Headlines
|
|
Consumers aren't buying into good economic surprises:
Recent economic data has mostly surprised to the upside, but consumer surveys aren't following along. Surprises in soft economic releases have been much worse than hard economic releases, which has typically resulted in a rebound in stock prices, while gold and commodities struggled.
|
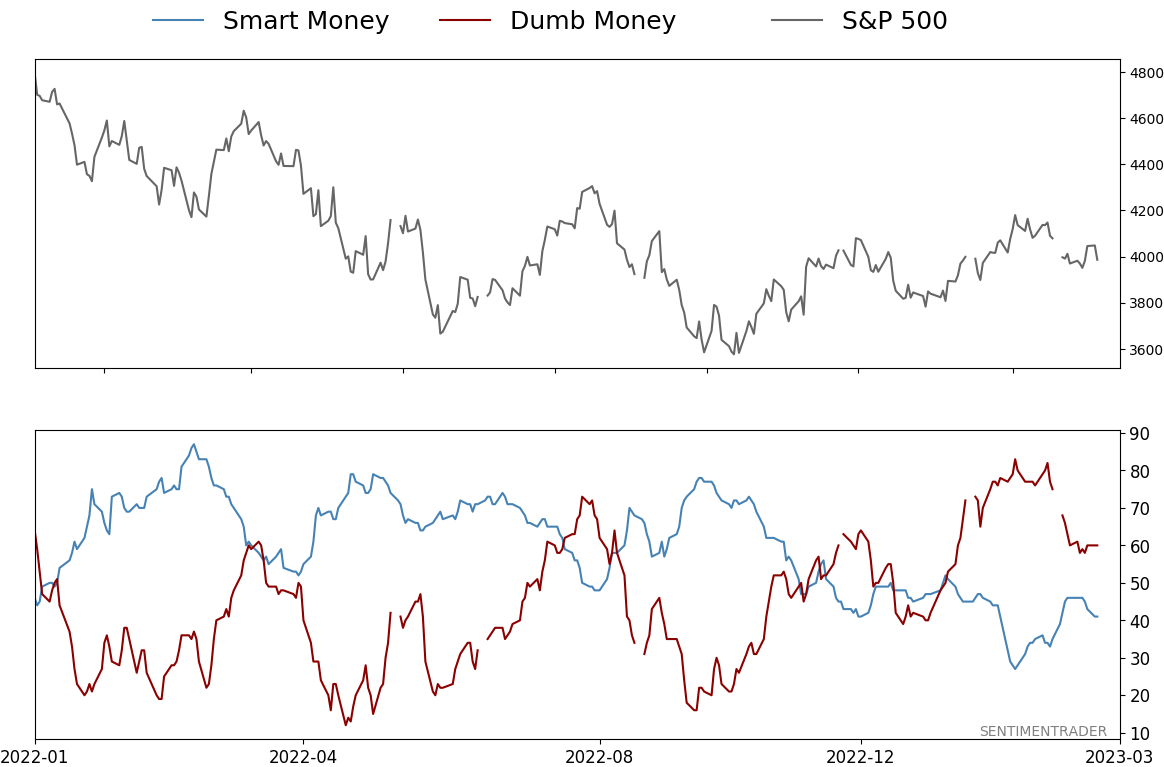
Smart / Dumb Money Confidence
|
Smart Money Confidence: 41%
Dumb Money Confidence: 60%
|
|
Risk Levels
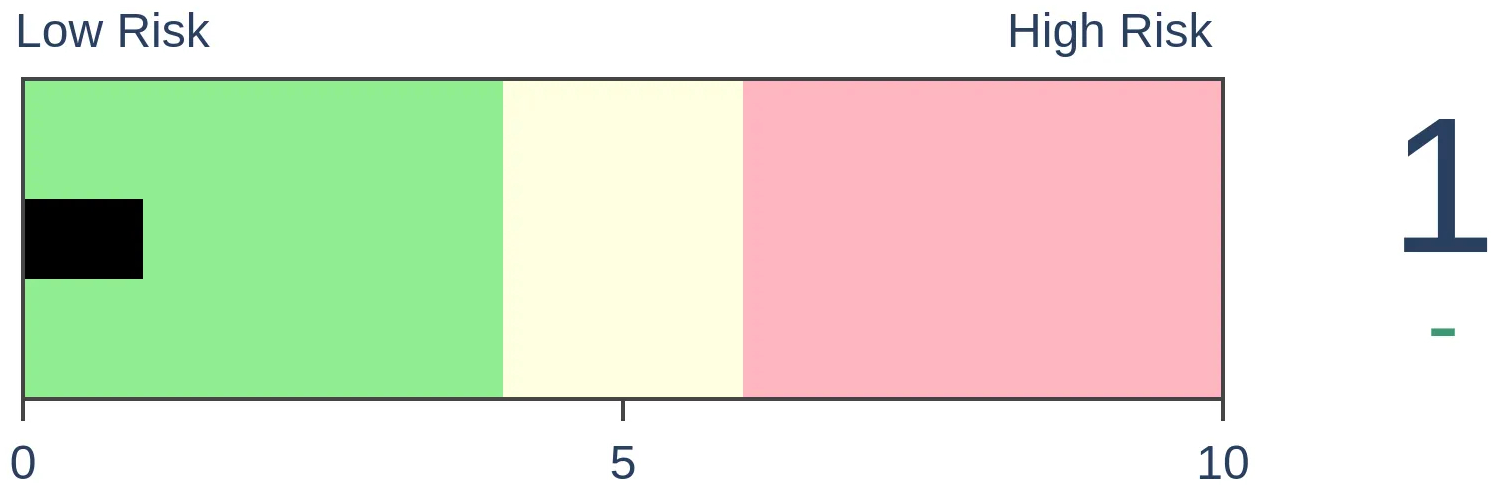
Stocks Short-Term

|
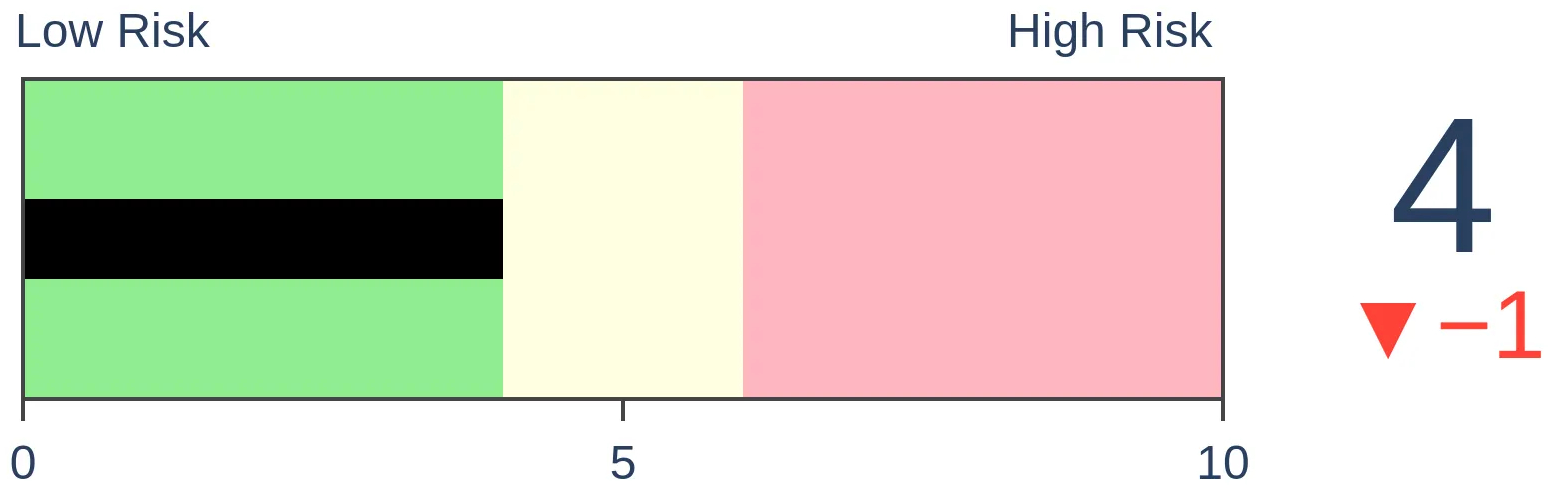
Stocks Medium-Term
|
|
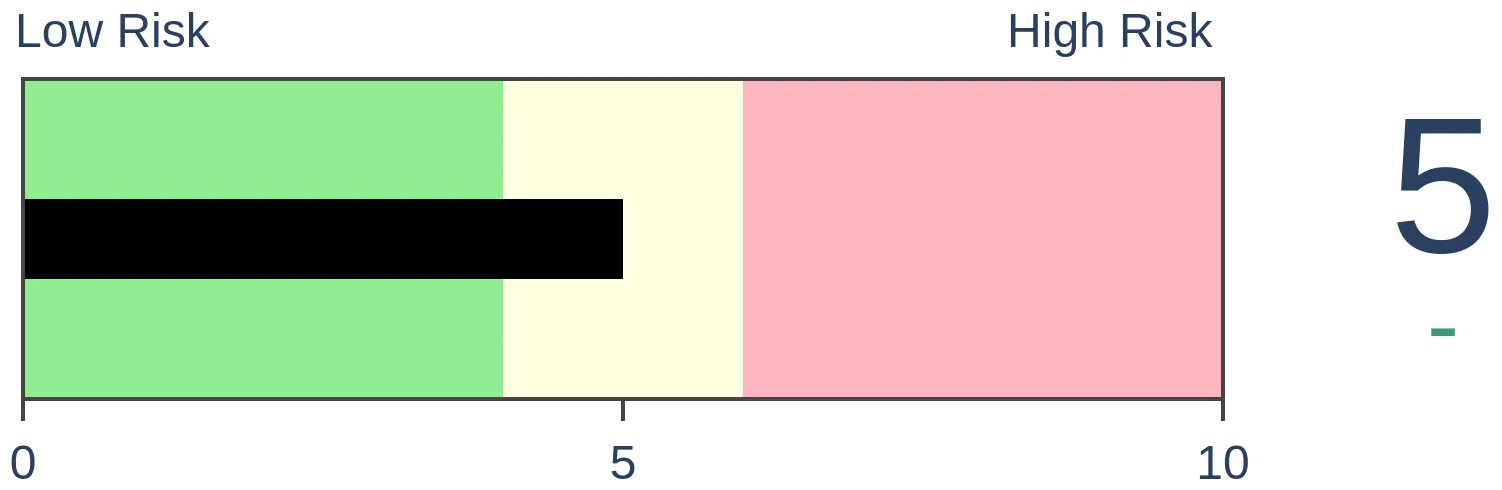
Bonds
|
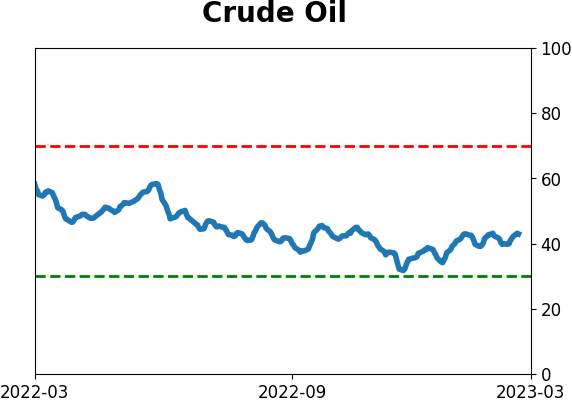
Crude Oil
|
|
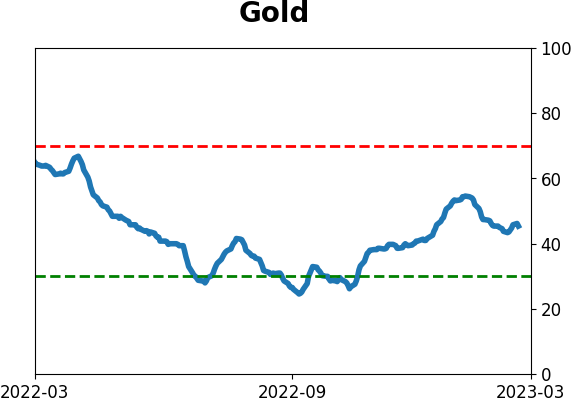
Gold

|
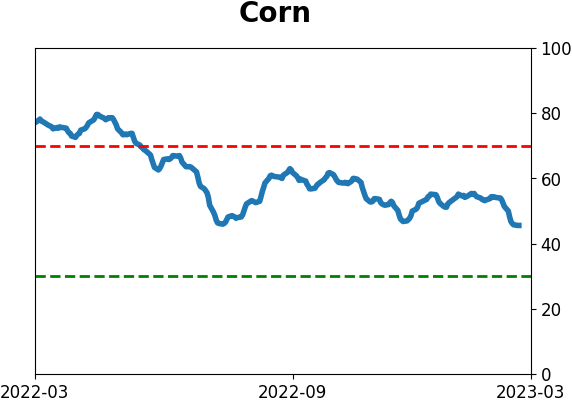
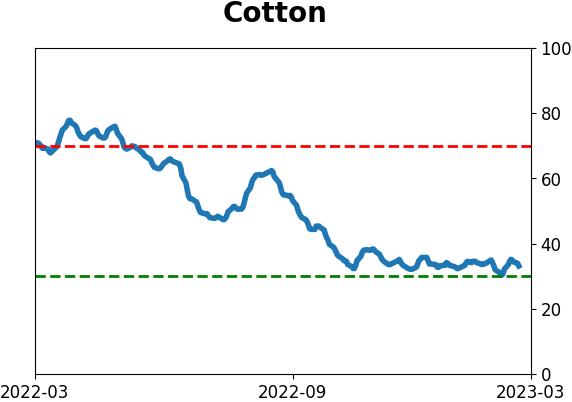
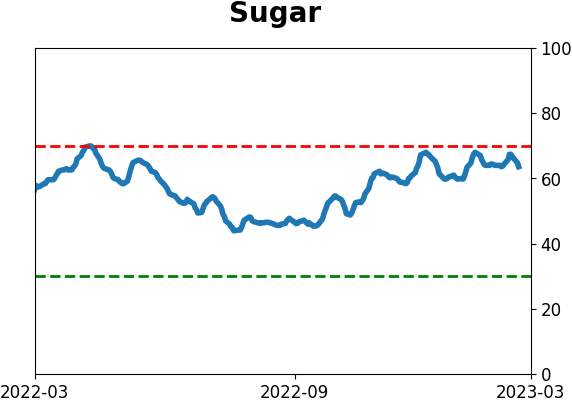
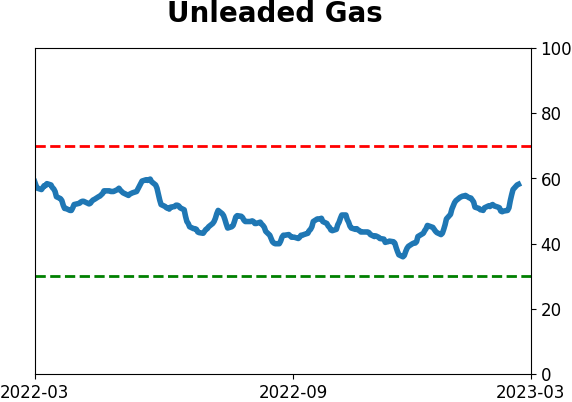
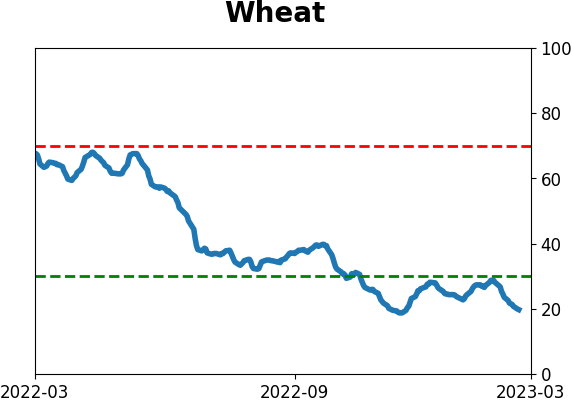
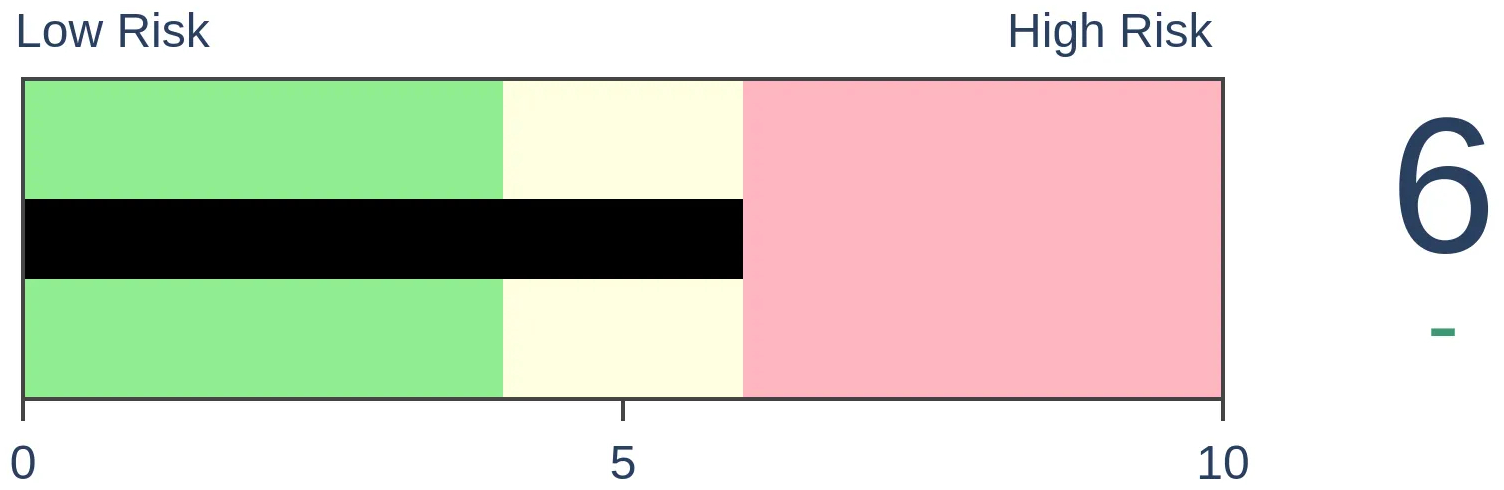
Agriculture
|
|
Research
By Jason Goepfert
BOTTOM LINE
Recent economic data has mostly surprised to the upside, but consumer surveys aren't following along. Surprises in soft economic releases have been much worse than hard economic releases, which has typically resulted in a rebound in stock prices, while gold and commodities struggled.
FORECAST / TIMEFRAME
None
|
Key points:
- Soft economic data like surveys have plunged relative to economic surprises in hard data
- When consumers are more cautious than they "should" be, stocks have tended to rally
- It wasn't a particularly good sign for gold or commodities
Consumers are more dubious than economic data suggests they should be
Consumers are a lot more pessimistic than they have any right to be. At least, that's the theory when looking at the latest batch of soft versus hard economic releases.
When "soft" economic data, like consumer surveys, beat economists' expectations, while "hard" economic data, like retail sales, labor market conditions, housing performance, etc., disappoint, then this indicator will rise. It shows that consumers are more optimistic than the real economic suggests they should be. Conversely, when this indicator is very negative, then it means that consumers have become more pessimistic than real economic data suggests they should be.
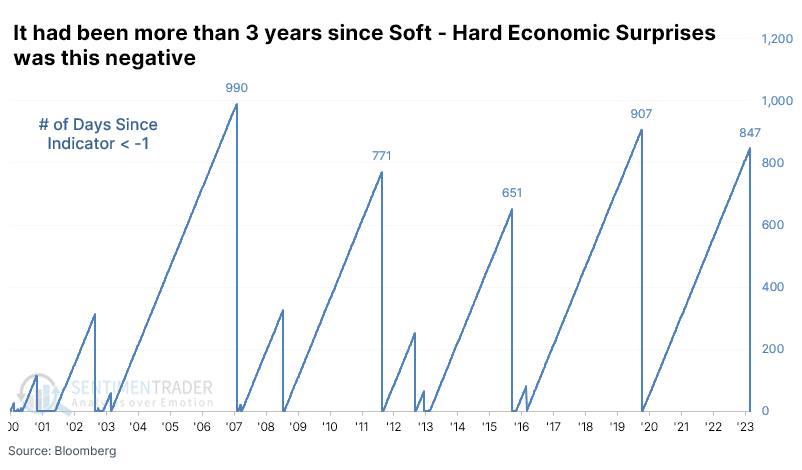
The chart below shows that the most recent update pushed soft releases well below those of hard releases. Over the past decade, this has coincided with the trough of market declines and double-digit annualized forward returns in the S&P 500.
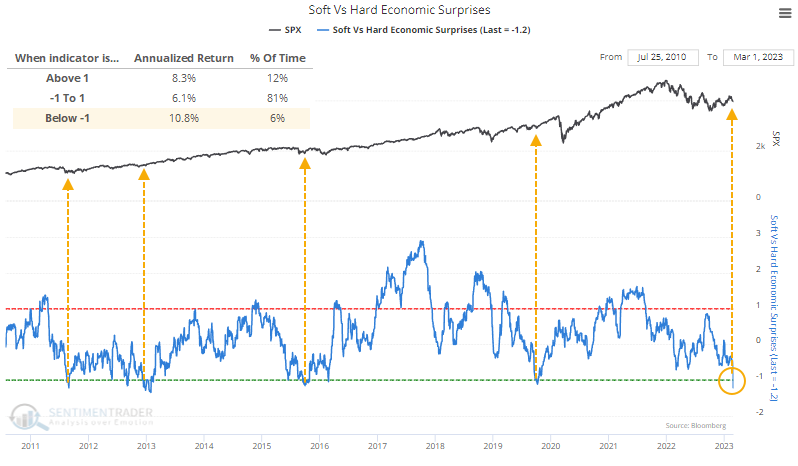
Before the last decade, it gave some false signals. It was below -1 for much of 2000 and early 2001 as stocks tumbled. And it fell below -1 briefly in July 2008 before a modest rally and then the complete breakdown into the teeth of the financial crisis.
It's been a long time since consumer expectations were so out of whack with economic data. This is the first spread below -1 in more than three years, one of the most extended stretches since the inception of the data more than 23 years ago.
Too-cautious consumers have typically led to more-aggressive investors
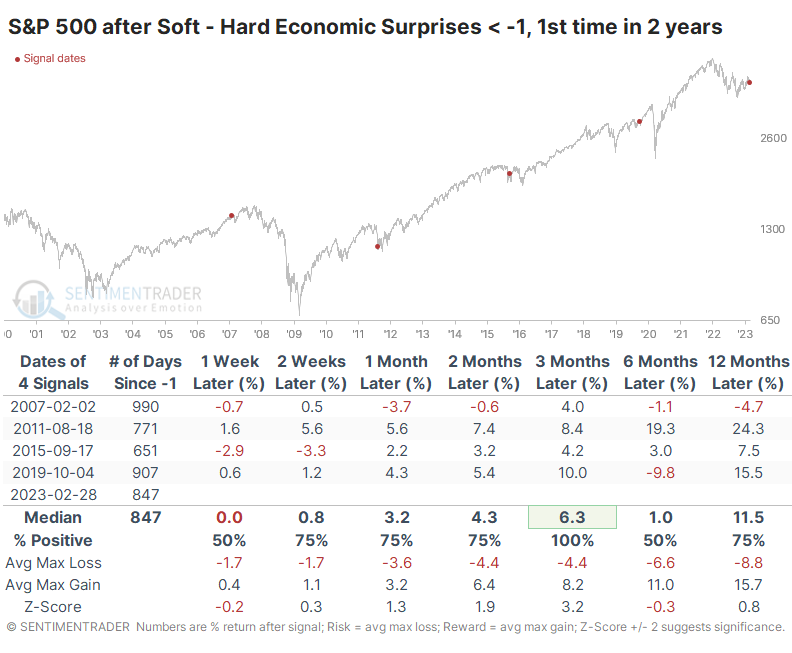
After the spread fell below -1 for the first time in years, the S&P's returns were good. Of course, we must discount any potential conclusion because of the minuscule sample size. So, for what it's worth, the S&P sported a positive return each time over the next three months and didn't suffer any consistent losses up to a year later.
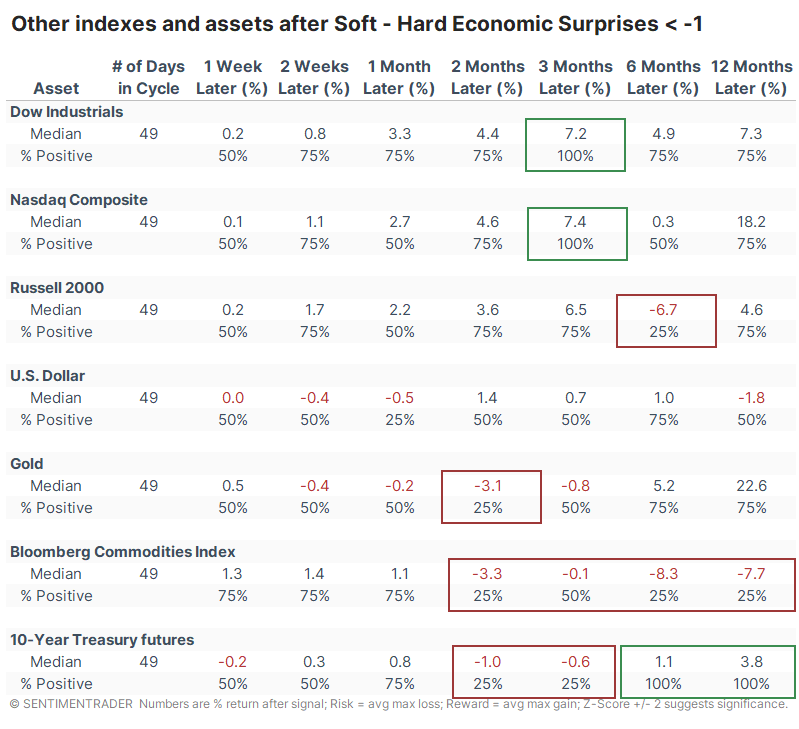
Among other indexes and assets, the Dow Industrials and Nasdaq showed very good returns over the next three months, while the small-cap Russell 2000 sported a negative return after three of the four signals six months later. Treasury note prices dipped in the intermediate term but rose strongly afterward. Gold and commodities, in general, struggled over the next two to three months.
What the research tells us...
When we look at a slow-moving indicator with a relatively limited history, analyzing extremes is necessarily an exercise in small sample sizes. We could debate the merits of statistical significance in financial markets for a decade and never change anyone's mind, so the usefulness of data like this is up to the user. As much as it can be relied upon, it does give a tiny bit of evidence for the bulls, at least over the medium-term, as too-cautious consumer sentiment has typically resulted in a rally in stocks.
Indicators at Extremes
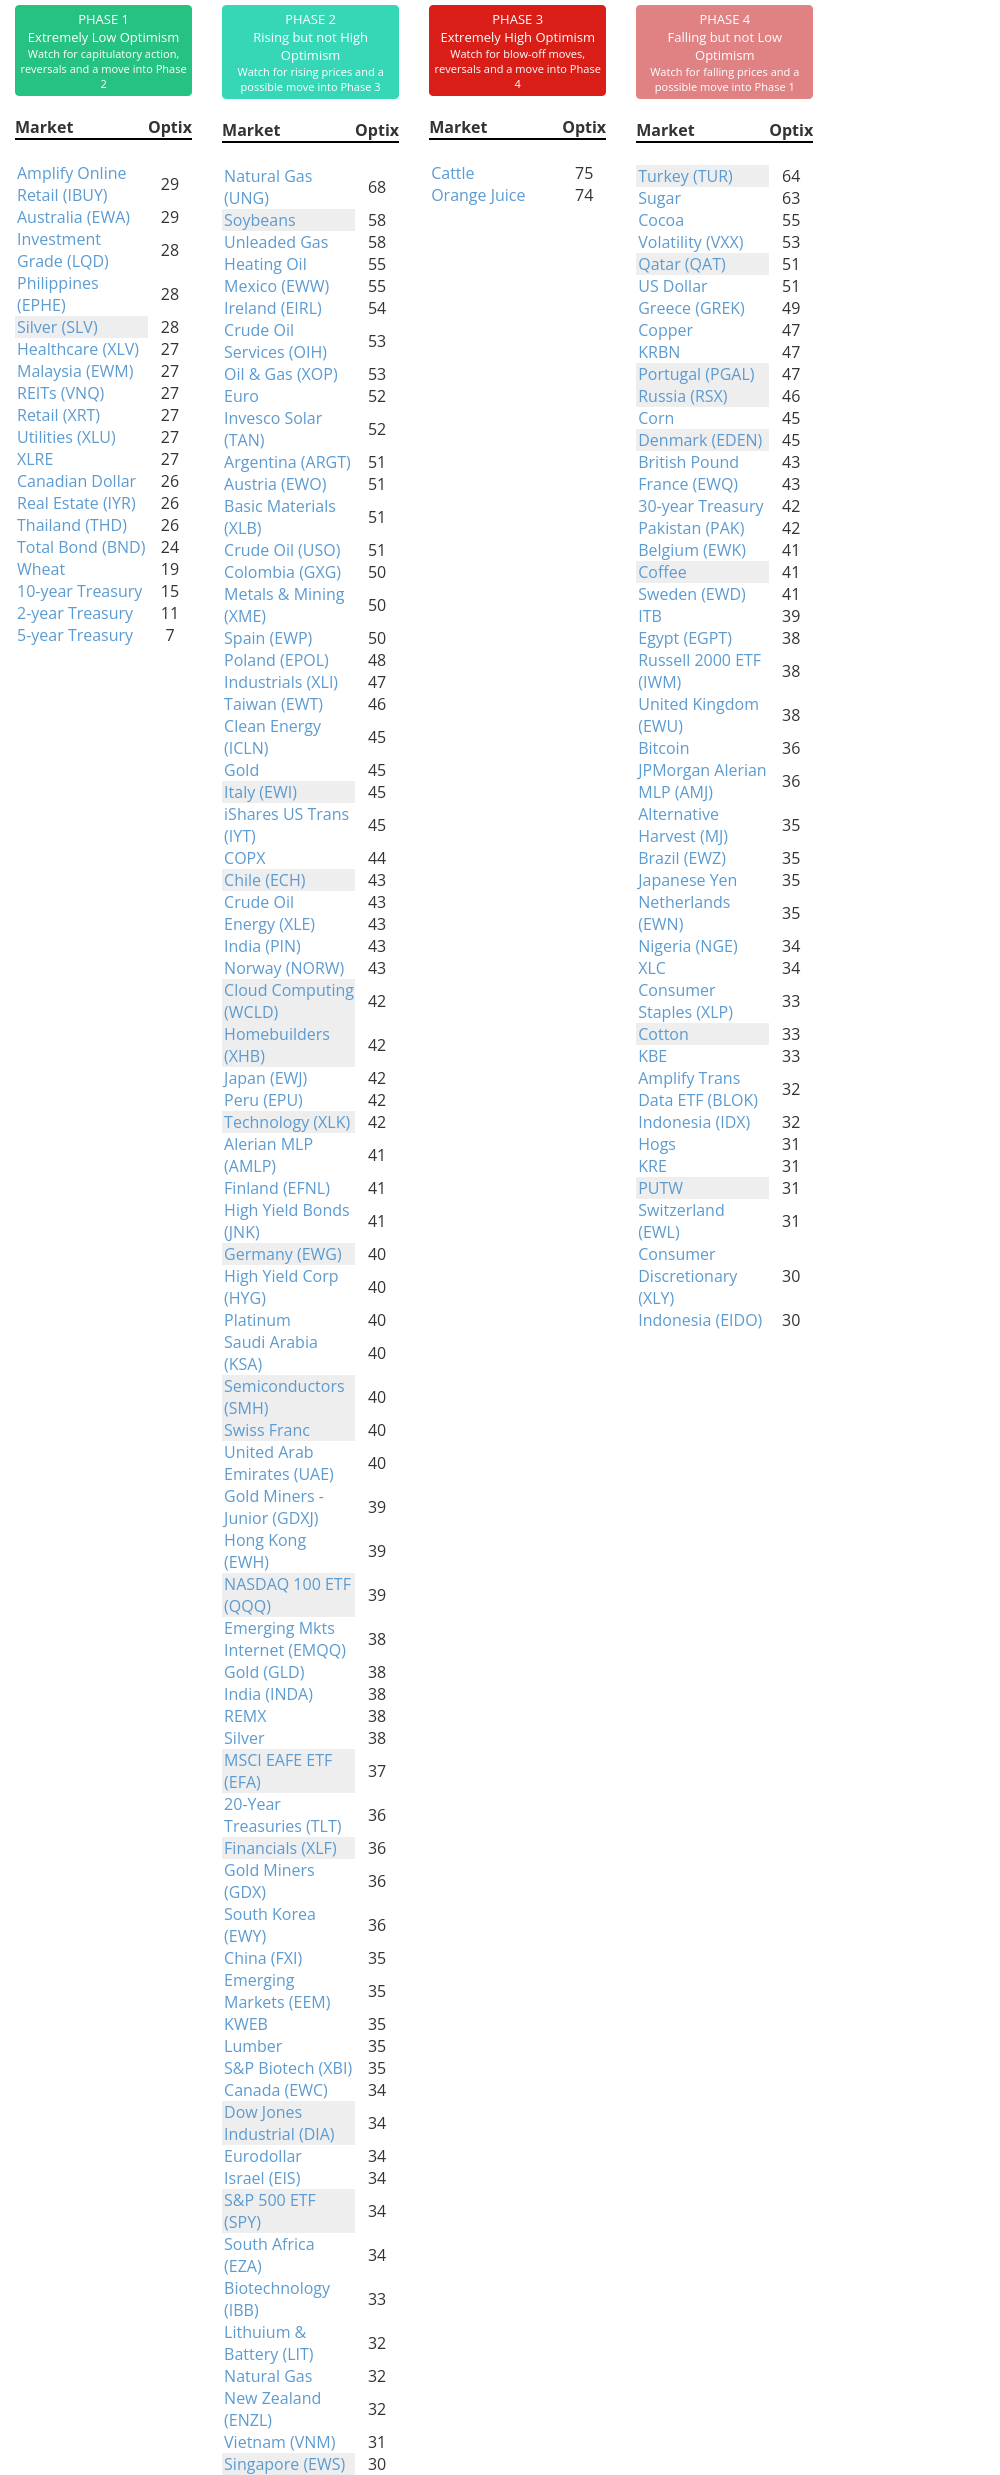
Phase Table
Ranks
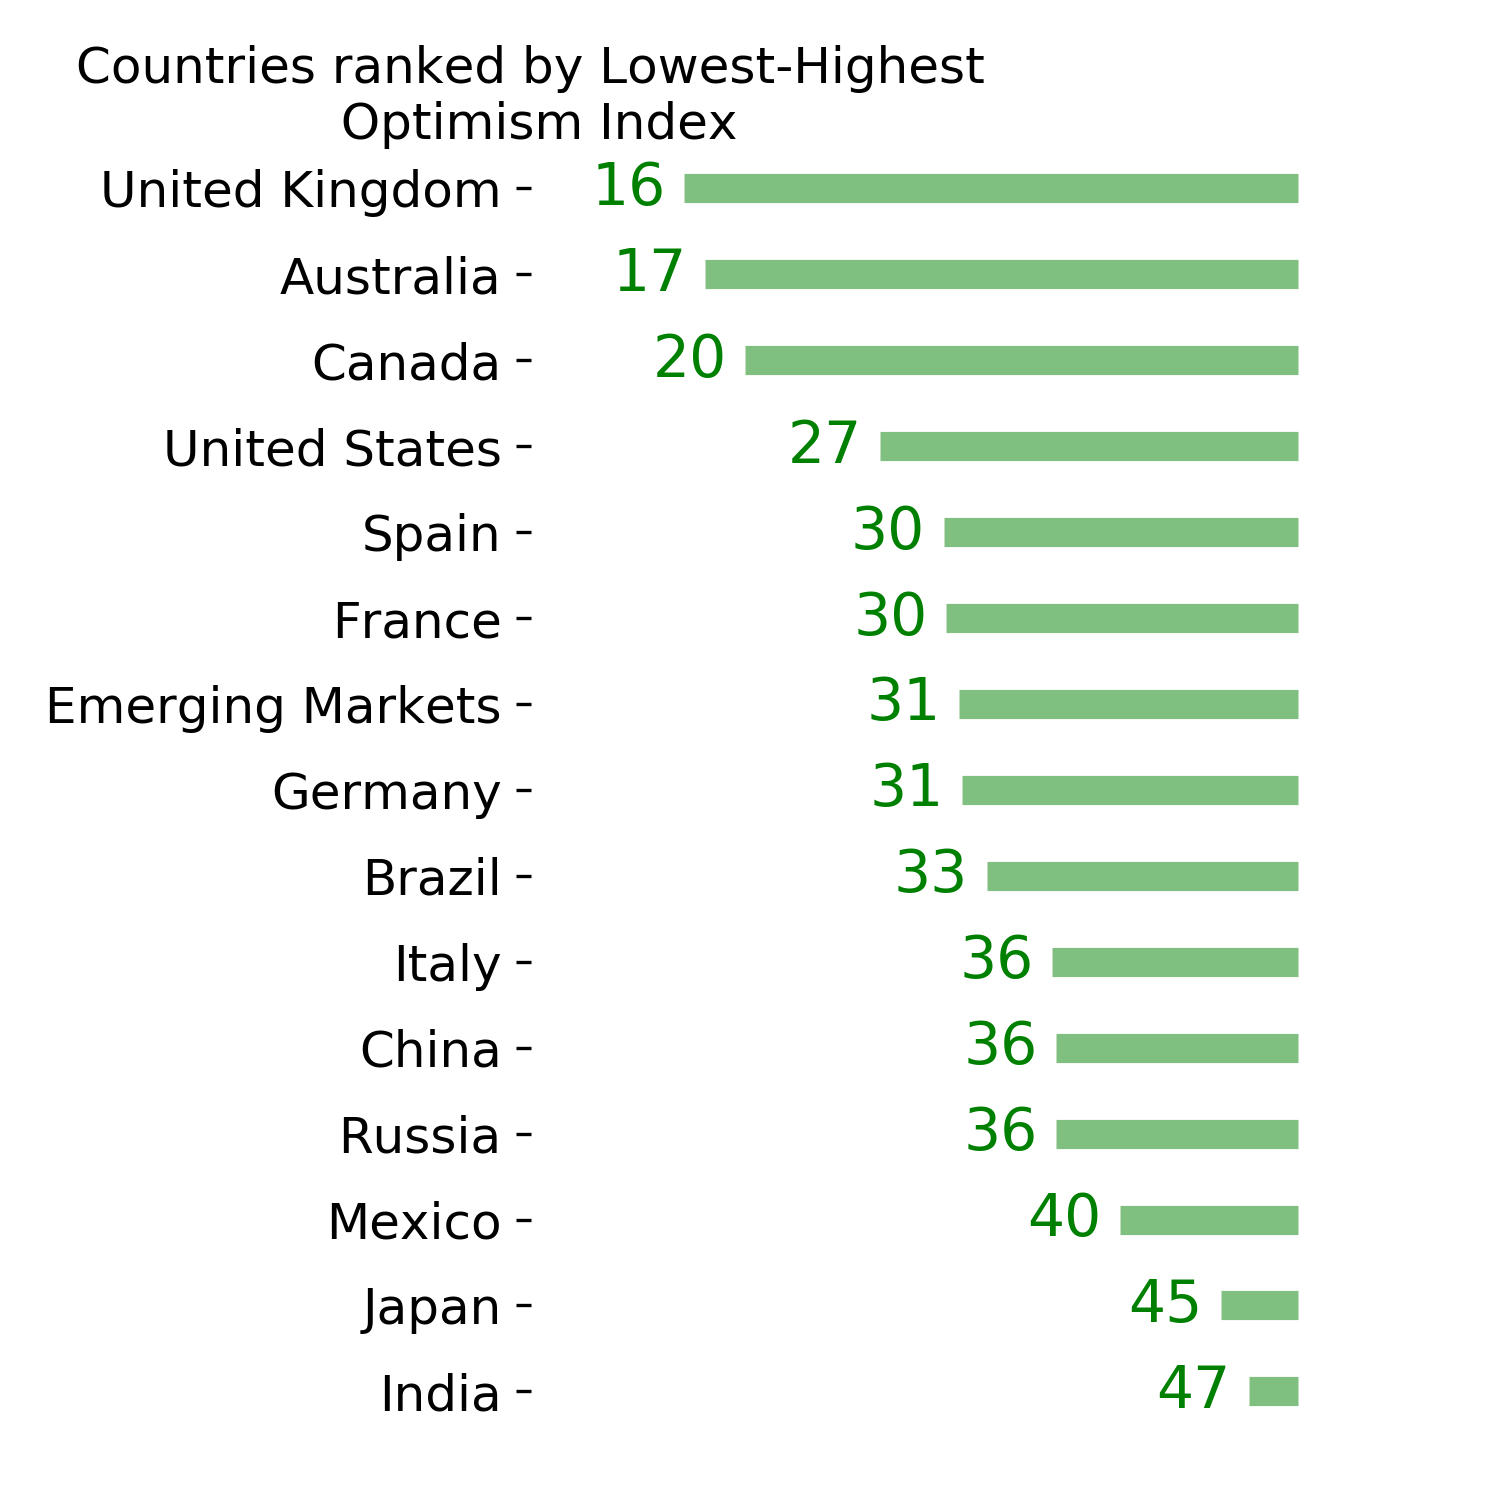
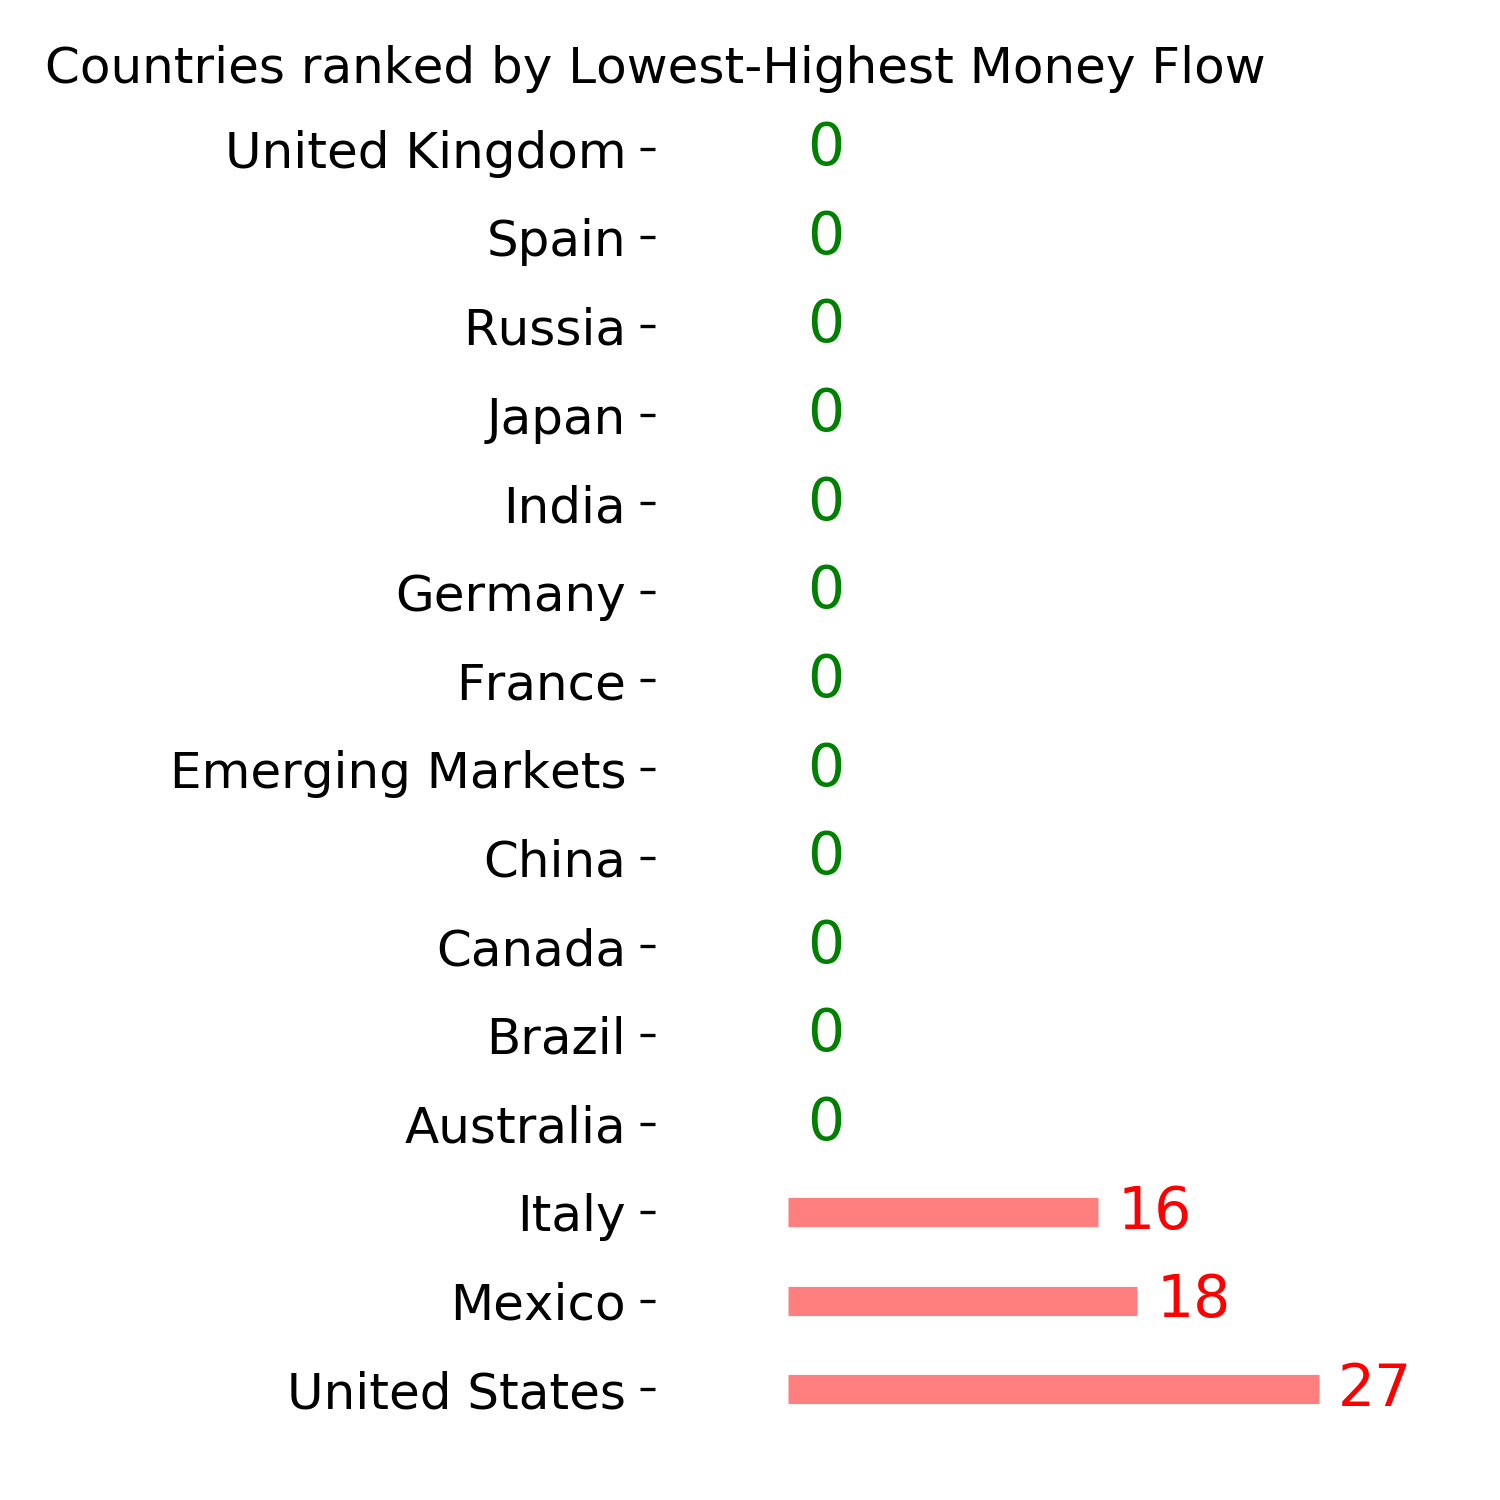
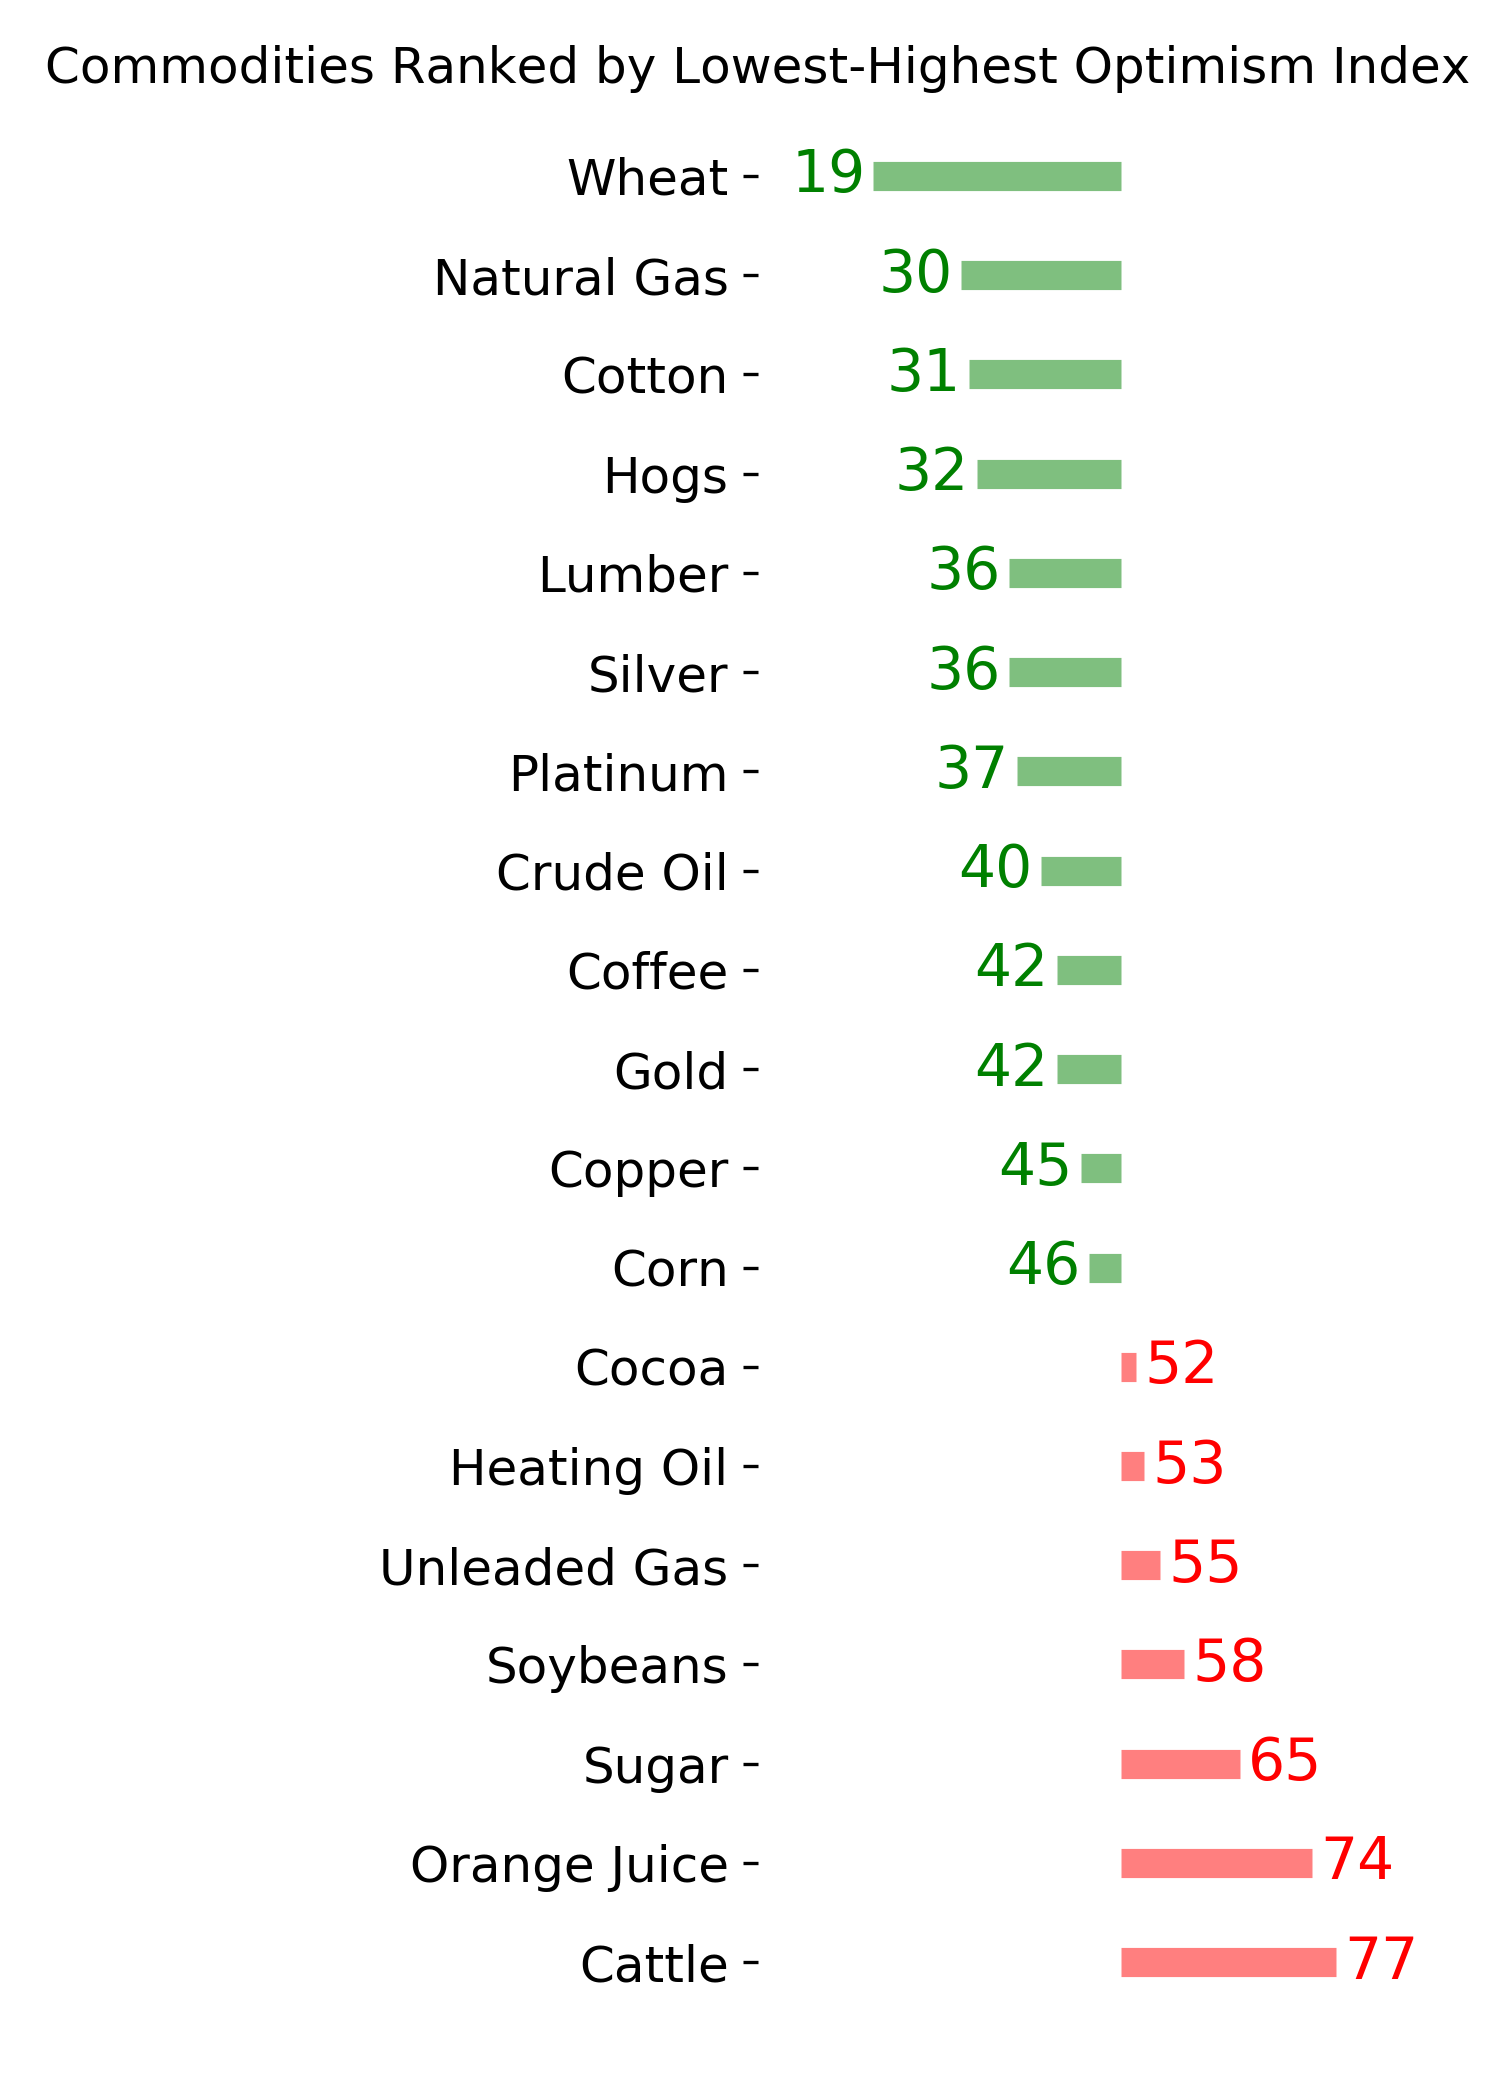
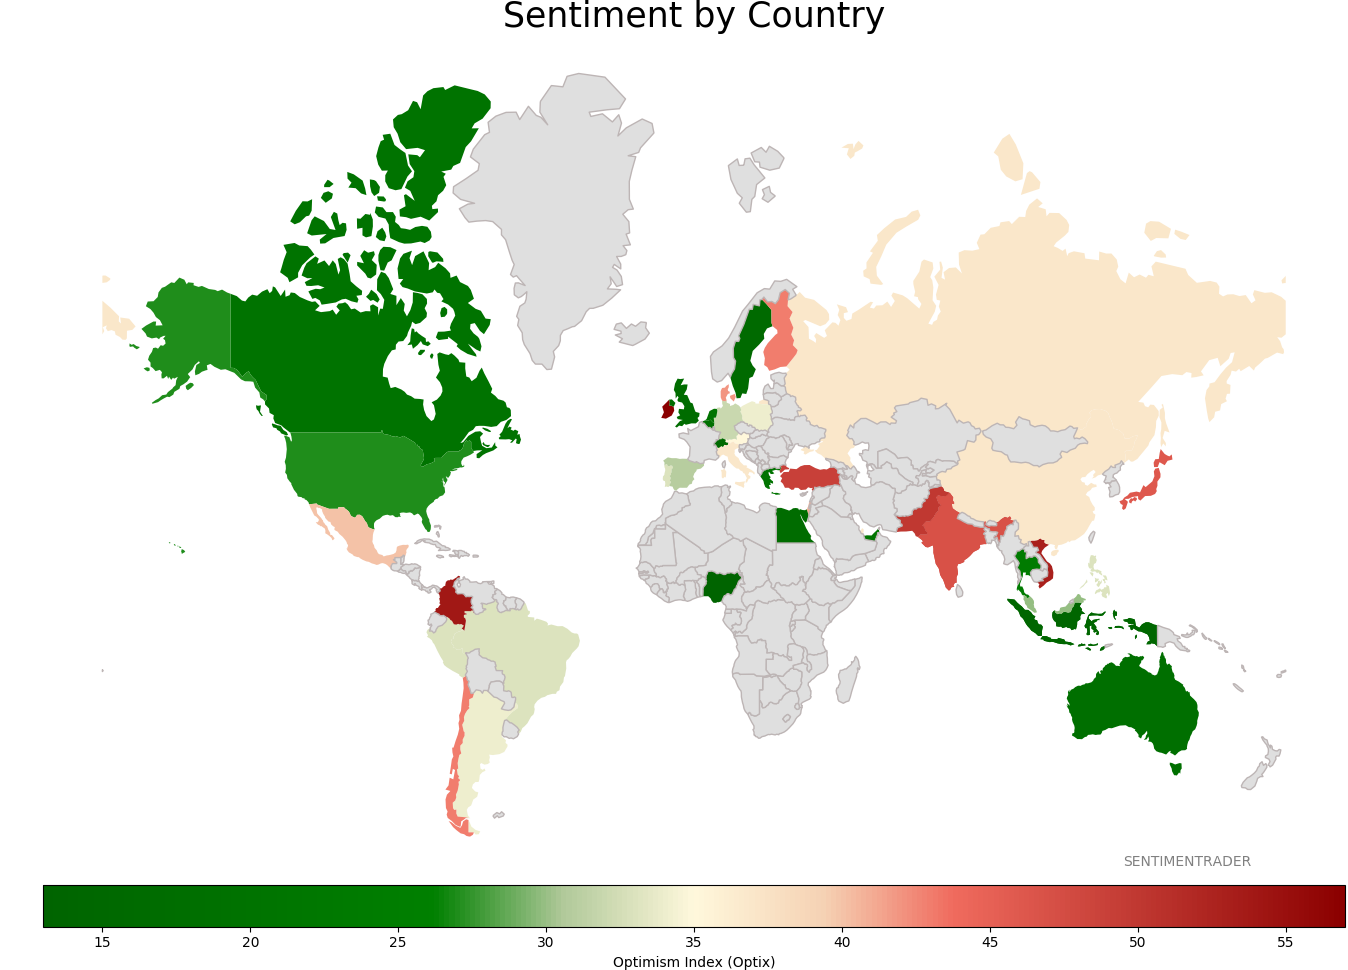
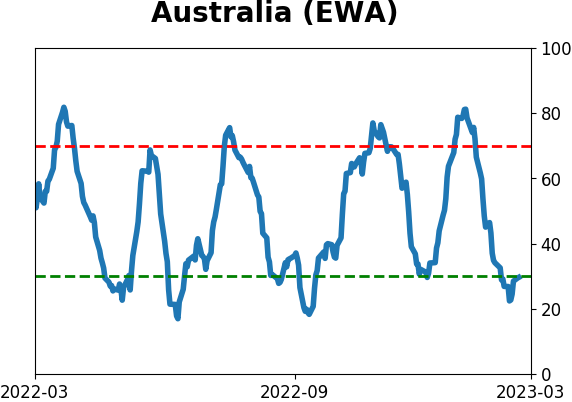
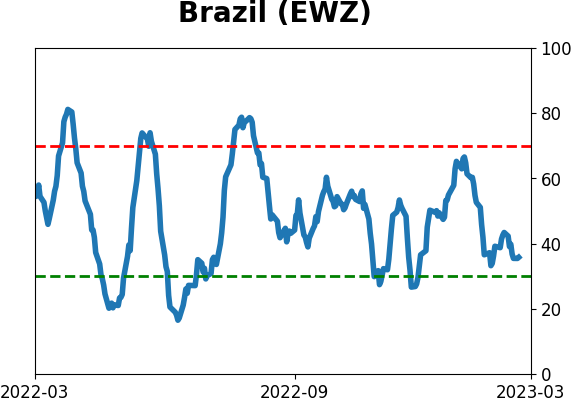
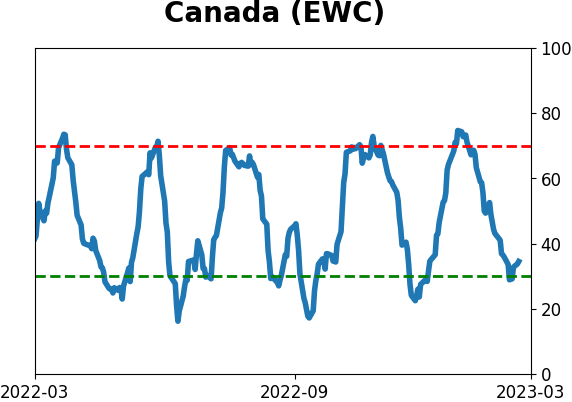
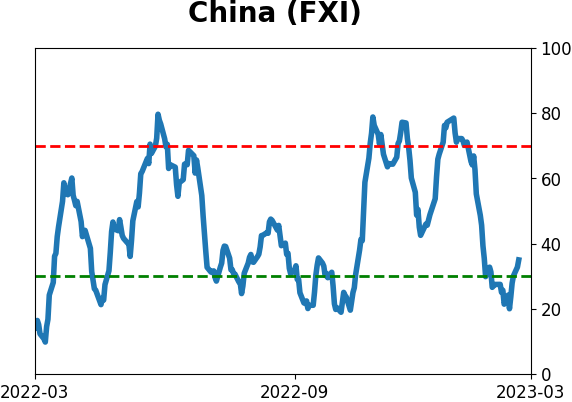
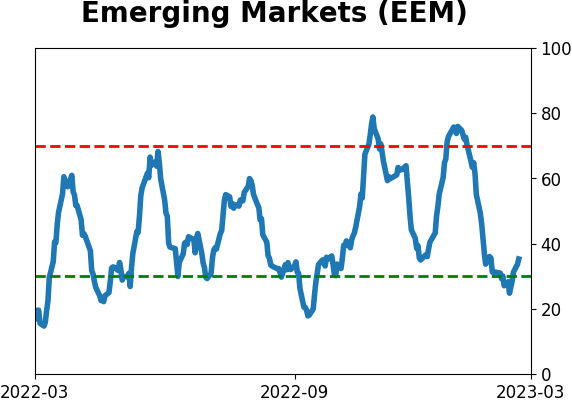
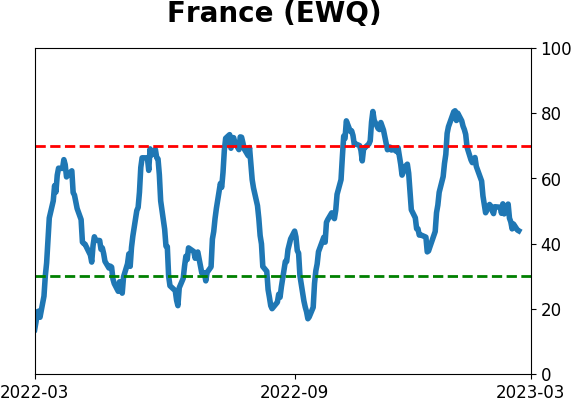
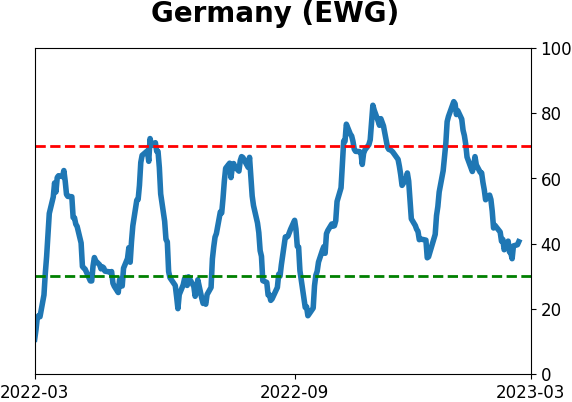
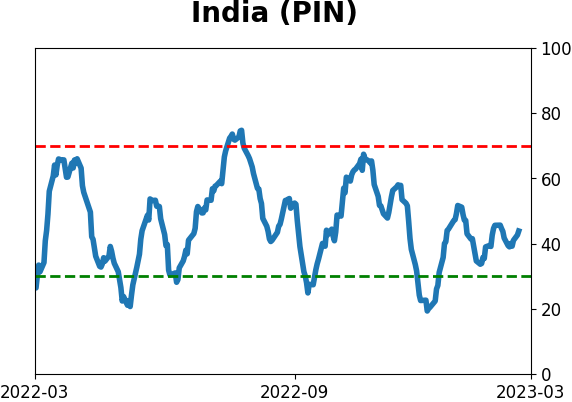
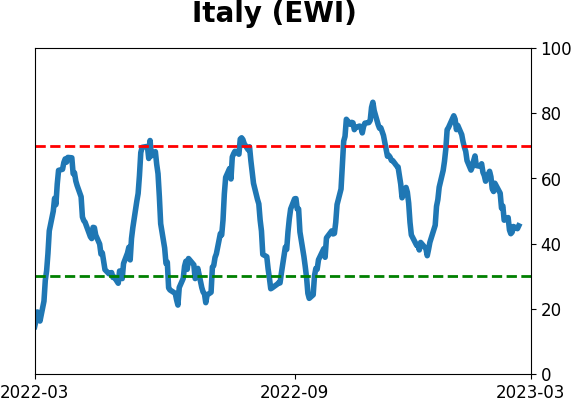
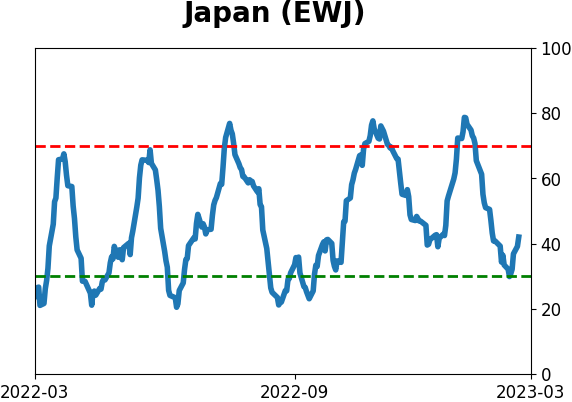
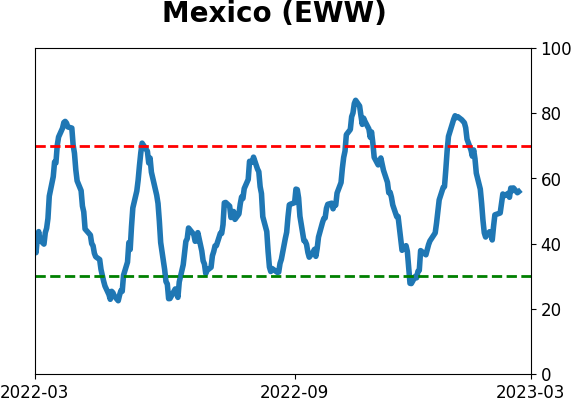
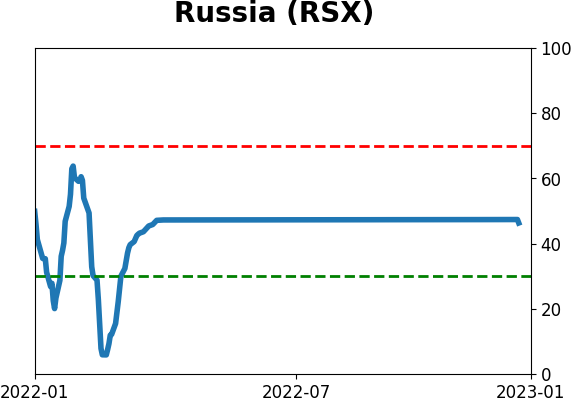
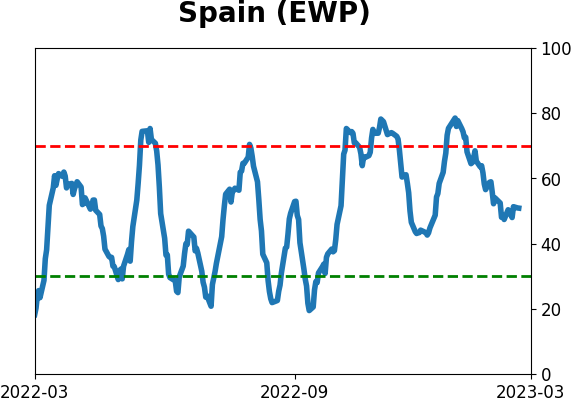
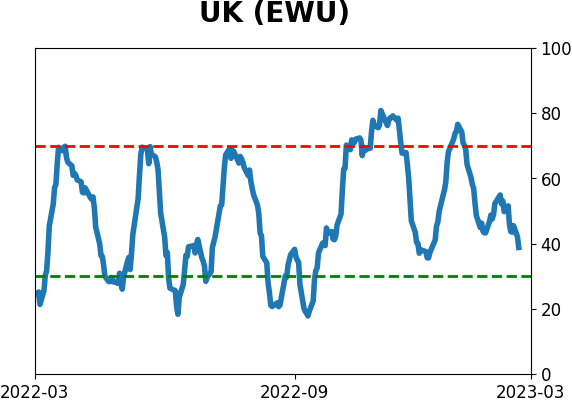
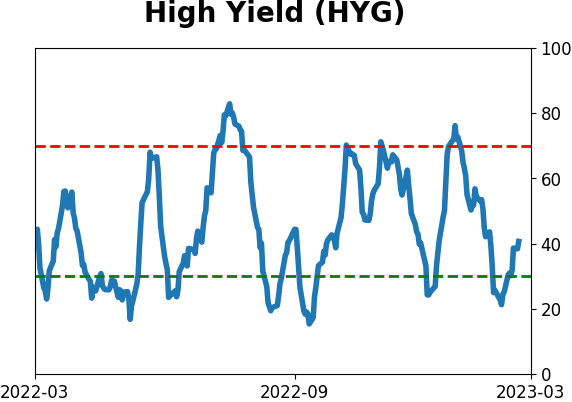
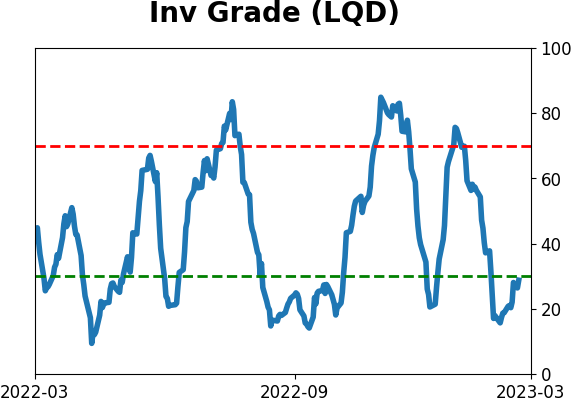
Sentiment Around The World
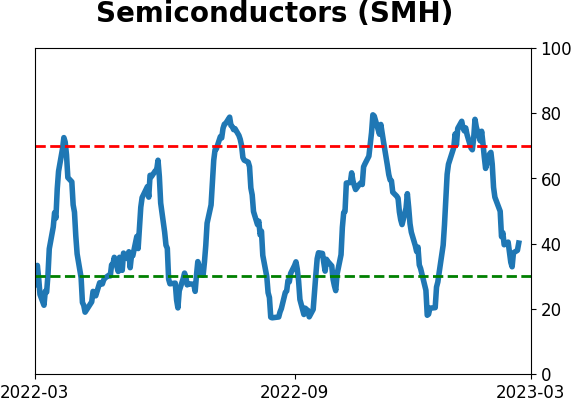
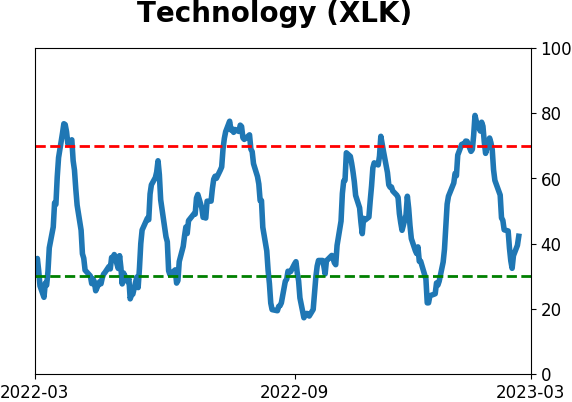
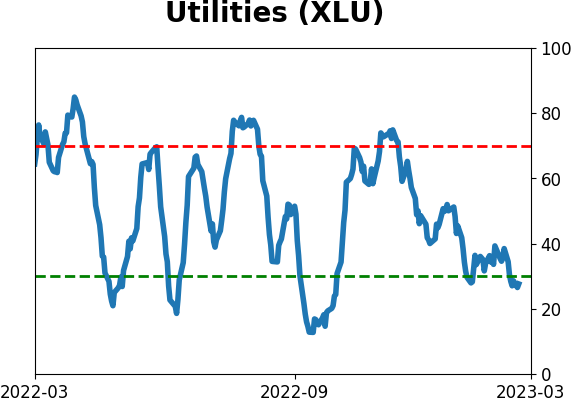
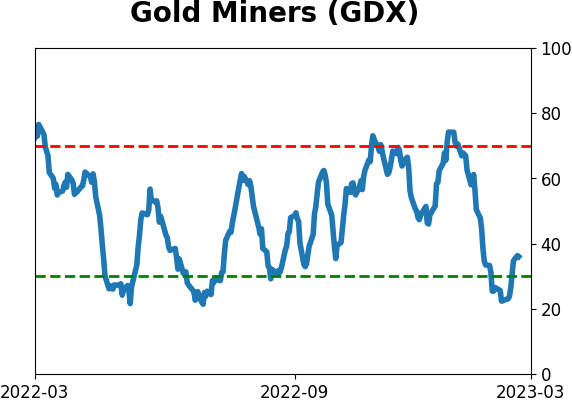
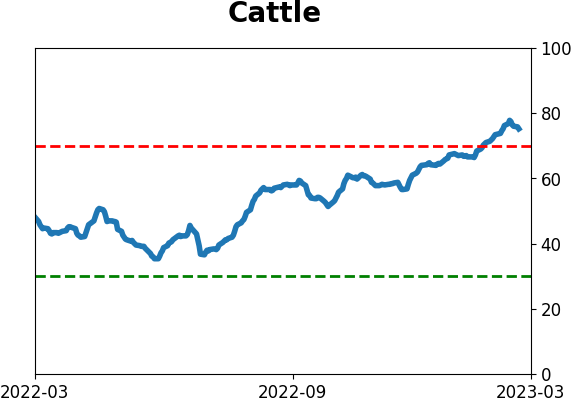
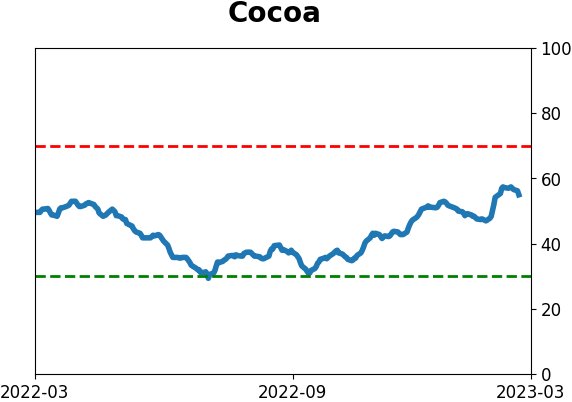
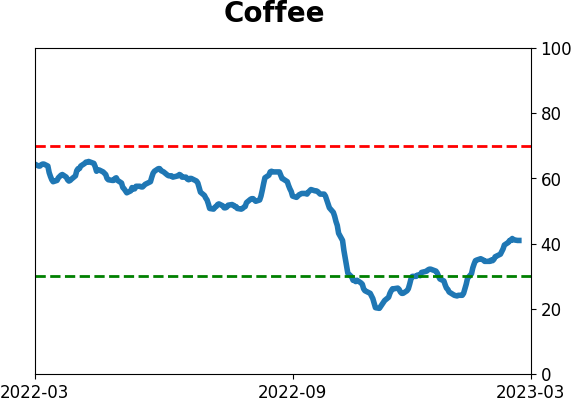
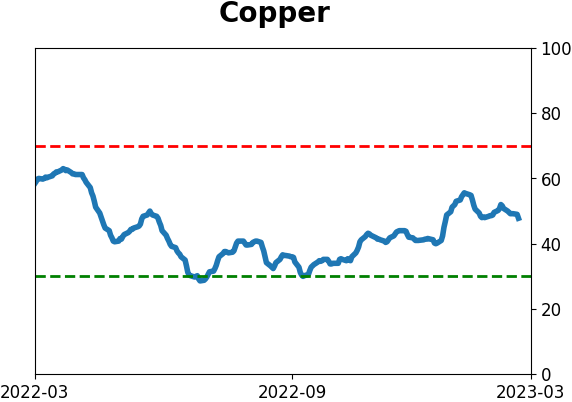
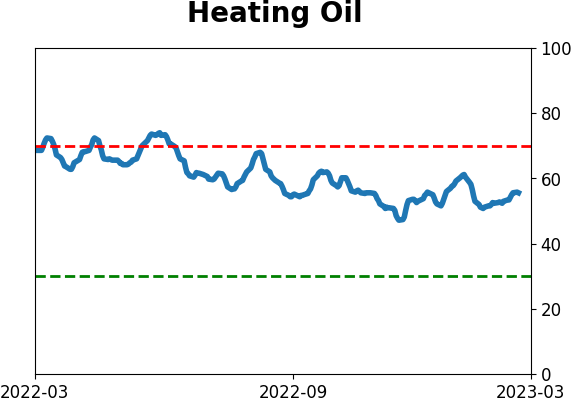
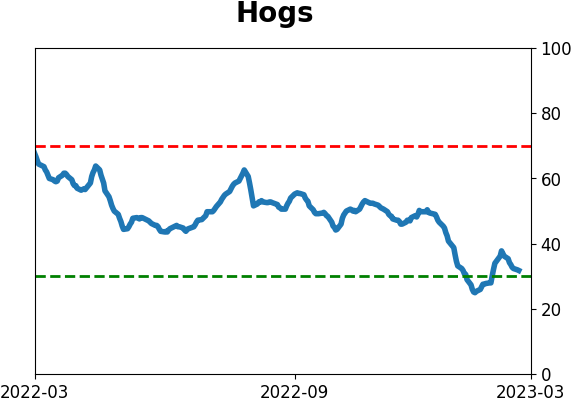
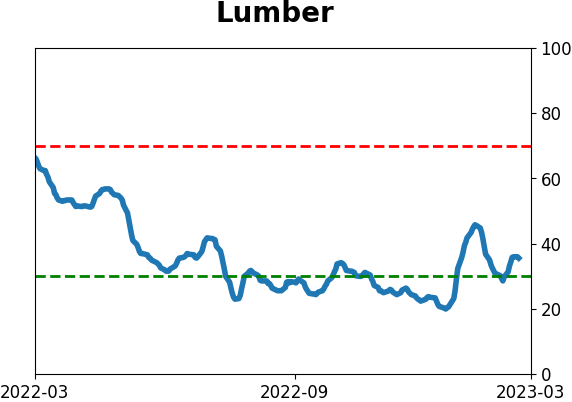
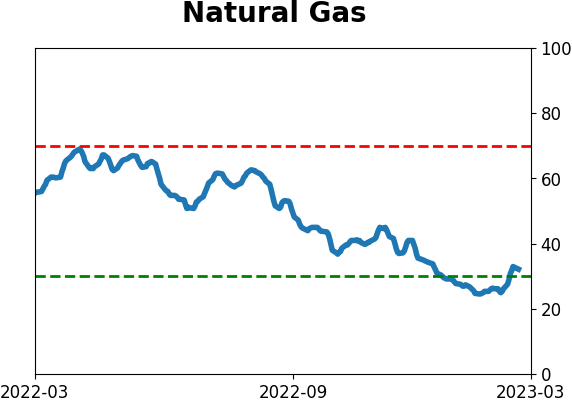
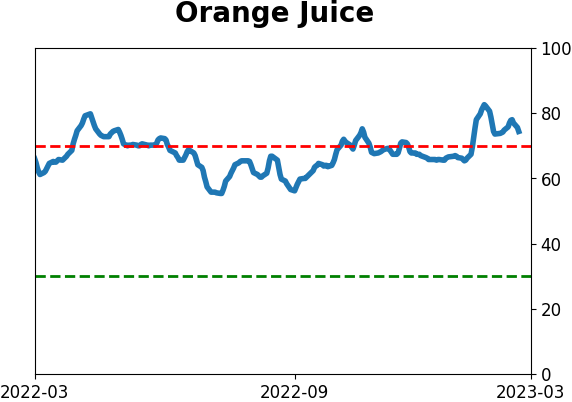
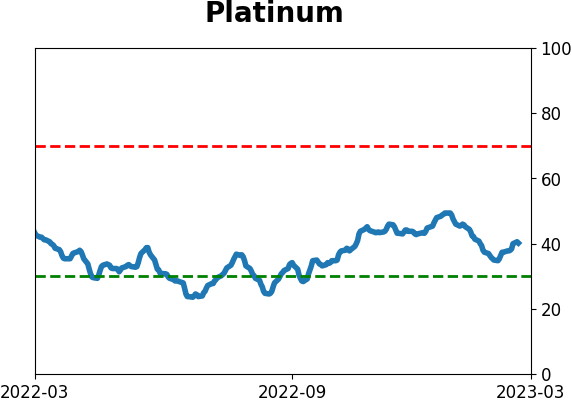
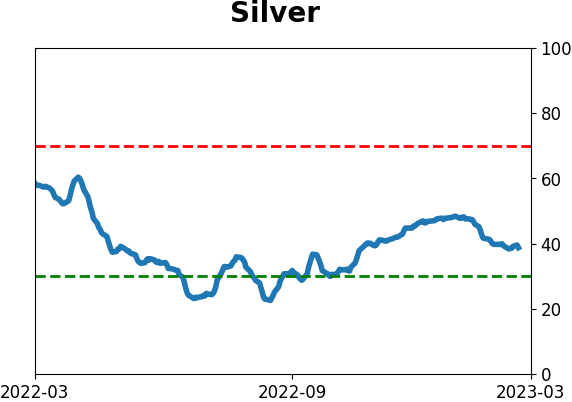
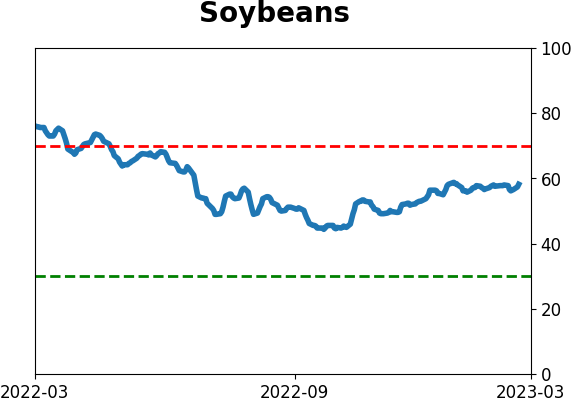
Optimism Index Thumbnails
|
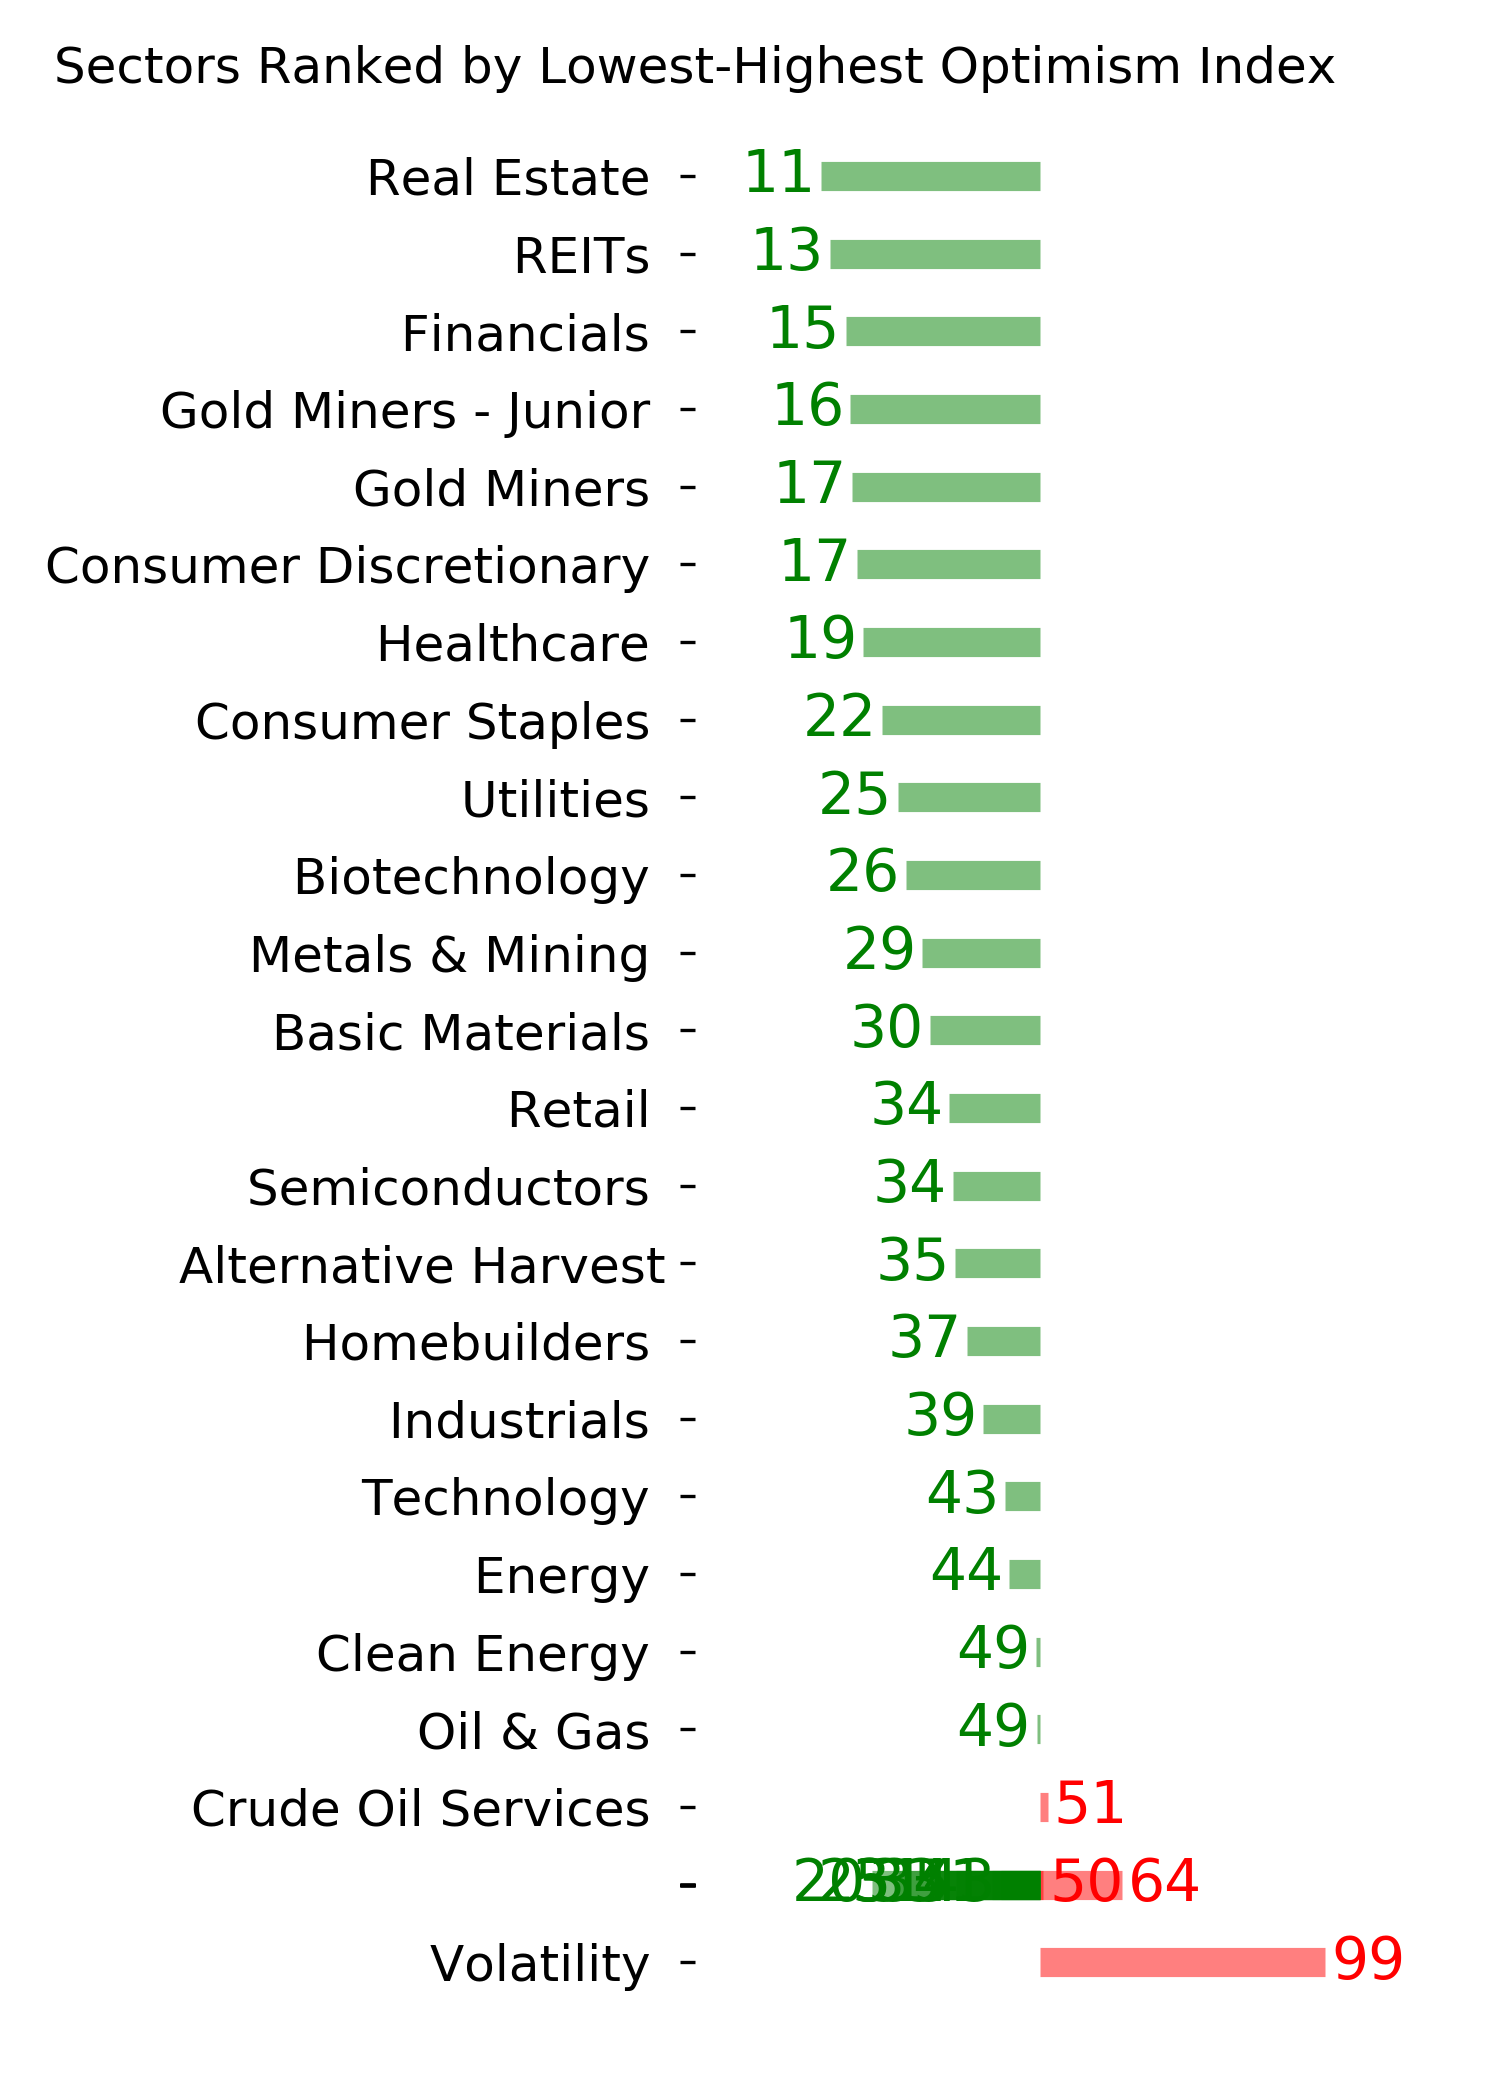
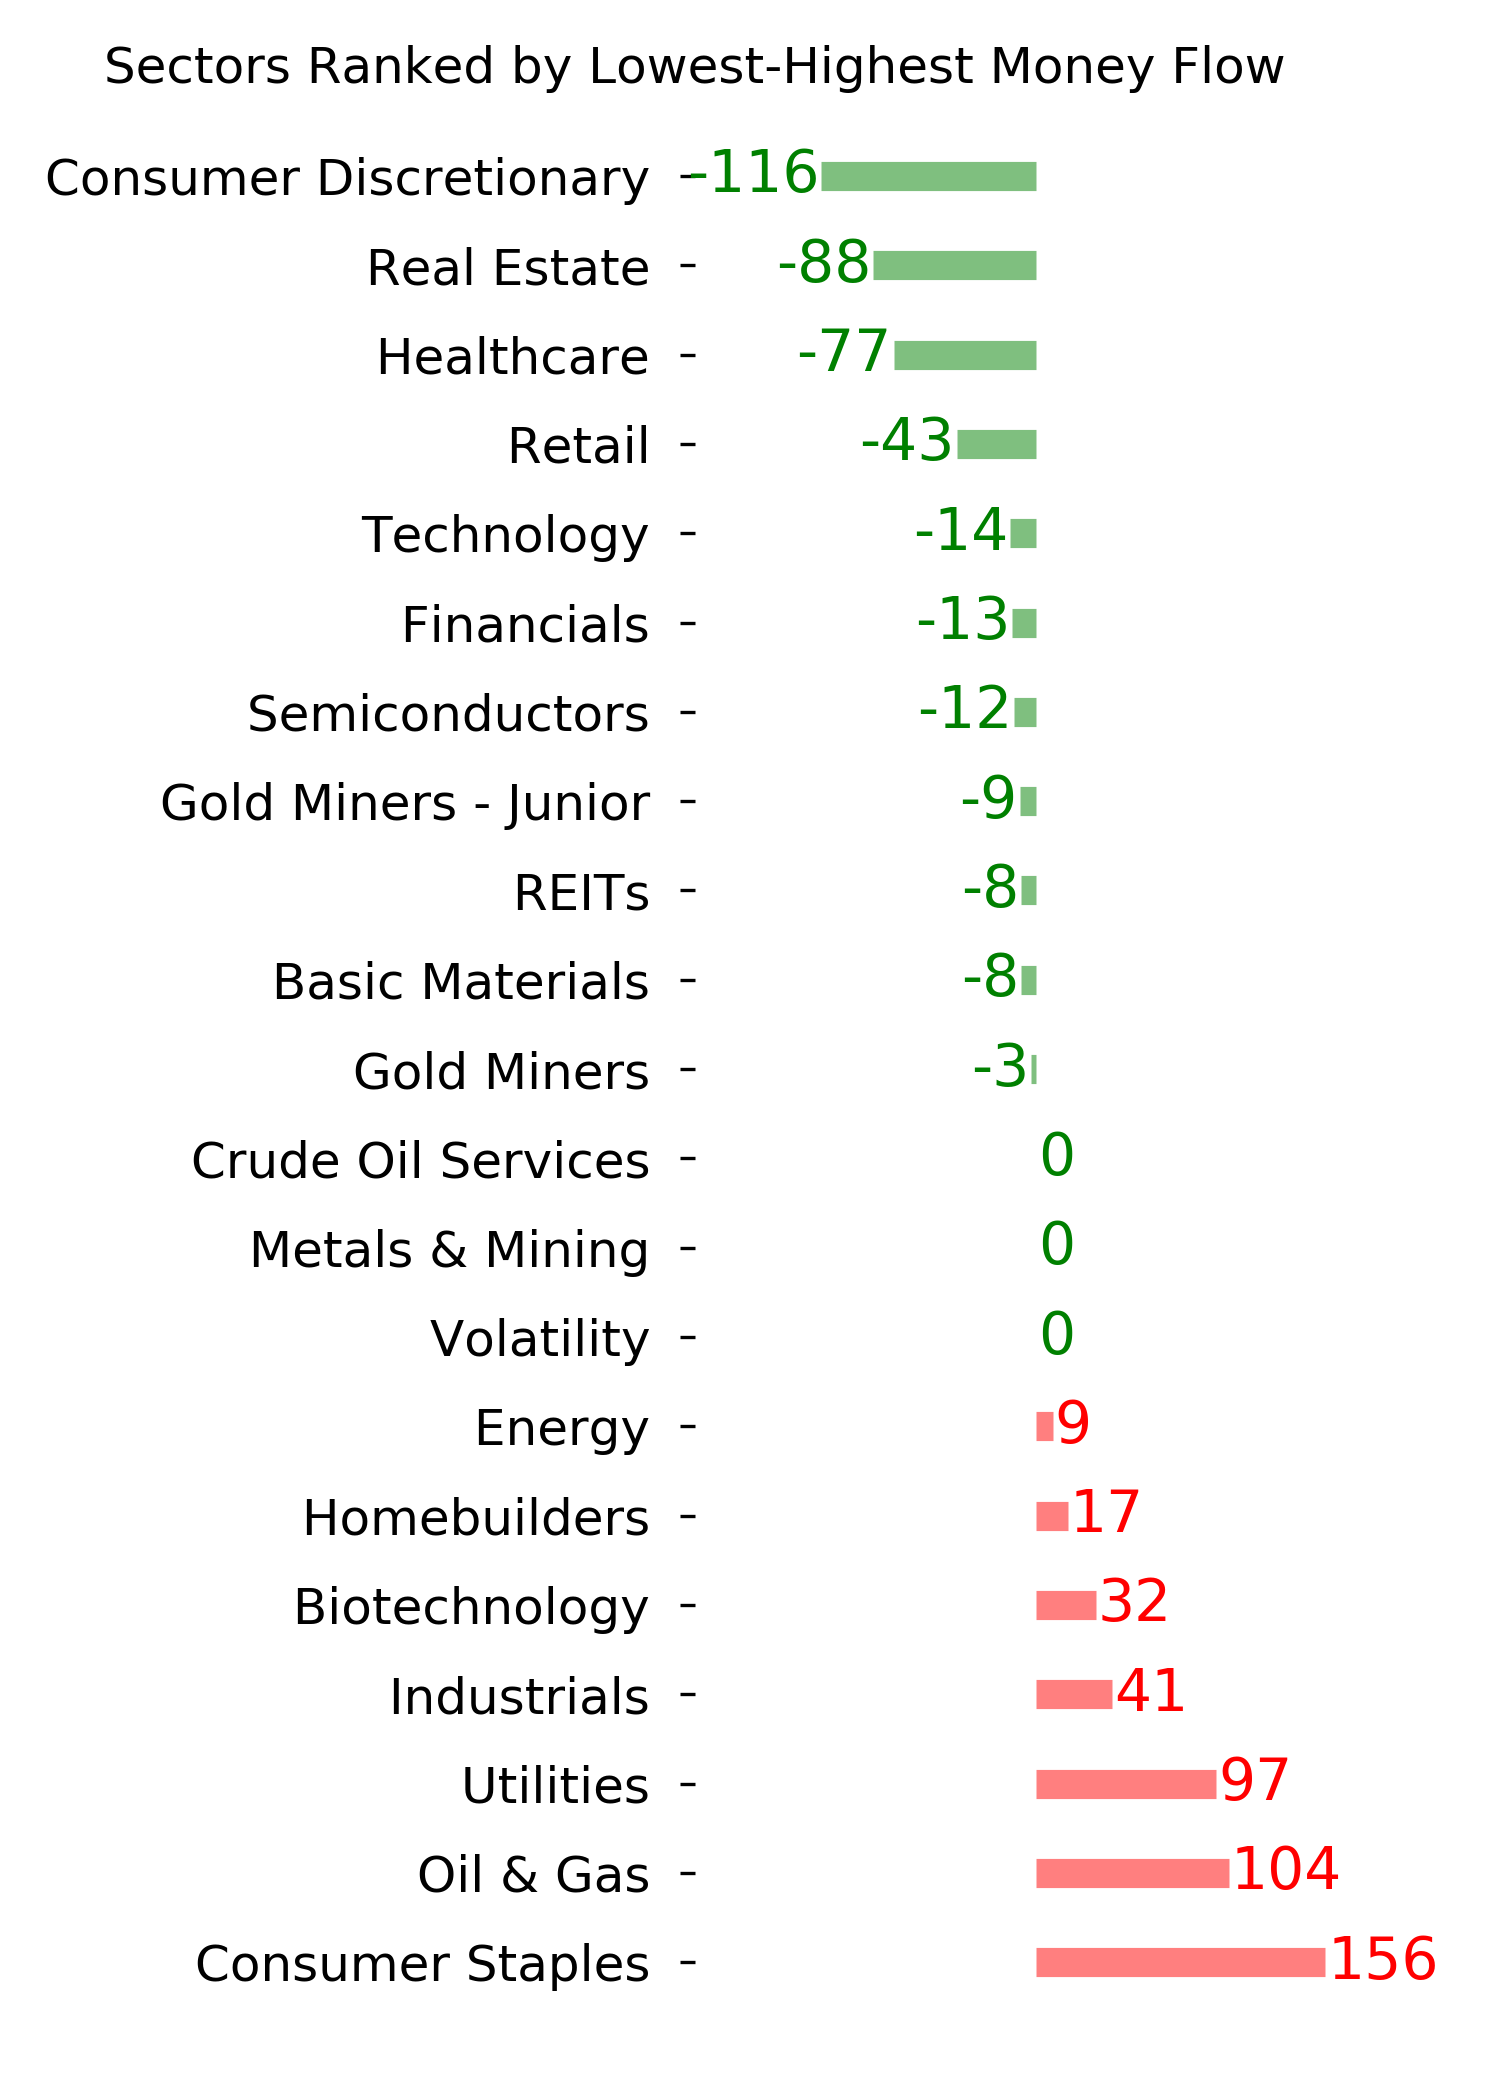
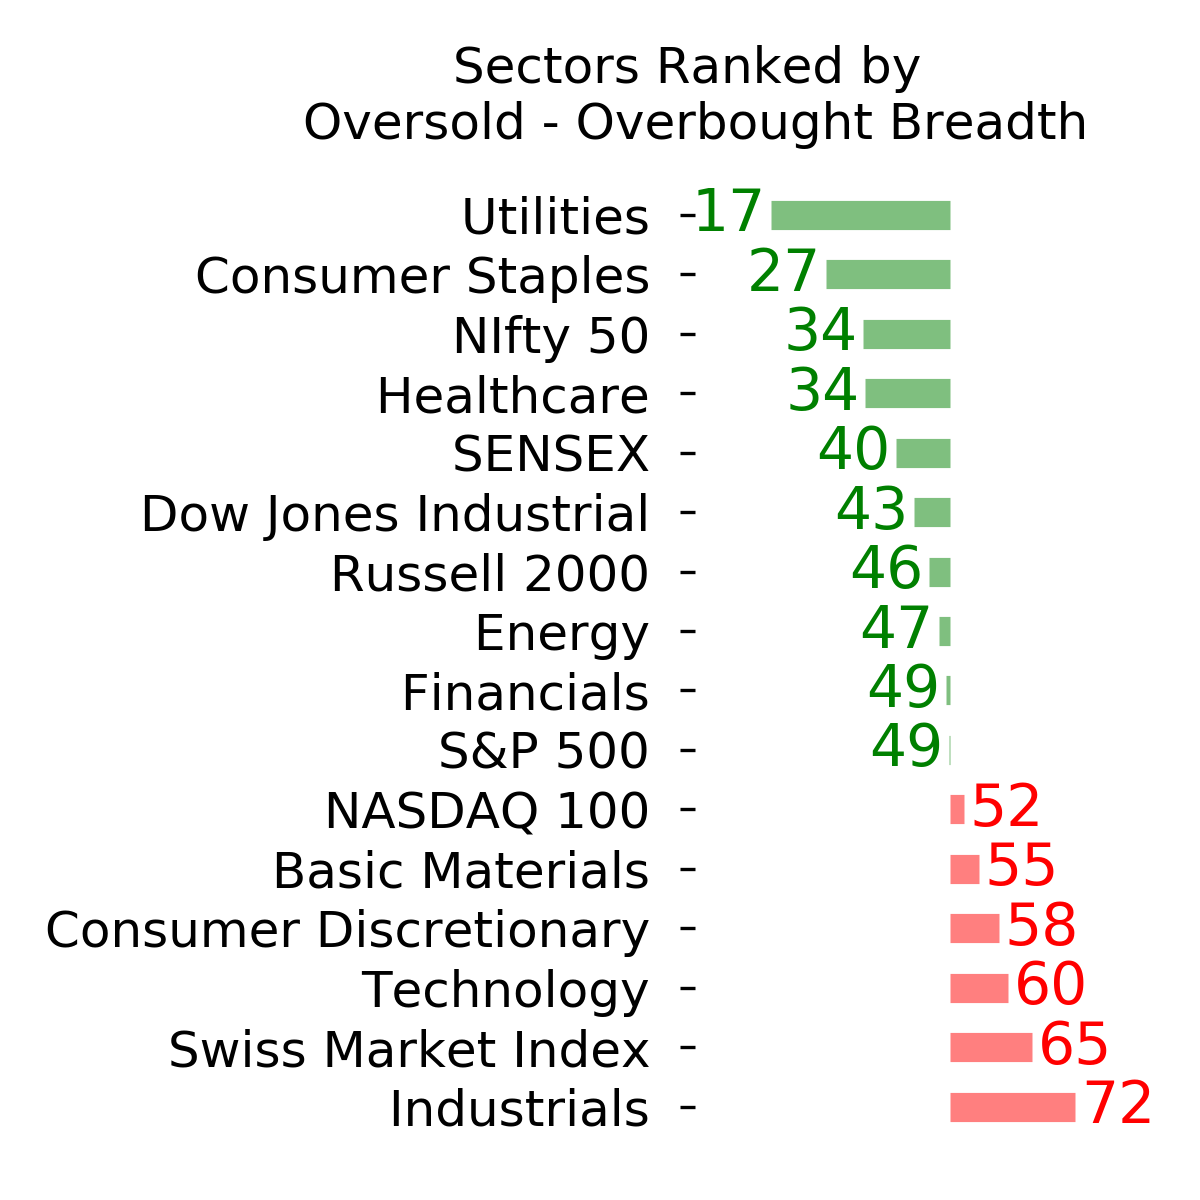
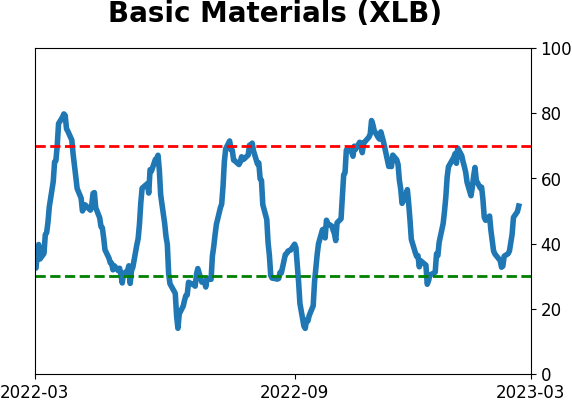
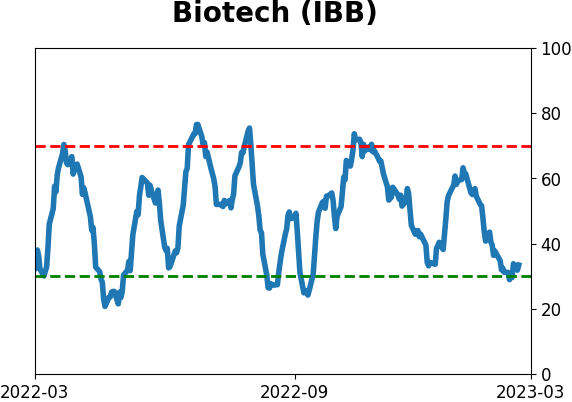
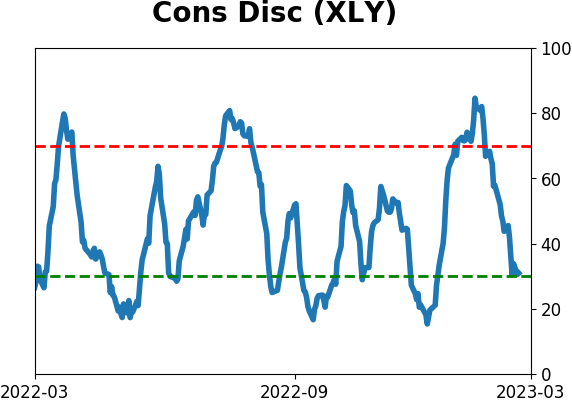
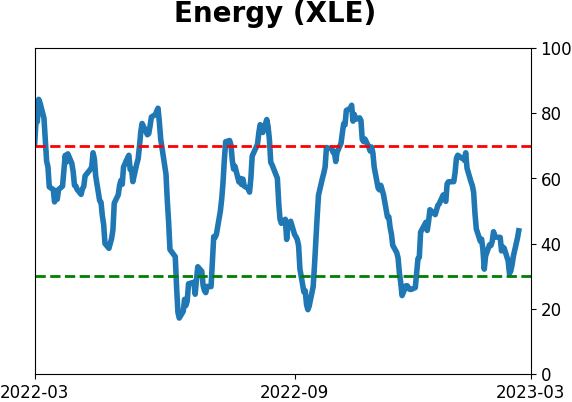
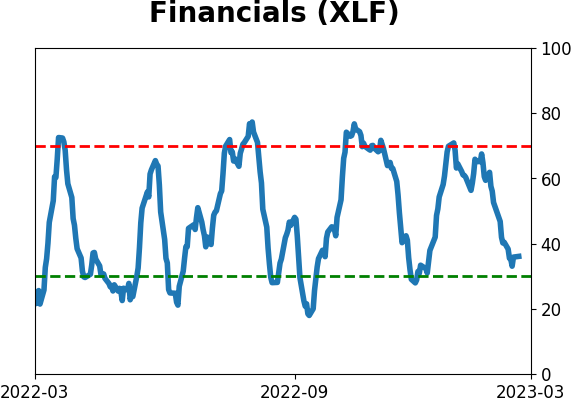
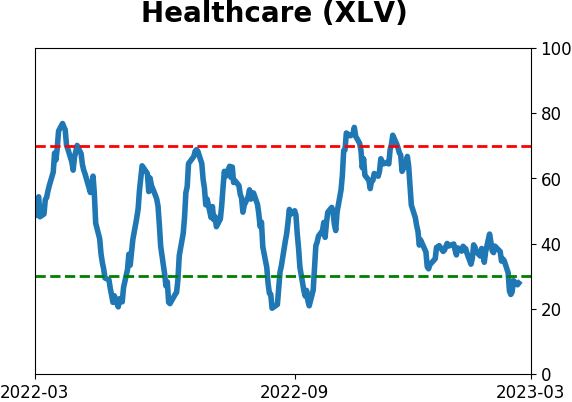
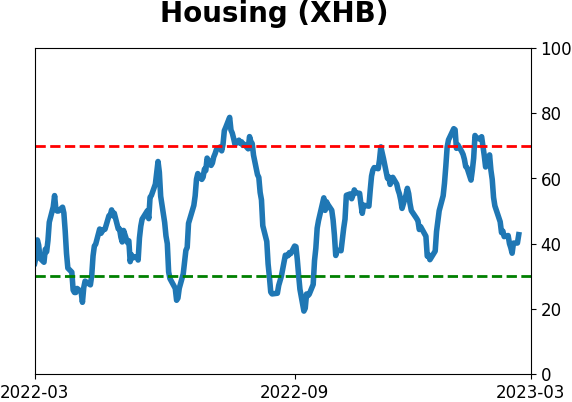
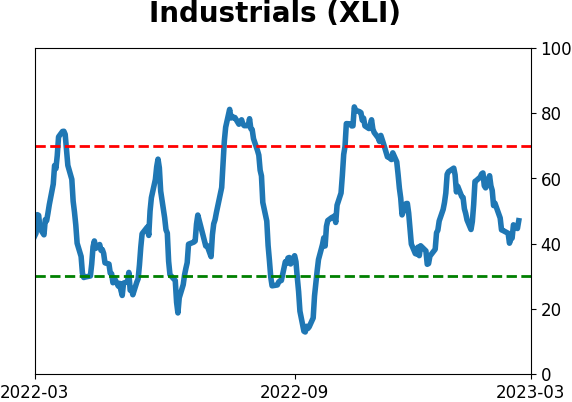
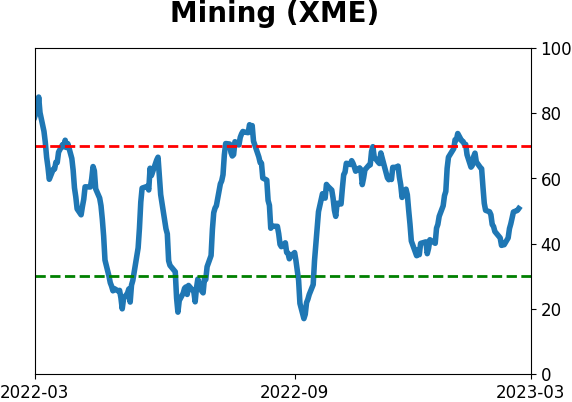
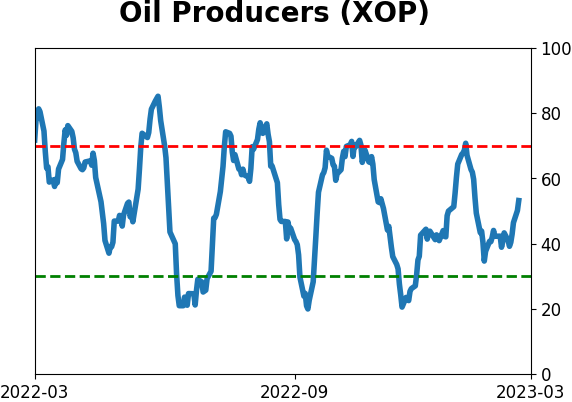
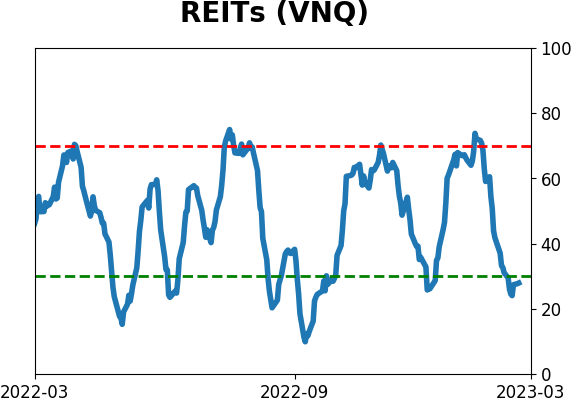
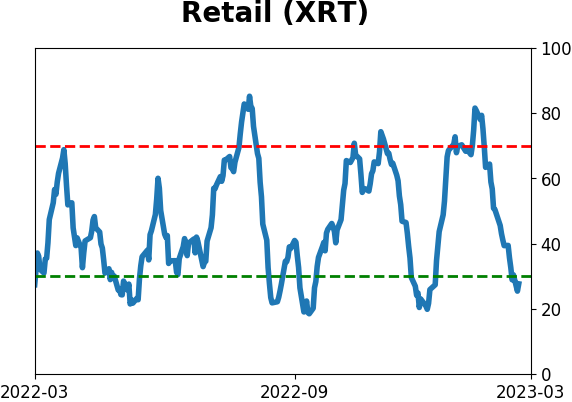
Sector ETF's - 10-Day Moving Average
|
|
|
Country ETF's - 10-Day Moving Average
|
|
|
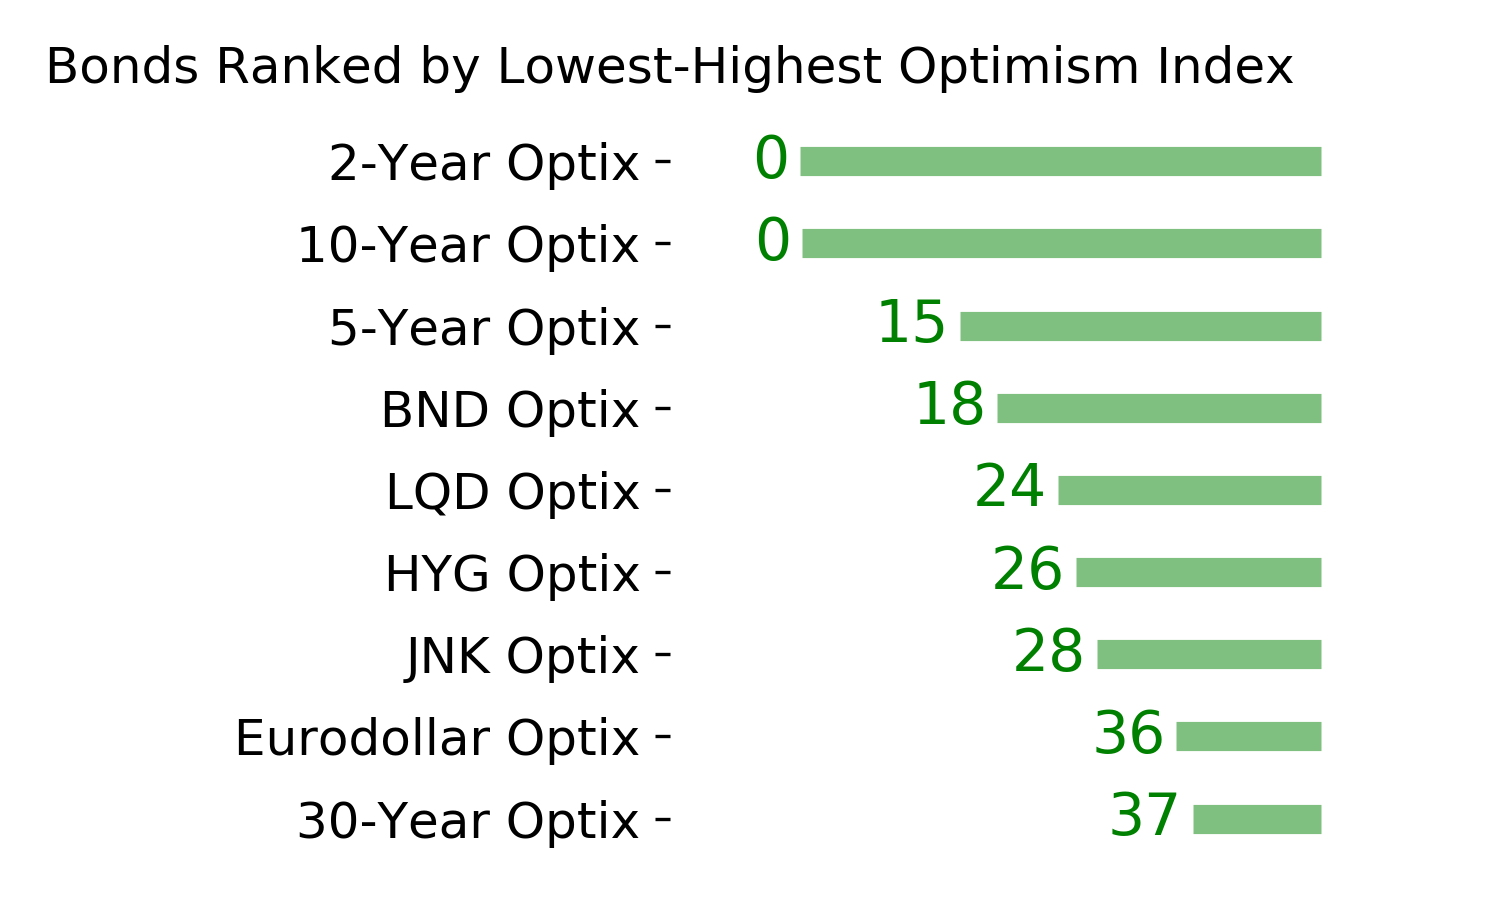
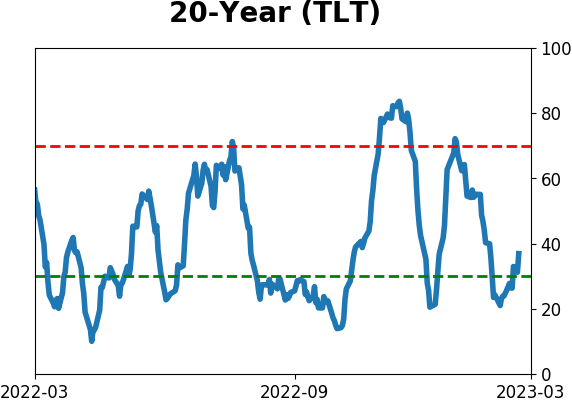
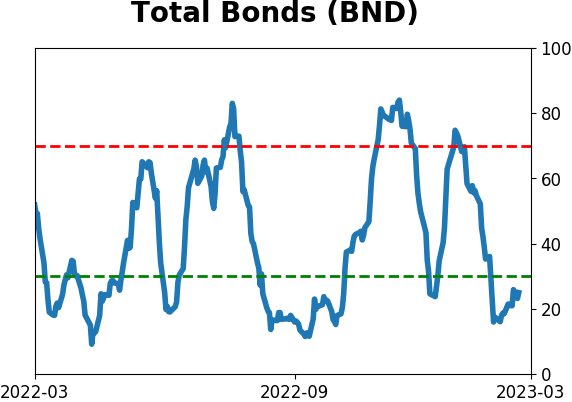
Bond ETF's - 10-Day Moving Average
|
|
|
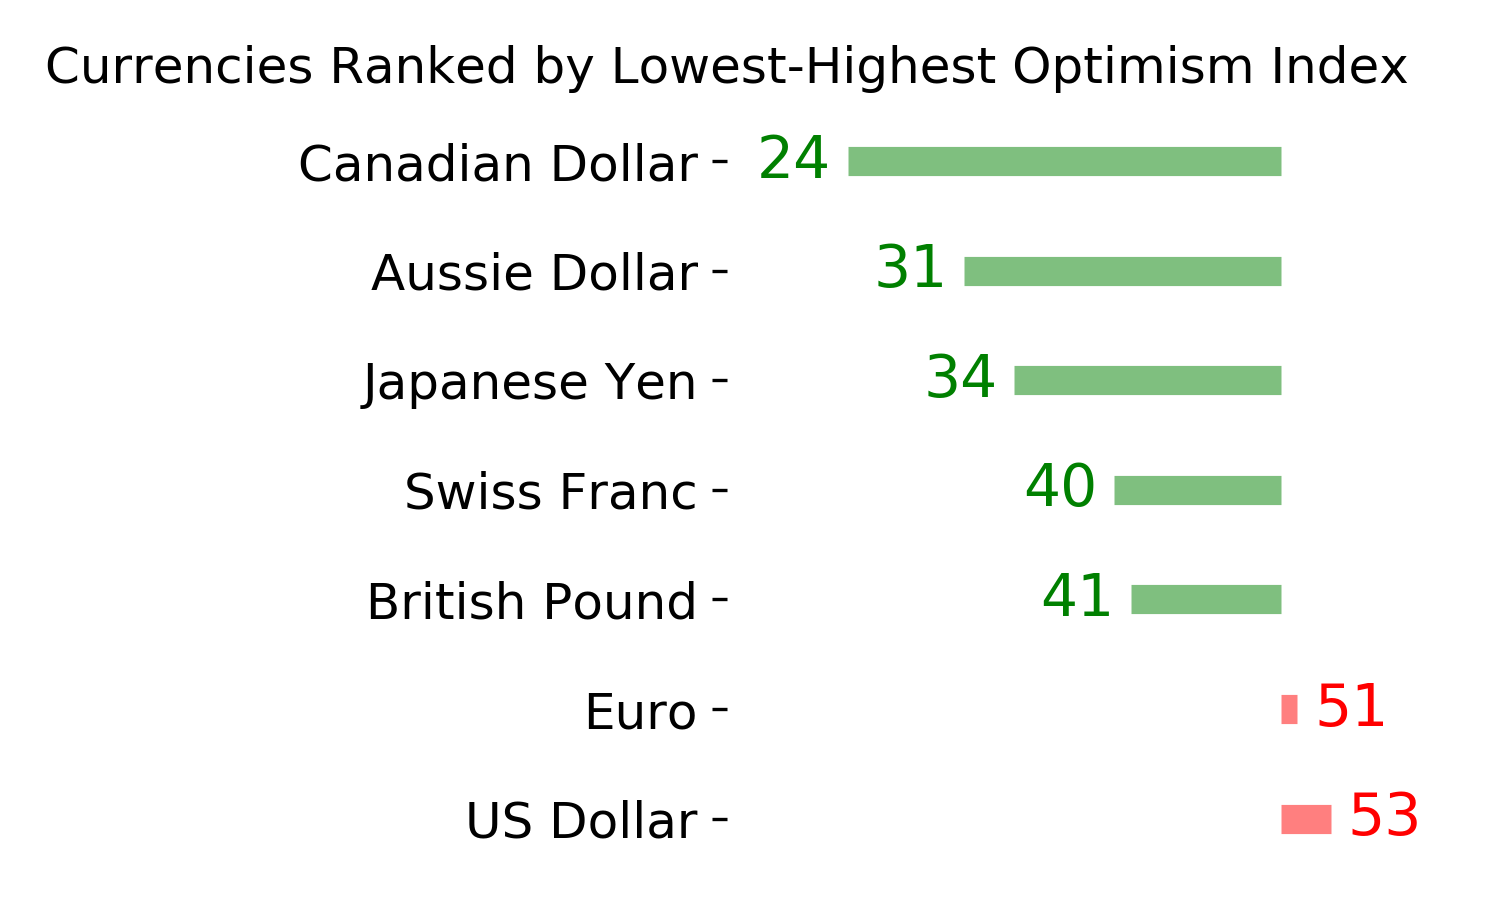
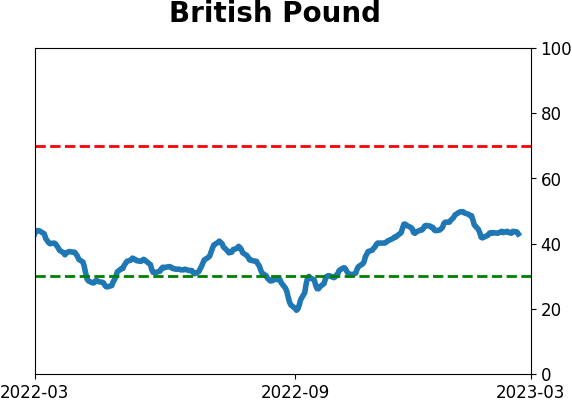
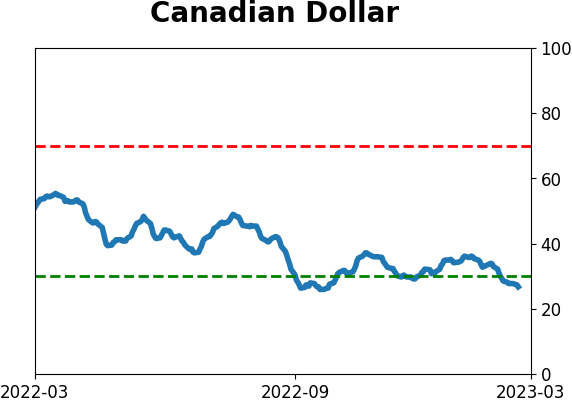
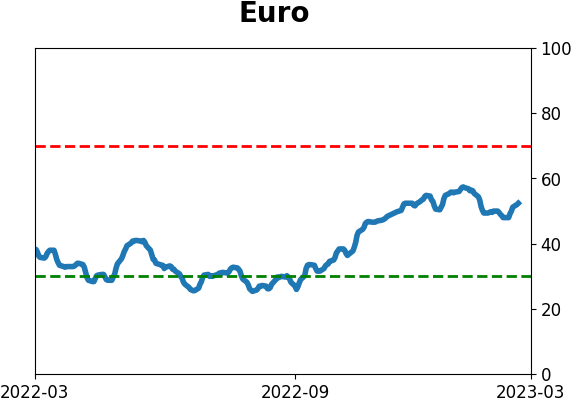
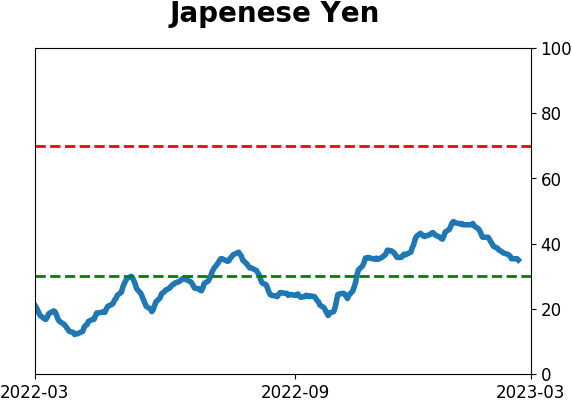
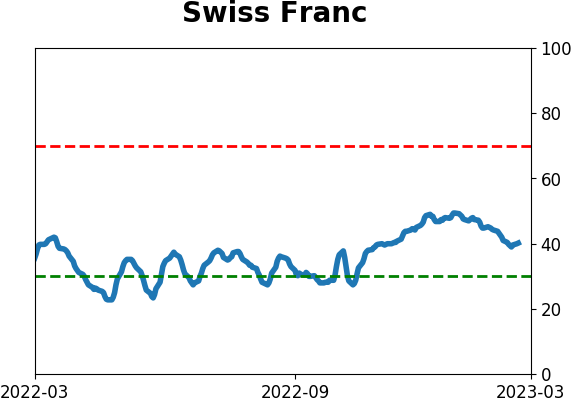
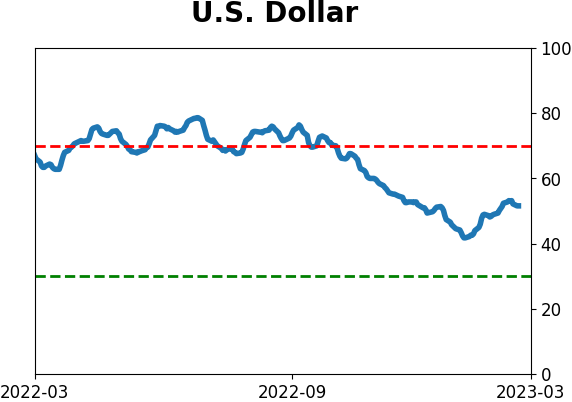
Currency ETF's - 5-Day Moving Average
|
|
|
Commodity ETF's - 5-Day Moving Average
|
|