Headlines
|
|
The volatility of everything is spiking:
Over the past week, implied volatility across assets has spiked. It's at or near the highest in a year in stocks, bonds, currencies, gold, and oil, only the 11th simultaneous cross-asset volatility spike since 1990. Other spikes tended to see stocks and the dollar rally in the months ahead, while gold fell.
NOTE: Our publishing schedule this week will be inconsistent, and a Daily Report may not be sent each day.
|
Smart / Dumb Money Confidence
|
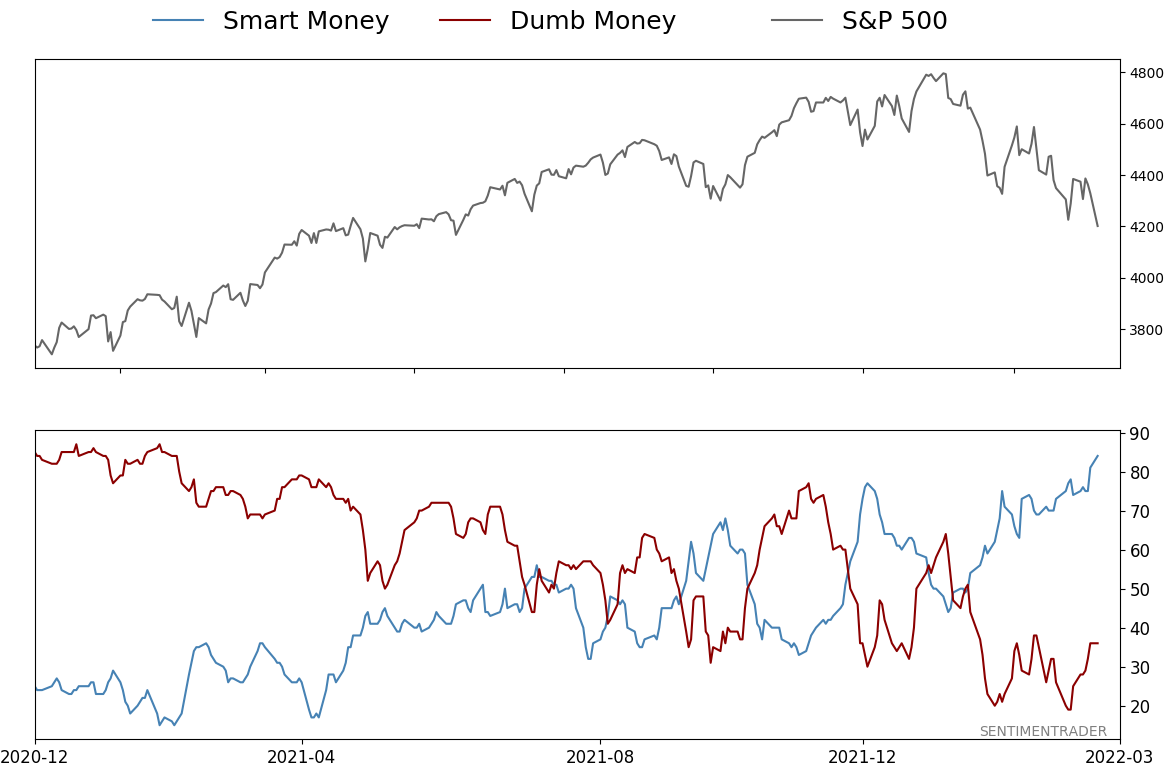
Smart Money Confidence: 84%
Dumb Money Confidence: 36%
|
|
Risk Levels
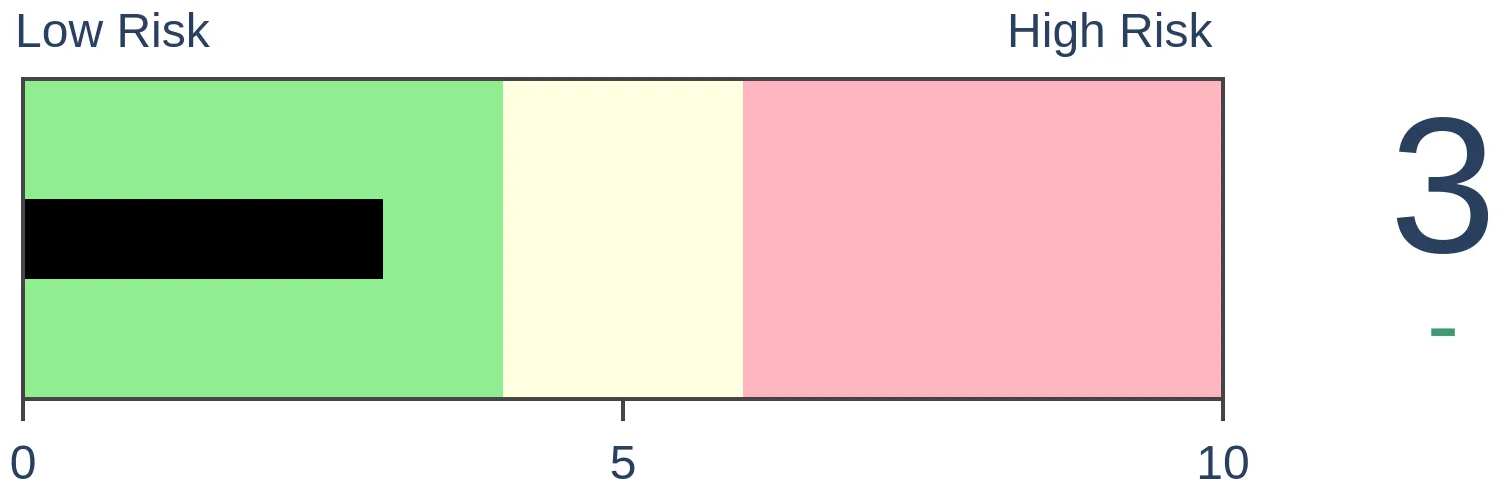
Stocks Short-Term
|
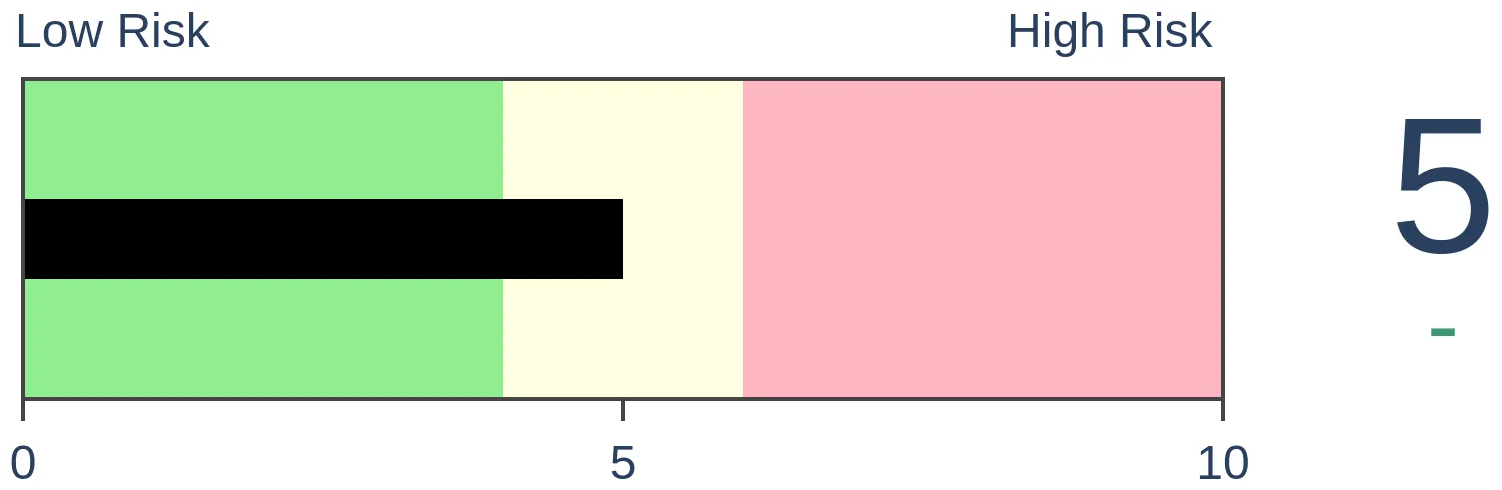
Stocks Medium-Term
|
|
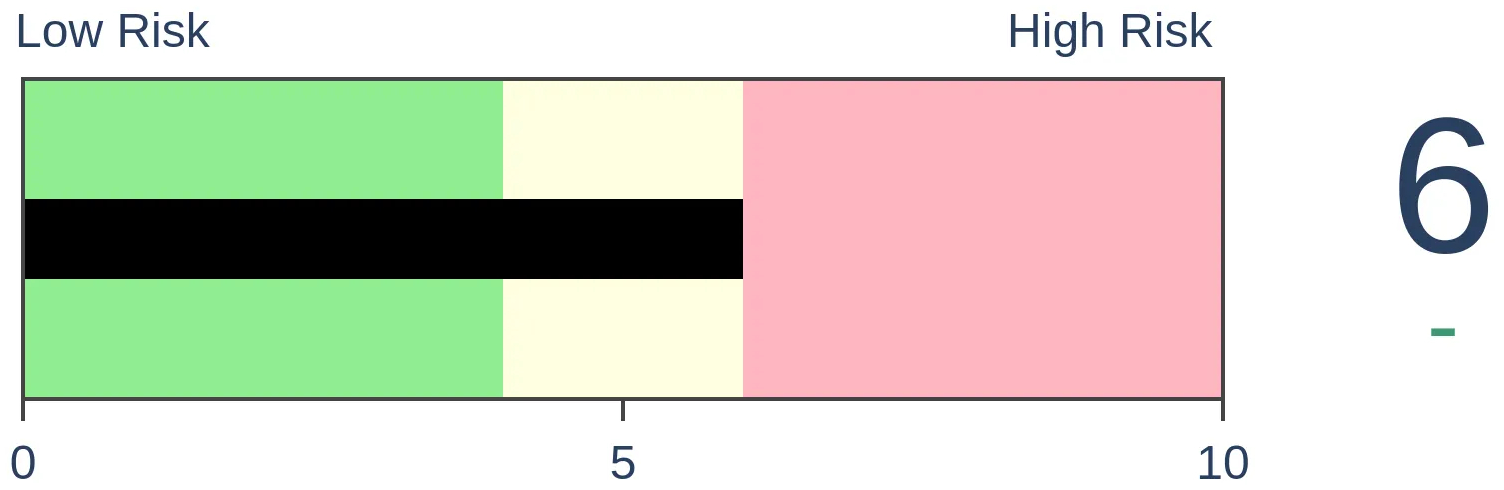
Bonds
|
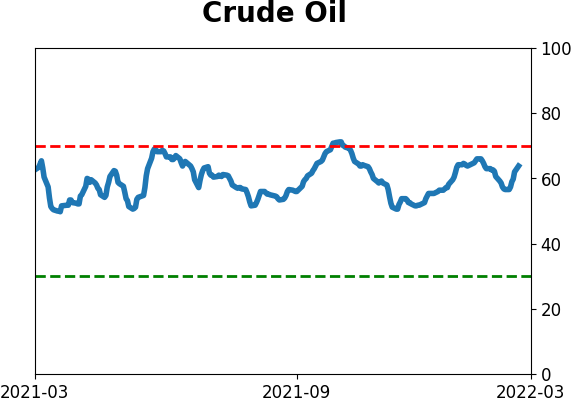
Crude Oil

|
|
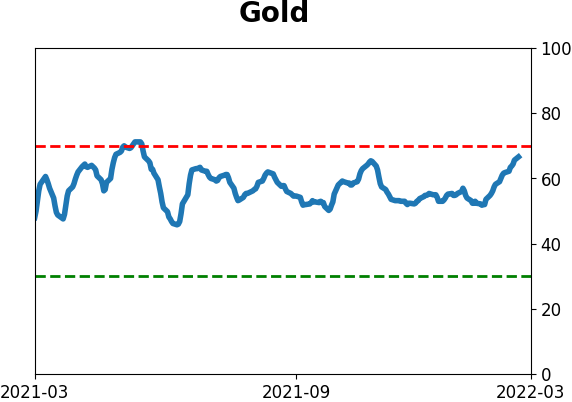
Gold
|
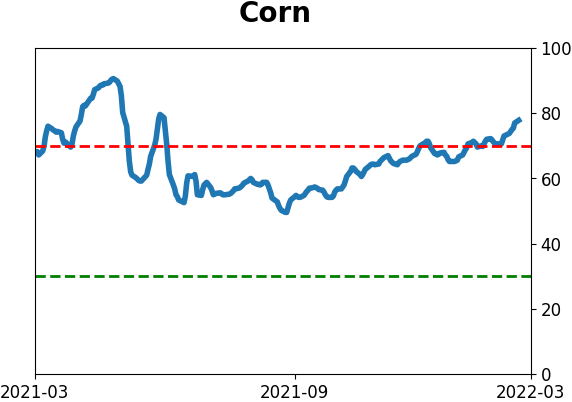
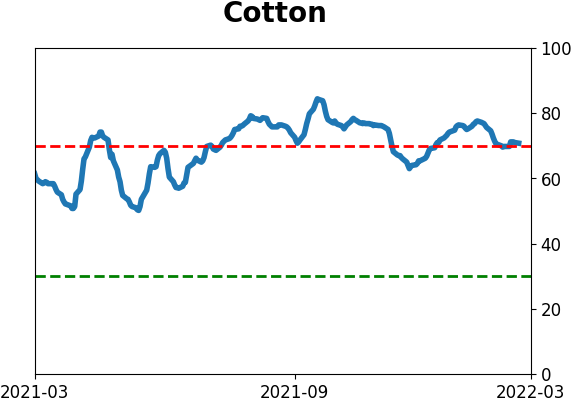
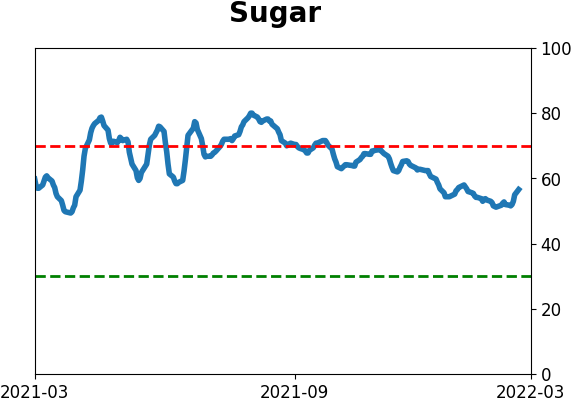
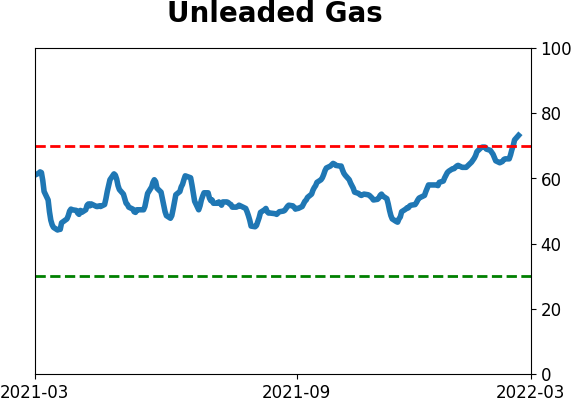
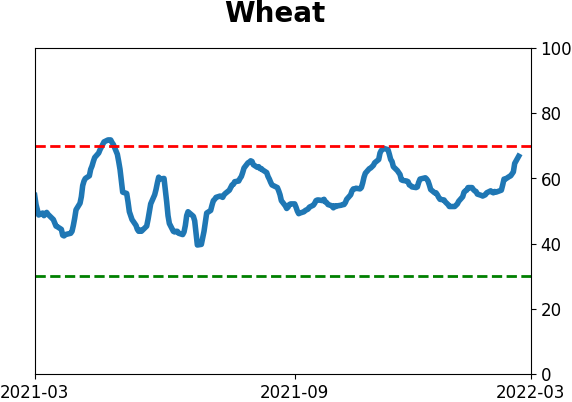
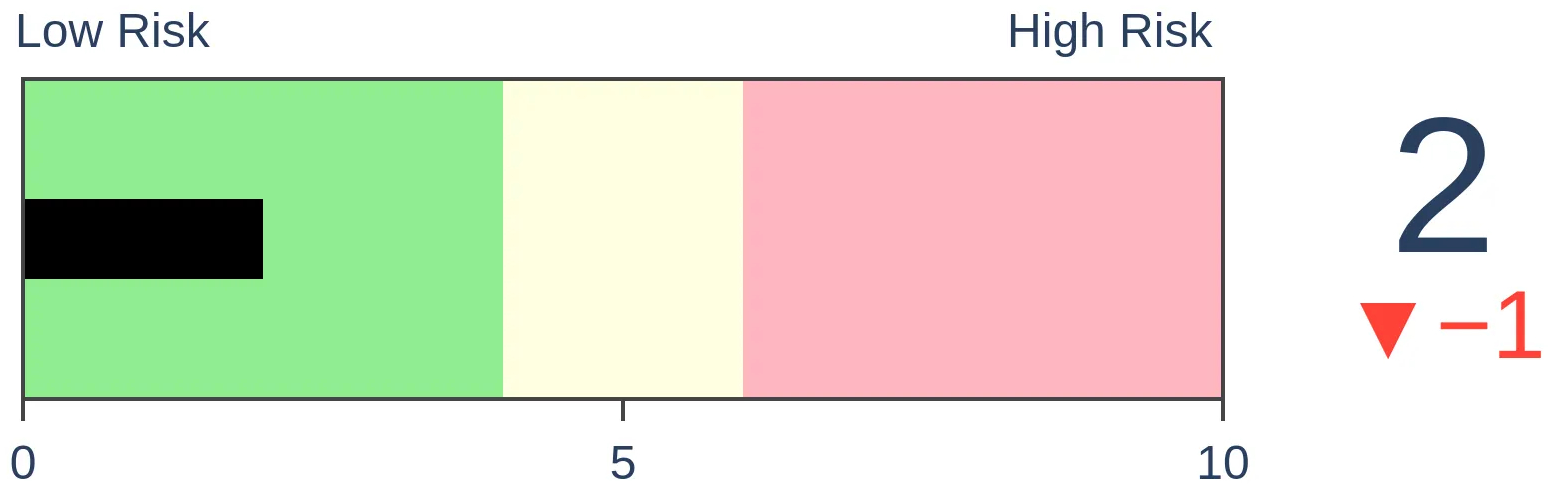
Agriculture

|
|
Research
By Jason Goepfert
BOTTOM LINE
Over the past week, implied volatility across assets has spiked. It's at or near the highest in a year in stocks, bonds, currencies, gold, and oil, only the 11th simultaneous cross-asset volatility spike since 1990. Other spikes tended to see stocks and the dollar rally in the months ahead, while gold fell.
FORECAST / TIMEFRAME
None
|
Key points:
- Implied volatilities in stocks, bonds, currencies, gold, and oil are all spiking
- This is only the 11th cross-asset volatility spike in 30 years
- After similar behavior, stocks and the dollar tended to rally while gold and oil fell
Traders are pricing in volatility spikes...everywhere
We saw last week that while investors are pessimistic (especially in stocks), they're not panicking. When true panic grips markets, it's usually reflected in credit, and it's just not happening to any great degree yet.
That's not to say there isn't volatility. There is, and it's everywhere.
Options traders price in rising volatility in stocks almost exclusively when they're declining. That's when investors panic. But in other markets, from bonds to FX to commodities, implied volatility just as often spikes when prices are rising quickly as when they're falling. When volatility across assets spikes at the same time, you know some crazy sh** is going down.
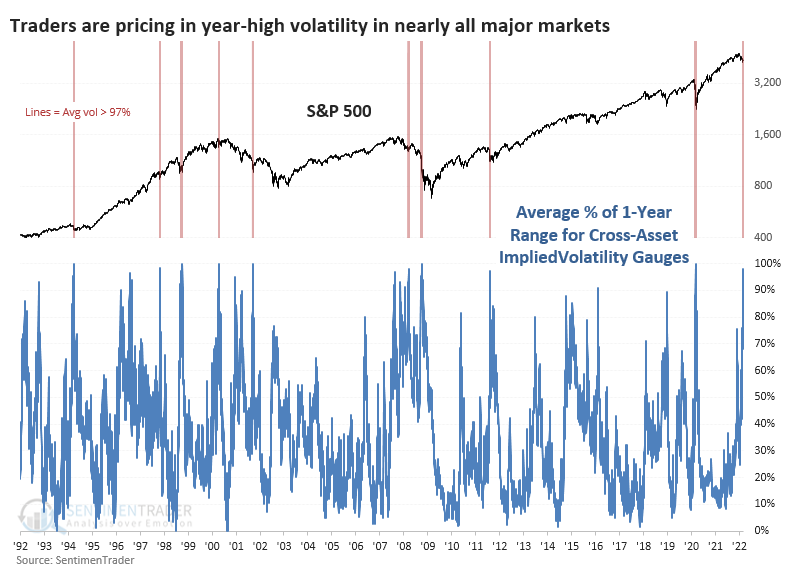
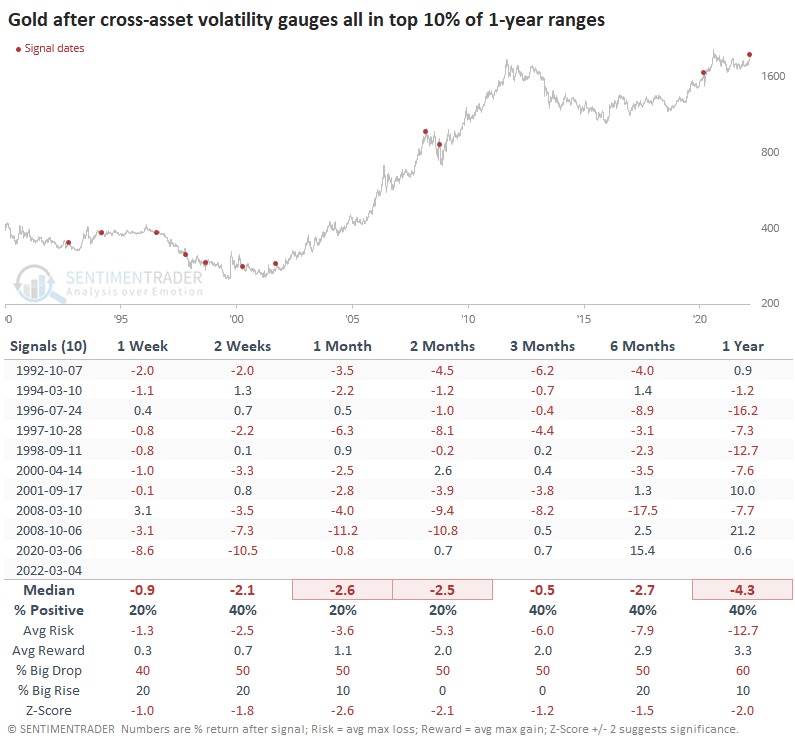
That's what's happening right now-for one of the few times in history, implied volatility in stocks, bonds, currencies, gold, and oil is spiking simultaneously. This is one of only a handful of times that every market is seeing the highest (or nearly the highest) volatility in the past year. The chart below shows volatility expectations for each market as a percentage of their one-year ranges.
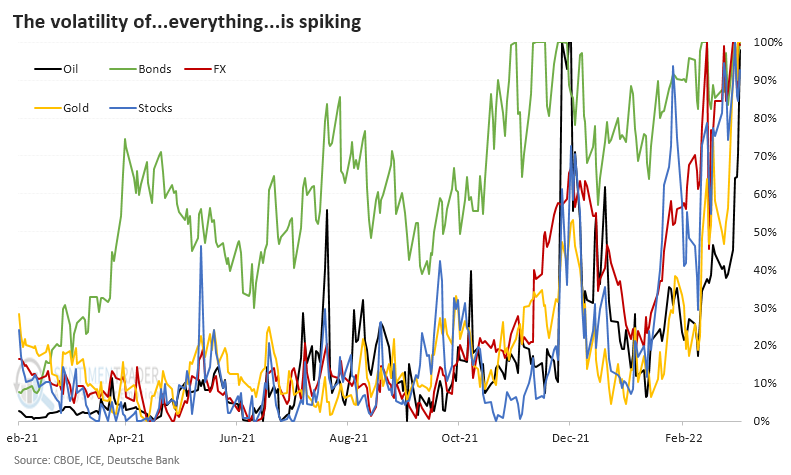
The average volatility gauge across markets is in the top 2% of their yearly ranges. That's an incredible bout of cross-asset concern that we've rarely seen in the past 30 years.
Volatility spikes tend to be good for stocks and the dollar, bad for gold and oil
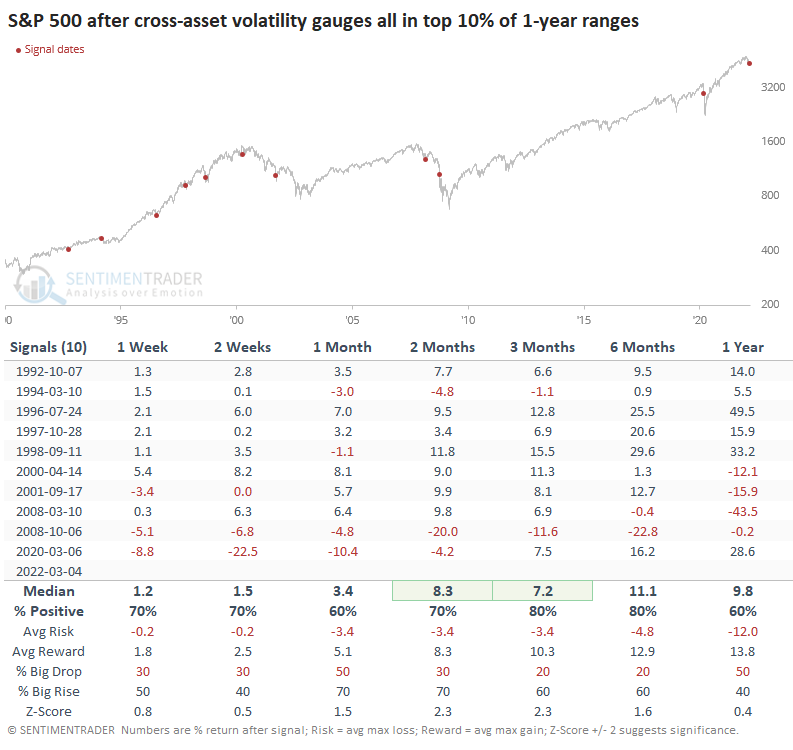
For the S&P 500, these bouts of high anxiety across markets have preceded excellent medium-term returns. The only real exceptions, unfortunately, were the last two. While it preceded a significant relief rally early in 2008, when it triggered again in October of that year, the final melt-down phase of the Global Financial Crisis was in full force. The same happened during the pandemic crash.
However, during other crises, it proved to be a good buying trigger for stocks, at least for a multi-week to multi-month rebound (including the Russian devaluation in 1998).
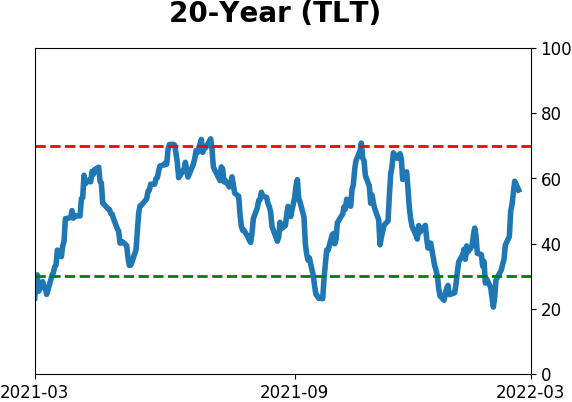
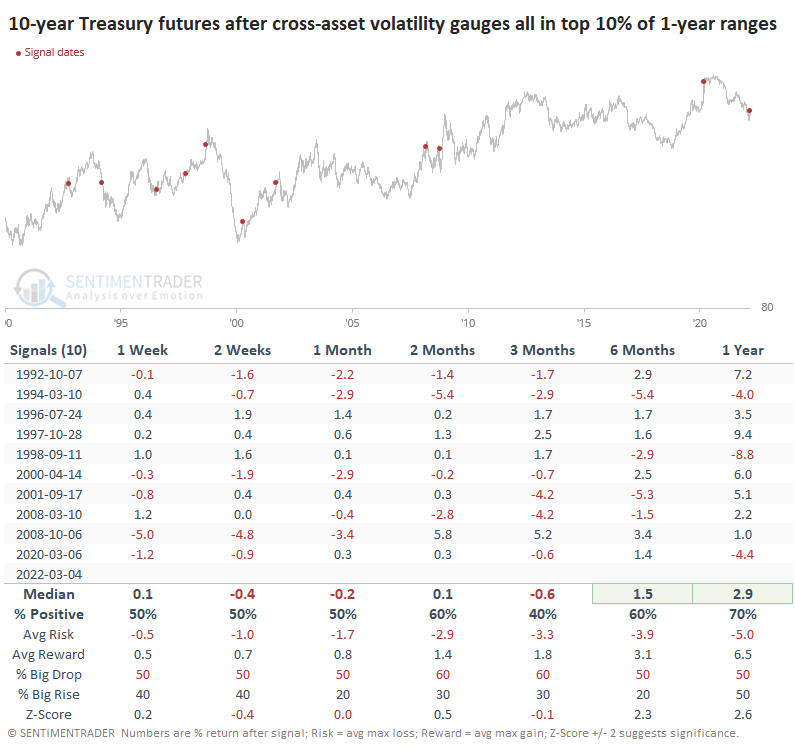
For bonds, it was more of a mixed picture. The futures on 10-year Treasuries showed inconsistent gains, though there was a slight positive correlation between short-term and long-term returns. If investors bid up Treasury prices in the week(s) after these volatility spikes, it was a better sign for their long-term prospects as well.
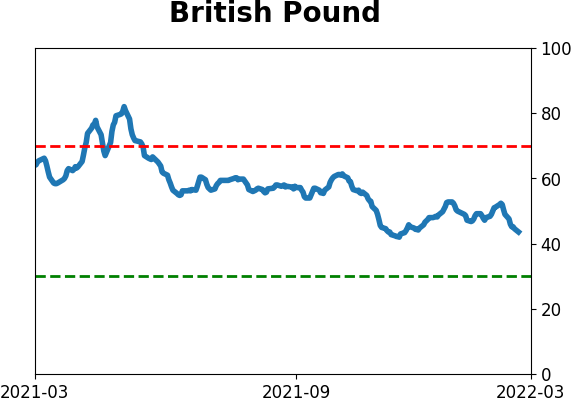
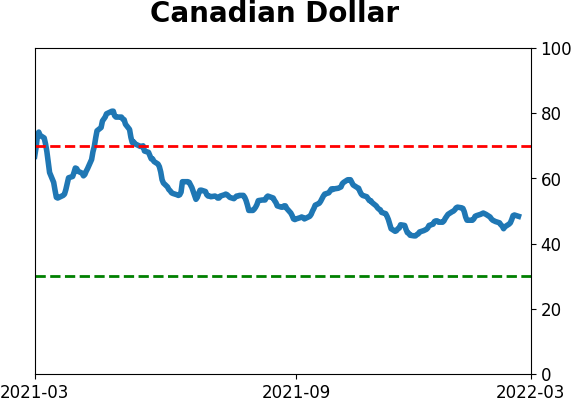
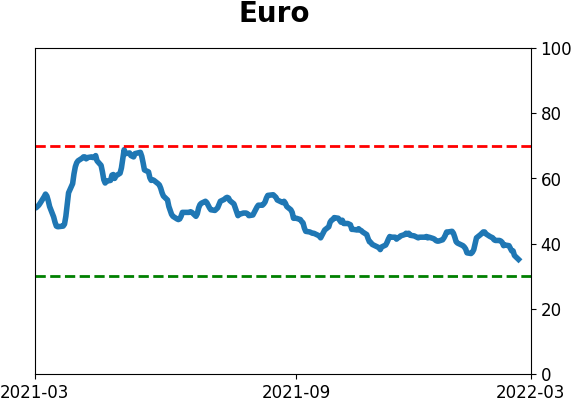
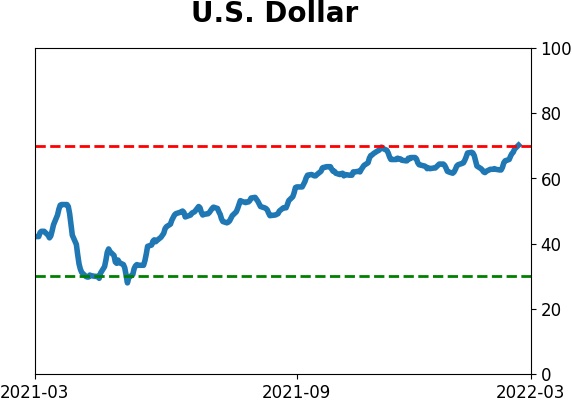
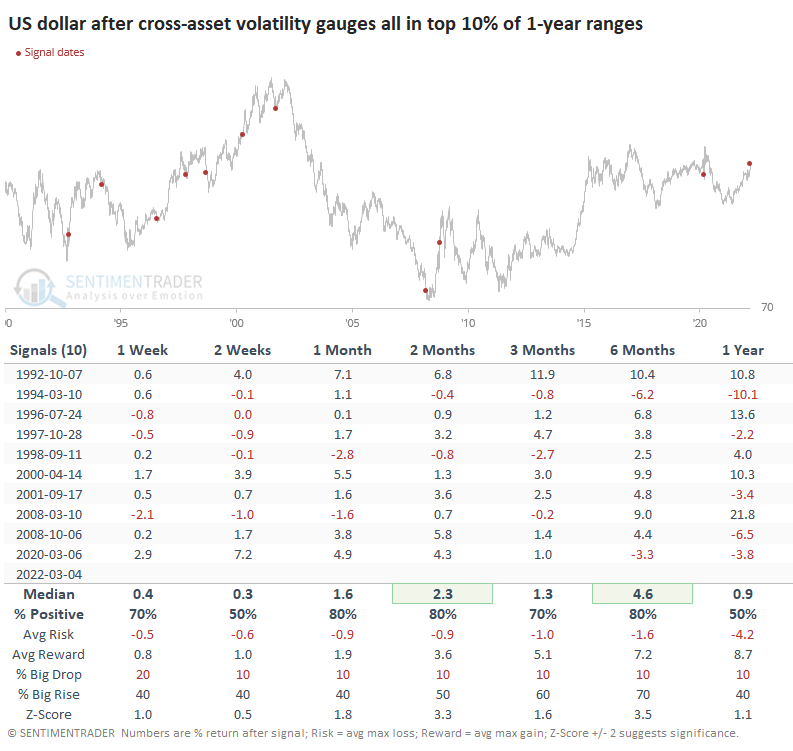
The dollar has often served as a safe-haven vehicle along with Treasuries, and several of these cross-asset volatility spikes coincided with a rising dollar. The buck tended to keep going in the months ahead, showing a positive return over the next 2 months after 8 of the 10 signals.
Gold is considered a good place to park "the world is going to hell" bets, and most of these crises saw the metal being bid up in the weeks prior. Unfortunately for gold bugs, it had a heck of a time holding onto those gains. Either 1 or 2 months later, gold sported a negative return every time.
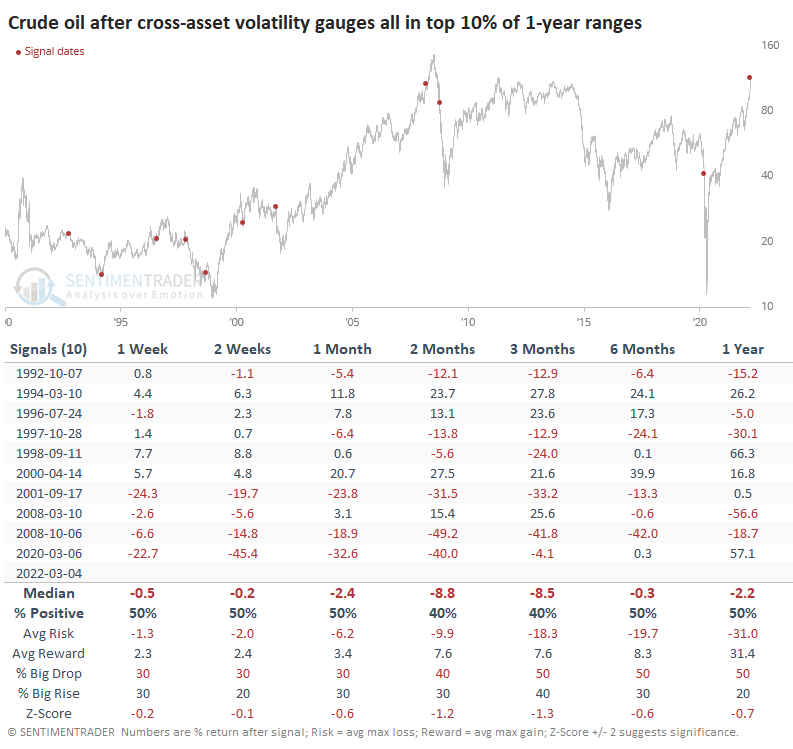
Crude oil also had trouble holding gains from these volatility spikes, especially in recent decades. This market, in particular, is subject to booms and busts based on supply/demand and geopolitical machinations and is the least subject to historical analysis because of it.
What the research tells us...
The Panic Button indicators we looked at last week are climbing quickly - it's up to 0.5 from 0.0 last week. But that's still far below all-out credit panic readings of 3.5 and above. That's not necessarily bad because investors do NOT want credit markets to sow panic. If and when they do, it's typically only during waterfall crashes. While investors are highly anxious, so far, the damage is relatively constrained, which should be a good thing from a multi-month point of view.
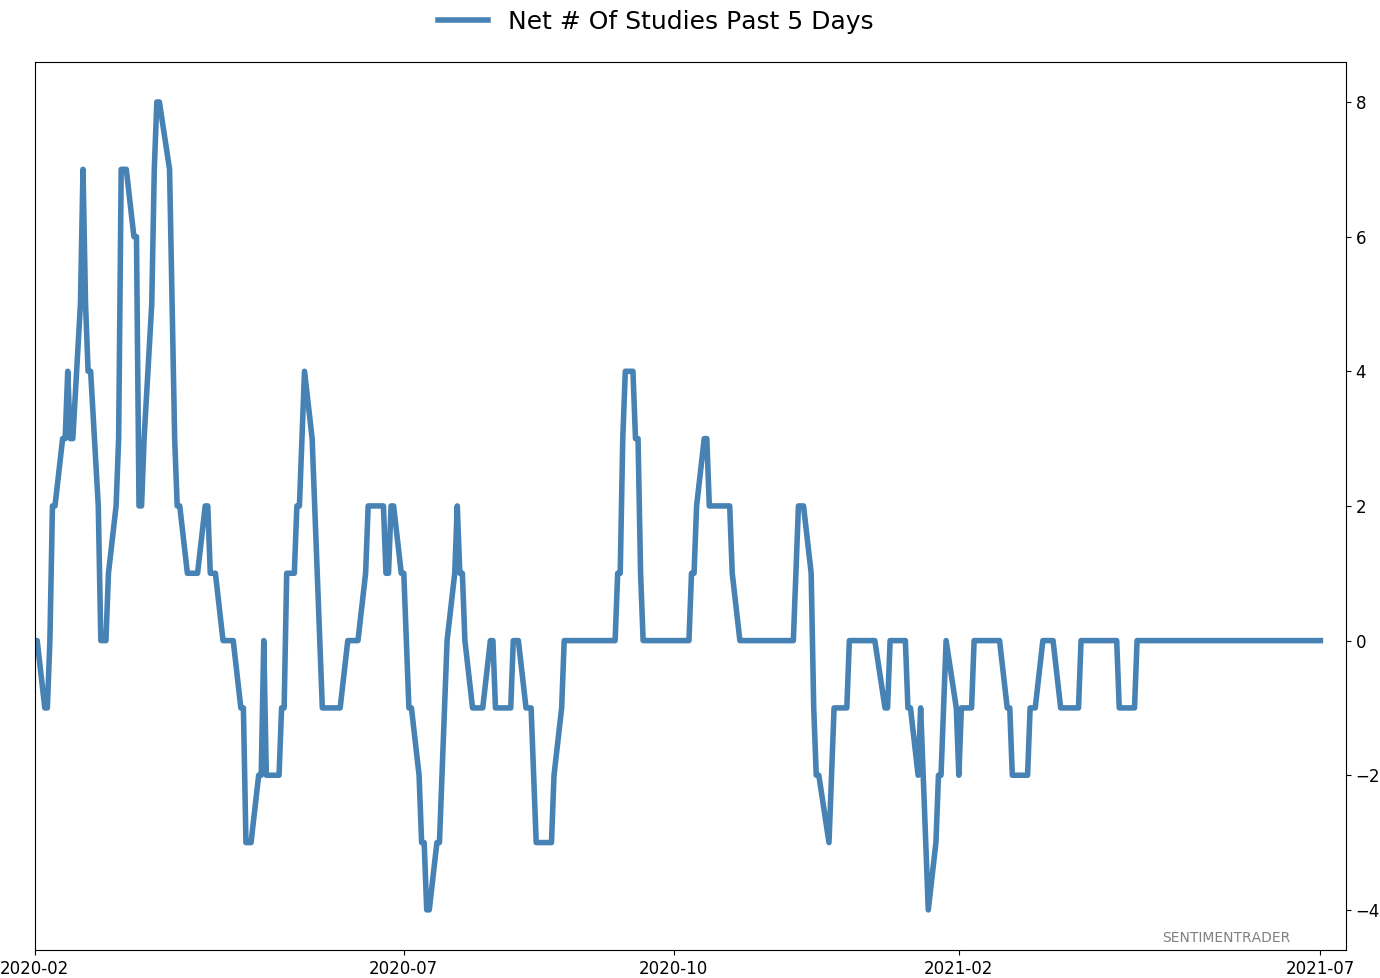
Active Studies
| Time Frame | Bullish | Bearish | | Short-Term | 4 | 0 | | Medium-Term | 21 | 2 | | Long-Term | 15 | 5 |
|
Indicators at Extremes
Portfolio
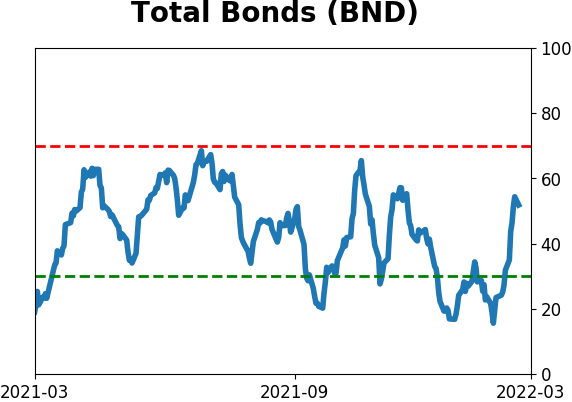
| Position | Description | Weight % | Added / Reduced | Date | | Stocks | RSP | 21.4 | Added 10.2% | 2022-01-28 | | Bonds | 32.7% BND, 7.1% SCHP | 40.1 | Added 8.3% | 2021-10-26 | | Commodities | GCC | 2.4 | Reduced 2.1%
| 2020-09-04 | | Precious Metals | GDX | 4.6 | Reduced 4.2% | 2021-05-19 | | Special Situations | 7.6% KWEB, 4.9% XBI, 3.7% XLE, 1.8% PSCE | 18.0 | Added 4.6% | 2022-02-24 | | Cash | | 13.2 | | |
|
Updates (Changes made today are underlined)
With a typical time frame of several months in this account, I normally don't make changes so quickly. I've added back part of the stock exposure I took off earlier in January due to the washed-out conditions and extreme pessimism we're seeing across a wide array of metrics. The biggest issue is that the environment is unhealthy and we could be in the throes of a protracted bear market. Even so, the readings we've seen recently have a good record at preceding relief rallies, so we'll have to see how that pans out. Bond sentiment is trying to recover from a recent bout of pessimism, and gold stocks are doing their thing which is not much at all. They've been flat for six months. Chinese tech stocks were doing exactly what they're supposed to do, then did *not* by plunging to new lows. This is troubling on a shorter-term time frame, but this was never meant for a trade, rather a multi-year investment. Recent behavior is troubling and I will not be adding any exposure as long as that's the case. RETURN YTD: -0.5% 2021: +8.7%, 2020: +8.1%, 2019: +12.6%, 2018: +0.6%, 2017: +3.8%, 2016: +17.1%, 2015: +9.2%, 2014: +14.5%, 2013: +2.2%, 2012: +10.8%, 2011: +16.5%, 2010: +15.3%, 2009: +23.9%, 2008: +16.2%, 2007: +7.8%
|
|
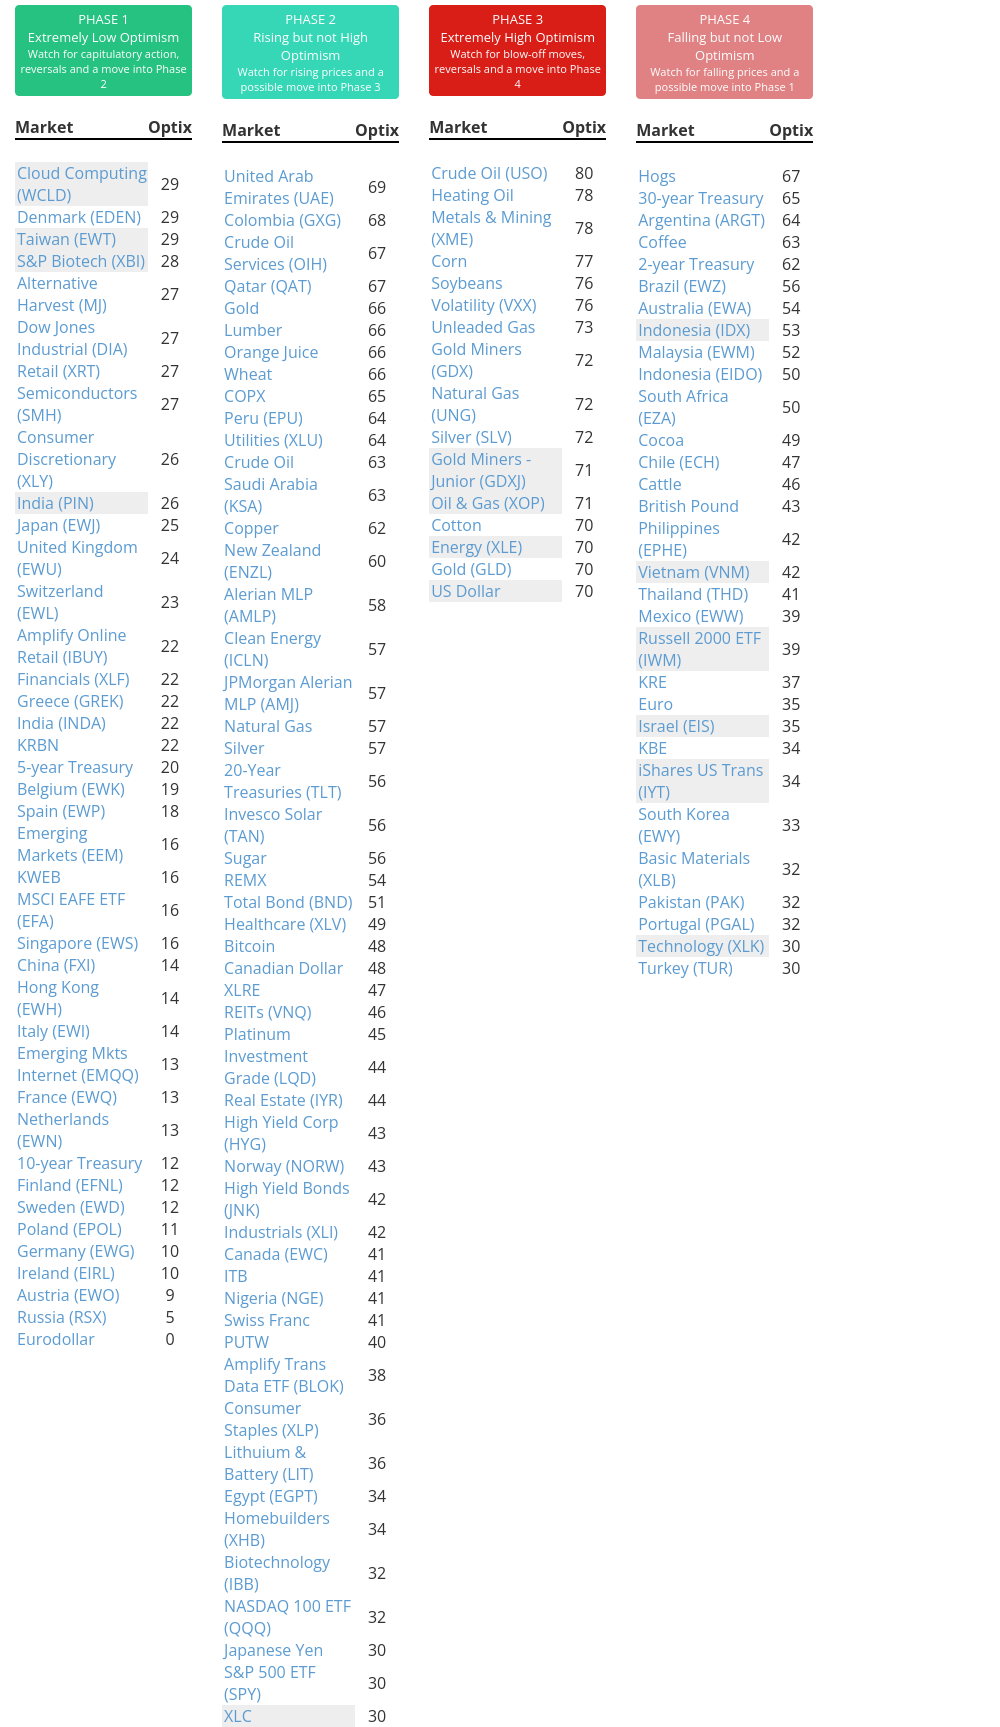
Phase Table
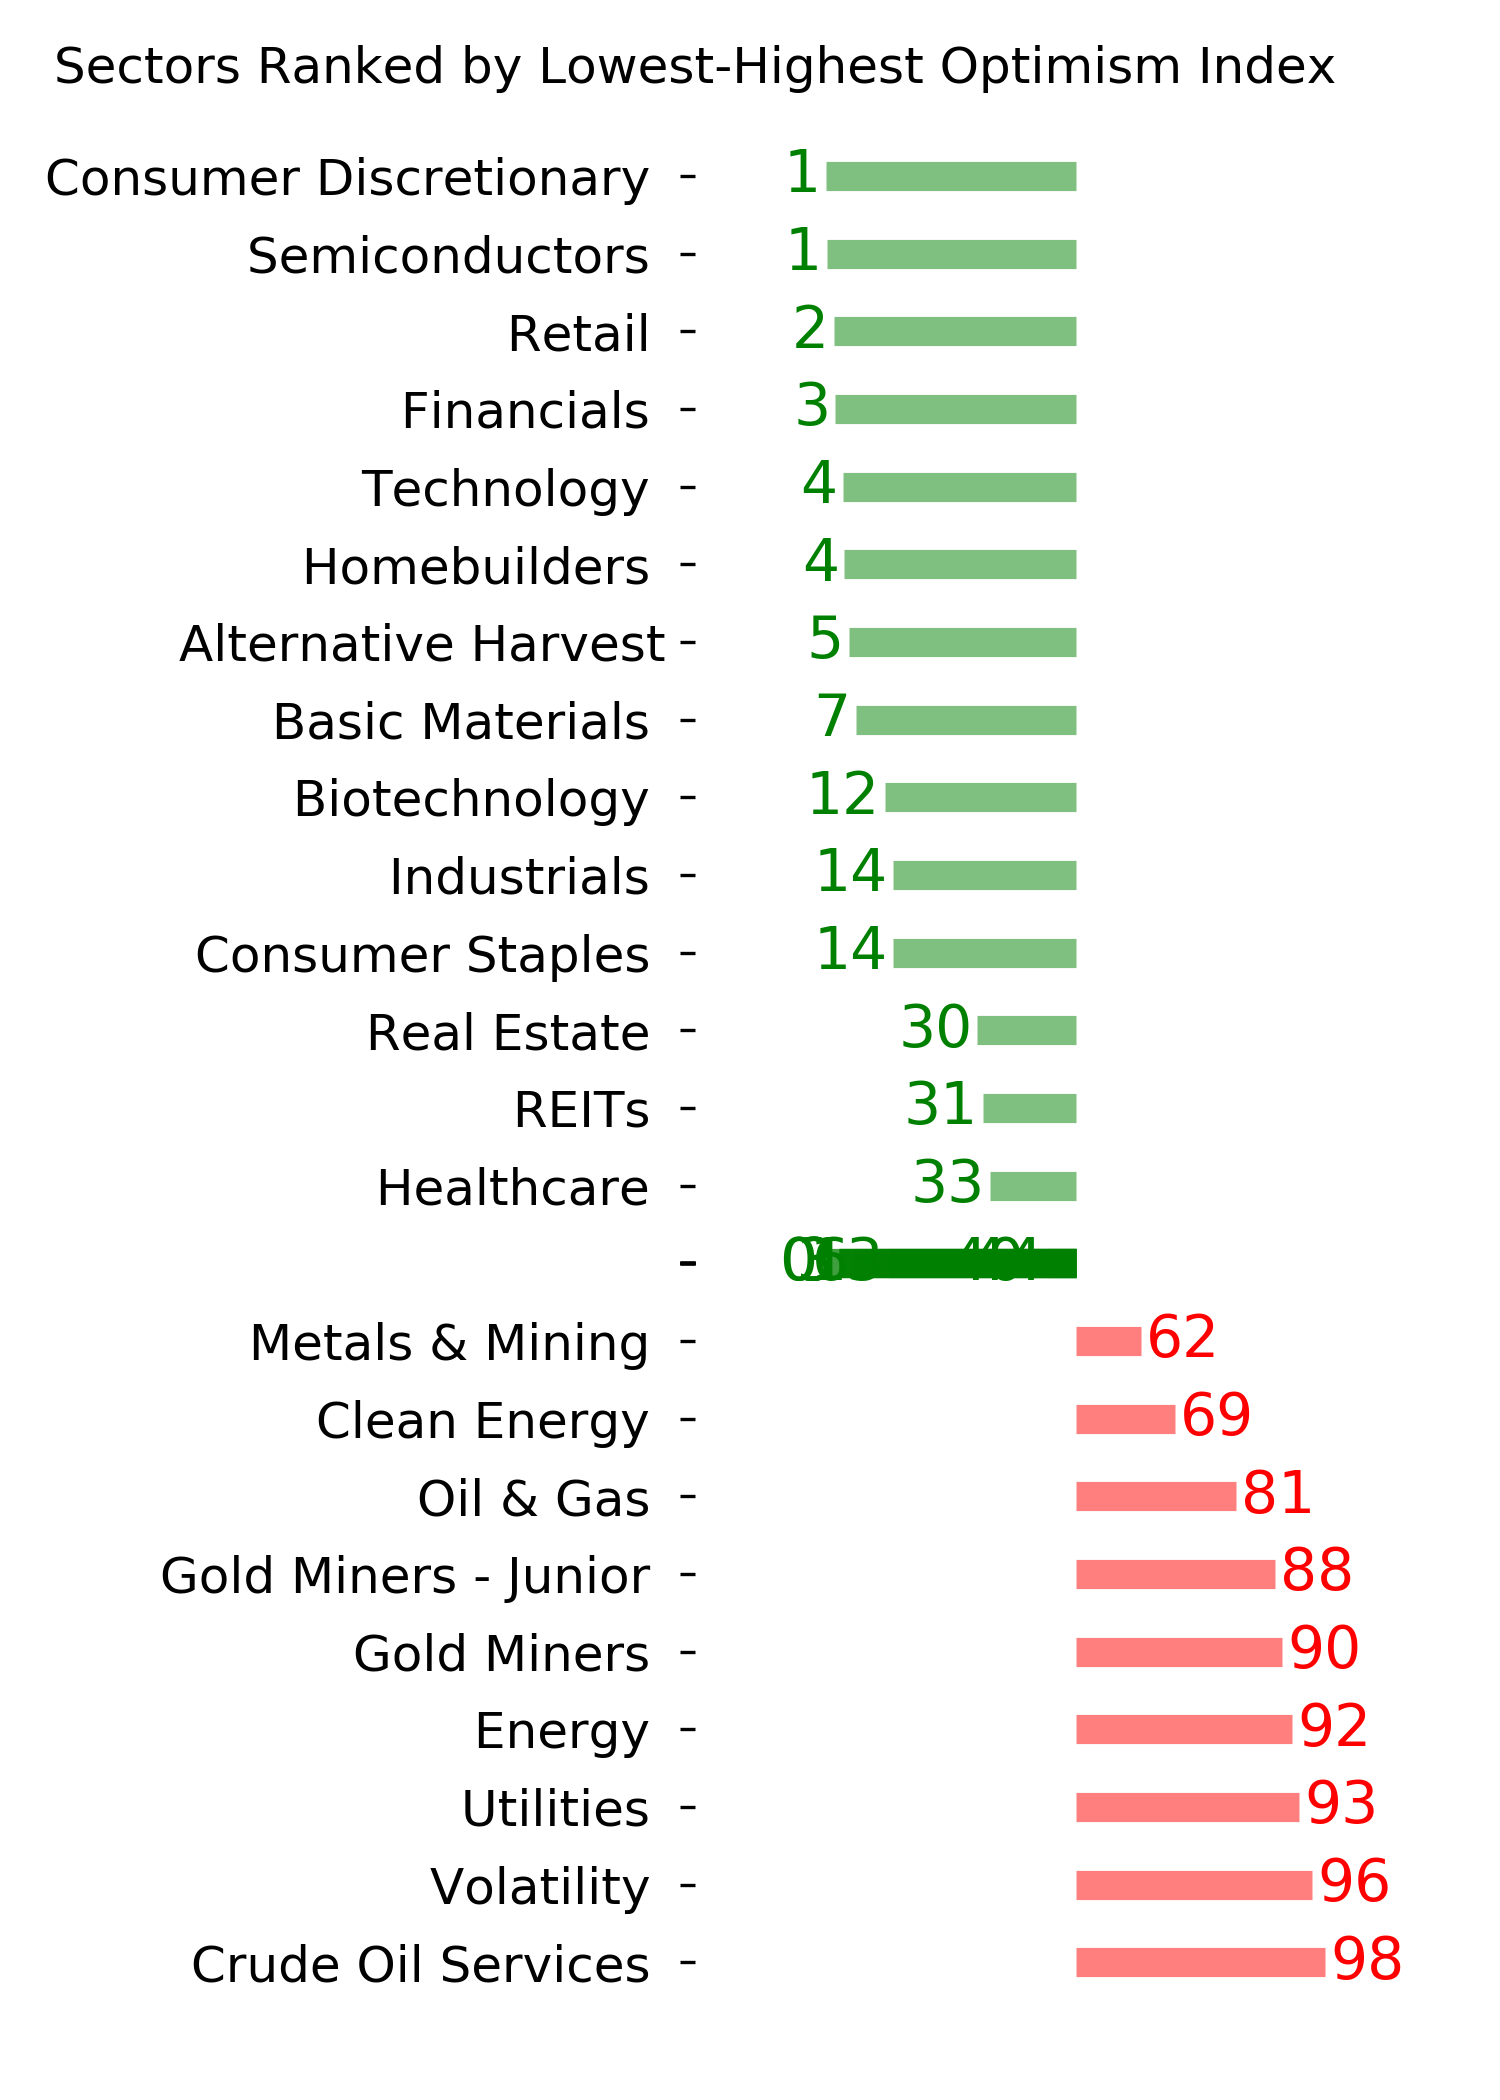
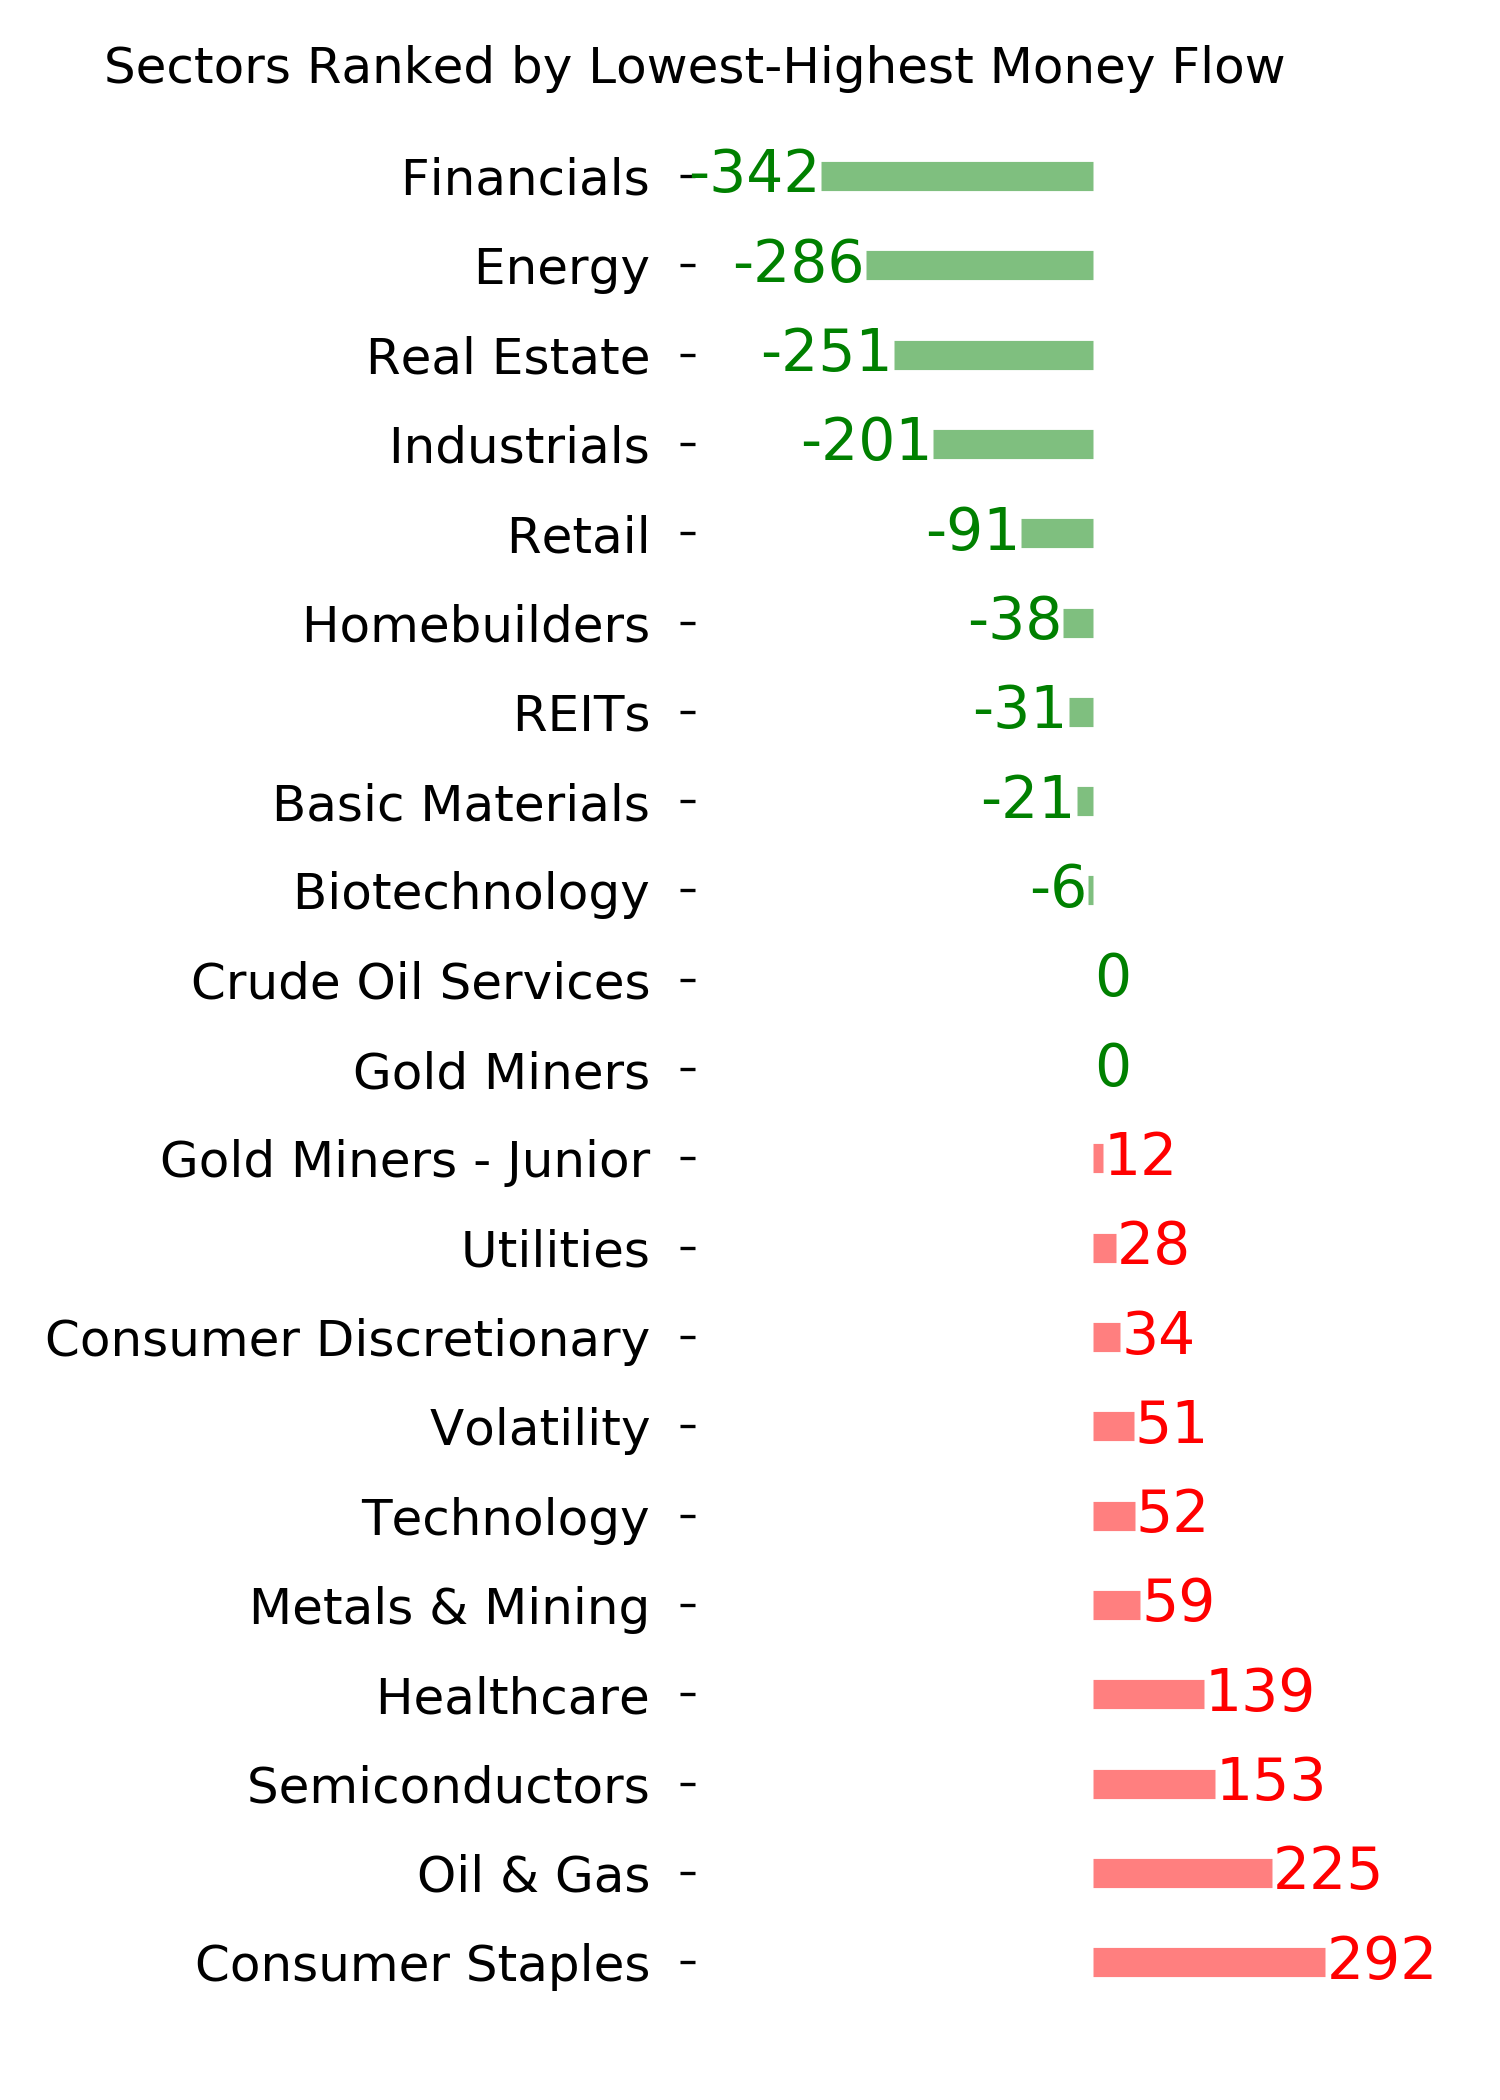
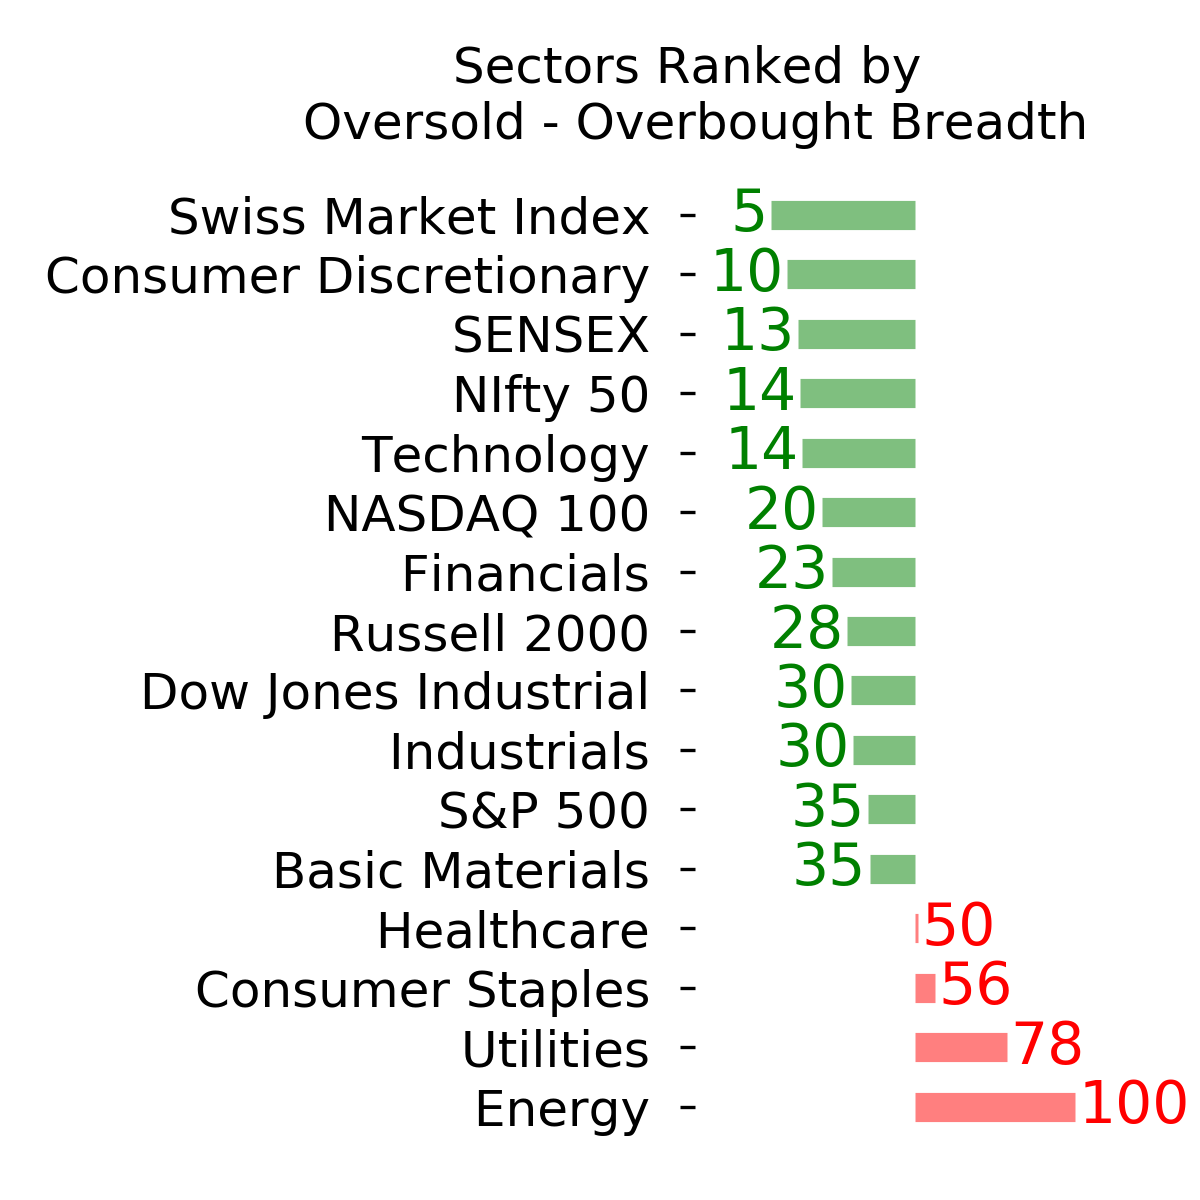
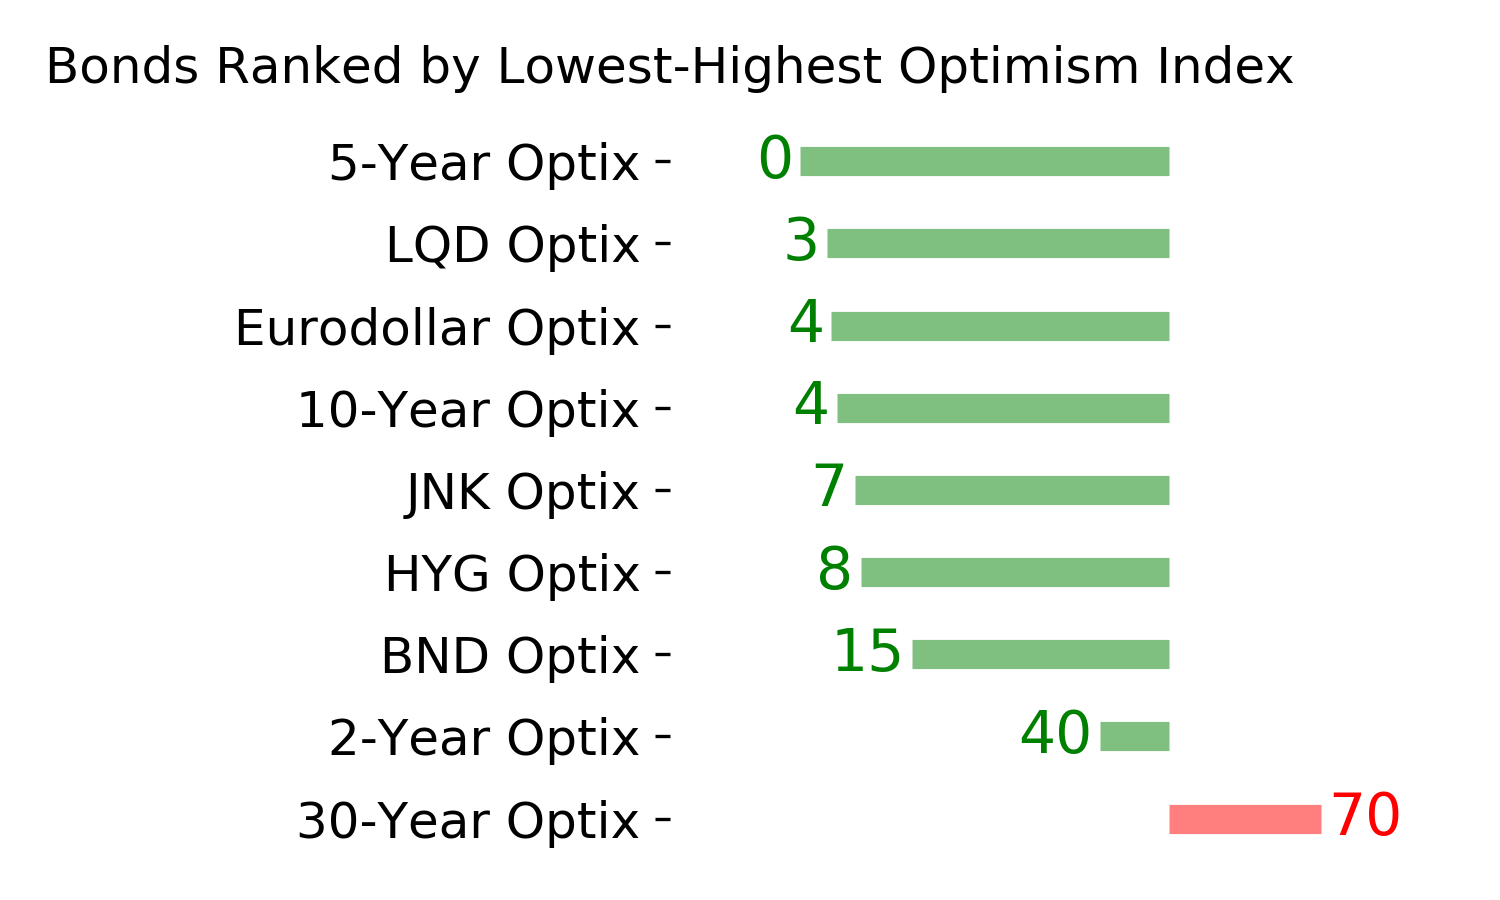
Ranks
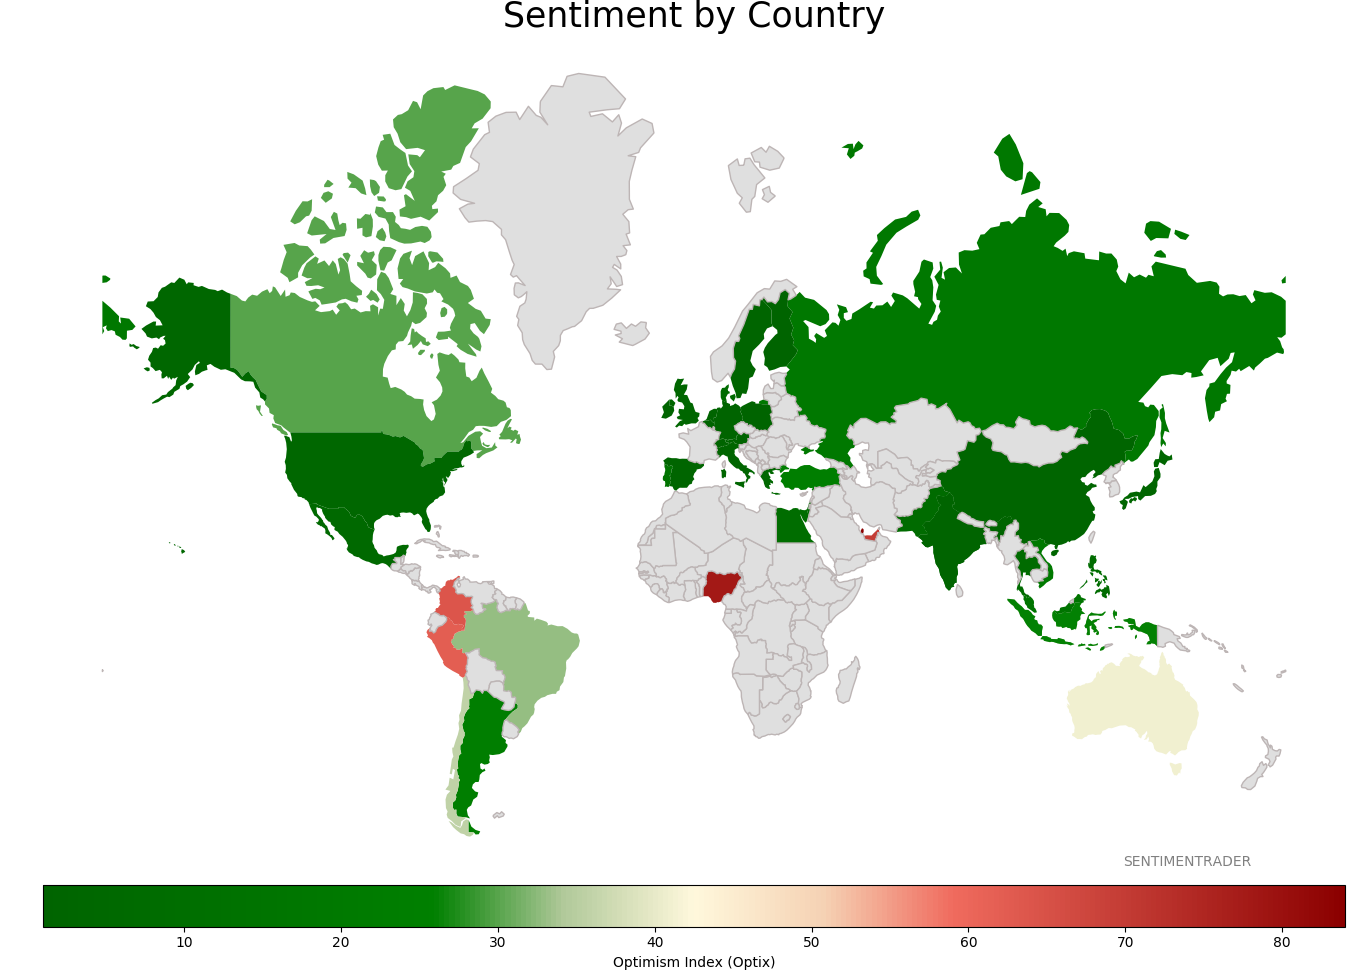
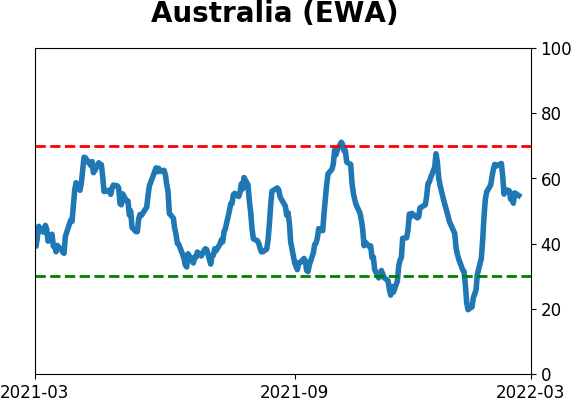
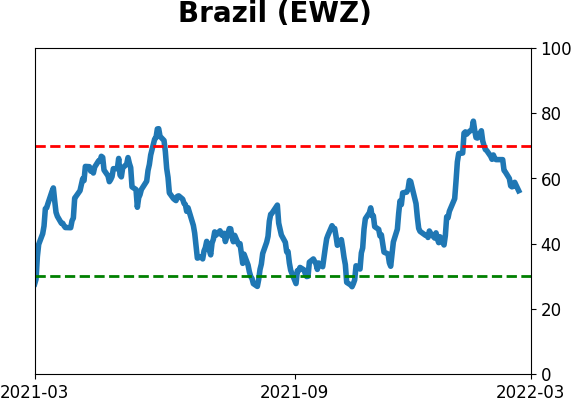
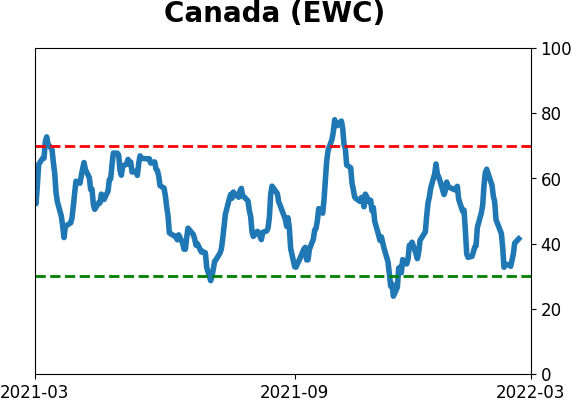
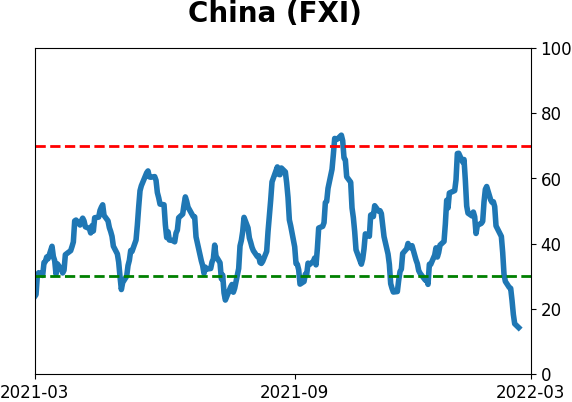
Sentiment Around The World
Optimism Index Thumbnails
|
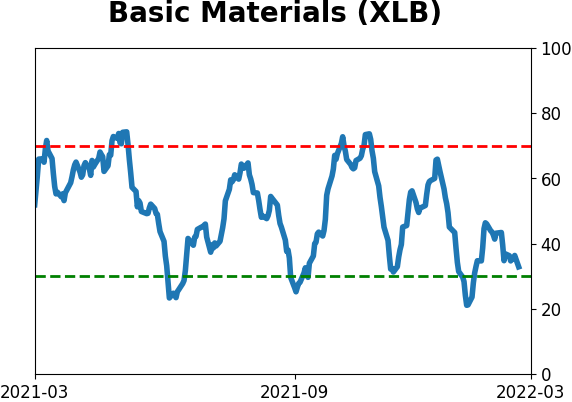
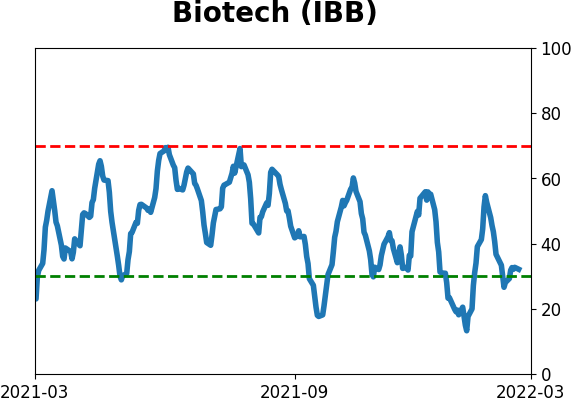
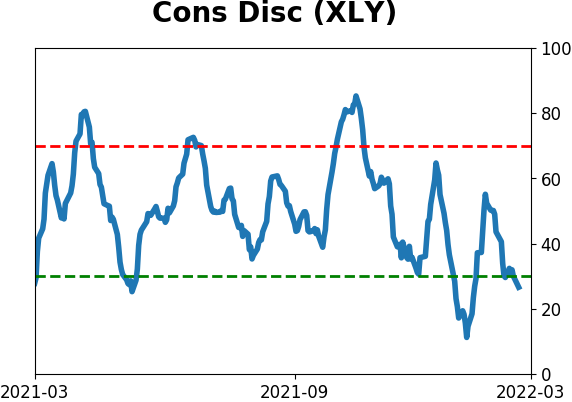
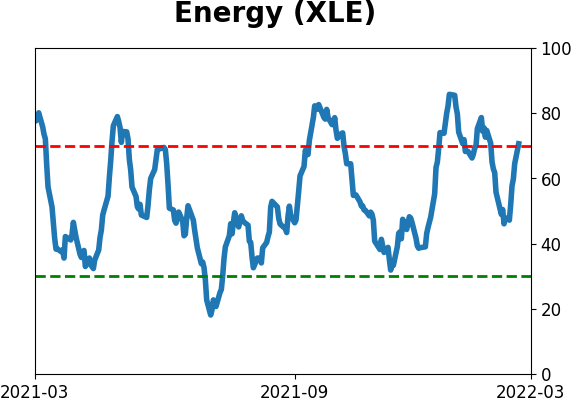
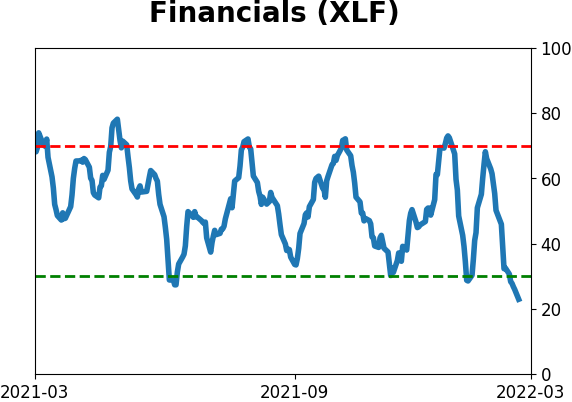
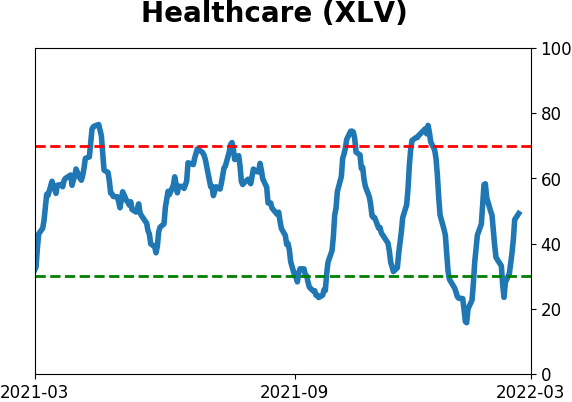
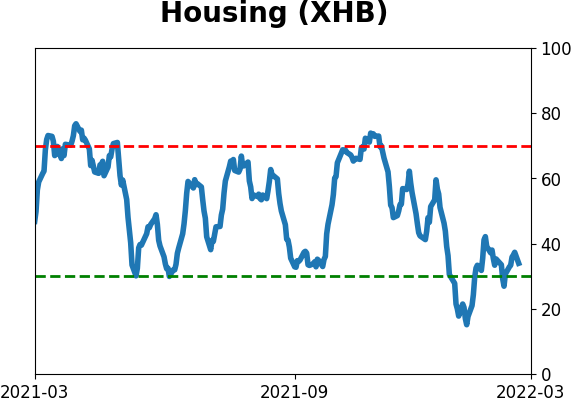
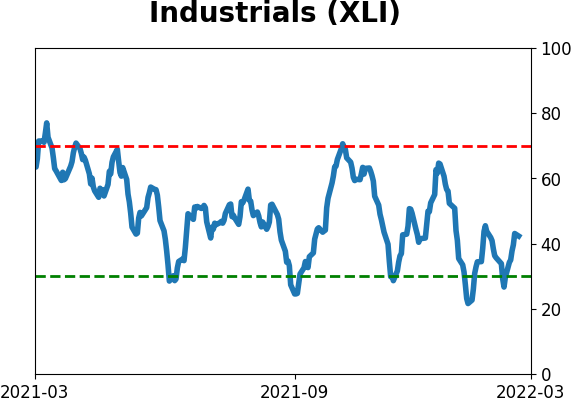
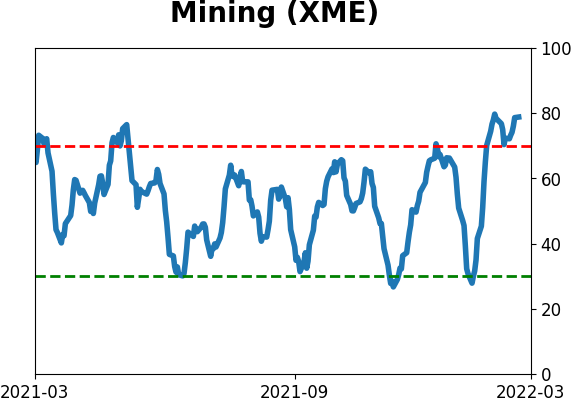
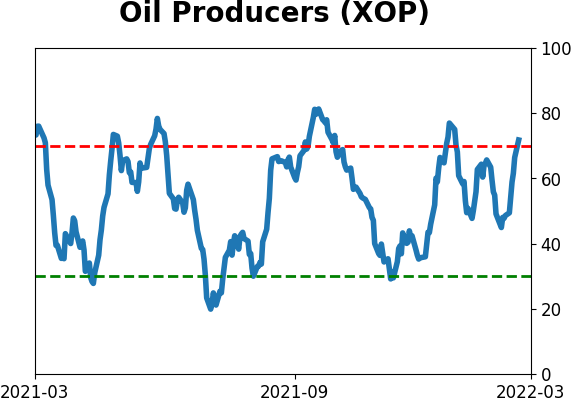
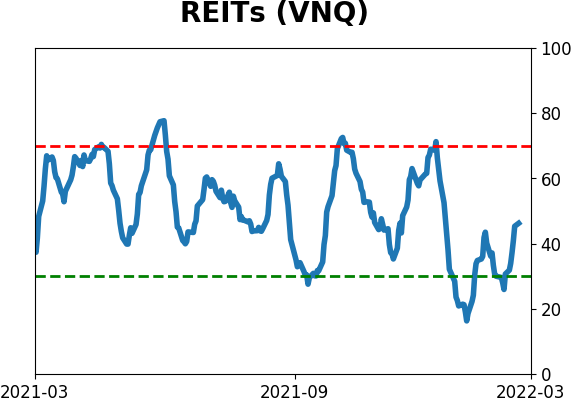
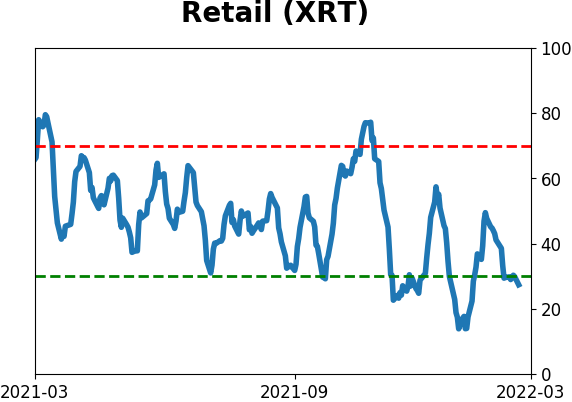
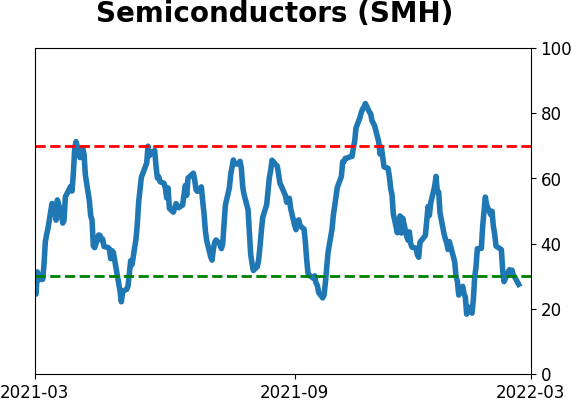
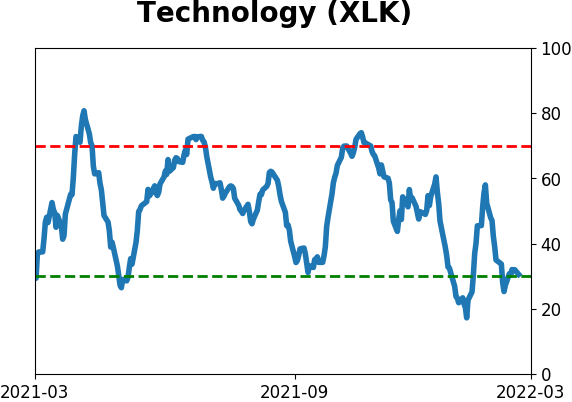
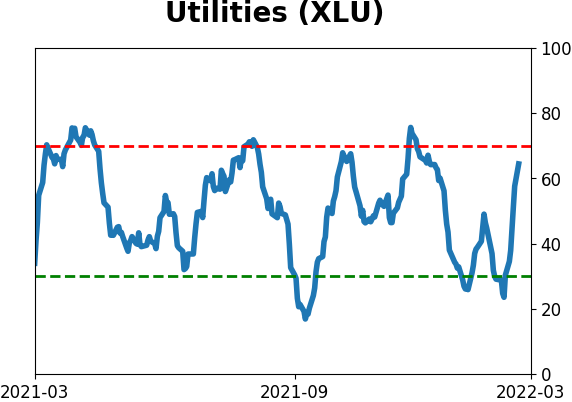
Sector ETF's - 10-Day Moving Average
|
|
|
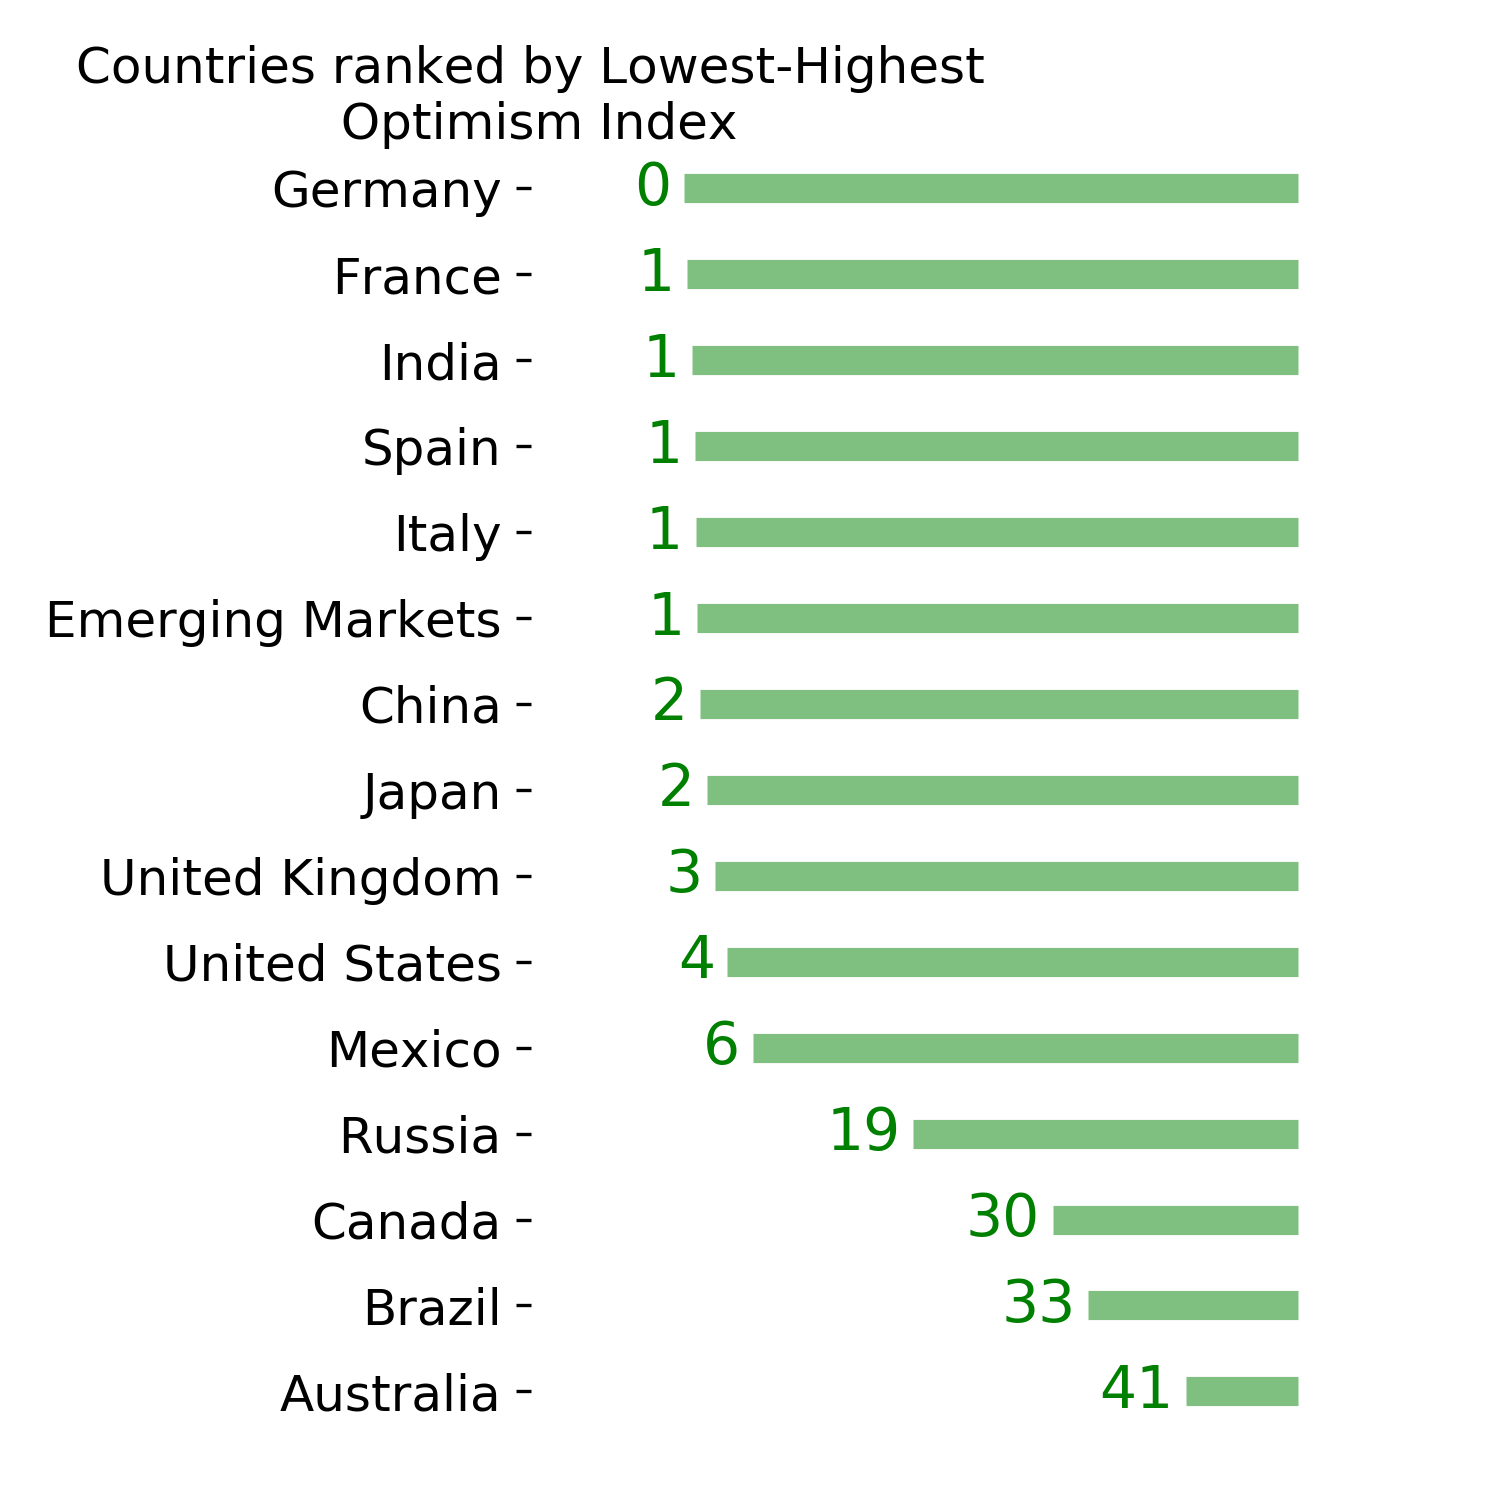
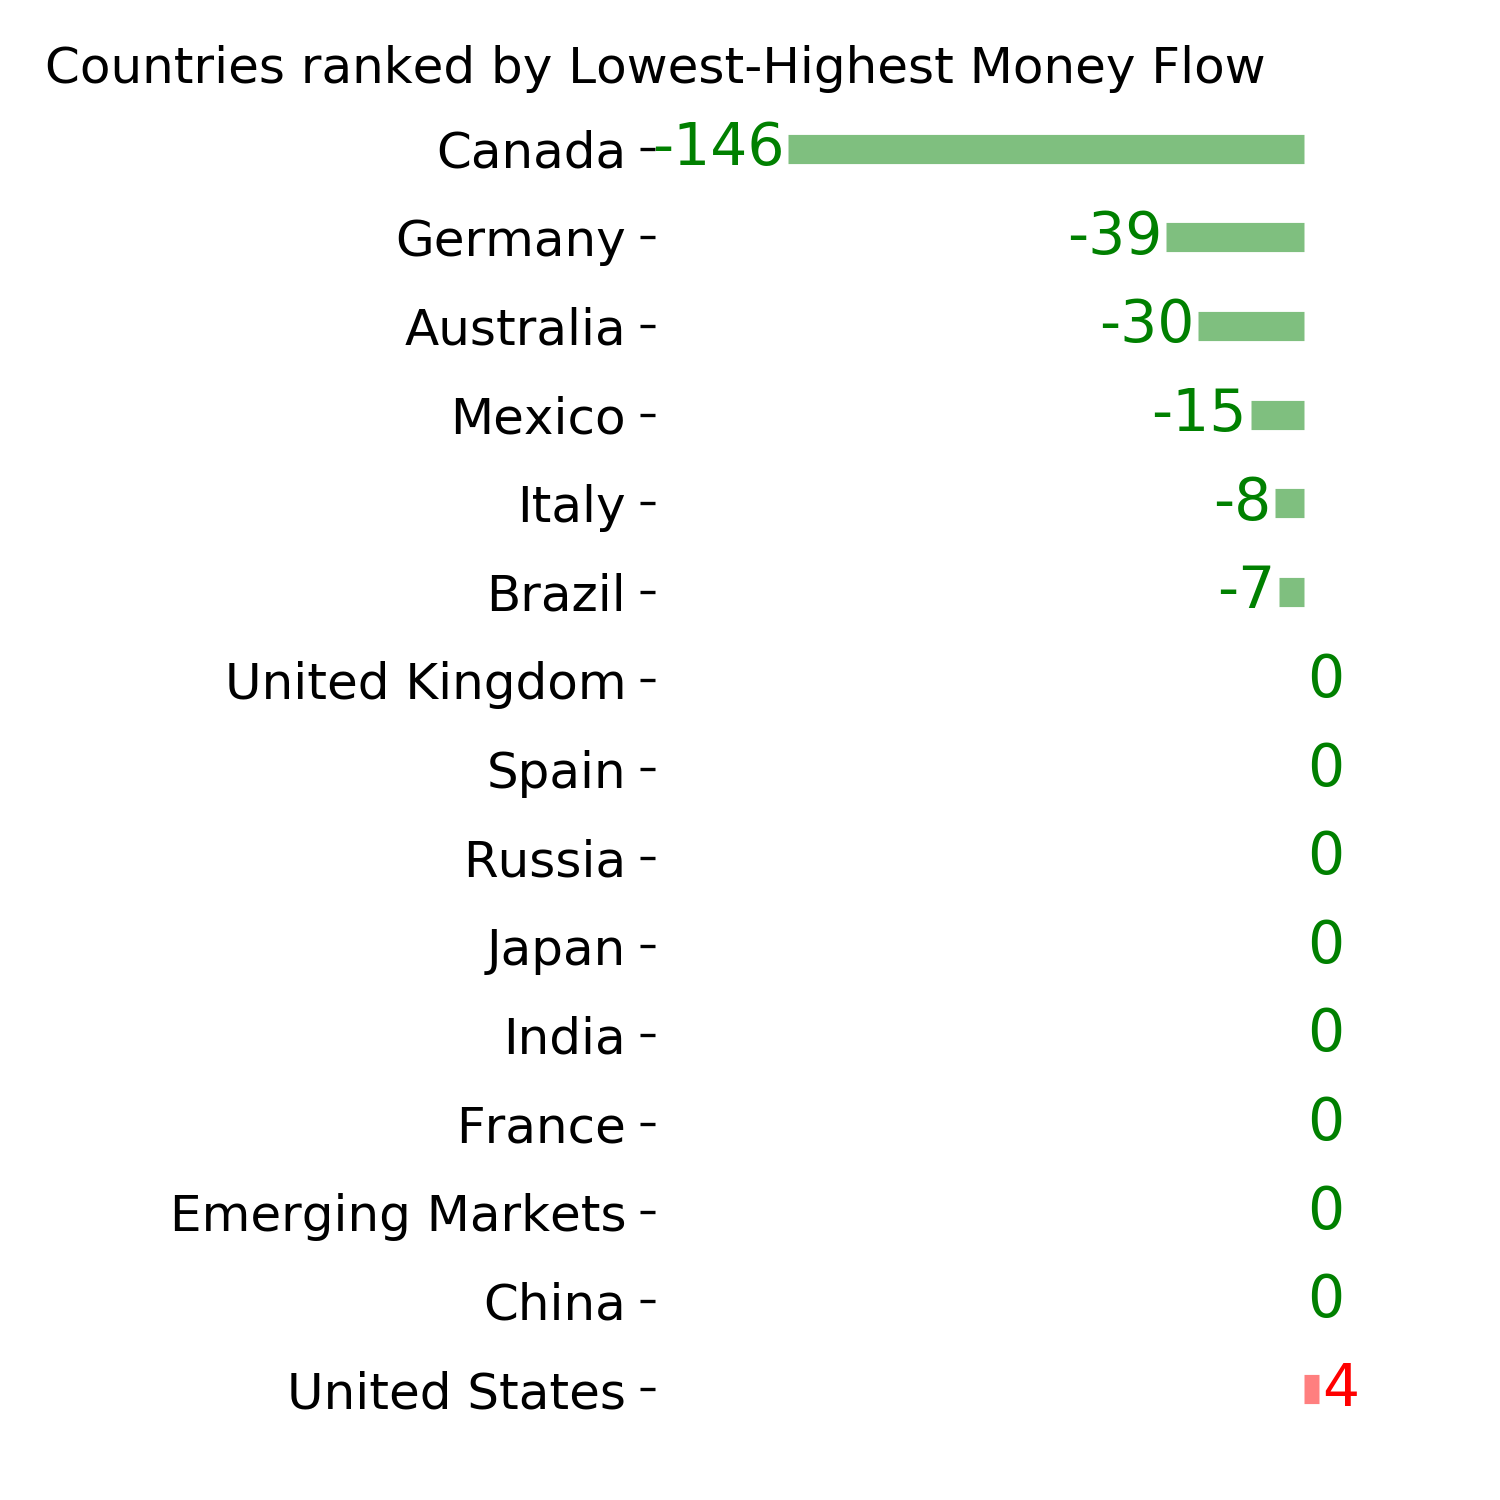
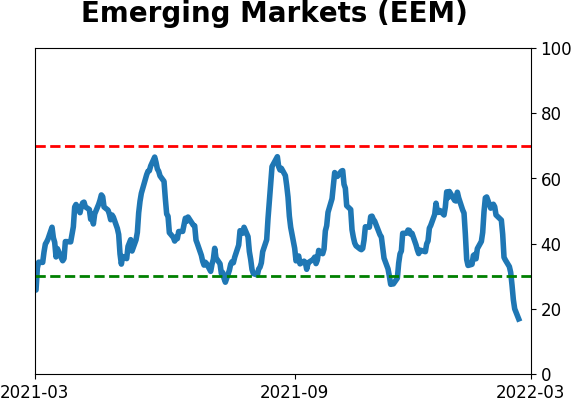
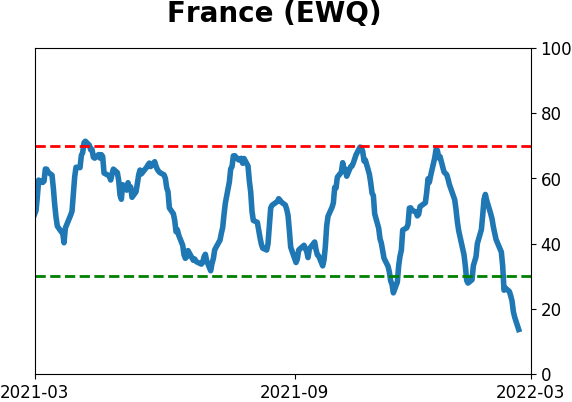
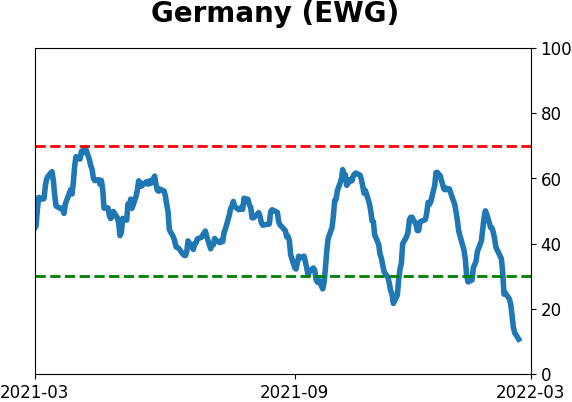
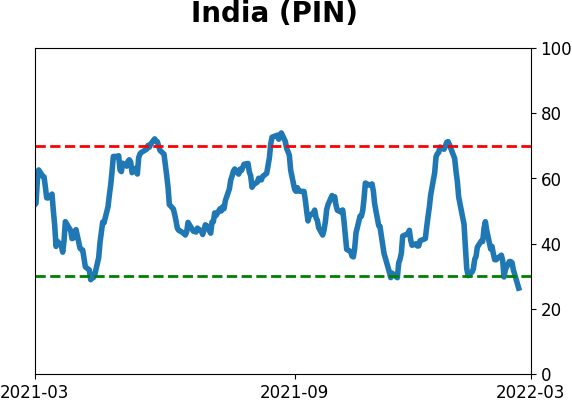
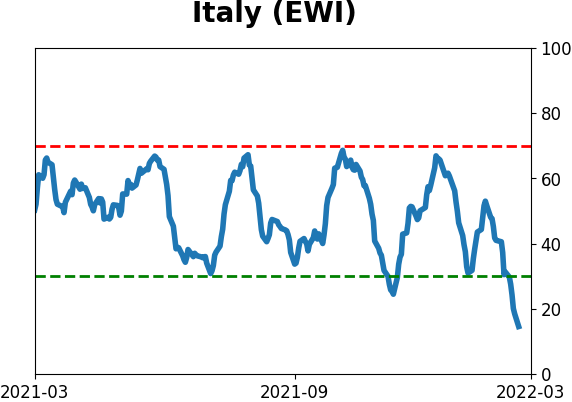
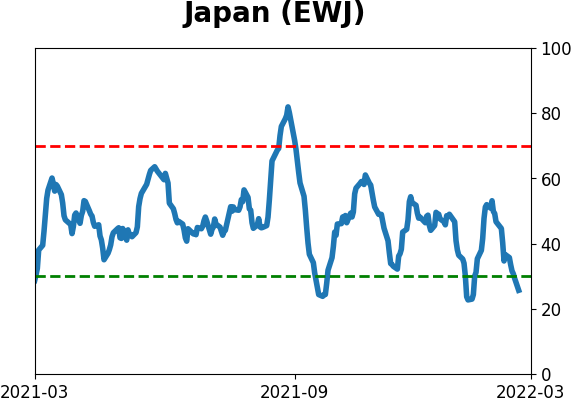
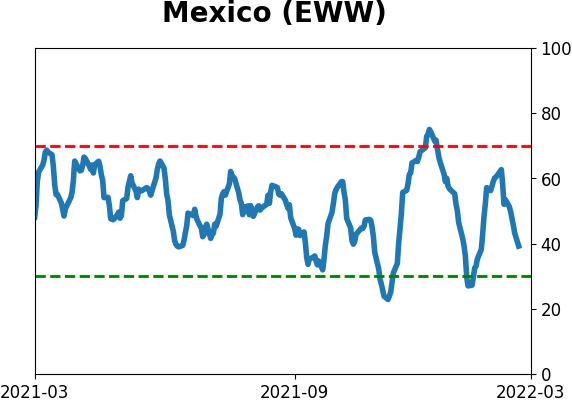
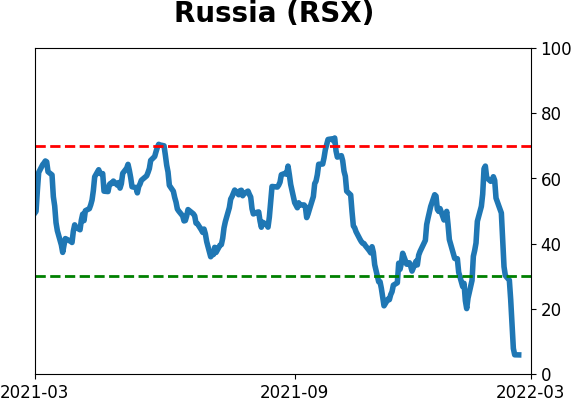
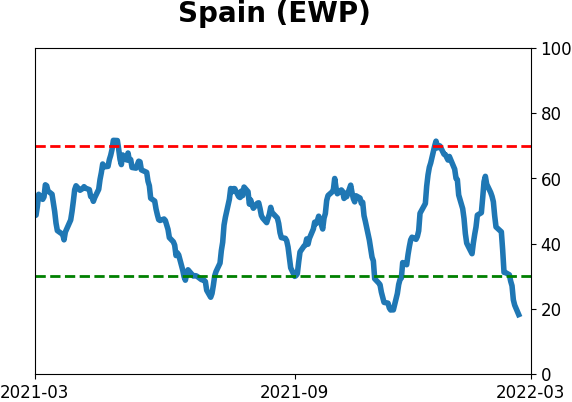
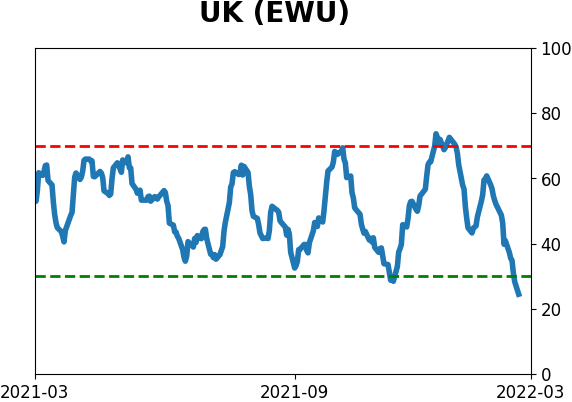
Country ETF's - 10-Day Moving Average
|
|
|
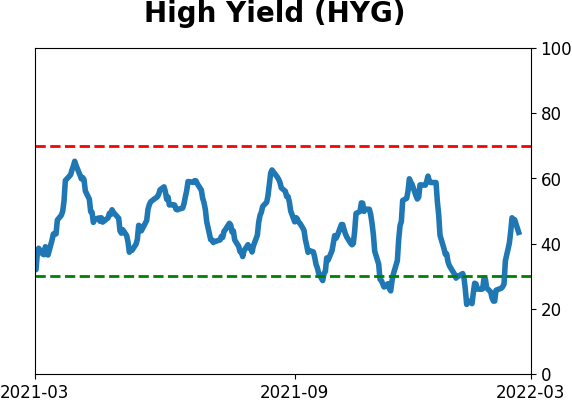
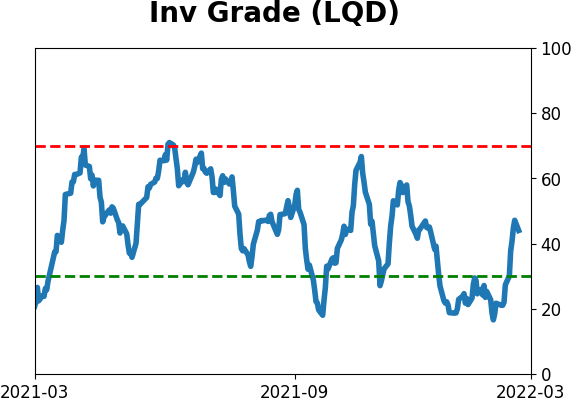
Bond ETF's - 10-Day Moving Average
|
|
|
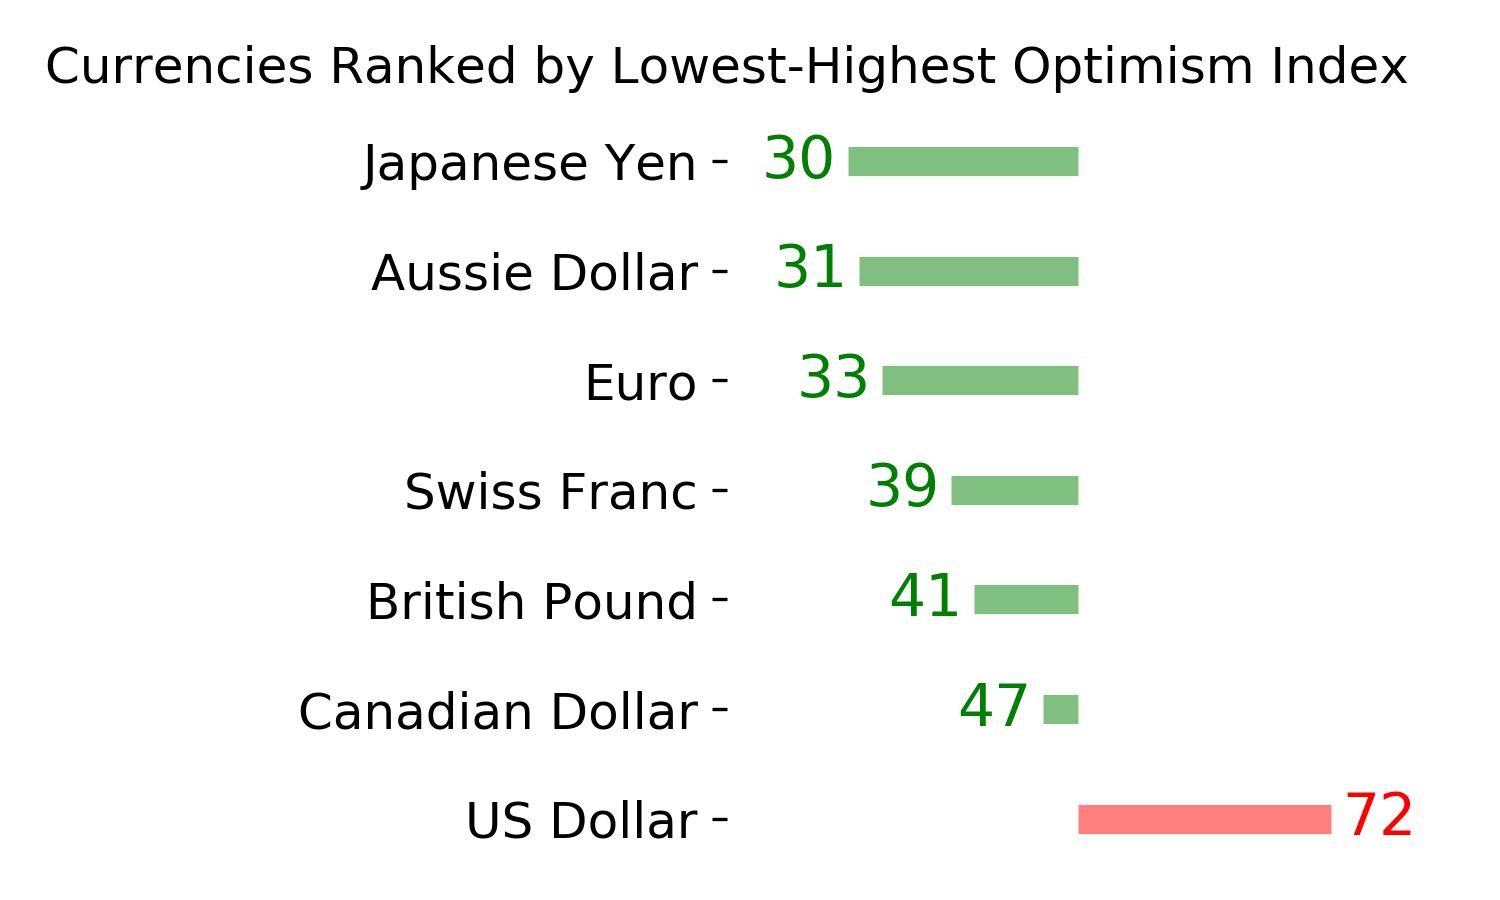
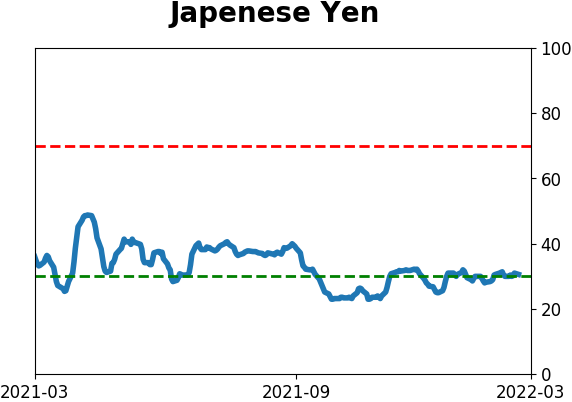
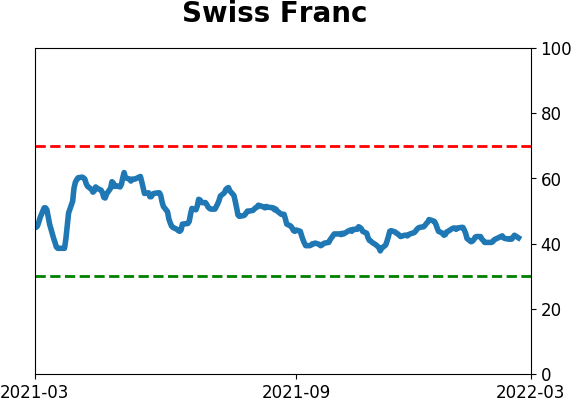
Currency ETF's - 5-Day Moving Average
|
|
|
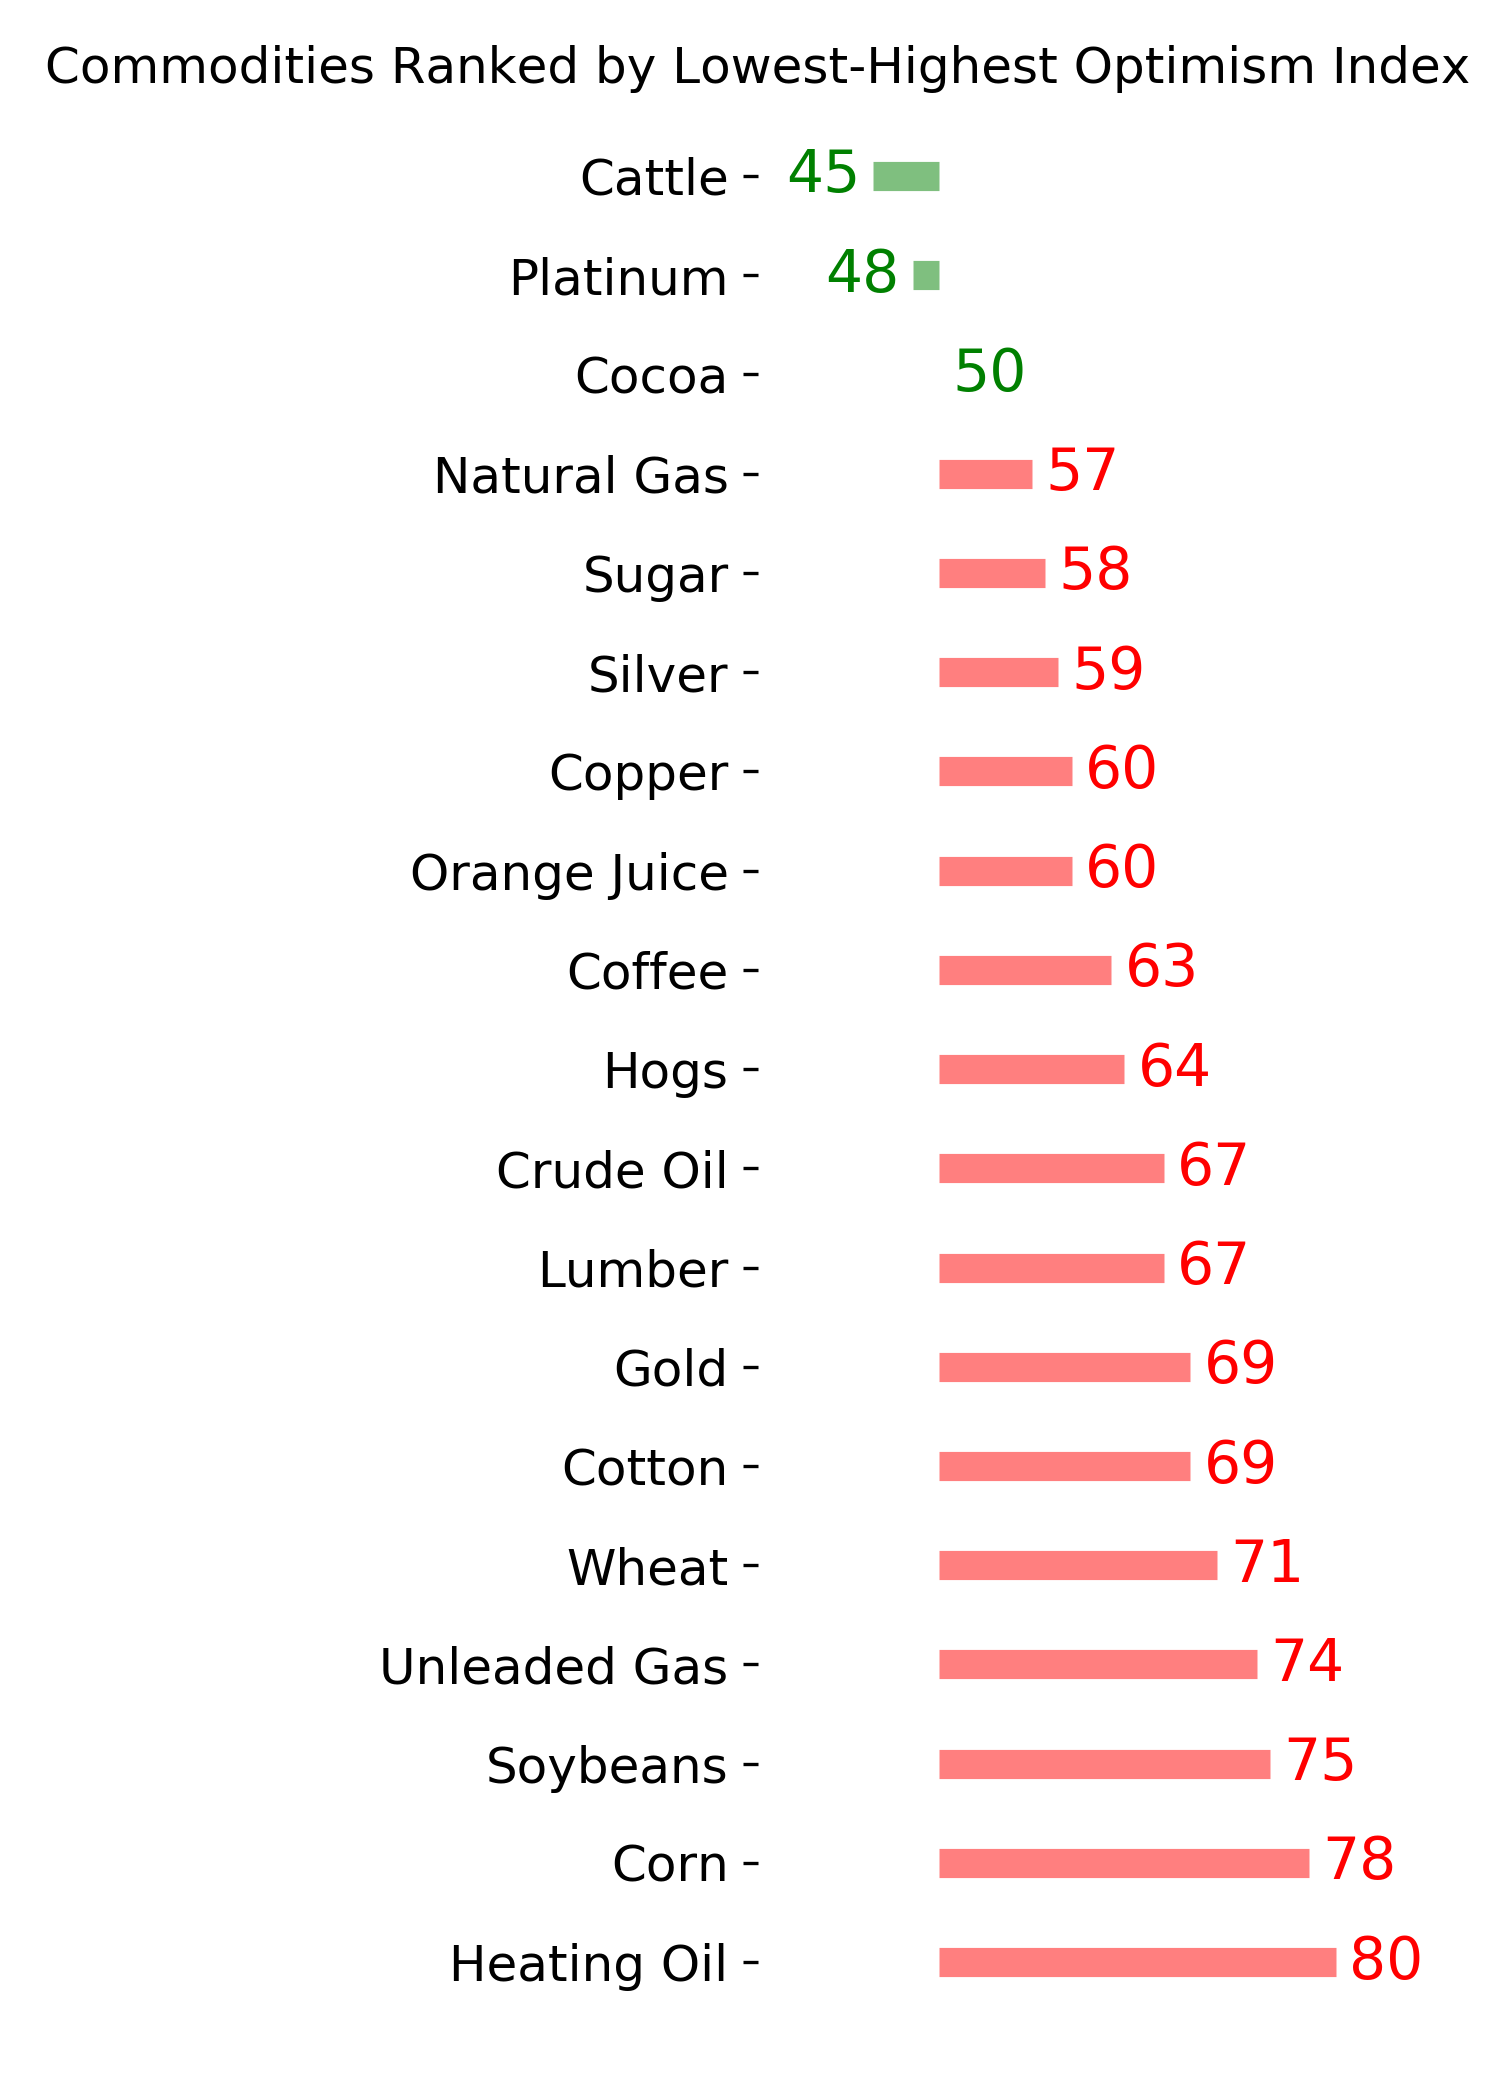
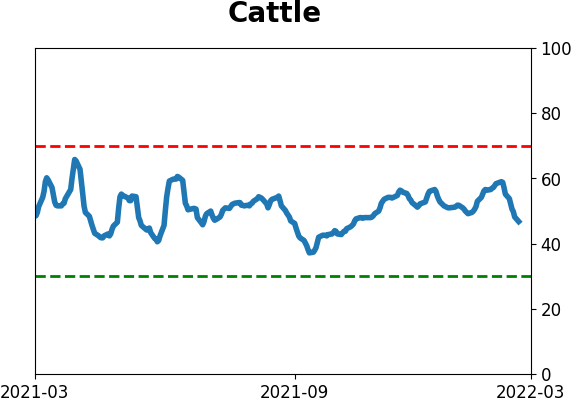
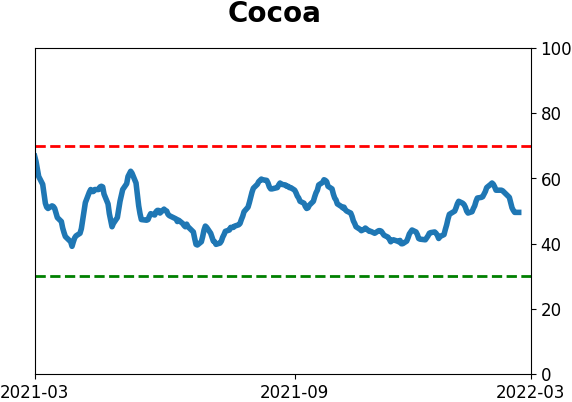
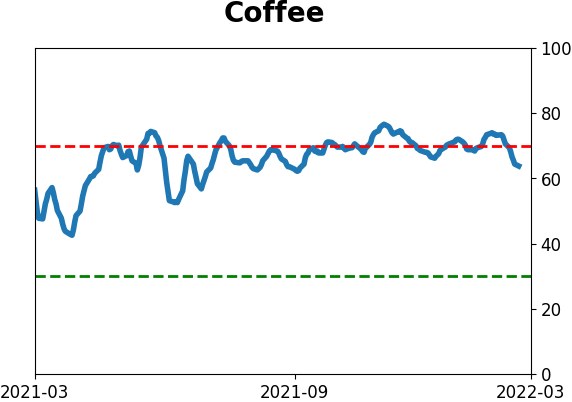
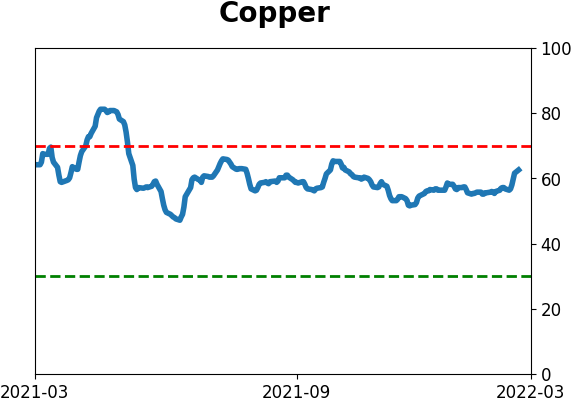
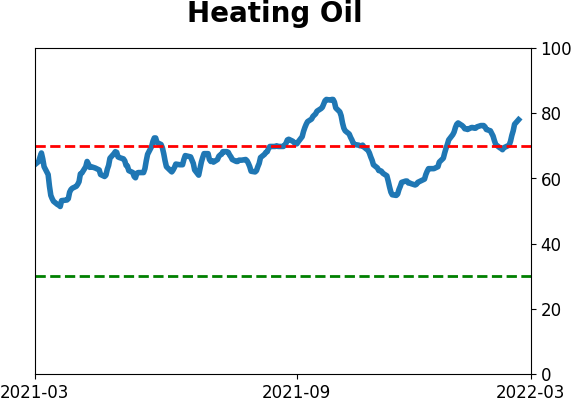
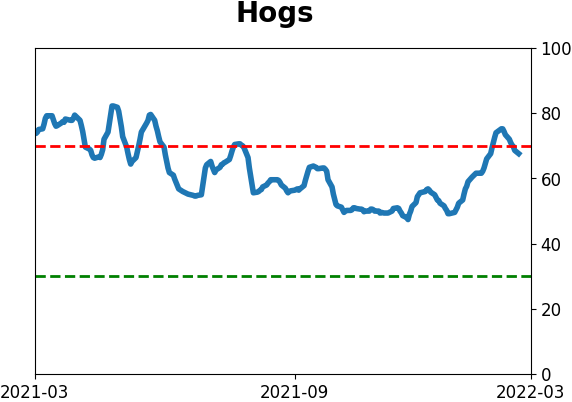
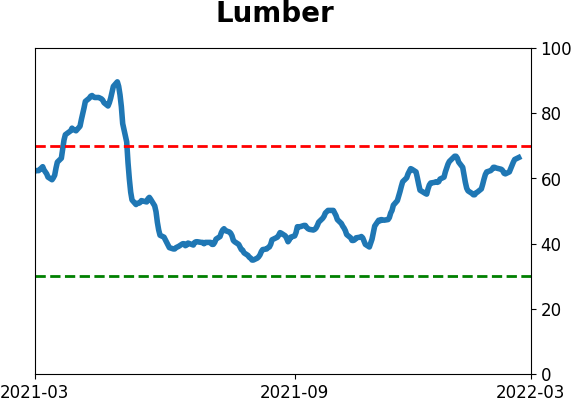
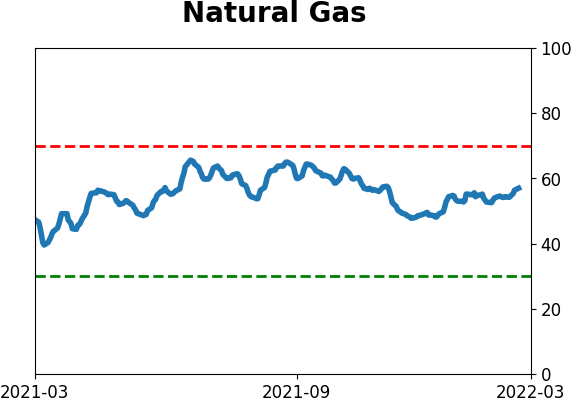
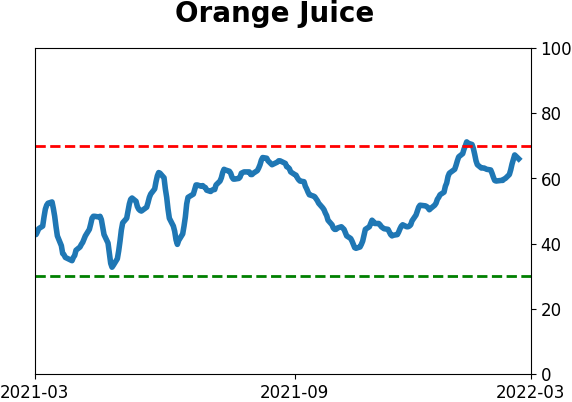
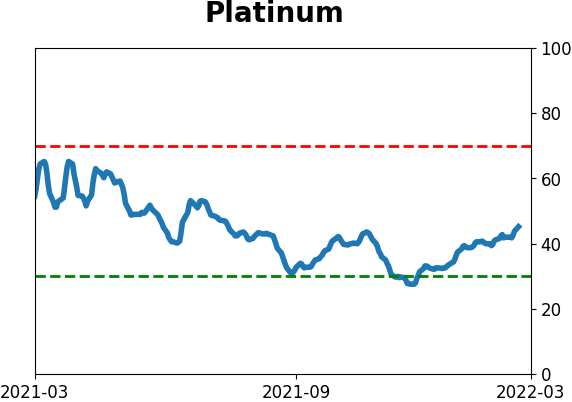
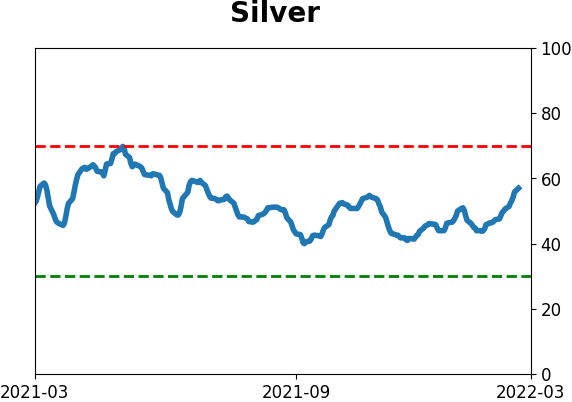
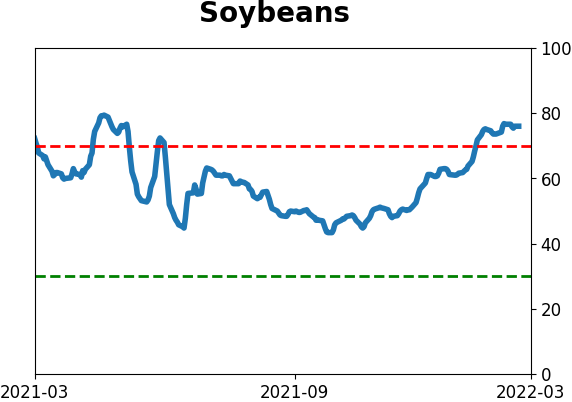
Commodity ETF's - 5-Day Moving Average
|
|