Headlines
|
|
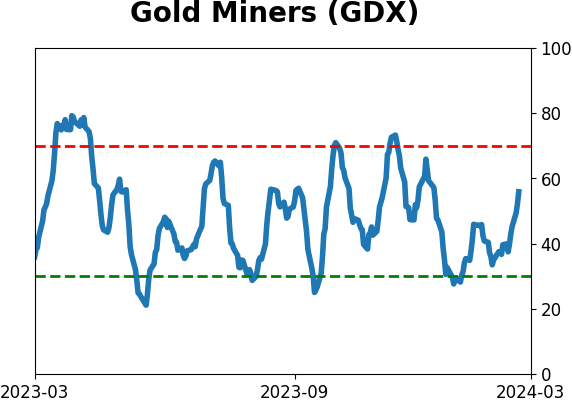
Gold mining stocks are showing nascent signs of longer-term recovery:
Gold mining stocks are loved by their faithful but pretty much ignored by everyone else. They've suffered years of selling pressure, which has triggered some compelling extremes. The percentage of those stocks with persistent long-term uptrends has spiked higher, a signal that has tended to lead to further rallies.
|
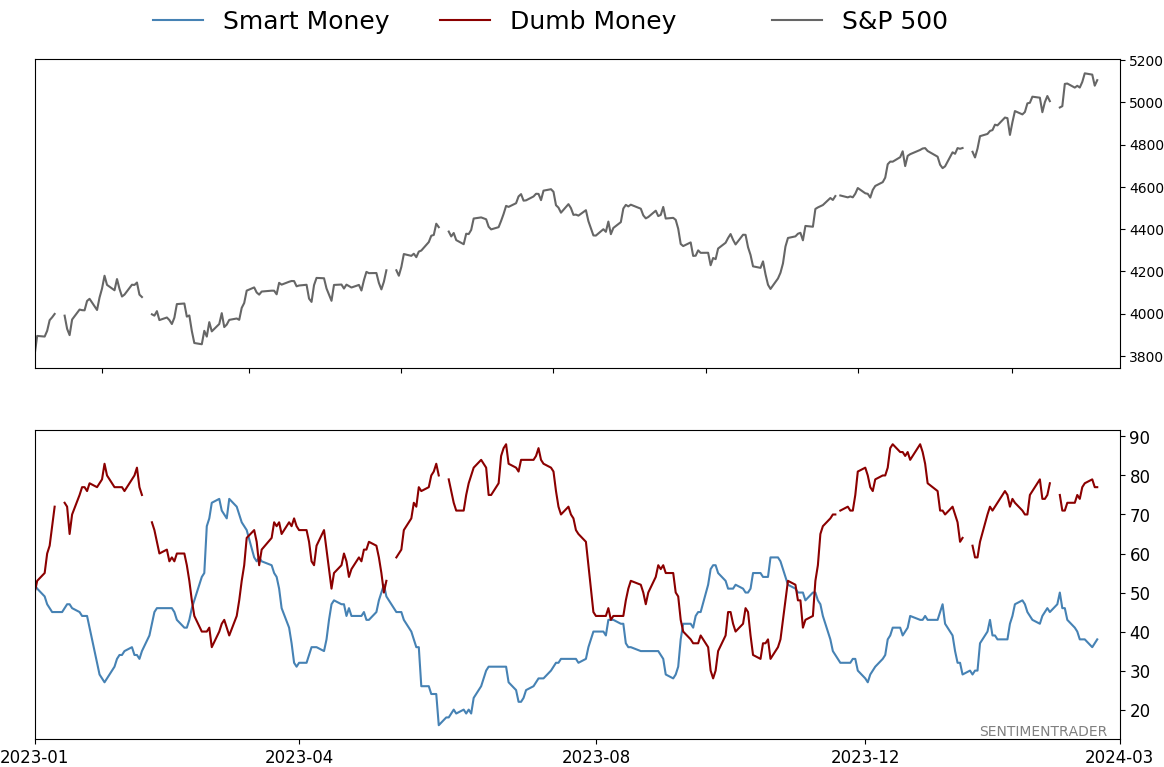
Smart / Dumb Money Confidence
|
Smart Money Confidence: 38%
Dumb Money Confidence: 77%
|
|
Risk Levels
Stocks Short-Term
|
Stocks Medium-Term
|
|
Bonds
|
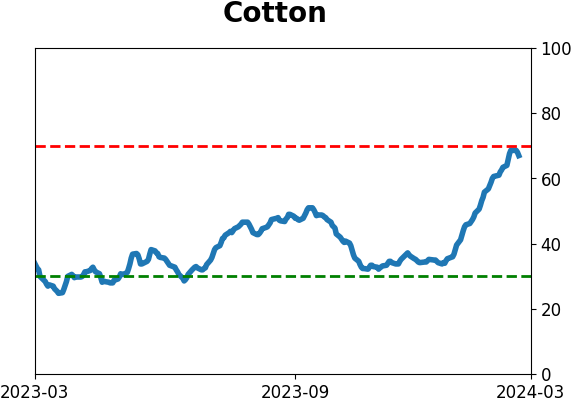
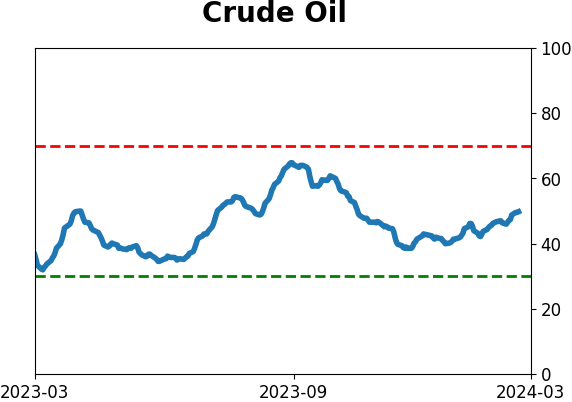
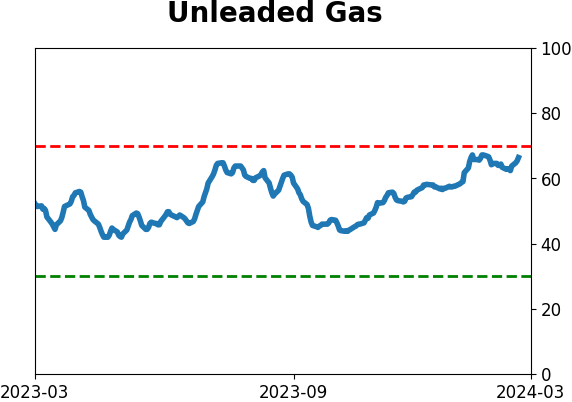
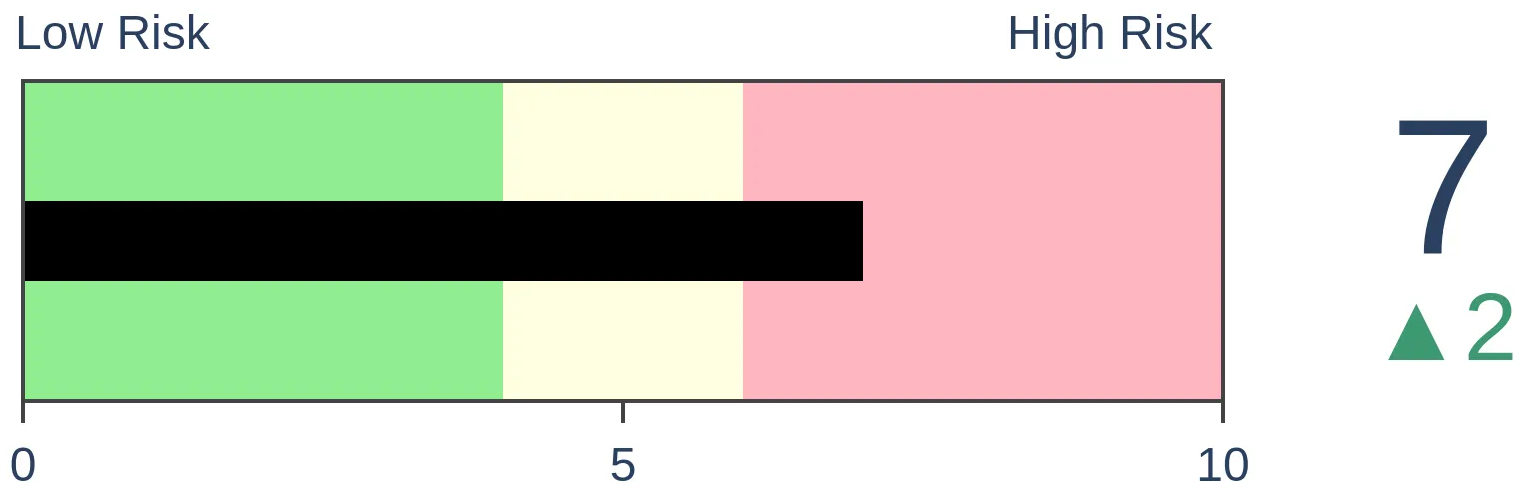
Crude Oil
|
|
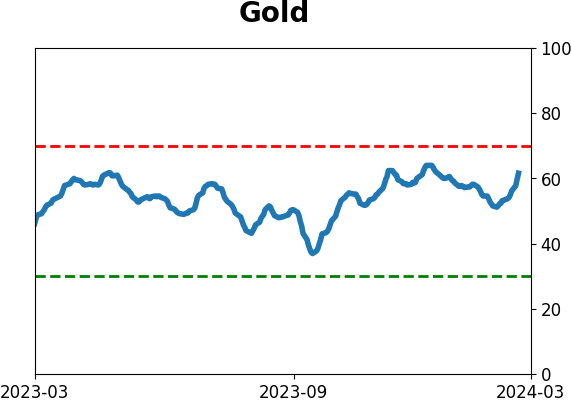
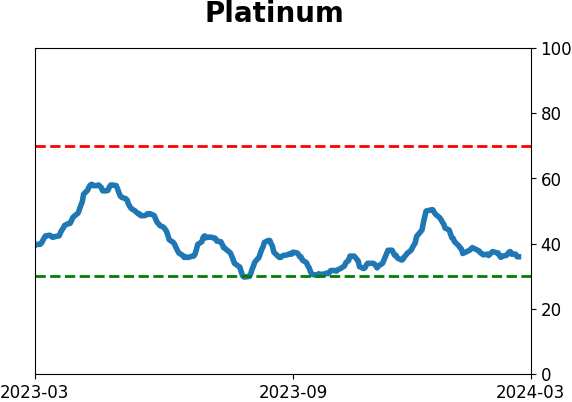
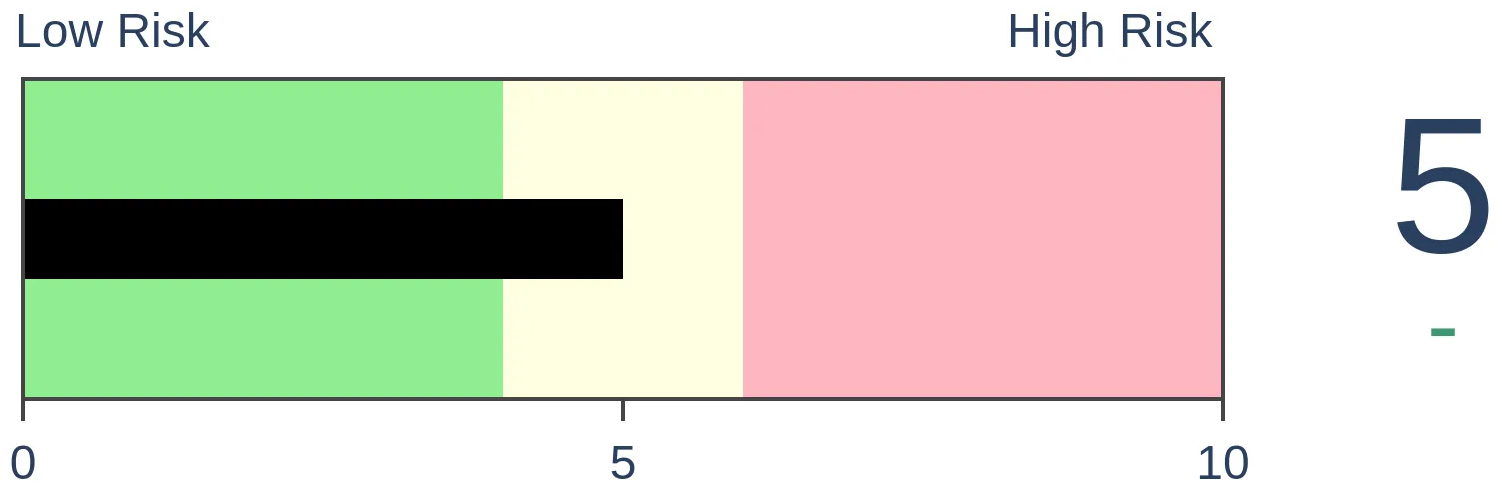
Gold

|
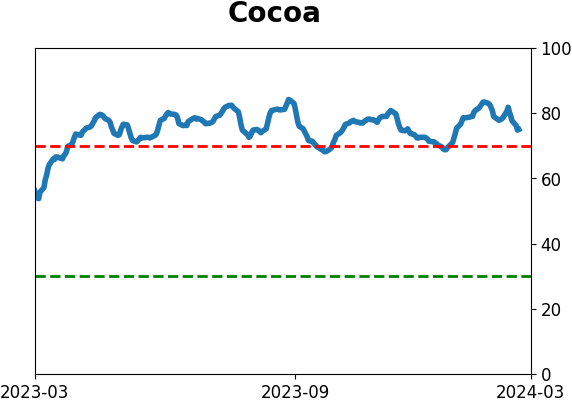
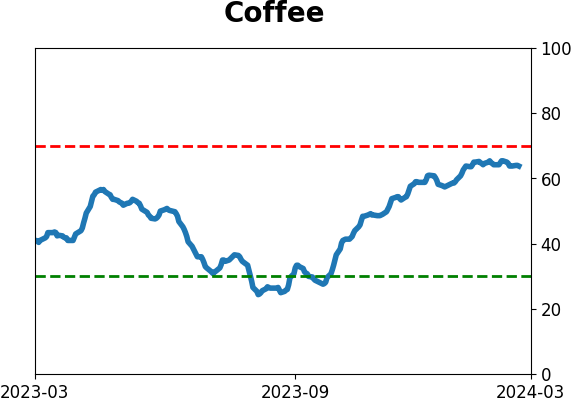
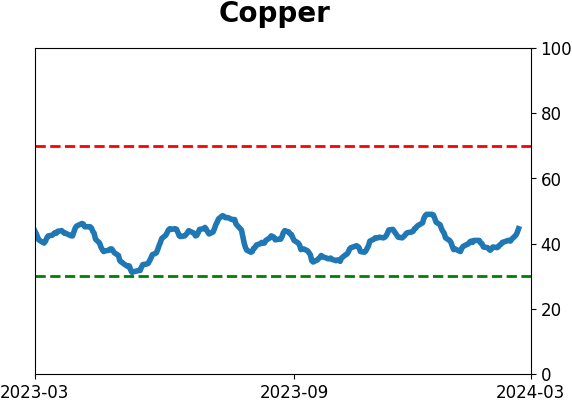
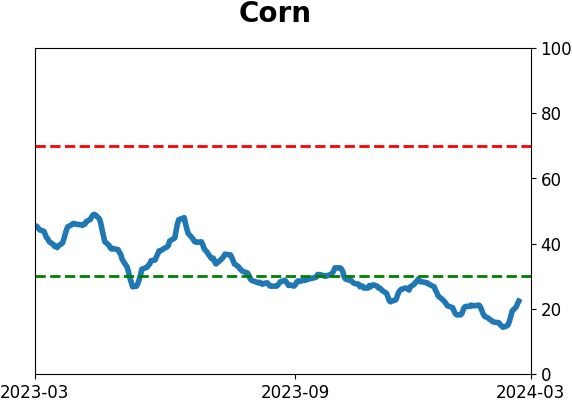
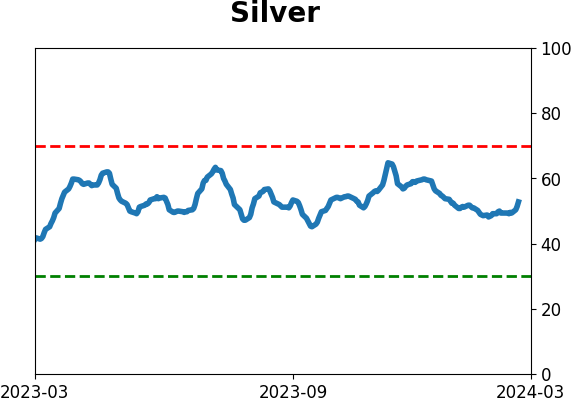
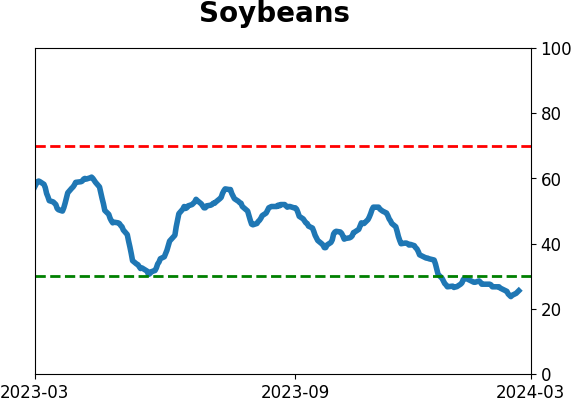
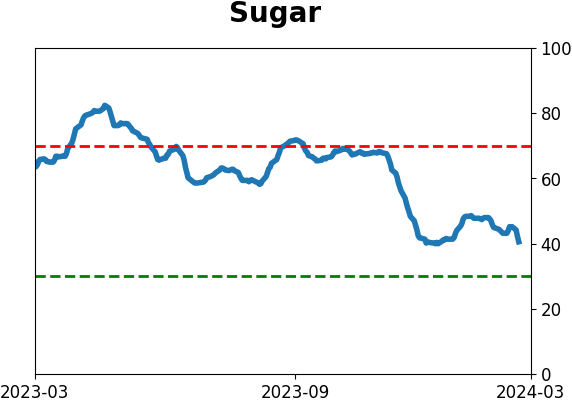
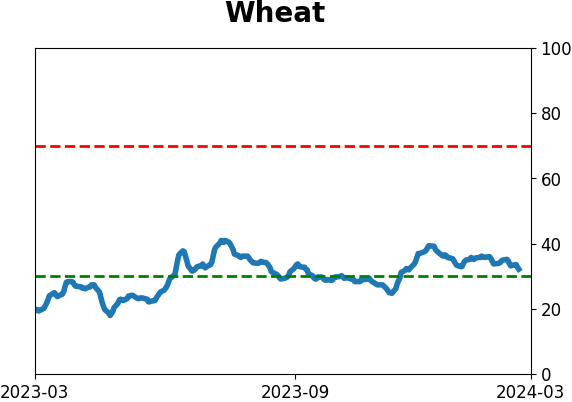
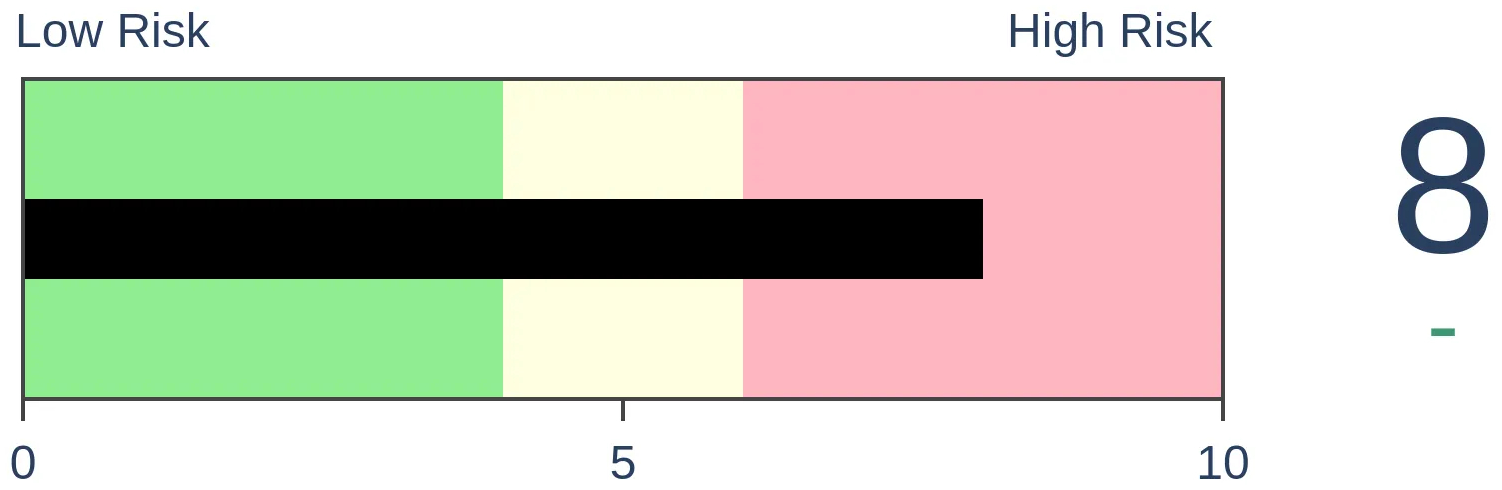
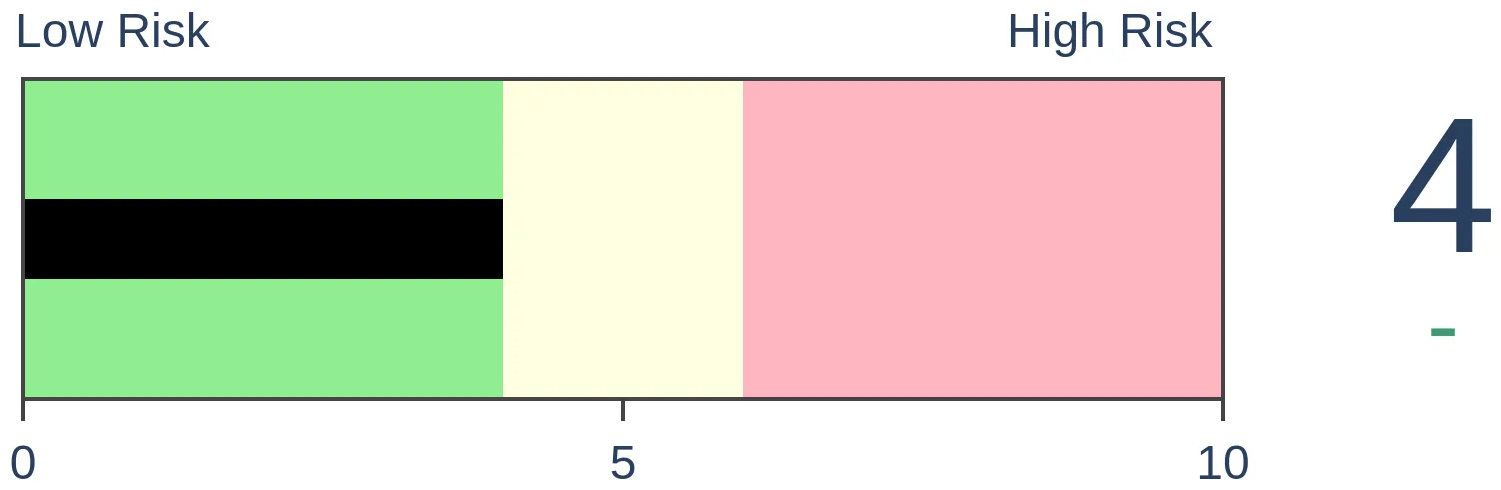
Agriculture

|
|
Research
By Jason Goepfert
BOTTOM LINE
Gold mining stocks are loved by their faithful but pretty much ignored by everyone else. They've suffered years of selling pressure, which has triggered some compelling extremes. The percentage of those stocks with persistent long-term uptrends has spiked higher, a signal that has tended to lead to further rallies.
FORECAST / TIMEFRAME
None
|
Key points:
- The percentage of gold mining stocks with persistent long-term uptrends has jumped from a low level
- Over the past 30 years, similar behavior preceded medium-term rallies almost every time
- Other signs suggest that the stocks have suffered a historic amount of selling pressure
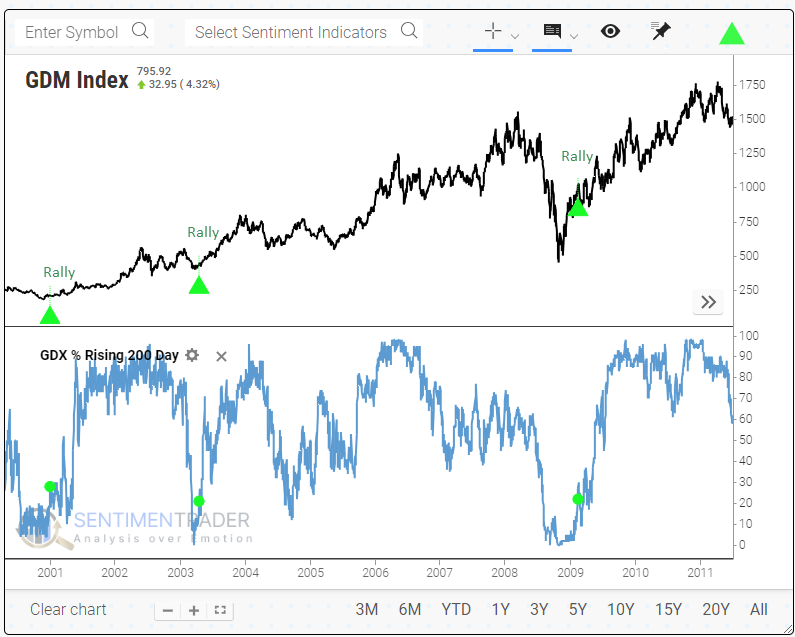
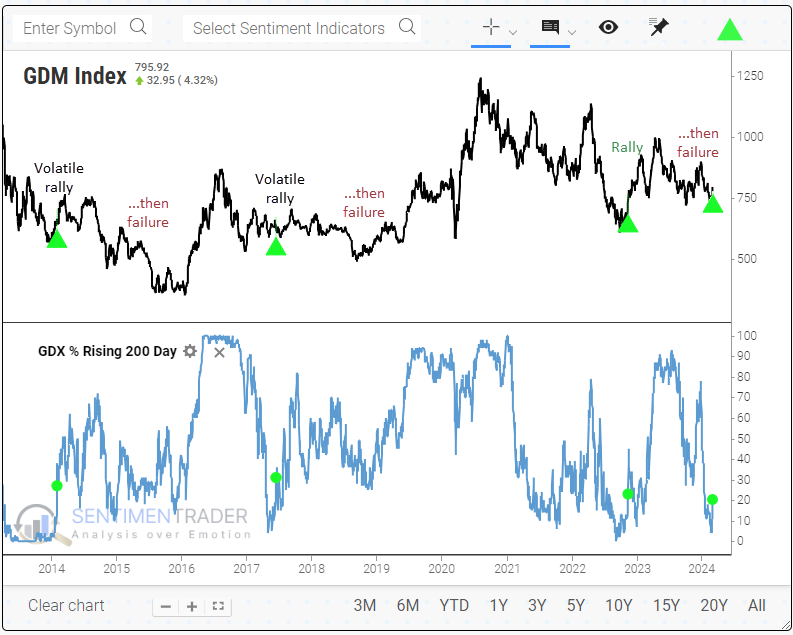
More gold stocks are showing long-term persistent uptrends
Several times in recent years, we've discussed the idea that two markets, in particular, have a nasty habit of continually disappointing investors. Those would be Chinese equities and gold miners.
Both sectors have a demonstrated history of failing just at the point when most other markets would be overtaken by upside momentum. That makes the current juncture for miners interesting because the breakout in gold has given miners some life. They've jumped over the past couple of sessions, and breadth is rapidly improving.
The percentage of miners with a rising 200-day moving average - a long-term look at solid uptrends - has quickly cycled from fewer than 5% of mining stocks to more than 20%. The backtester shows that the other times the stocks cycled like this, miners showed gains over the next 2-3 months every time but once, in 1997, which was a complete and utter failure.
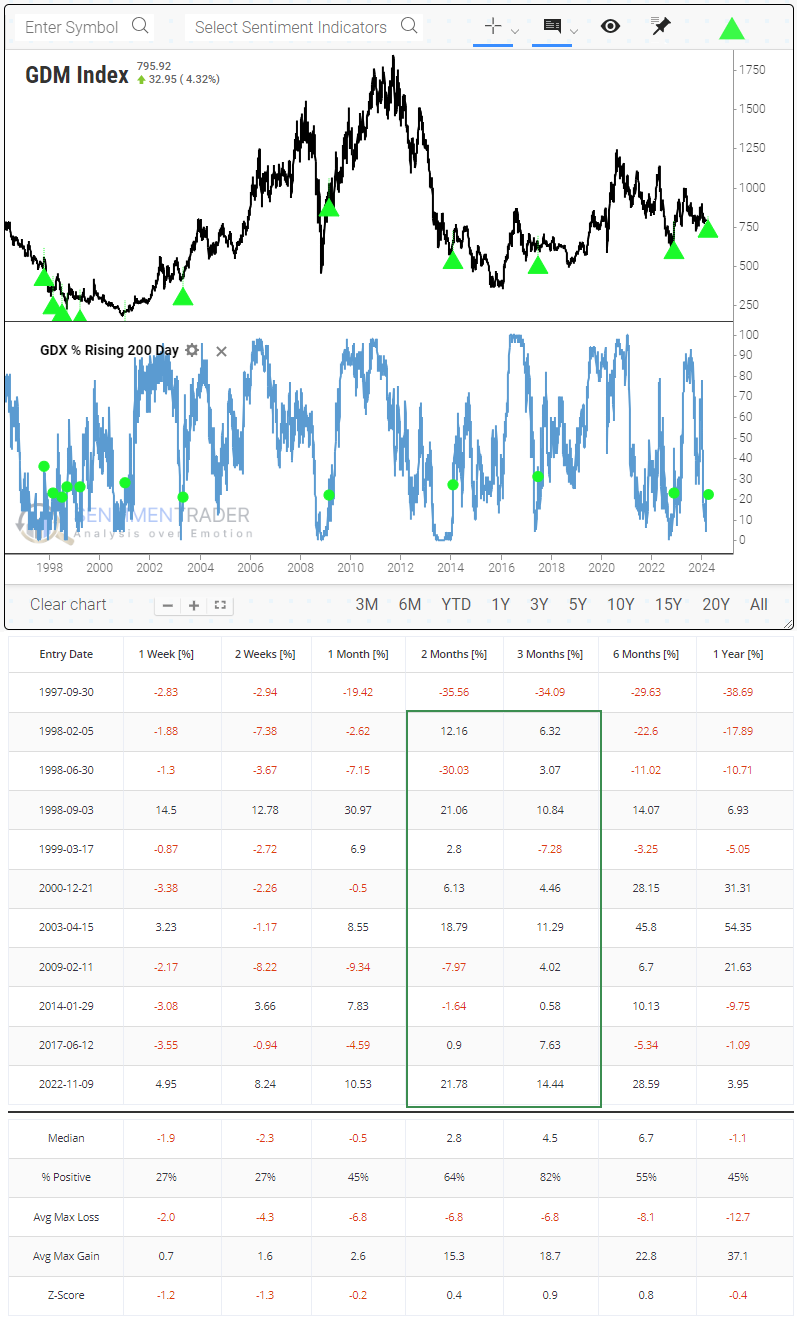
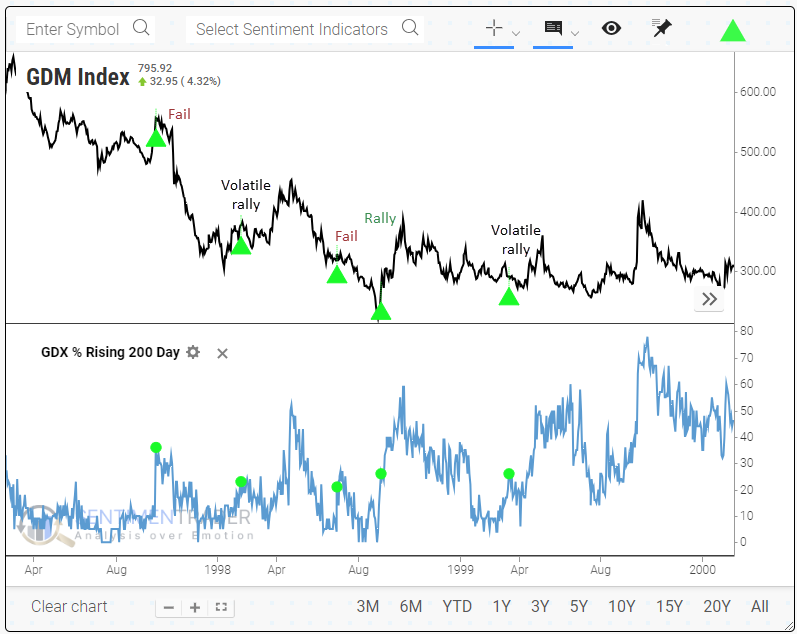
There were three distinct periods when gold stocks cycled like they have recently. The first was in the late 1990s. Only one of those signals preceded uninterrupted losses - the others either failed or led to hard-to-stomach volatile rallies over several months.
During the 2000s, these cycles were excellent signs that the worst of the selling pressure was over. All three signals ended bear markets and preceded stunning gains in the year(s) ahead.
The most recent decade has been a mixed bag. While all three signals preceded gains over the next several months, only one was convincing, and each of them ended up failing long-term.
More signs of a long-term washout
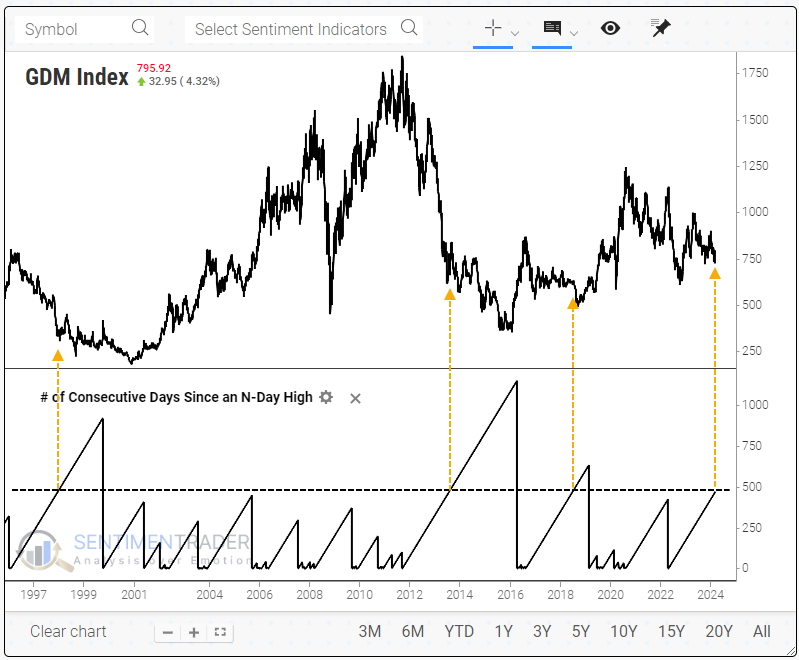
Gold stocks are also nearing 500 days since they last set a 52-week high. One of the new technical indicators added to Backtest Engine 2.0 allows a user to show how many days it's been since a stock, index, or ETF reached a user-defined high or low.
The three other times miners went this long since a new high, they started to form long-term bottoms, but it was a drawn-out, messy process.
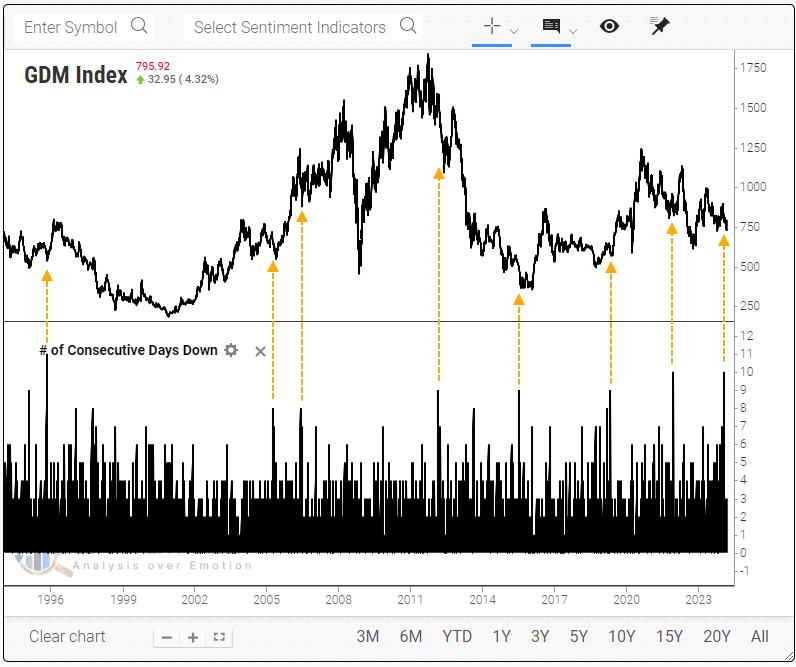
The problem has been an absolute lack of buying interest, excluding the past few days. Recently, the sector suffered a streak of 10 consecutive down days for only the third time in 30 years. The others preceded short- to medium-term rebounds, while slightly lesser streaks tended to occur near longer-term turning points.
What the research tells us...
Every time we discuss gold mining stocks, this disclaimer is required: they have a remarkable ability to disappoint, especially after a rally. The faithful always believe this time is different, and about once a decade, it actually is. So far, there is no sign this is one of those times, so faith is required, and any long-term investor will just about faint at the suggestion of faith as a strategy.
Investors simply don't care about a dirty industry like mining at the moment, though that could change at any moment if the hot new things (AI, crypto) start to trigger losses. The activity over the past few days suggests that could be the case, but we'll just have to see. On a short-term basis, there isn't much we follow that points to a positive expectation for gold mining stocks. Longer-term, they've been hated long enough and hard enough that faith could turn into actual profits.
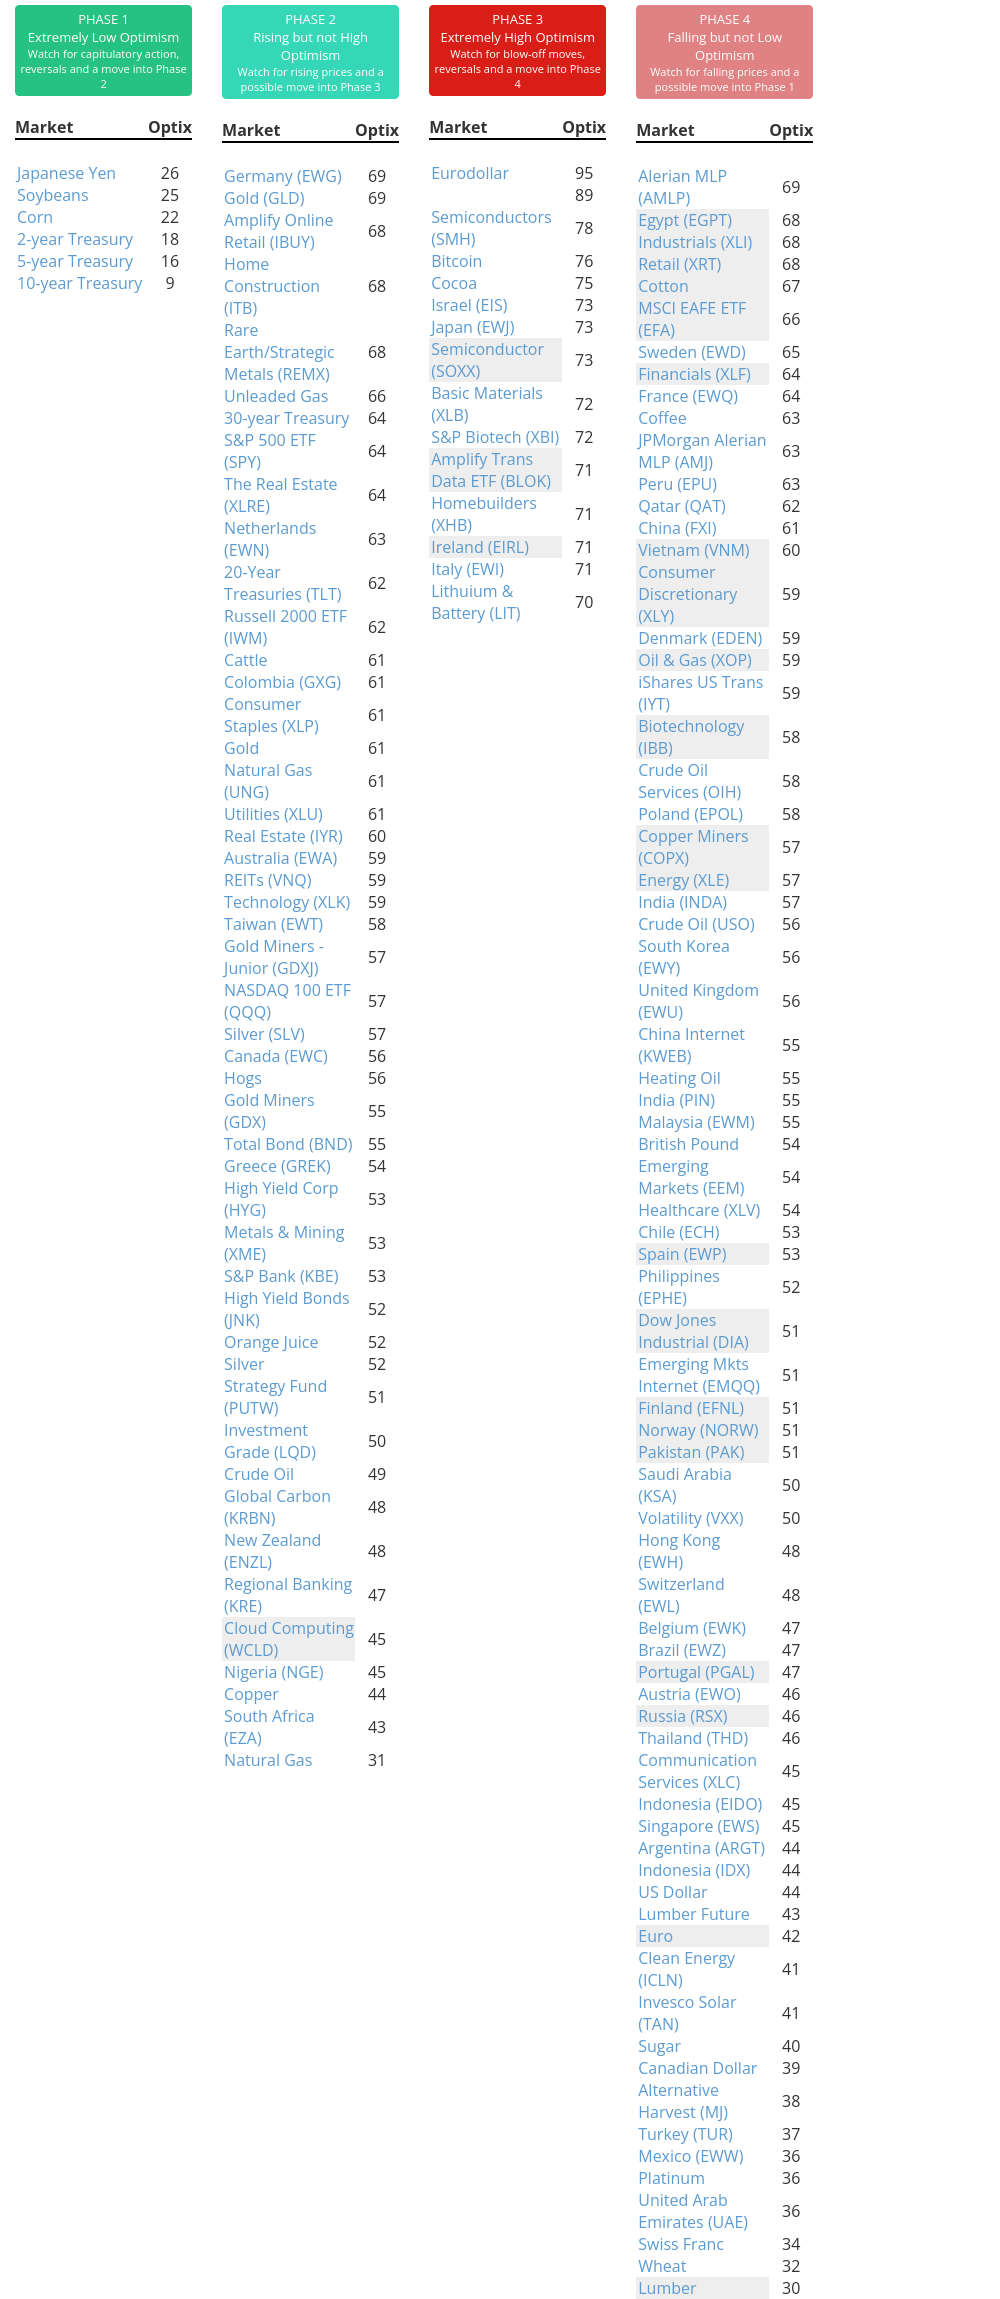
Indicators at Extremes
Phase Table
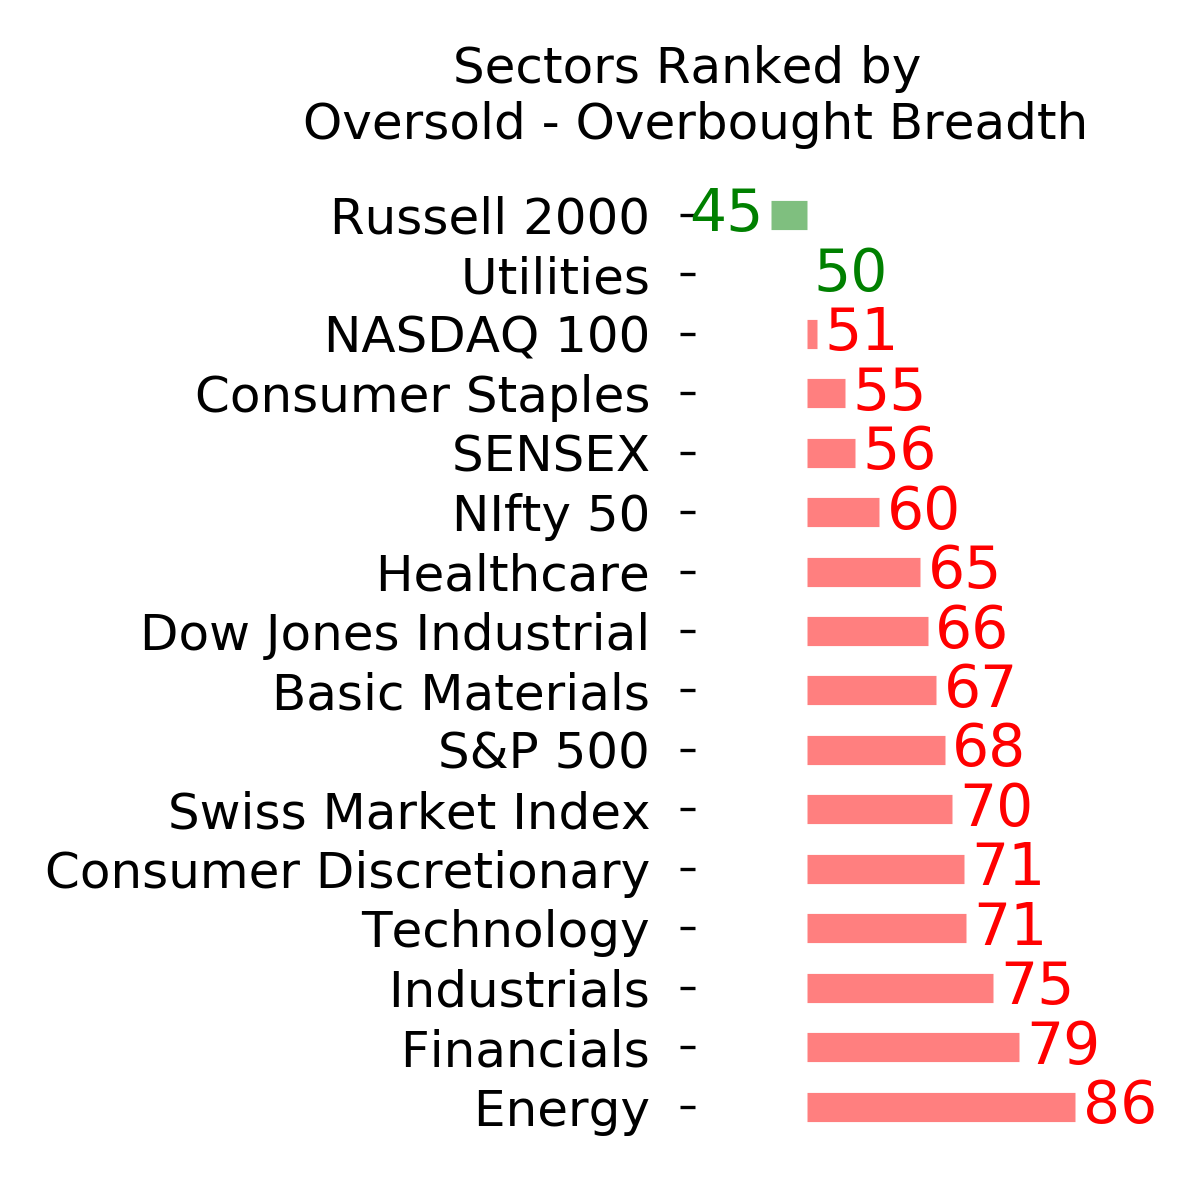
Ranks
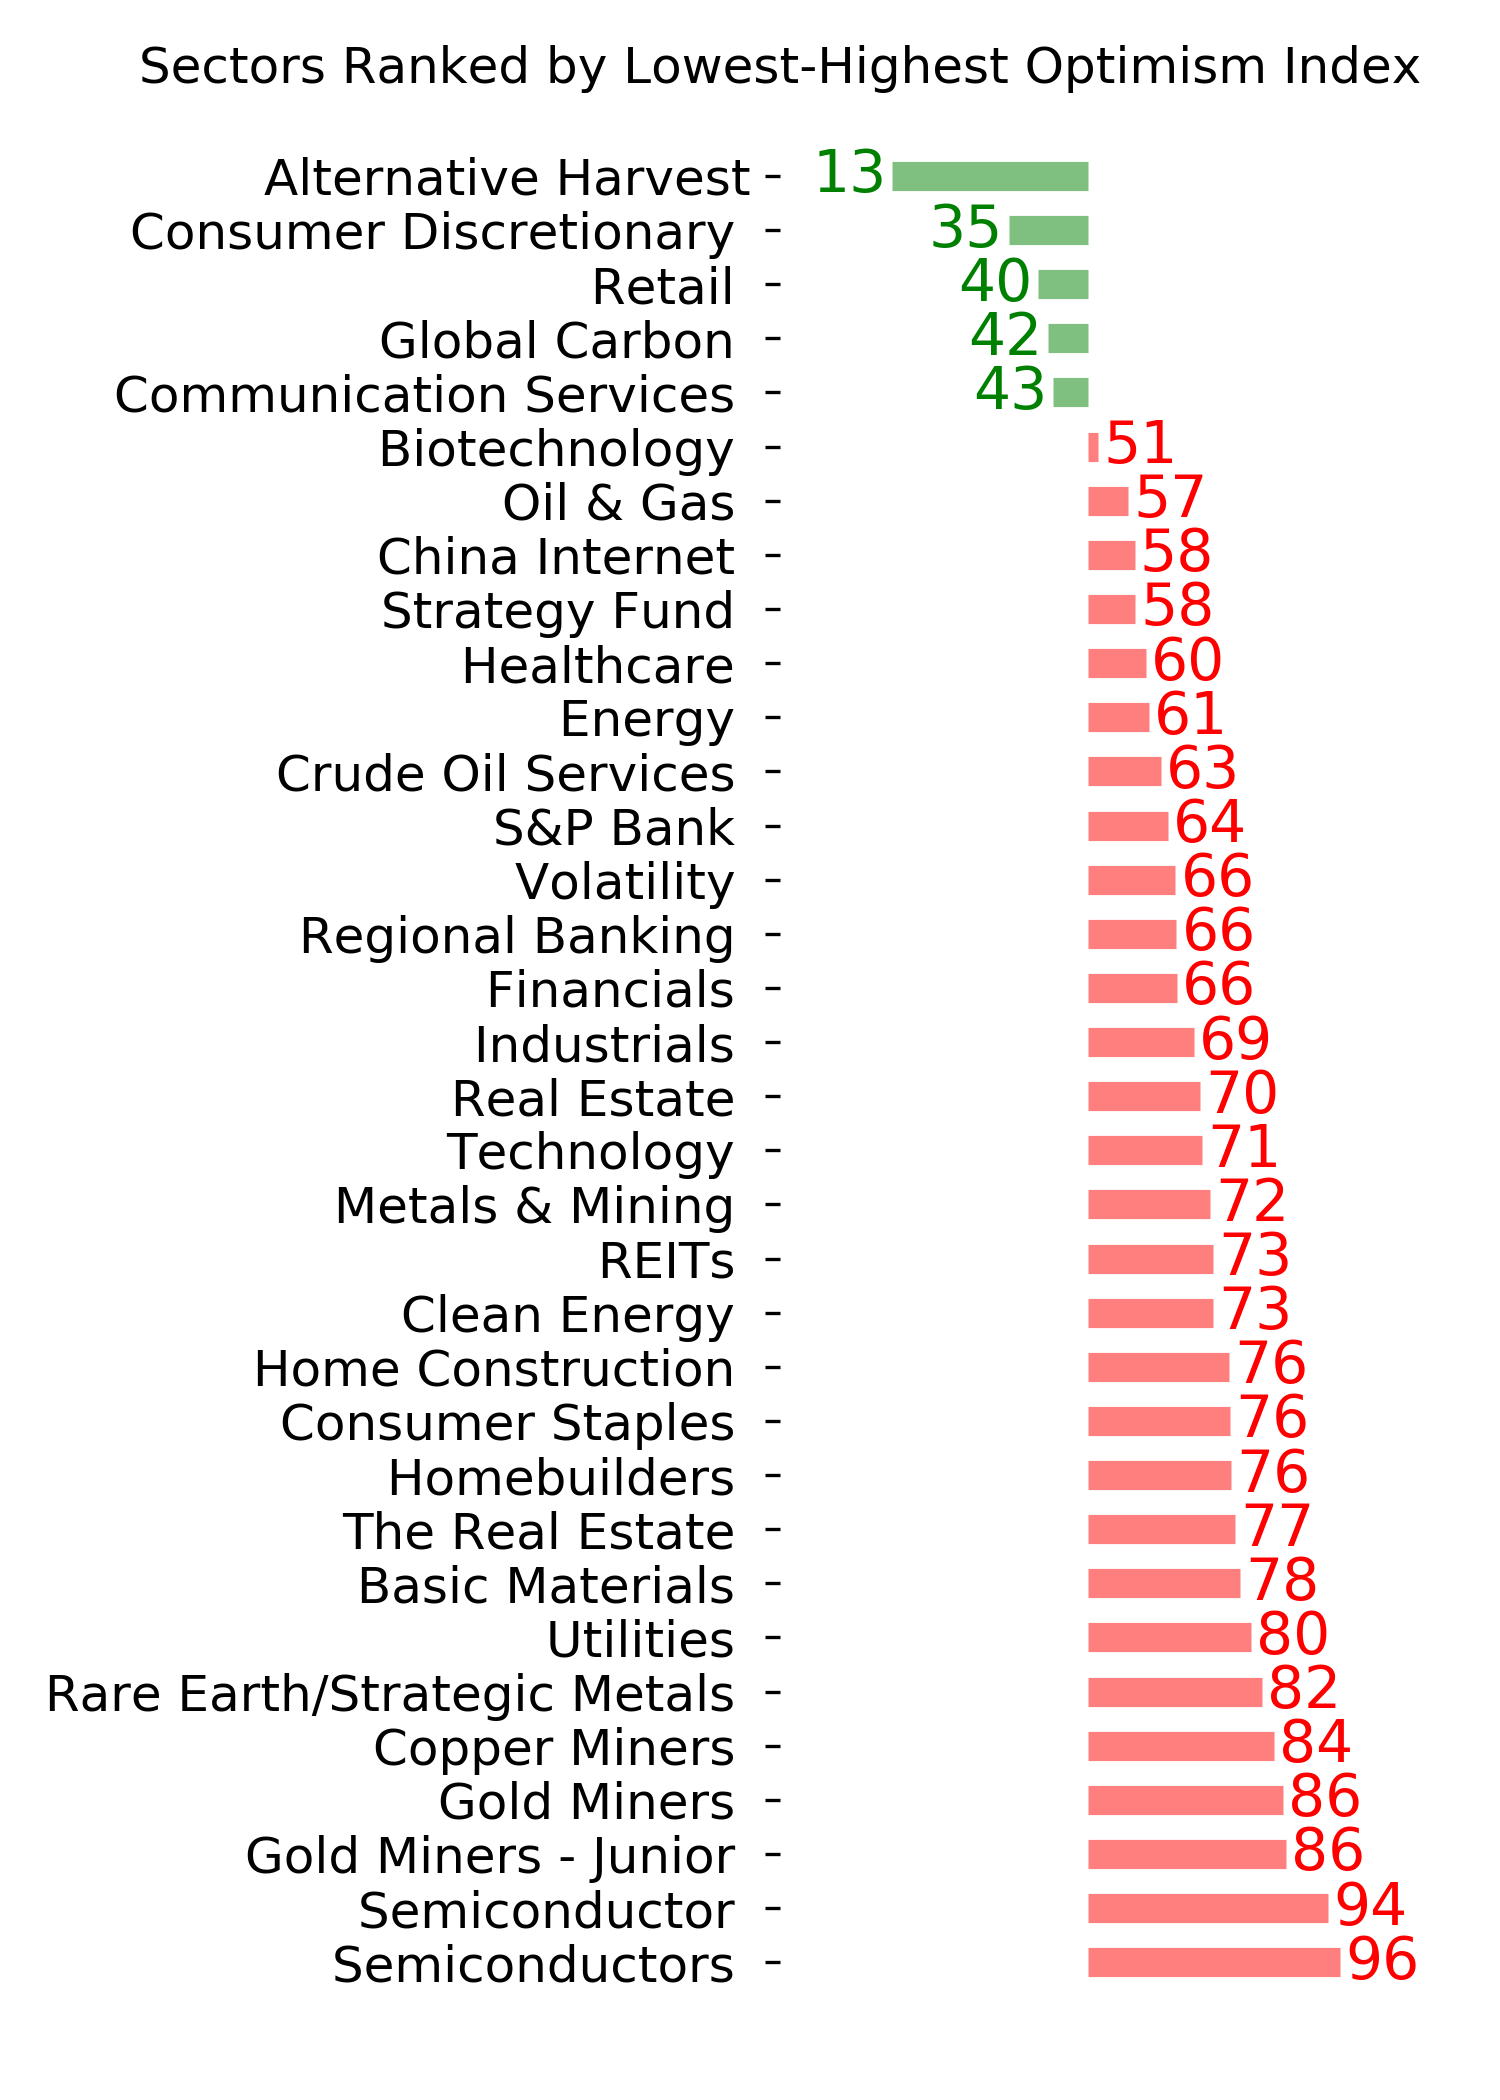
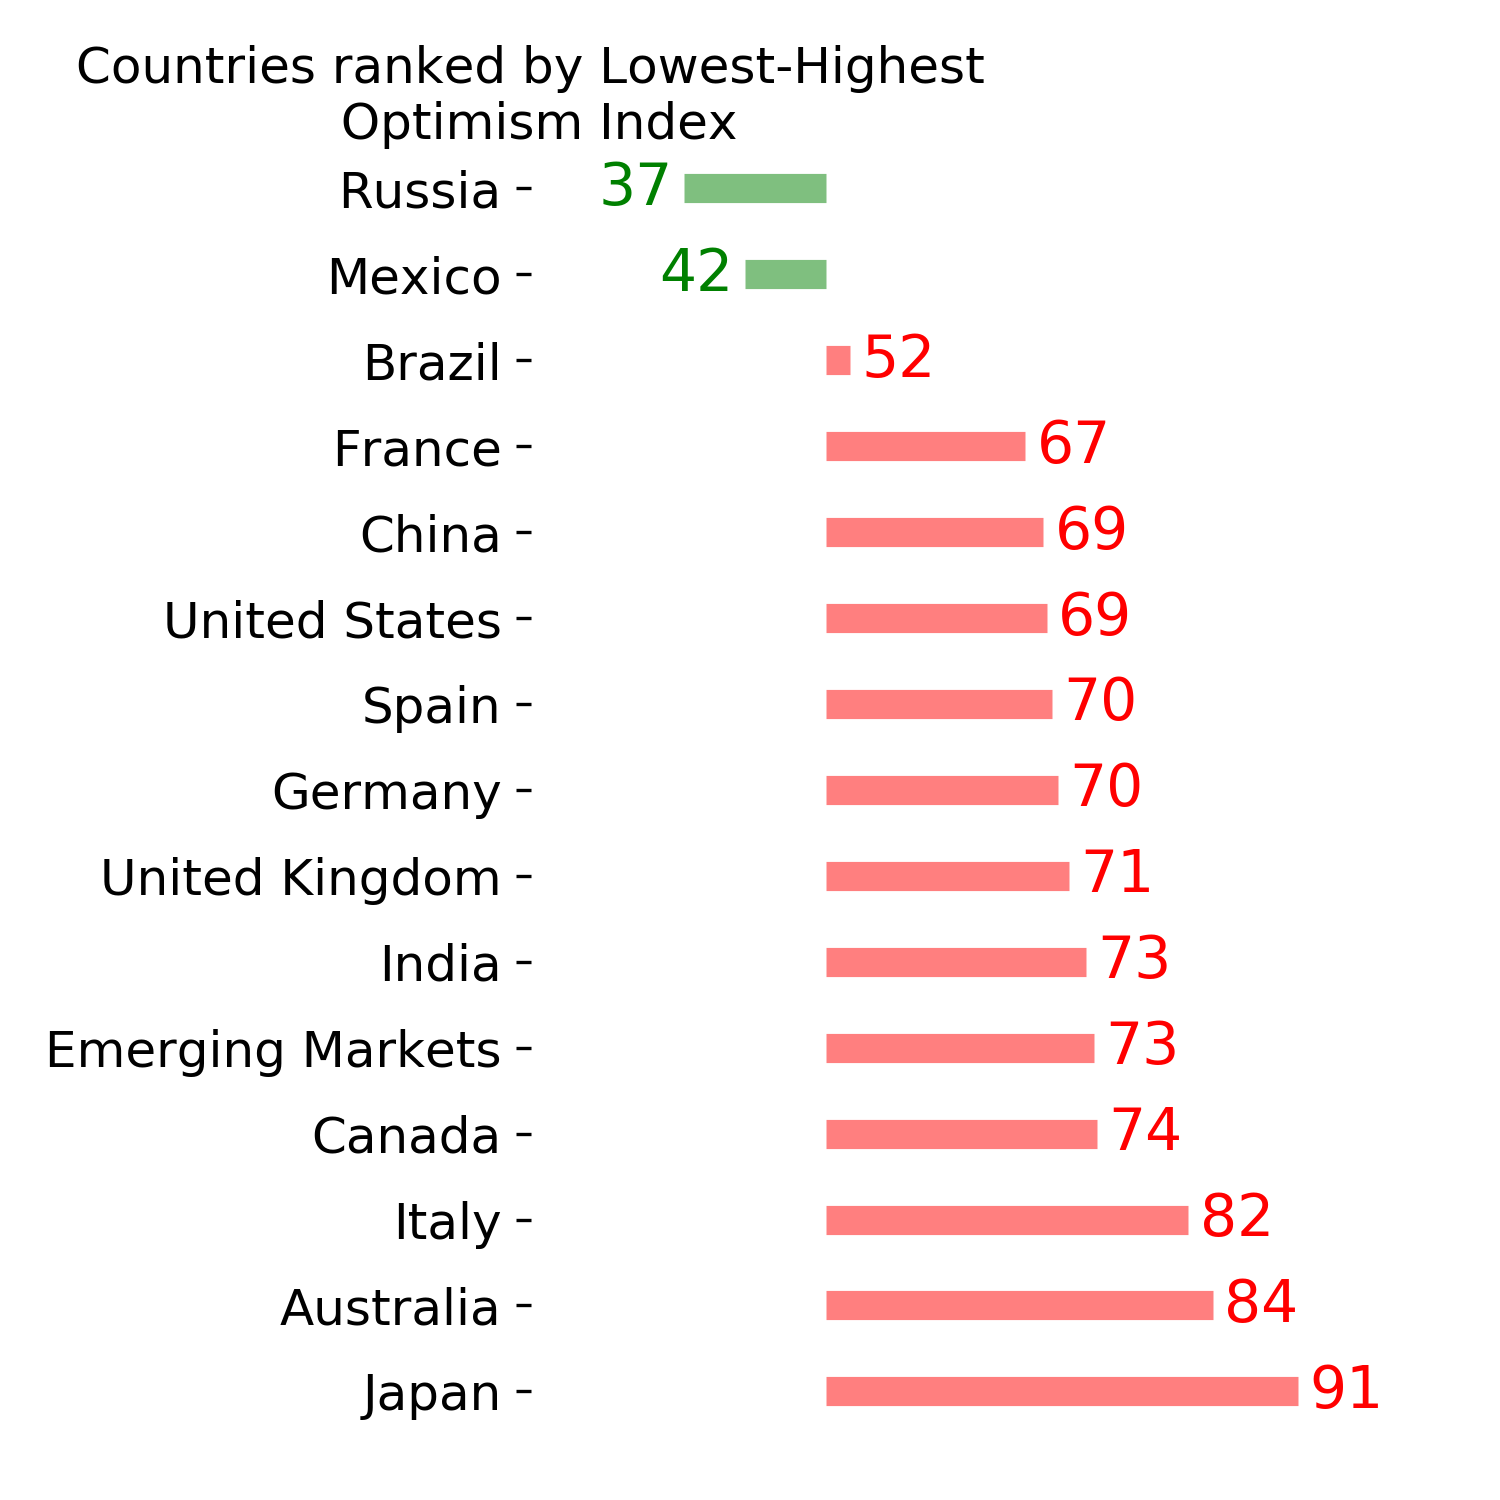
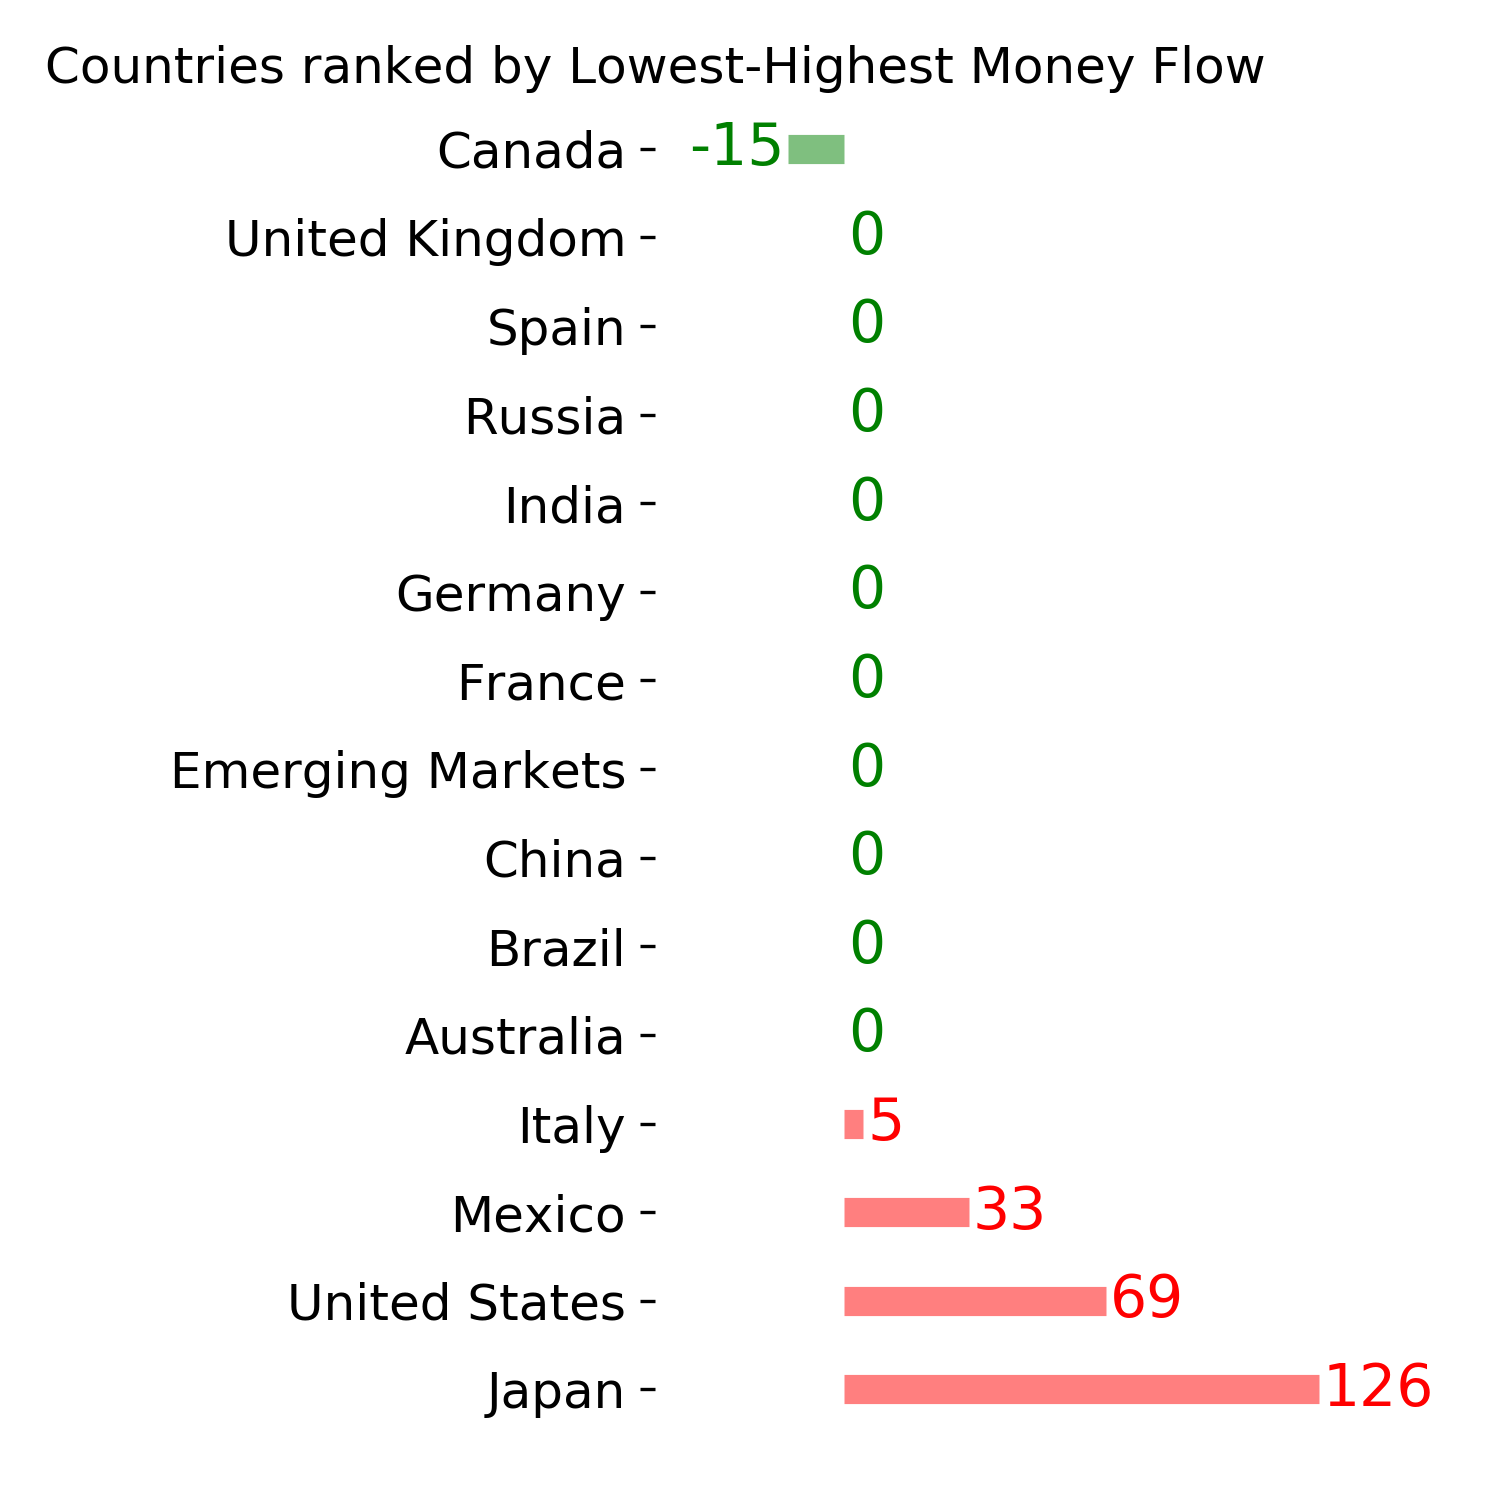
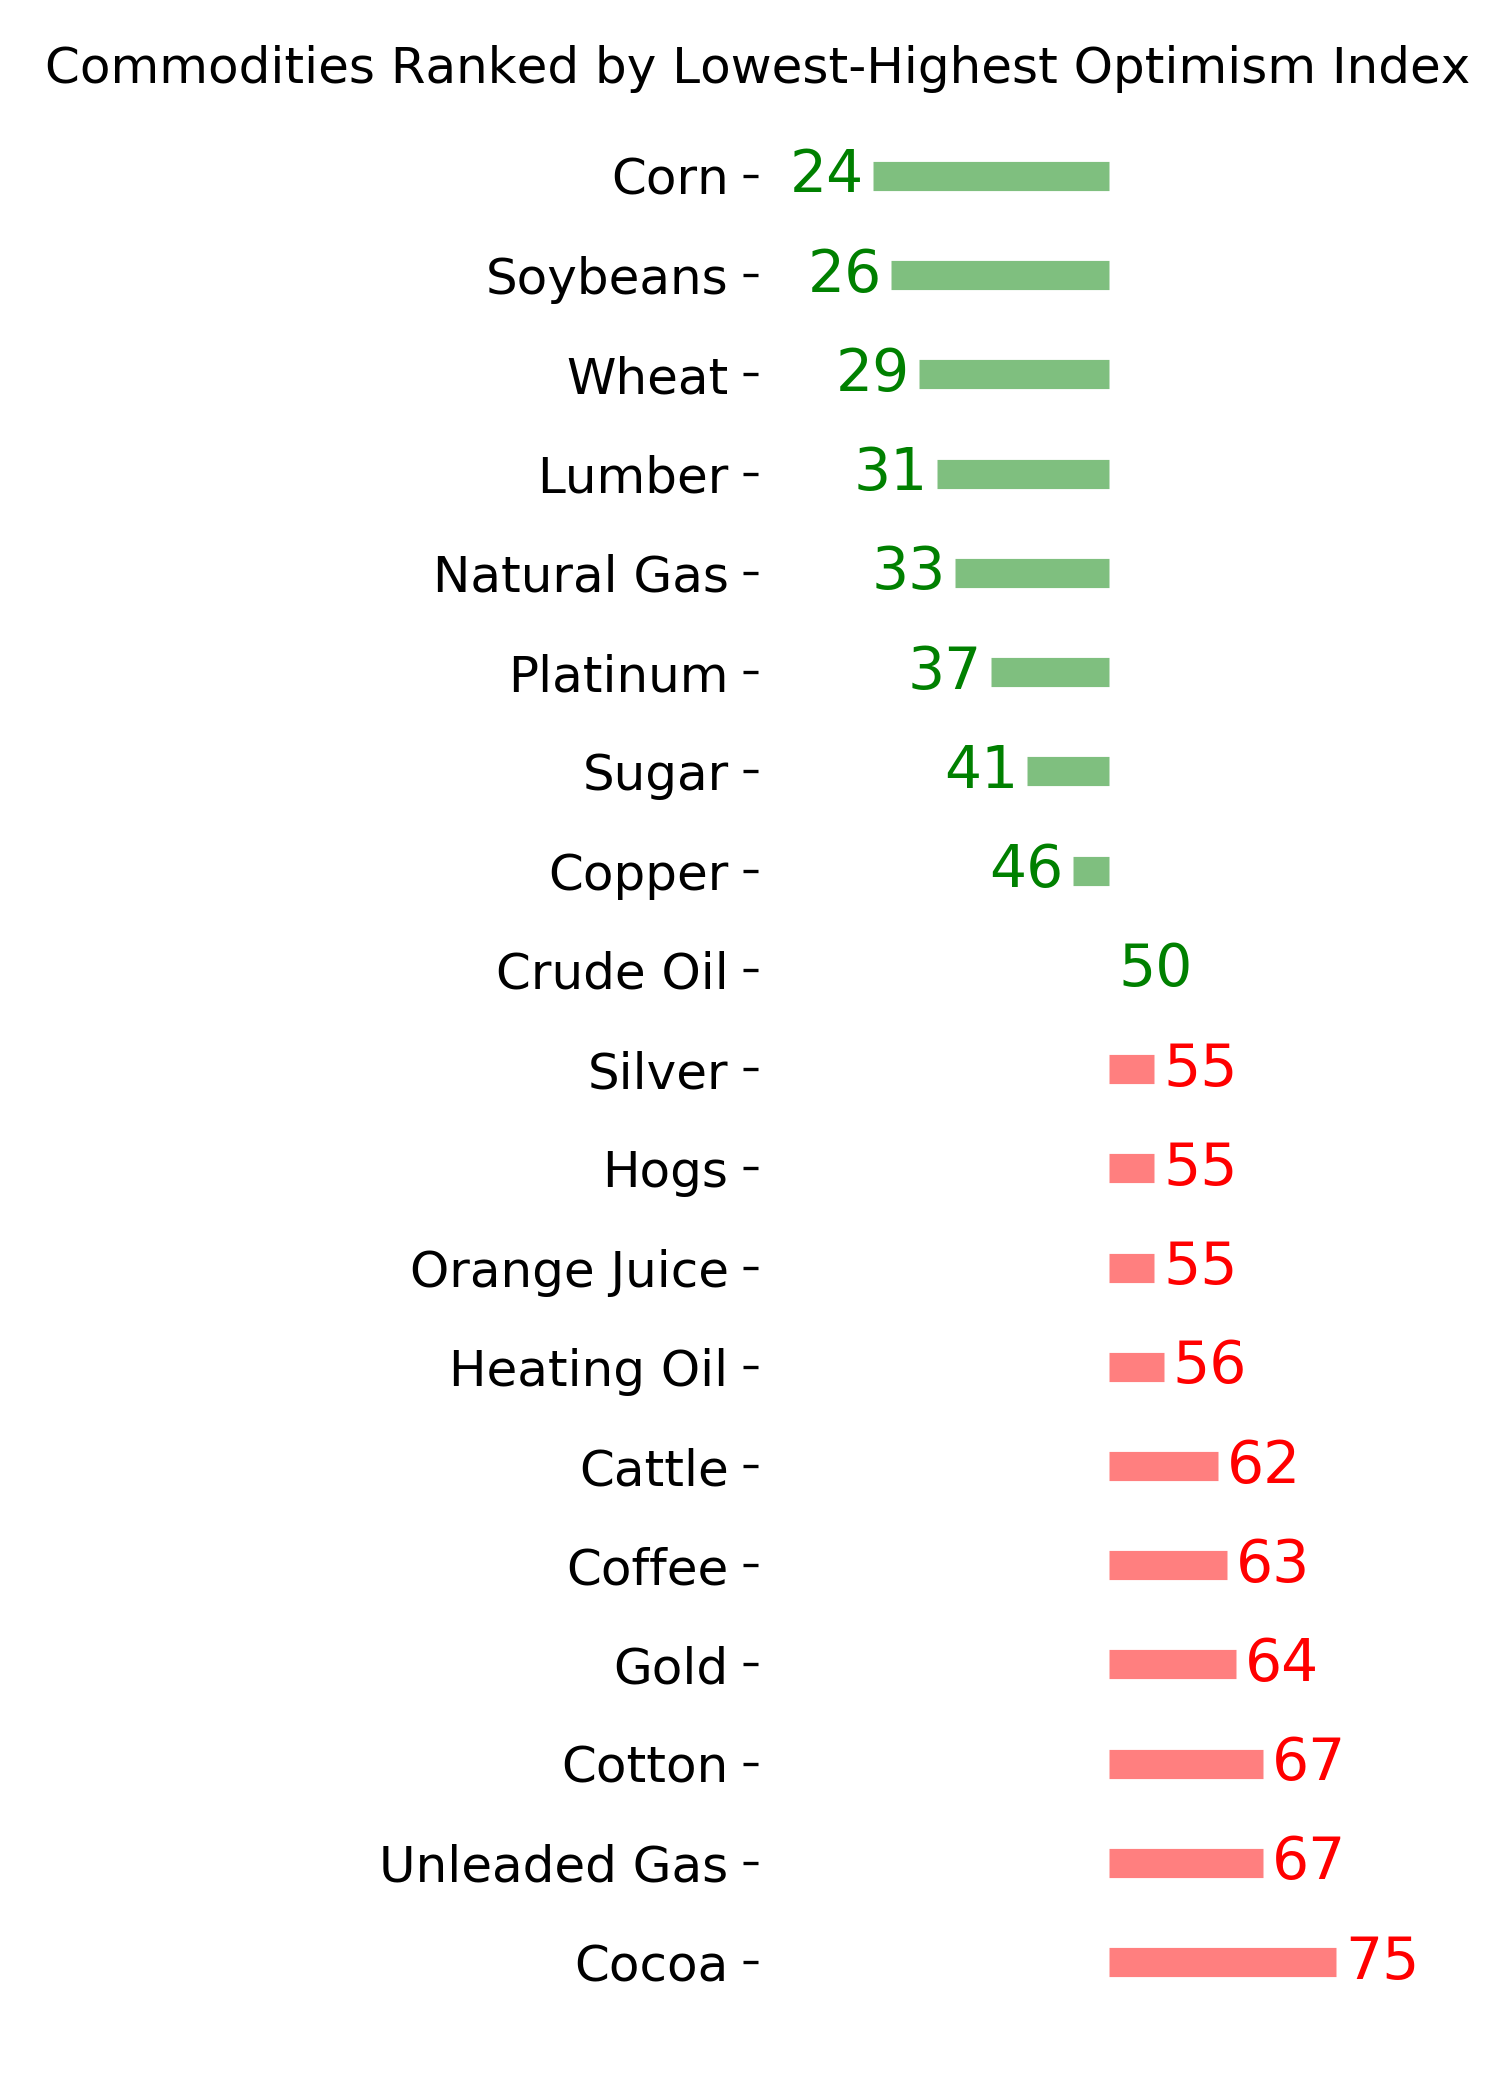
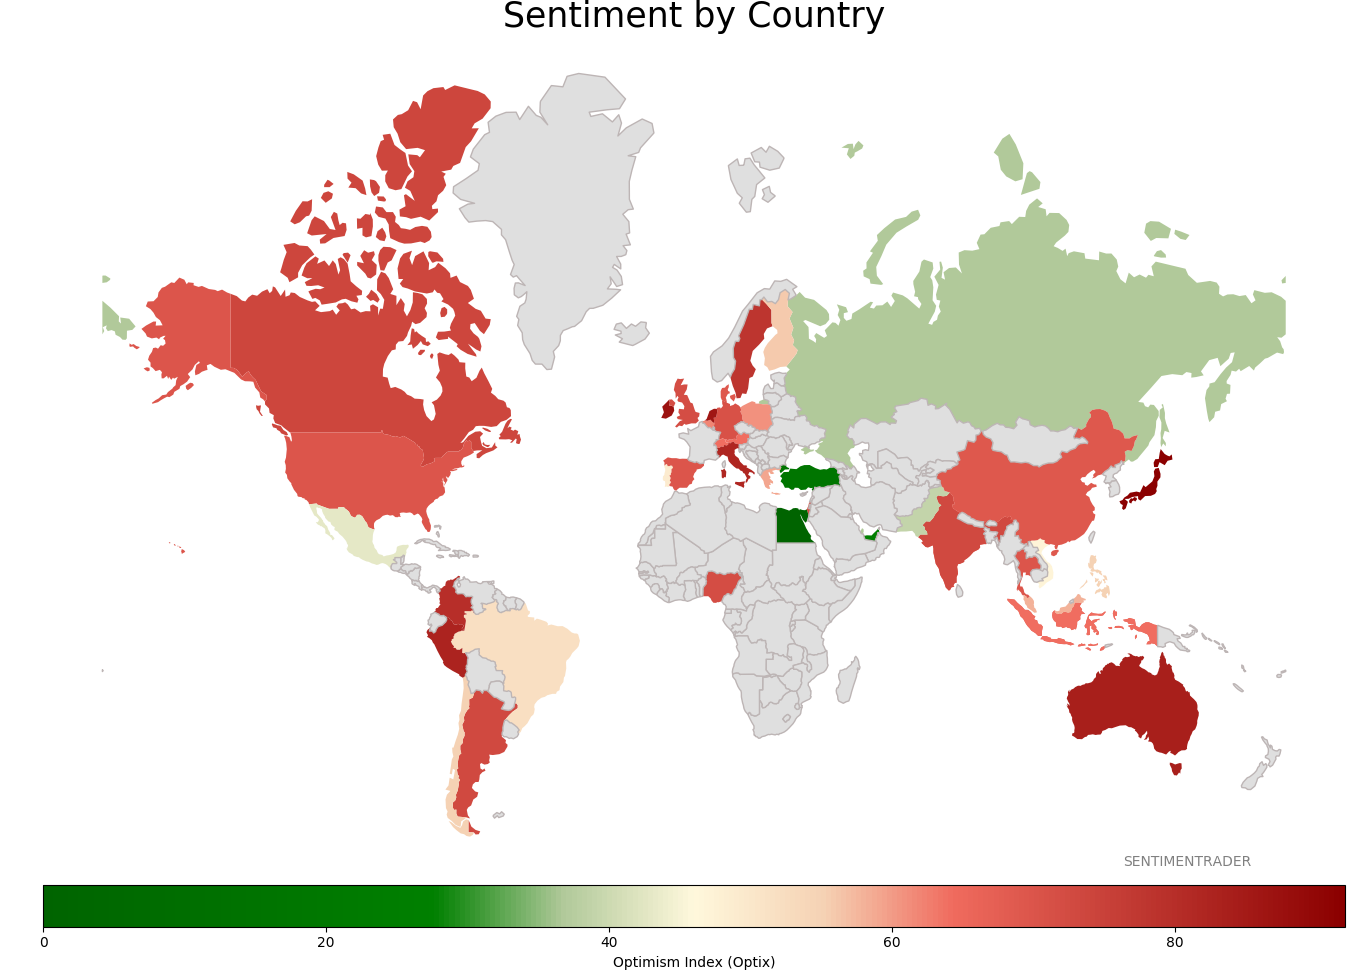
Sentiment Around The World
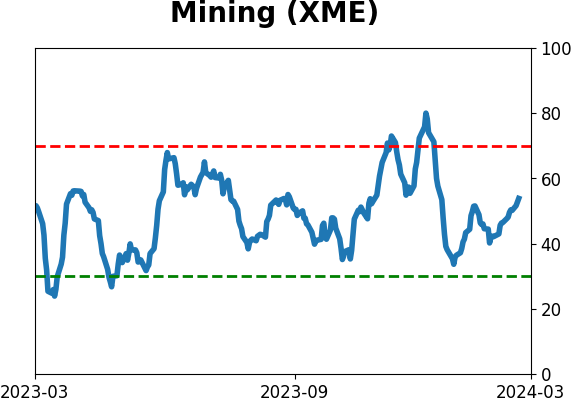
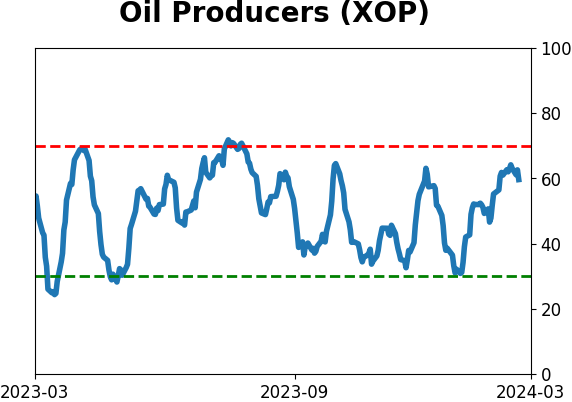
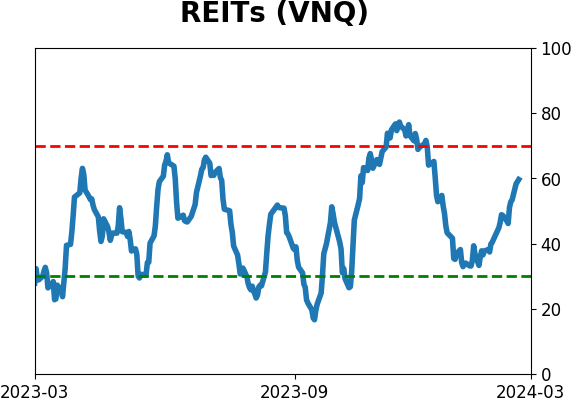
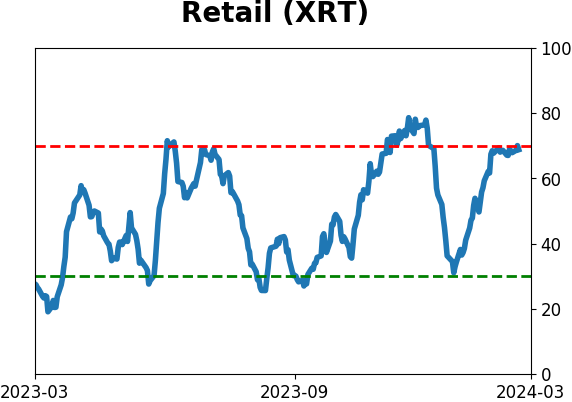
Optimism Index Thumbnails
|
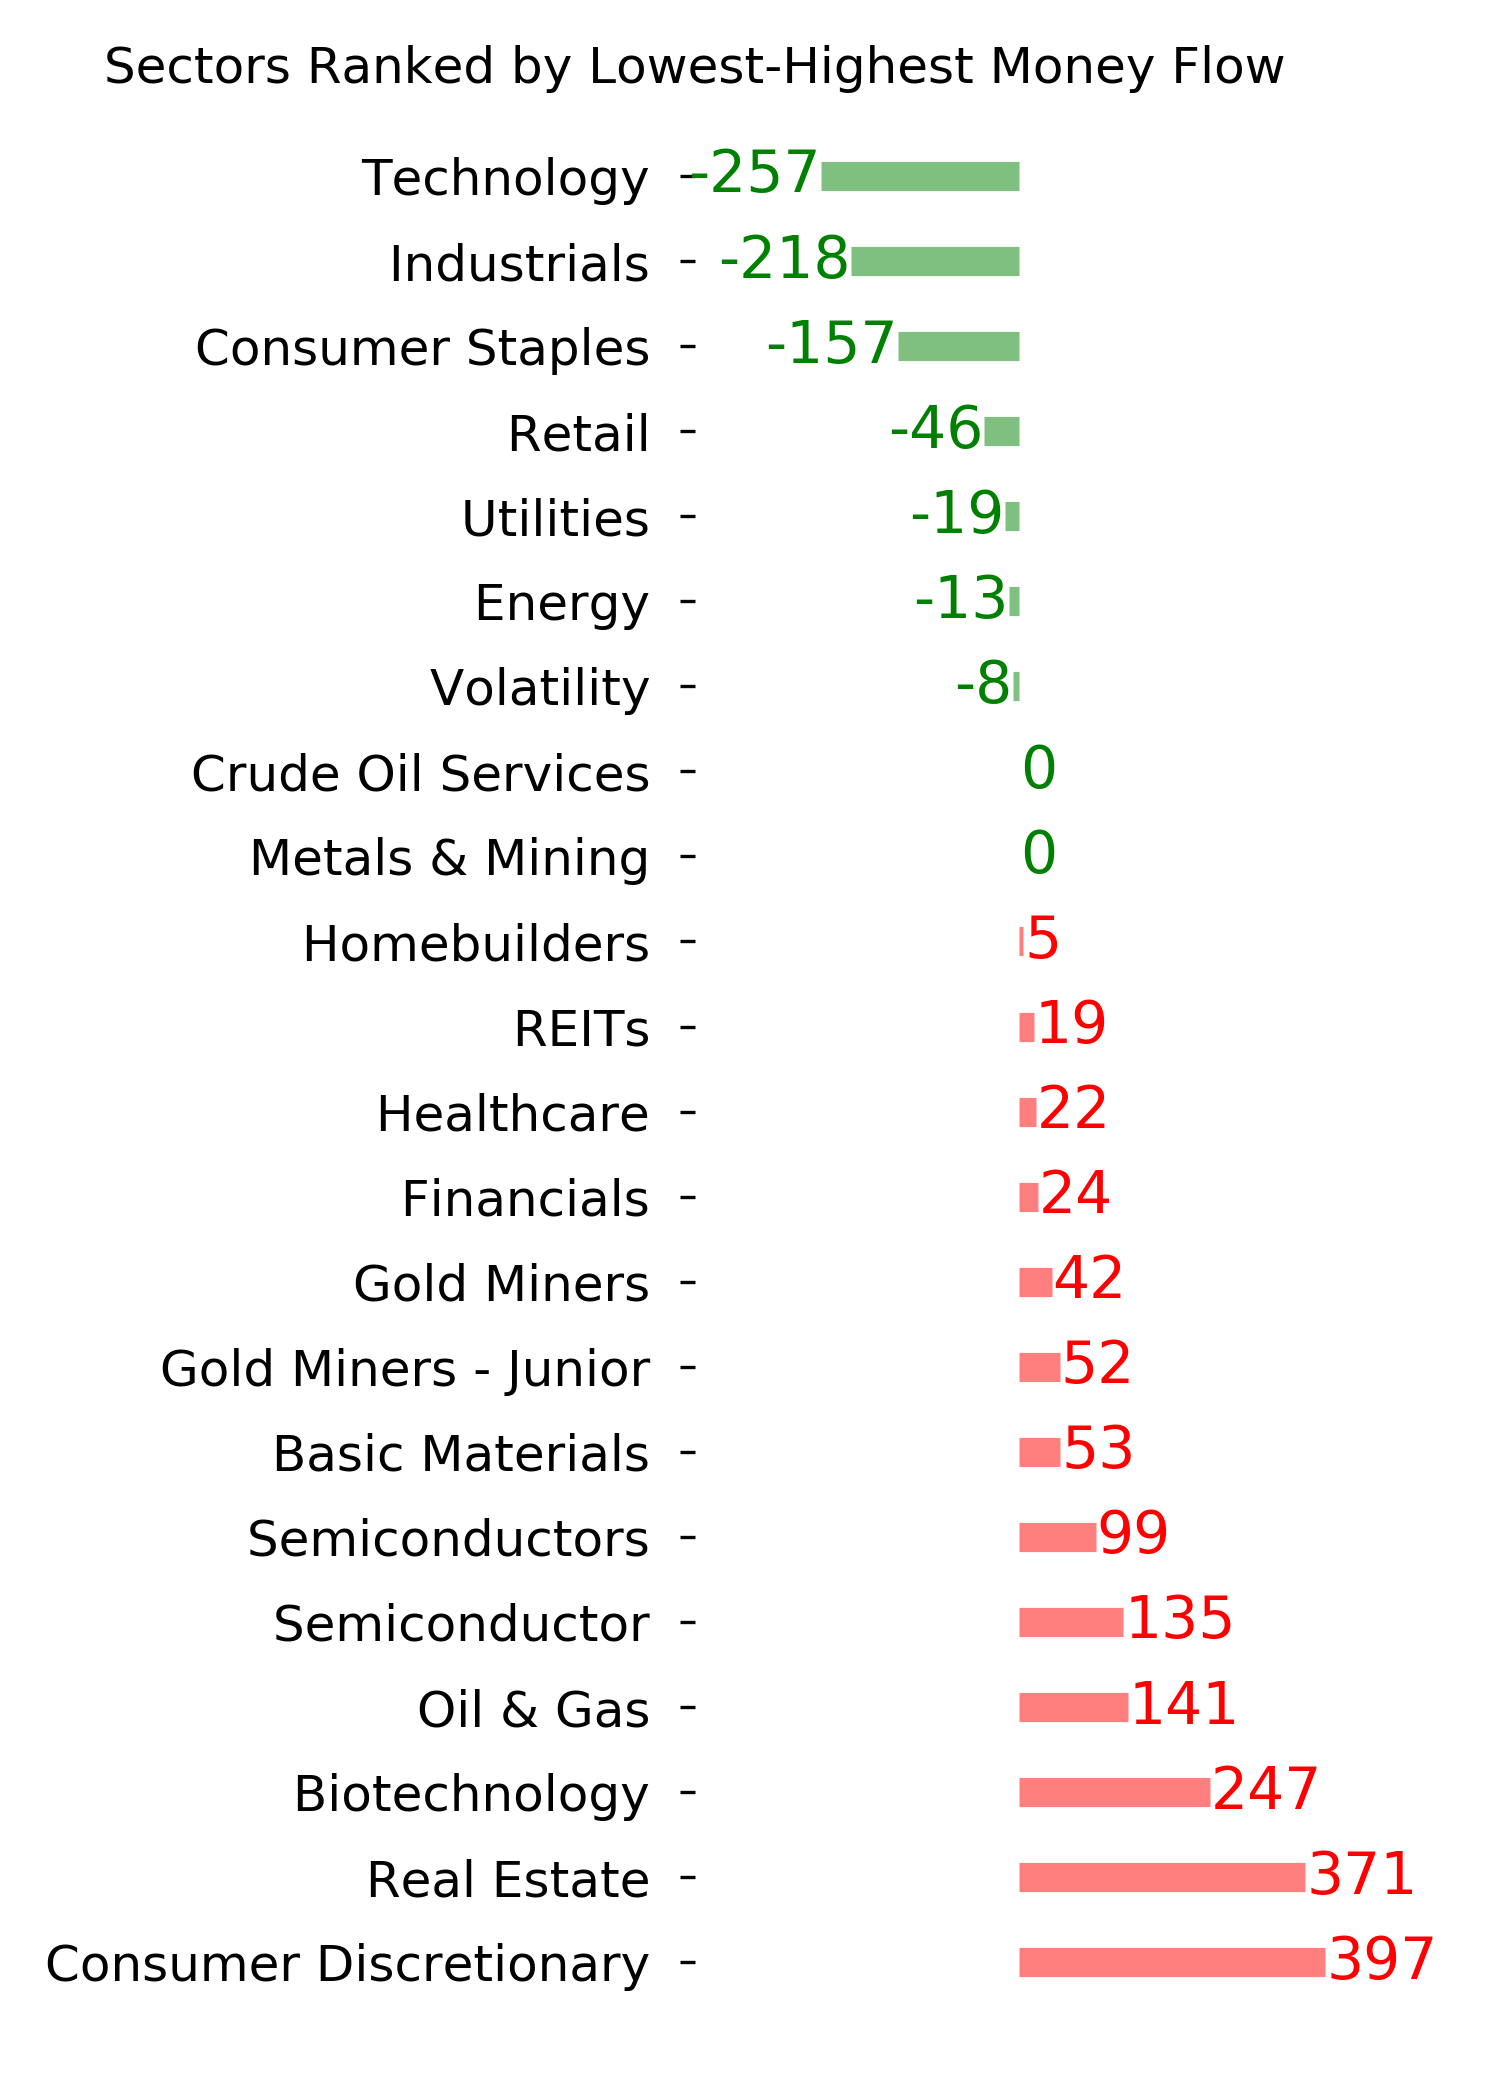
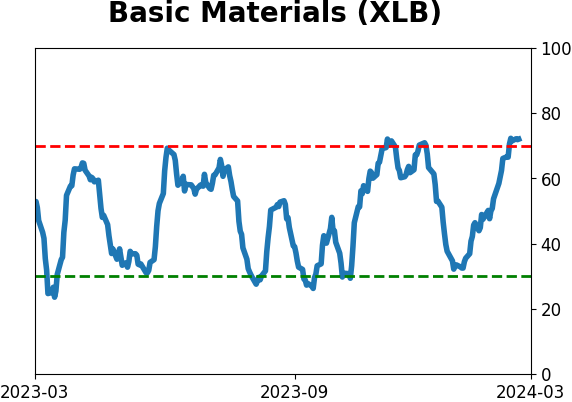
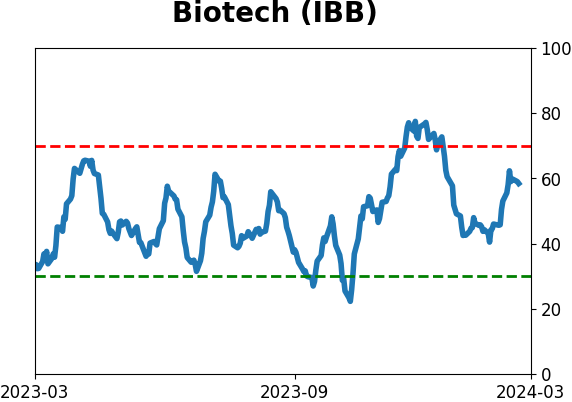
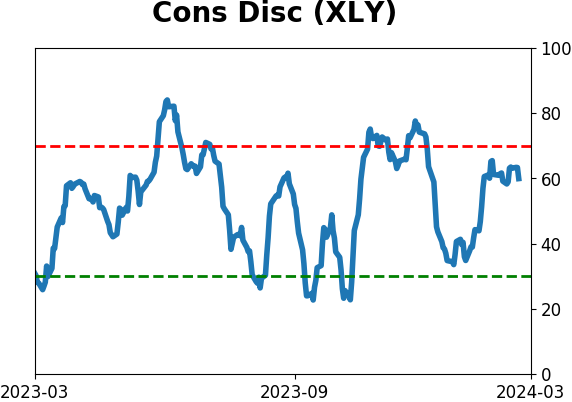
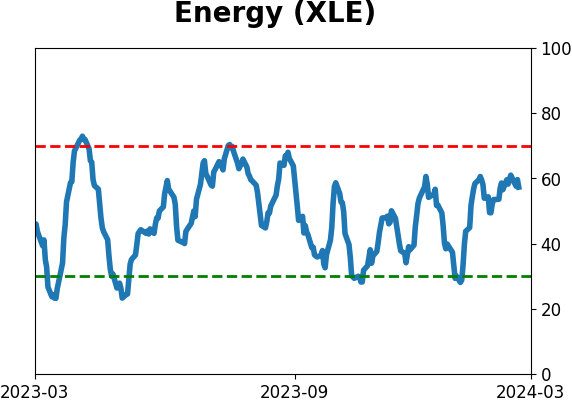
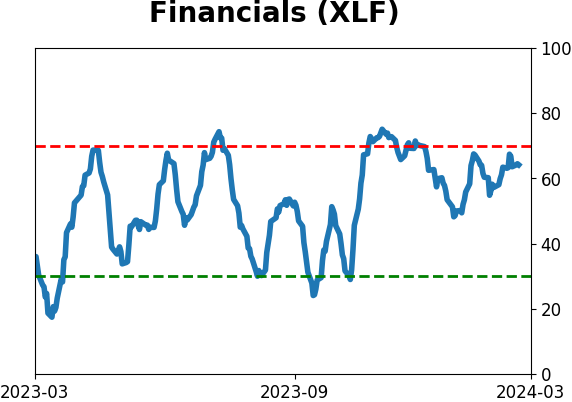
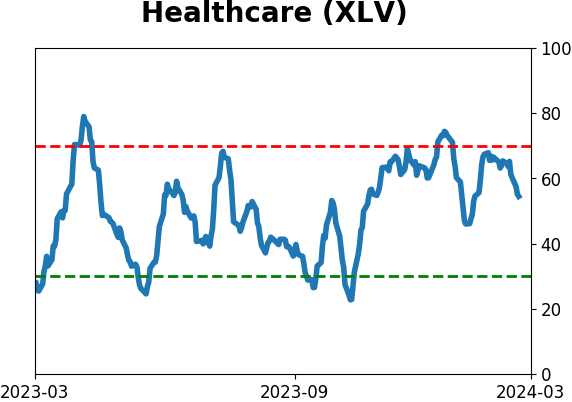
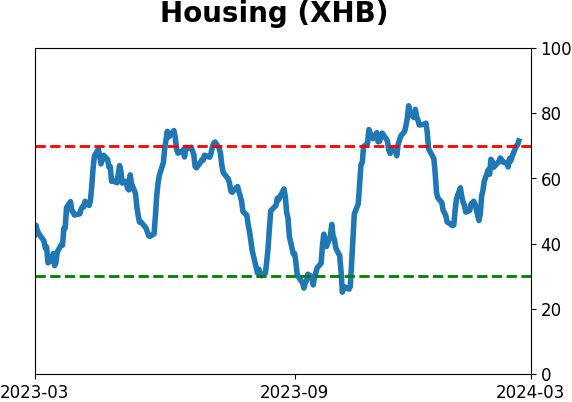
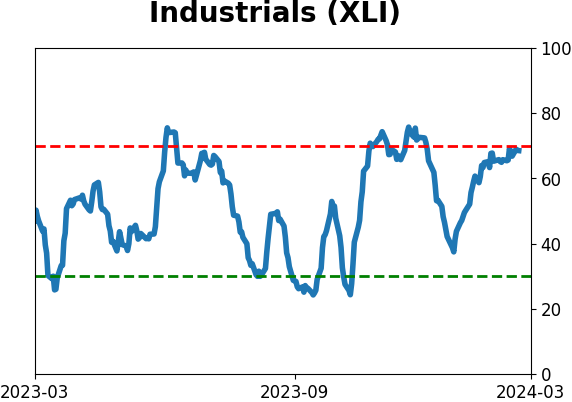
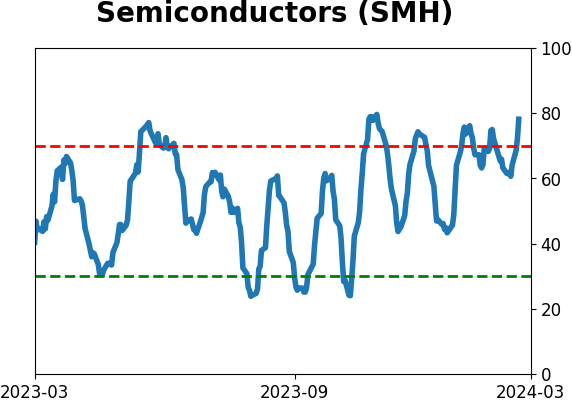
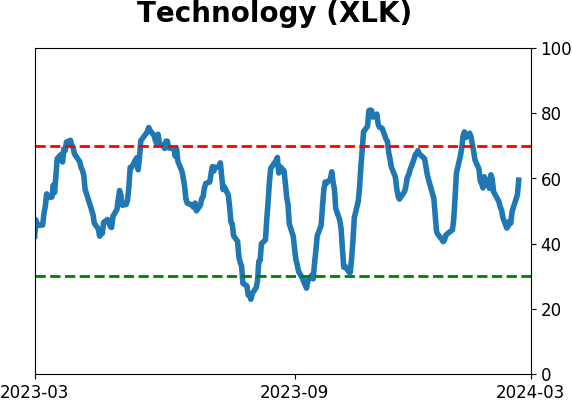
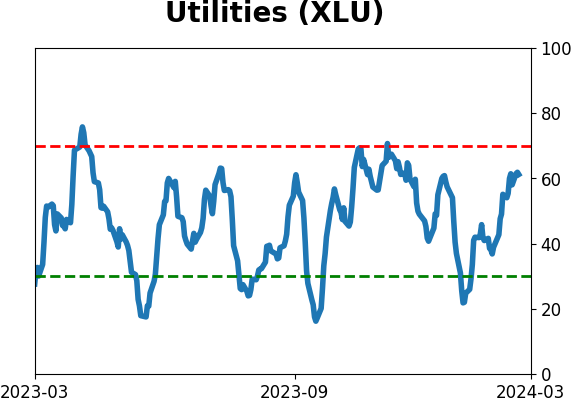
Sector ETF's - 10-Day Moving Average
|
|
|
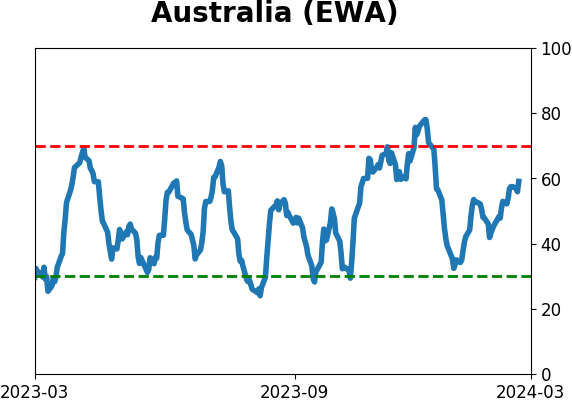
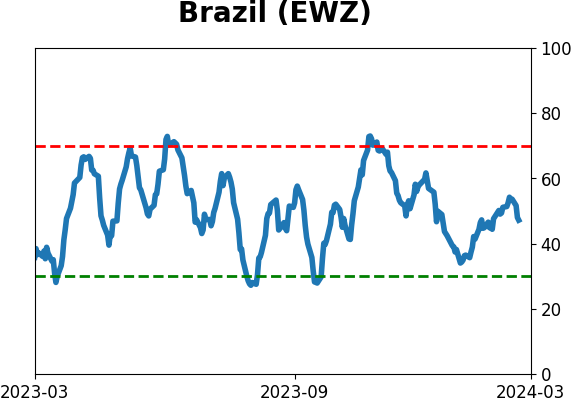
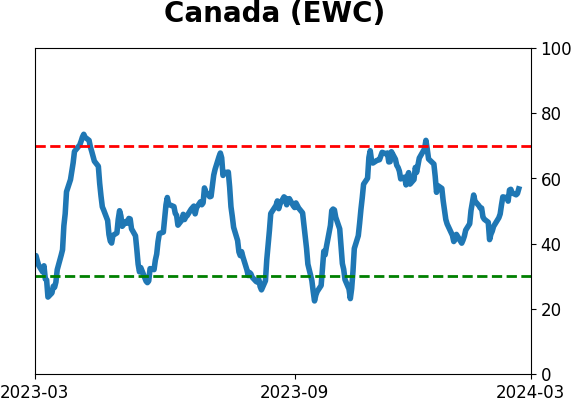
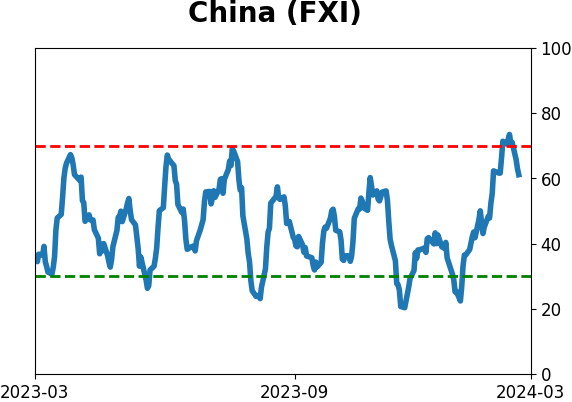
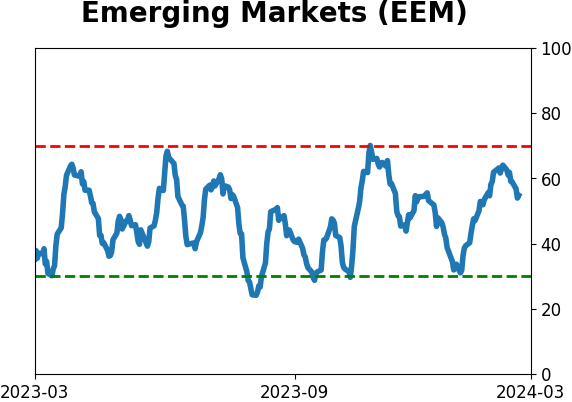
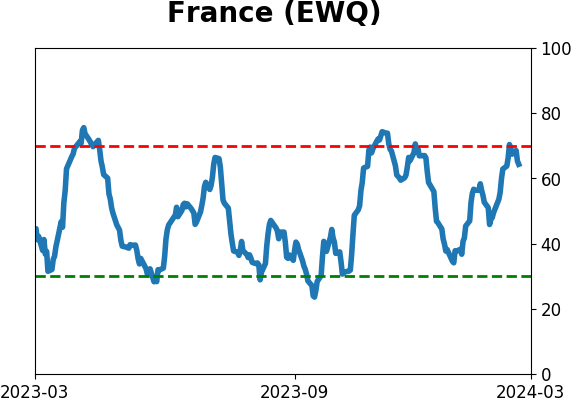
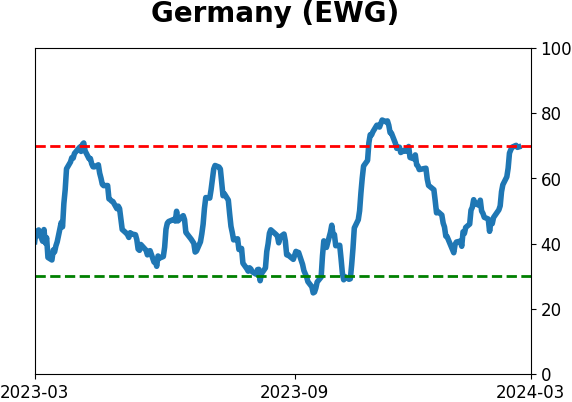
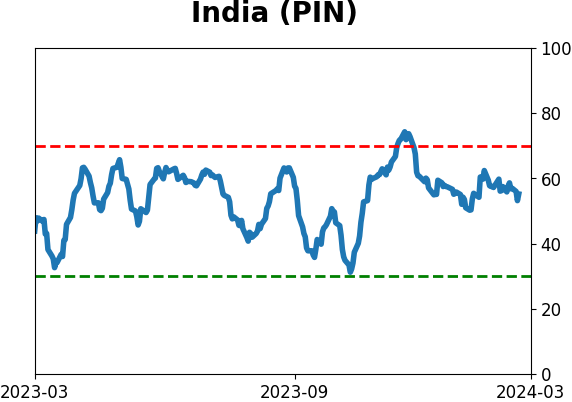
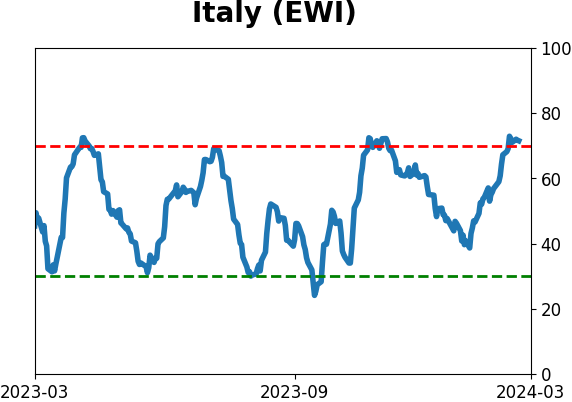
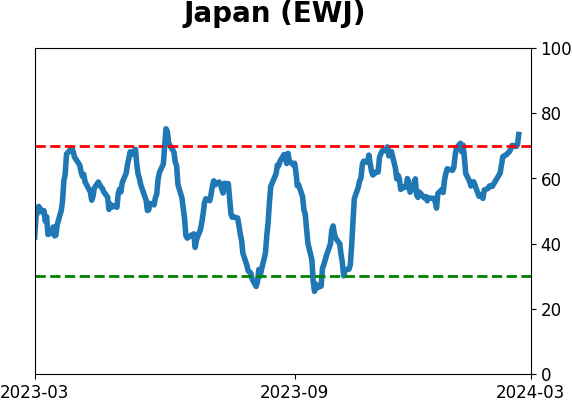
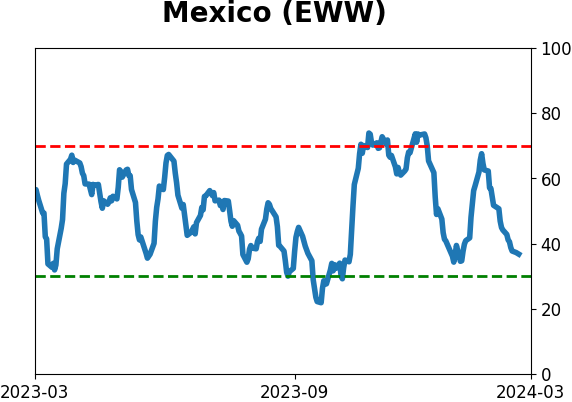
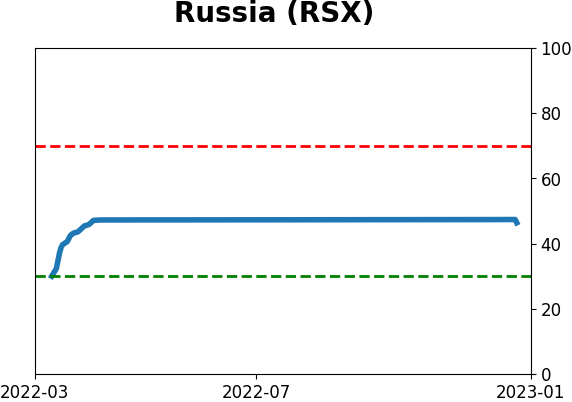
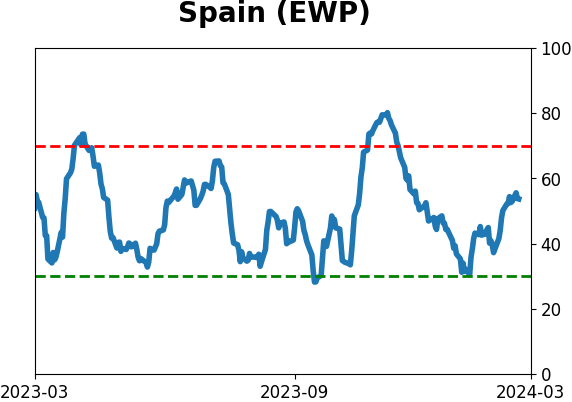
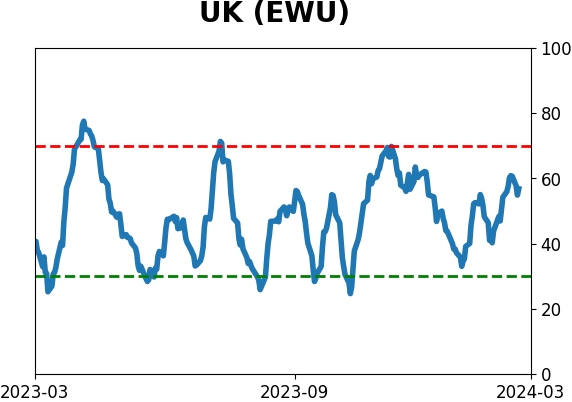
Country ETF's - 10-Day Moving Average
|
|
|
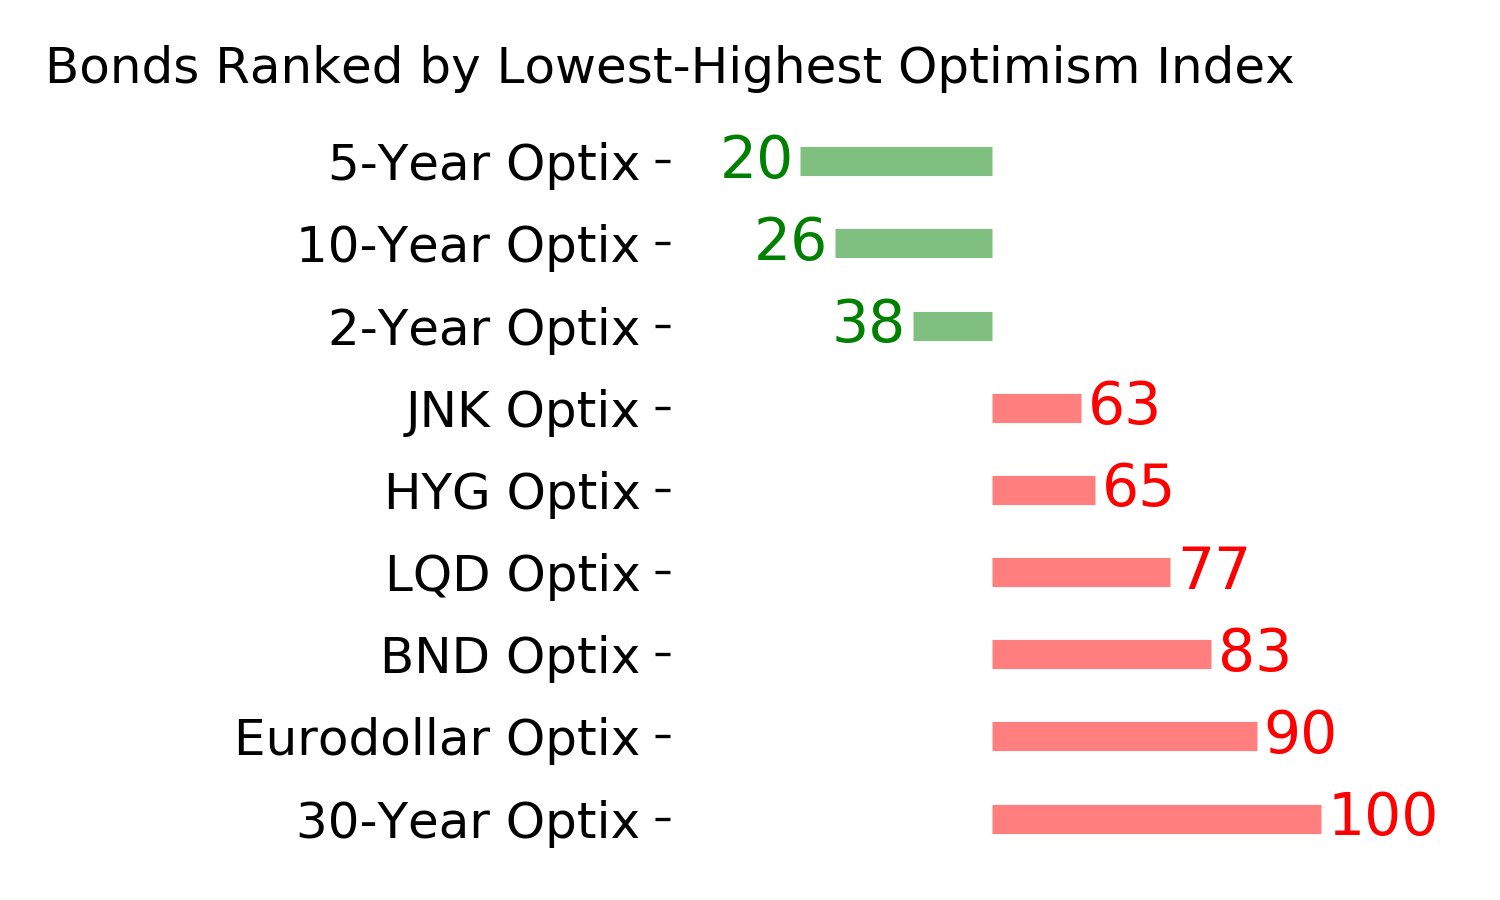
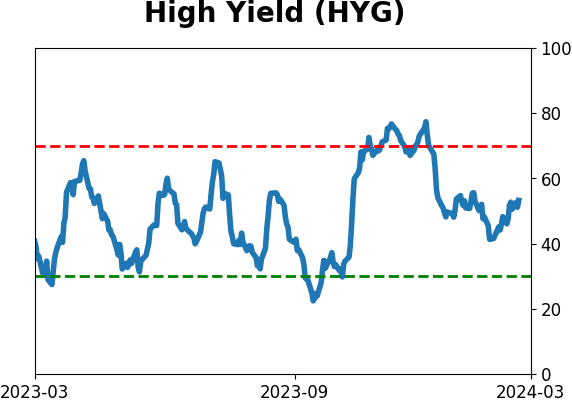
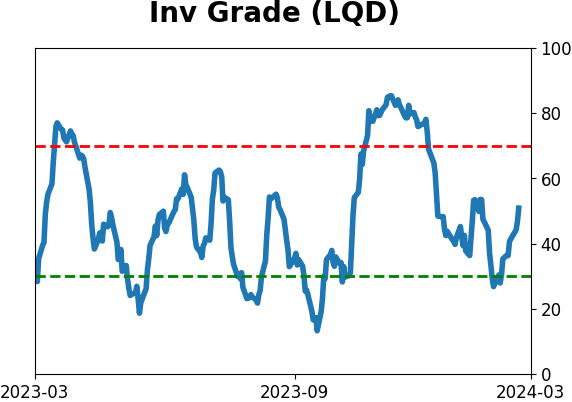
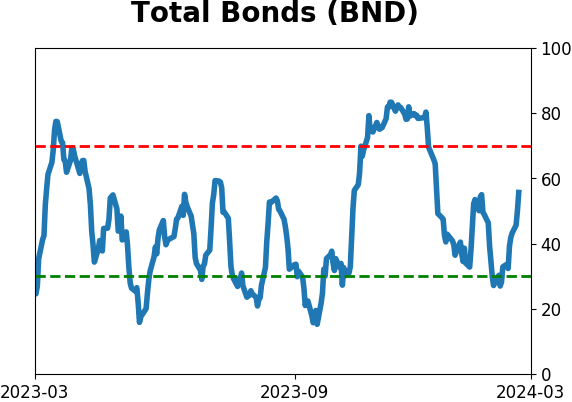
Bond ETF's - 10-Day Moving Average
|
|
|
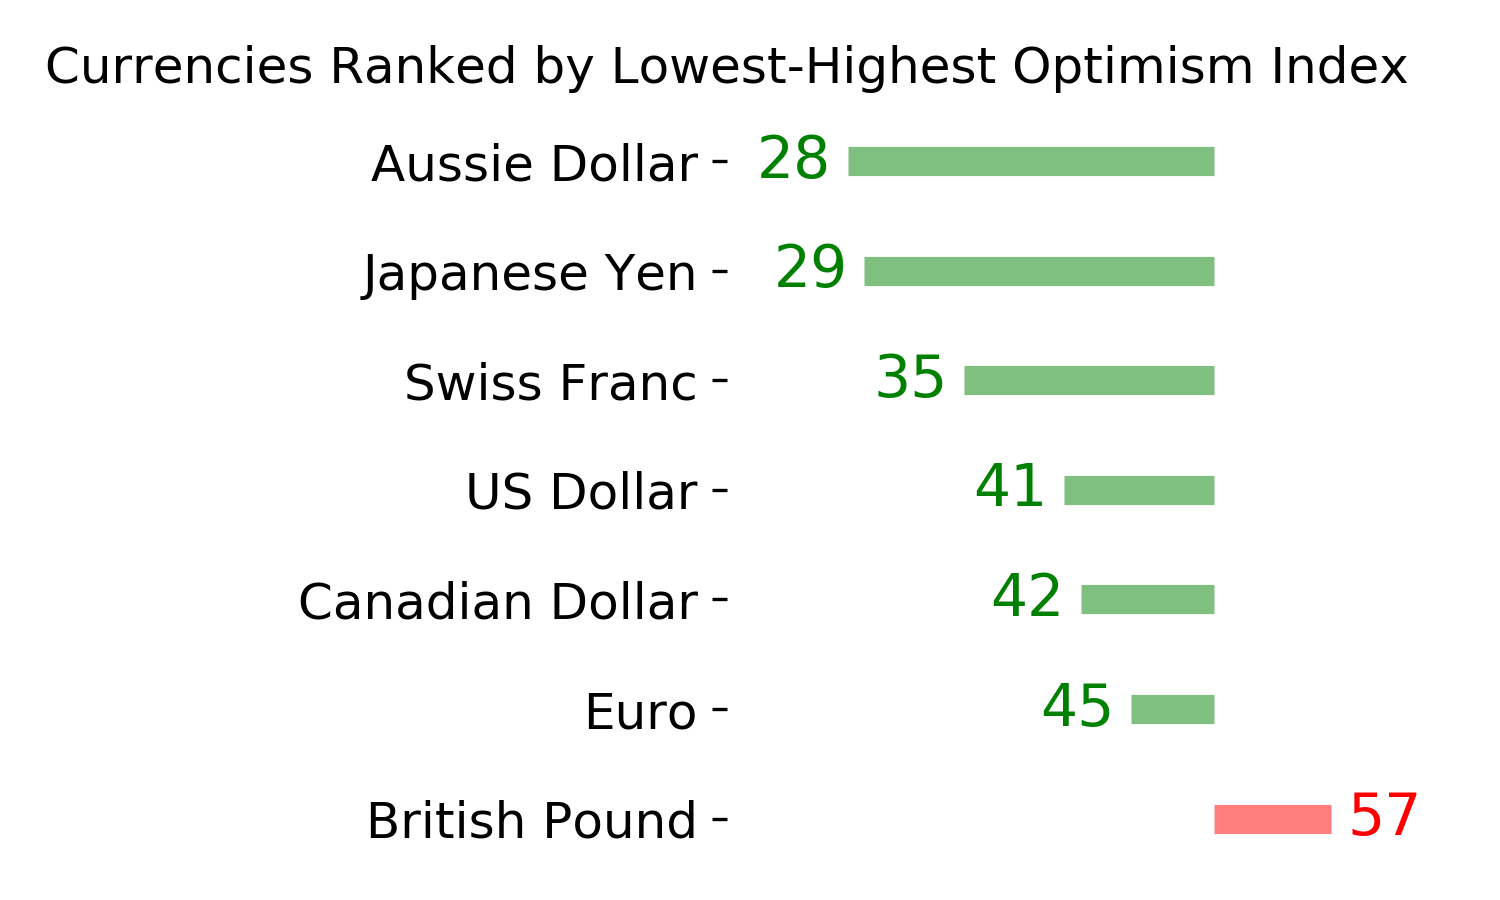
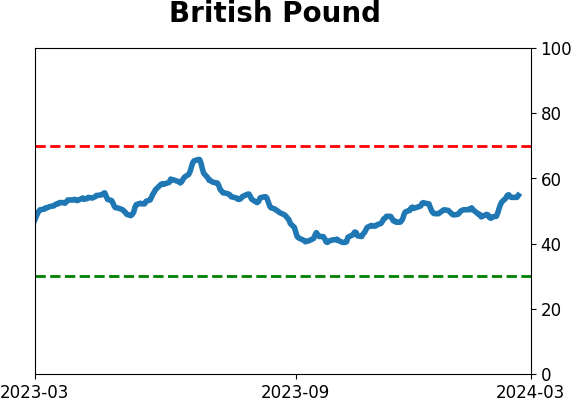
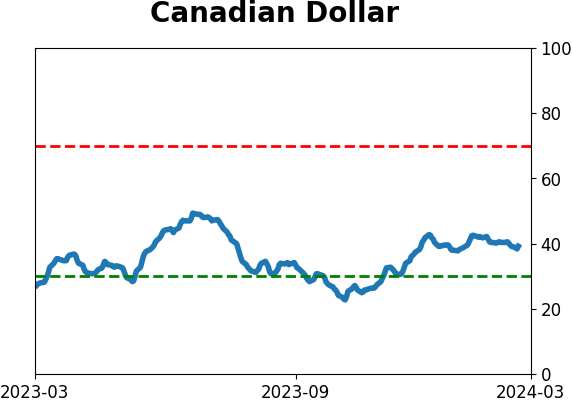
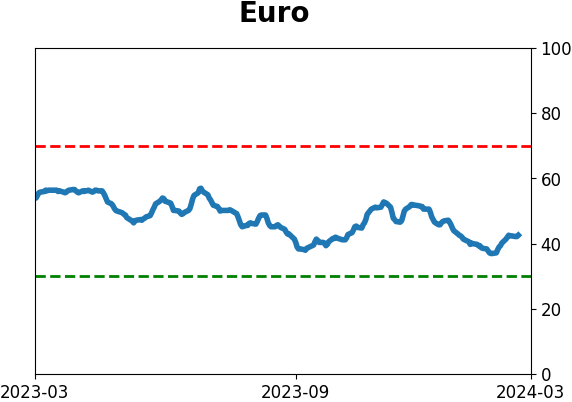
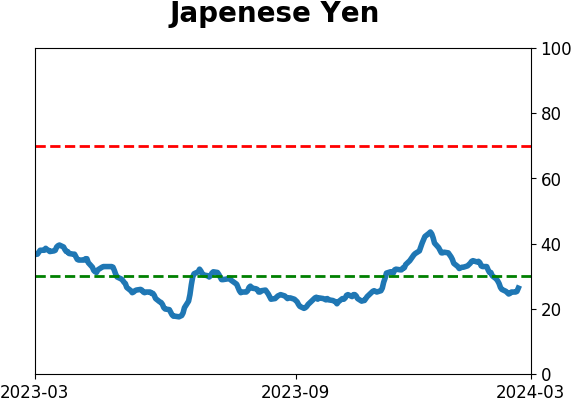
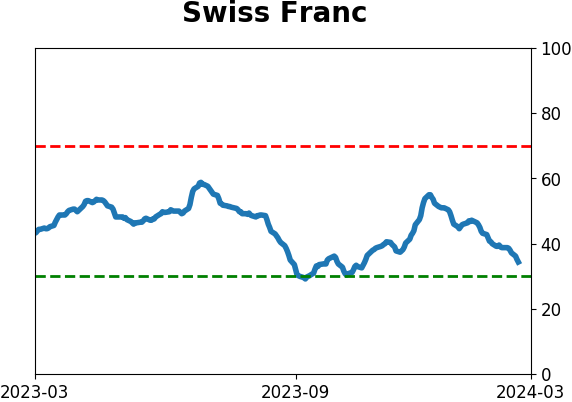
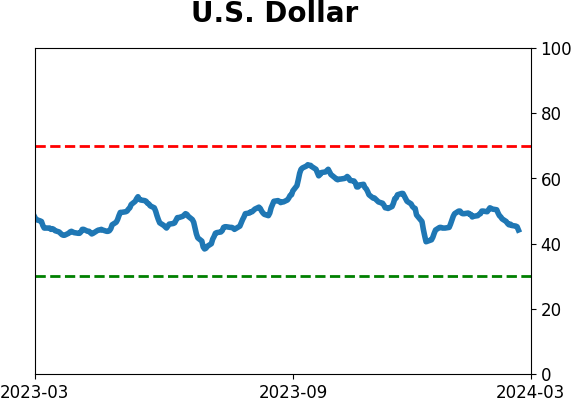
Currency ETF's - 5-Day Moving Average
|
|
|
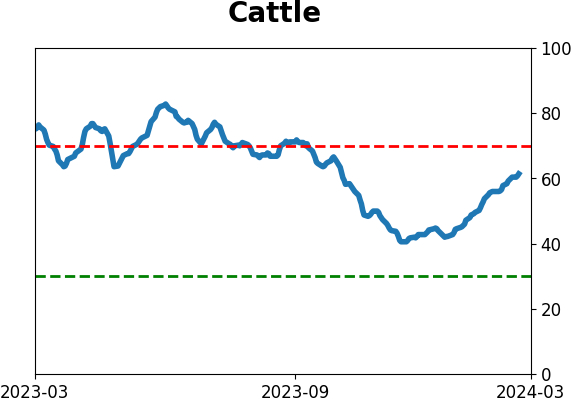
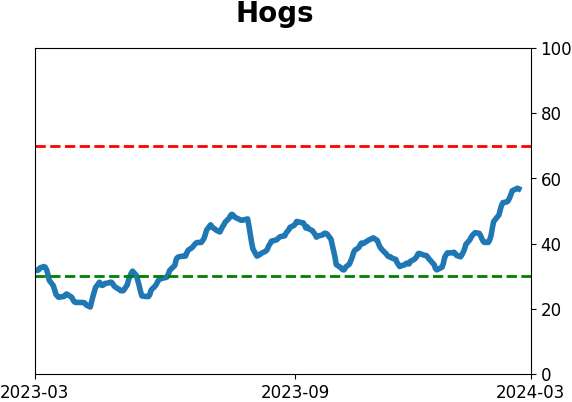
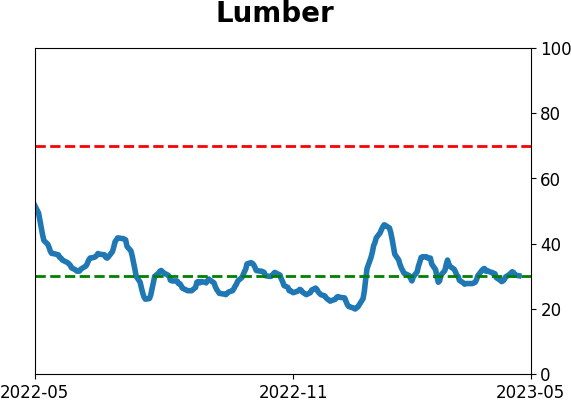
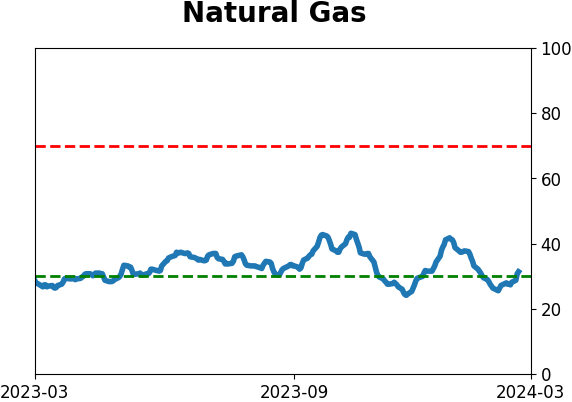
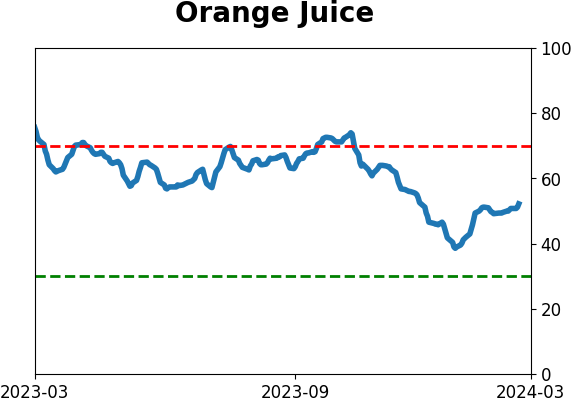
Commodity ETF's - 5-Day Moving Average
|
|