Headlines
|
|
Investors are showing persistent Enthusiasm:
Over the past few weeks, the S&P 500 has shown a high positive correlation to the Enthusiasm phase of a Typical Sentiment Cycle. It has also shown a high negative correlation to the Panic phase. Similar behavior preceded some rocky returns over the next couple months, but mostly good returns long-term.
|
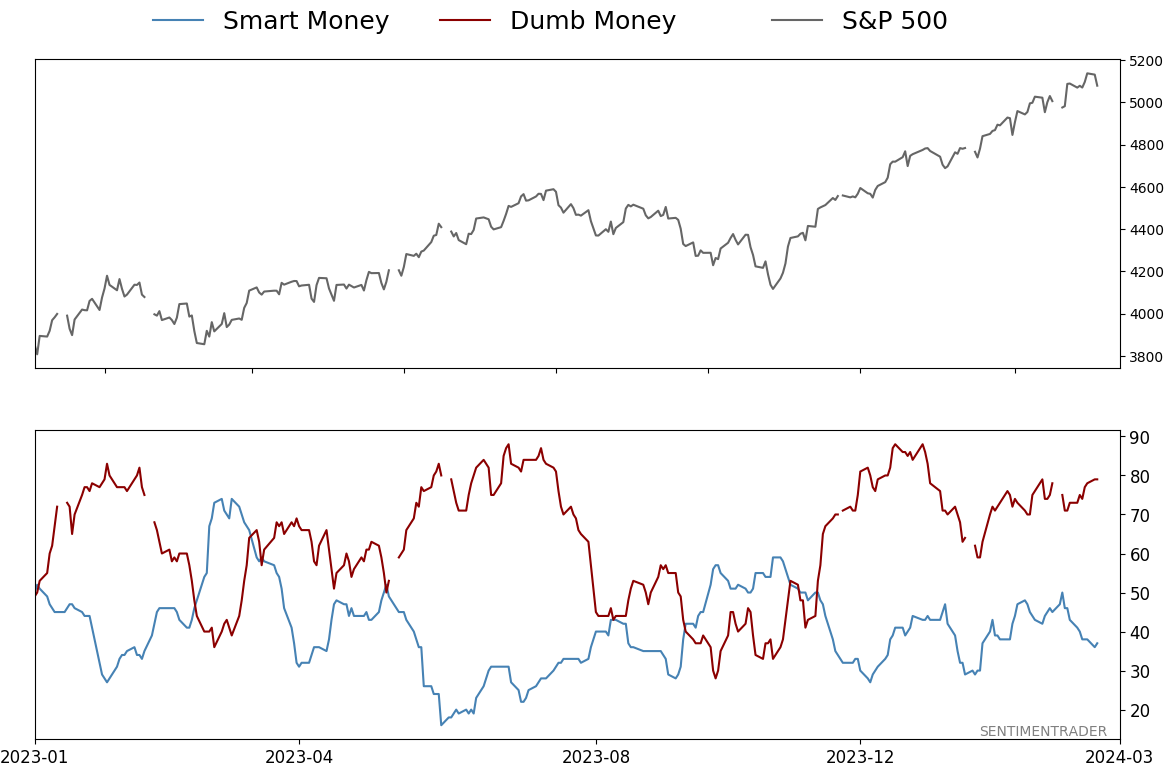
Smart / Dumb Money Confidence
|
Smart Money Confidence: 37%
Dumb Money Confidence: 79%
|
|
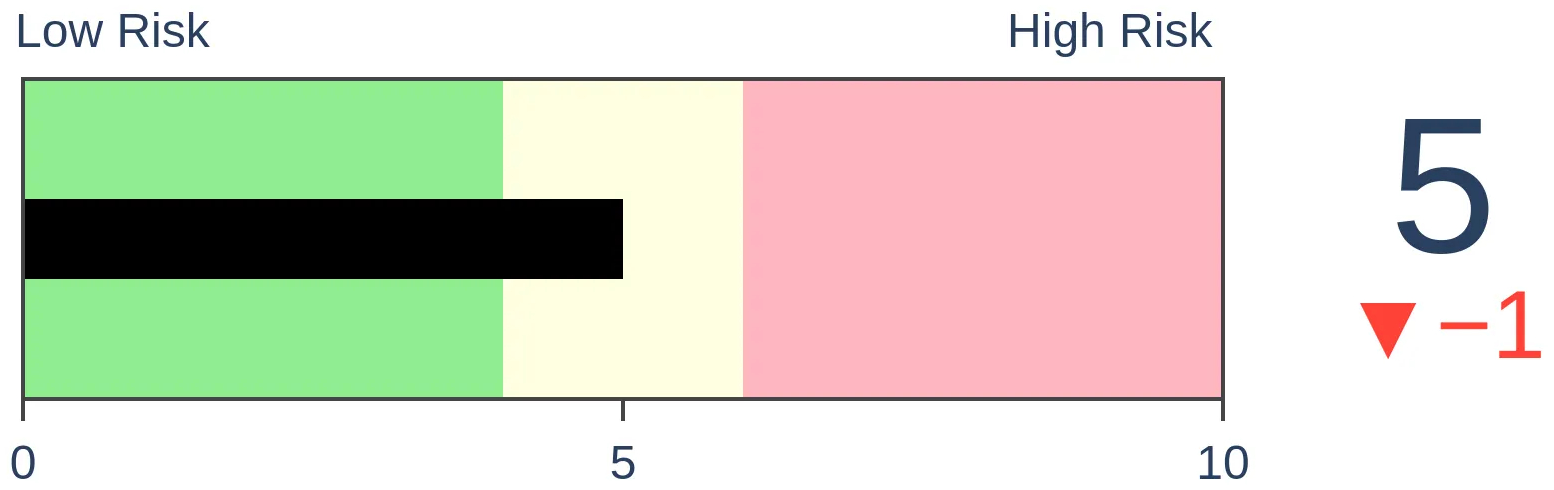
Risk Levels
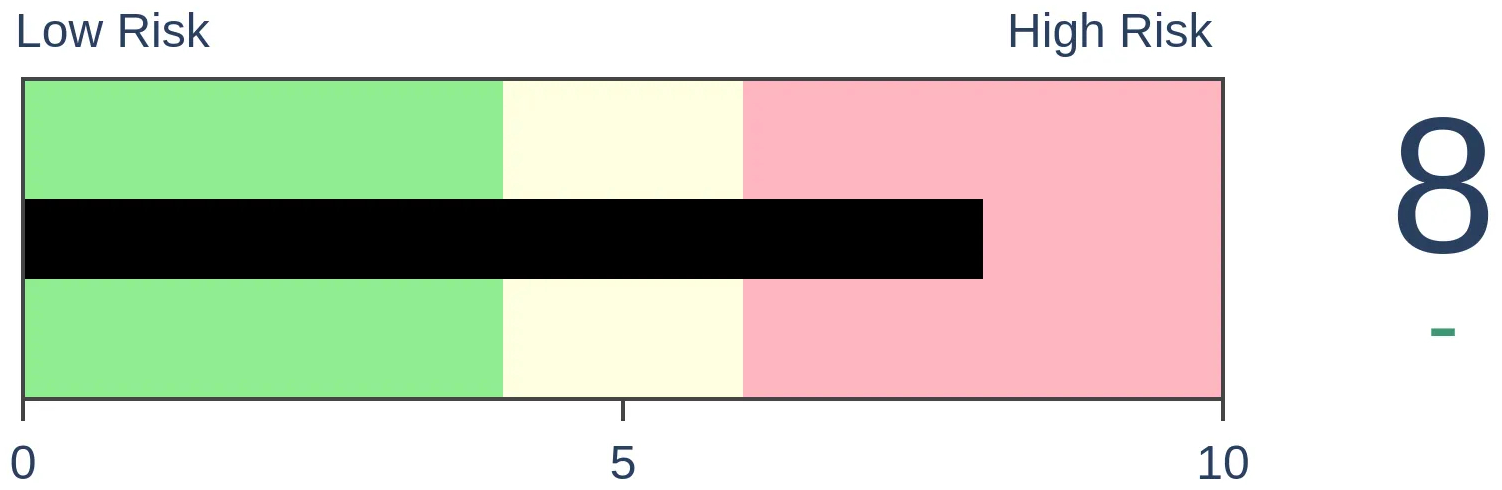
Stocks Short-Term
|
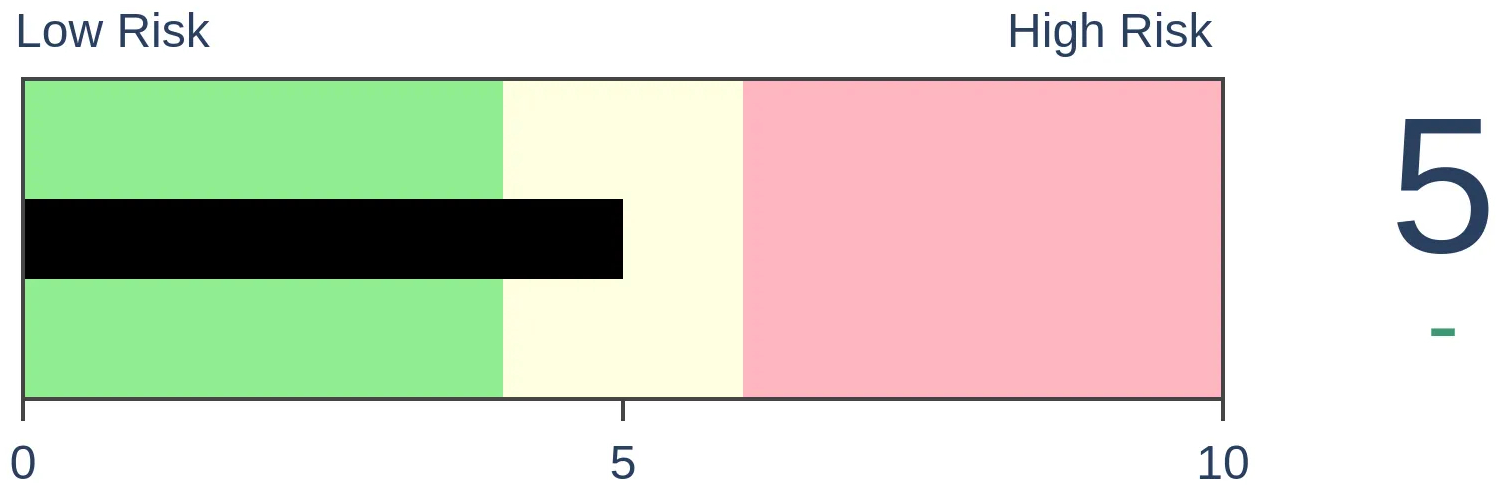
Stocks Medium-Term
|
|
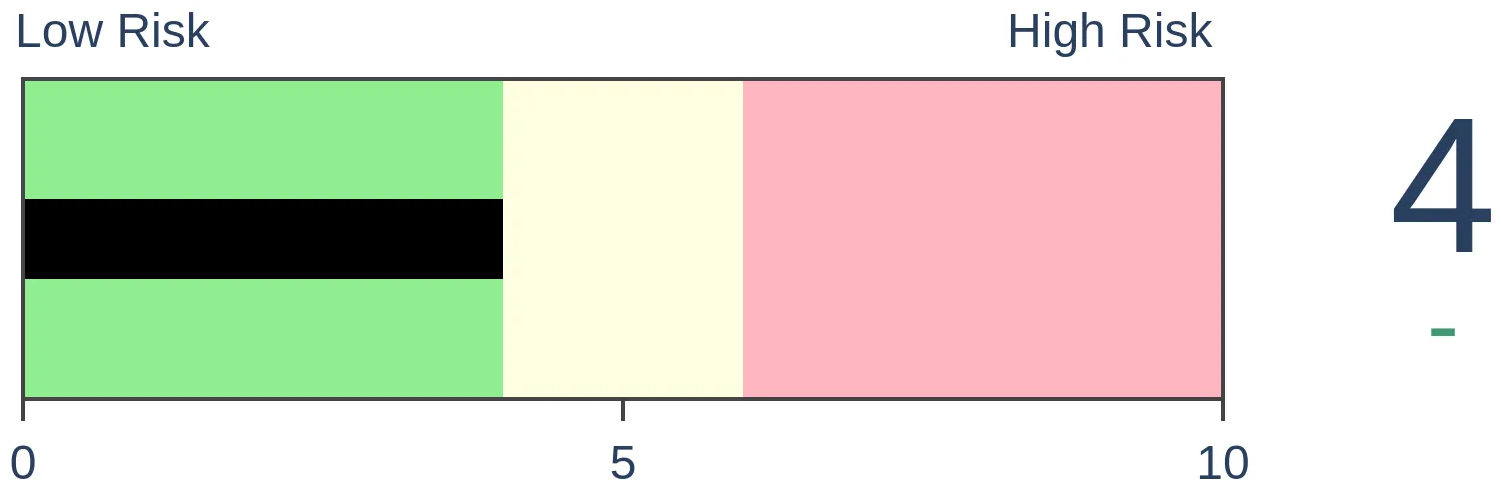
Bonds

|
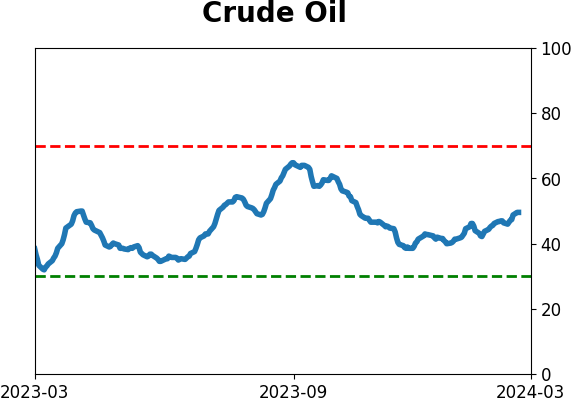
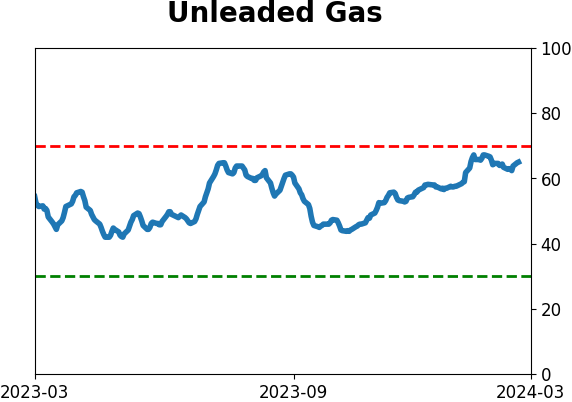
Crude Oil
|
|
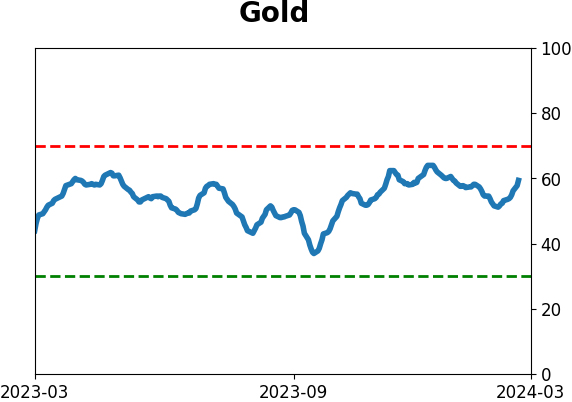
Gold
|
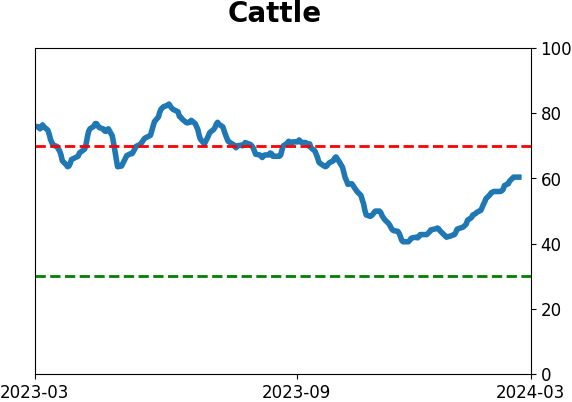
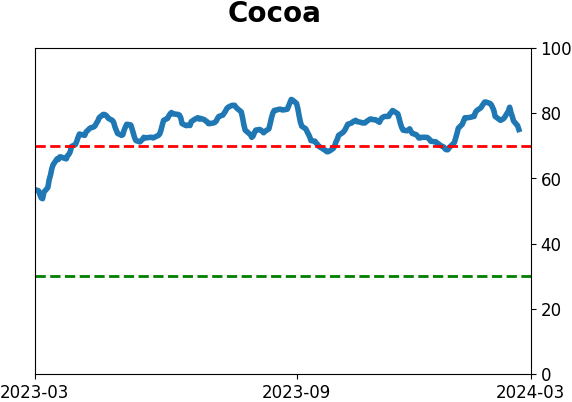
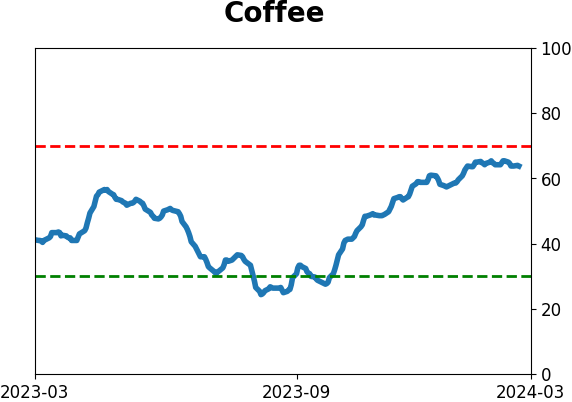
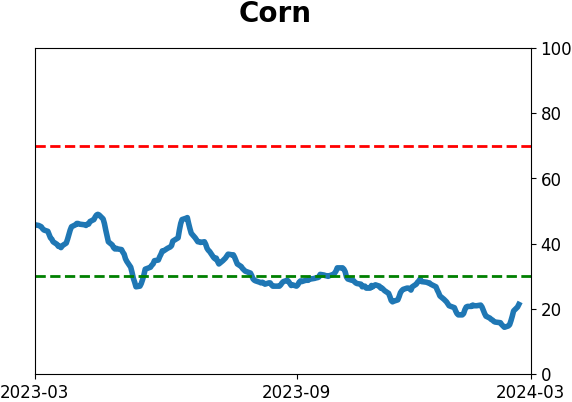
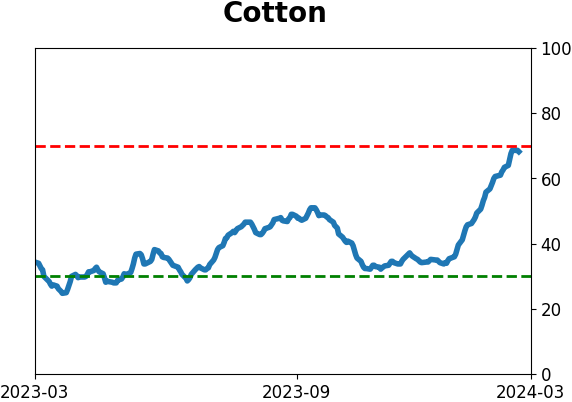
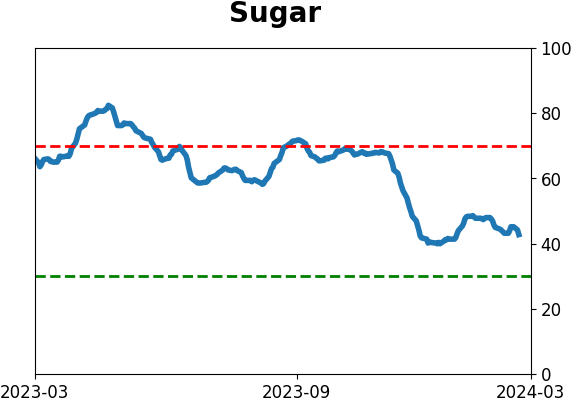
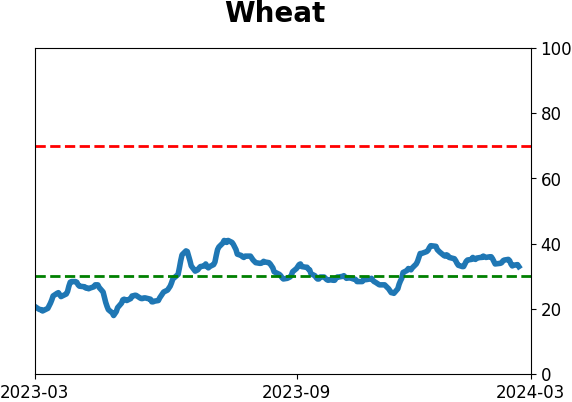
Agriculture

|
|
Research
By Jason Goepfert
BOTTOM LINE
Over the past few weeks, the S&P 500 has shown a high positive correlation to the Enthusiasm phase of a Typical Sentiment Cycle. It has also shown a high negative correlation to the Panic phase. Similar behavior preceded some rocky returns over the next couple months, but mostly good returns long-term.
FORECAST / TIMEFRAME
None
|
Key points:
- Stocks are showing a high correlation to the Enthusiasm phase of a Typical Sentiment Cycle
- At the same time, there is a high negative correlation to the Panic phase, as has been the case for 3 weeks now
- Similar behavior preceded "meh" returns over the medium term, but good ones in the longer term
If this sentiment cycle follows most others, investors are showing high Enthusiasm
A year ago, investors were still trying to shake off the misery of 2022. By that point in the rally, they were finally getting to the point of Returning Confidence, which was a good long-term sign for stocks.
This is based on a Typical Sentiment Cycle and has served as a good guide over the years. Even though stocks had a good year in 2023, a summer lull was enough to trigger panic, which subsided by December. Again, a good sign for stocks.
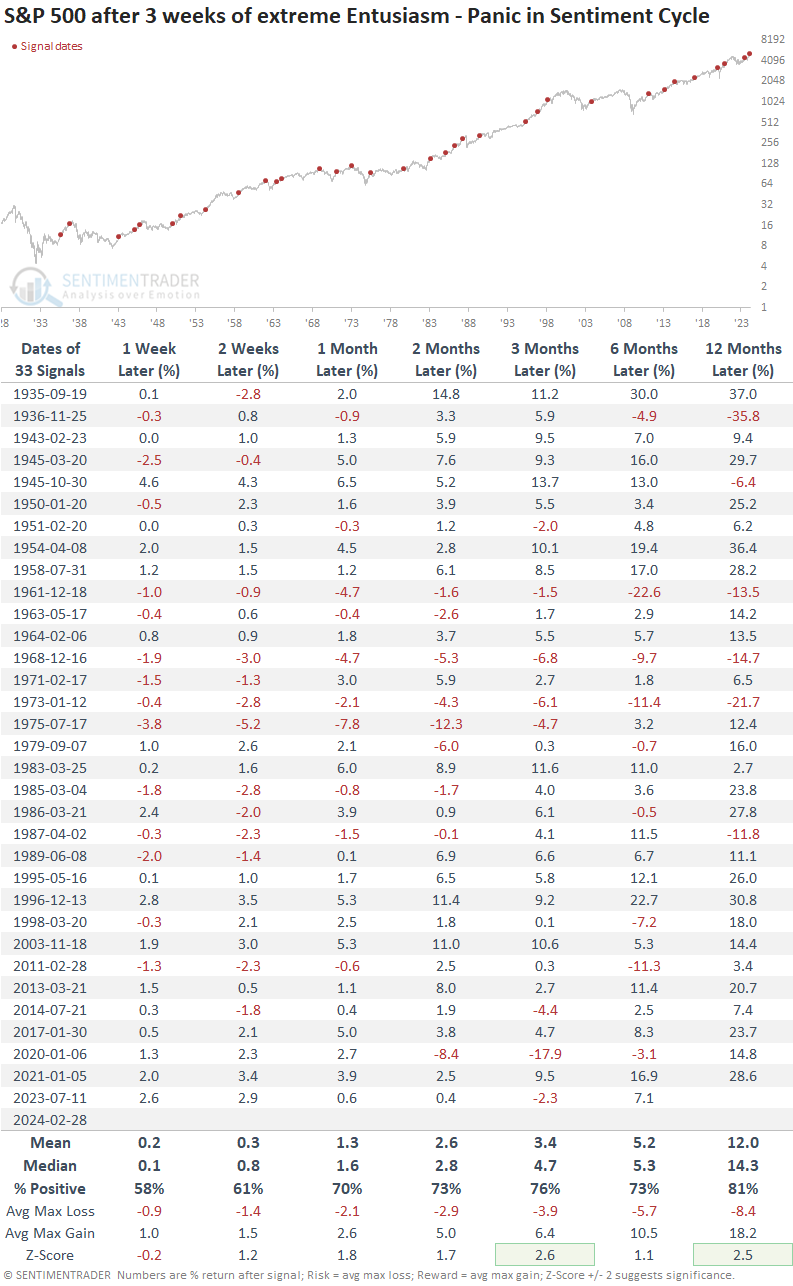
Over the past 18 weeks, the straight-up rally has moved us to an interesting juncture in the Sentiment Cycle. For the past few weeks, the S&P 500 has demonstrated a high positive correlation to the Enthusiasm part of the Cycle and a highly negative correlation to the Panic phase.
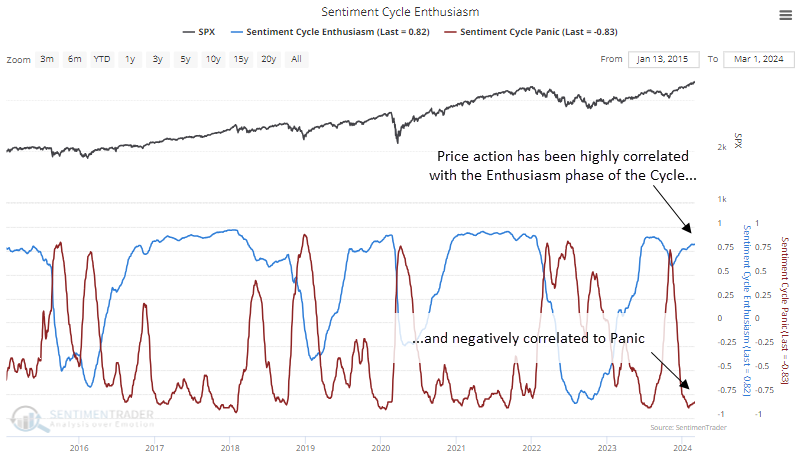
This behavior has been persistent, with the Enthusiasm correlation holding above +0.8 for fifteen consecutive days and the Panic correlation below -0.8 over the same stretch.
The table below shows all other times the correlations were this extreme simultaneously for three straight weeks. Overall, returns in the S&P 500 were above average, though its consistency was just a bit better than random, and the risk/reward ratio was ho-hum.
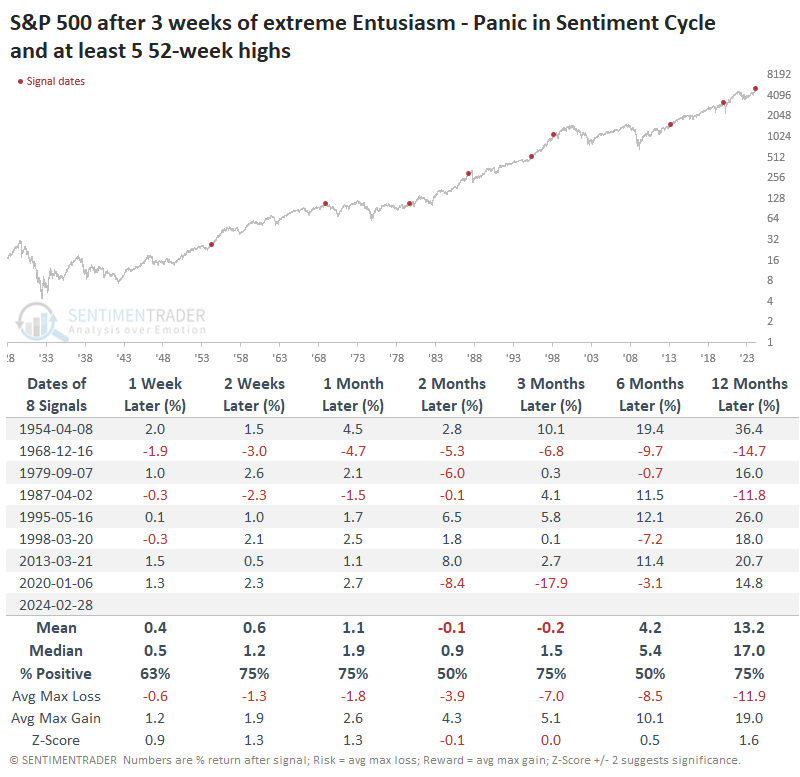
One difference with our current situation is that the S&P has repeatedly hit new highs during the past few weeks. So, the table below filters the signals to only include those times when the index reached at least five 52-week highs within the past three weeks of extreme correlations.
After these signals, we can see a rockier path over the next 2-3 months. In 1954, 1995, and 2013, stocks continued to rocket higher without much of a pause. The other five instances suffered a medium-term pullback or showed only modest gains.
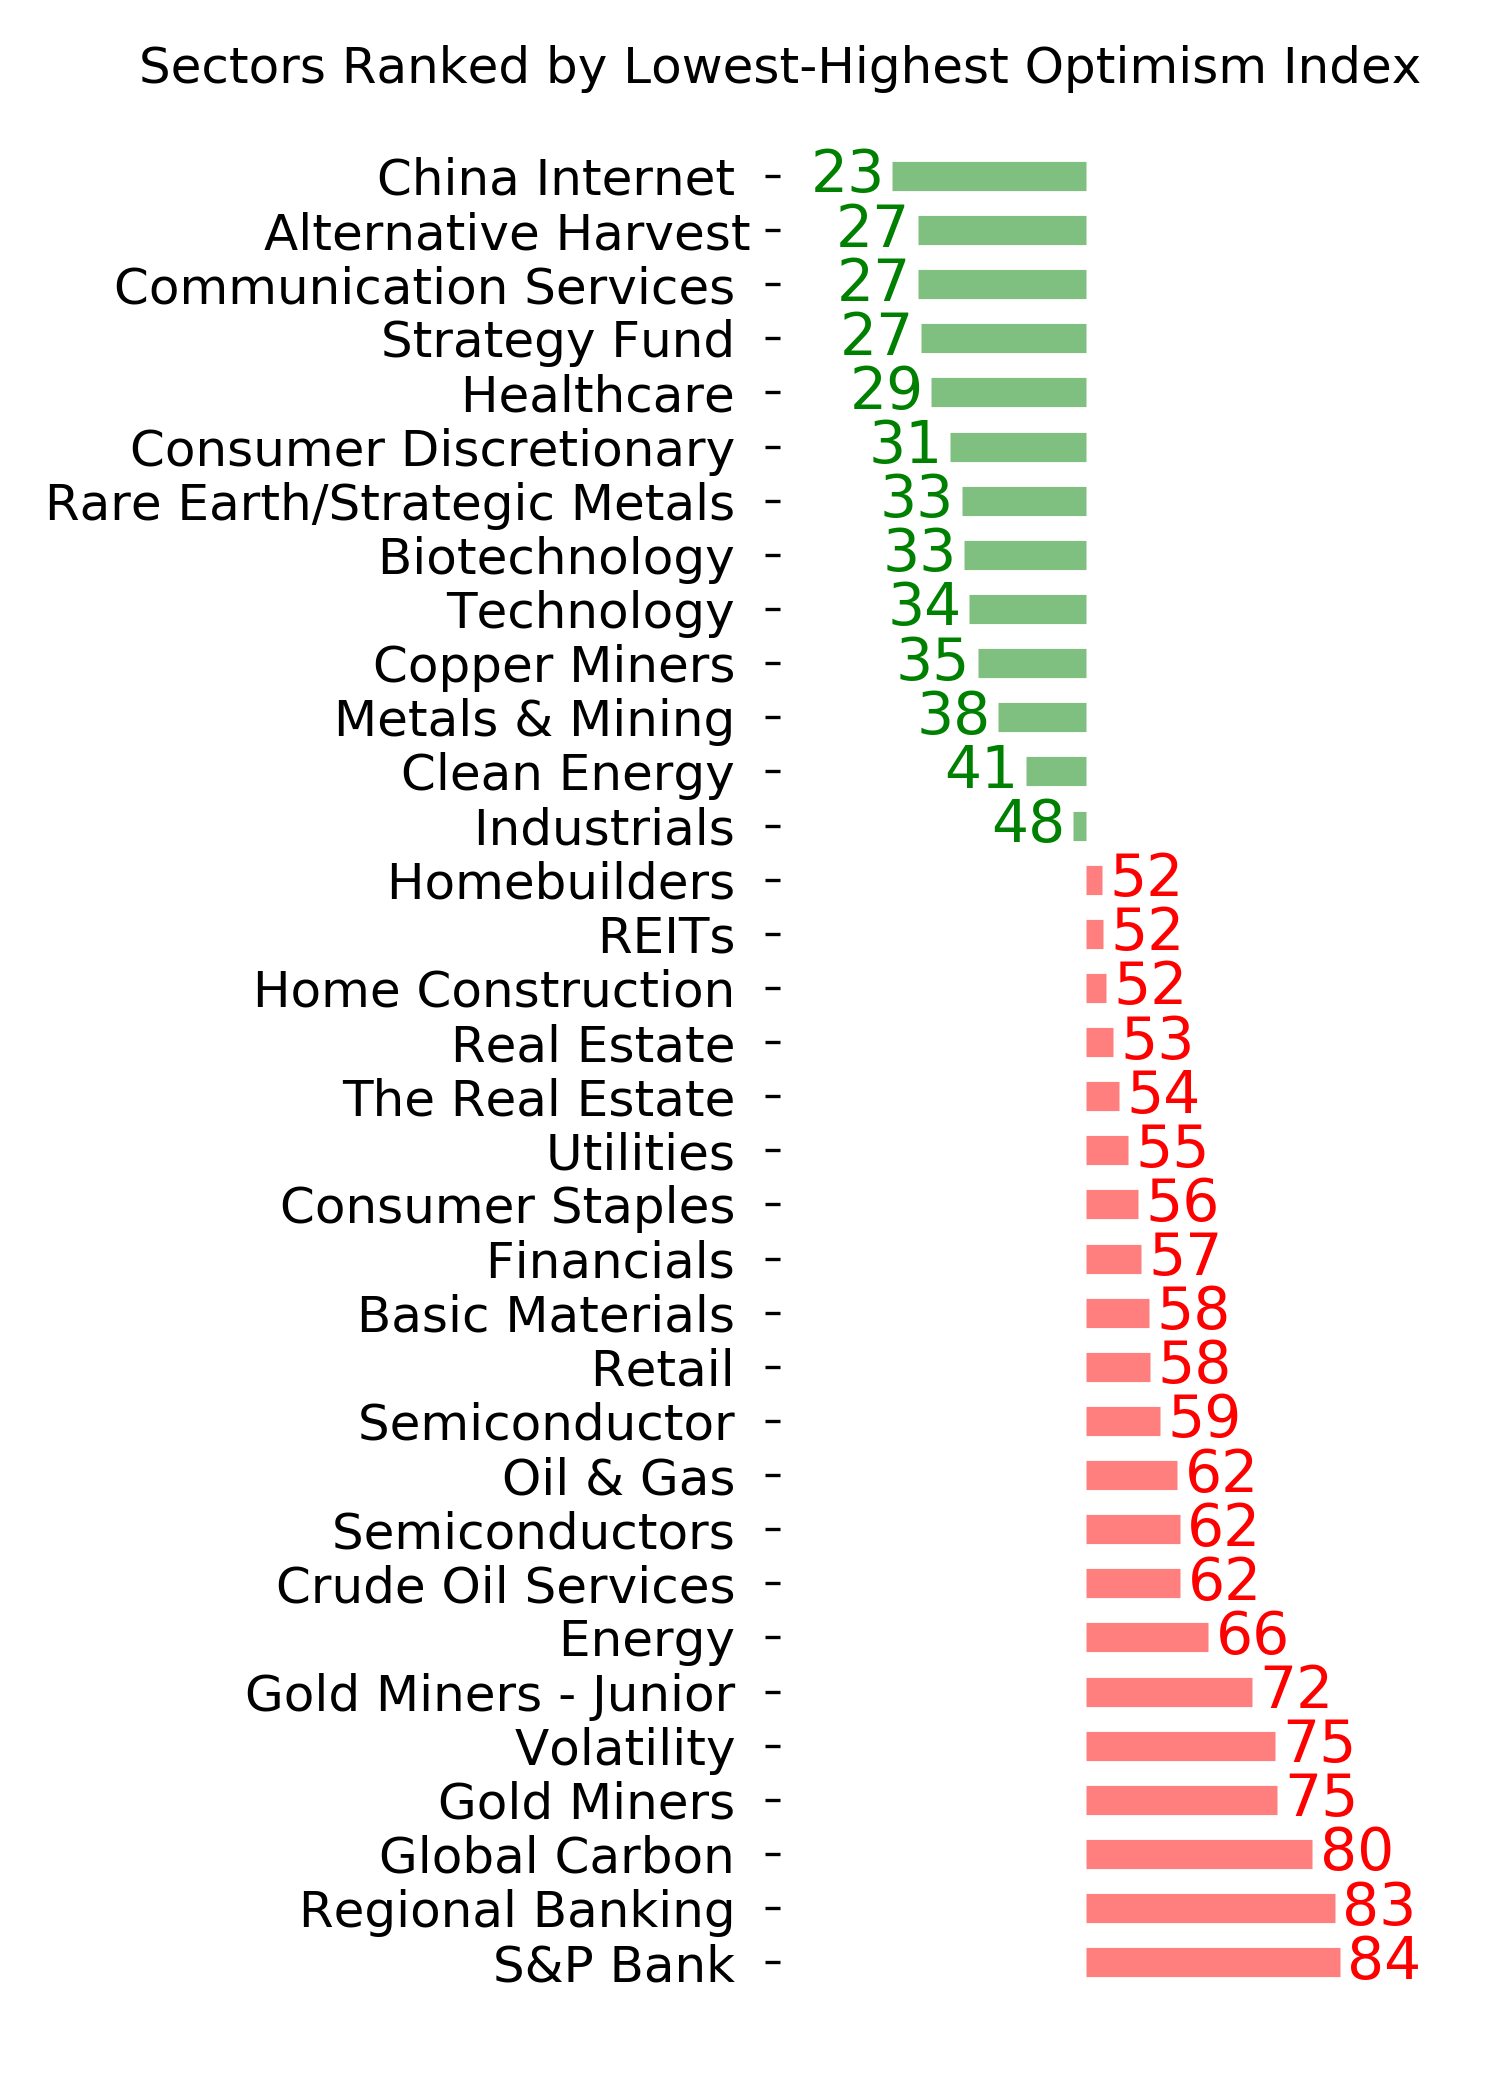
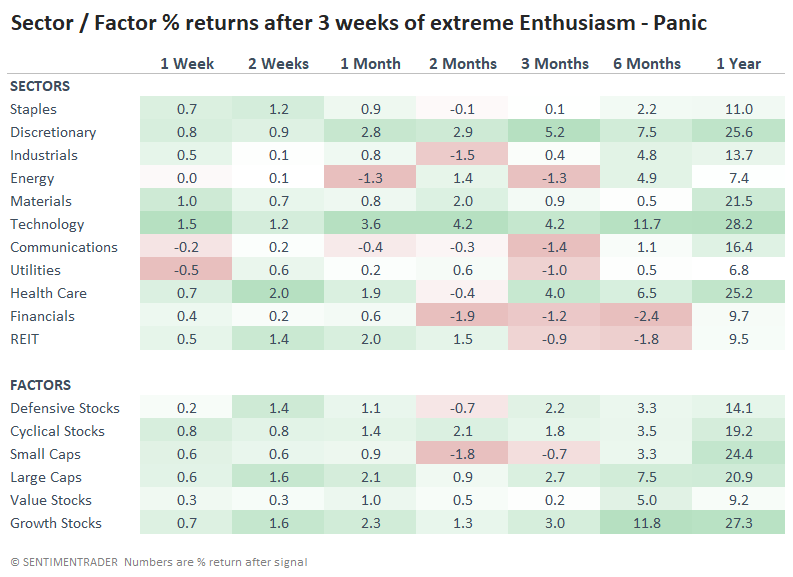
Perhaps surprisingly, the best-performing sectors and factors after several weeks of extreme Enthusiasm (and not Panic) were Technology and Growth stocks. They showed the most robust one-year returns, followed closely by Discretionary stocks.
What the research tells us...
Not everything is a contrary indicator. When we see something like a high correlation to the Enthusiasm phase of a Typical Sentiment Cycle, the skeptics among us are more likely to think that means lower forward returns. Historically, that hasn't been the case, at least over longer time frames.
That's because these are long-term indicators, and during prolonged bear markets, we just don't see price action persistent enough to trigger these correlations. The fact that we're seeing them now suggests that sentiment may be enthusiastic, but that's not necessarily a bad thing during bull markets.
Indicators at Extremes
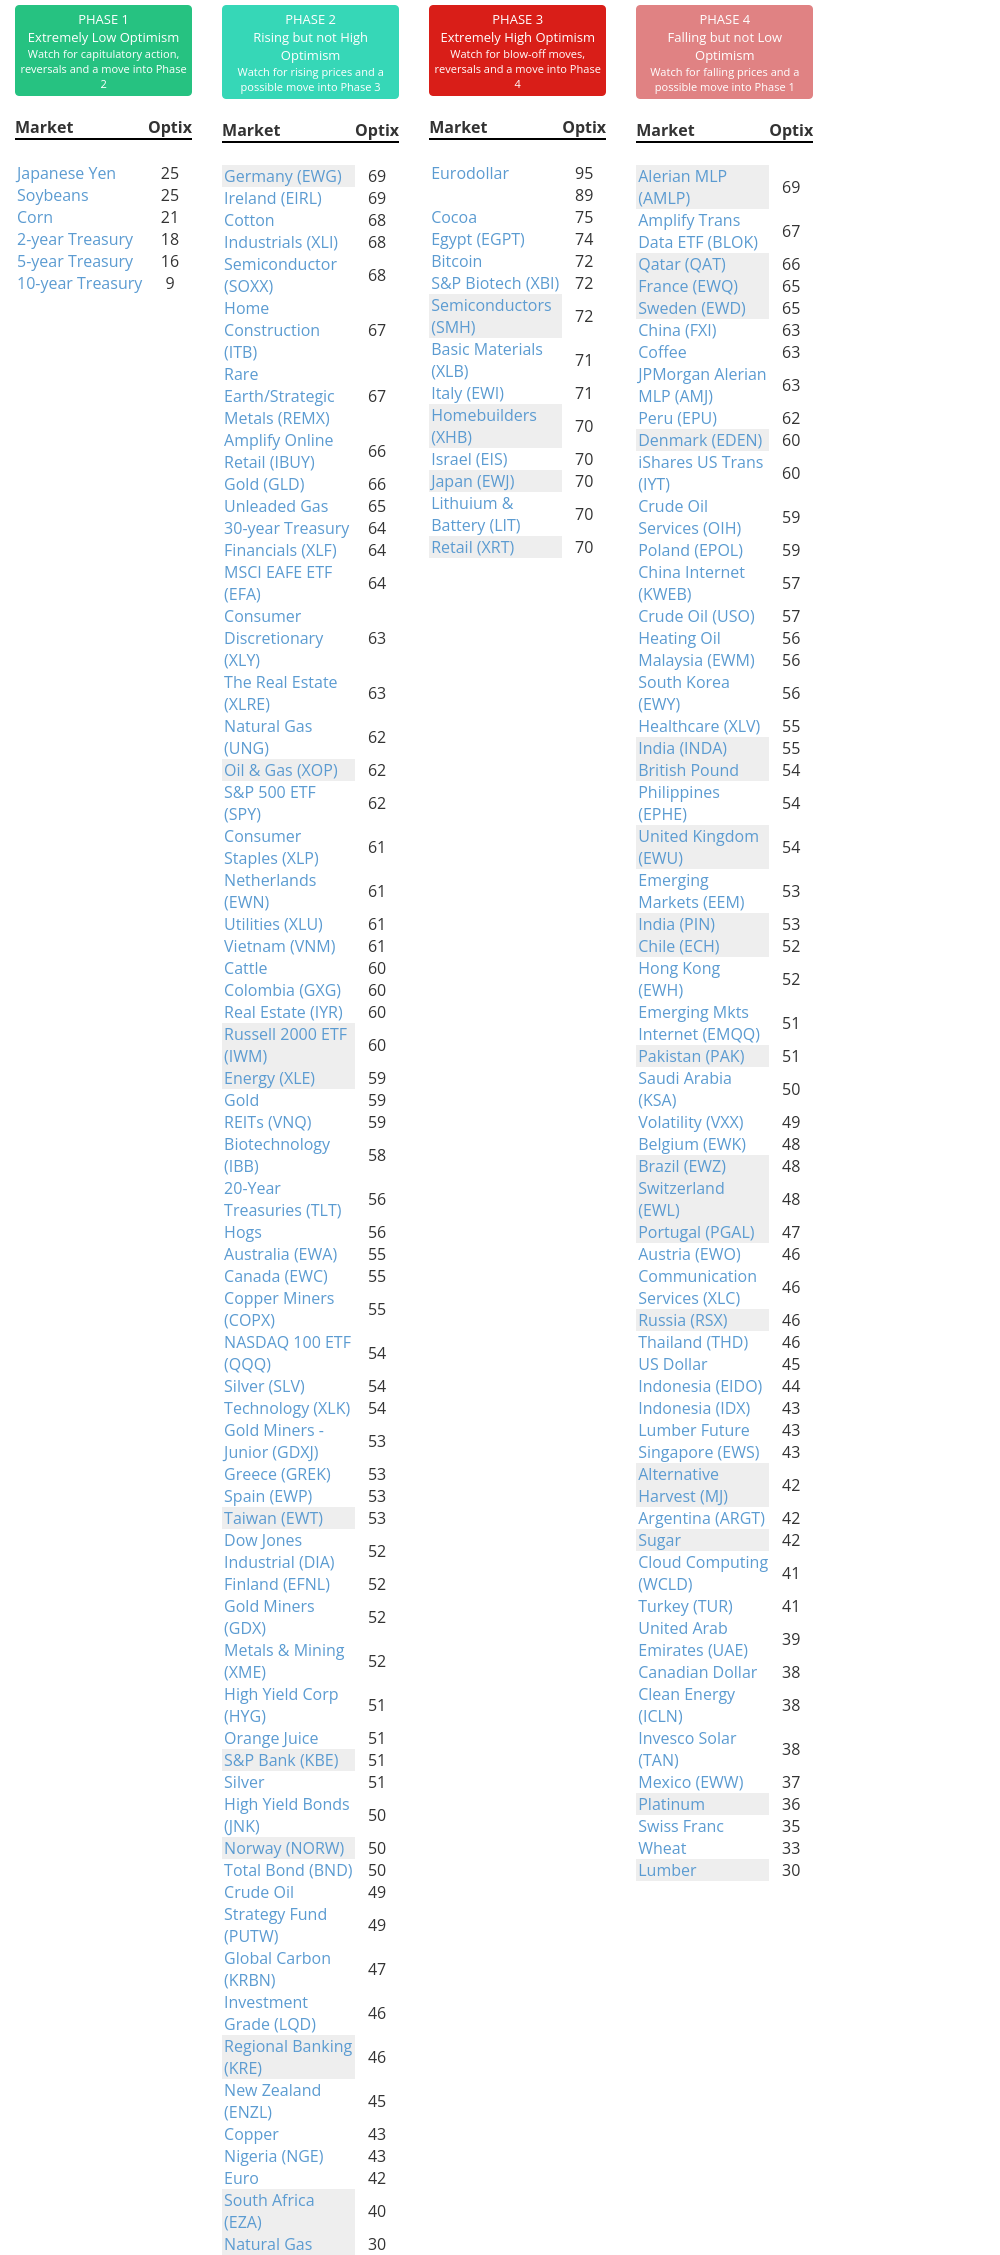
Phase Table
Ranks
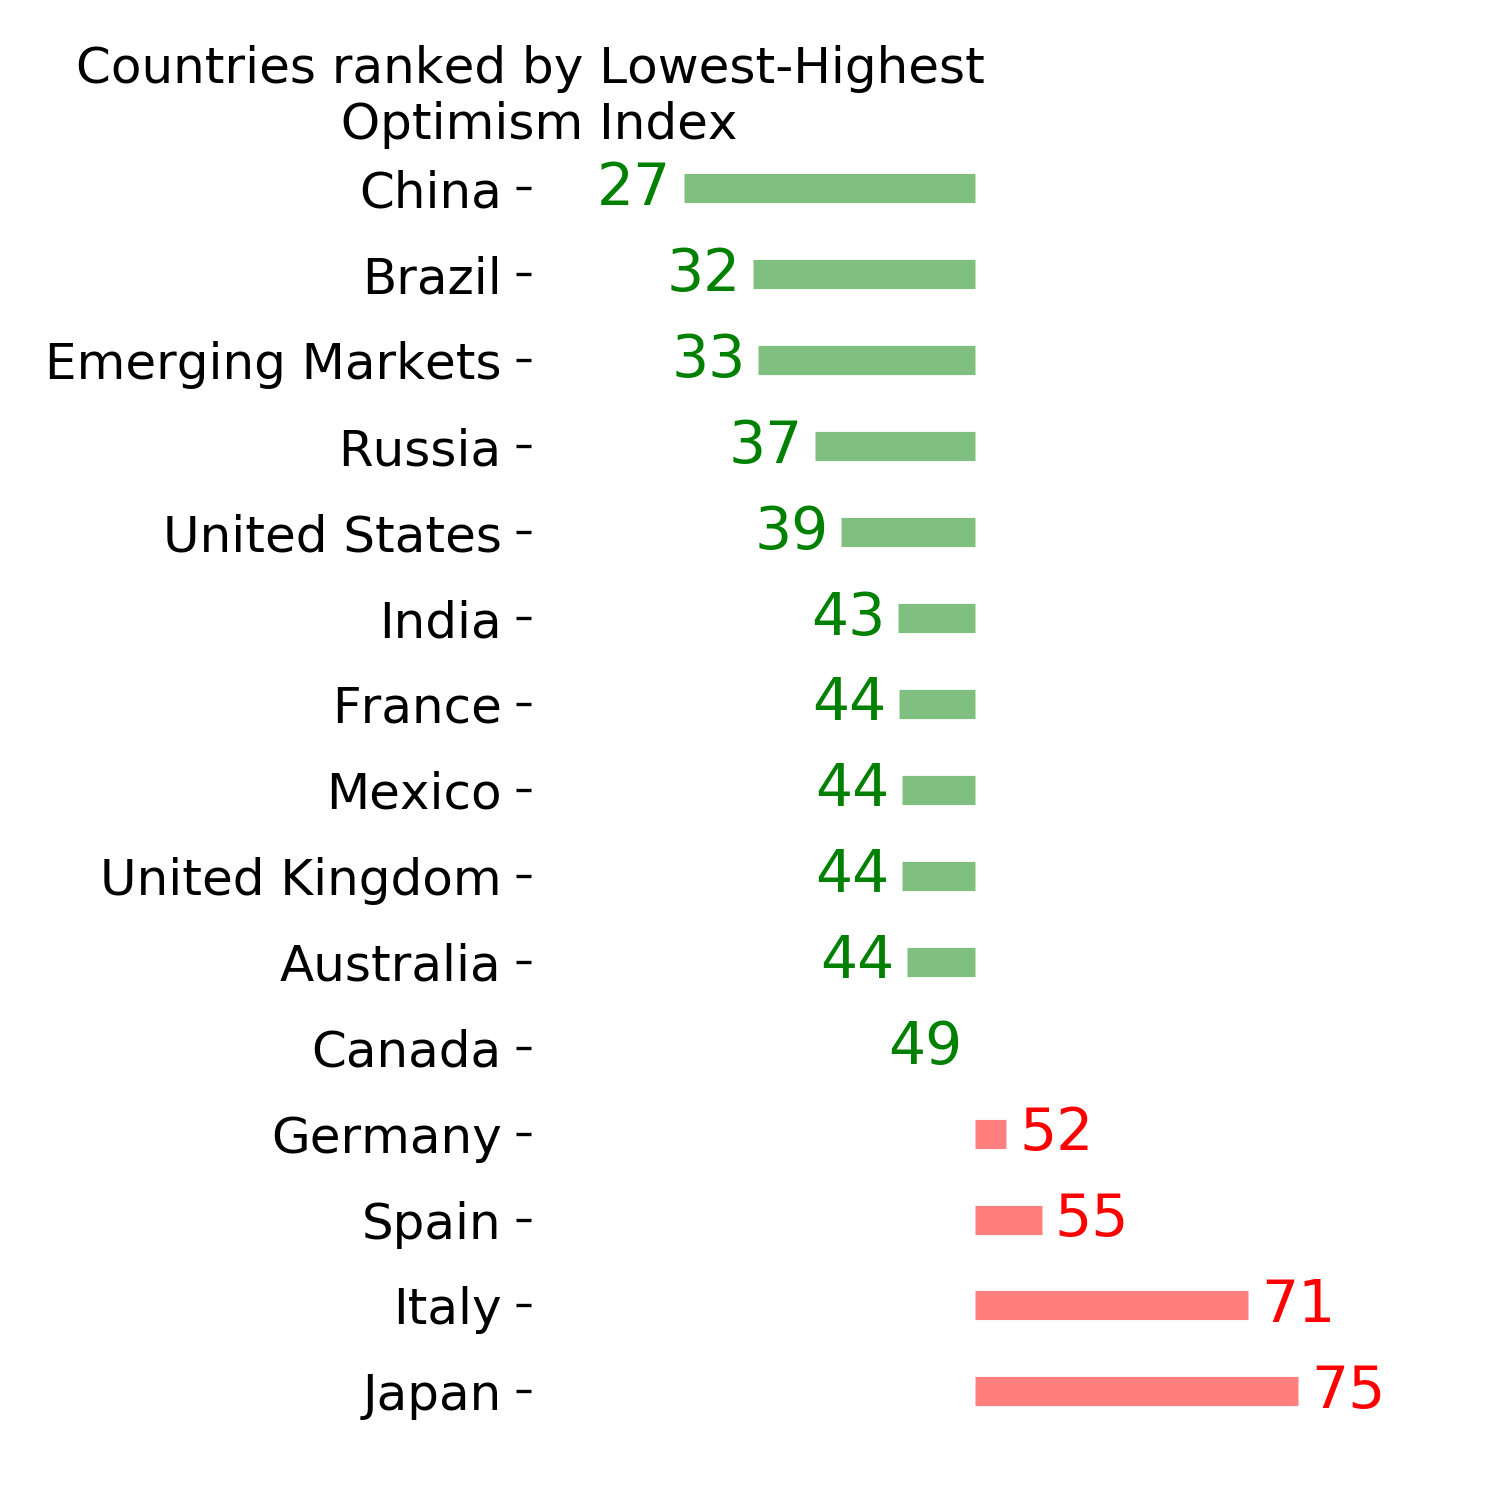
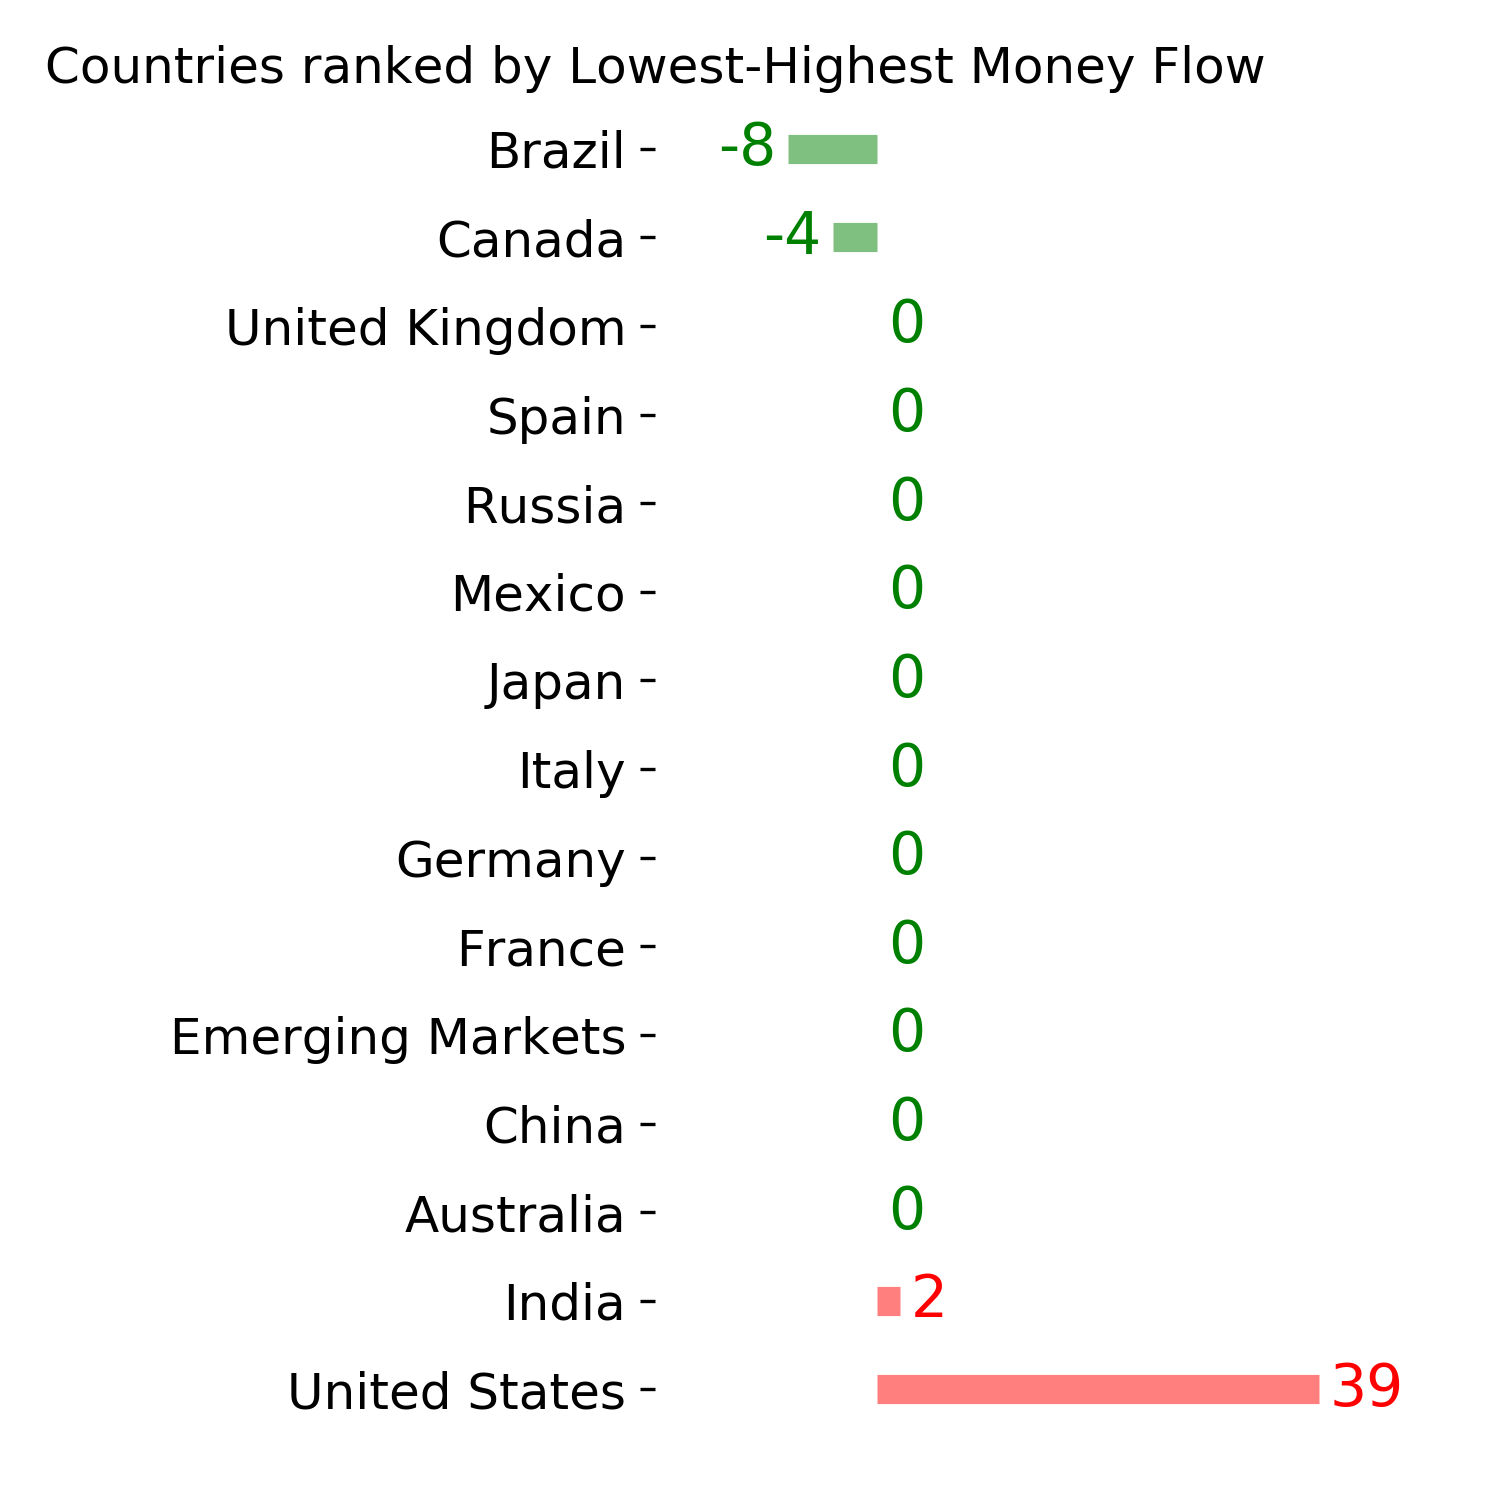
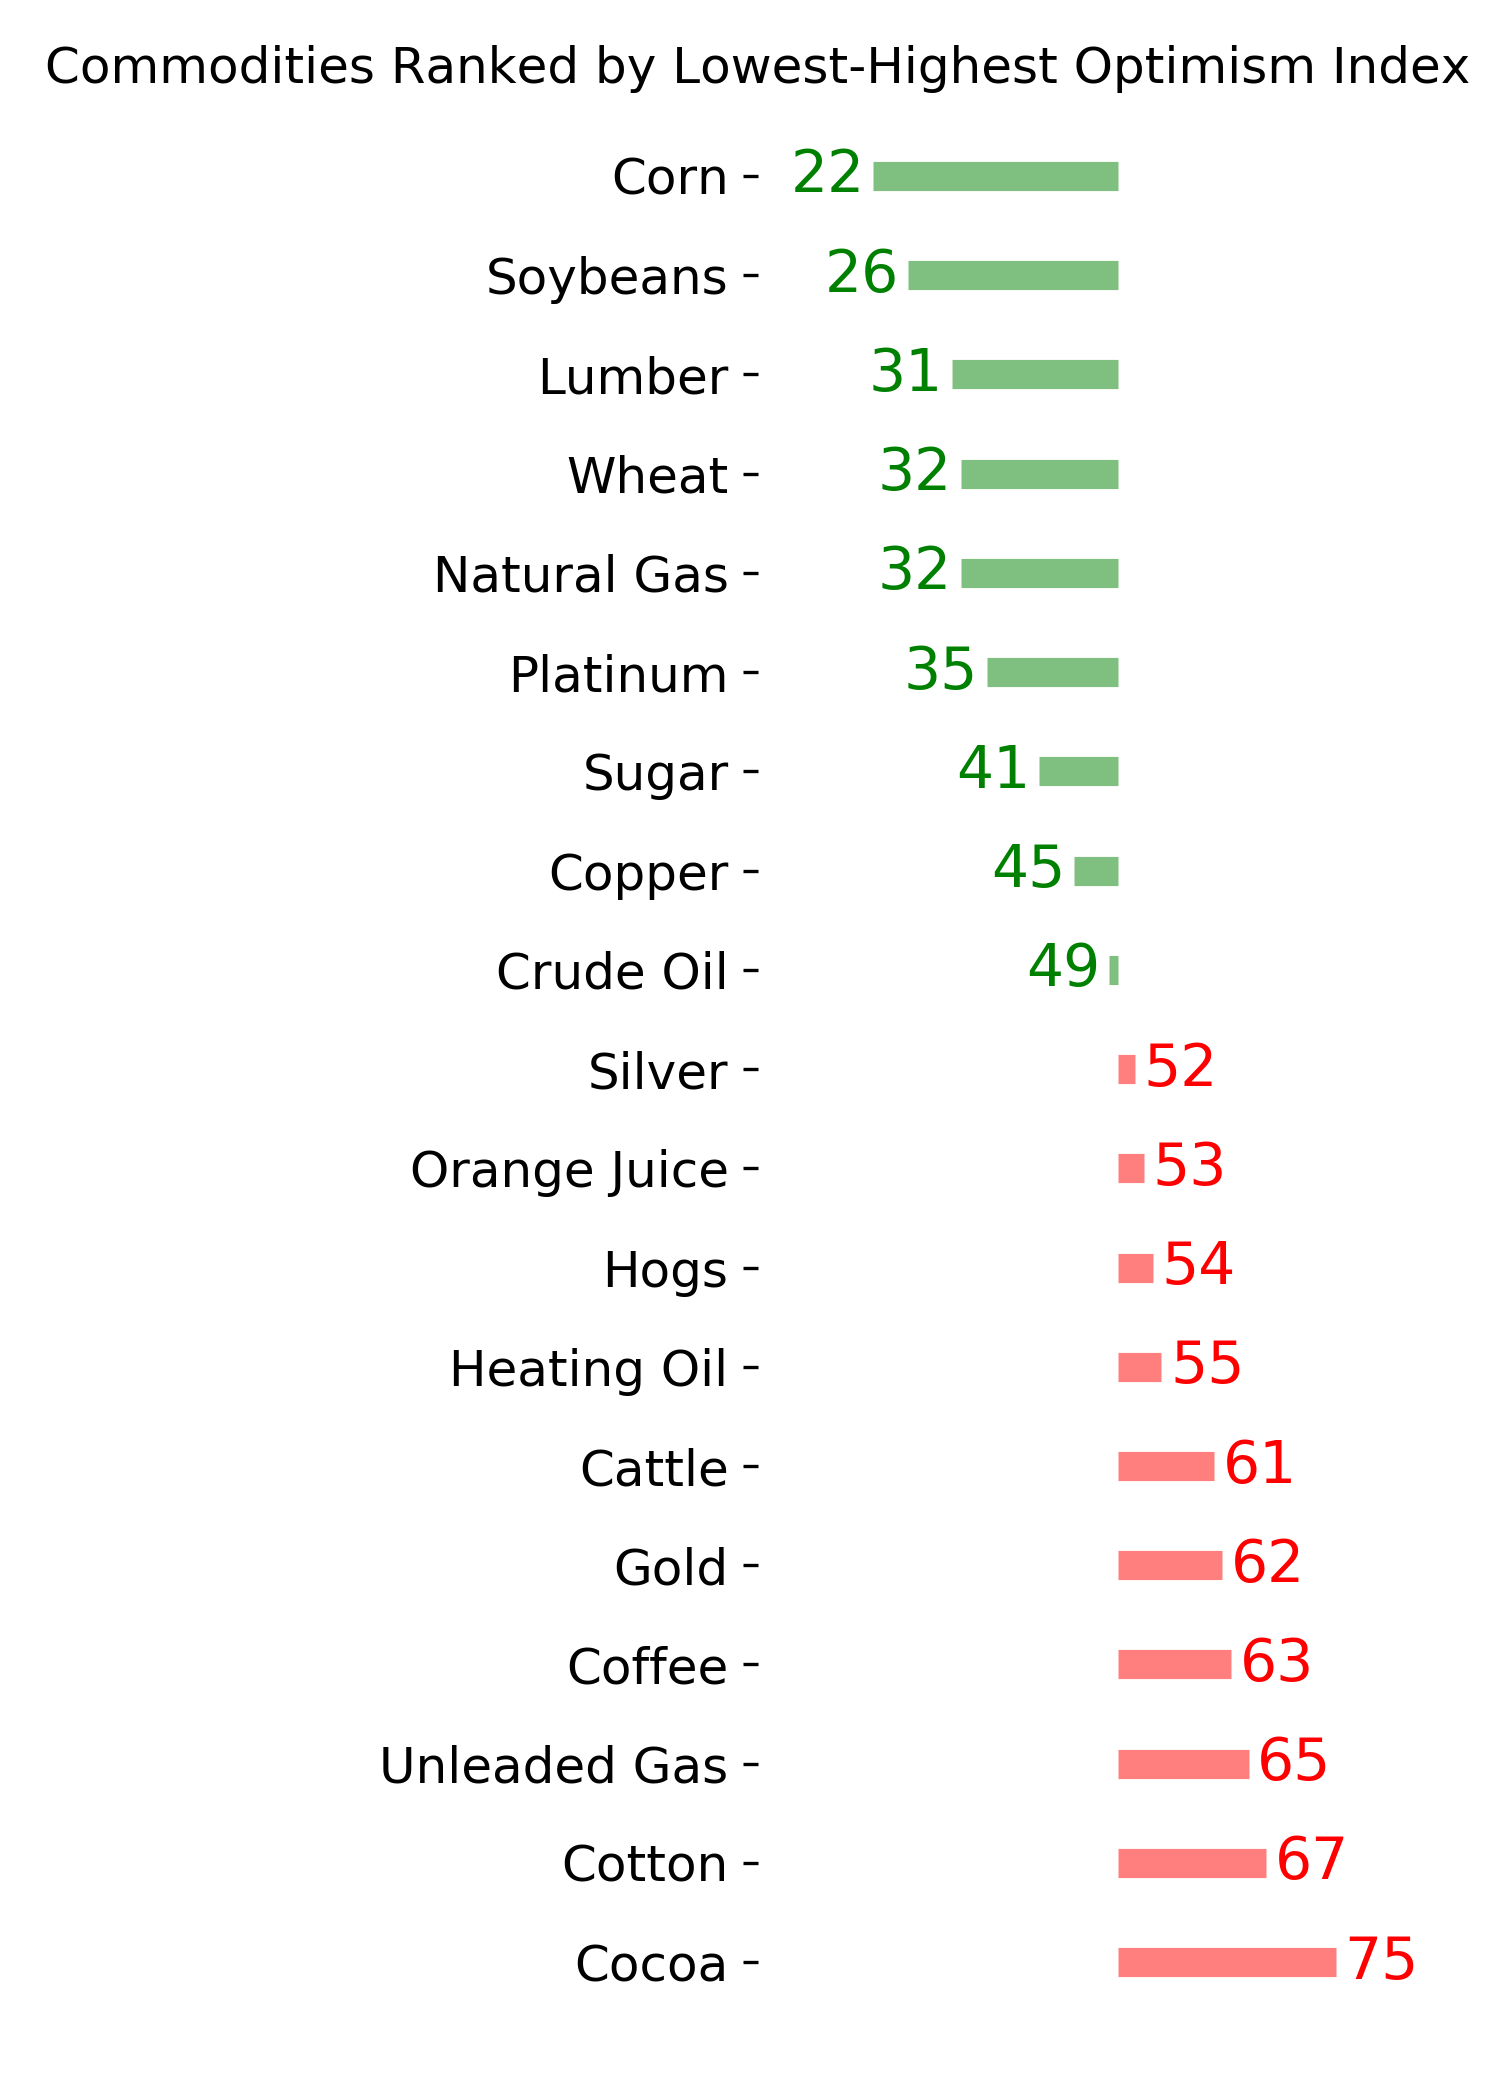
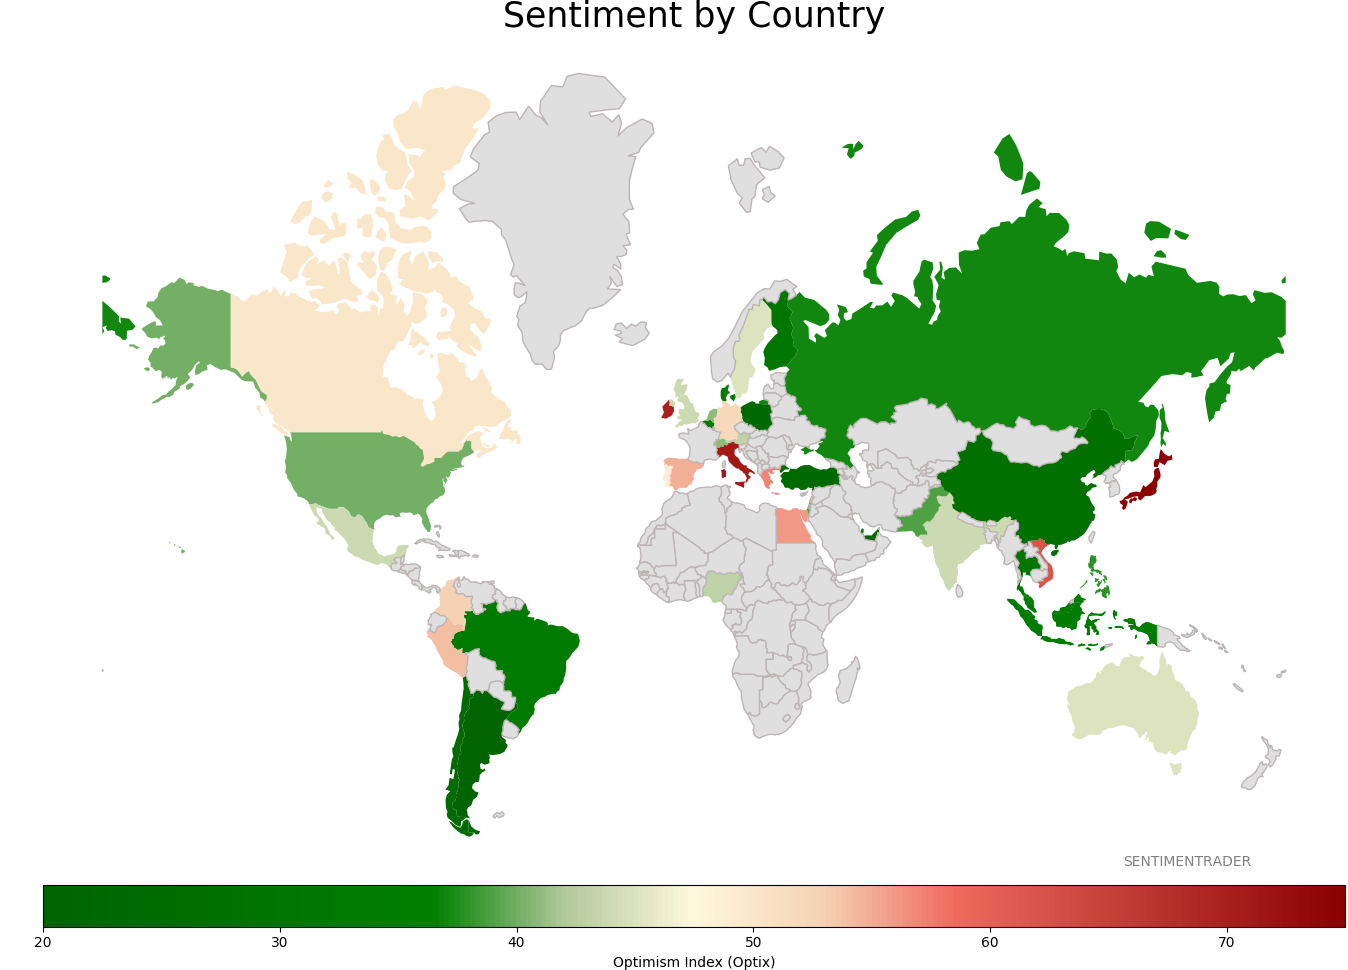
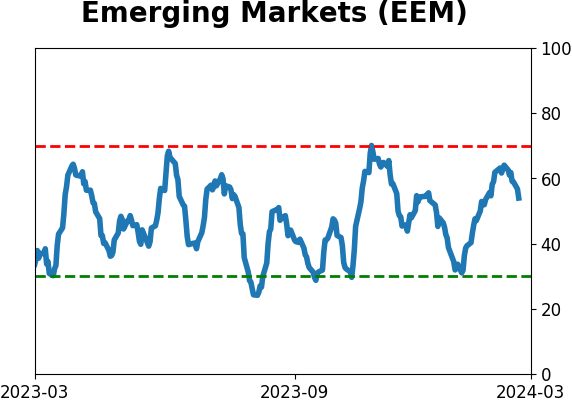
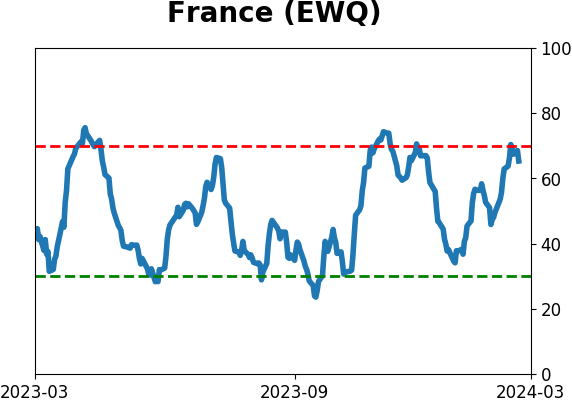
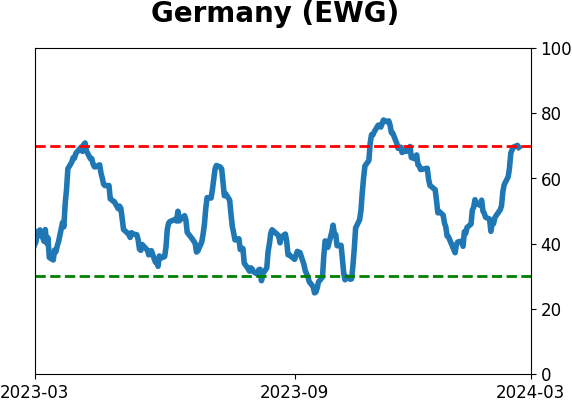
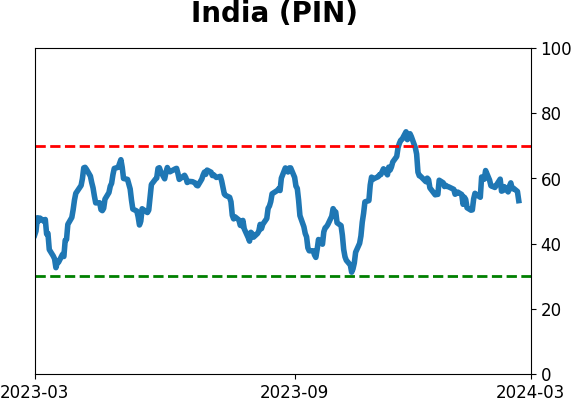
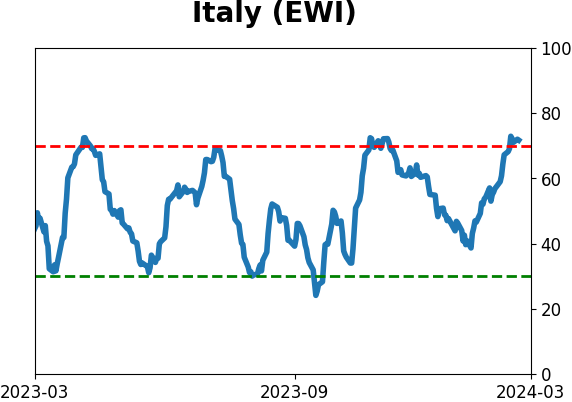
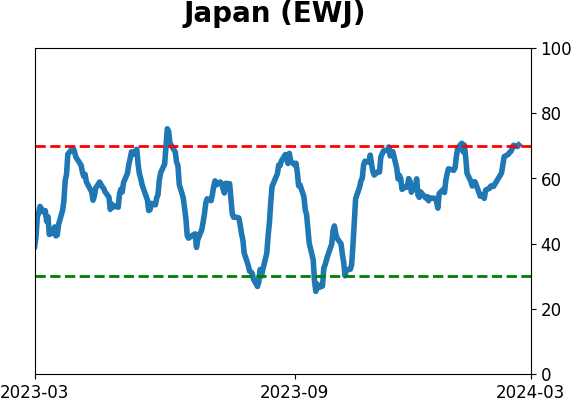
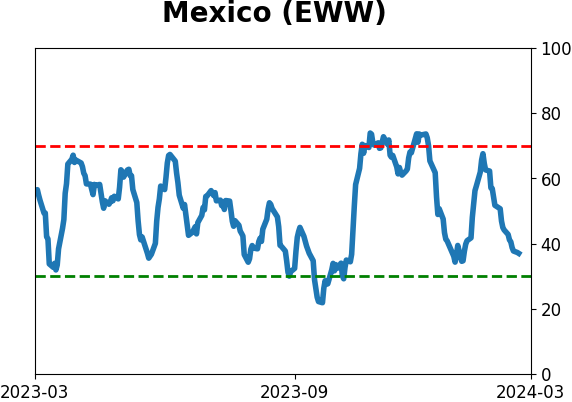
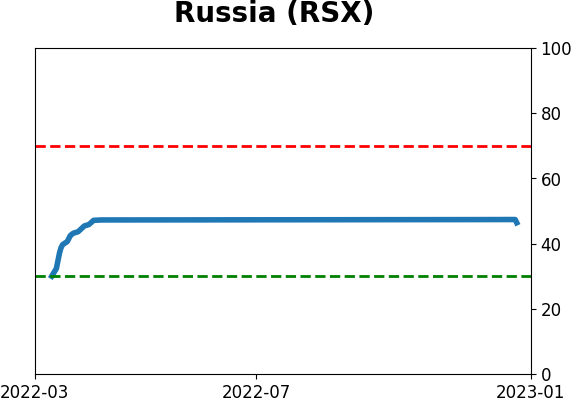
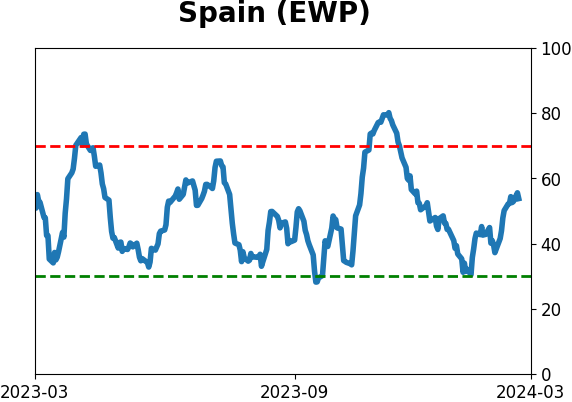
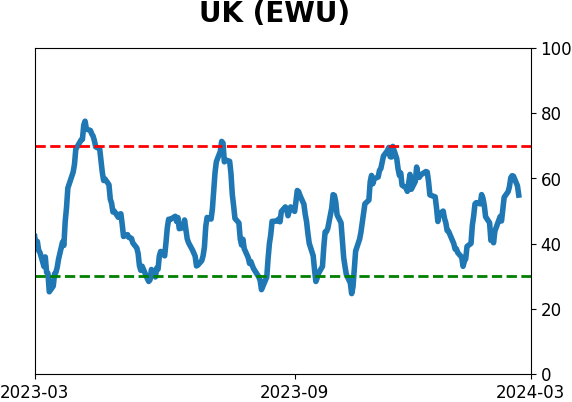
Sentiment Around The World
Optimism Index Thumbnails
|
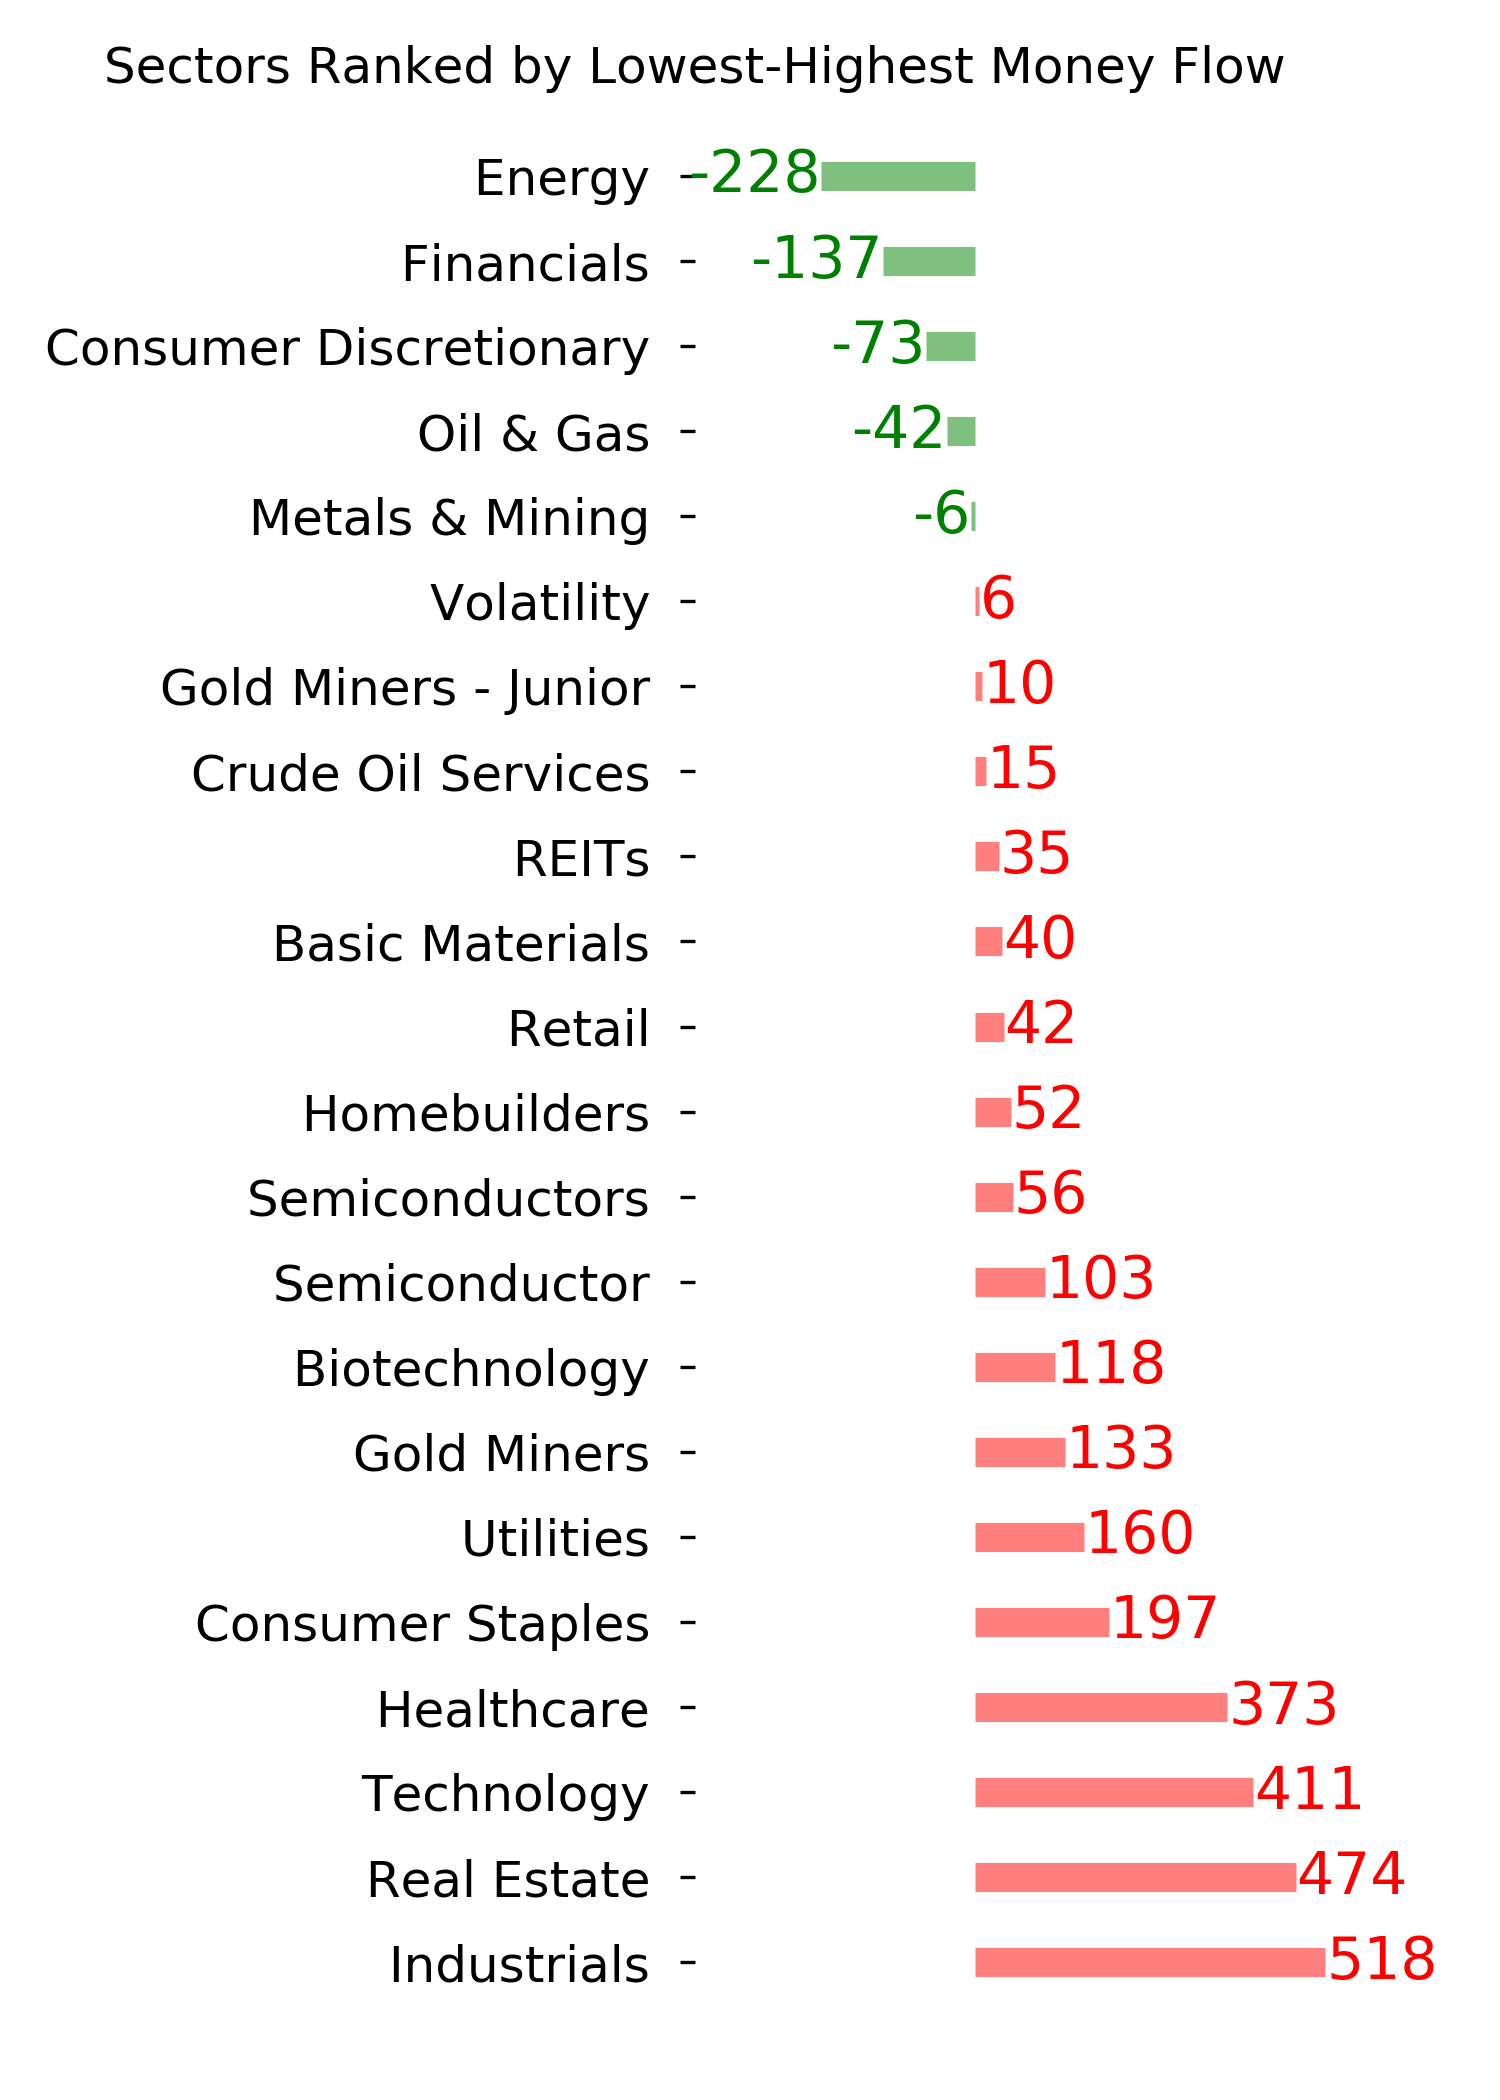
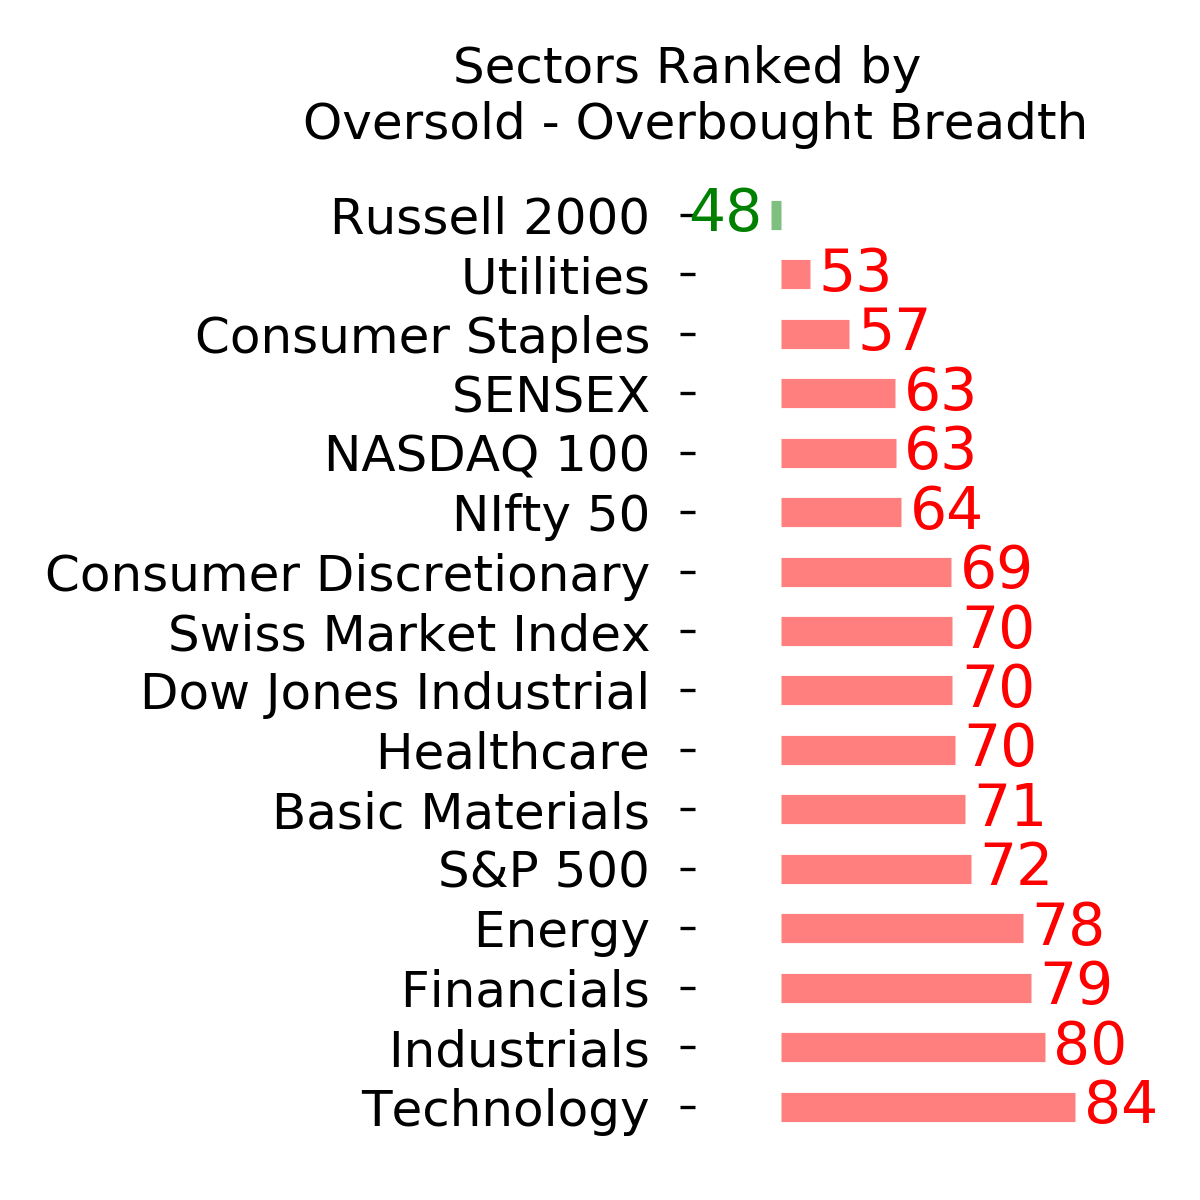
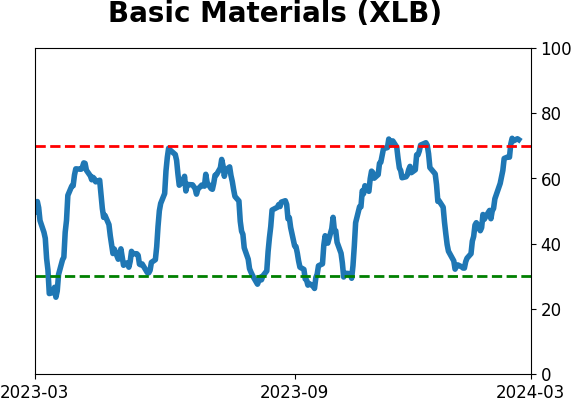
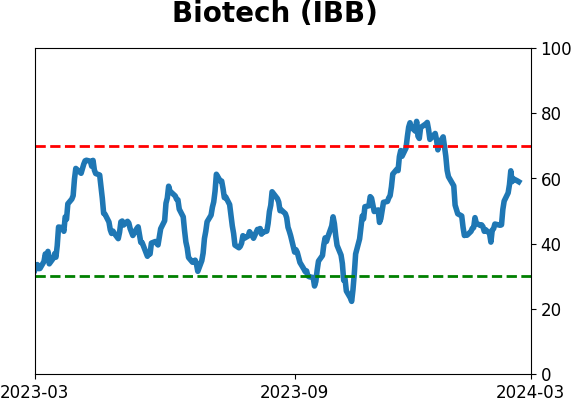
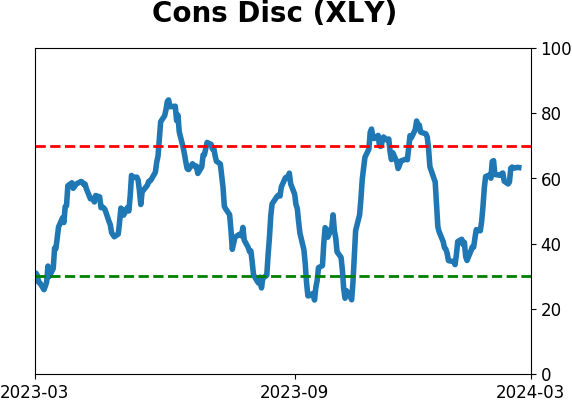
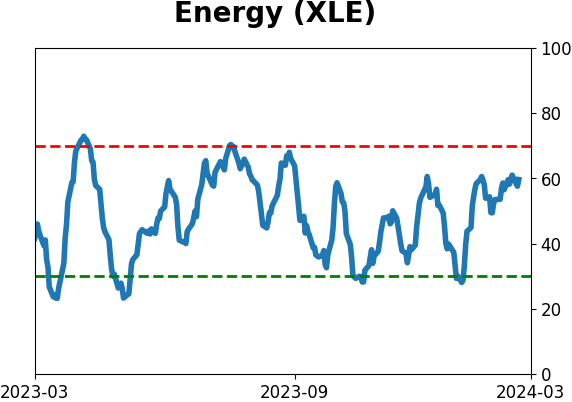
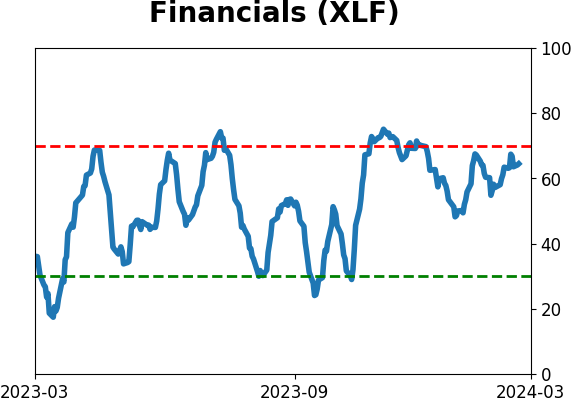
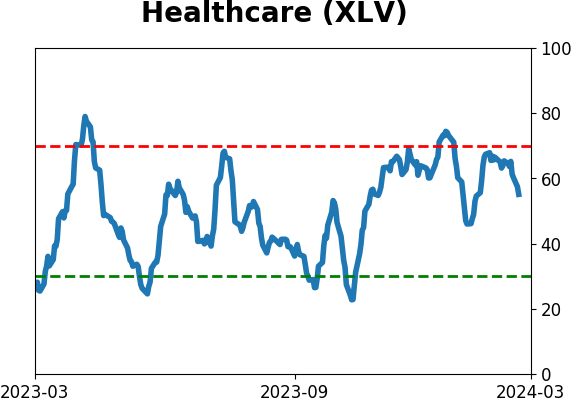
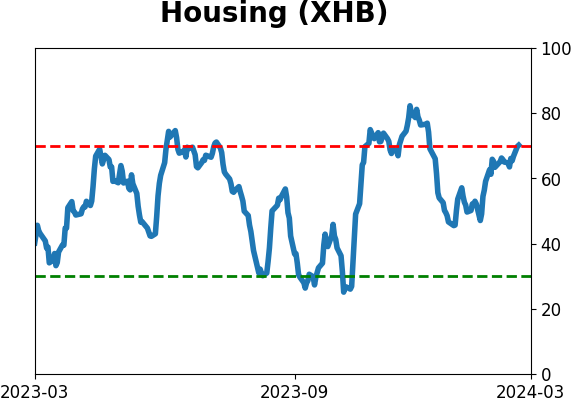
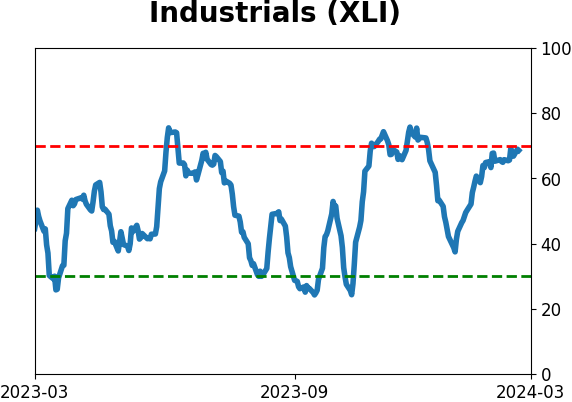
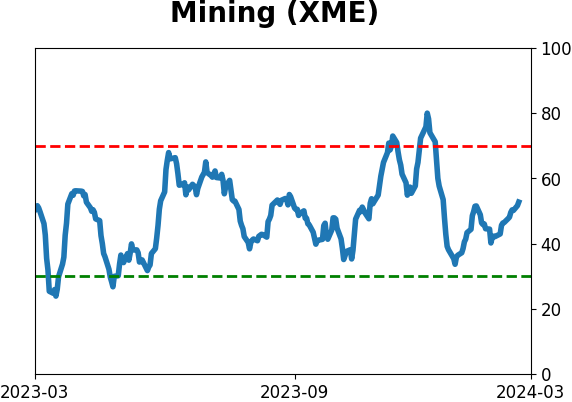
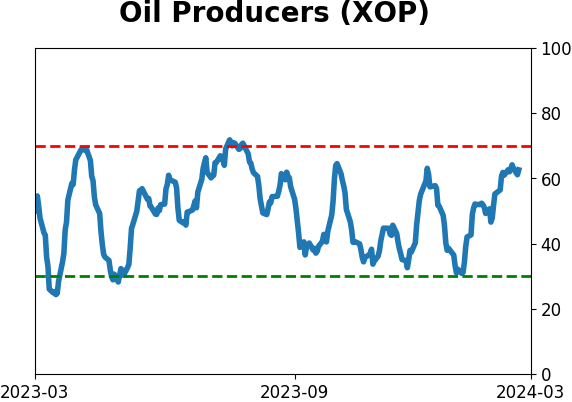
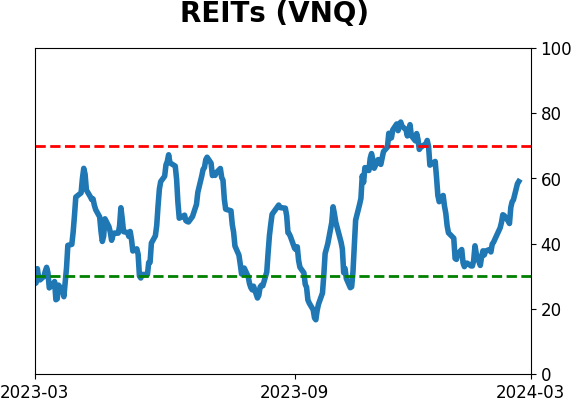
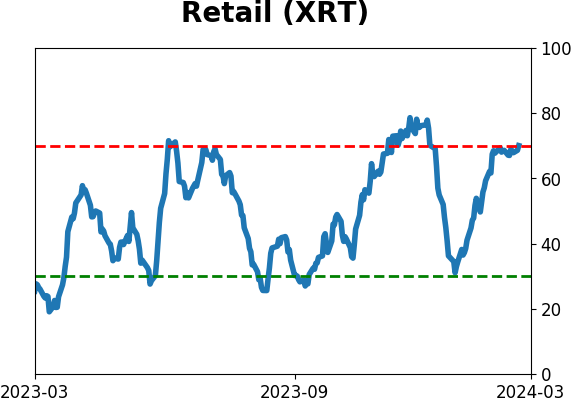
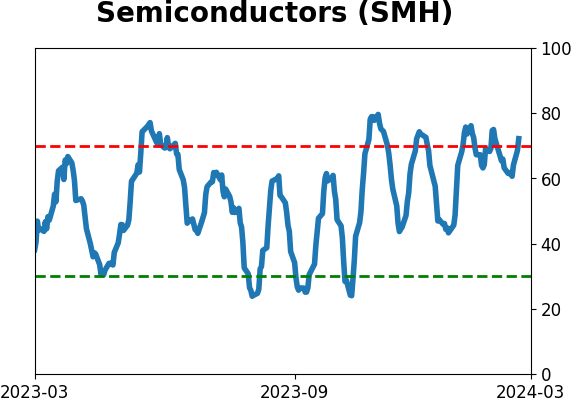
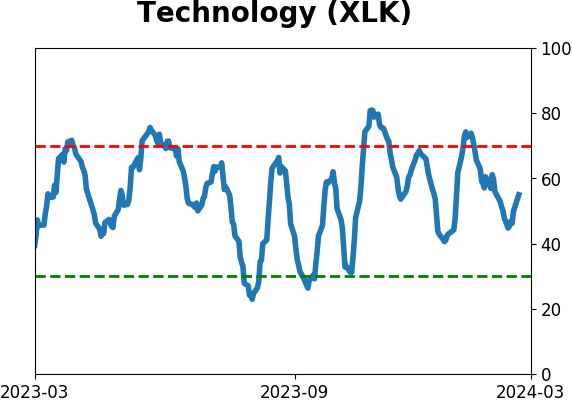
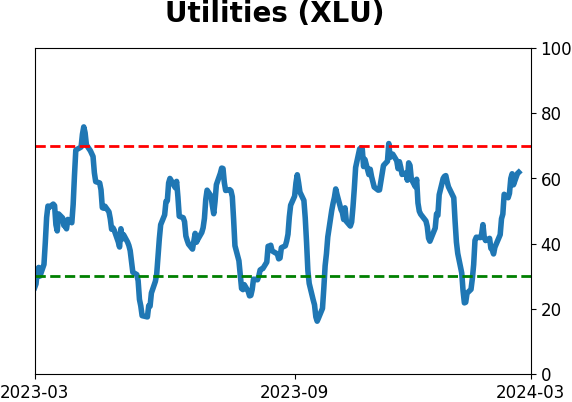
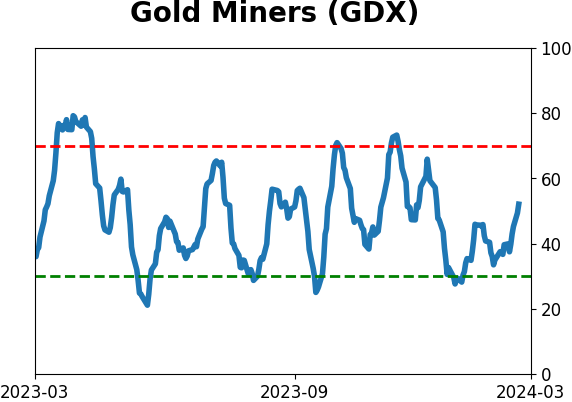
Sector ETF's - 10-Day Moving Average
|
|
|
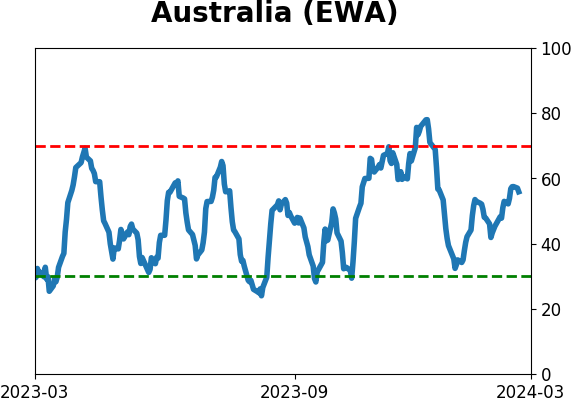
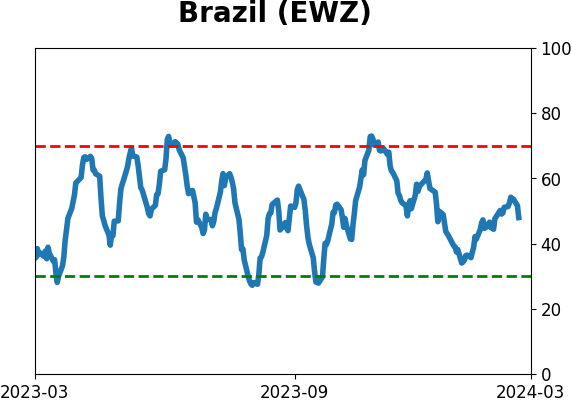
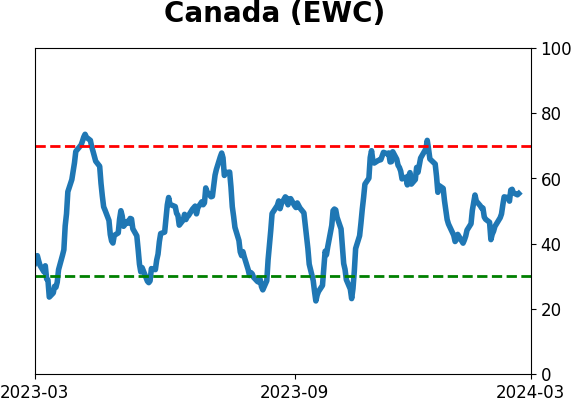
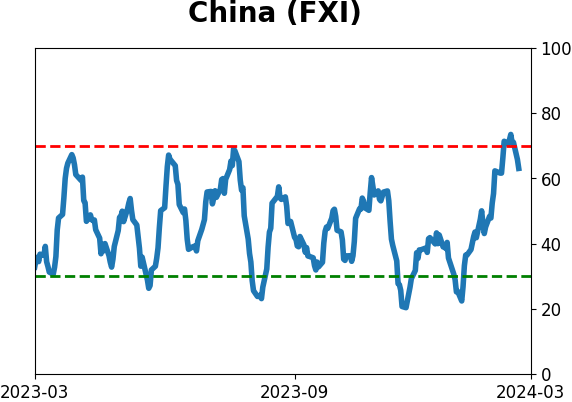
Country ETF's - 10-Day Moving Average
|
|
|
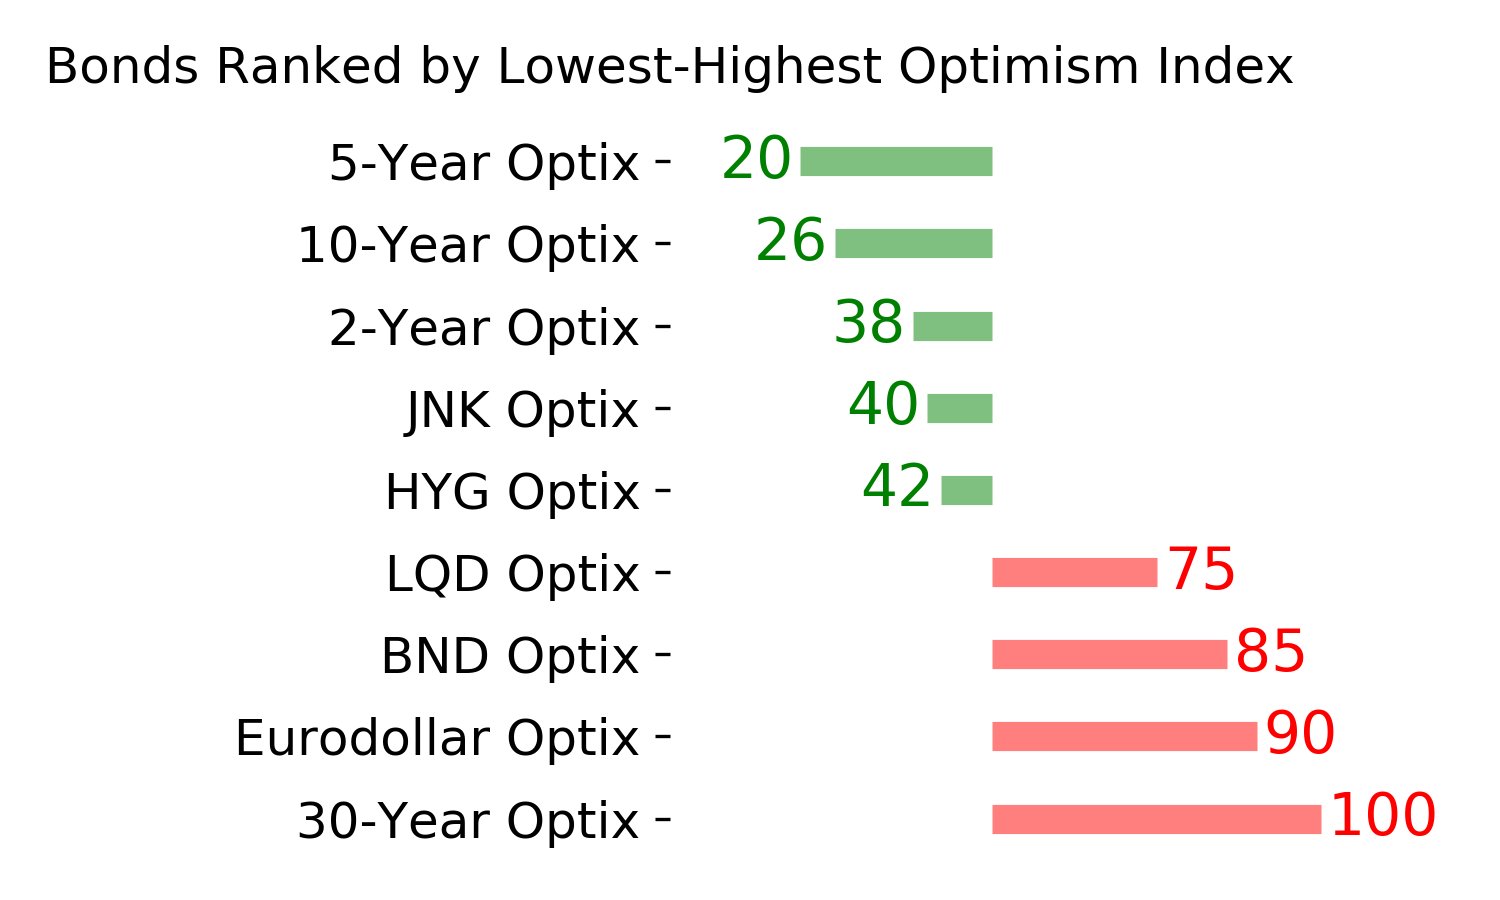
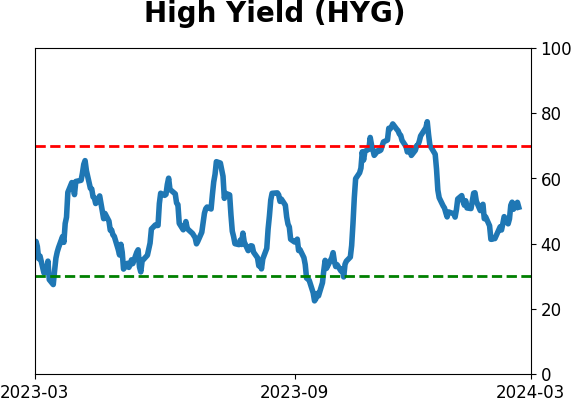
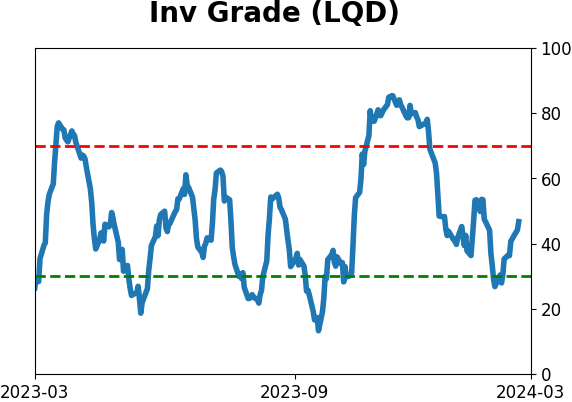
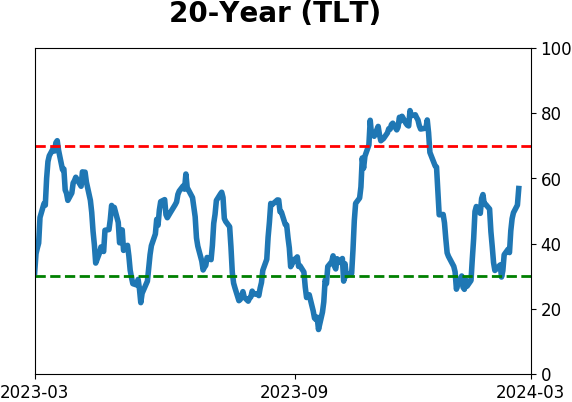
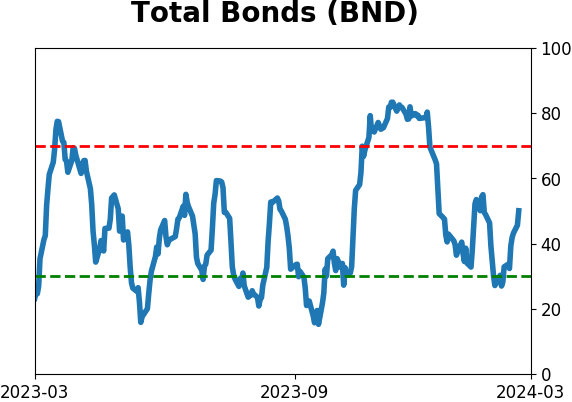
Bond ETF's - 10-Day Moving Average
|
|
|
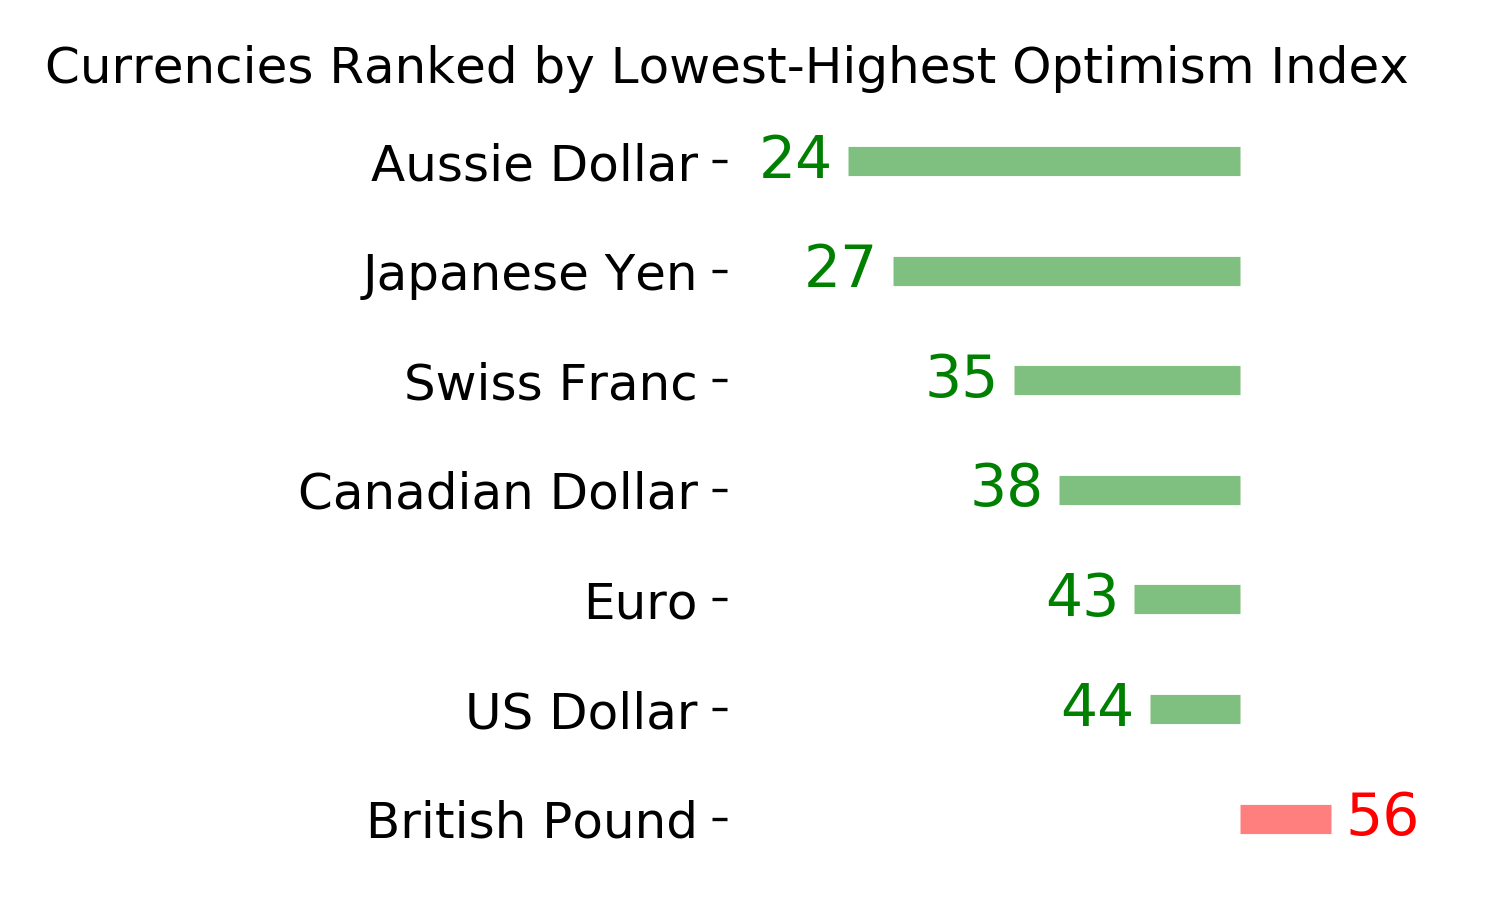
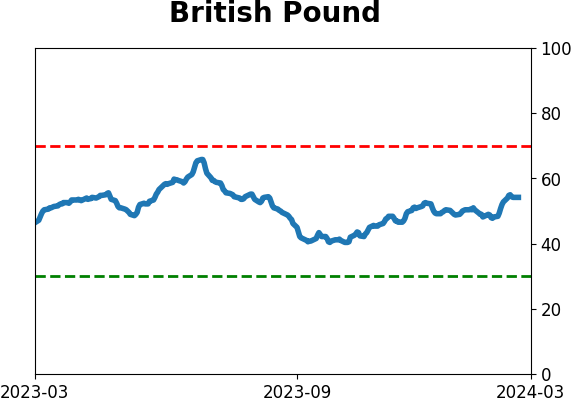
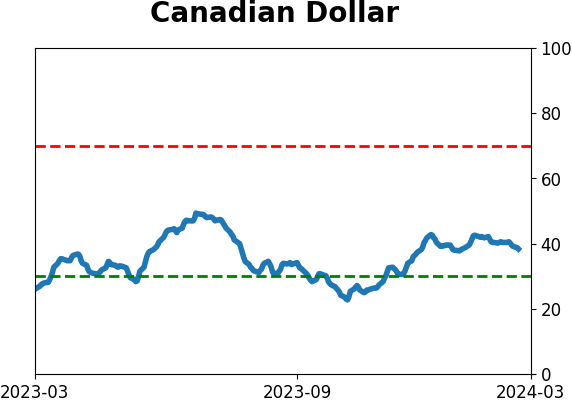
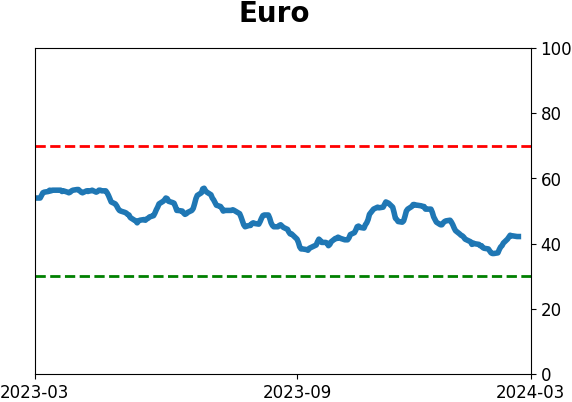
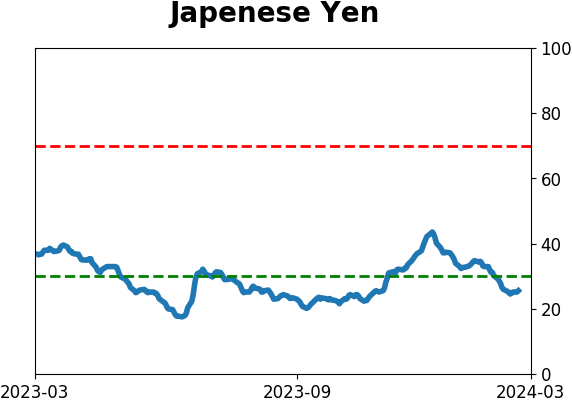
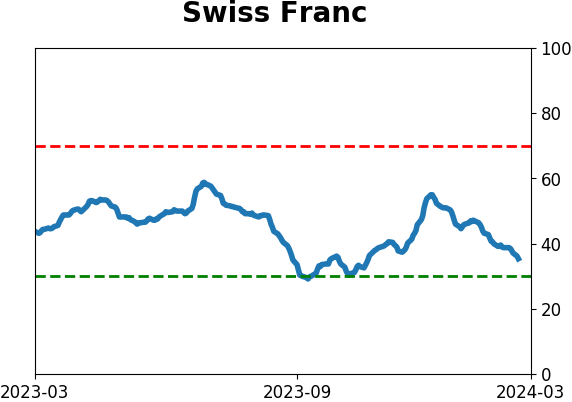
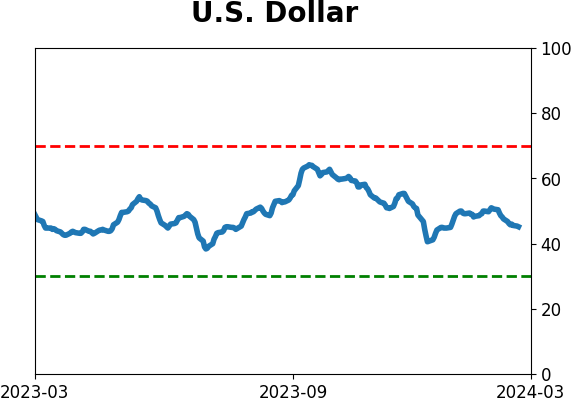
Currency ETF's - 5-Day Moving Average
|
|
|
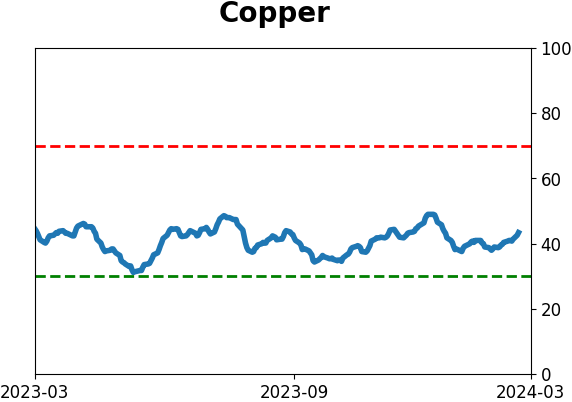
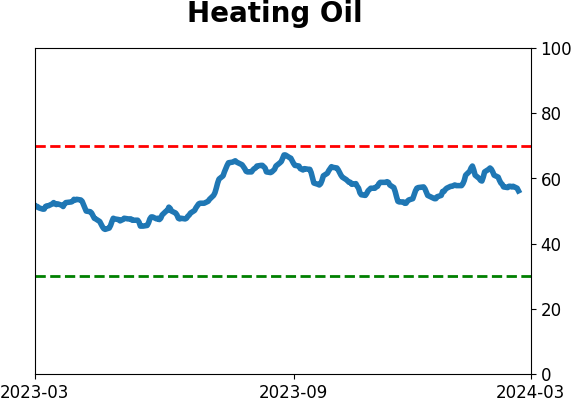
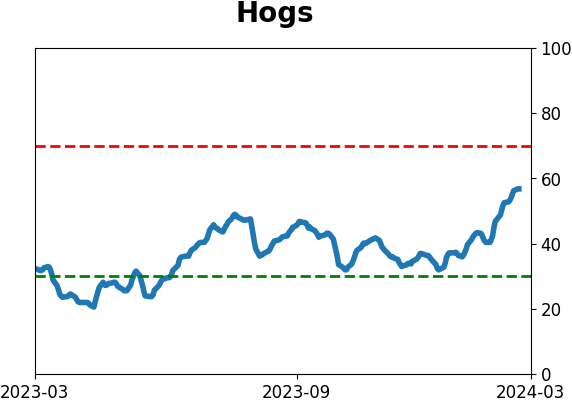
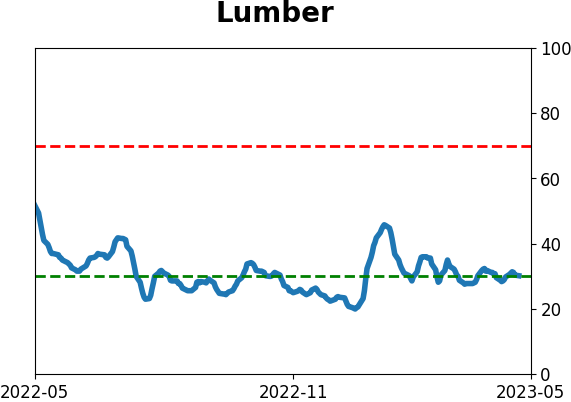
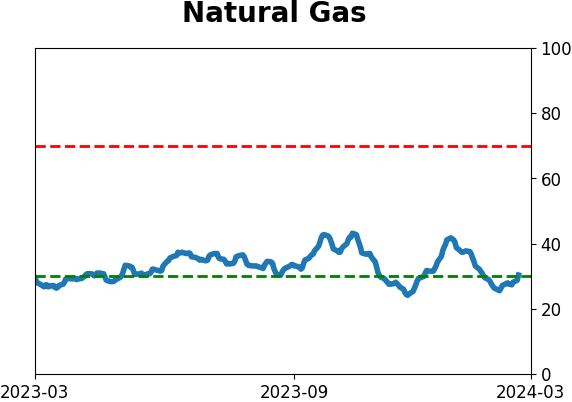
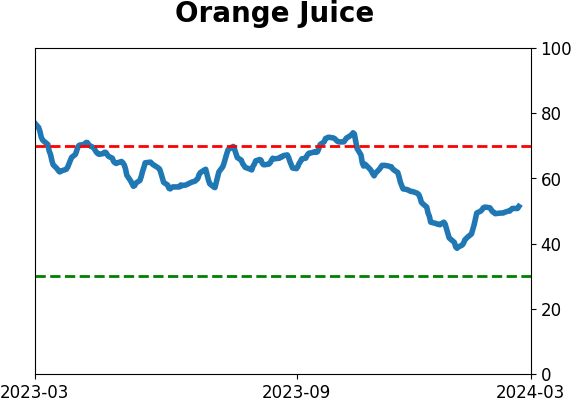
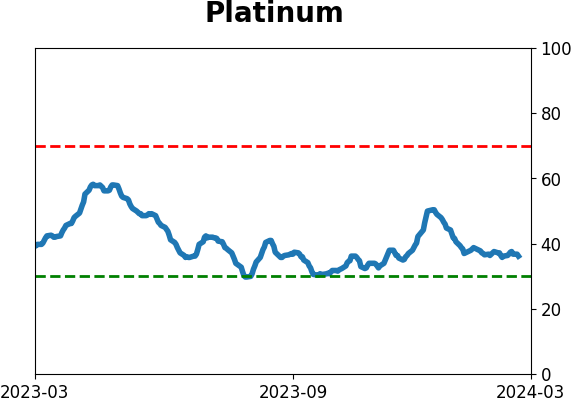
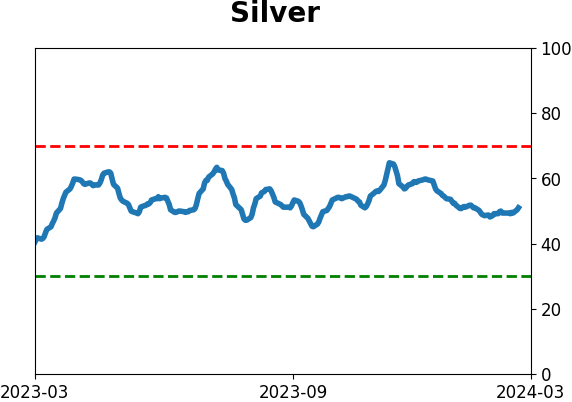
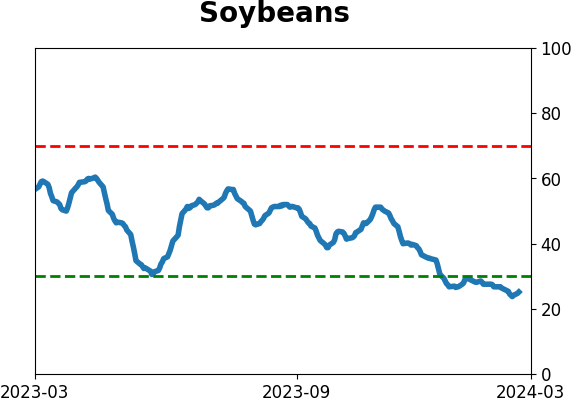
Commodity ETF's - 5-Day Moving Average
|
|