Headlines
|
|
A bad year for grow-and-hold:
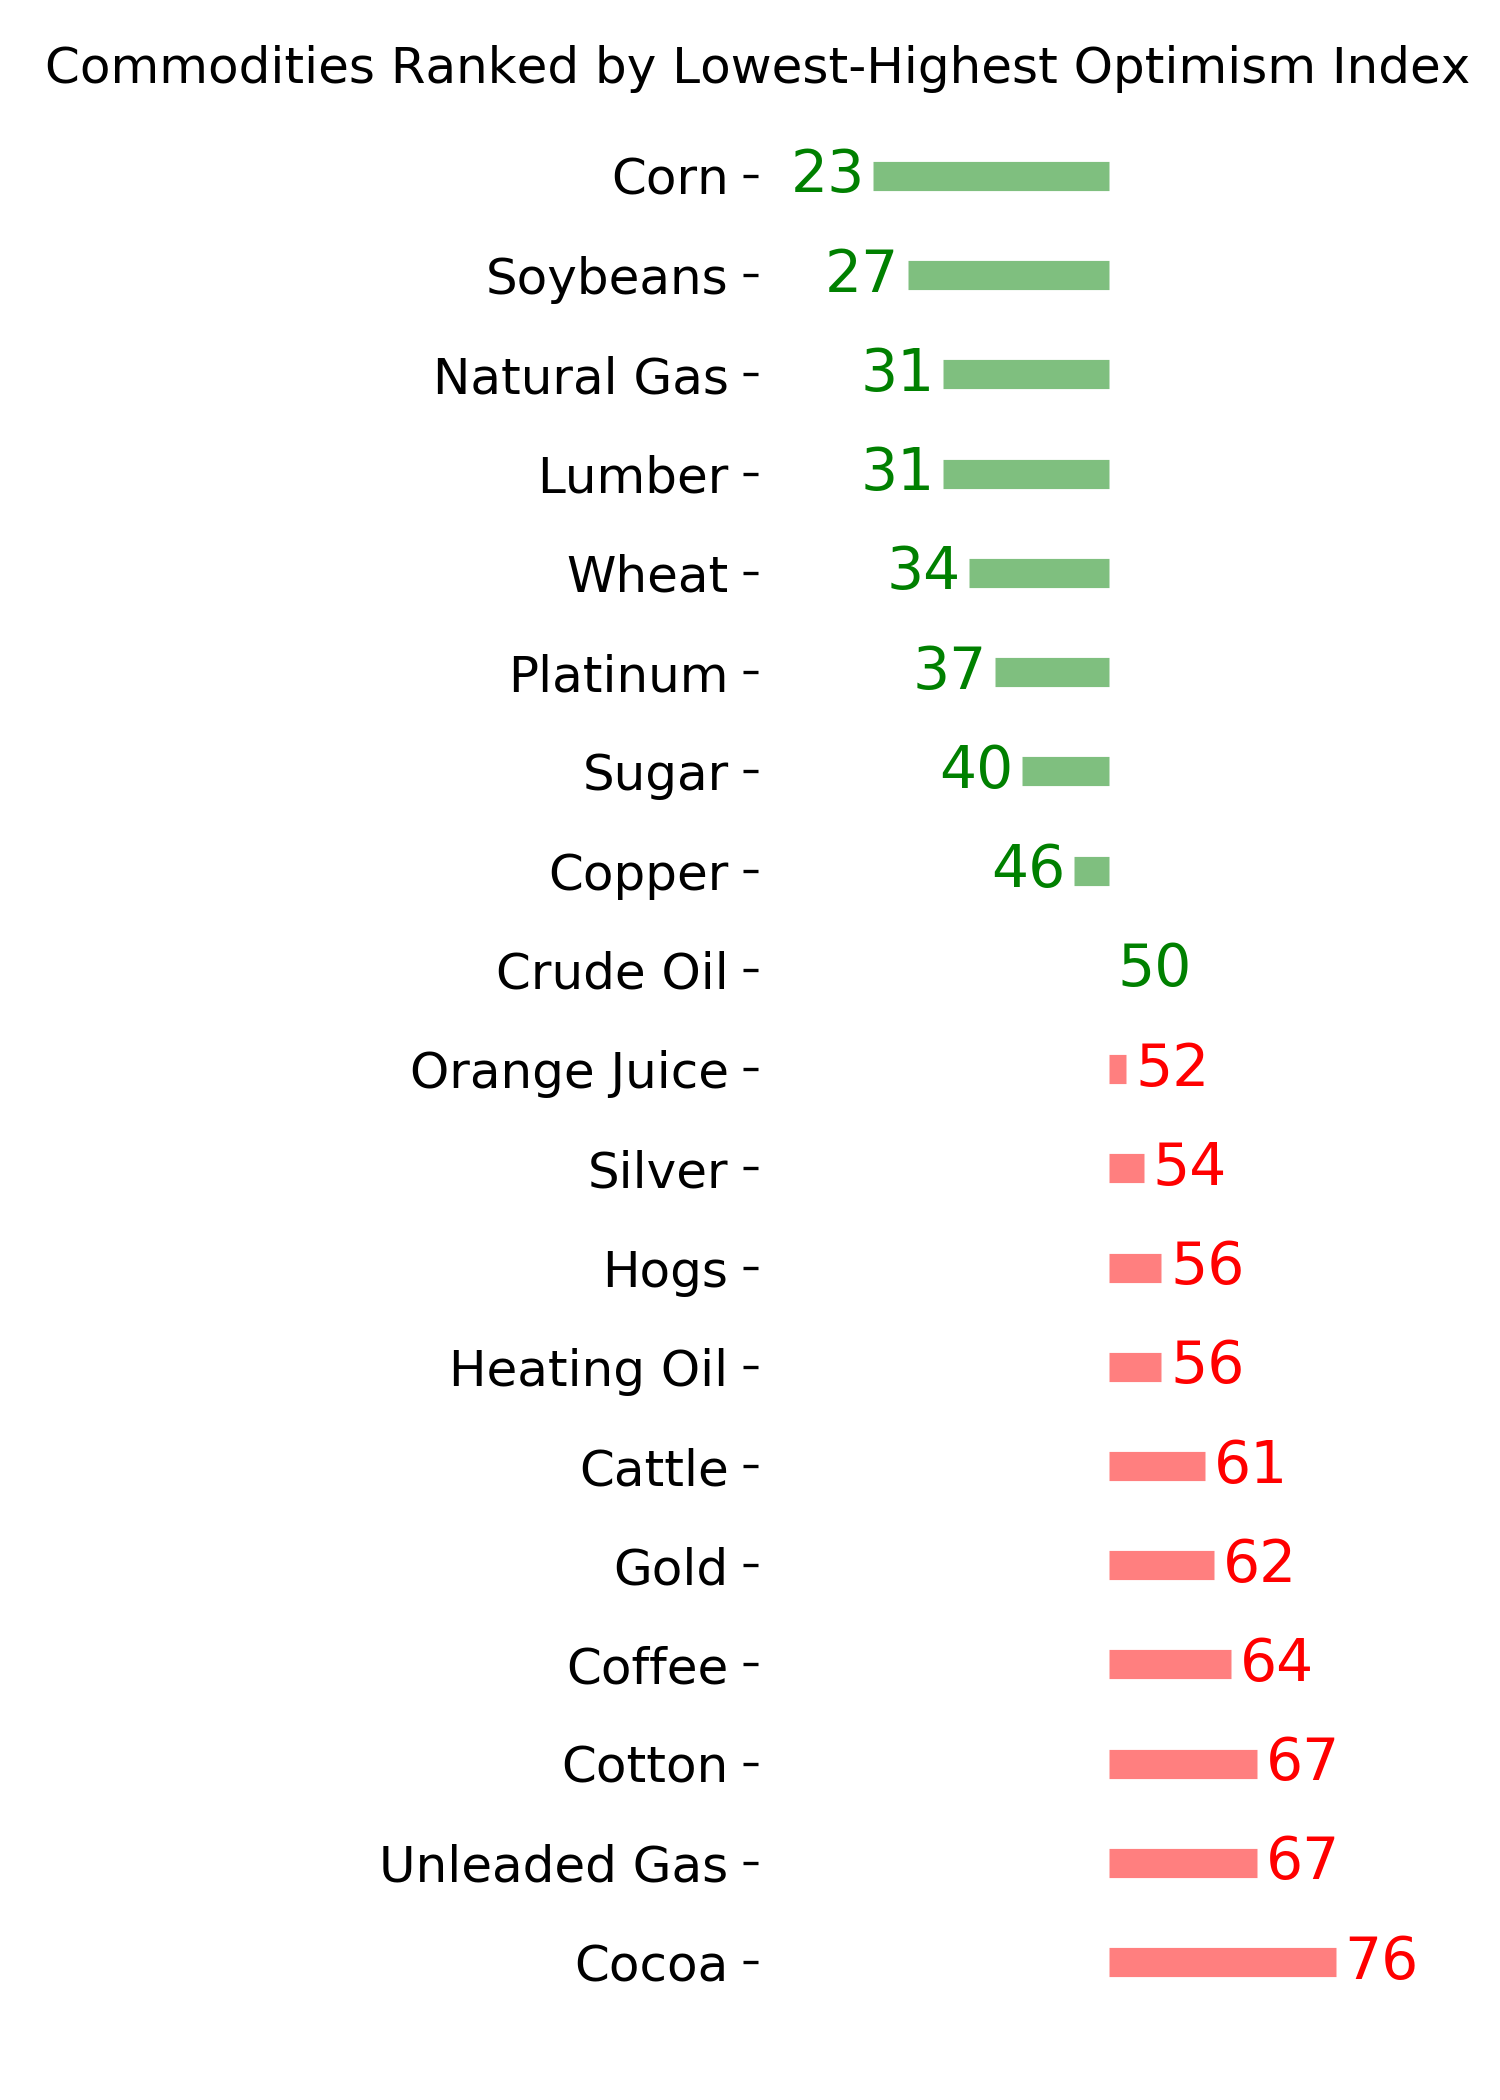
Sentiment toward corn and, to a lesser extent, soybeans is as bad as it has been in 30 years. After optimism on both contracts was as low as it is now, they tended to rally over the next six months. This year is particularly unusual because the contracts are bucking their seasonal tendencies.
|
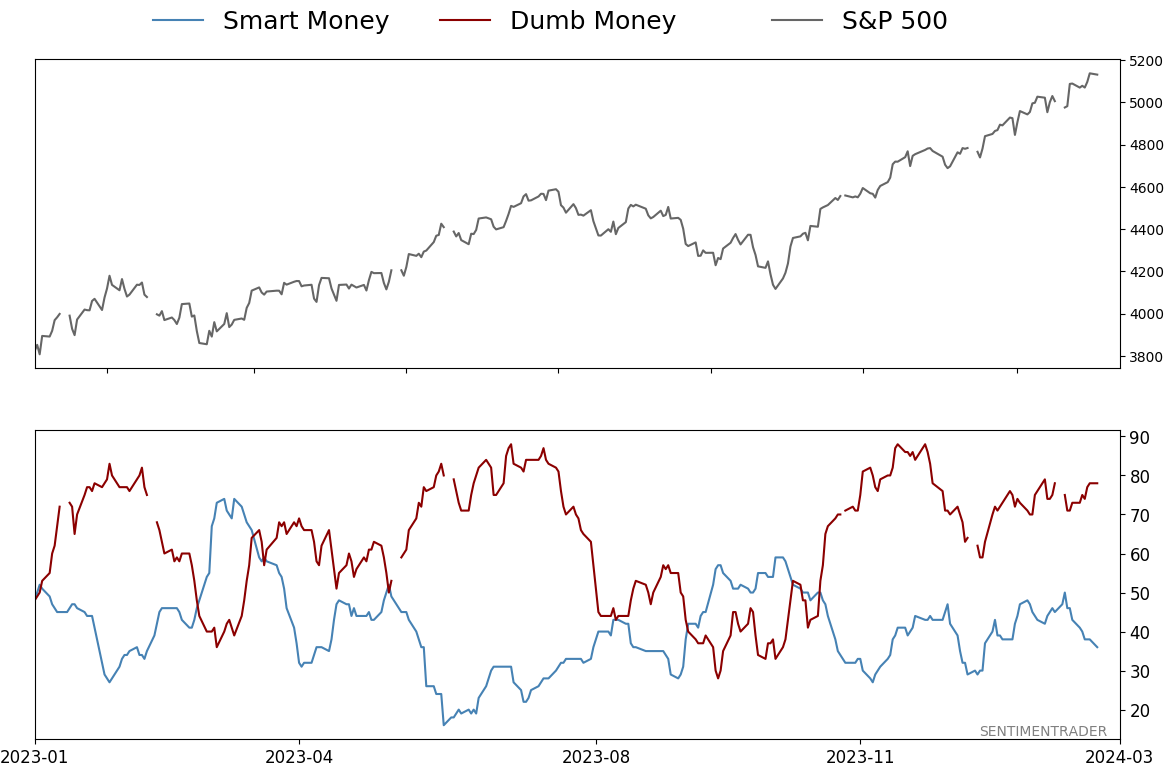
Smart / Dumb Money Confidence
|
Smart Money Confidence: 36%
Dumb Money Confidence: 78%
|
|
Risk Levels
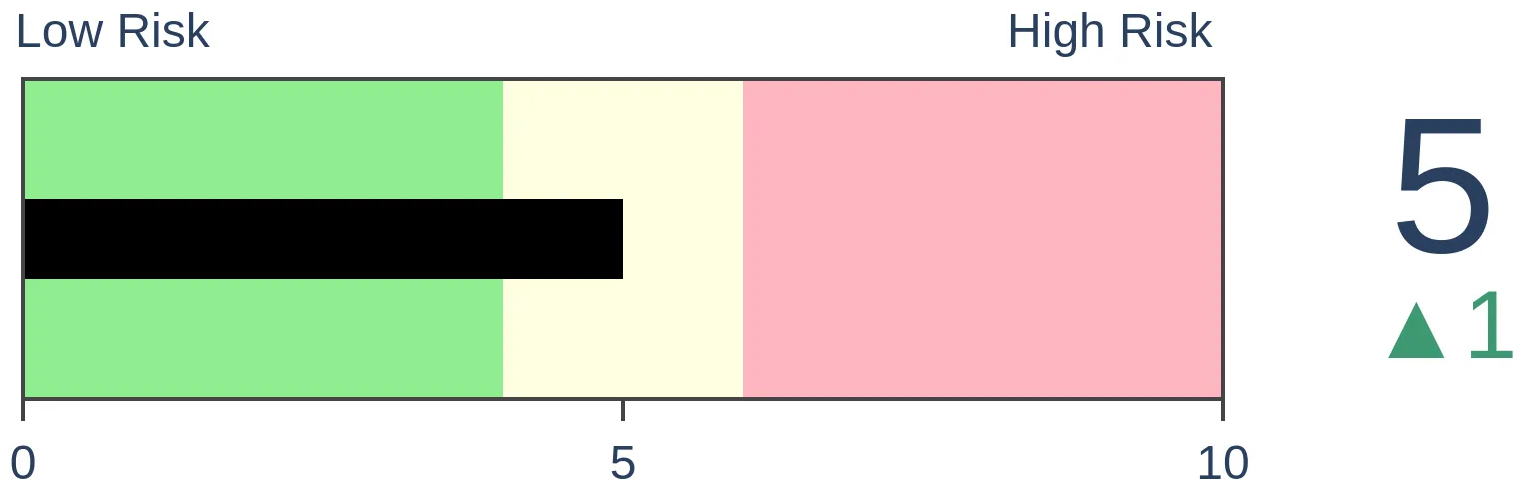
Stocks Short-Term
|
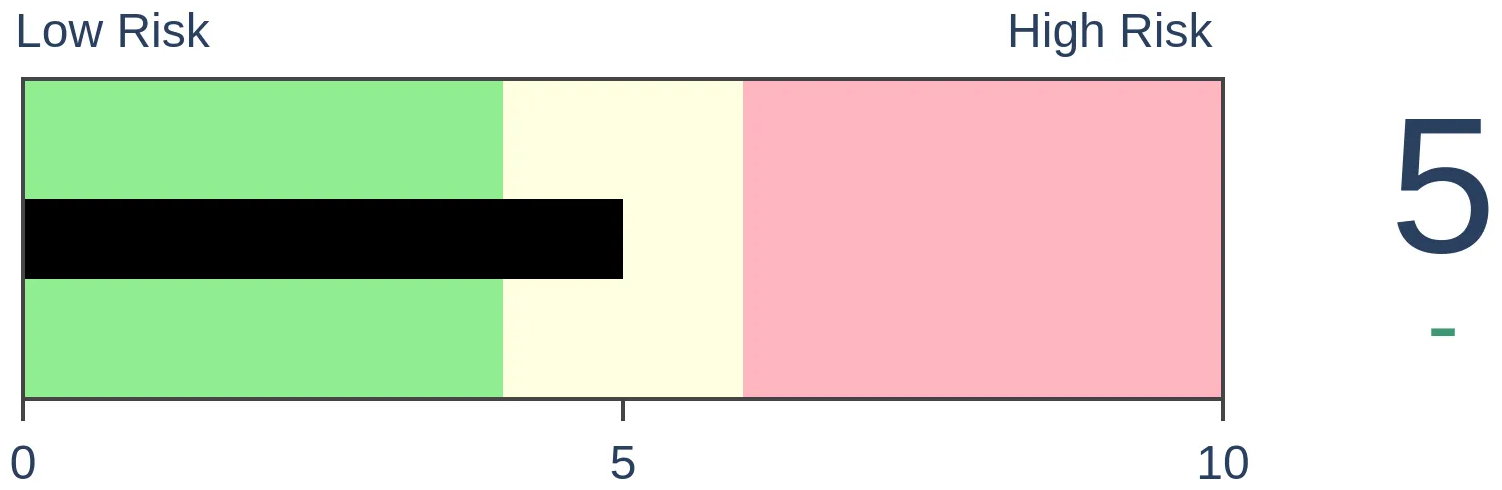
Stocks Medium-Term
|
|
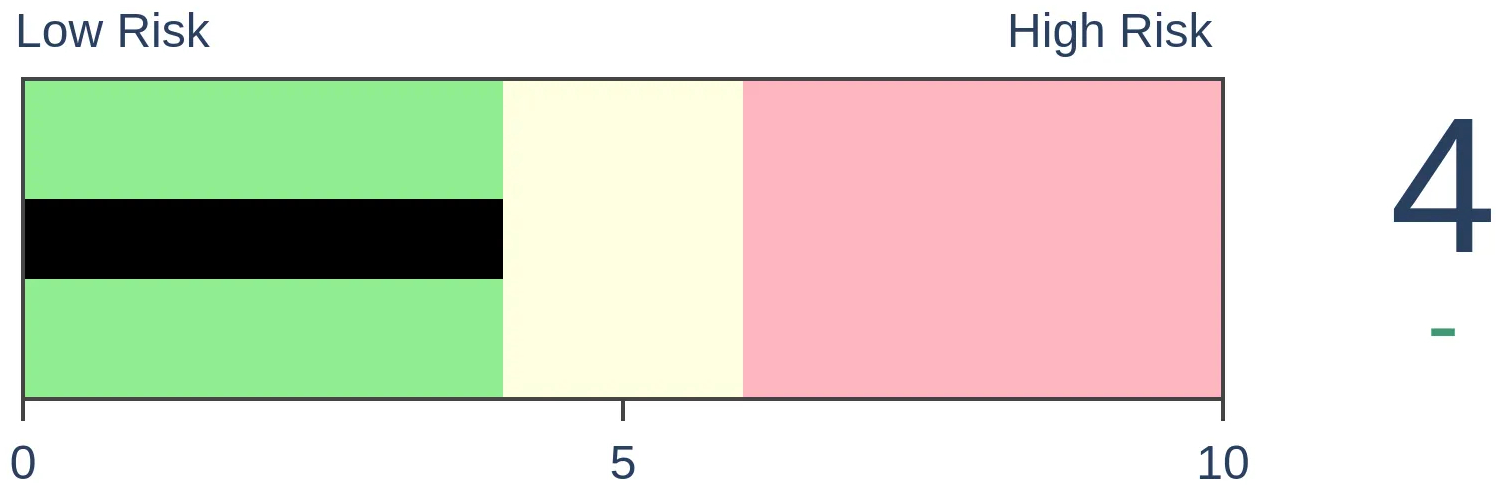
Bonds
|
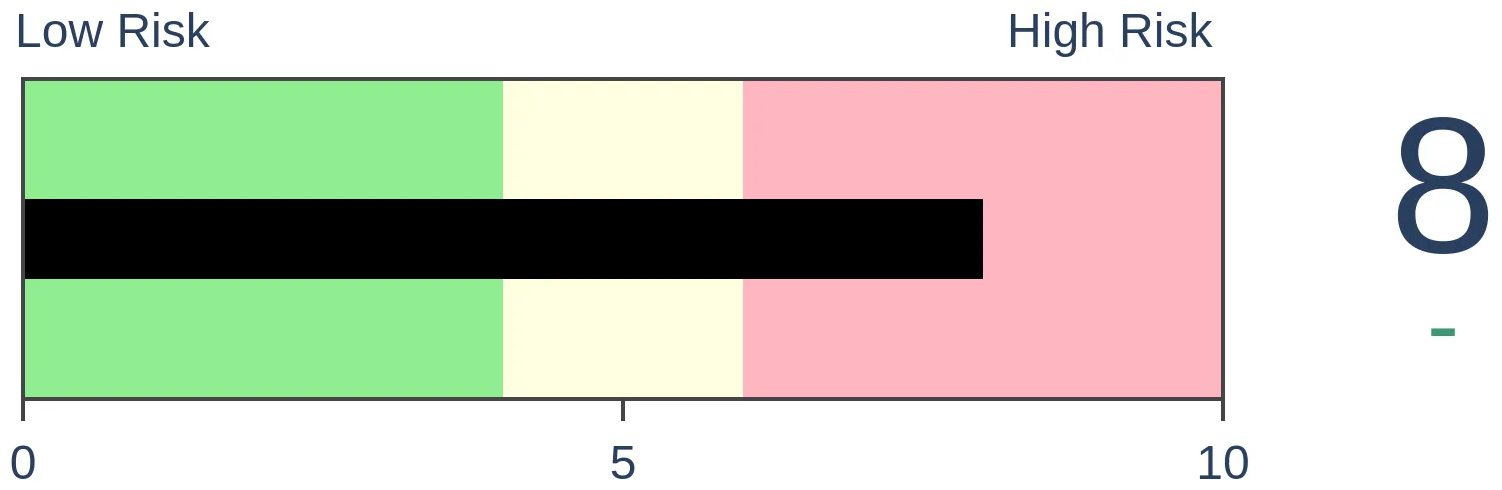
Crude Oil
|
|
Gold

|
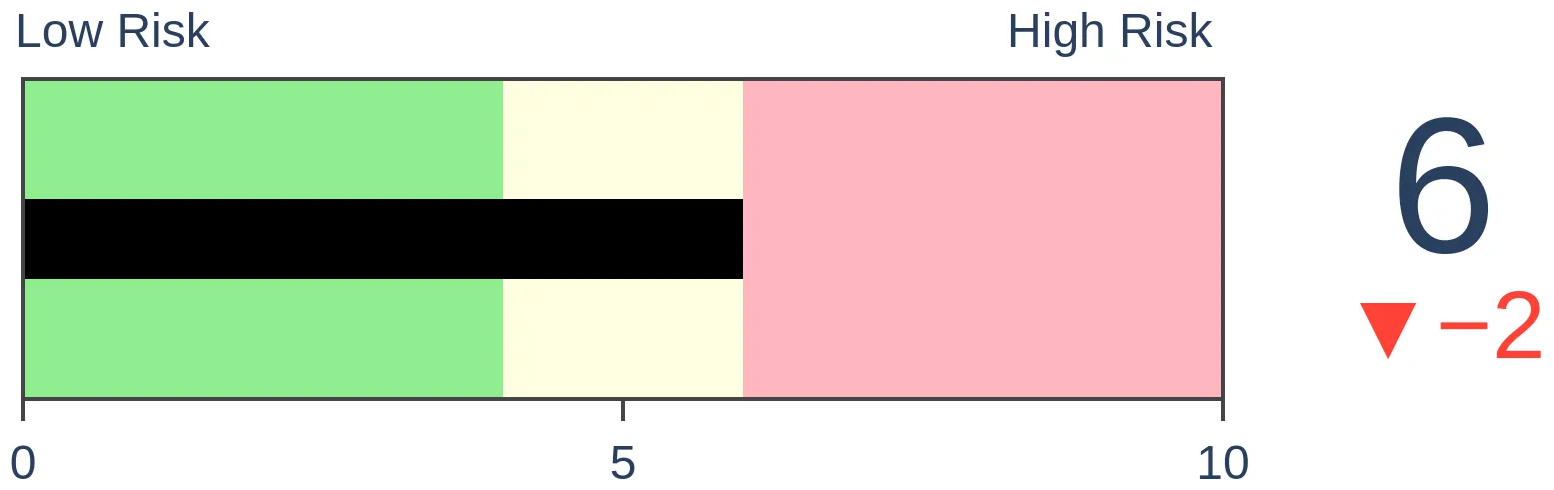
Agriculture
|
|
Research
By Jason Goepfert
BOTTOM LINE
Sentiment toward corn and, to a lesser extent, soybeans is as bad as it has been in 30 years. After optimism on both contracts was as low as it is now, they tended to rally over the next six months. This year is particularly unusual because the contracts are bucking their seasonal tendencies.
FORECAST / TIMEFRAME
None
|
Key points:
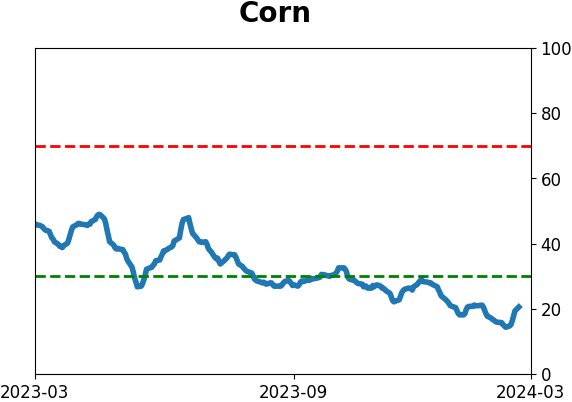
- The prices for corn and soybeans have plummeted over the past year
- Speculators are pressing short bets, and sentiment is as bad as any period in 30 years
- Over the next six months, both contracts tended to rally after similarly depressed optimism
A tough stretch for corn and beans
It hasn't been a pleasant year for farmers holding grains in storage. Many expected prices to hold up last year, so instead of selling to elevators or hedging with futures contracts, they put corn and soybeans in storage. And prices have wilted almost without interruption.
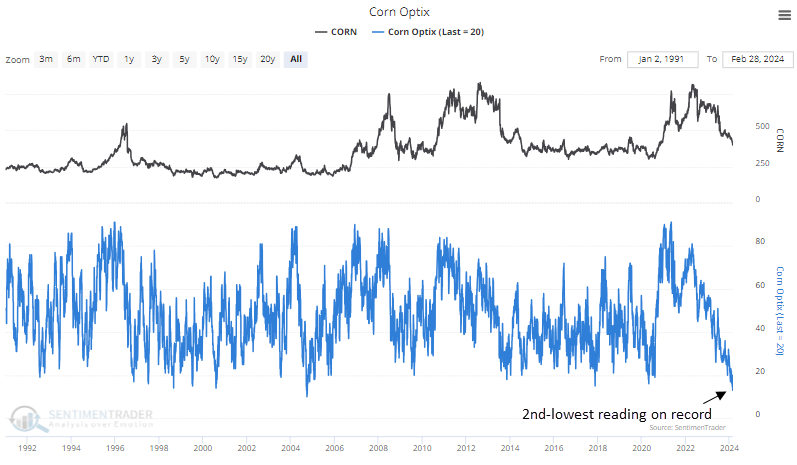
As a result, speculators are pressing their short bets to record levels, and overall sentiment in corn is as bad as it has been in nearly 35 years.
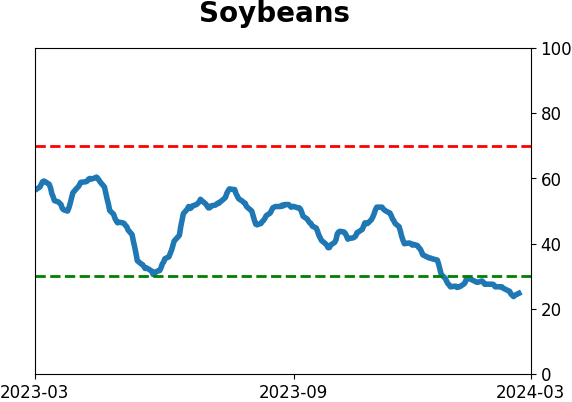
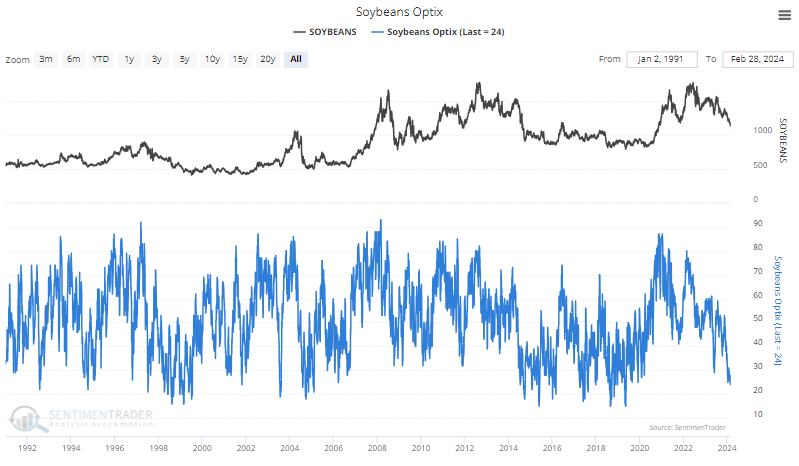
It's not much better in beans.
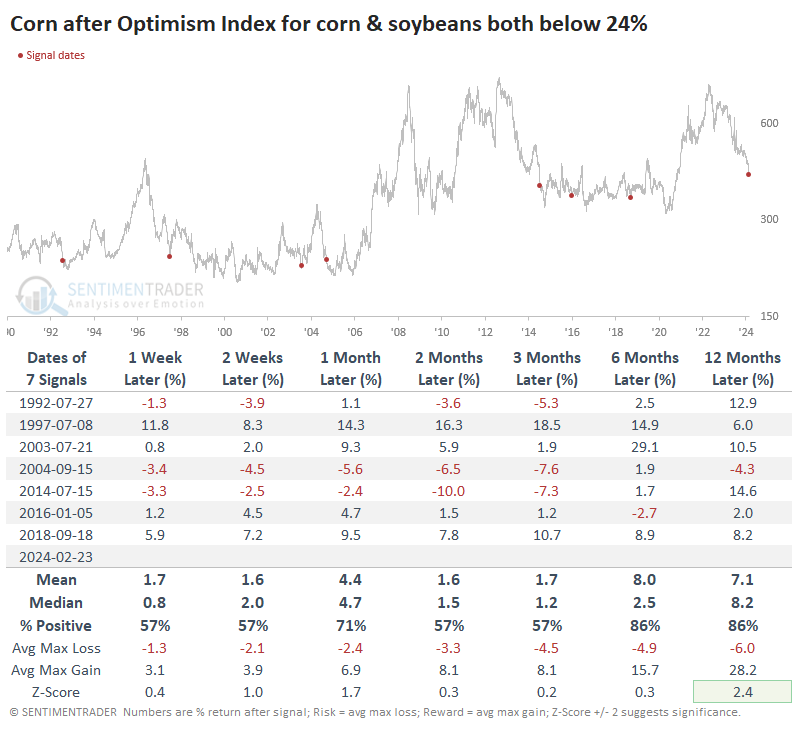
This is the first time in six years that the Optimism Index for both corn and soybeans was 24% or below. For corn, this tended to occur at or near troughs. It preceded months of losses in 2004 and 2014, with the contract losing more than -10% within the next six months, but the losses were then erased as the market righted itself. It performed quite well over the next 6-12 months, with limited losses relative to reward.
It was a very similar story in soybeans. It tends to swing around more than corn, and the returns reflected that. The only signal that preceded persistent losses was in 2014.
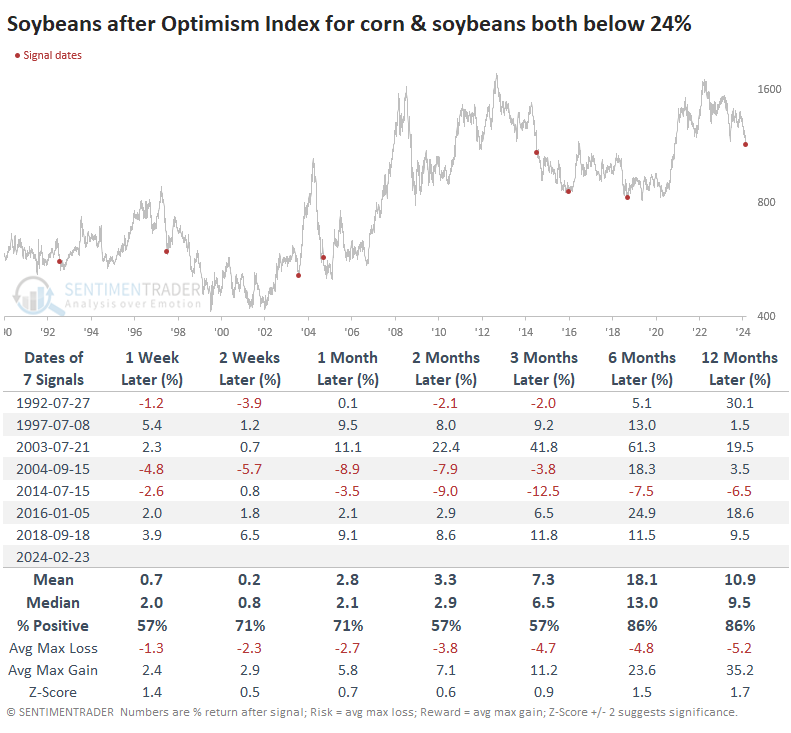
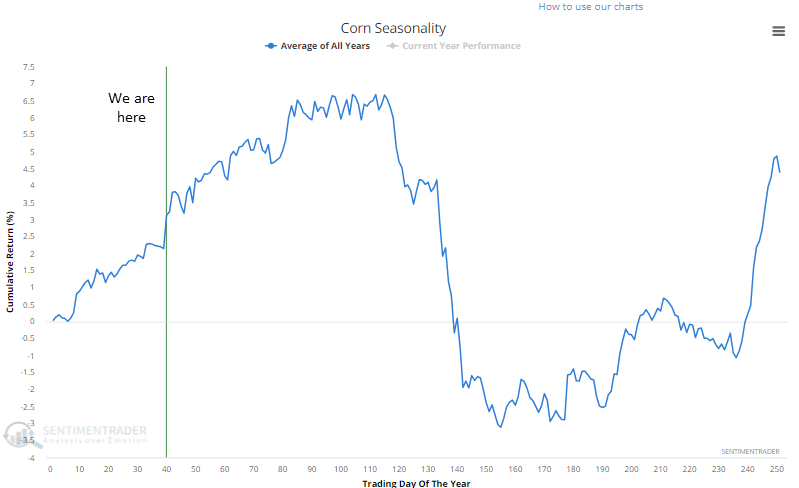
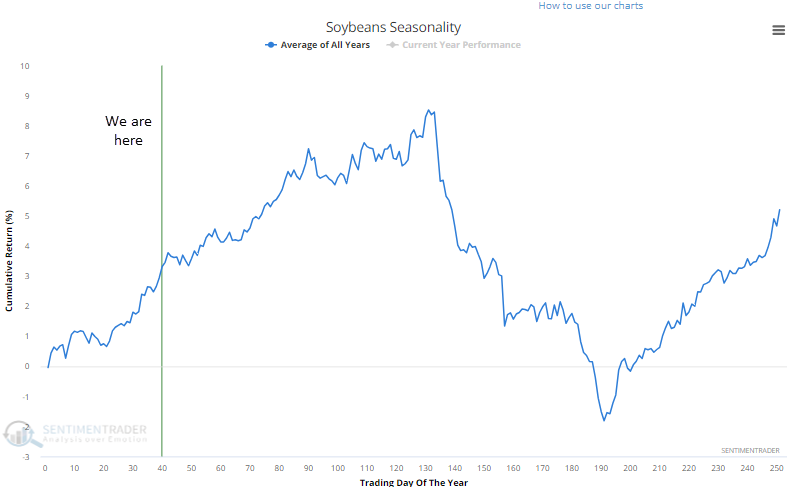
Oddly, we're seeing this level of pessimism at this point in the year. Due to planting cycles, corn and beans have tended to exhibit consistent seasonal trends, very closely tracking each other. They tend to peak in the spring and decline during the summer months. That's why every signal but one in the tables above was during the summer months.
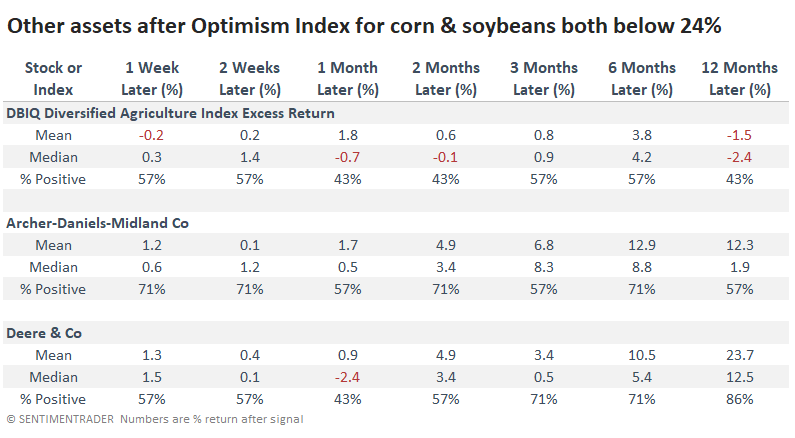
Instead of trading futures contracts or ETFs like CORN and SOYB to bet directly on those two markets, a popular alternative has been the DBA fund, which holds several different agricultural commodities based on their trends and other metrics. Its current allocation to corn and soybeans is only about 20%, so it's far from a direct bet on them.
We can see from the table that the index that DBA tracks, the DBIQ Diversified Agriculture Index, has not performed all that well after the signals in the table above. A couple of established agribusiness companies, ADM and Deere, have performed significantly better.
What the research tells us...
When it comes to commodities, in particular, macro forces can easily overwhelm lopsided sentiment. Supply/demand dynamics or geopolitical events can disrupt these relatively small markets far longer than most others. There are some signs that's the case now in some of the grain markets, mainly corn. Sentiment has been historically depressed for two months, and yet the contract recently made even lower lows. Typically, a more reliable turning point is when the market starts absorbing bad news without moving substantially lower. It has yet to show that tendency consistently, but it should be a focus from here on forward, given the historically depressed sentiment.
Indicators at Extremes
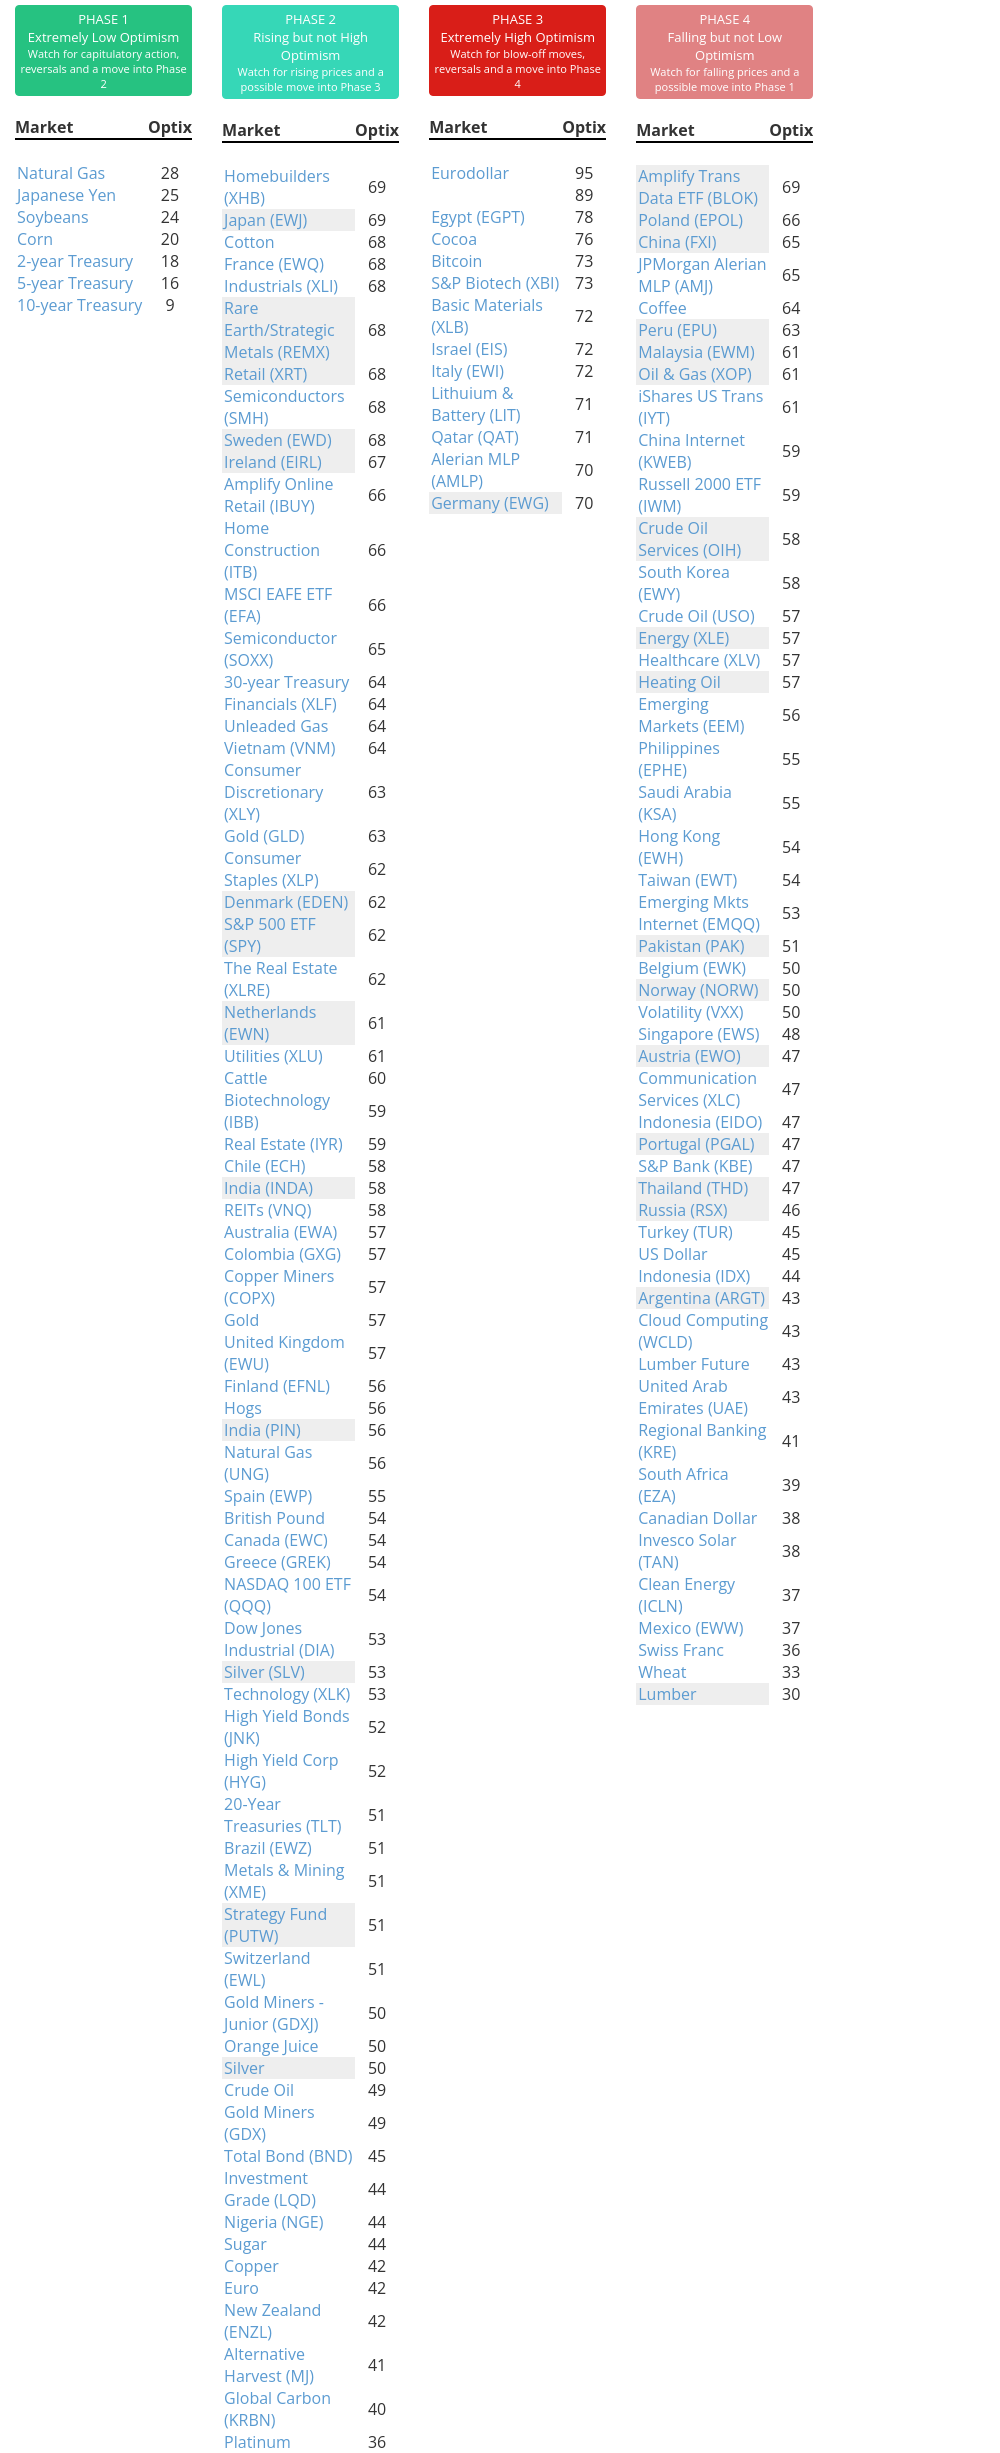
Phase Table
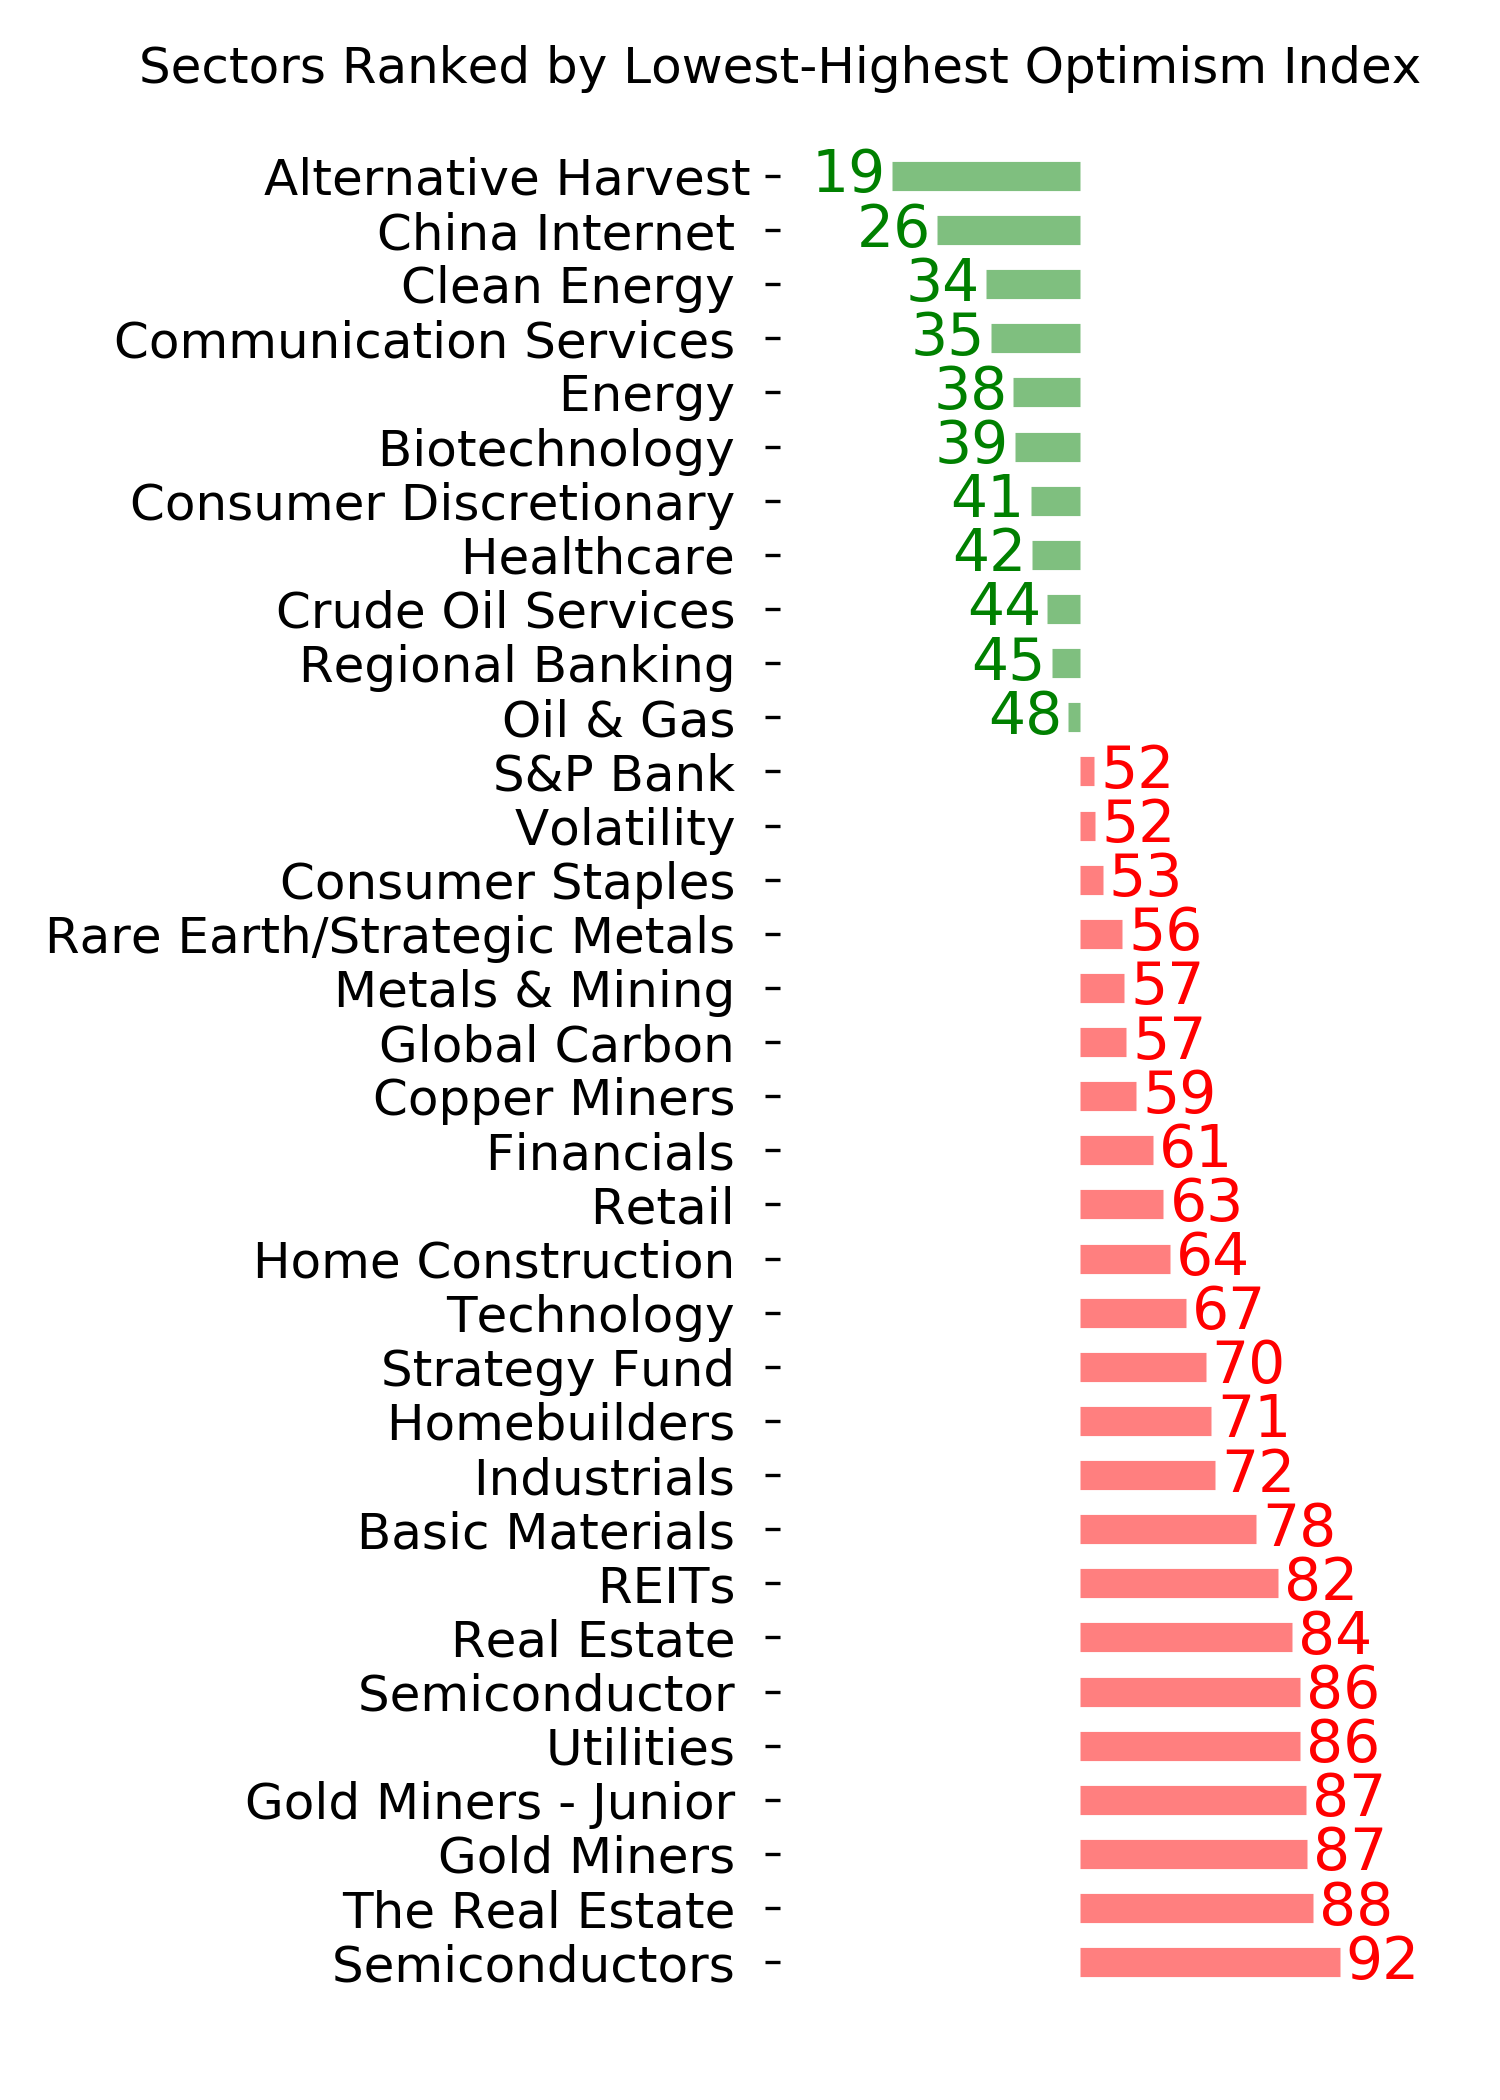
Ranks
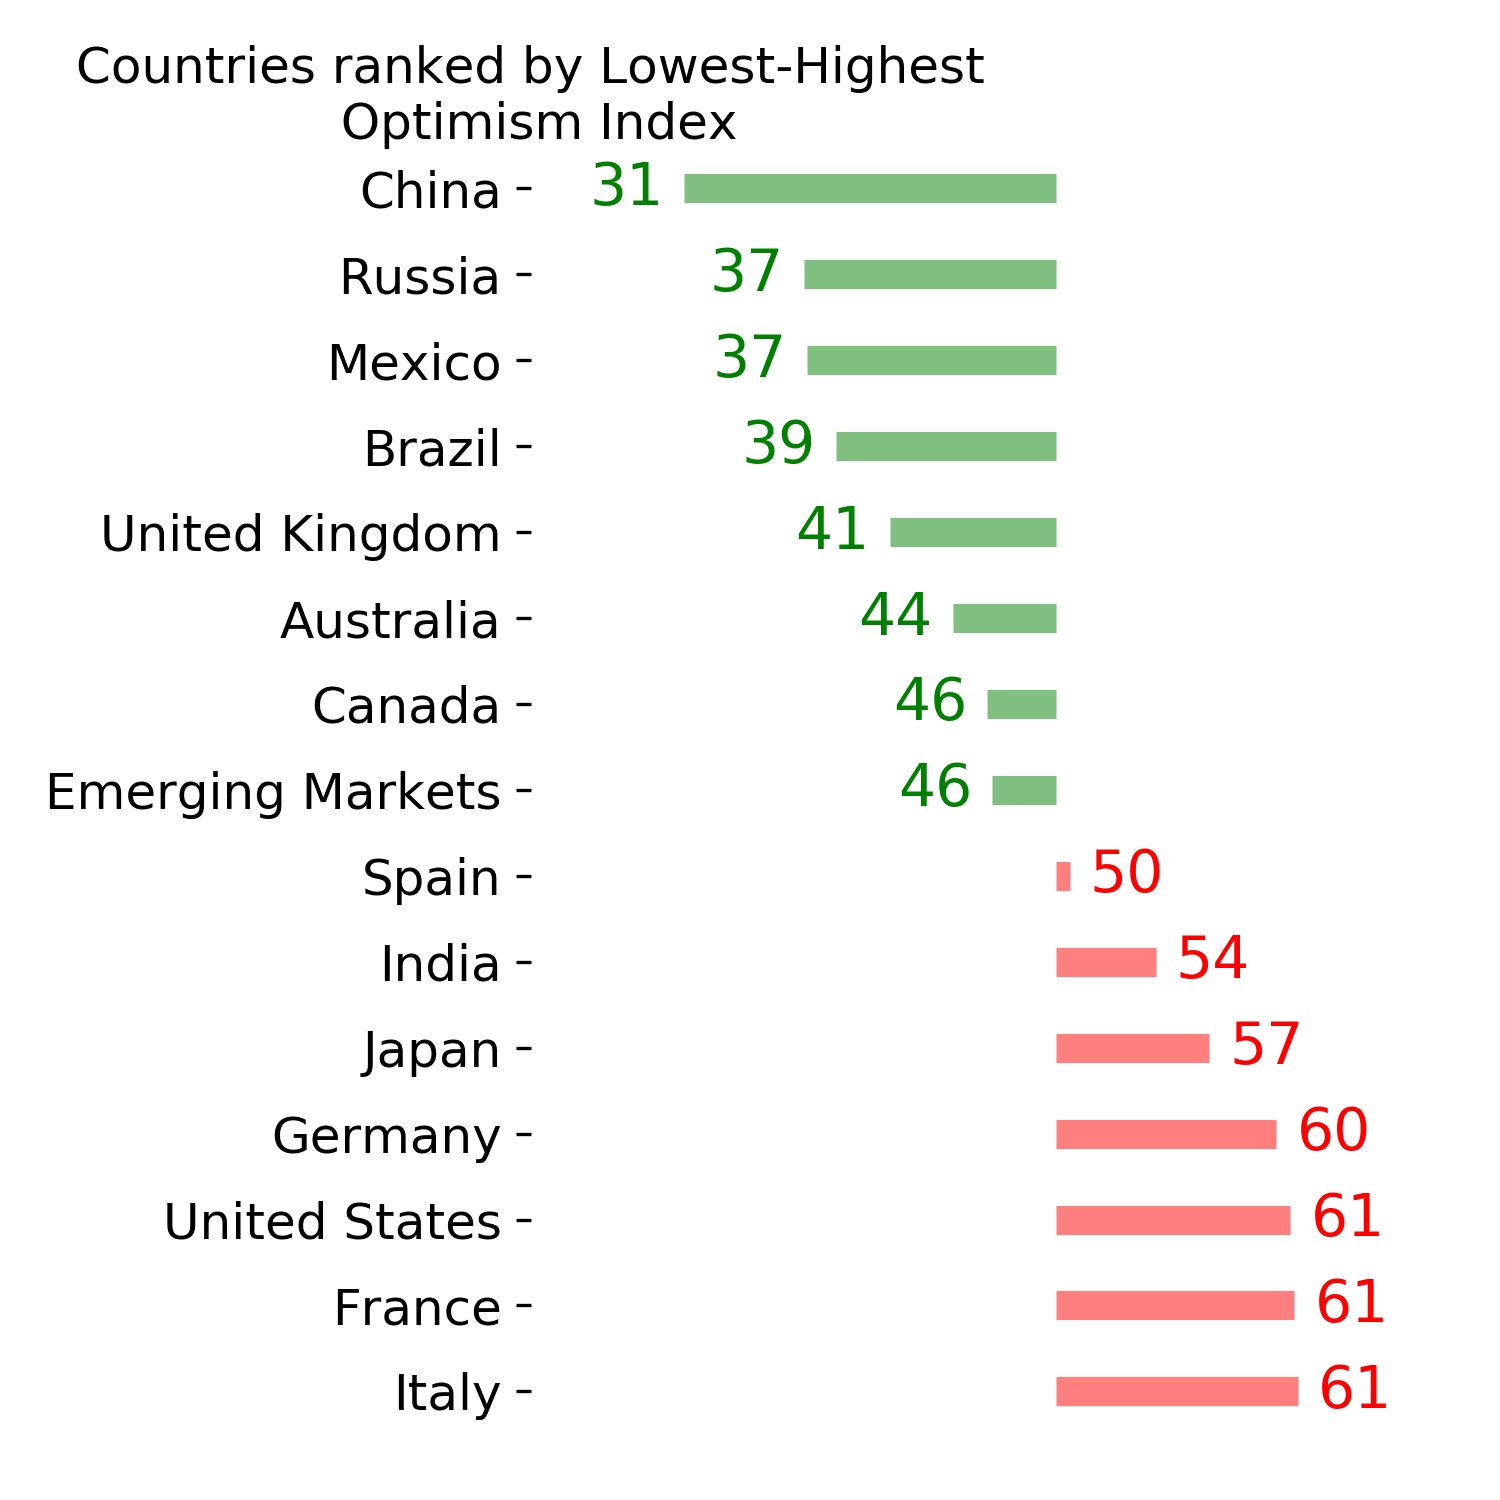
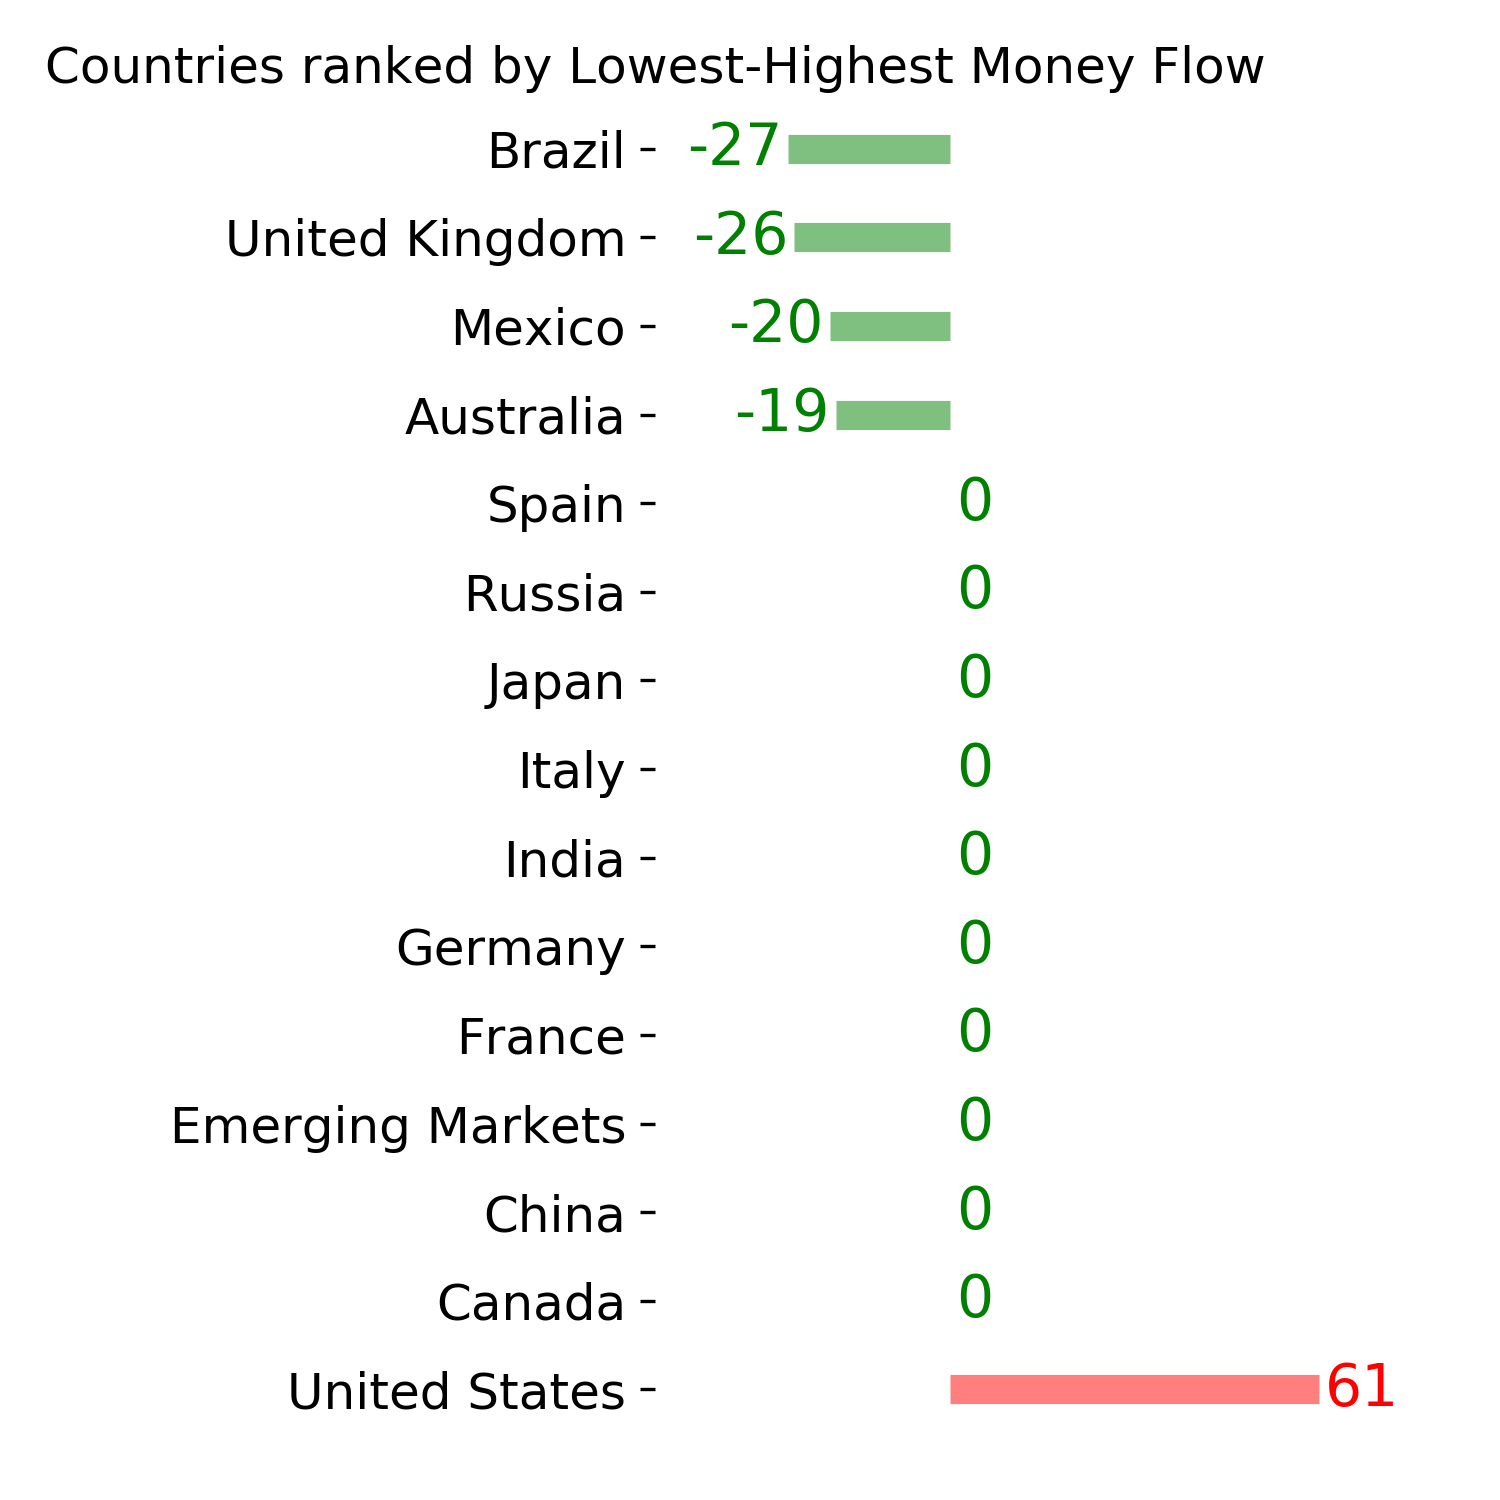
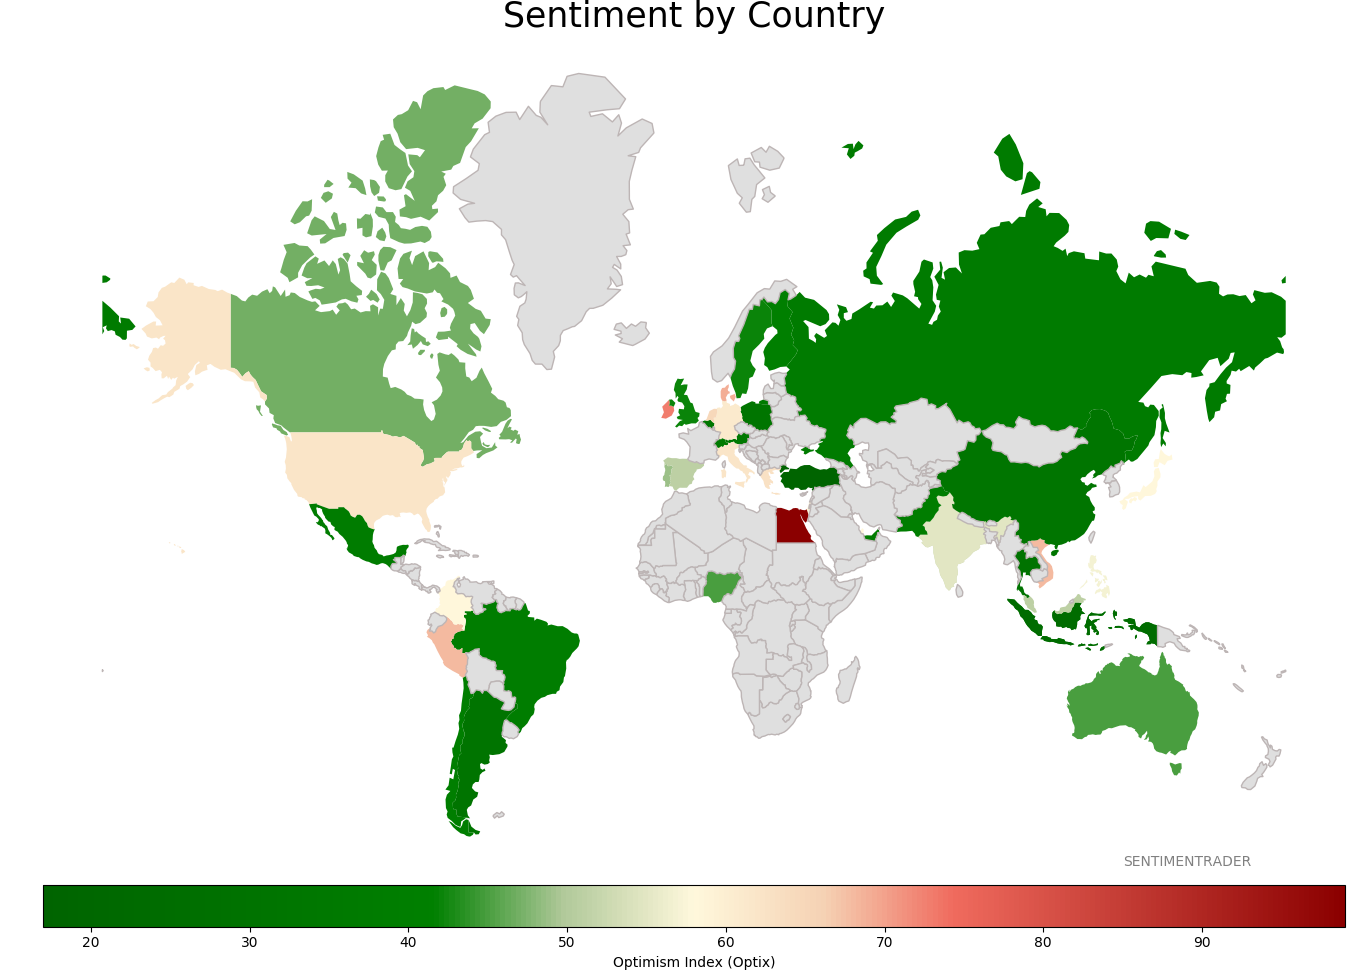
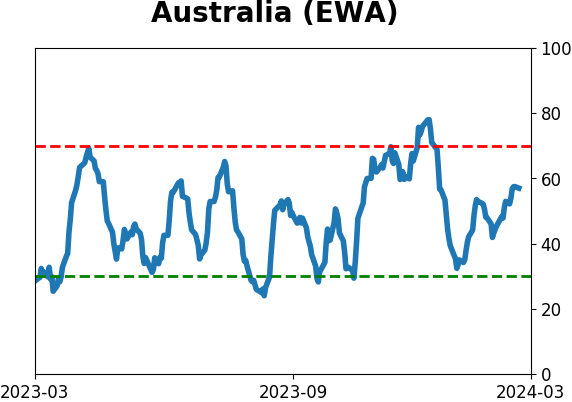
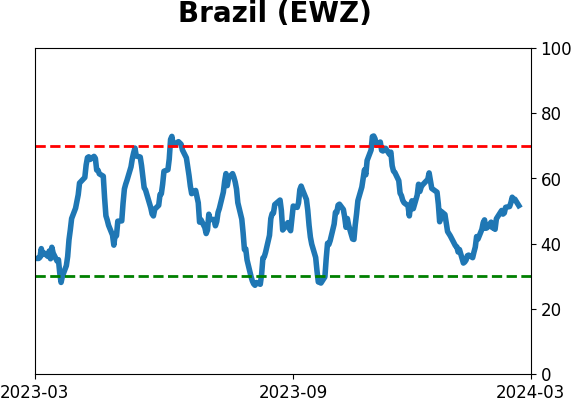
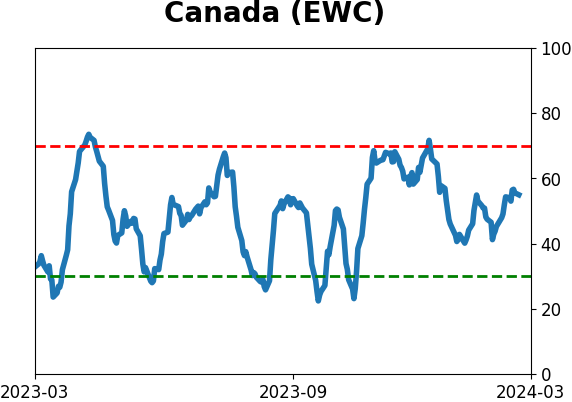
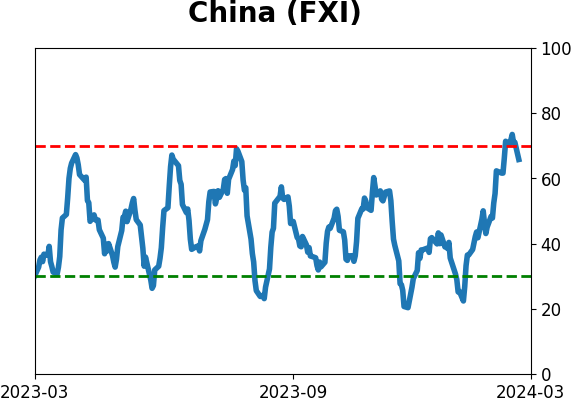
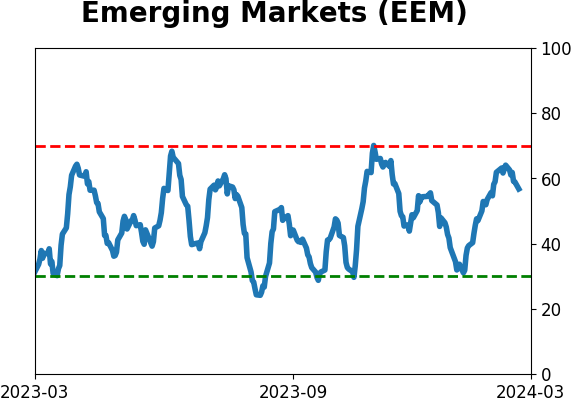
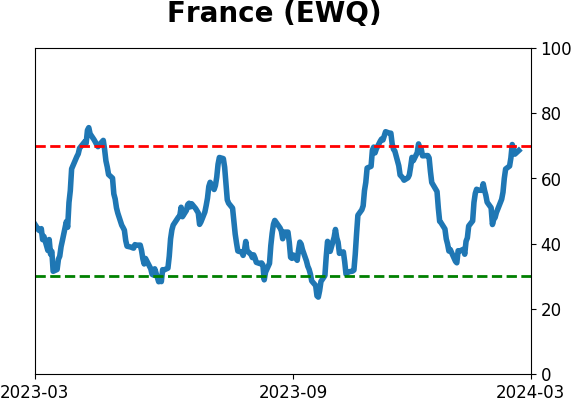
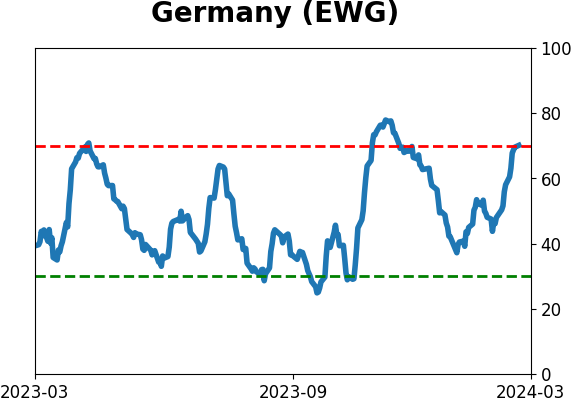
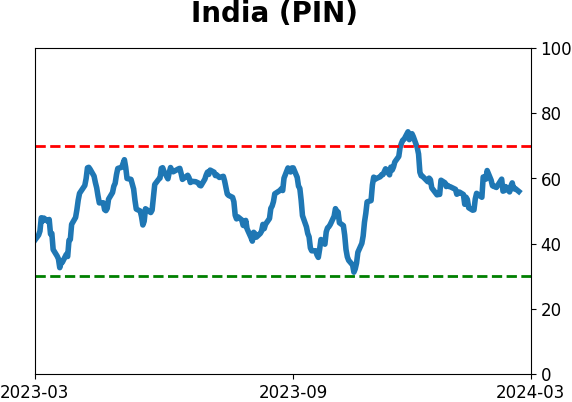
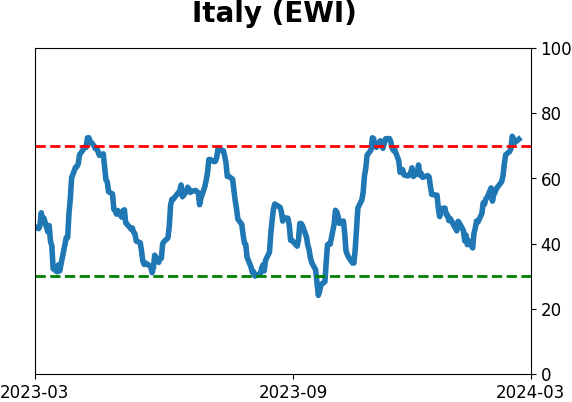
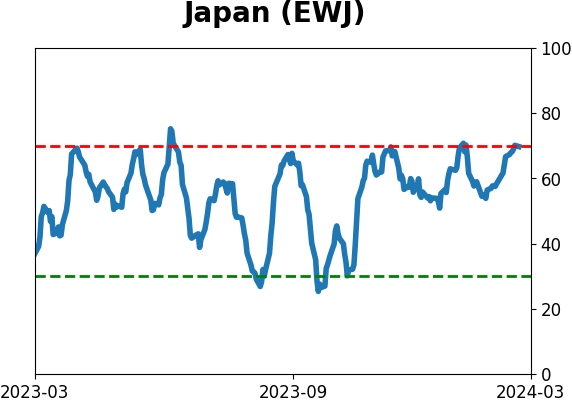
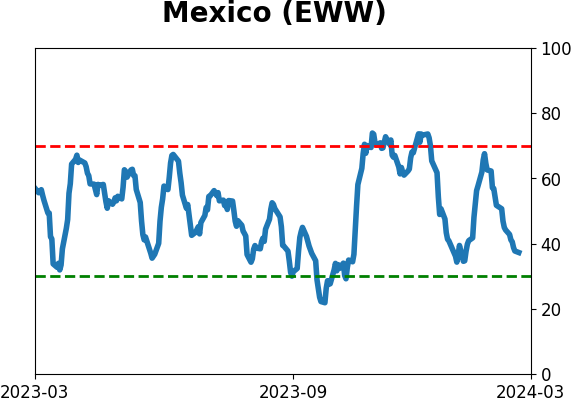
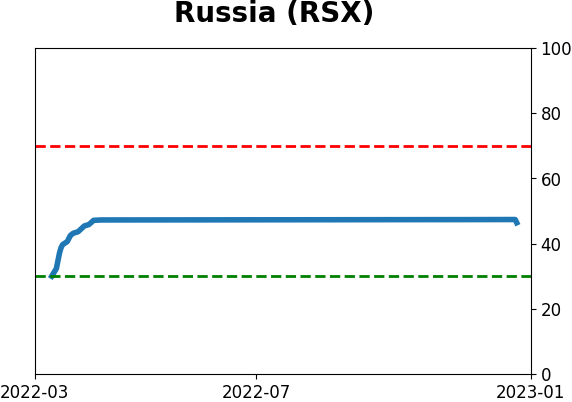
Sentiment Around The World
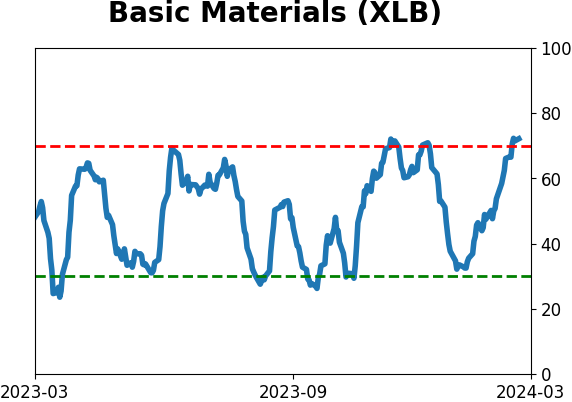
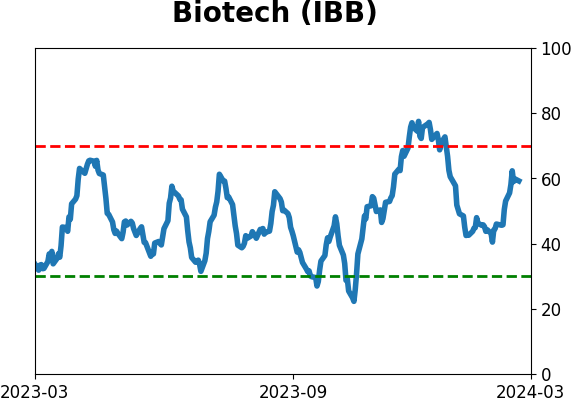
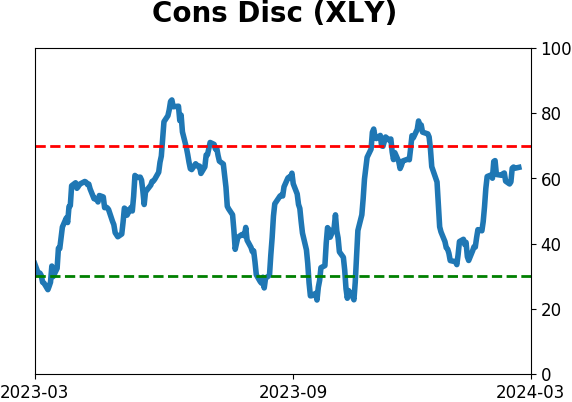
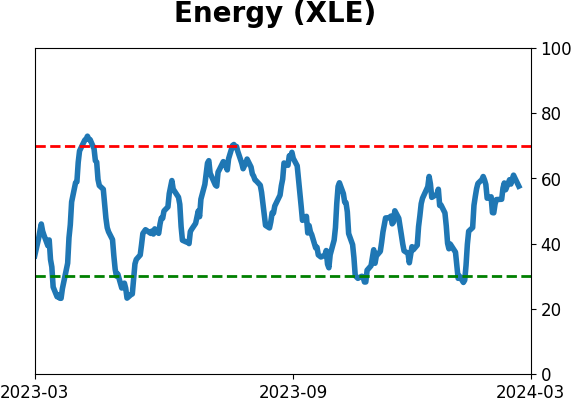
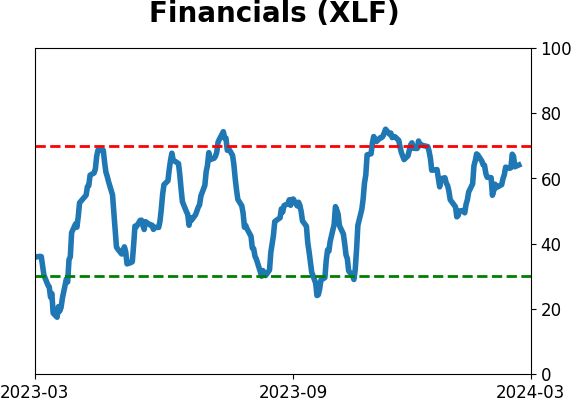
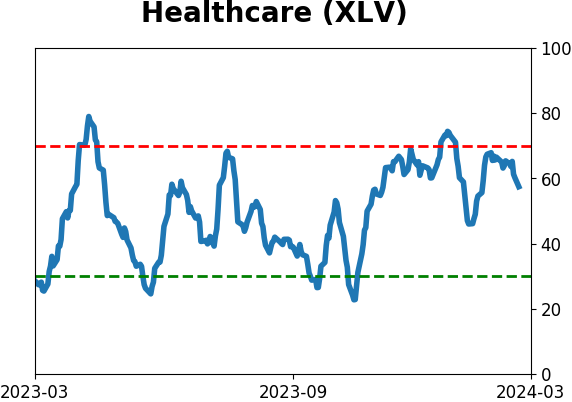
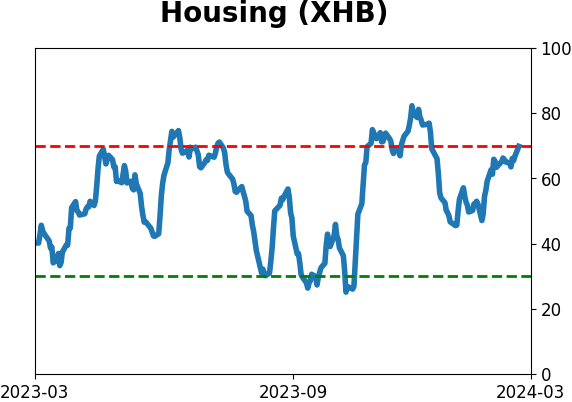
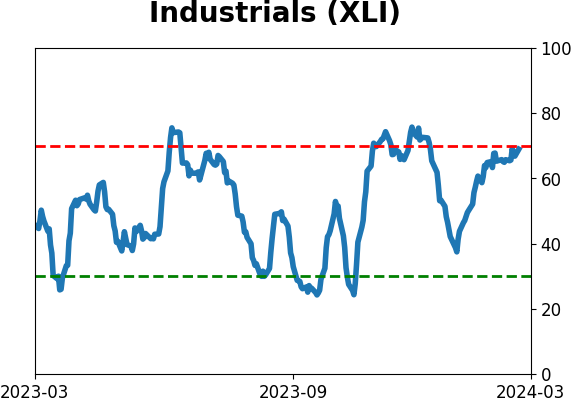
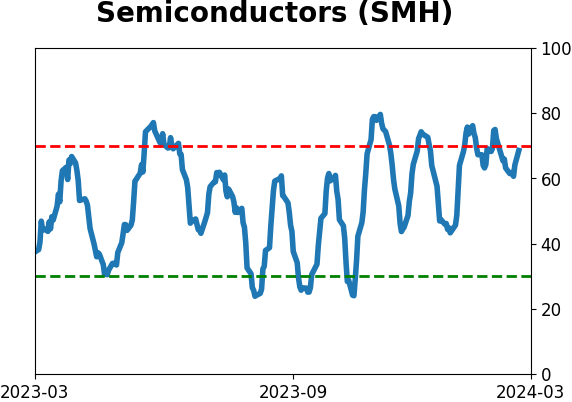
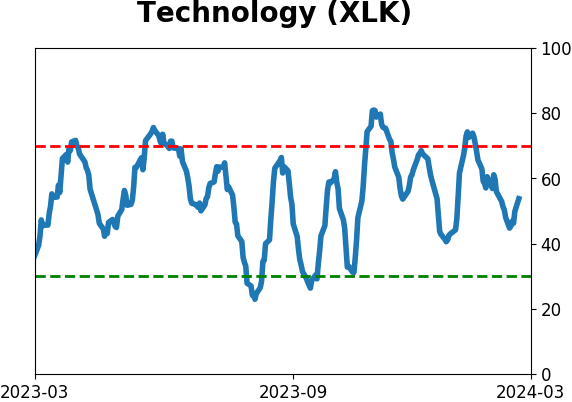
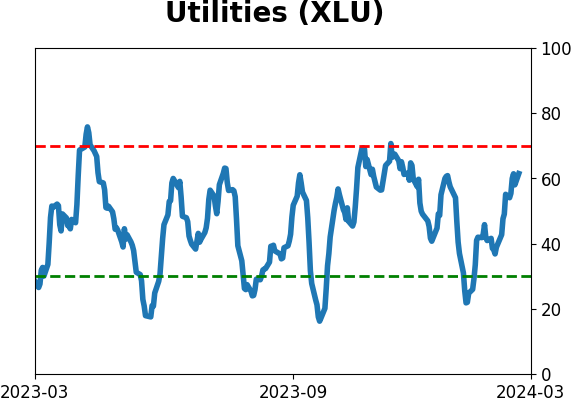
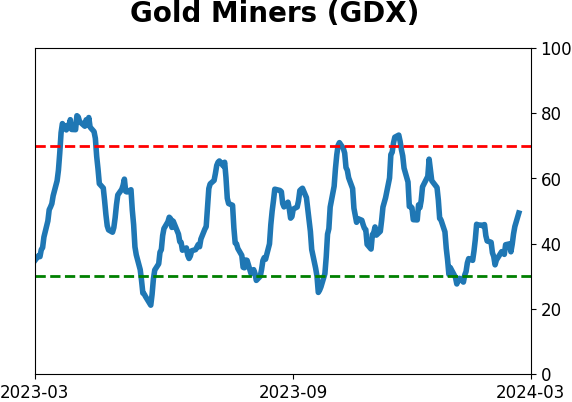
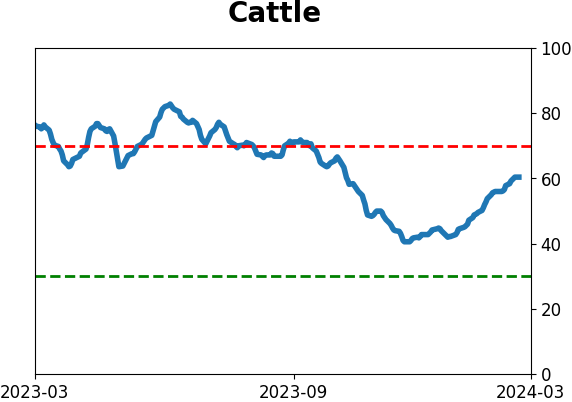
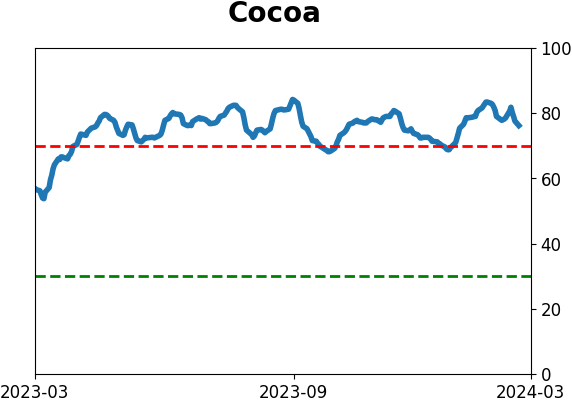
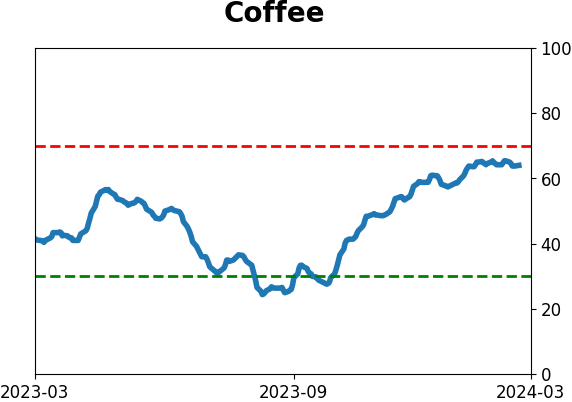
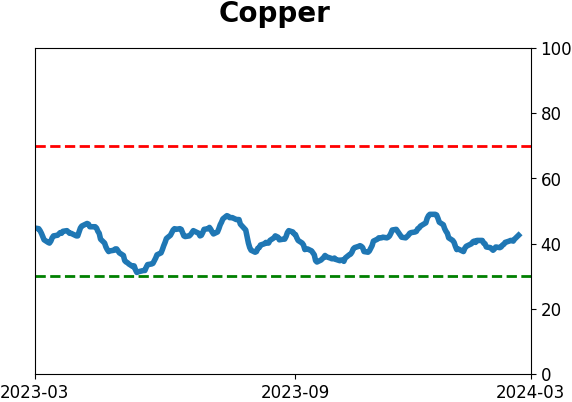
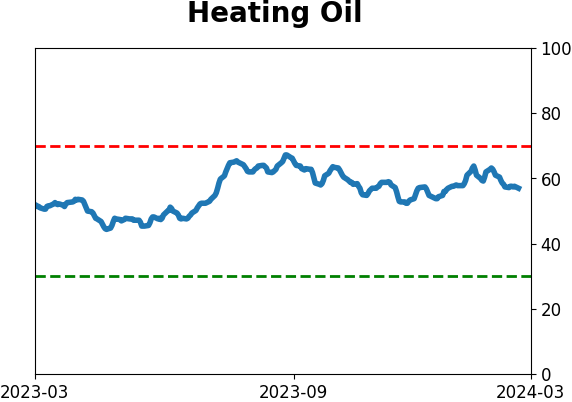
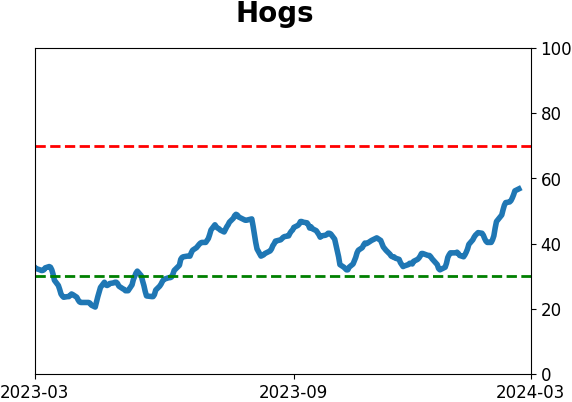
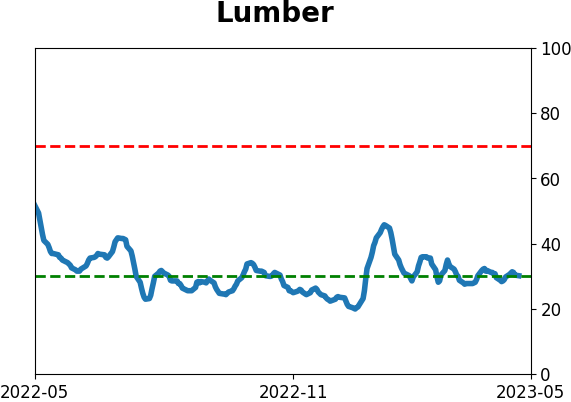
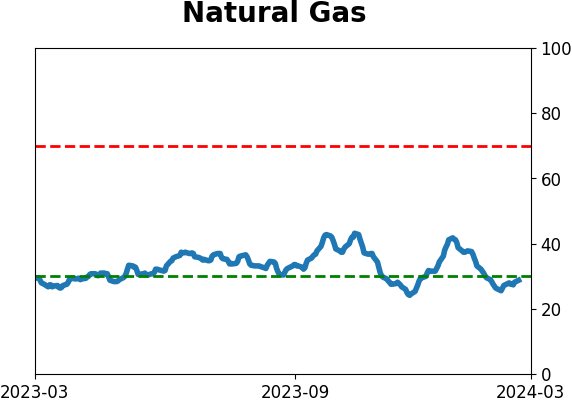
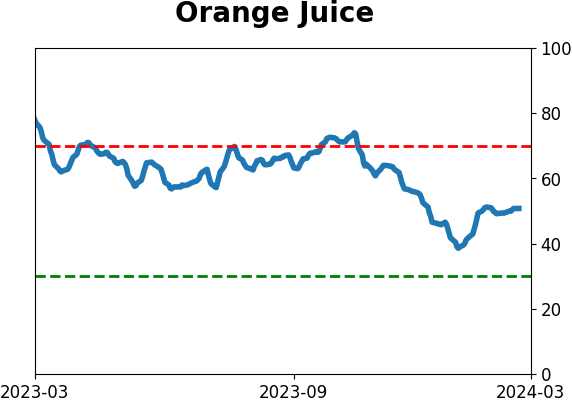
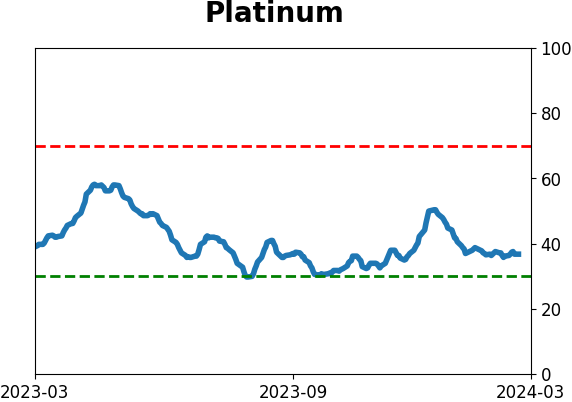
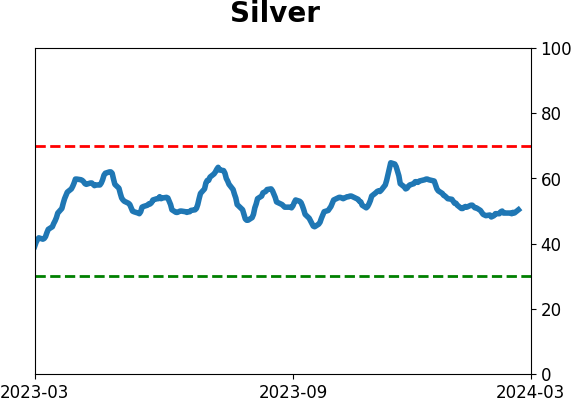
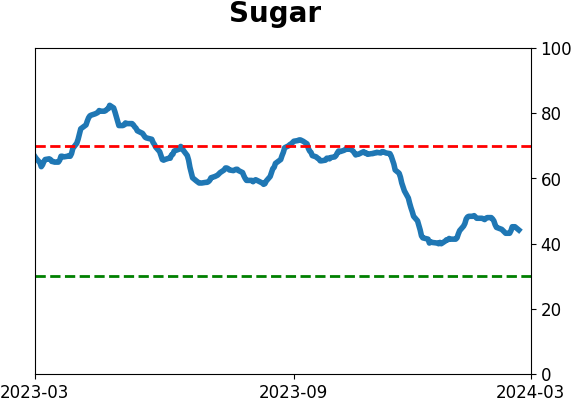
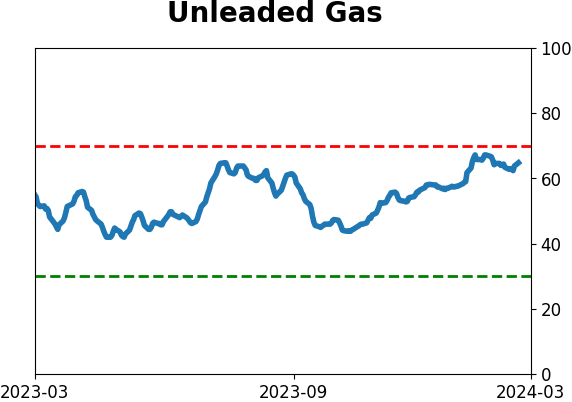
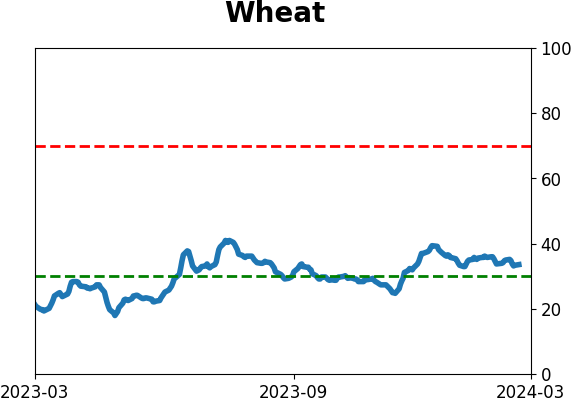
Optimism Index Thumbnails
|
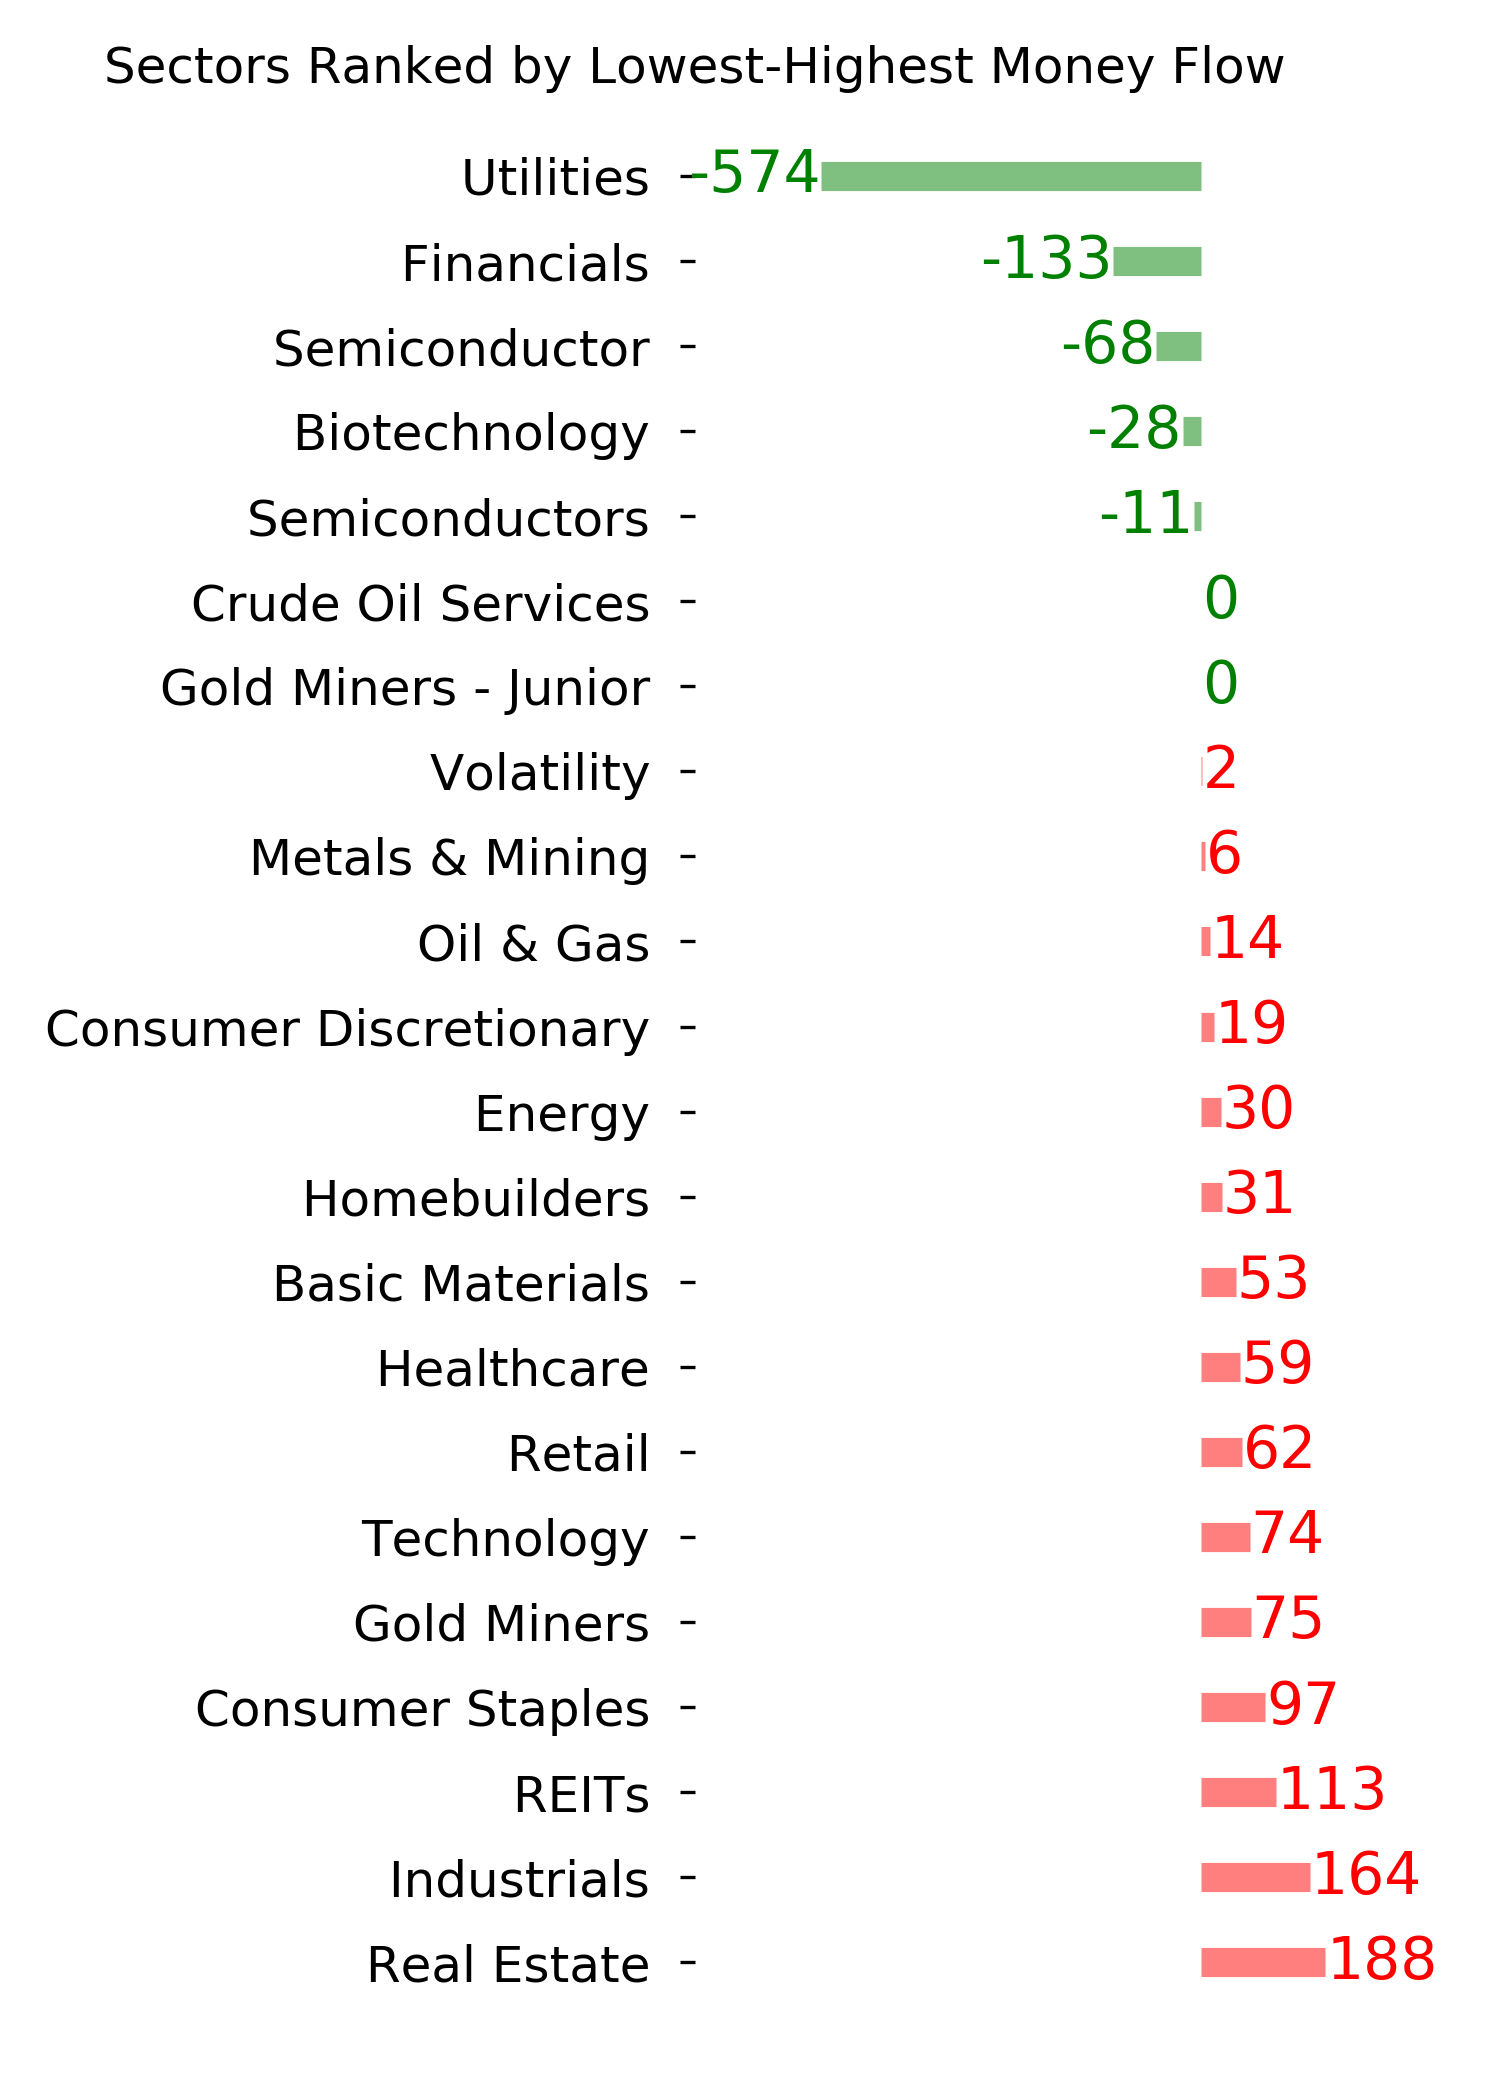
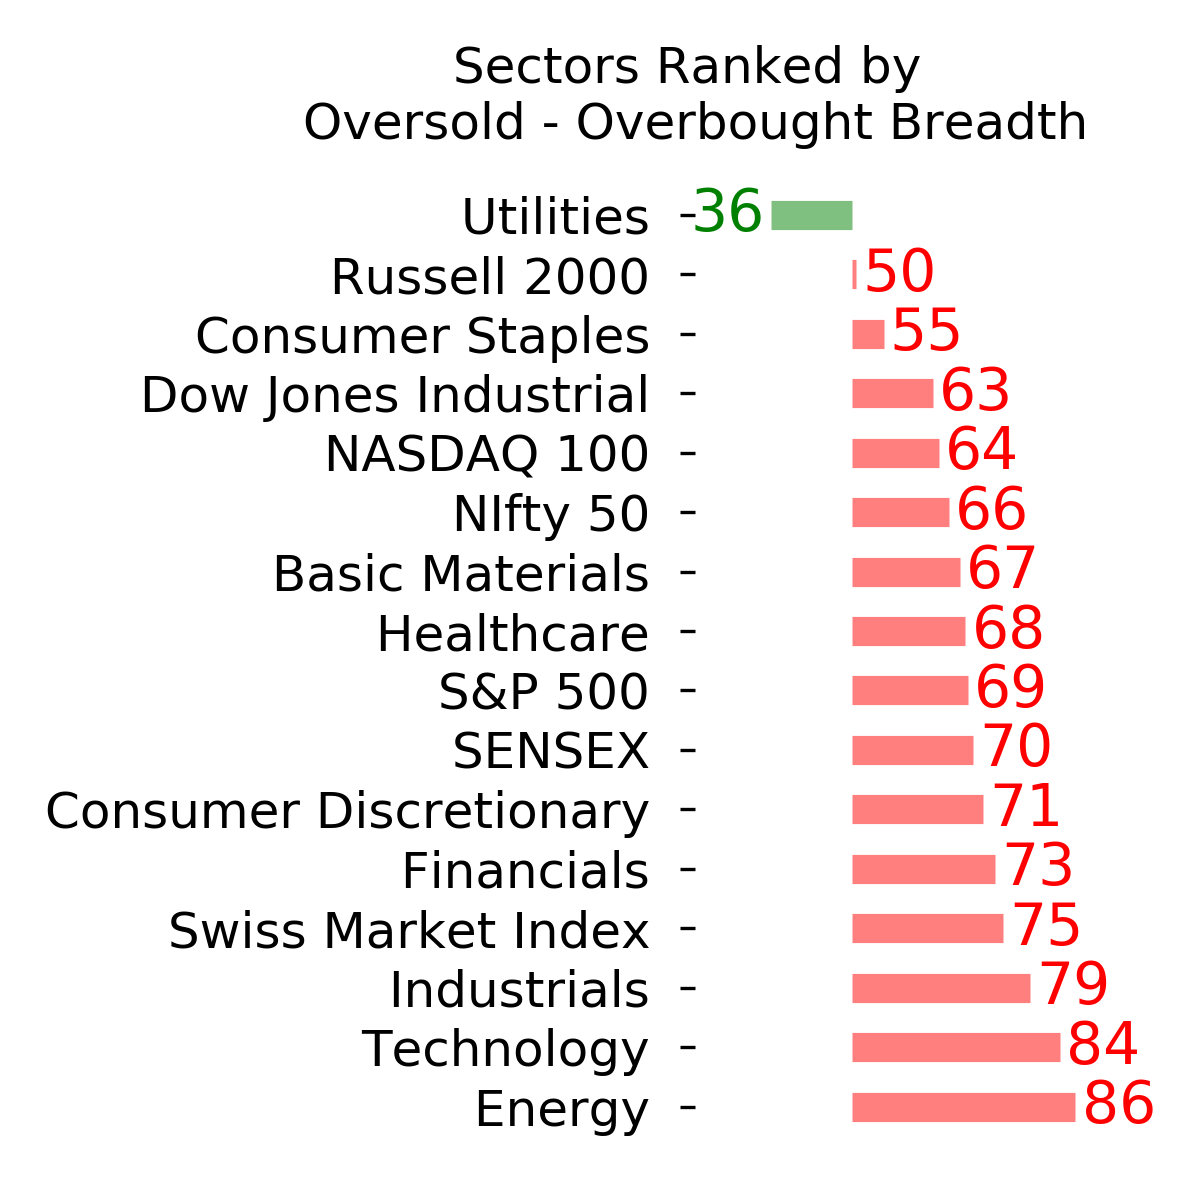
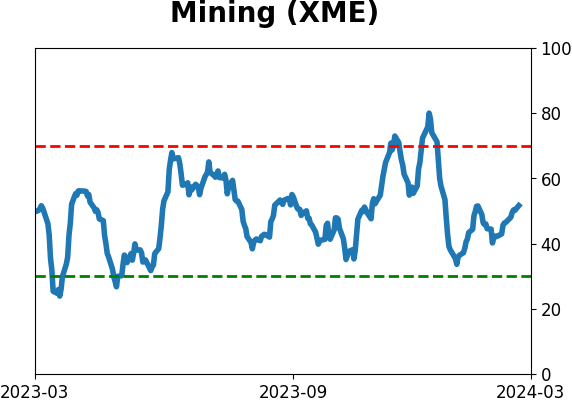
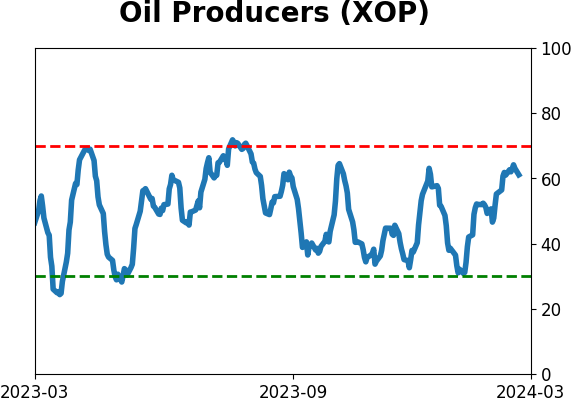
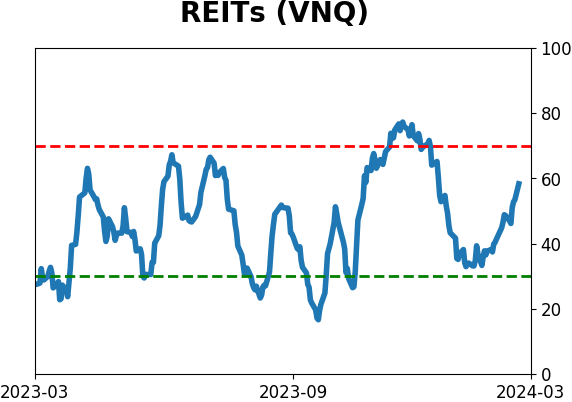
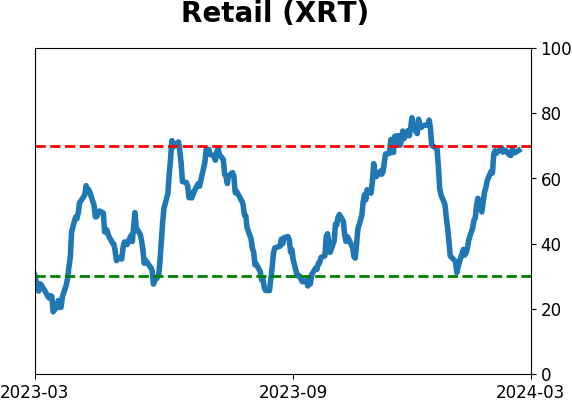
Sector ETF's - 10-Day Moving Average
|
|
|
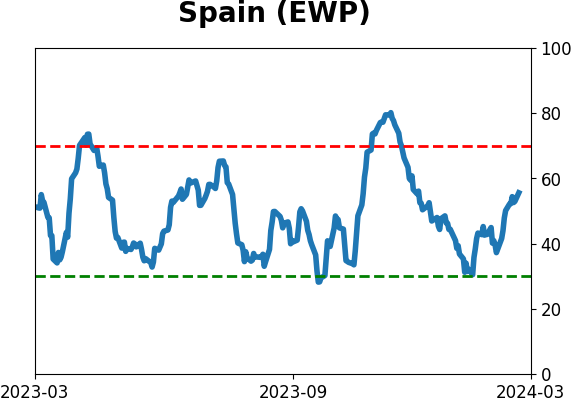
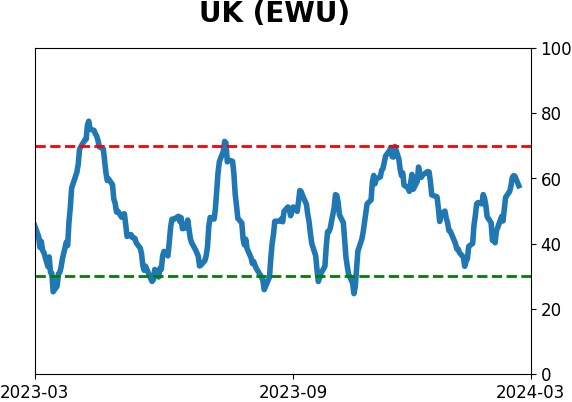
Country ETF's - 10-Day Moving Average
|
|
|
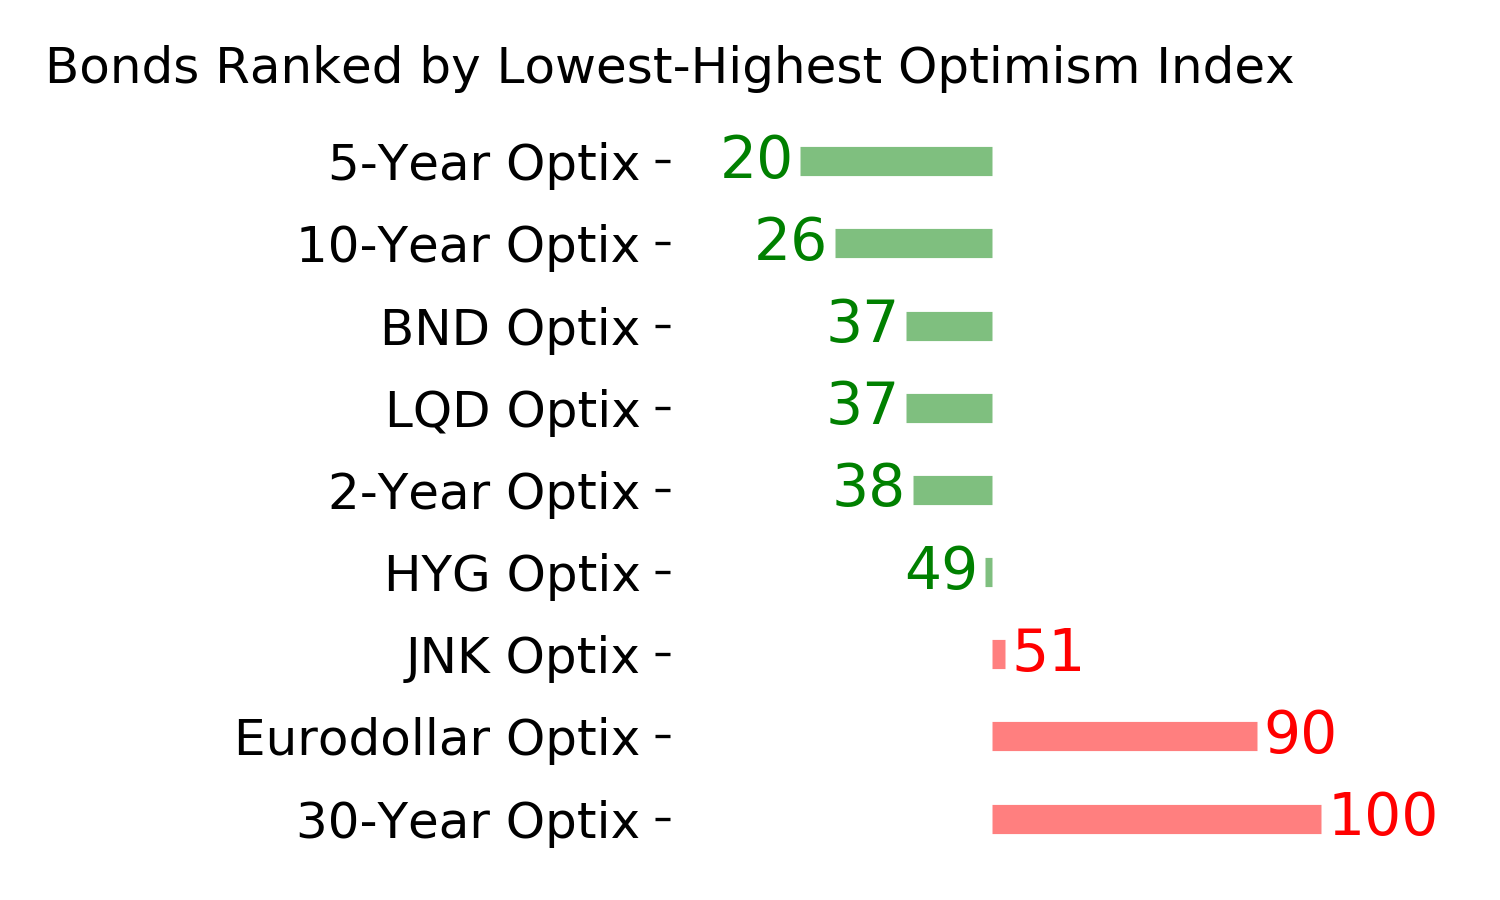
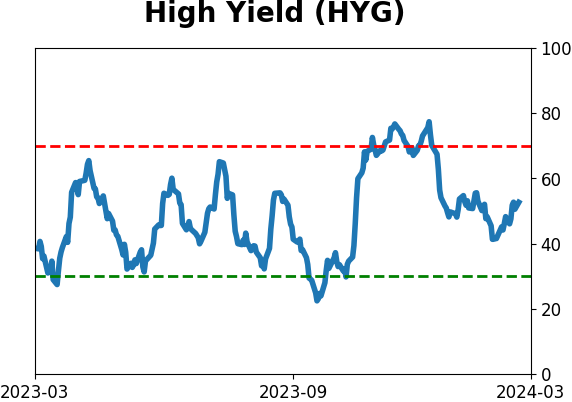
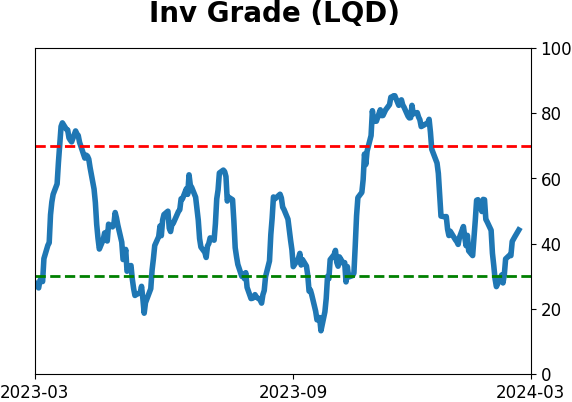
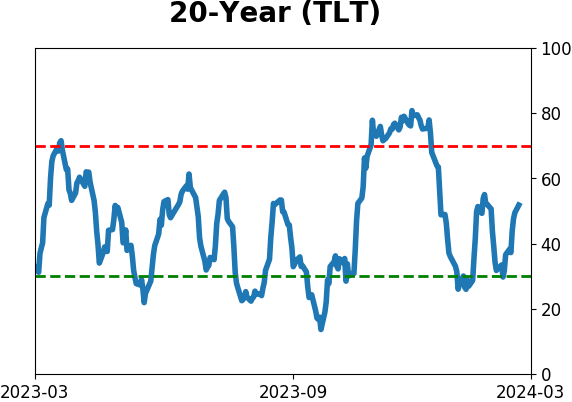
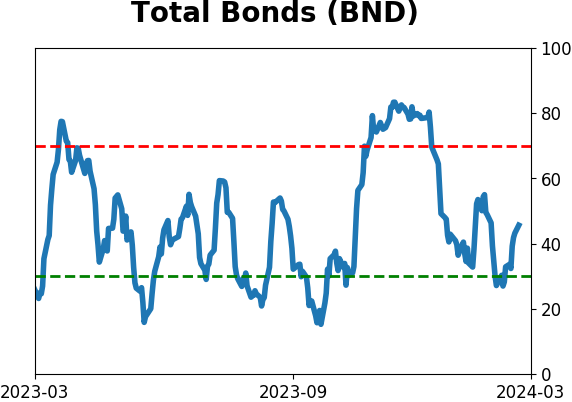
Bond ETF's - 10-Day Moving Average
|
|
|
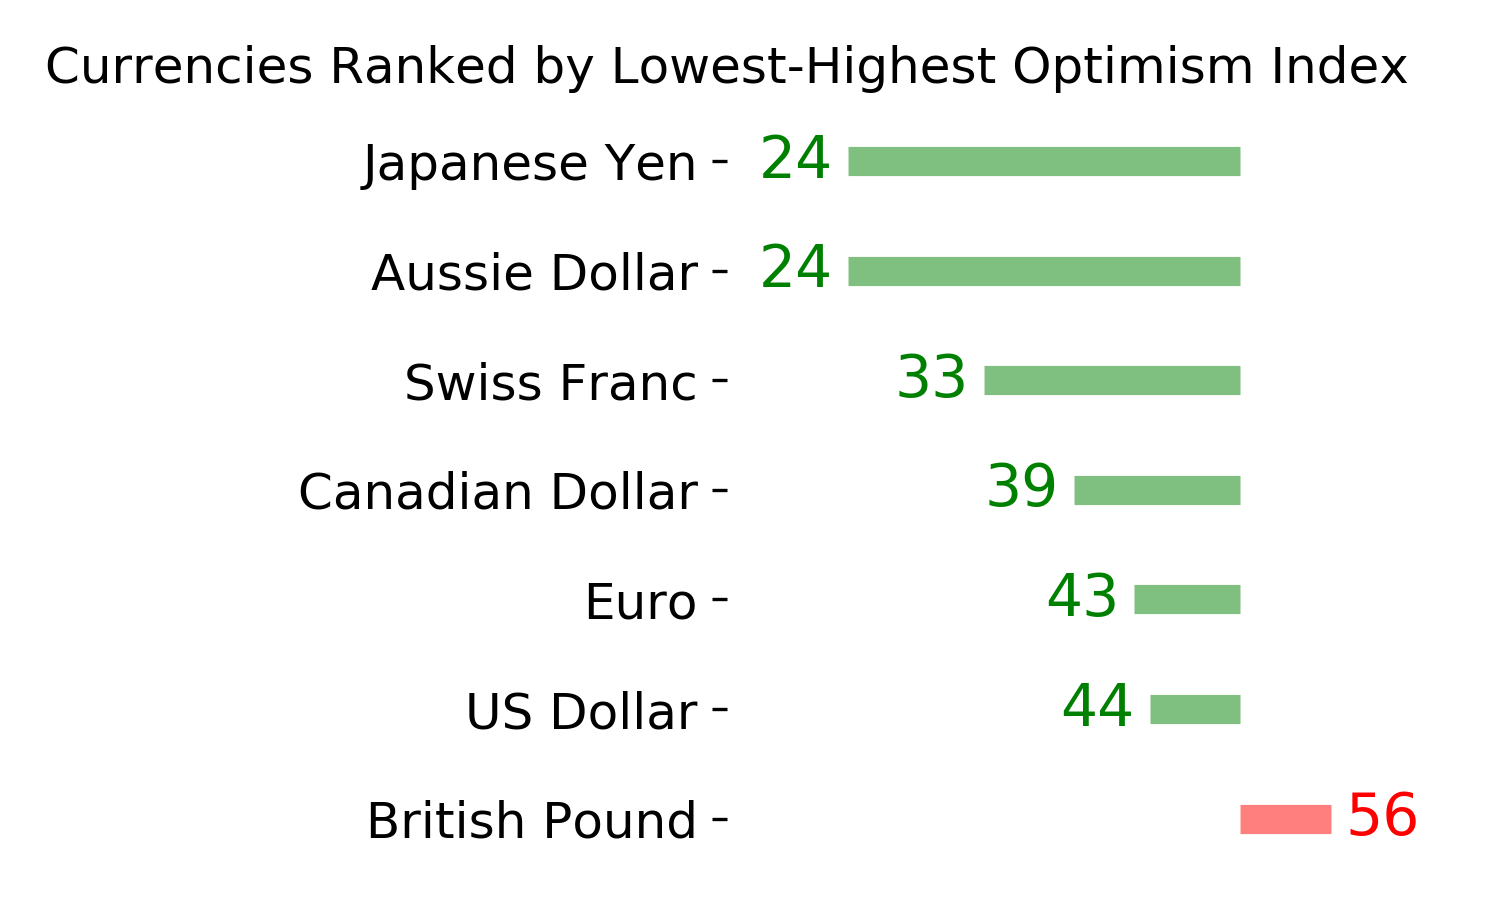
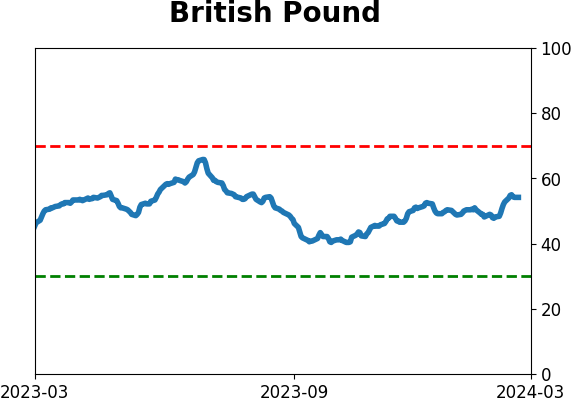
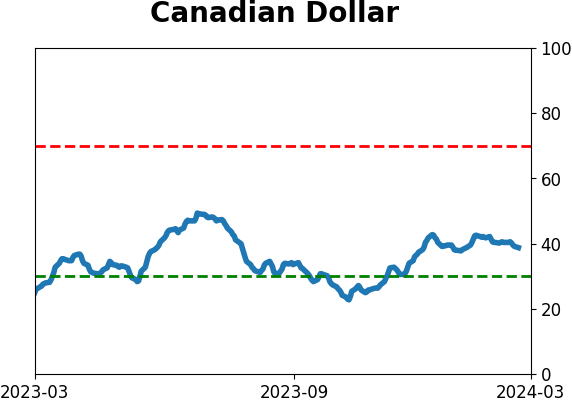
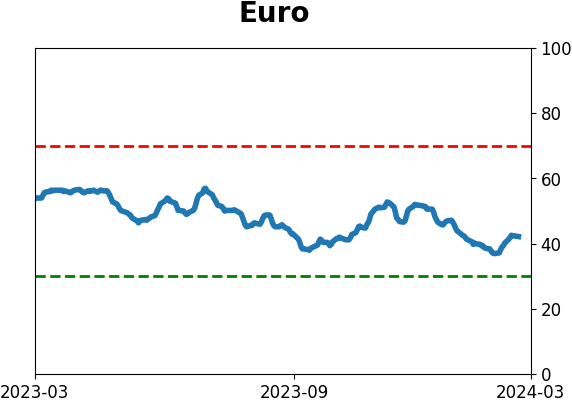
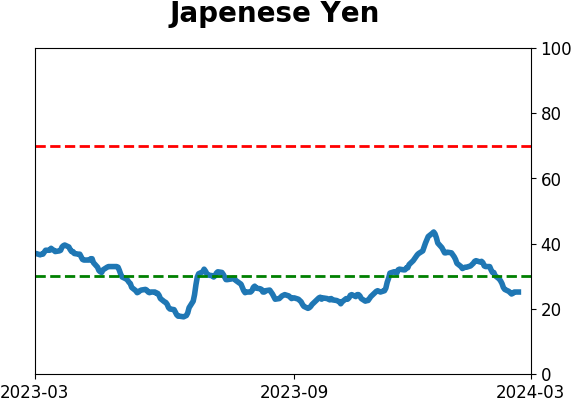
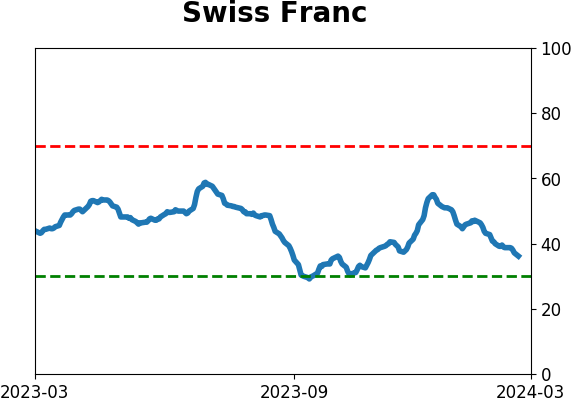
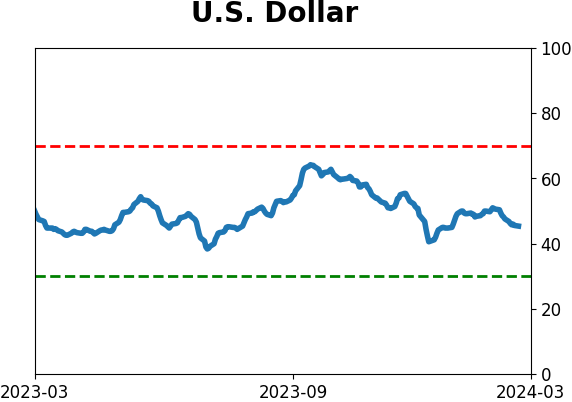
Currency ETF's - 5-Day Moving Average
|
|
|
Commodity ETF's - 5-Day Moving Average
|
|