Daily Report : TradingEdge Weekly for Mar 3 - Defensive stumbles, volatility events, seasonal tailwinds, natural gas potential

| View/Print a PDF version of this Report |
Headlines
|
TradingEdge Weekly for Mar 3 - Defensive stumbles, volatility events, seasonal tailwinds, natural gas potential: This week, we saw that defensive sectors are getting hit even as traders have been betting on a volatility event. If it happened now, it would be unusual, as stocks enjoy a strong seasonal tailwind for the next few months during pre-election years. Asia Pacific stocks, and high-yield bonds, have both struggled. Natural gas has some compelling bullish signals, which would be helped by another failure in the dollar's counter-trend rally. |
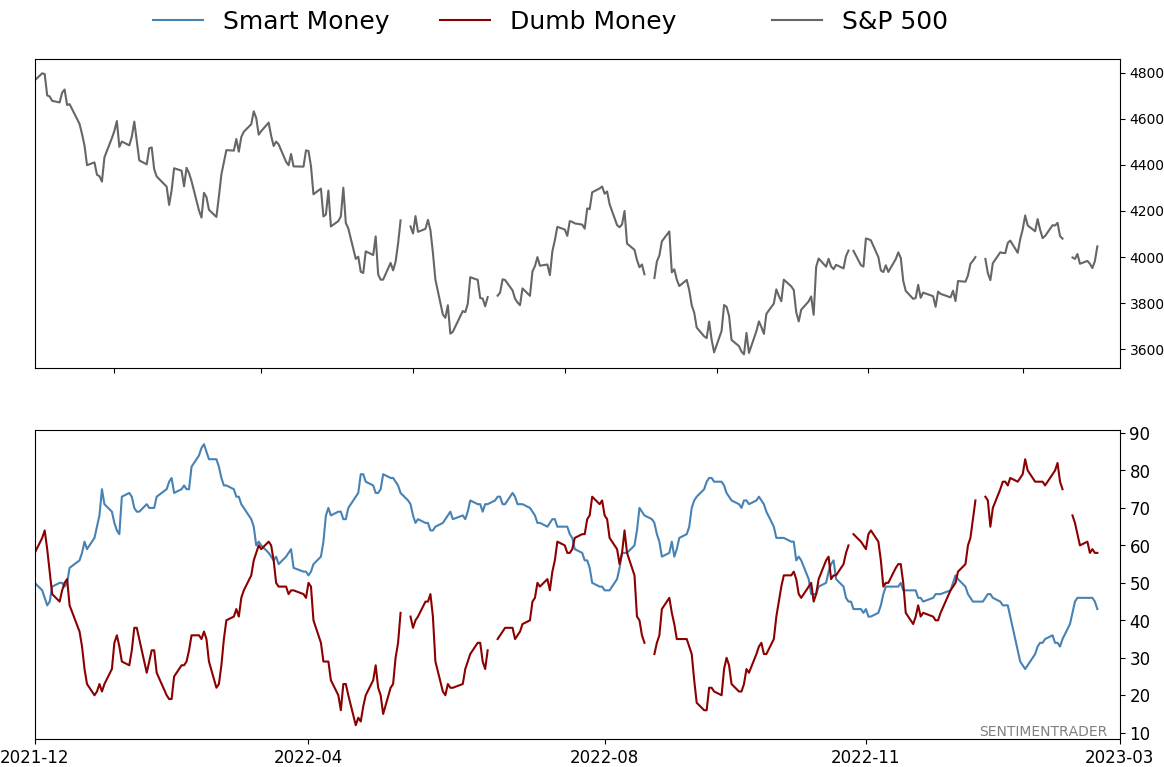
Smart / Dumb Money Confidence
|
|
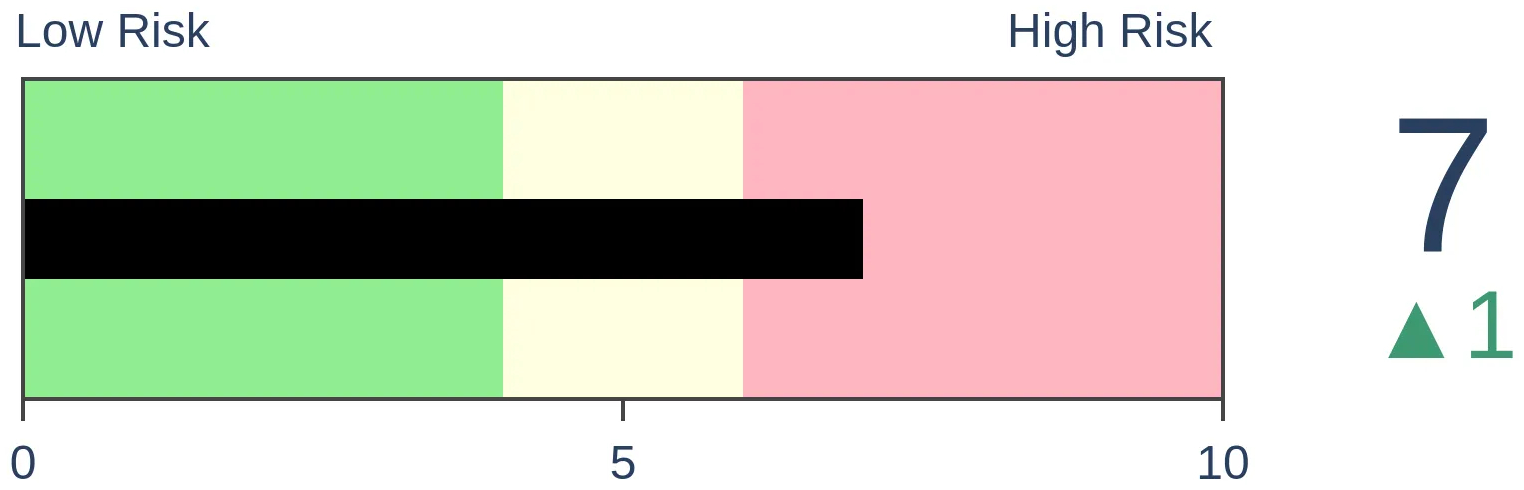
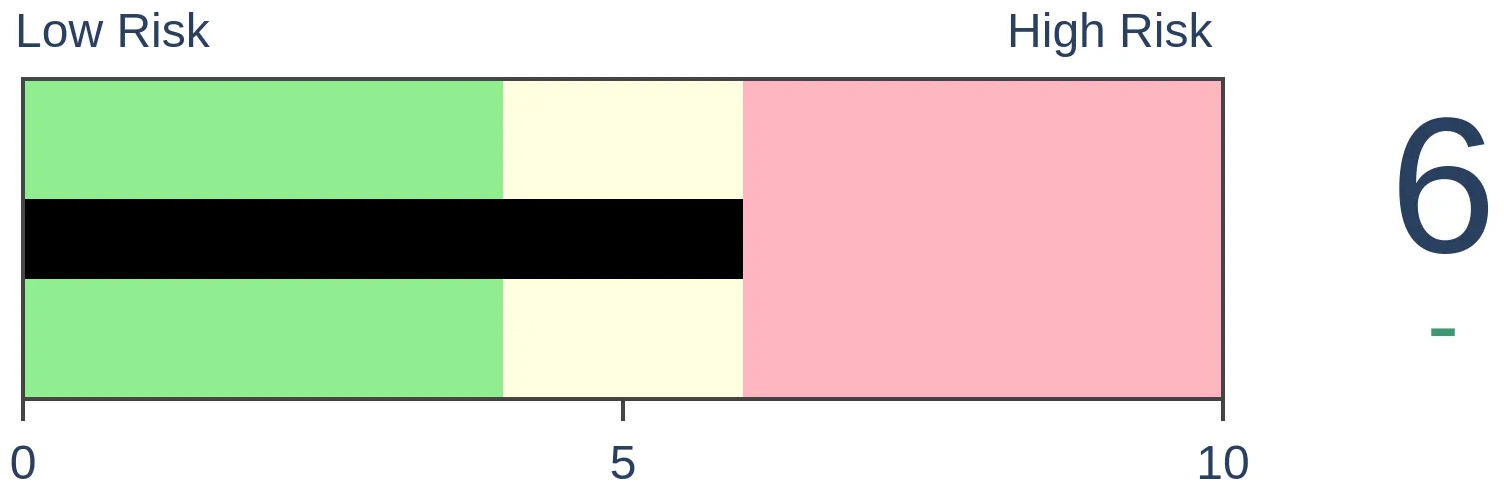
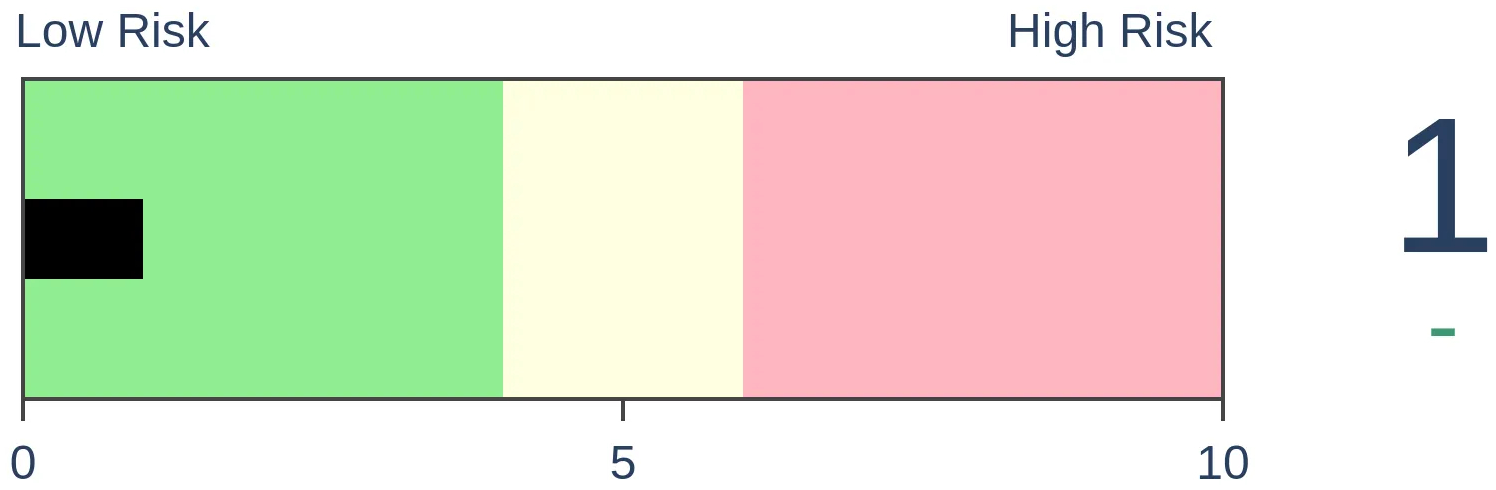
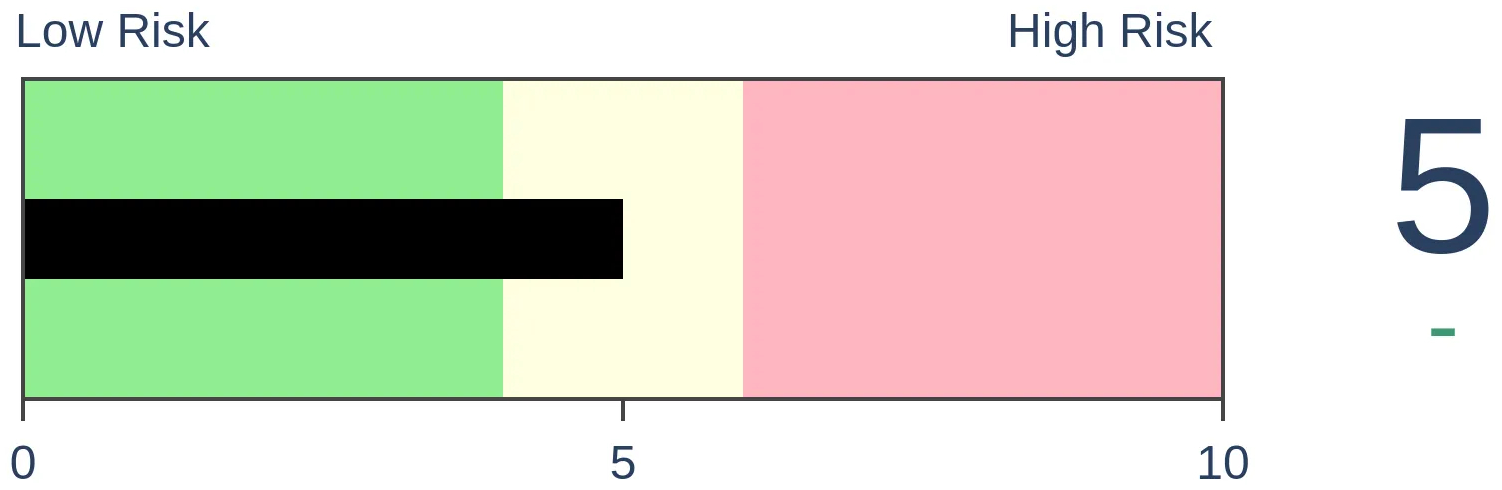
Risk Levels
|
|

|

Research
TradingEdge Weekly for Mar 3 - Defensive stumbles, volatility events, seasonal tailwinds, natural gas potentialBy Jason GoepfertBOTTOM LINEThis week, we saw that defensive sectors are getting hit even as traders have been betting on a volatility event. If it happened now, it would be unusual, as stocks enjoy a strong seasonal tailwind for the next few months during pre-election years. Asia Pacific stocks, and high-yield bonds, have both struggled. Natural gas has some compelling bullish signals, which would be helped by another failure in the dollar's counter-trend rally. FORECAST / TIMEFRAME |
Key points:
- Defensive sectors are getting hit, leading a jump in 1- and 3-month lows
- Maybe that has something to do with rapidly improving macro conditions
- Traders are betting on a volatility event, with persistently call volume in VIX options
- Seasonality would argue against that anytime soon, with pristine returns from March-July of pre-election years
- Stocks in the Asia Pacific region have stumbled badly, which usually begets more selling pressure
- High-yield bonds haven't reacted well since the thrust into January, though there are some oversold indicators
- Natural gas is entering a positive seasonal window
- More notably, the futures spread has widened to an extreme, which preceded rallies every time
- Using options for a defined-risk way to trade a rebound in natural gas stocks
- A rebound in natty would be helped by a falling dollar, which has enjoyed a large counter-trend rally
- One way to adjust a profitable options trade on a foreign currency ETF
Defensive sectors are getting hit
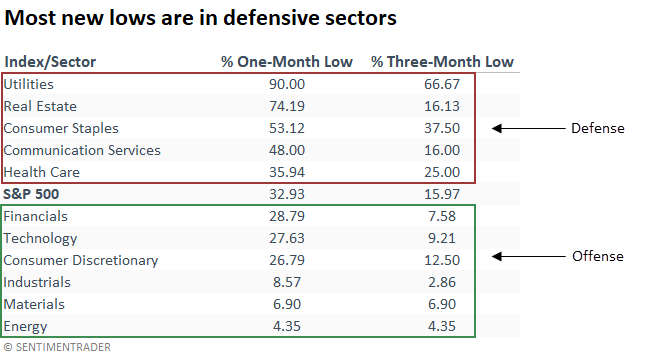
Defensive sectors are driving the expansion in the percentage of one and three-month lows. Dean showed that when defensive sector lows dominate, the S&P 500 is typically near the end of a pullback.
Typically, cyclical sectors in a correction or bear market lead the expansion in new lows as investors jettison risky groups. However, new lows in defensive sectors have dominated in the current pullback.
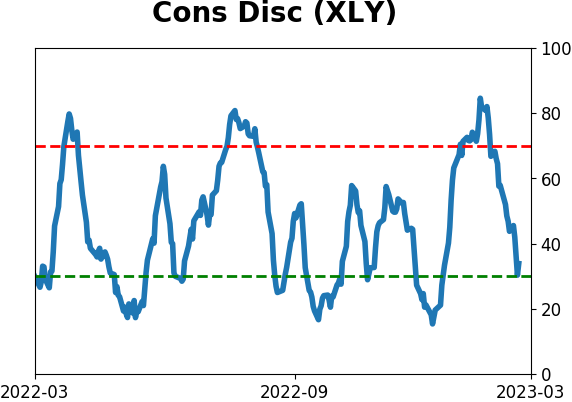
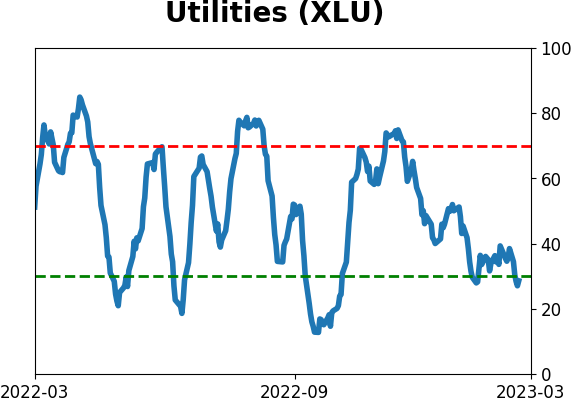
Over 35% of S&P 500 Consumer Staples stocks closed at a three-month low on Wednesday, while only 12.5% of Consumer Discretionary stocks did. And over 90% of S&P 500 utility sector stocks closed at a one-month low, far outpacing any cyclical sector.
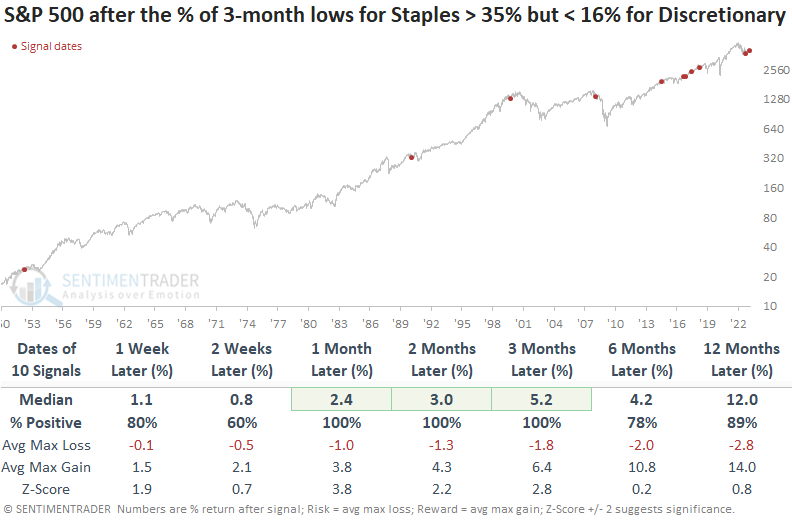
When three-month lows for the Consumer Staples sector exceed 35%, and three-month lows for the Consumer Discretionary sector are less than 16%, the S&P 500 showed a strong tendency to rally over the next few months. While the January 2008 signal was a significant failure on a long-term basis, it showed a gain across several time frames.
When more than 90% of S&P 500 Utility sector stocks close at a one-month low, the S&P 500 tends to trend upward, especially over medium and long-term time frames. The two previous signals in 2022 occurred near significant bottoms that led to explosive counter-trend rallies.
When applying the utility signals to sectors, cyclical groups outperform the defensive ones except for Health Care over long-term horizons.
Macro conditions are improving quickly
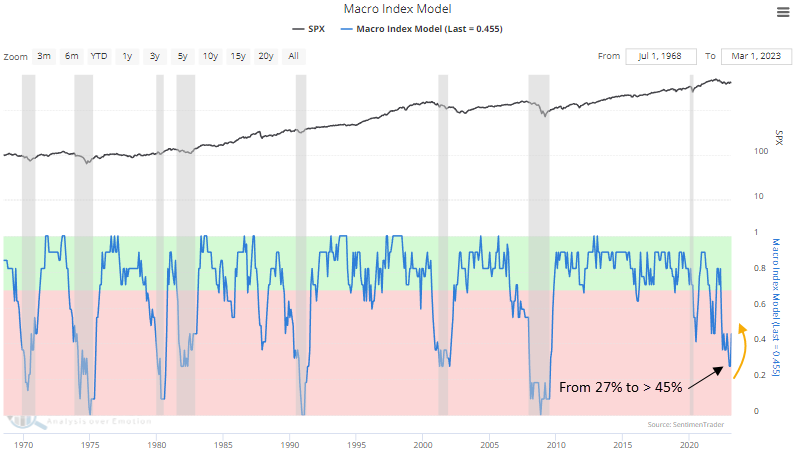
Defensive sectors are struggling as our Macro Index Model (MIM) surged over the past month. Dean noted that the model increased by over 18% on a month-over-month basis.
After falling to the lowest level in over a decade, the composite consisting of 11 diverse economic indicators to determine the state of the U.S. economy surged by more than 18%. While the MIM remains well below the favorable threshold of 70%, significant month-over-month surges like now tend to ignite a turning point for economic conditions that benefit stocks.
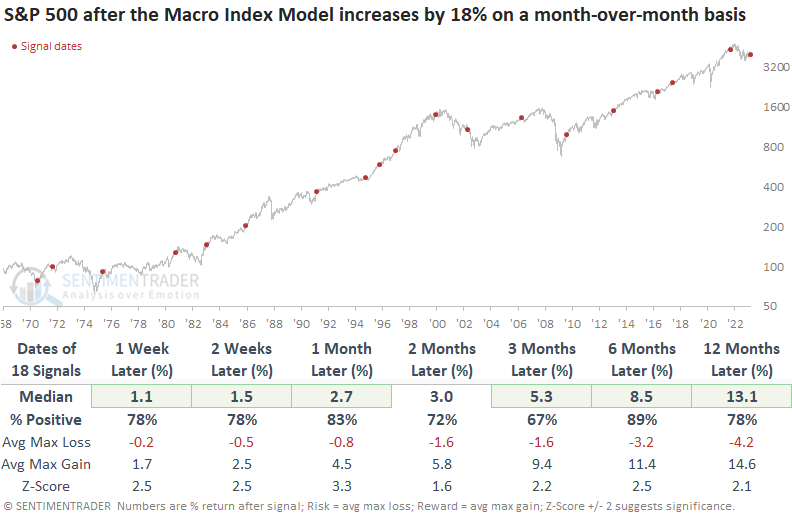
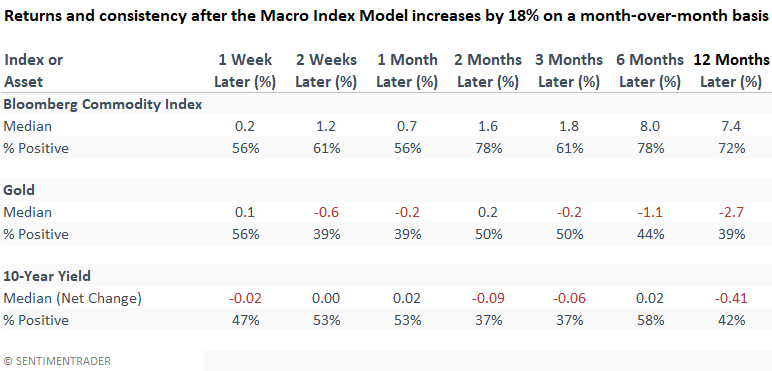
When the Macro Index Model increases on a month-over-month basis by 18% or more, the S&P 500 responded with a bullish outcome. Returns, win rates, and z-scores look excellent across all time frames. The only significant failure occurred in 2002.
From a sector perspective, Consumer Discretionary and Industrials tended to perform well over the next year, which aligns with current relative strength trends.
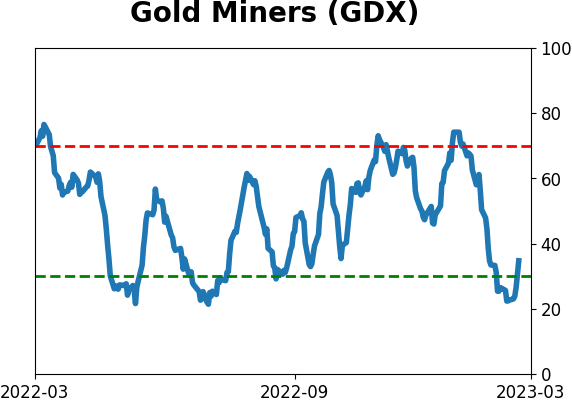
Commodities also tended to benefit from a jump in economic activity. However, the same can't be said for gold, as the metal was more likely to falter. The net change and win rates in the 10-year yield are a mixed bag.
Traders seem to be betting on a volatility event
There is always something for investors to wring their hands about. Financial media is only too eager to supply that demand because they know that fear sells. It always has and always will.
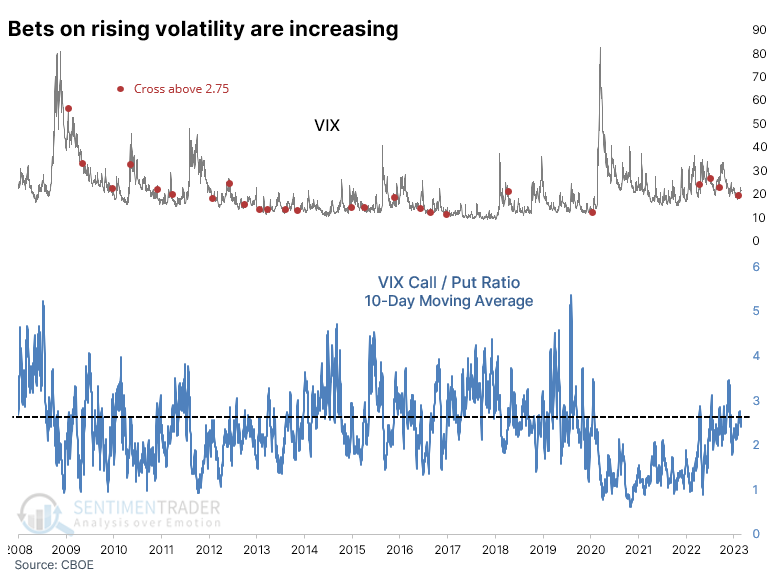
One of the latest worries is that traders are building up bets that volatility is about to increase. Over the past ten days, the ratio of call option volume to put option volume has risen, but it's been elevated for months. It's in the upper end of its range, but nothing extreme. When the ratio crossed 2.75, which it did recently, it didn't mean anything consistent for the VIX.
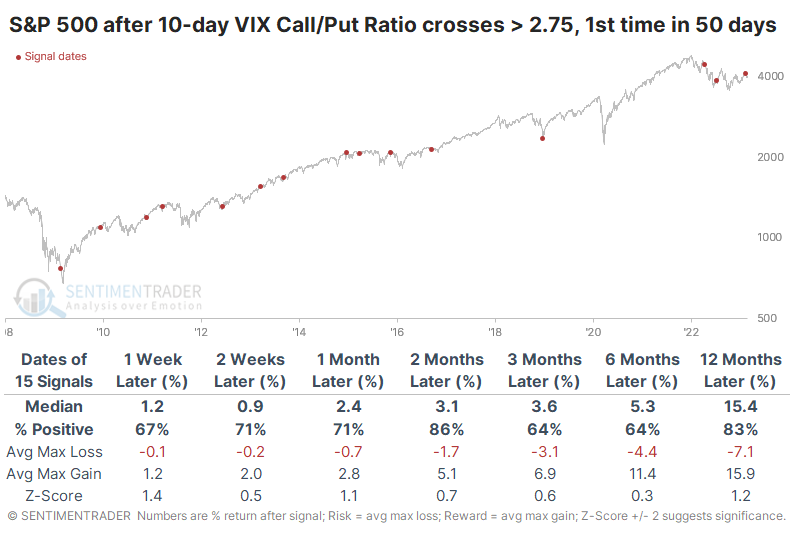
The VIX is almost impossible to trade, as the ETF proxies are nearly perfect wealth-destroying machines. If we look at rises in the VIX Call/Put Ratio and their impact on an index like the S&P 500, there wasn't much cause for concern. It did precede a few nasty drawdowns, but over the next two months, 13 out of 15 signals saw a rally in the S&P (both of the negative returns were double-digits, though).
The elevated call volume has been sticky, meaning many call options haven't expired and are still outstanding. So, the open interest of calls relative to puts is high; it's more than 3-to-1. Again, this has been assumed to be bullish for volatility and bearish for stocks. One could kinda-sort make that argument as long as one was willing to wait anywhere from weeks to years for the "volatility event" to occur.
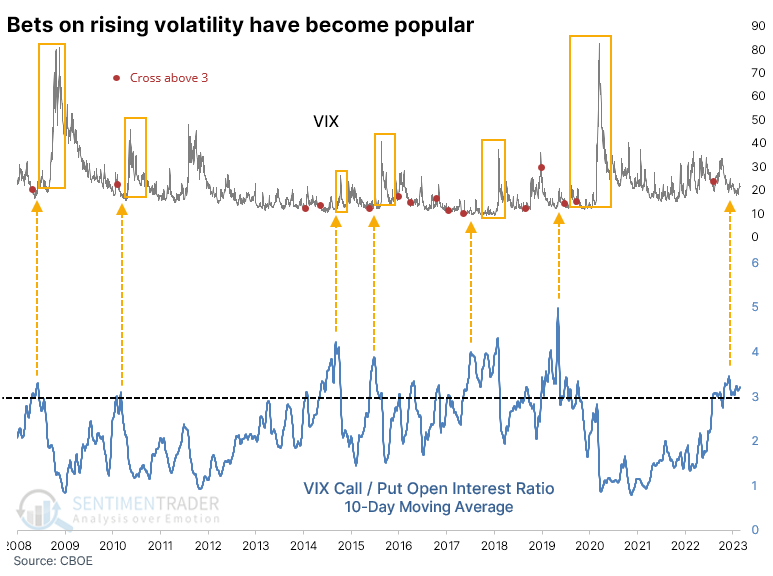
Whenever the ratio of outstanding call options to outstanding put options crosses 3.2 to 1, which it did last week, the S&P suffered a few nasty declines. Still, it would have been frustrating to consistently trade on this idea, as most of the signals preceded gains.
Such an event would go against a strong seasonal tailwind
Jay showed that seasonality may still provide a boost for stocks in the months ahead. March through July of pre-election years has been good for stocks and particularly favorable for Nasdaq-listed ones.
The chart below displays the annual seasonal trend for the S&P 500 Index. Note the typical favorability during the March through July period.
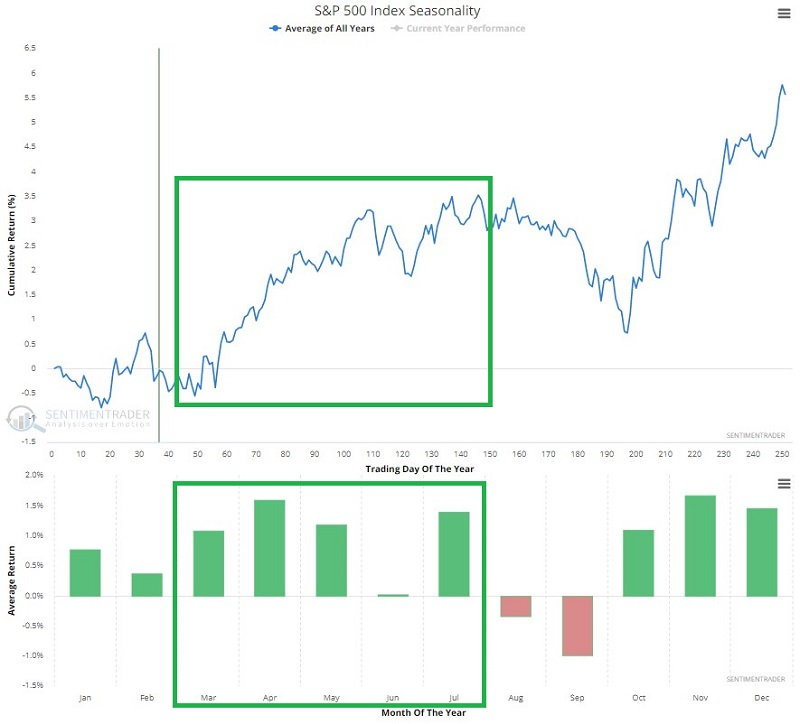
There is an interesting quirk regarding the election cycle. Since 1920, this seasonal window during non-pre-election years showed a gain 62% of the time, with an average gain a bit higher than the average loss. They were about twice as likely to show a 10% gain as a 10% loss.
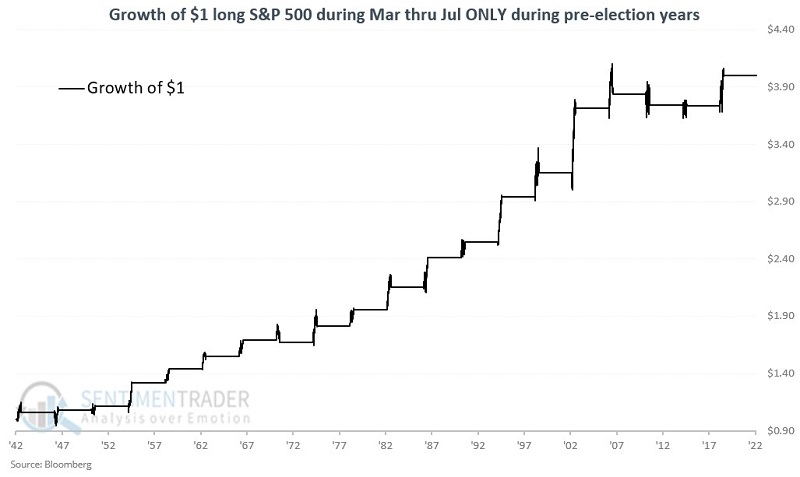
Now let's focus only on pre-election years. The March-July winning percentage rises from 62% to 76%, the median up year improves from +7.2% to +8.8%, and it was three times more likely to see a large gain than a large loss.
Another thing to note is that since the start of the 1940s March-July pre-election year performance has been much better. During the 1920s and 1930s, there were two wins and three losses.
The chart below highlights S&P's March-July pre-election year performance starting in 1943. Performance has been noticeably consistent over the past 80 years (85% Win Rate, four gains over +10%, and a maximum decline of only -2.6%).
It has been even better for the Nasdaq. For the following test, we will use the Nasdaq Composite Index from 1971 to 1985 and the Nasdaq 100 Index after that. For brevity, we will refer to this as the "Nasdaq."
The chart below displays the growth of $1 invested in the Nasdaq only during March through July of each pre-election starting in 1971.
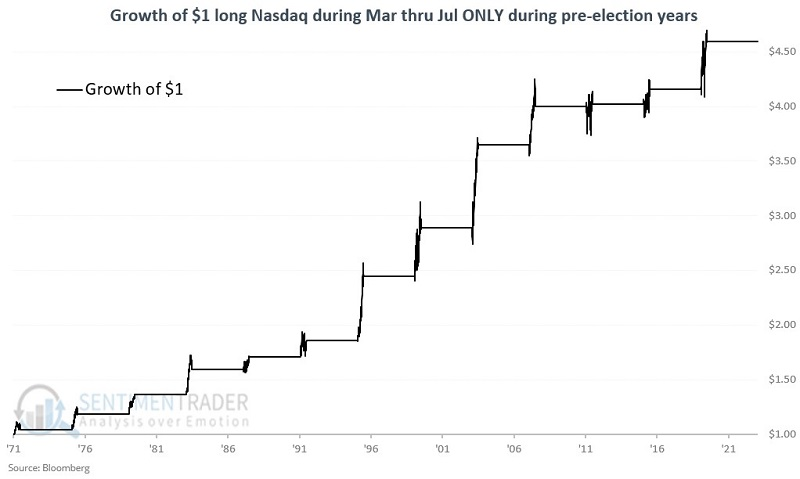
The index sported a gain 100% of the time, 13 for 13. Its median return was +10.6% and rallied more than 10% during seven of the years. Only once in 13 times did the S&P 500 outperform Nasdaq during this period.
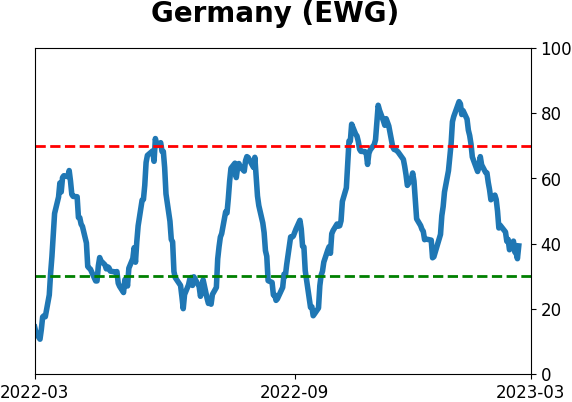
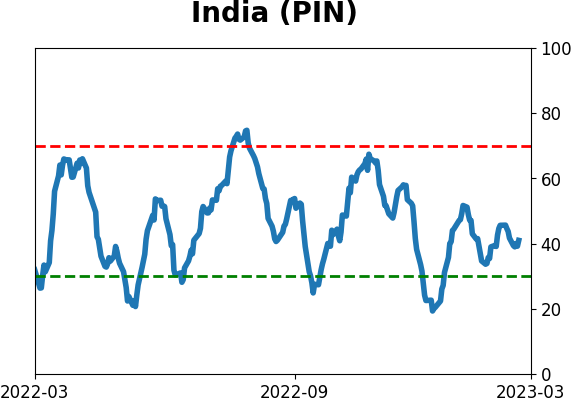
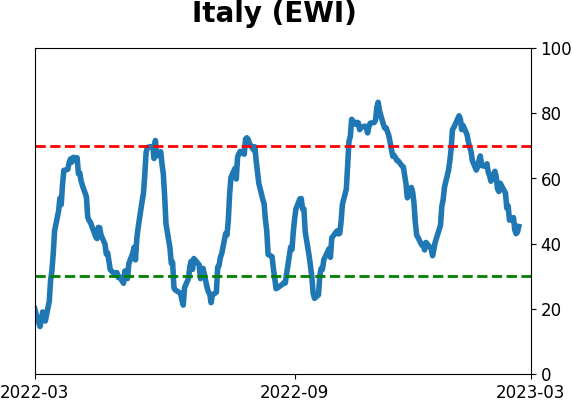
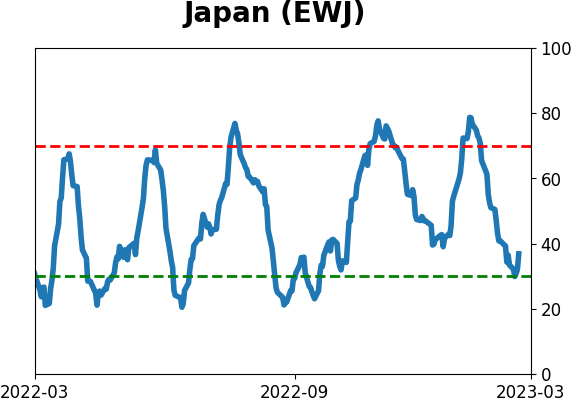
Asia Pacific stocks are breaking down
Dean noted that several breadth and price momentum indicators triggered risk-off signals for the Asia-Pacific region. After similar alerts, returns for an Asia-Pacific index were negative over the next few months.
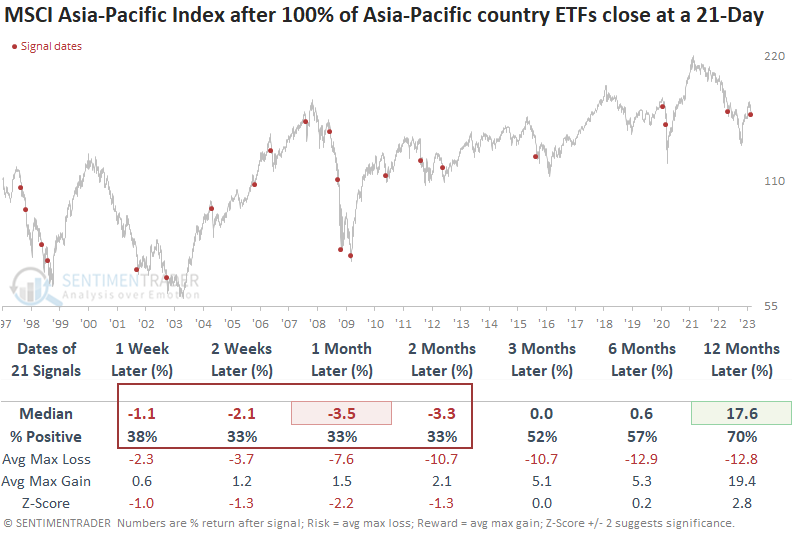
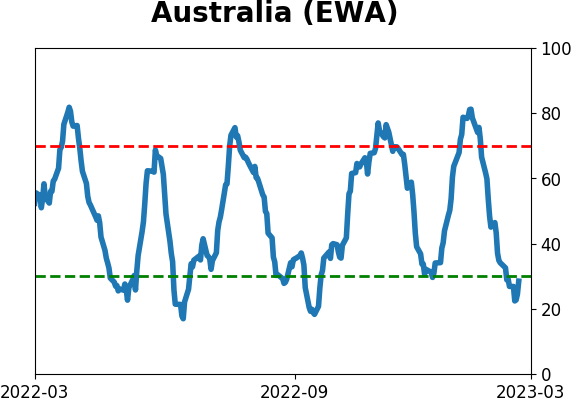
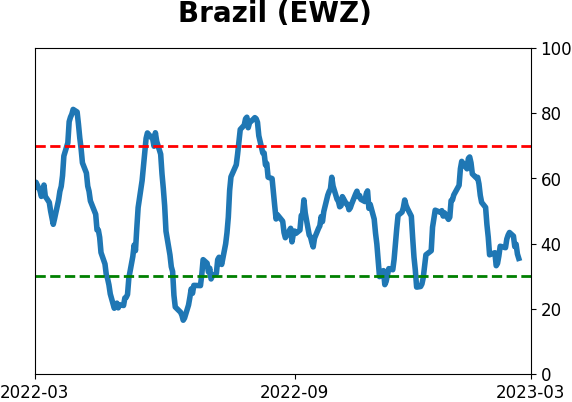
Last Friday, every single Asia-Pacific country ETF closed at a 21-day low. The synchronized expansion in lows is troubling as it typically only occurs within the context of bear markets.
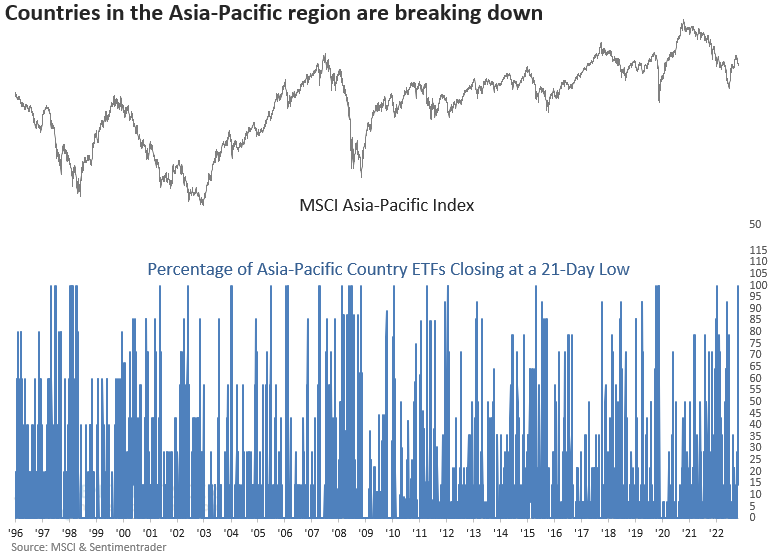
When every Asia-pacific country ETF closes at a 21-day low, the MSCI Asia-Pacific Index struggles over the next few months. The signal shows a loss at some point over that time frame in 19 out of 21 cases.
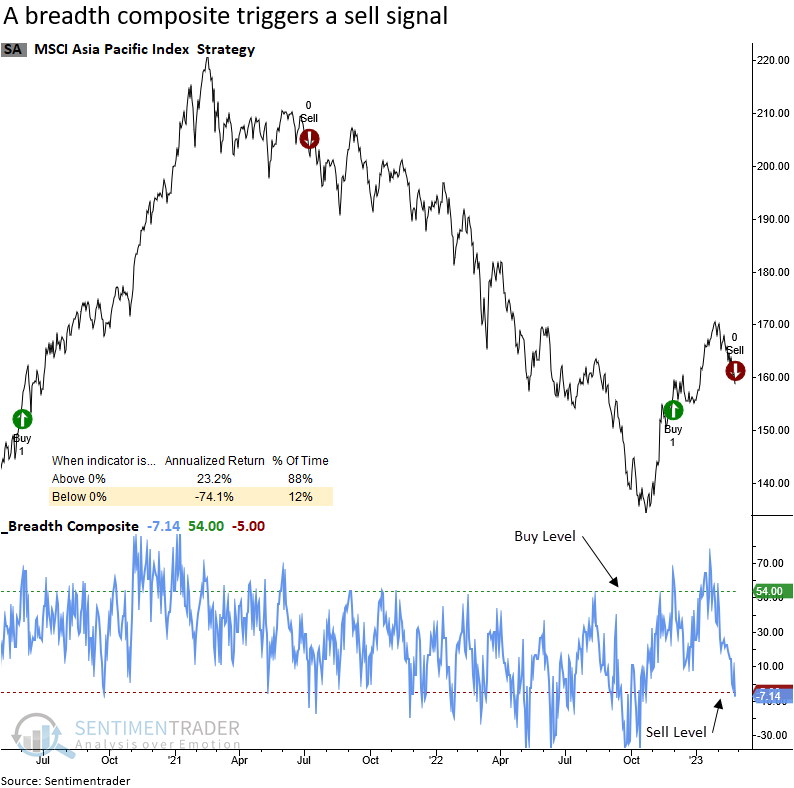
A breadth composite that measures participation trends for country ETFs in the Asia-Pacific region also registered a risk-off signal. Annualized returns look abysmal when the composite falls below zero, which is the case now.
The Relative Strength Index (RSI), a momentum indicator developed by J. Welles Wilder Jr., can be applied to individual stocks within an index or a basket of ETFs to create a composite similar to the often-mentioned percentage of issues above the 50-day average.
On Friday, the percentage of Asia-Pacific country ETFs on an RSI buy signal declined below 28%, triggering a risk-off alert. Similar to the breadth composite, an assessment of annualized returns looks unfavorable when the composite falls below 25%, which is the case now.
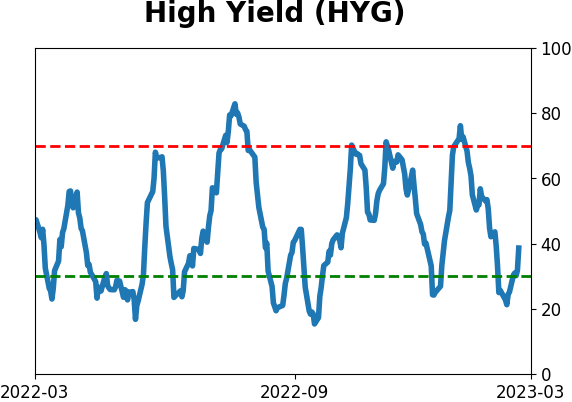
High-yield bonds are struggling, too
Ostensibly, one of the first places for trouble to show up is in high-yield bonds. As a sort of hybrid market between stocks and bonds, this is often where smoke will first start to smolder, as credit traders sell in anticipation of a shaky economy, corporate earnings, and debt coverage.
And those bonds have been acting terribly.
When investors panicked in October, there was a spike lower in the net percentage of high-yield bonds trading at a 52-week high minus 52-week low. It took until January for new highs to outnumber new lows - something not seen during the entirety of 2022 - and continued to surge into early February. This was similar to the last two recoveries in 2009 and 2020.
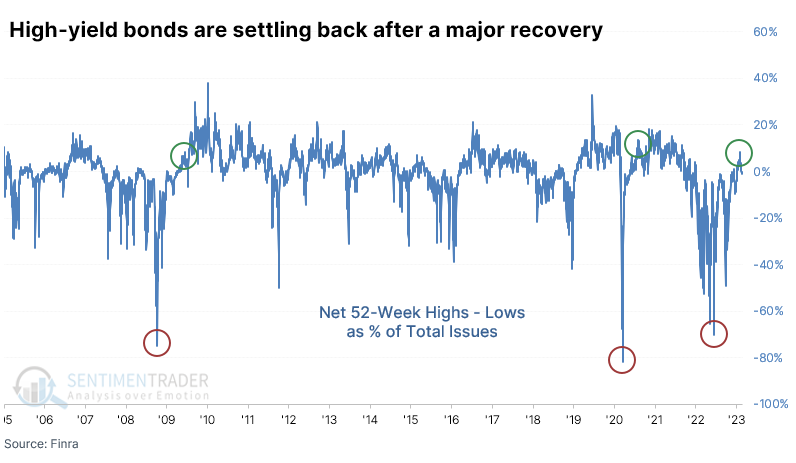
There is a sample size of two here, so of course, we can't read much, in anything, into it. It is disturbing that the reaction this time is significantly worse a couple of weeks after the surge than it was after the prior two instances.
If we look for lesser panics in 52-week lows and subsequent recoveries, we still see the worst reaction in the first two weeks. The others saw positive returns each time.
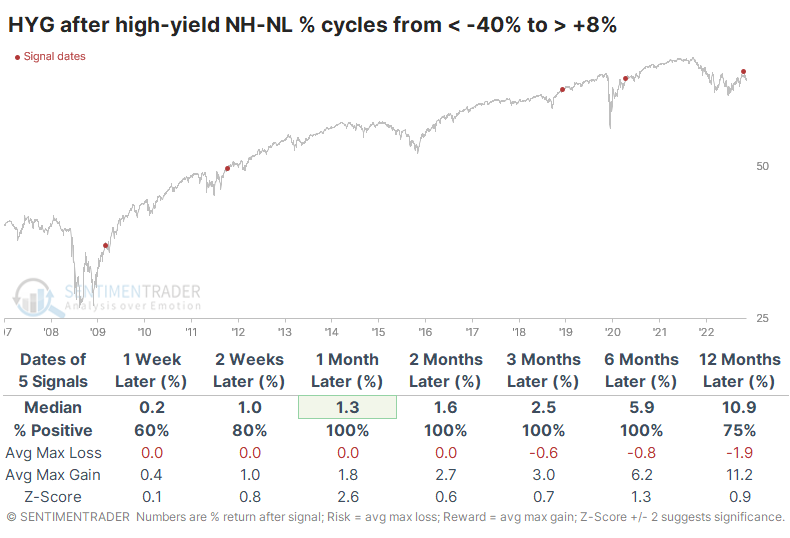
The maximum losses and gains table across each time frame shows how much the current signal is an outlier. There was a dip after the 2009 surge, but even that was less than the current one. And after the initial surge this time, there has been no upside whatsoever. That's not the kind of behavior seen during bull markets.
The breadth thrust in high-yield bonds last August suggested higher prices long-term, though there were some indications that it could be a rough month or so before that occurred. For the most part, that's what transpired so far, so no major worries there.
Over the past month, the wholesale selling of high-yield bonds has pushed some core breadth indicators into oversold territory. The Backtest Engine shows that whenever the McClellan Oscillator nears -90 or below, forward returns over the next 3-12 months were excellent.
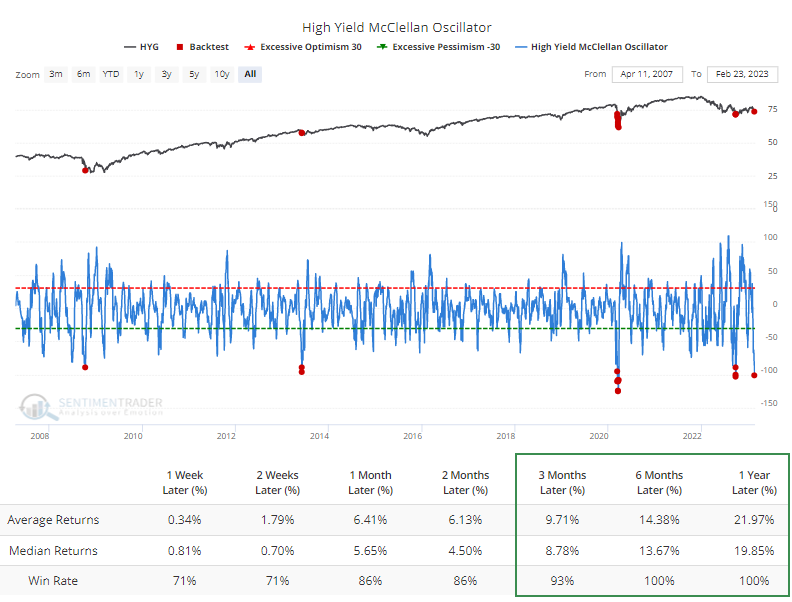
The long-term Summation Index has pulled back significantly after cycling from the worst oversold reading ever to an extremely high one. When this happened in 2010, high-yield bonds went through months of consolidation.
Traders have been fleeing the market, with the worst fund flow in the existence of HYG. Traders have pulled out an average of more than $400 million daily. The exodus has led to a plunge in outstanding shares, a rough gauge of overall investor interest in a fund. It's now down to the lower end of the range since 2015.
The seasonal window for high-yield bonds remains weak for a few more weeks. The seasonal cycle has troughed around mid-March, and April has historically shown the strongest returns, with the overall trend drifting higher throughout the summer months.
Natural gas now has a tailwind
Natural gas has plummeted -76% in just six months. Jay showed that the market is entering a favorable seasonal window. The chart below displays the annual seasonal trend for natural gas futures (ticker NG).
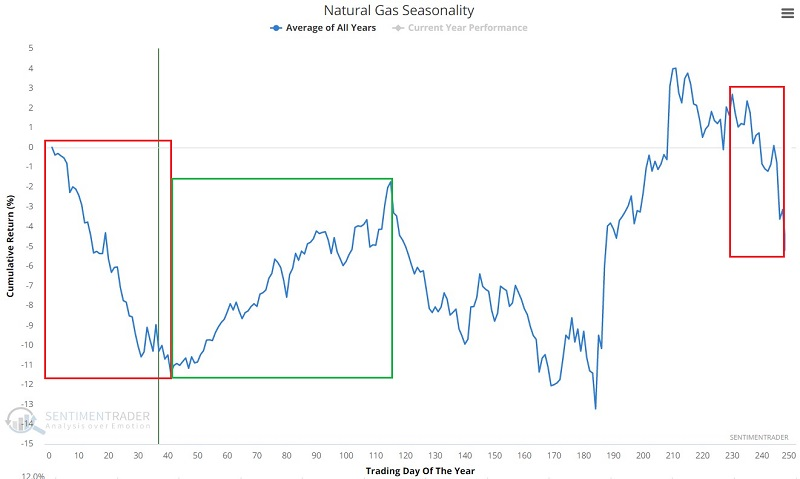
The seasonally favorable period extends from the close of TDY #41 through the closing of TDY #115. For 2023, this period extends from the close on 2023-02-28 through 2023-06-12.
The chart below displays the cumulative hypothetical performance from holding one Natural Gas futures contract during this window since 1990.
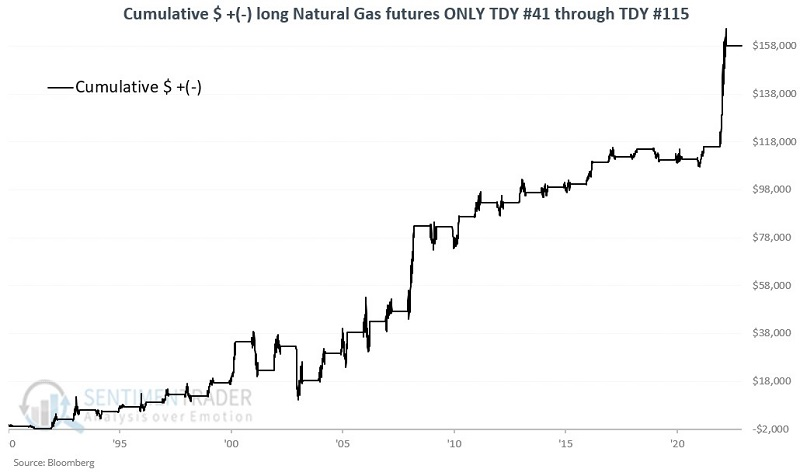
The volatile contract gained during 76% of the years, with a median gain of $4,190 versus a median loss of only -$840. It gained more than $10,000 five times versus losing more than that much only twice.
The United States Natural Gas Fund (UNG) is an exchange-traded security designed to track in percentage terms the movements of Natural Gas futures prices. UNG issues shares that may be bought and sold like shares of stock. That fund showed a similar seasonal bias to the futures contract.
Another compelling indicator for natural gas prices
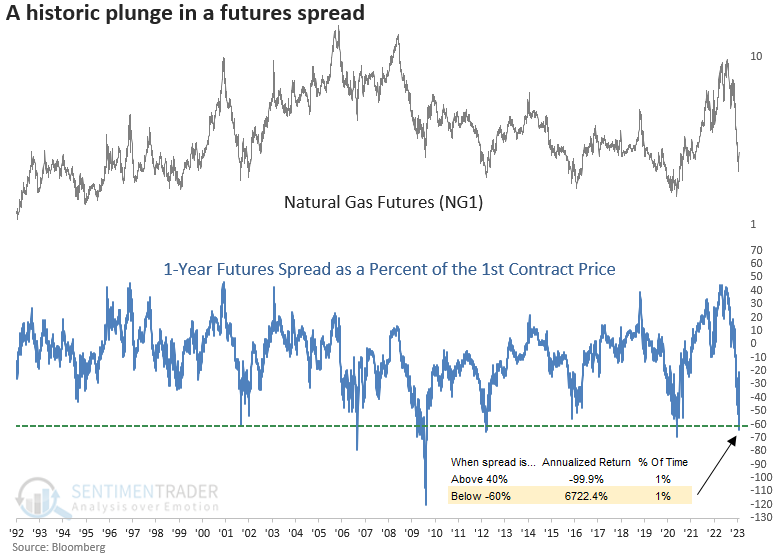
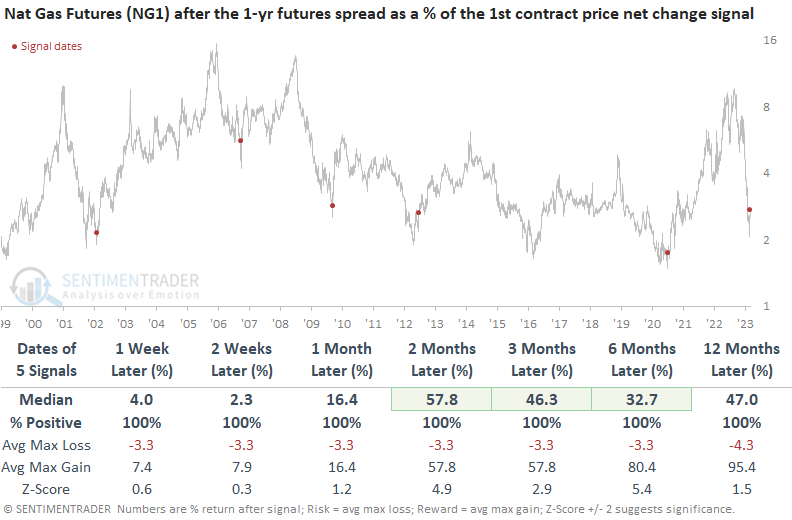
Dean noted that the 1-year futures spread as a % of the 1st contract price for natural gas plunged below -60% and reversed. After similar spread reversals, natural gas rallied every time from one week to twelve months later.
If we track dislocations in the natural gas market by monitoring the 1-year futures spread as a percent of the 1st contract price, last week, the spread fell below -60% for only the 6th time in history. While extremely rare, annualized returns are uber bullish when the indicator falls below -60%. Conversely, natural gas is highly likely to decline when it exceeds +40%, which it did in 2022.
Dean created a simple trading signal for the futures spread. After the indicator declines below -60%, the model looks for a 3-day net change increase in the spread of +19%.
On Monday, the 3-day net change surged by the most significant amount in history, triggering a new buy signal. The signals in 2006 and 2020 were triggered almost immediately after the spread fell below -60%, which is the case now.
Another option would be natural gas stocks. Dean showed the returns after these signals for Southwestern Energy, EQT Corp., and Range Resources, and they were similarly impressive.
Using options to trade a natural gas rebound
None of this guarantees a rally in natural gas, but it does point to a potential opportunity. Jay showed that options allow traders to make specific dollar-risk bets with limited risk.
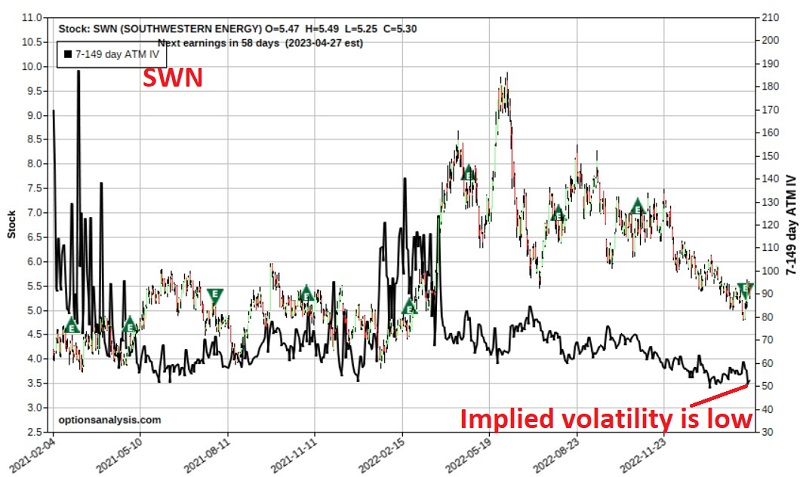
He showed charts showing implied volatility for options on the stocks noted above. What is interesting to note is that IV for UNG (a popular natural gas ETF) is relatively high (i.e., option premiums are "expensive"). In contrast, IV for the three individual stocks is relatively low (i.e., options are "cheap"). This partly explains why UNG options presently have wide bid/ask spreads (market makers are forcing wider spreads to compensate them for taking the risk of writing options on this highly volatility security). This also suggests that individual stocks may offer better opportunities if we are looking simply to buy a call option in hopes of a natural gas rally.
Jay showed a screen, looking at potentially attractive options. Option delta is arbitrarily set to 40 or higher to avoid buying options that are far out of the money. Note that delta is a Greek option variable that can be viewed in different ways. A delta of 40 suggests that the position is roughly equivalent to holding 40 shares of the underlying security. Delta also offers a rough approximation of the probability that the option will expire in the money (i.e., the likelihood that the underlying security price will be above the option strike price at option expiration).
The screenshot below displays the output screen with results sorted by Gamma. Gamma is another Greek option variable that tells us how many Deltas the option will gain if the underlying security rises by $1 in price.
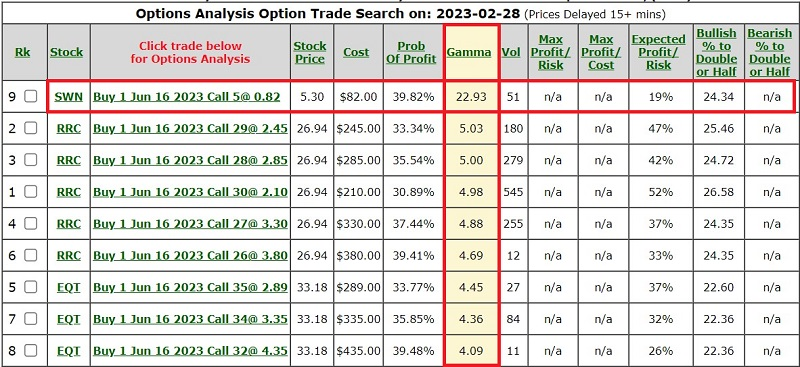
According to the parameters set - and with an emphasis on high gamma, the top trade involves:
- Buying the SWM June16 2023 5 call @ $0.82
The screenshot below displays the particulars for this trade, and the chart below shows the risk curves (i.e., the expected $P/L at a given price for SWN as of four different dates leading up to options expiration).
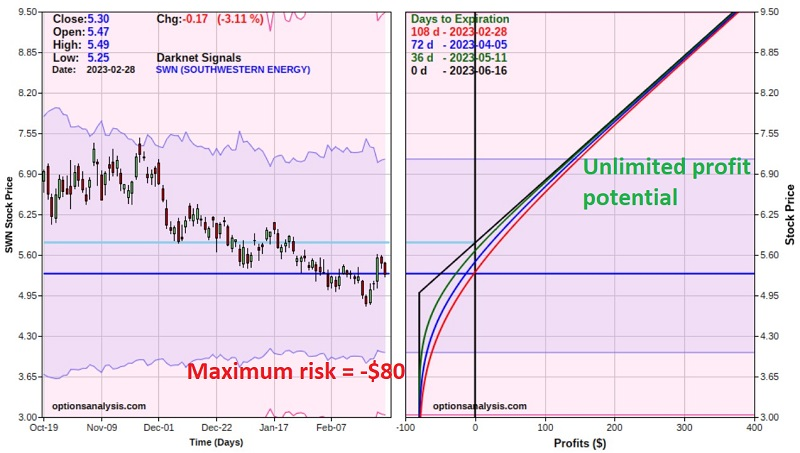
The option has 108 days left until expiration, so there is plenty of time for SWN to make the hoped-for move higher. The cost to enter the trade - and the maximum risk - $80 for a 1-lot (this is based on the assumption that we use a limit order at the midpoint of the bid/ask spread and that we can get filled at that price). A 1-lot has a delta of 65, meaning this position is roughly equivalent to holding 65 shares of SWN. However, buying 65 shares of SWN would cost $345 instead of $80 to buy the call.
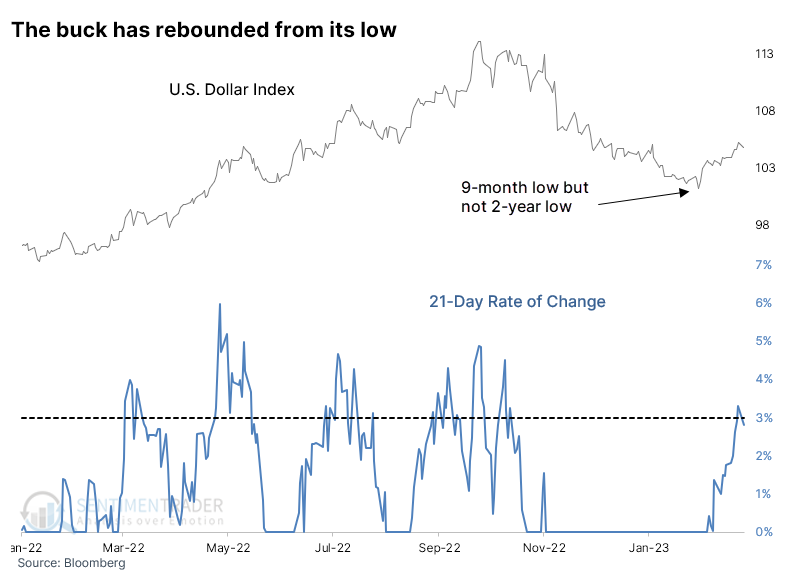
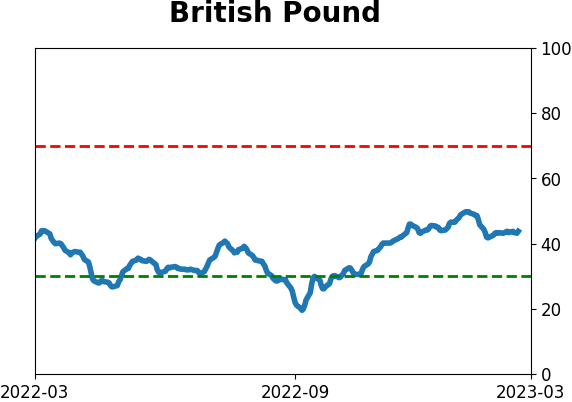
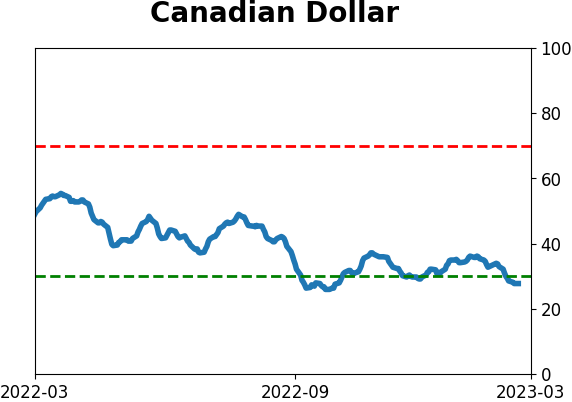
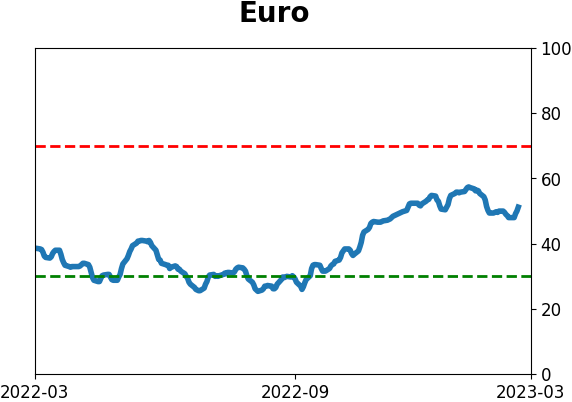
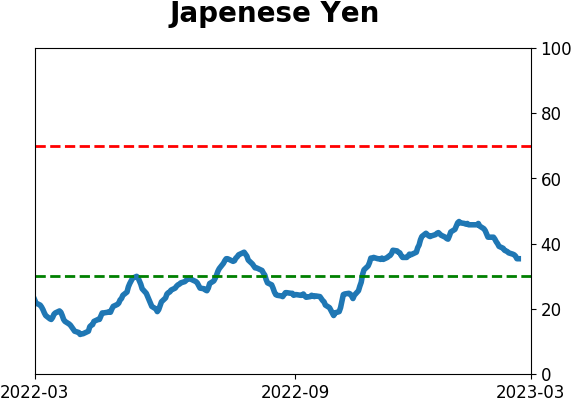
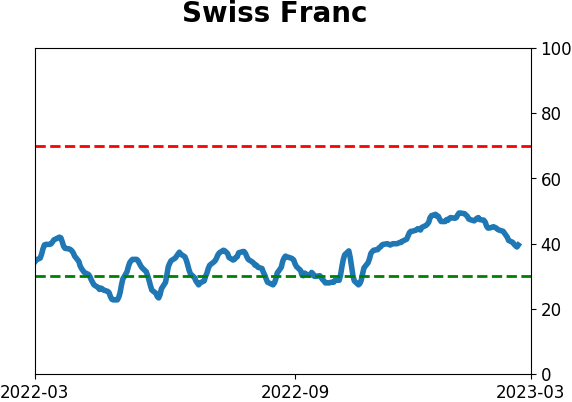
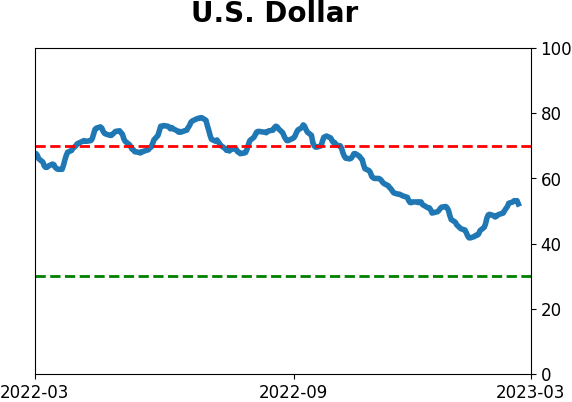
The dollar's counter-trend rally
A rebound in natural gas would be helped if the dollar declined.
Investors have had a renewed focus on the U.S. dollar in recent weeks, as it has helped to upend some trends in place since October. It has enjoyed a strong rebound over the past several weeks, with a 21-day rate of change of more than 3%. The rally is coming on the heels of what had been at least a 9-month low in the dollar, but not a 2-year low. Meaning, it has been a counter-trend rally that was not within a prolonged downtrend.
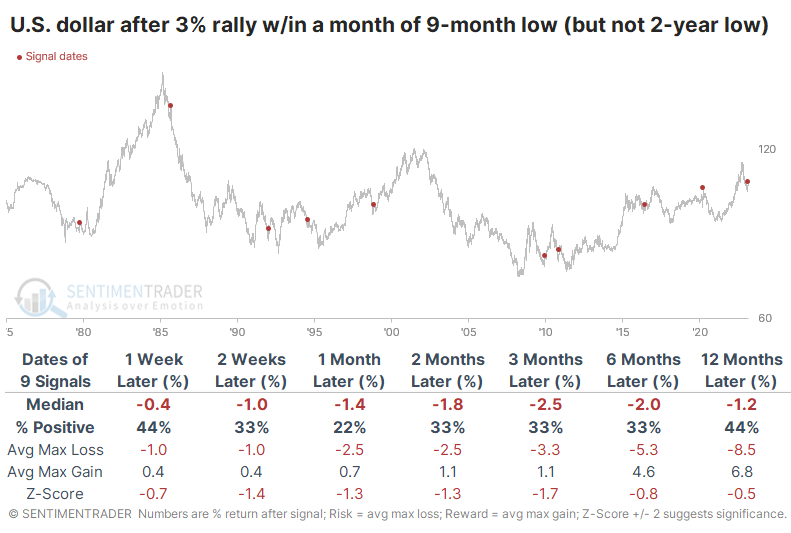
After similar rebounds, the dollar struggled to hold its gains. It sported a negative return after all but one signal either one or two months later. The only exception was in 1992, and that rally petered out in the months ahead.
For the S&P 500, the failure of the dollar to follow through on its counter-trend rallies was a good sign. Over the next 3-12 months, there were no losses of any magnitude, and a year later, the index sported a positive return every time.
For Emerging Market stocks, there were two fewer signals due to limited data. But over the next three months, all of the signals showed a positive return. Two of those ended up falling hard in the months ahead.
If the dollar struggles, that usually means good things for gold. While there were some losses, over the next few months, gold rallied after 7 of the 9 signals. For the most part, gold did quite well, with mostly limited losses and potentially strong gains.
Commodities, in general, also tended to rebound, though it was mostly loaded in the short term.
What to do when things go right
In January, Jay highlighted an unfavorable seasonal tendency for foreign currencies and showed an example options trade that would profit if the tendencies played out. They did. Now, he showed one approach to adjusting a profitable options trade to lock in a profit while still allowing for additional profit potential.
The example trade we highlighted in the original article involved buying a put option on the Invesco CurrencyShares Euro Trust ETF (ticker FXE). The example trade involved buying 1 Mar17 2023 FXE 101 strike price put option @ $1.40.
The good news is that the option has more than doubled in price, thus generating a significant percentage open profit. The bad news is that if FXE turns and rallies, this trade could quickly become a loss.
One of the great potential benefits of trading options is the opportunity to adjust an existing position rather than merely exiting an existing position. If you buy or sell short shares of an ETF, the only way to lock in profit is to sell (or buy back if short) your shares. This locks in profit but also eliminates additional profit potential. So, let's discuss a potential action plan for a profitable options trade.
The steps below assume that you have previously purchased a call or put option and that that position now has a profit of at least +30%.
- Step 1: Sell your existing open position
- Step 2: Use half of your open profit to buy an at-the-money option in the next monthly expiration
- Step 3: Sell an option two strikes out-of-the-money in the next monthly expiration
Each step intends to:
- Step 1: Lock in a profit on the trade and start playing with "house money"
- Step 2: Add additional time for the trade to continue and allow for further profit potential
- Step 3: Sell out-of-the-money options to help reduce the cost of the new options purchased
Following the plan highlighted above, the steps would be to:
- Step 1: Sell the Mar17 FXE 101 put @ $3.00 (a profit of $160)
- Step 2: Buy the Apr21 FXE 97 put @ $0.80 (using ½ of open profit)
- Step 3: Sell the Apr21 FXE 95 put @ $0.30 (to reduce the cost of the option purchased)
The particulars and risk curves for this adjusted position appear below.
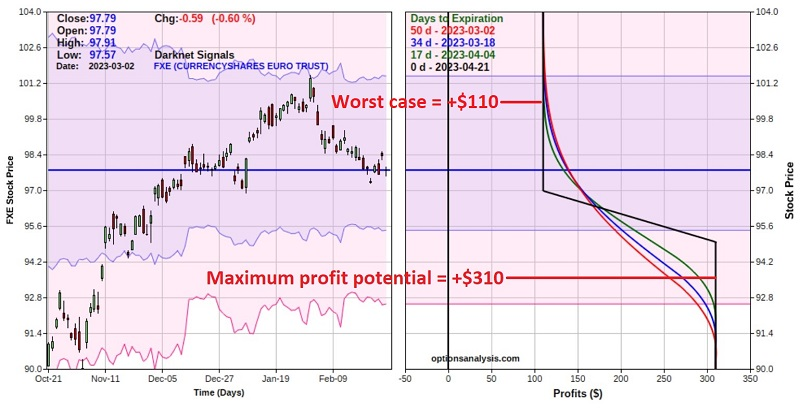
Things to note:
- The worst-case scenario for the newly adjusted position is that we hold the position until the April expiration and FXE is at or above $97 a share at the time
- If the above happens, the worst-case is a net profit of $110 (or 79% on the $140 risked when the original trade was entered)
- If FXE continues to decline, our maximum profit potential is +$310 (or +121% on the initial $140 risk) if FXE is below $95 a share by the April expiration
About TradingEdge Weekly...
The goal of TradingEdge Weekly is to summarize some of the research published to SentimenTrader over the past week. Sometimes there is a lot to digest, and this summary highlights the highest conviction or most compelling ideas we discussed. This is NOT the published research; rather, it pulls out some of the most relevant parts. It includes links to the published research for convenience, and if you don't subscribe to those products, it will present the options for access.
Indicators at Extremes
|
|
|
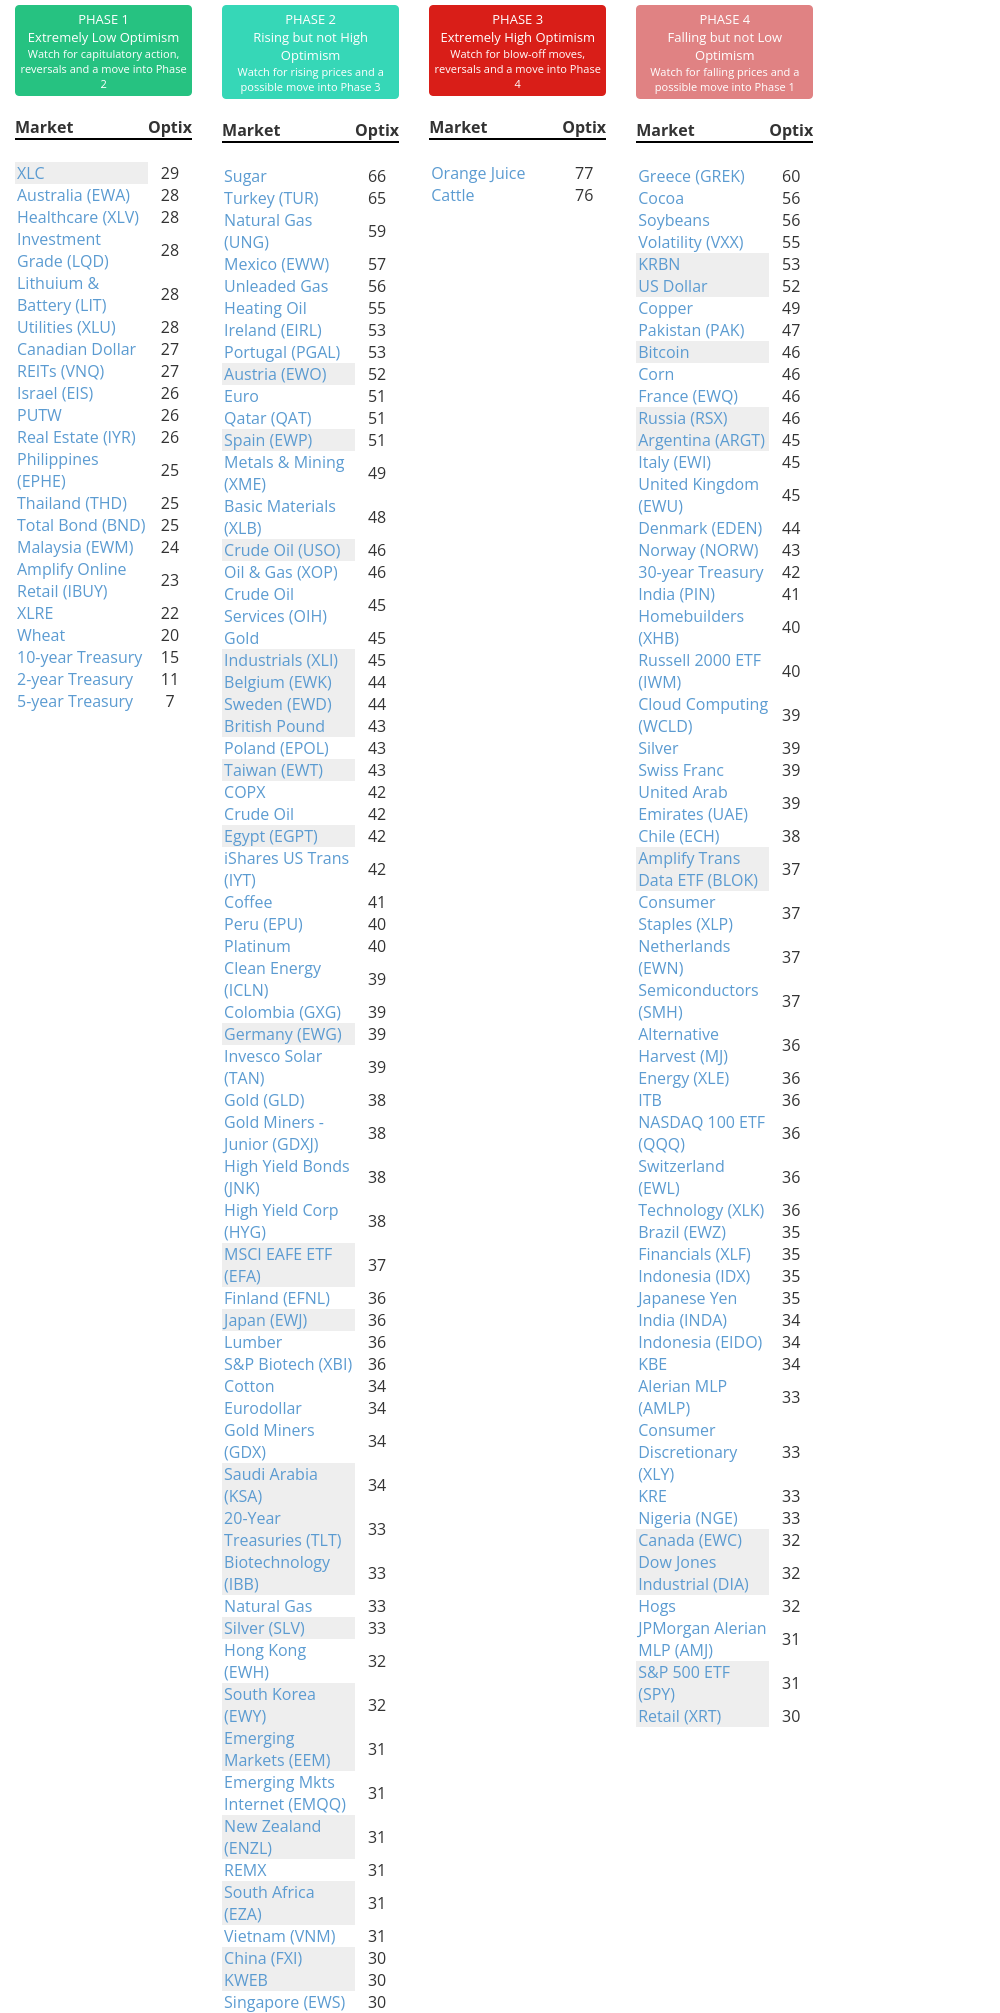
Phase Table
|
|
|
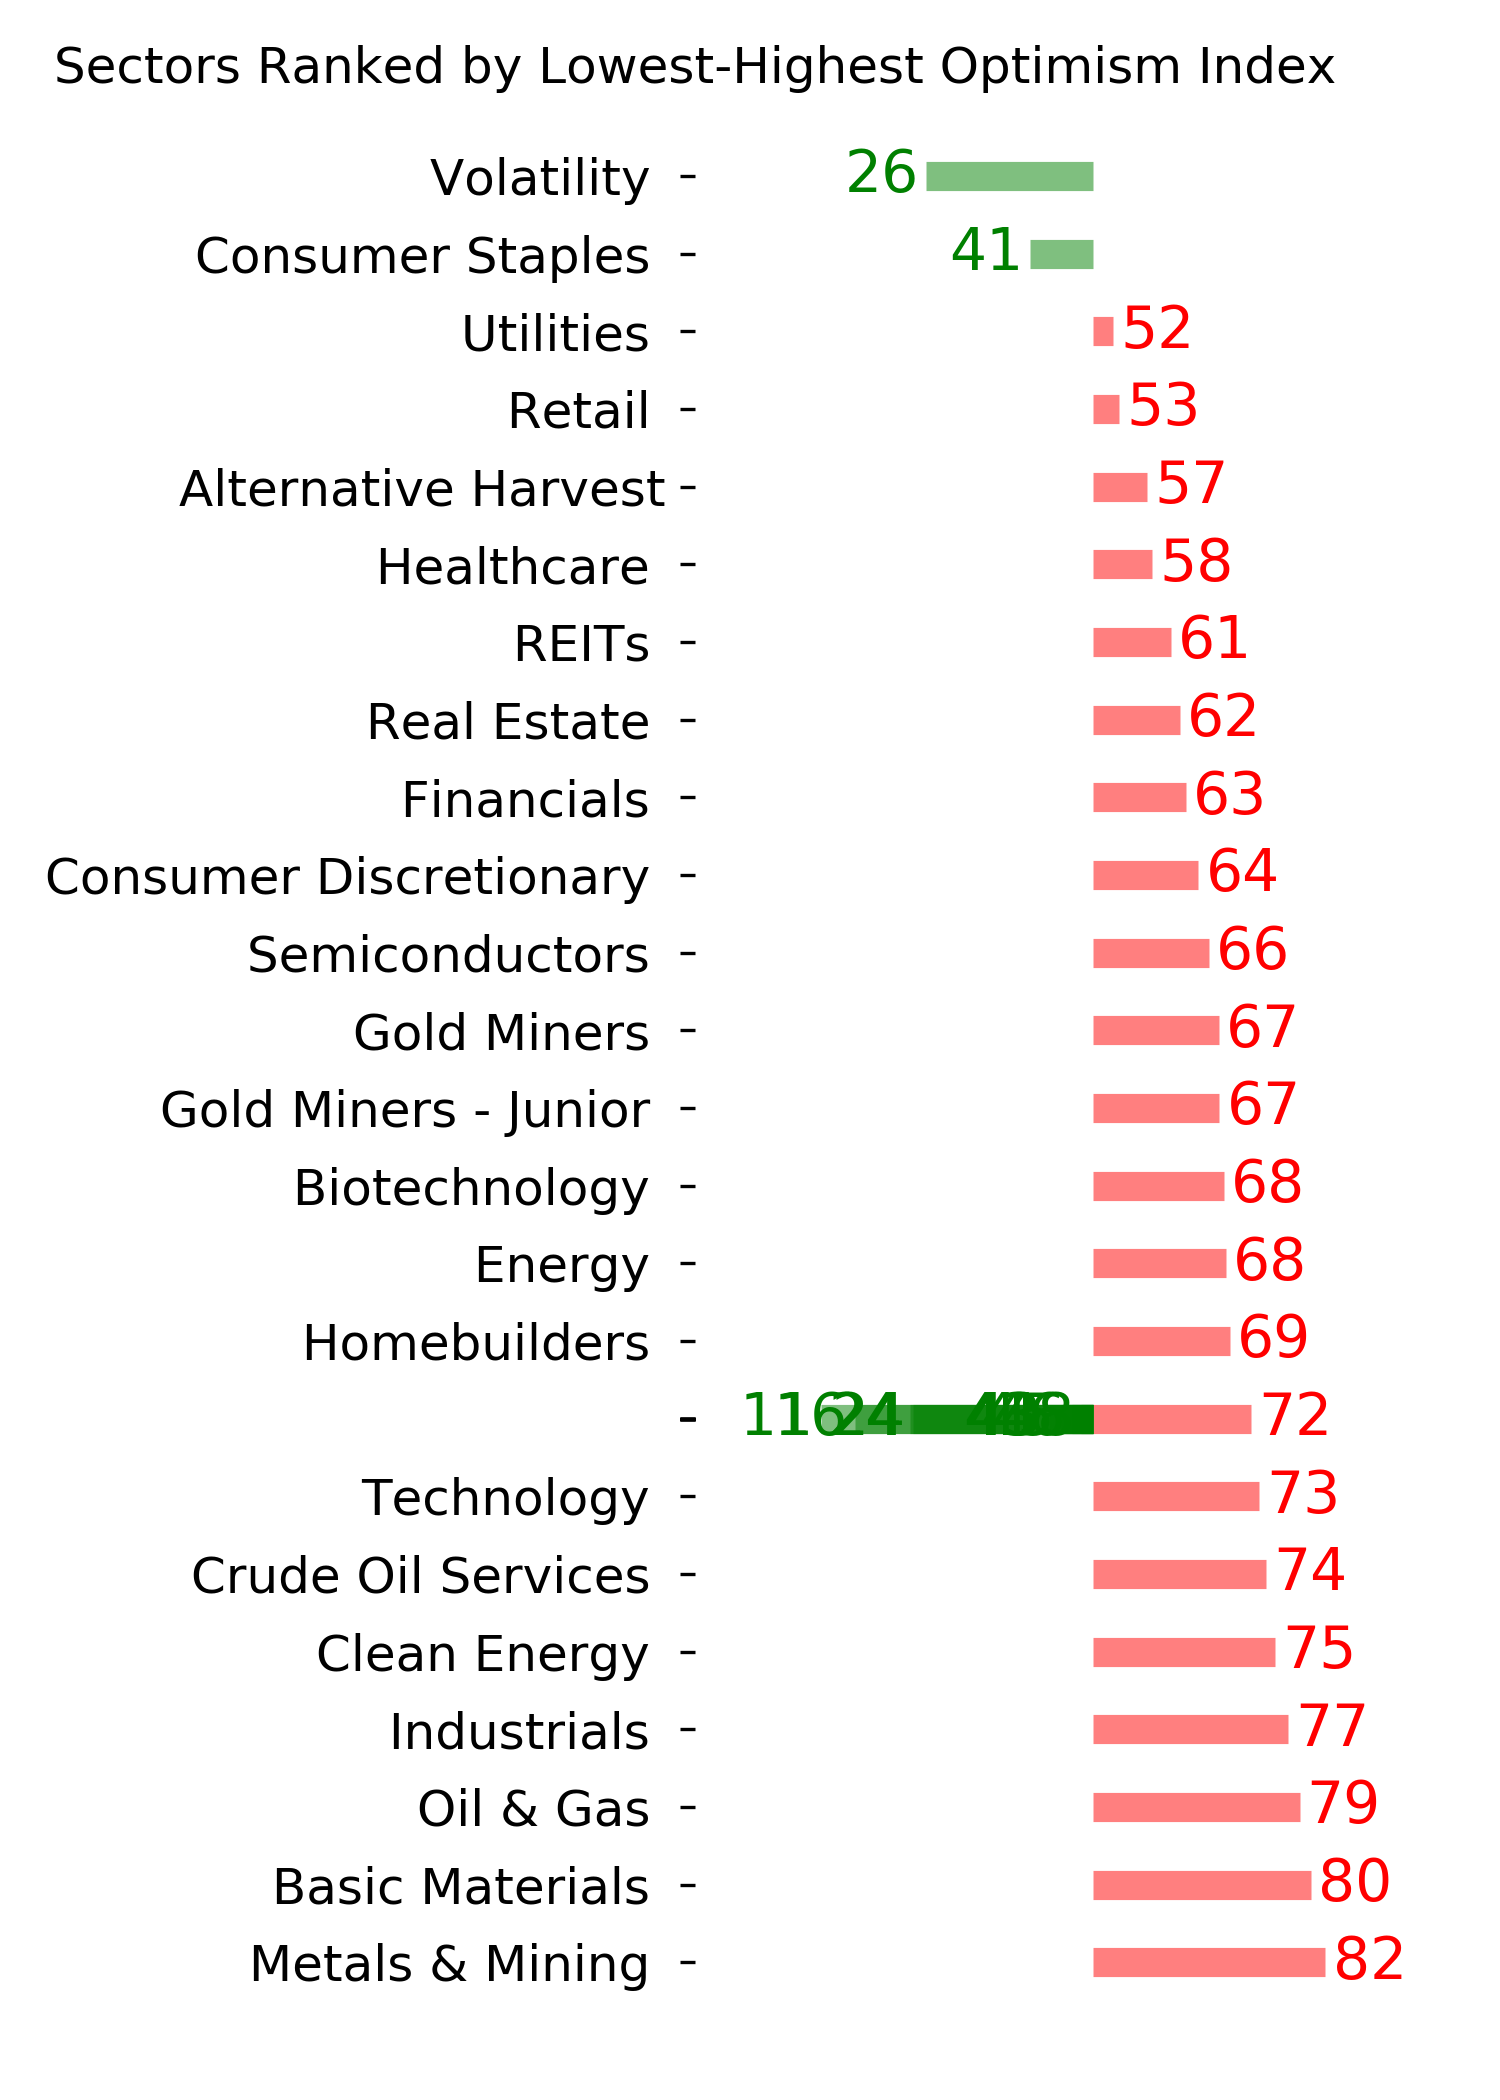
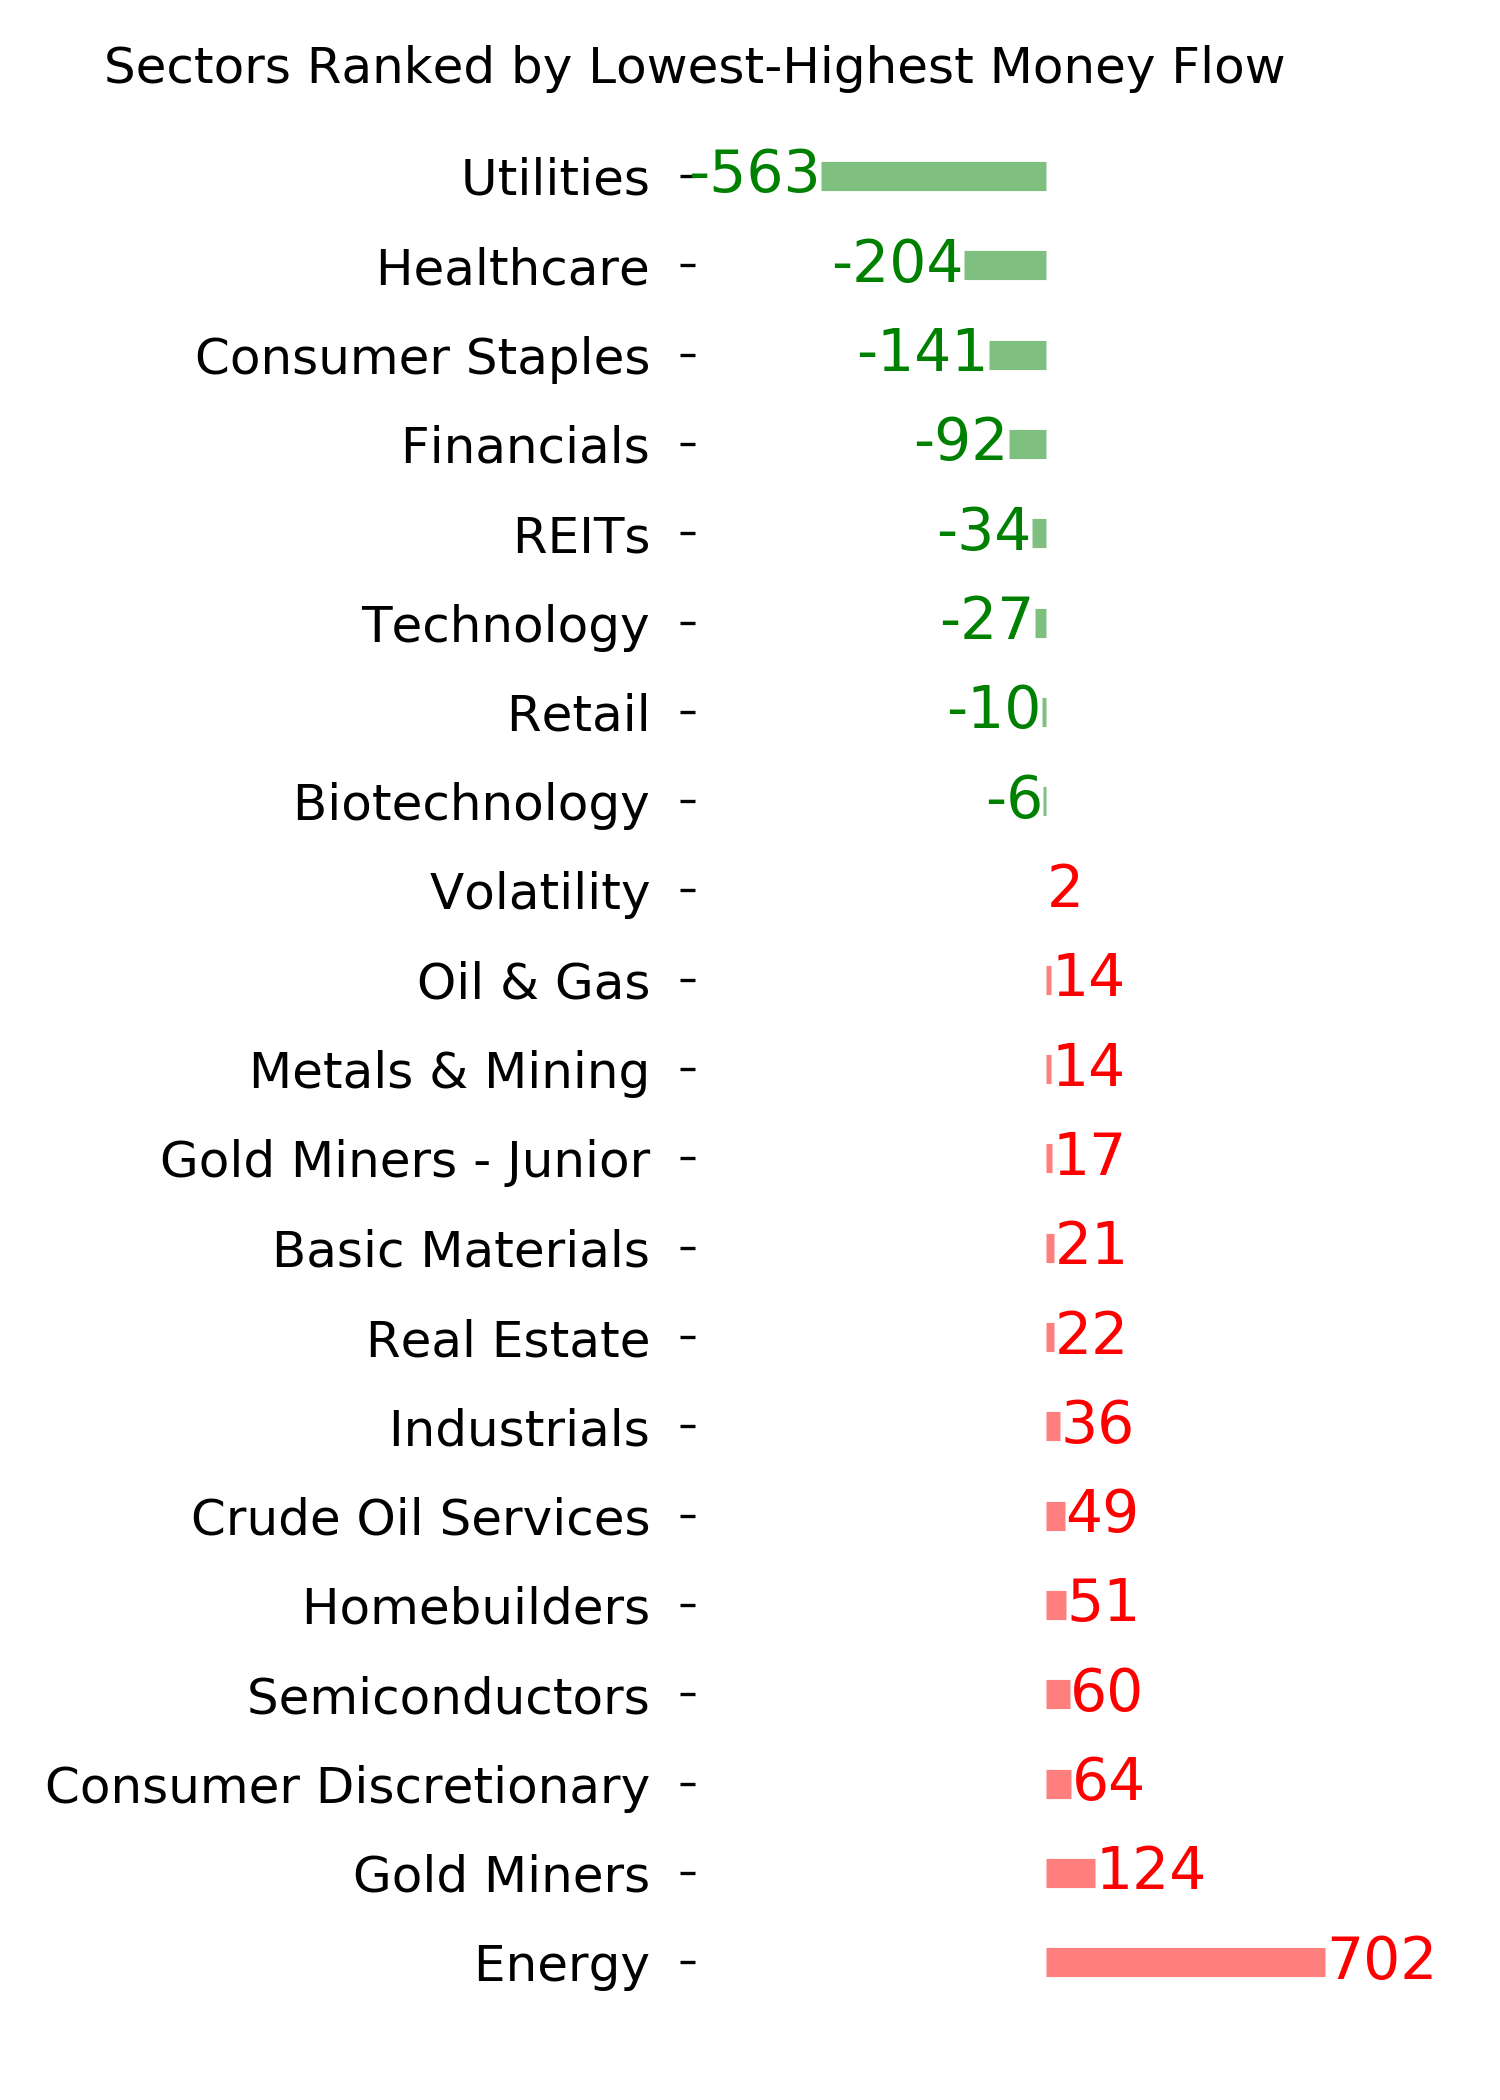
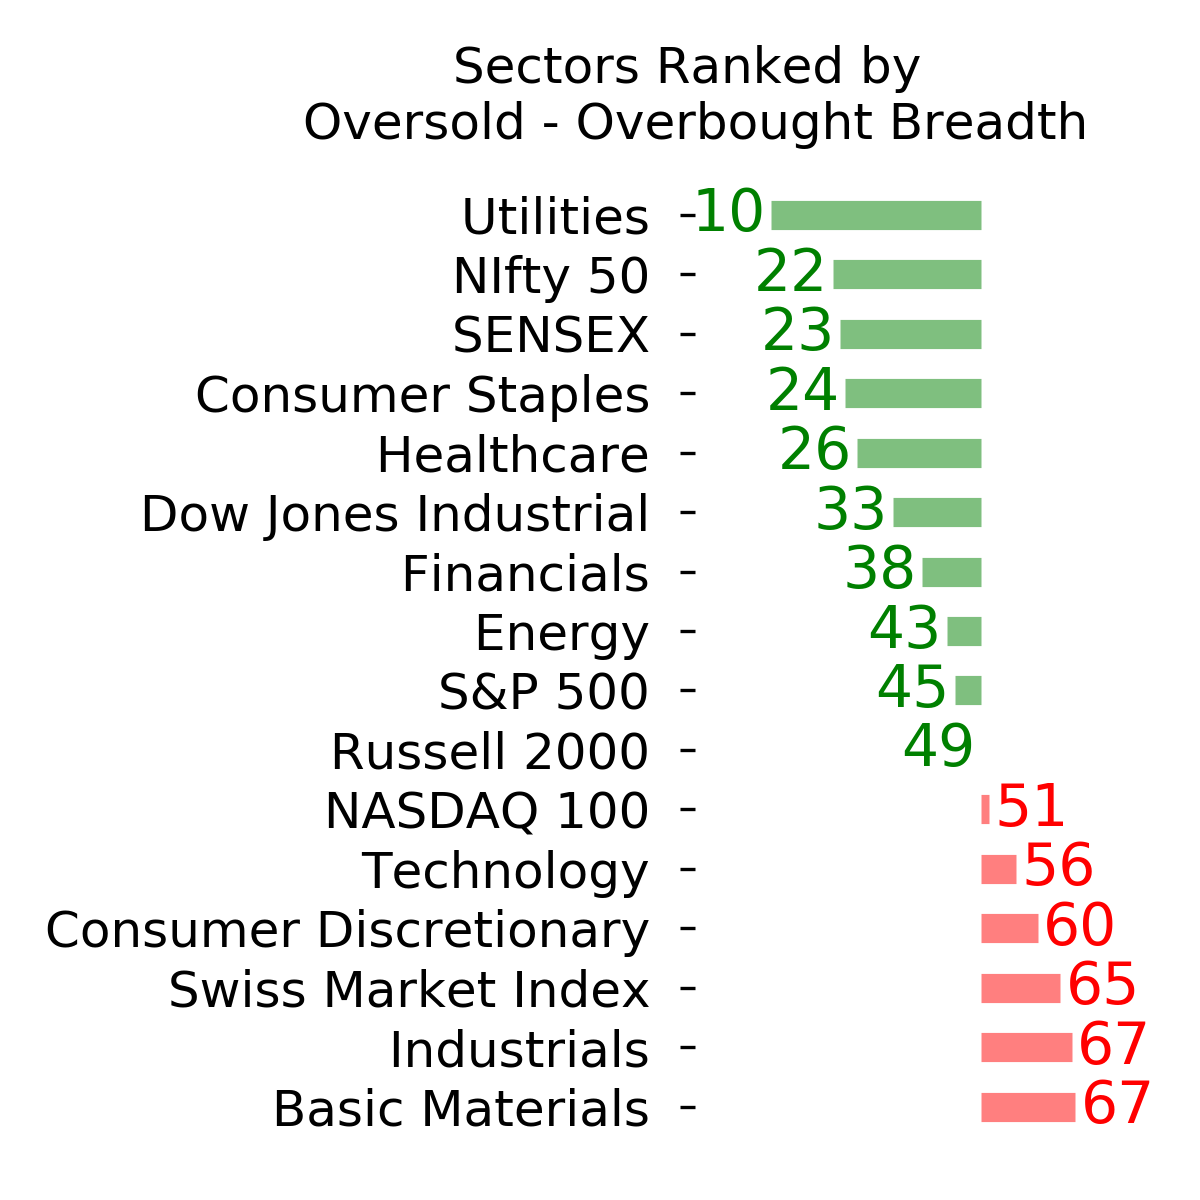
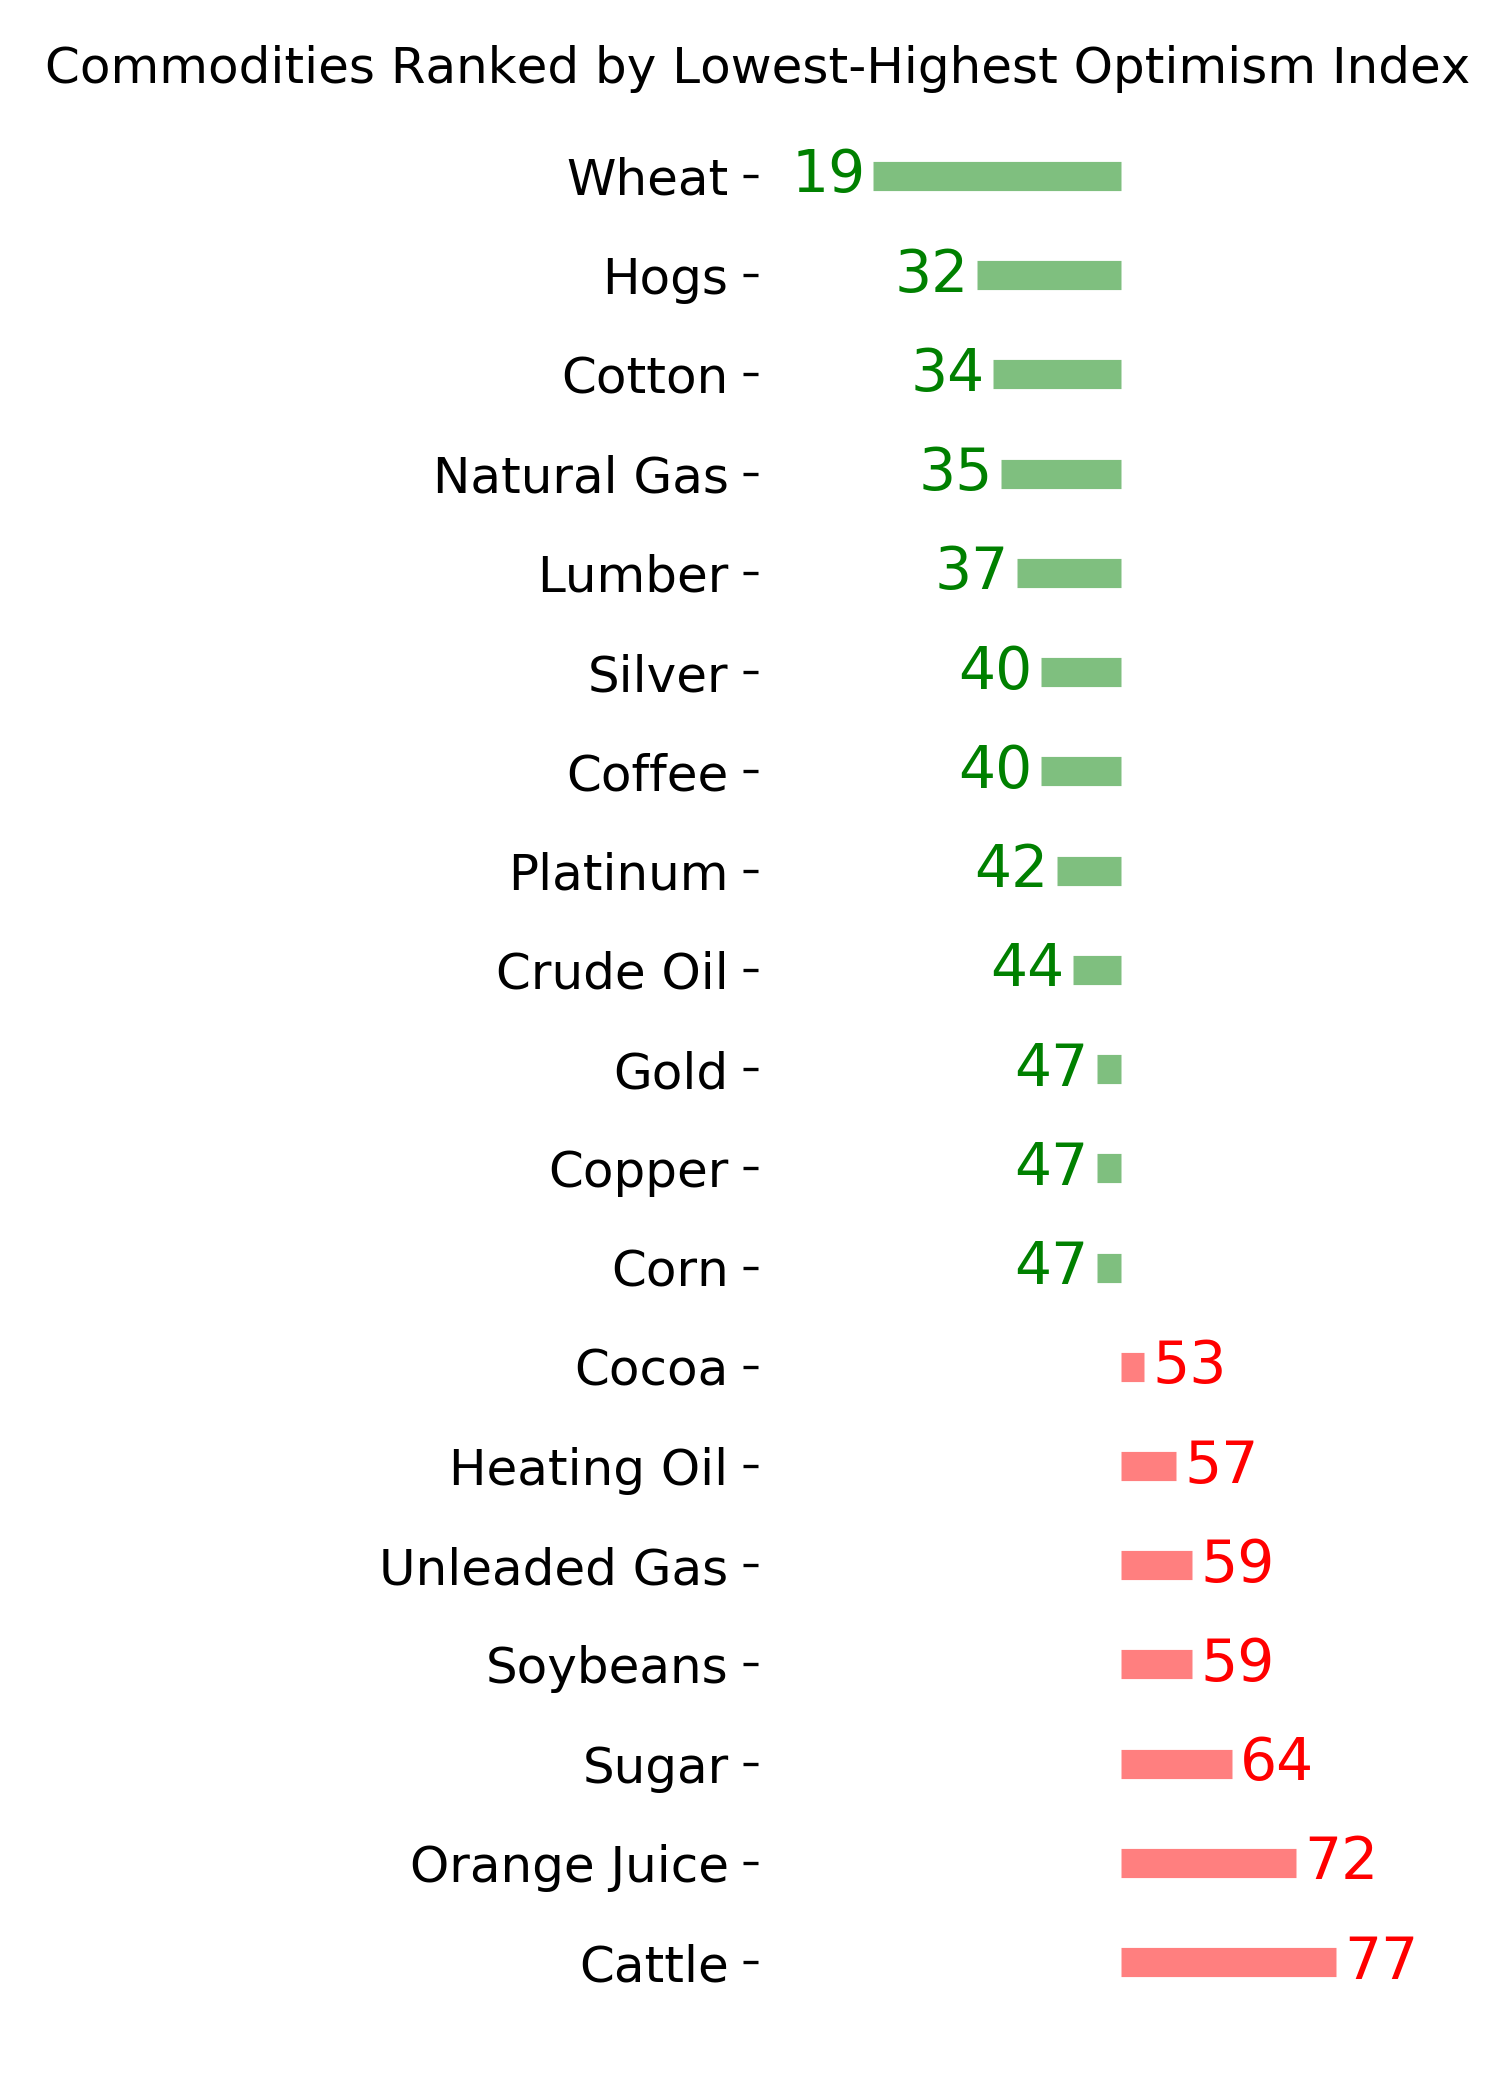
Ranks
|
|
|
|
|
|
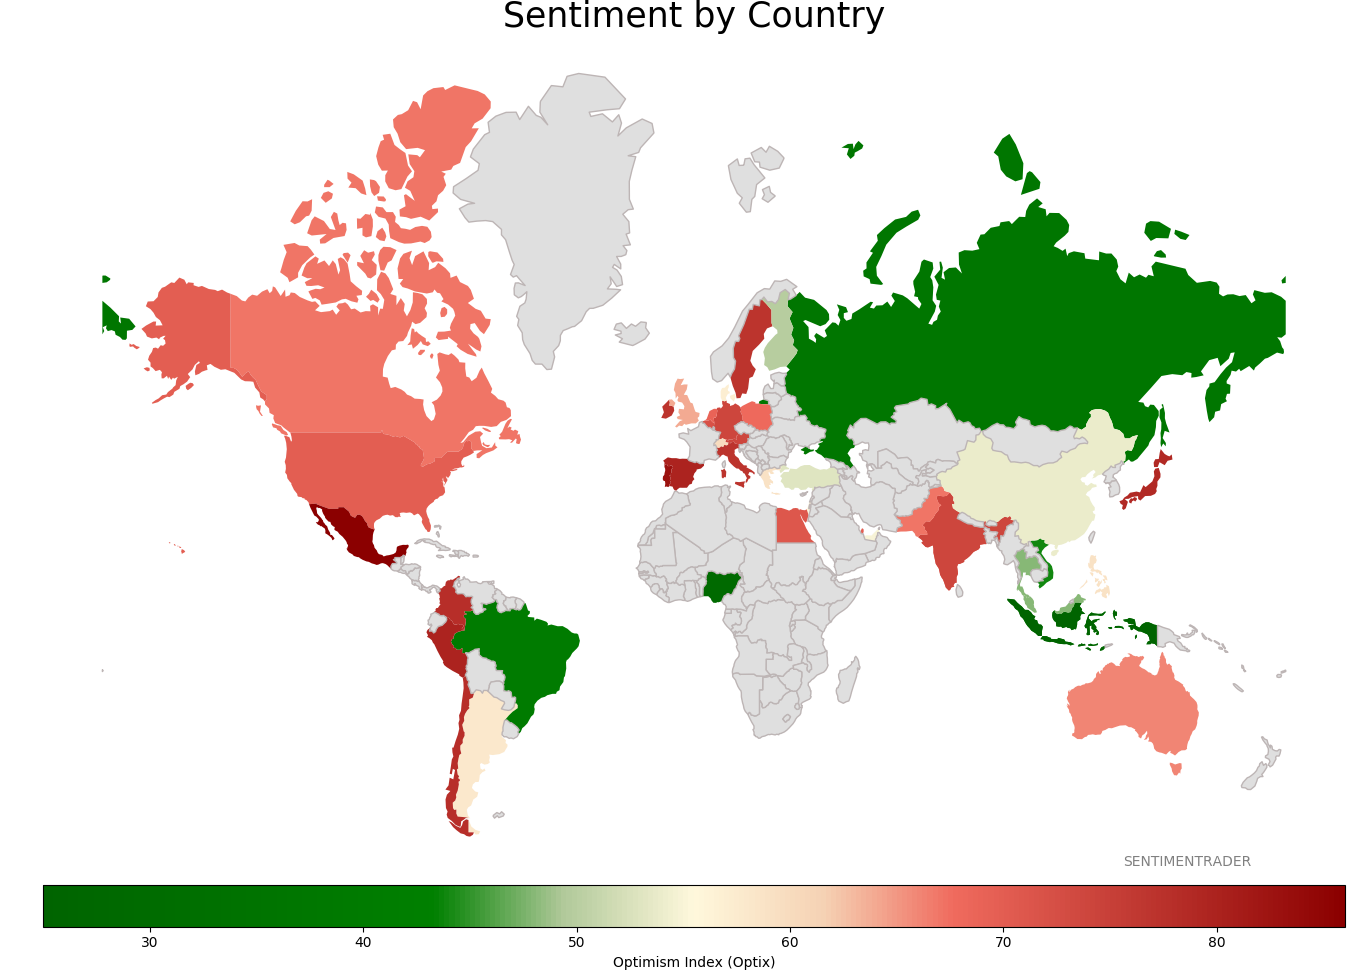
Sentiment Around The World
|
|
|
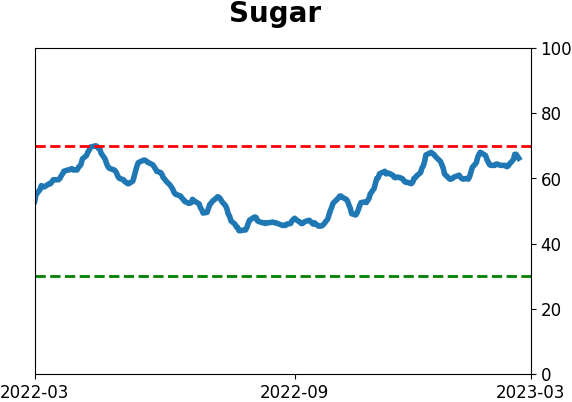
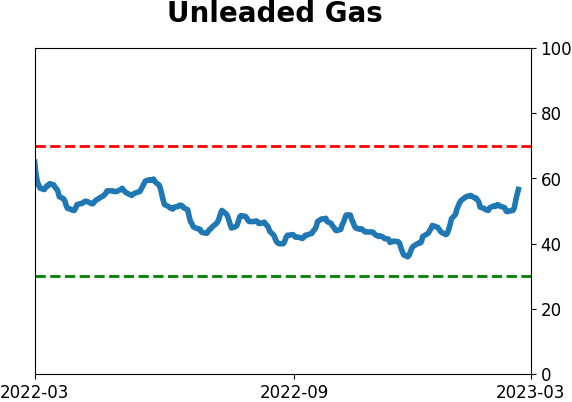
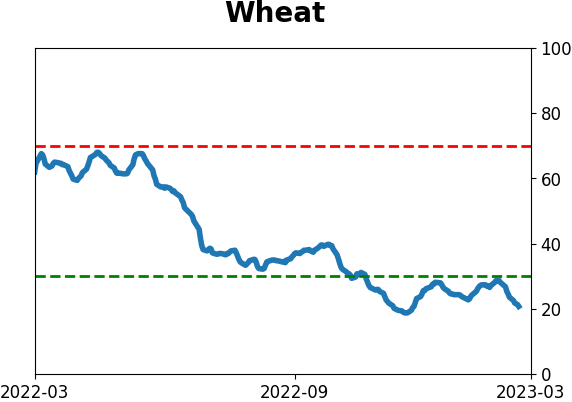
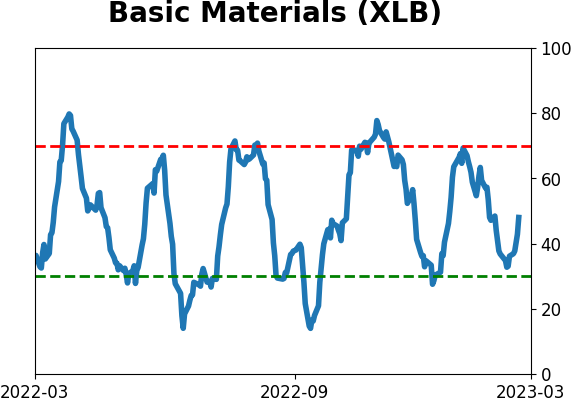
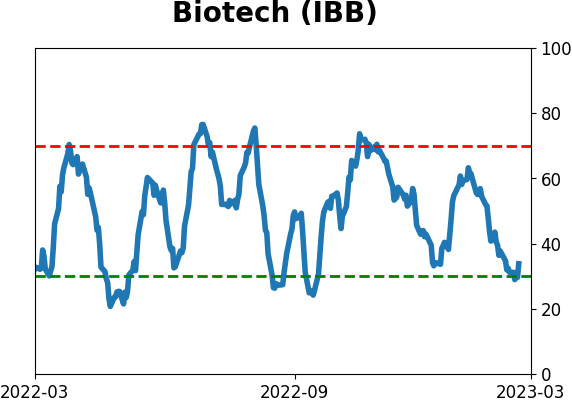
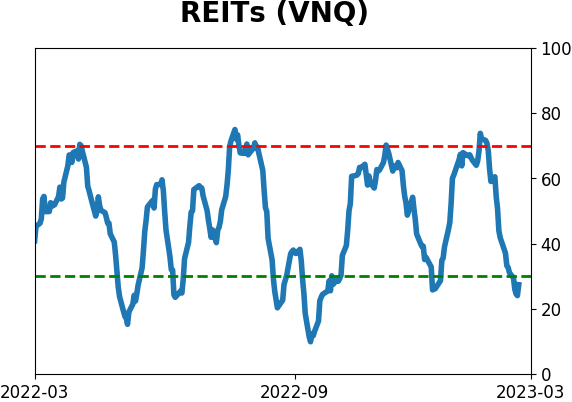
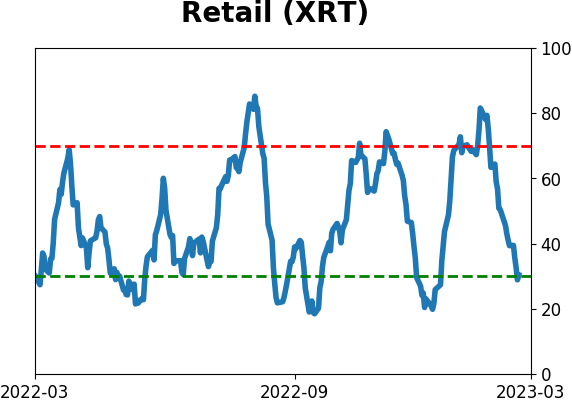
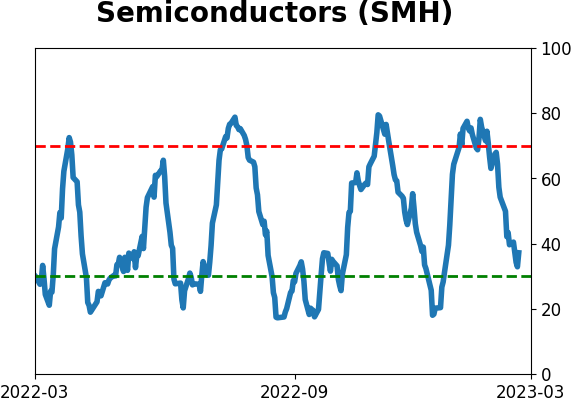
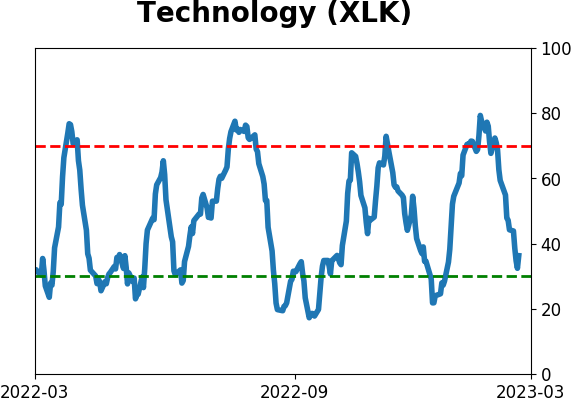
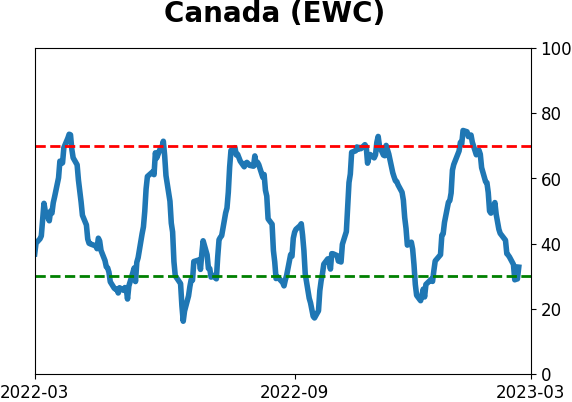
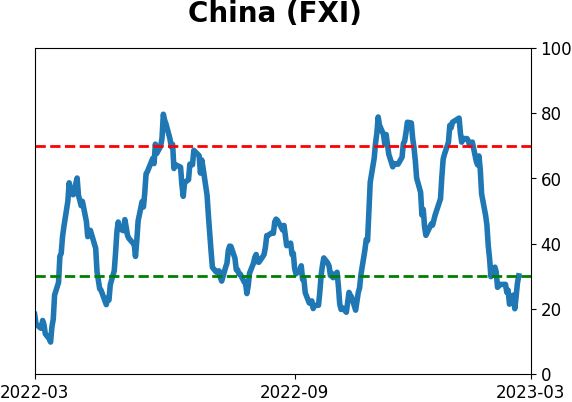
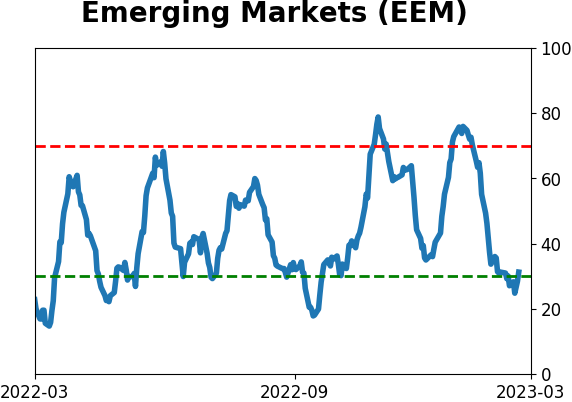
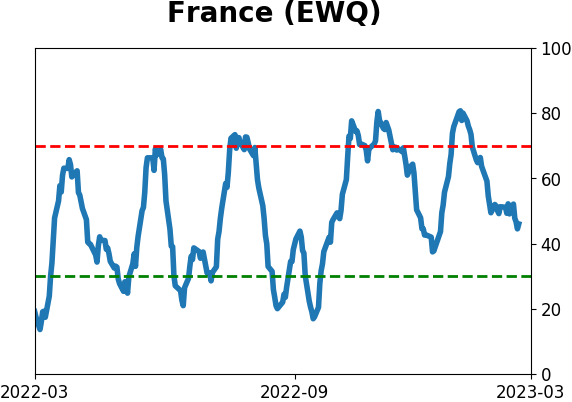
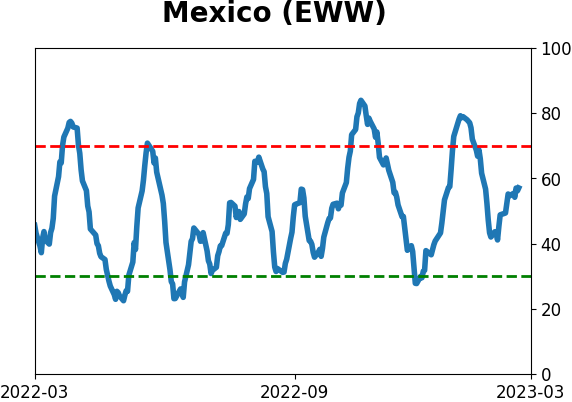
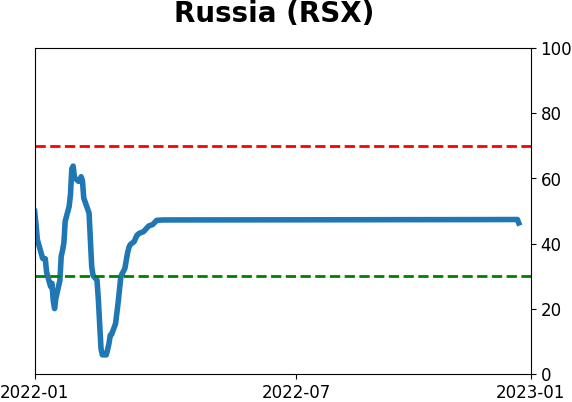
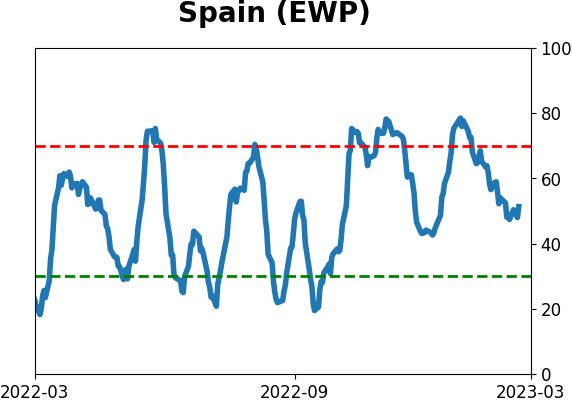
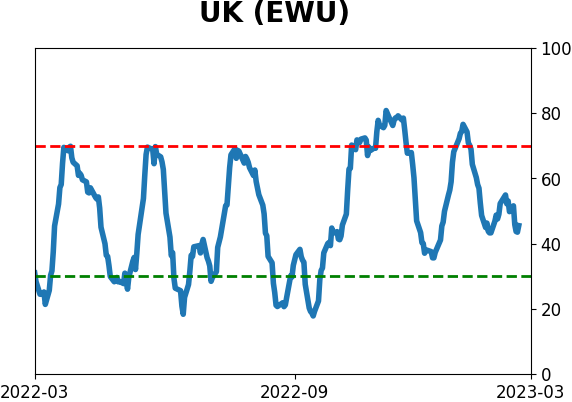
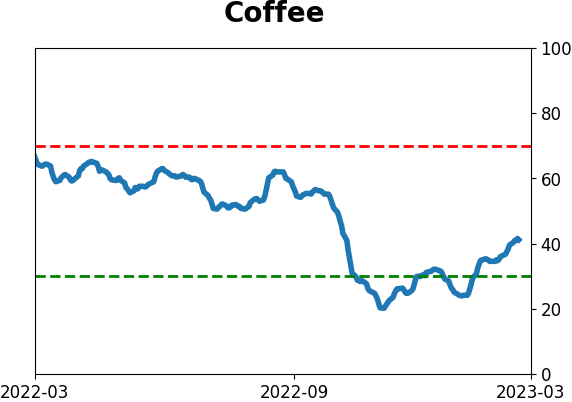
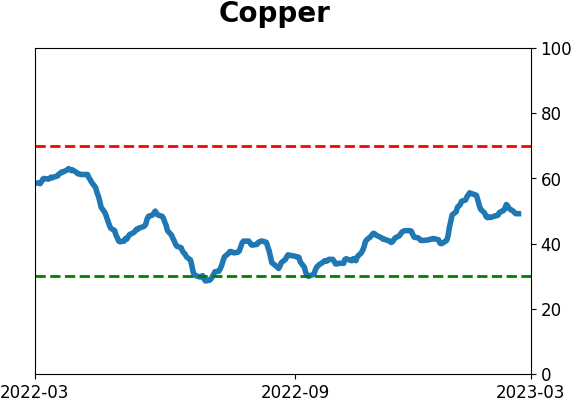
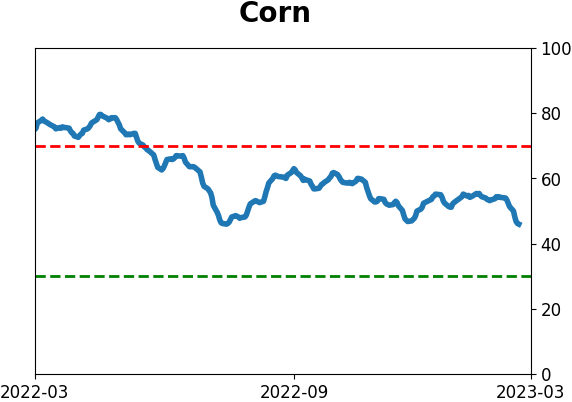
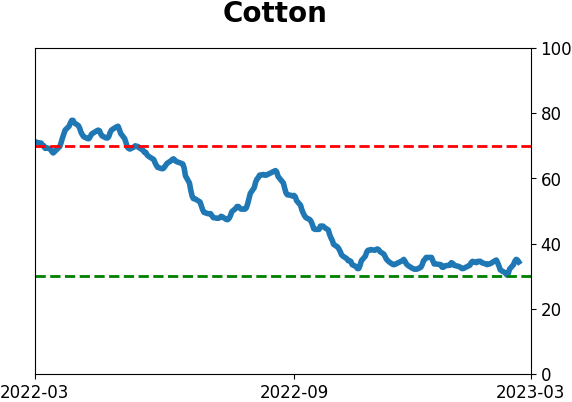
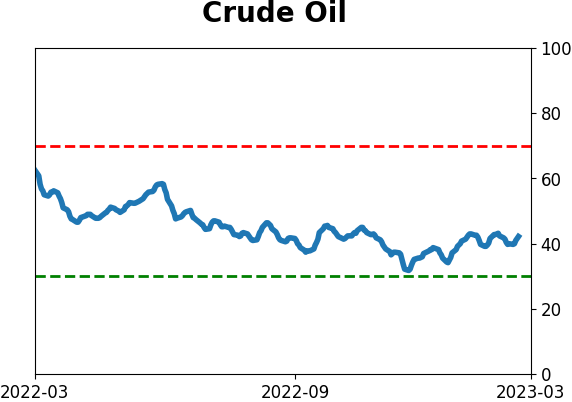
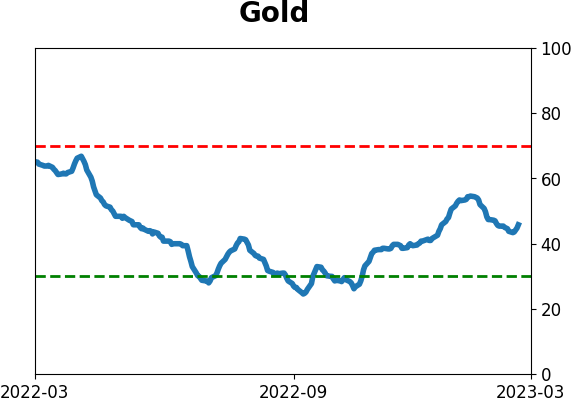
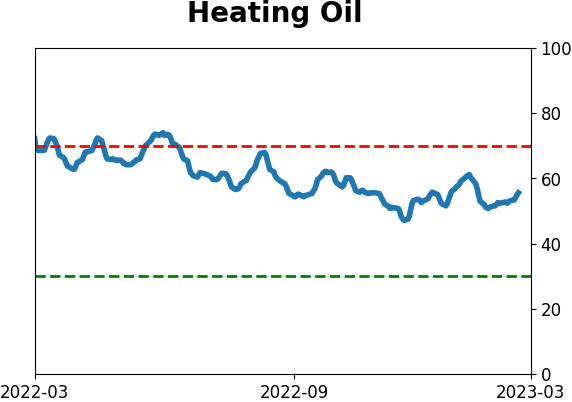
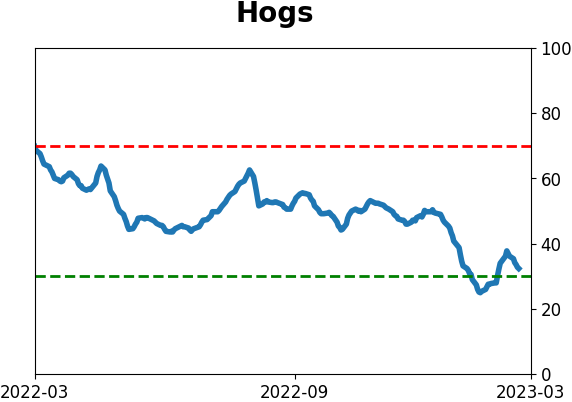
Optimism Index Thumbnails
|
|
|
|
|
|
|
|
|
|
|
|
|
|
|
|
|
|
|
|

|