Headlines
|
|
For the 1st time in 2 years, bears reign:
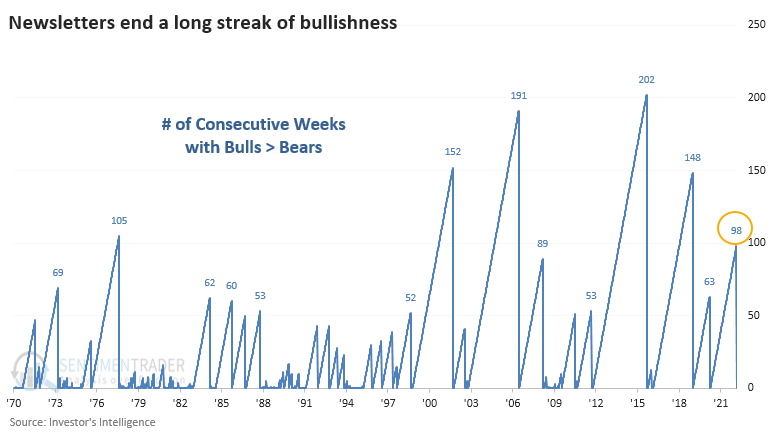
For the first time in almost 2 years, the Investor's Intelligence survey of newsletter writers showed more bears than bulls, ending the 6th-longest streak in its history. The ends of other long streaks of optimism tended to precede a multi-month bounce in stocks.
|
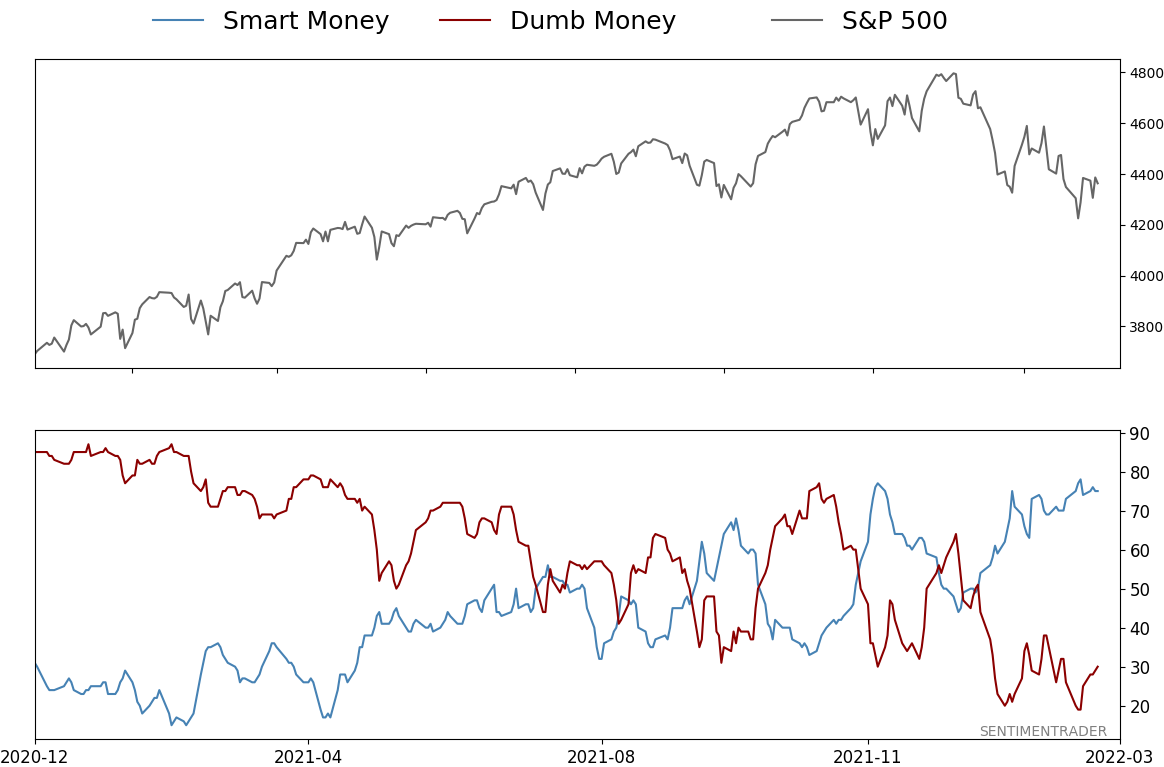
Smart / Dumb Money Confidence
|
Smart Money Confidence: 75%
Dumb Money Confidence: 30%
|
|
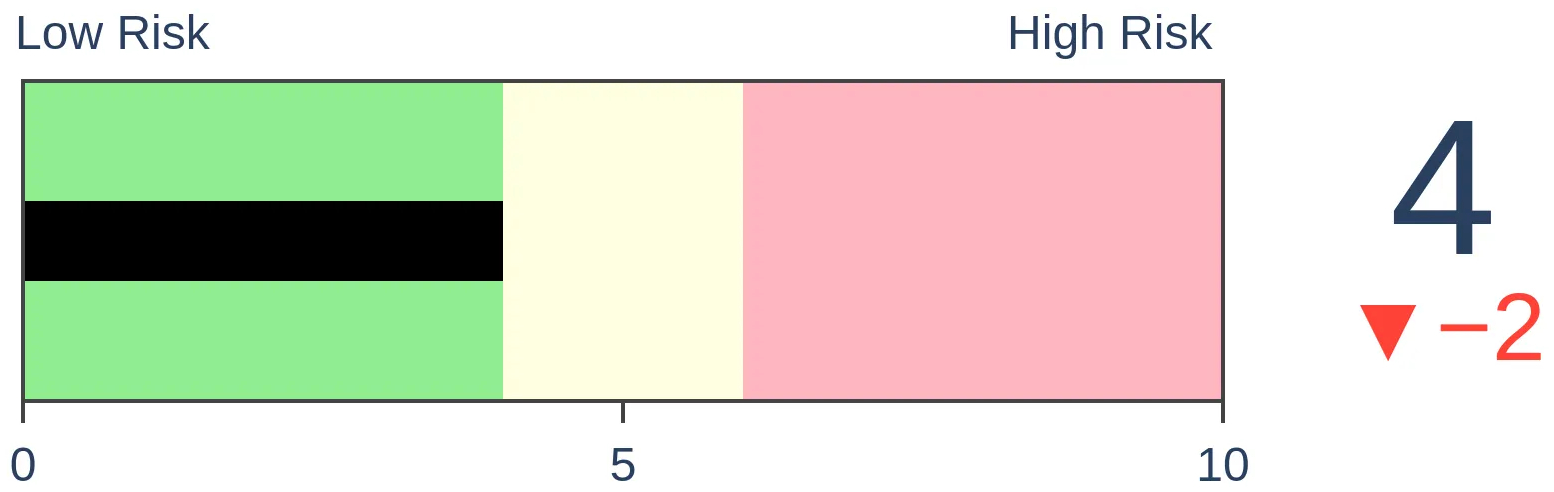
Risk Levels
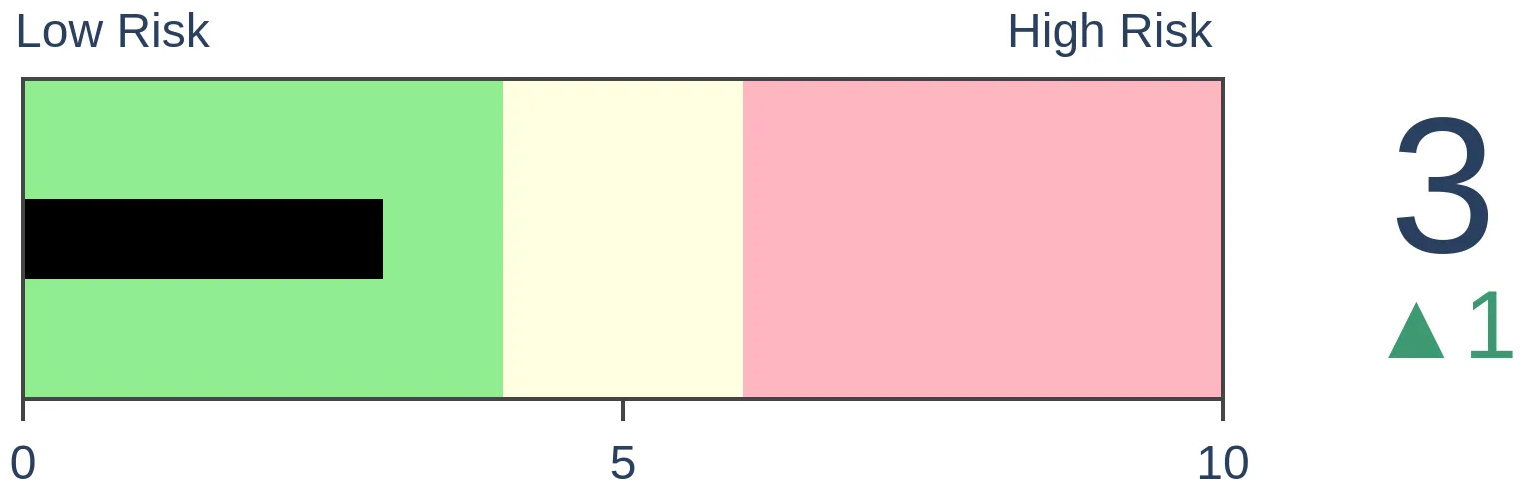
Stocks Short-Term
|
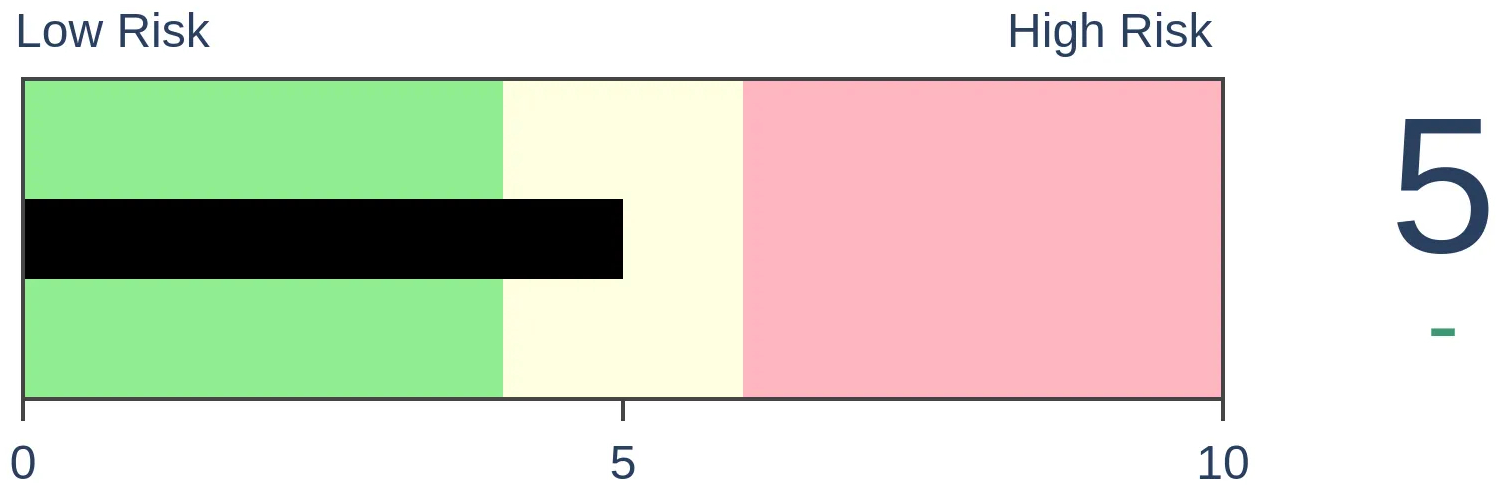
Stocks Medium-Term
|
|
Bonds

|
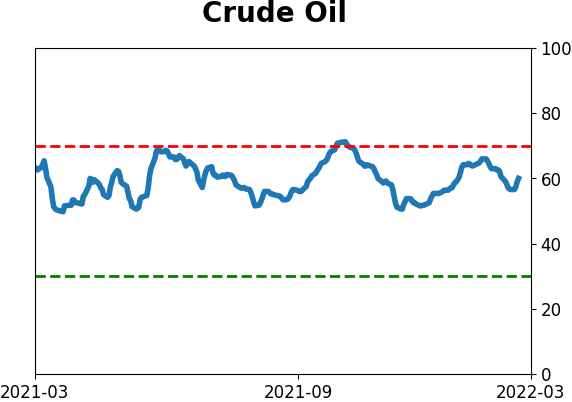
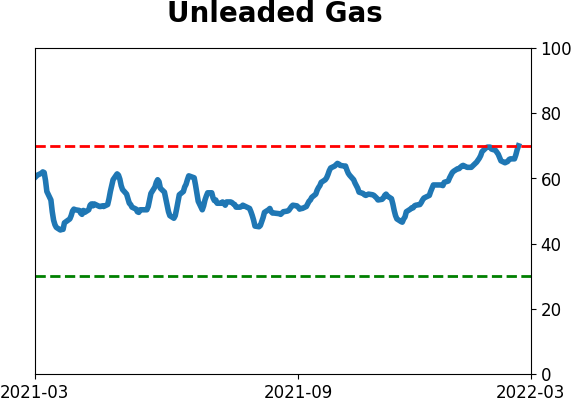
Crude Oil

|
|
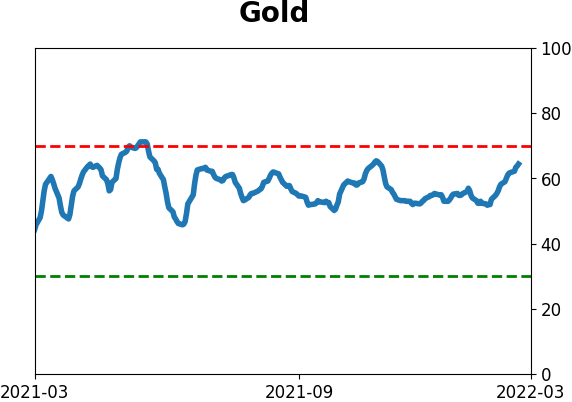
Gold
|
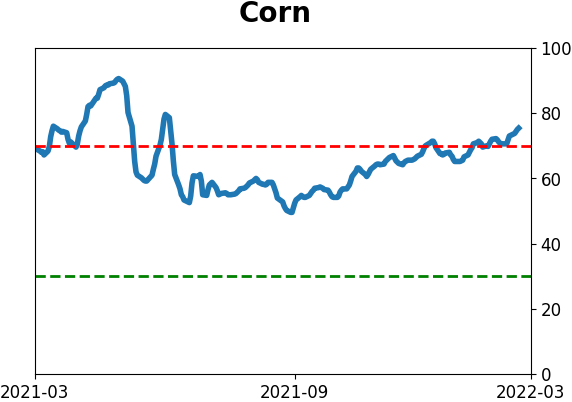
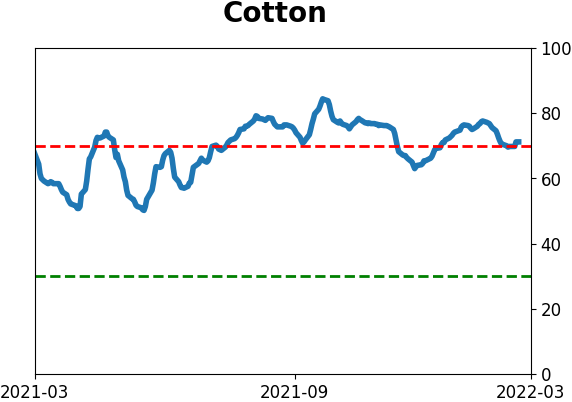
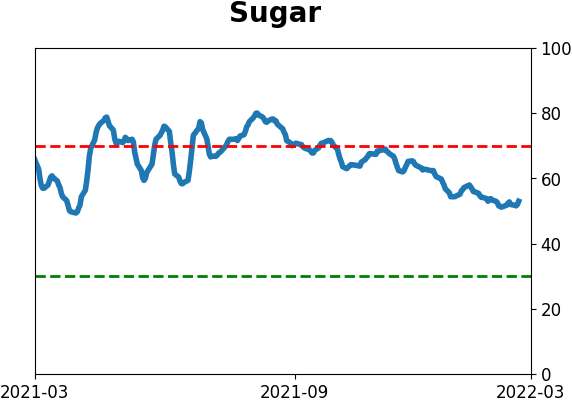
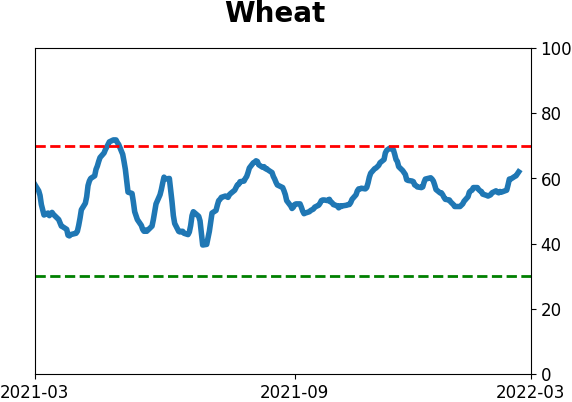
Agriculture

|
|
Research
By Jason Goepfert
BOTTOM LINE
For the first time in almost 2 years, the Investor's Intelligence survey of newsletter writers showed more bears than bulls, ending the 6th-longest streak in its history. The ends of other long streaks of optimism tended to precede a multi-month bounce in stocks.
FORECAST / TIMEFRAME
SPY -- Up, Medium-Term
|
Key points:
- The I.I. survey of newsletter writers showed more bears than bulls
- This ended a streak of nearly 2 years of optimism, the 6th-longest streak in 53 years
- The ends of other long streaks mostly preceded gains for stock indexes and sectors
Survey of newsletters shows more bears than bulls, 1st time in almost 2 years
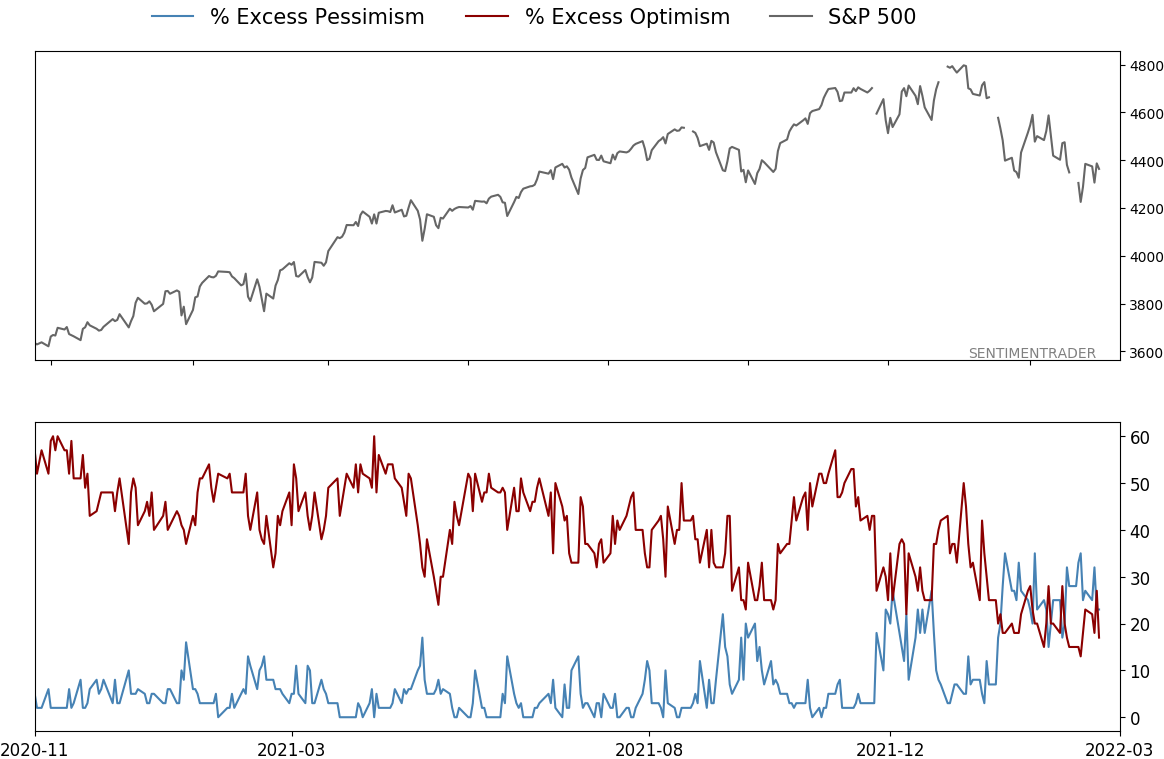
Investors aren't panicking, but they sure aren't very bullish, either. On an average day over the past week, nearly 30% of our core indicators have recorded a pessimistic extreme. That's the most since April 2020, but at most significant lows over the past decade, nearly 50% of indicators hit a pessimistic extreme.
Still, more and more indicators are falling out of neutral, including real-money gauges and surveys. One of the granddaddy surveys from Investor's Intelligence showed that more newsletters expect stocks to decline than rally in the months ahead. This is the first week with fewer bulls than bears in nearly 2 years.
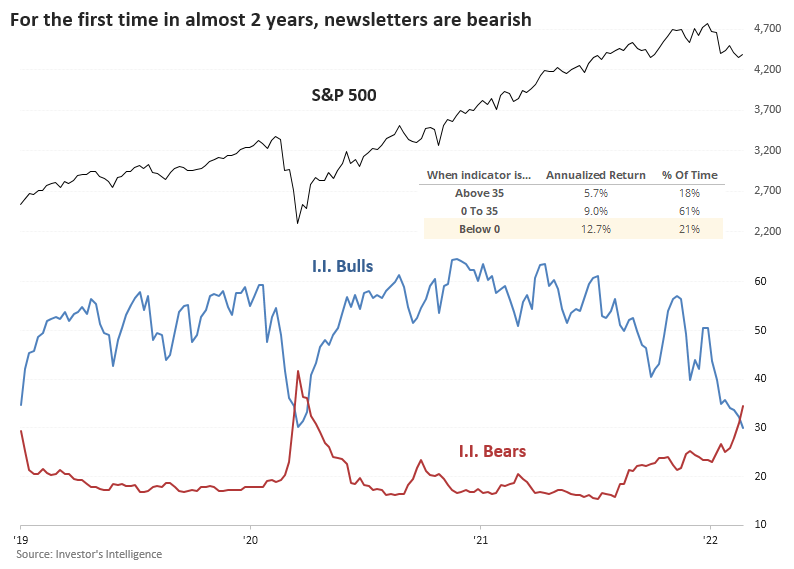
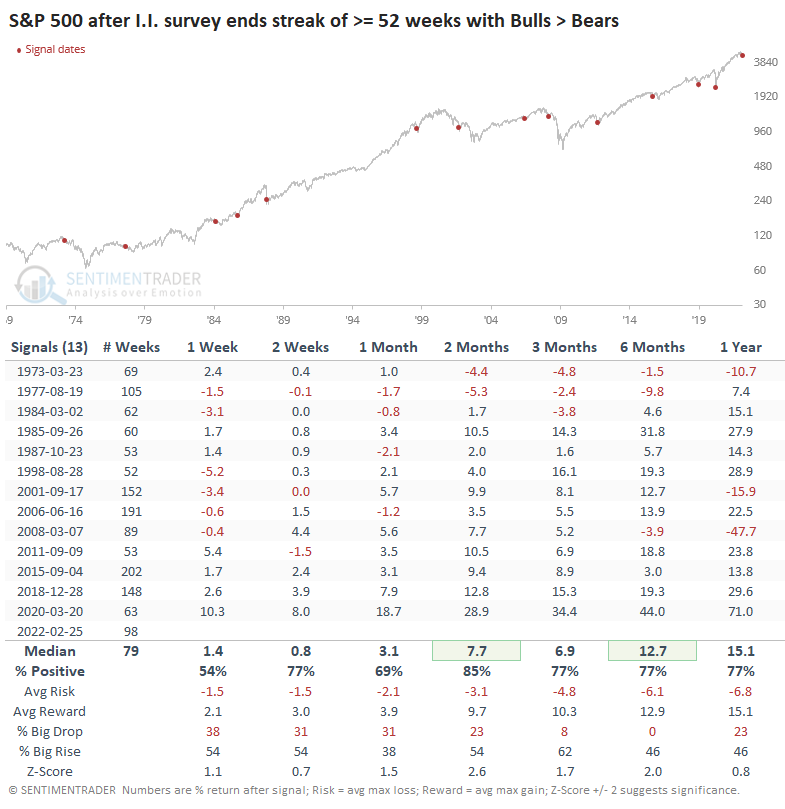
This ends the 6th-longest streak of bullish sentiment since the survey's inception.
Best to fade the majority of newsletters
The ends of other long streaks of optimism tended to be a good sign for the S&P 500. While we prefer to see optimism rising instead of falling, by the time that pessimists accounted for the majority of newsletters, most stock declines were behind us. Over the next 2 months, the S&P rallied after 11 out of 13 precedents. The only two losses were in the 1970s, and the gains tended to persist, though they most certainly did not in 2008.
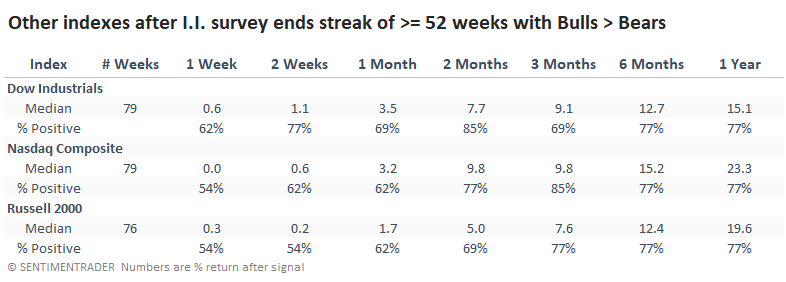
It was also a mostly good sign for the other major indexes. The Dow Industrials did the best in the short term, while the Nasdaq took the lead after that.
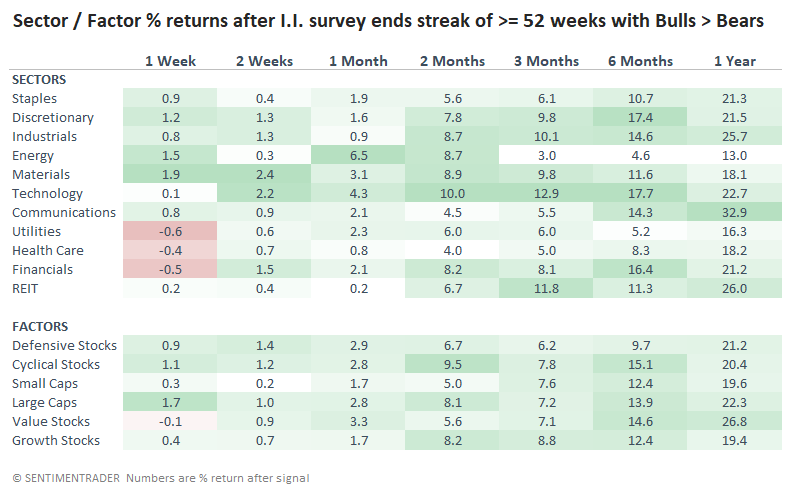
Among sectors and factors, Technology stocks showed the most consistently impressive average returns, with Industrials and Discretionary doing well, too. Cyclical stocks showed better short-term returns while Value stocks did best over the long term. Over the next 6 months, Value stocks gained after 12 out of 13 signals.
What the research tells us...
The Investor's Intelligence survey isn't yet showing that newsletters are extremely pessimistic. But the fact that they're pessimistic at all is noteworthy since it ends a long period of optimism. After other long streaks of bullish opinion, stocks had a strong tendency to rally in the months ahead. We'd prefer to see rising optimism, but the fact that stocks showed consistently strong returns after these streaks is a point in bulls' favor.
Active Studies
| Time Frame | Bullish | Bearish | | Short-Term | 4 | 0 | | Medium-Term | 21 | 2 | | Long-Term | 15 | 5 |
|
Indicators at Extremes
Portfolio
| Position | Description | Weight % | Added / Reduced | Date | | Stocks | RSP | 21.4 | Added 10.2% | 2022-01-28 | | Bonds | 32.7% BND, 7.1% SCHP | 40.1 | Added 8.3% | 2021-10-26 | | Commodities | GCC | 2.4 | Reduced 2.1%
| 2020-09-04 | | Precious Metals | GDX | 4.6 | Reduced 4.2% | 2021-05-19 | | Special Situations | 7.6% KWEB, 4.9% XBI, 3.7% XLE, 1.8% PSCE | 18.0 | Added 4.6% | 2022-02-24 | | Cash | | 13.2 | | |
|
Updates (Changes made today are underlined)
With a typical time frame of several months in this account, I normally don't make changes so quickly. I've added back part of the stock exposure I took off earlier in January due to the washed-out conditions and extreme pessimism we're seeing across a wide array of metrics. The biggest issue is that the environment is unhealthy and we could be in the throes of a protracted bear market. Even so, the readings we've seen recently have a good record at preceding relief rallies, so we'll have to see how that pans out. Bond sentiment is trying to recover from a recent bout of pessimism, and gold stocks are doing their thing which is not much at all. They've been flat for six months. Chinese tech stocks were doing exactly what they're supposed to do, then did *not* by plunging to new lows. This is troubling on a shorter-term time frame, but this was never meant for a trade, rather a multi-year investment. Recent behavior is troubling and I will not be adding any exposure as long as that's the case. RETURN YTD: +0.1% 2021: +8.7%, 2020: +8.1%, 2019: +12.6%, 2018: +0.6%, 2017: +3.8%, 2016: +17.1%, 2015: +9.2%, 2014: +14.5%, 2013: +2.2%, 2012: +10.8%, 2011: +16.5%, 2010: +15.3%, 2009: +23.9%, 2008: +16.2%, 2007: +7.8%
|
|
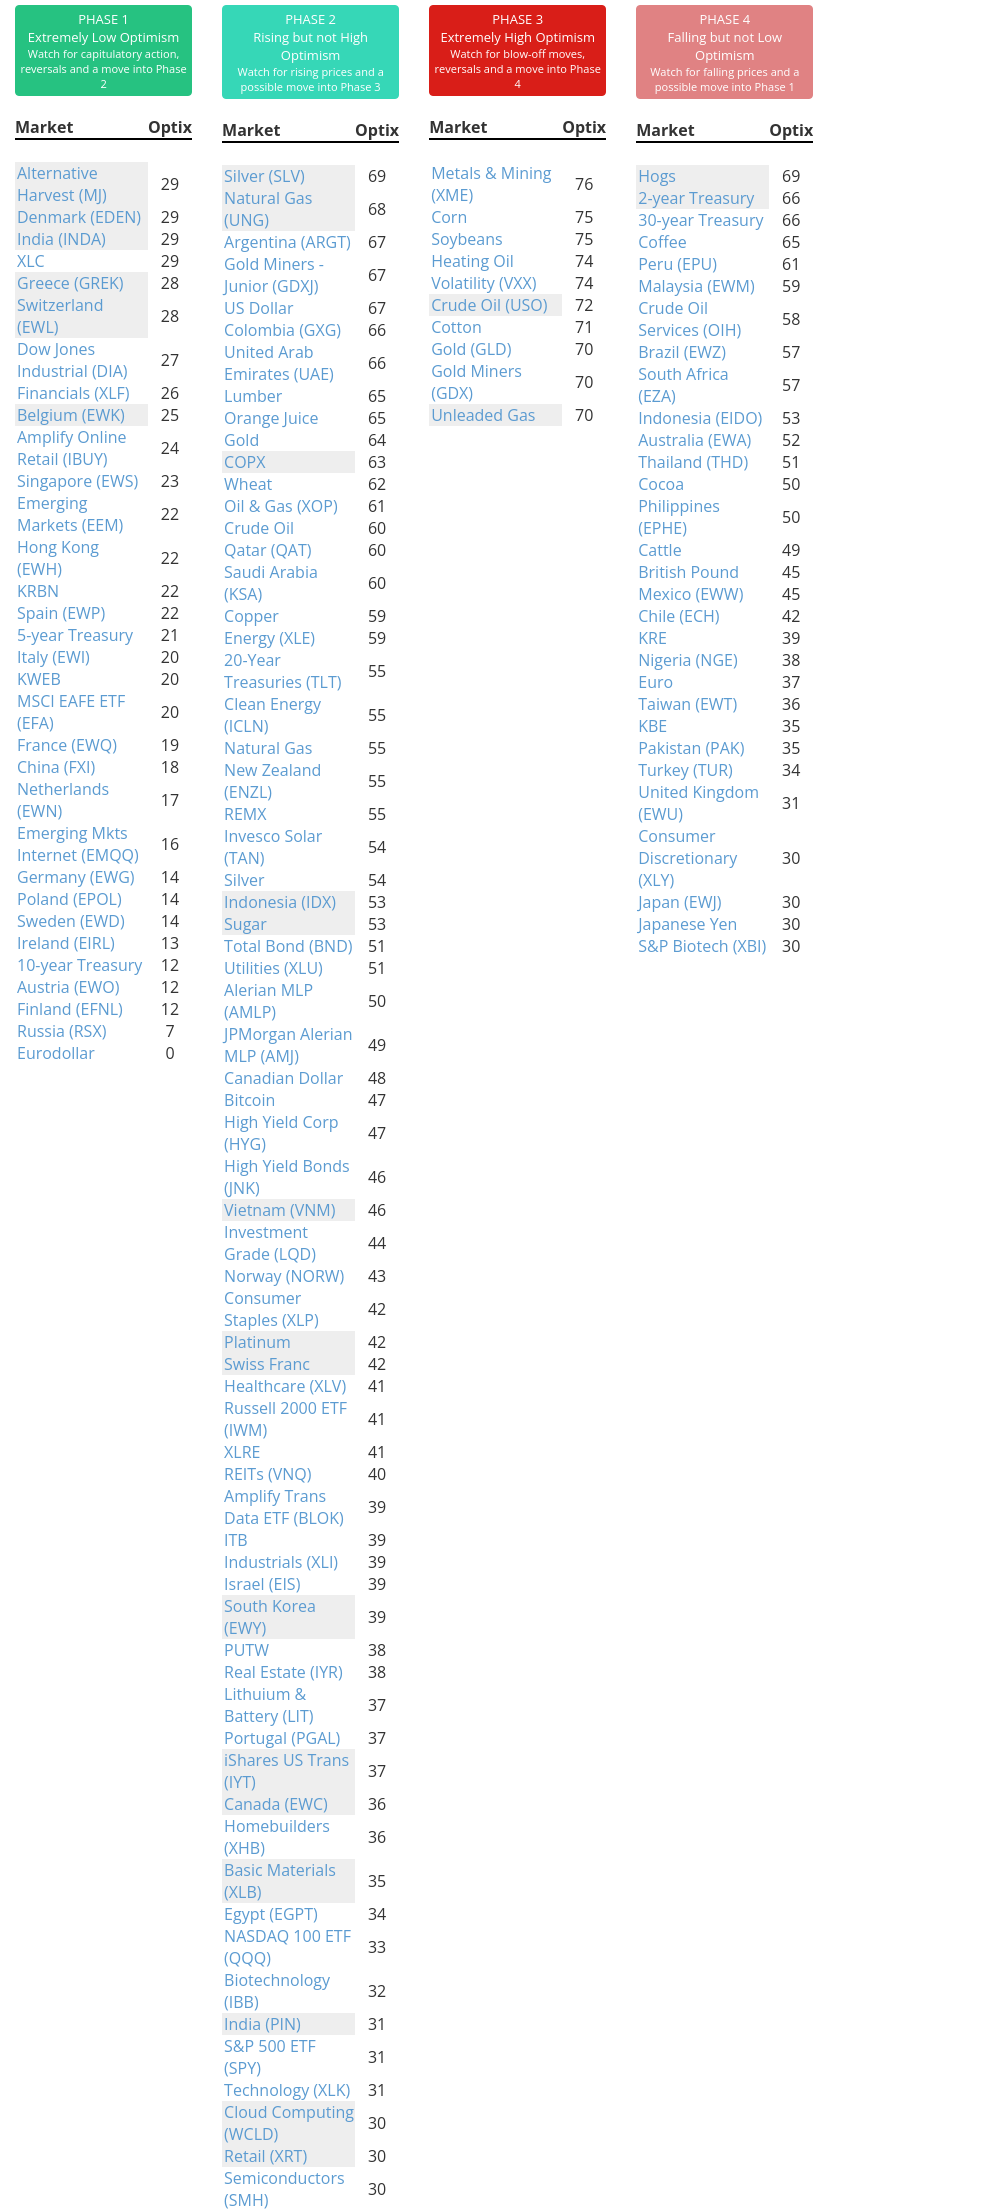
Phase Table
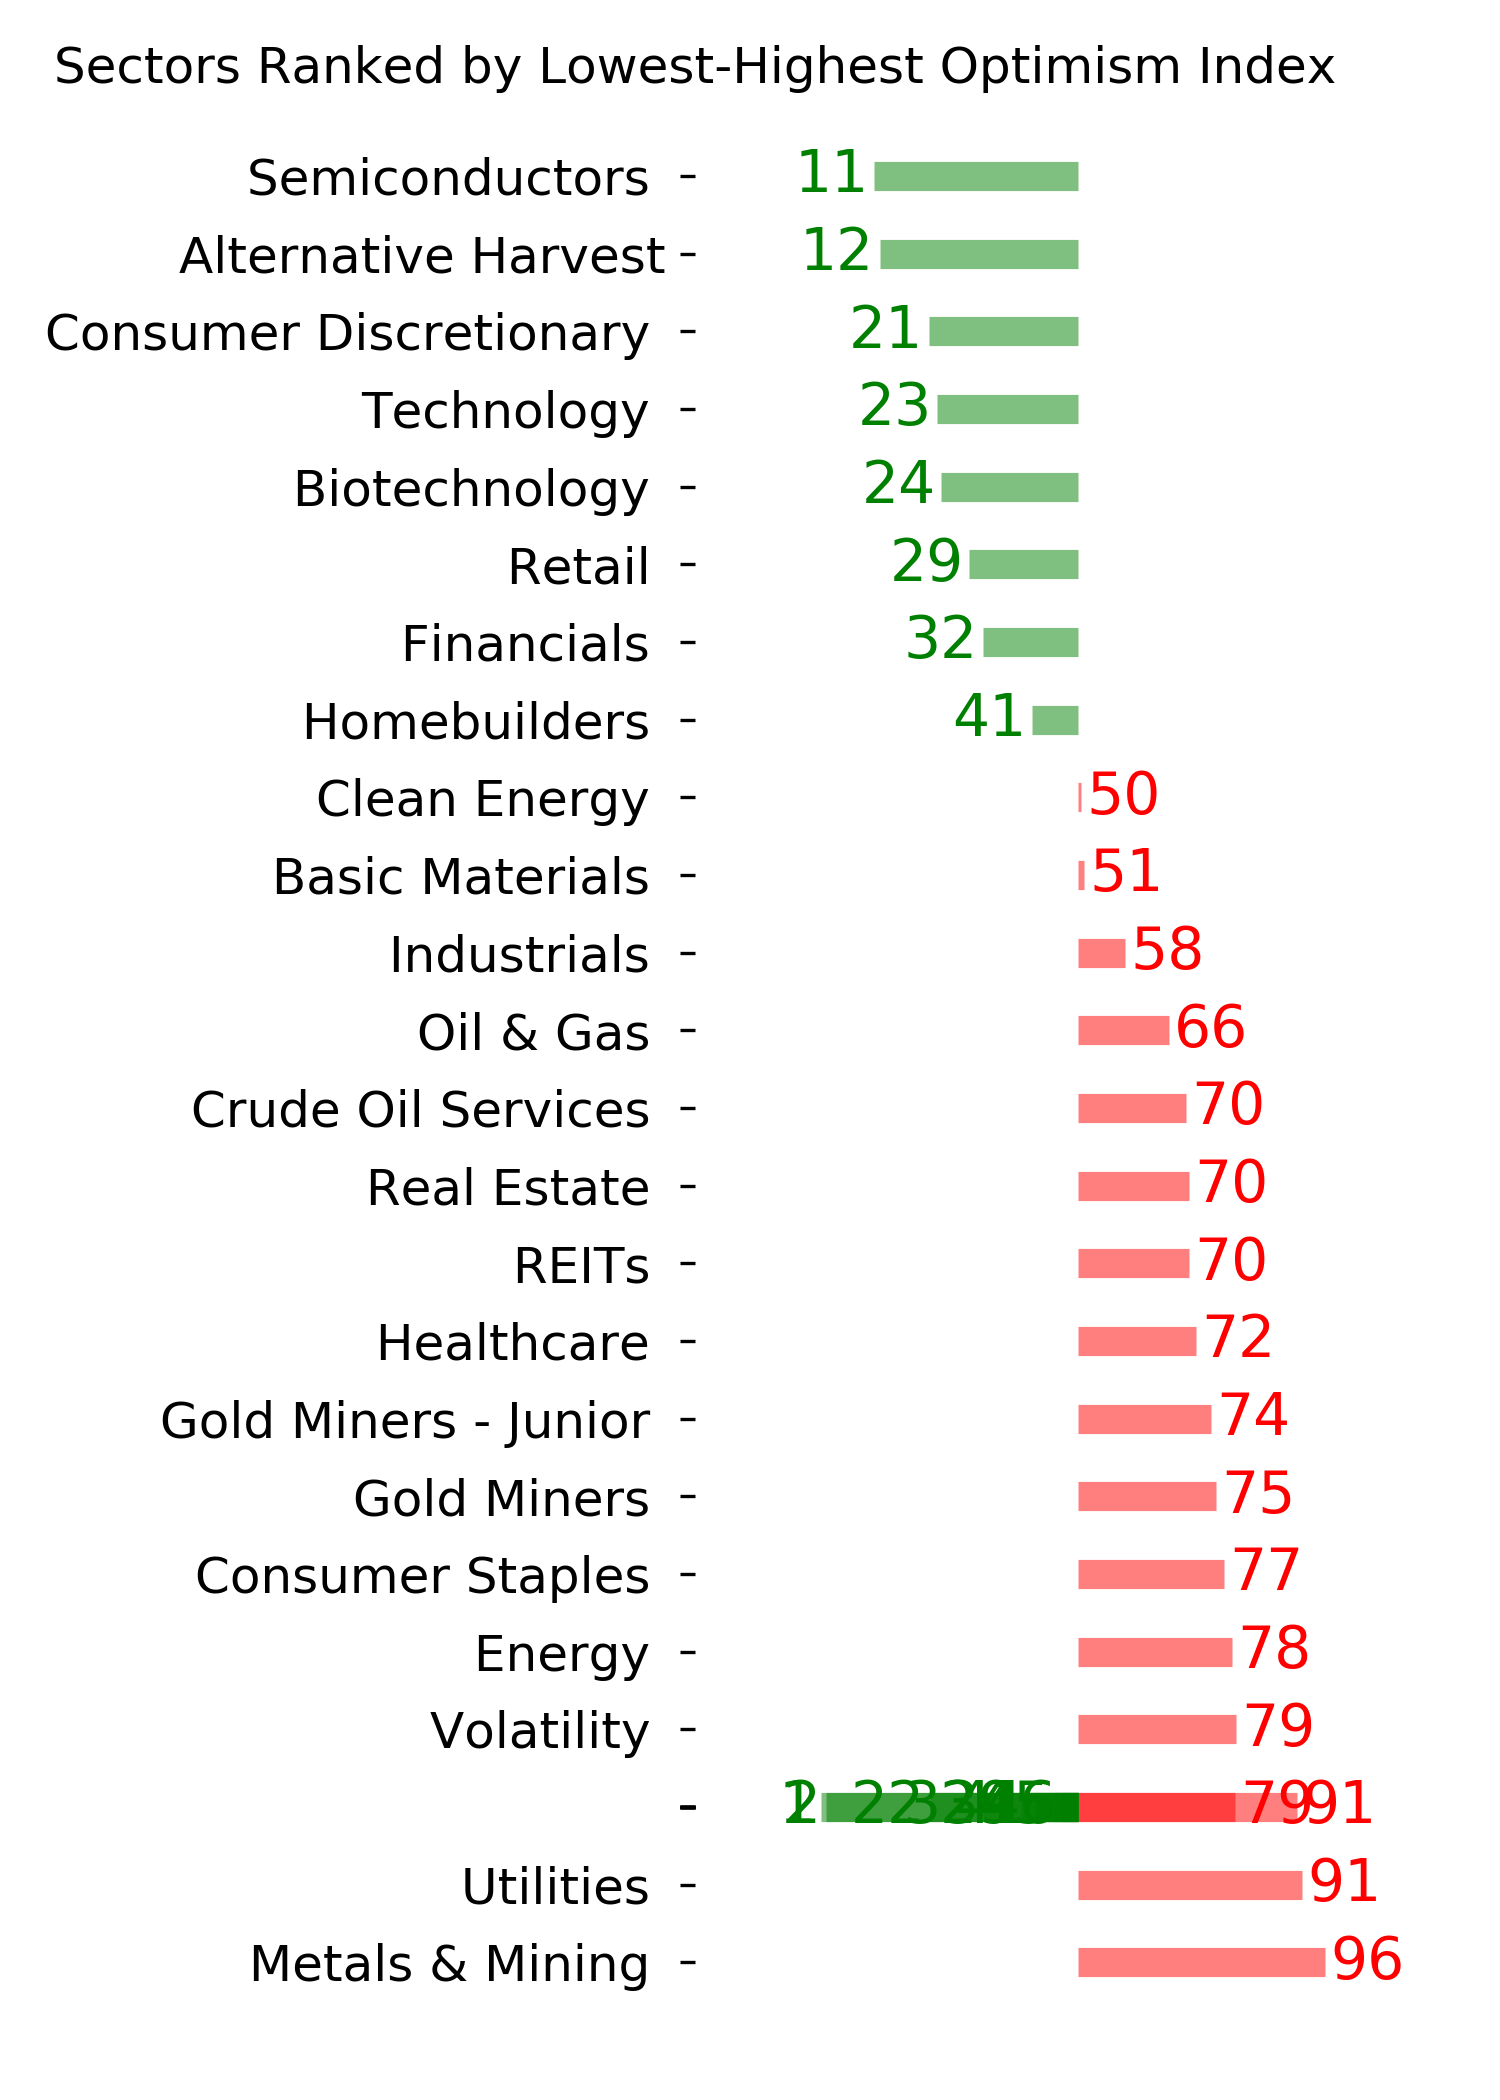
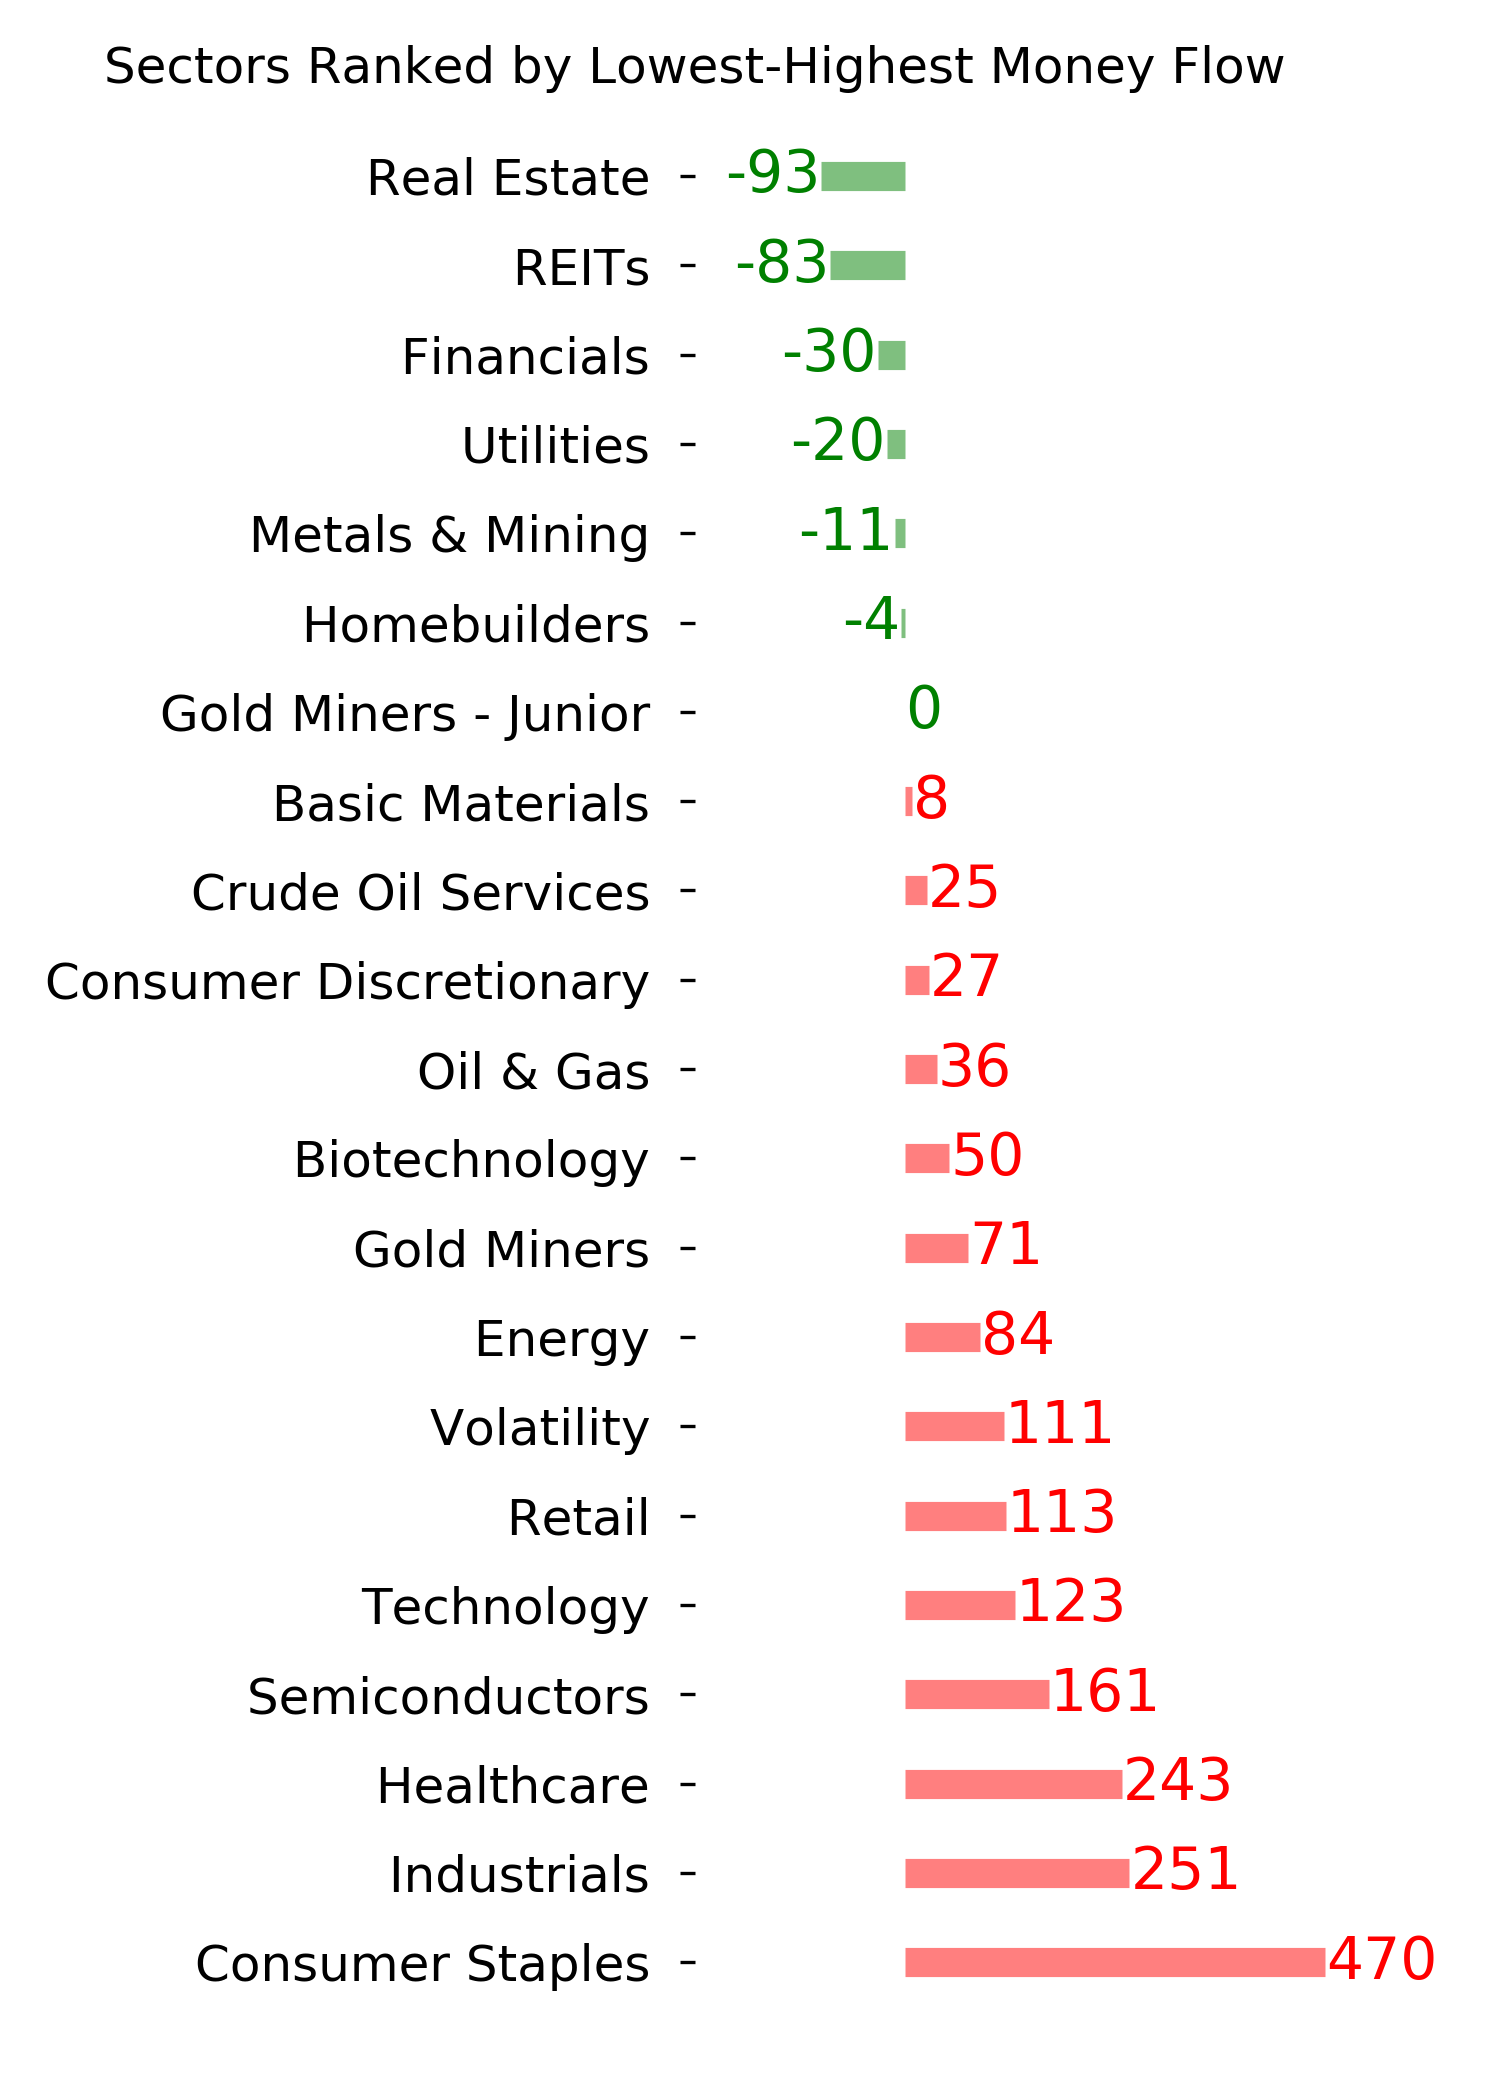
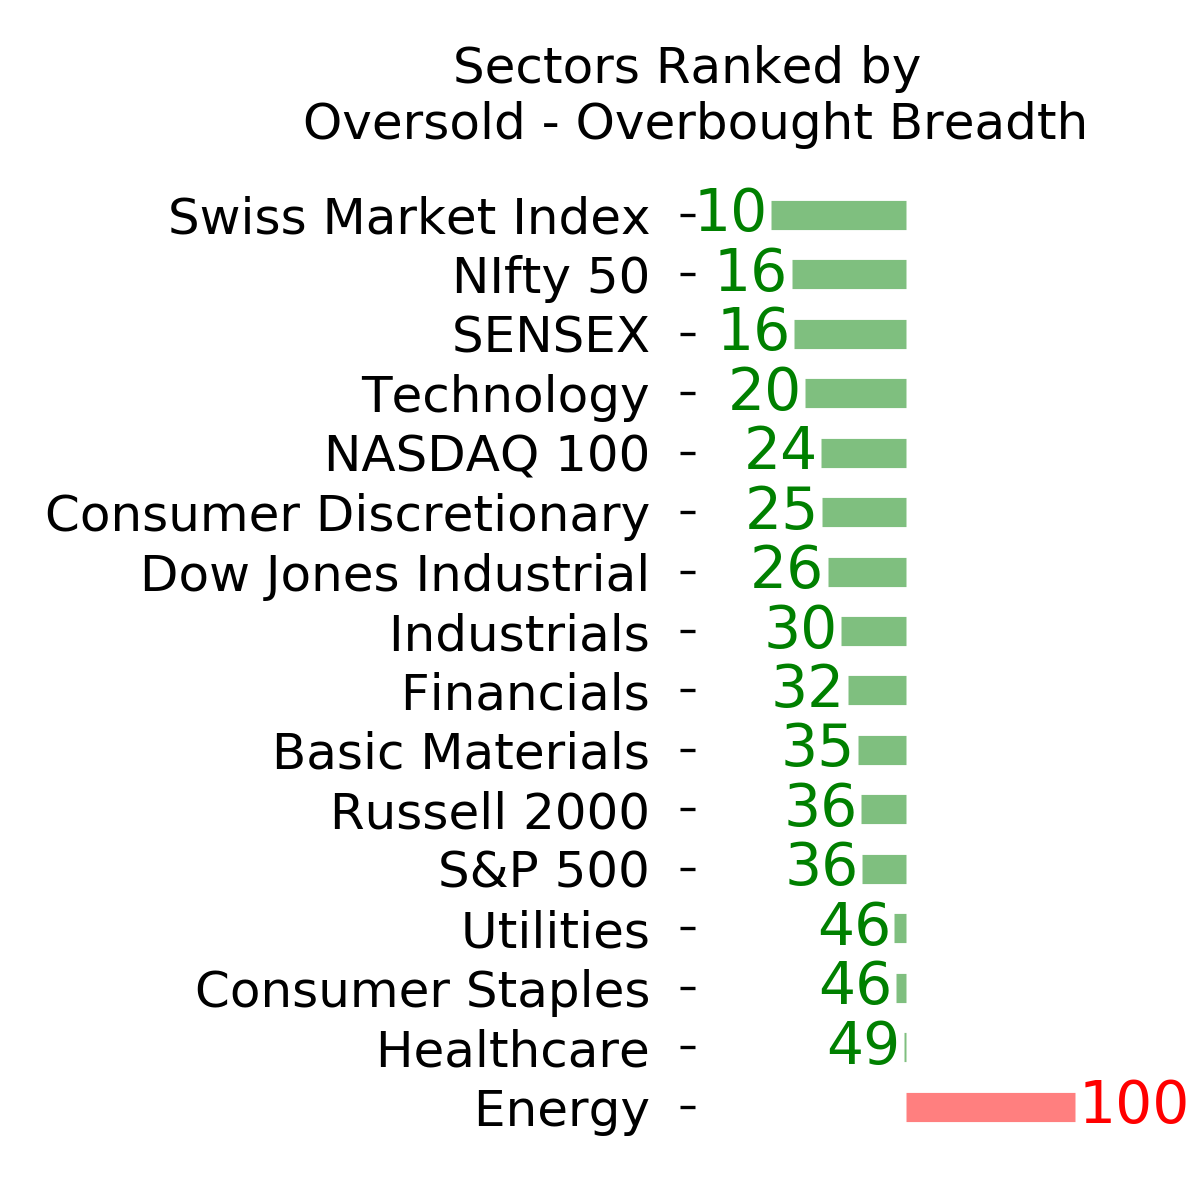
Ranks
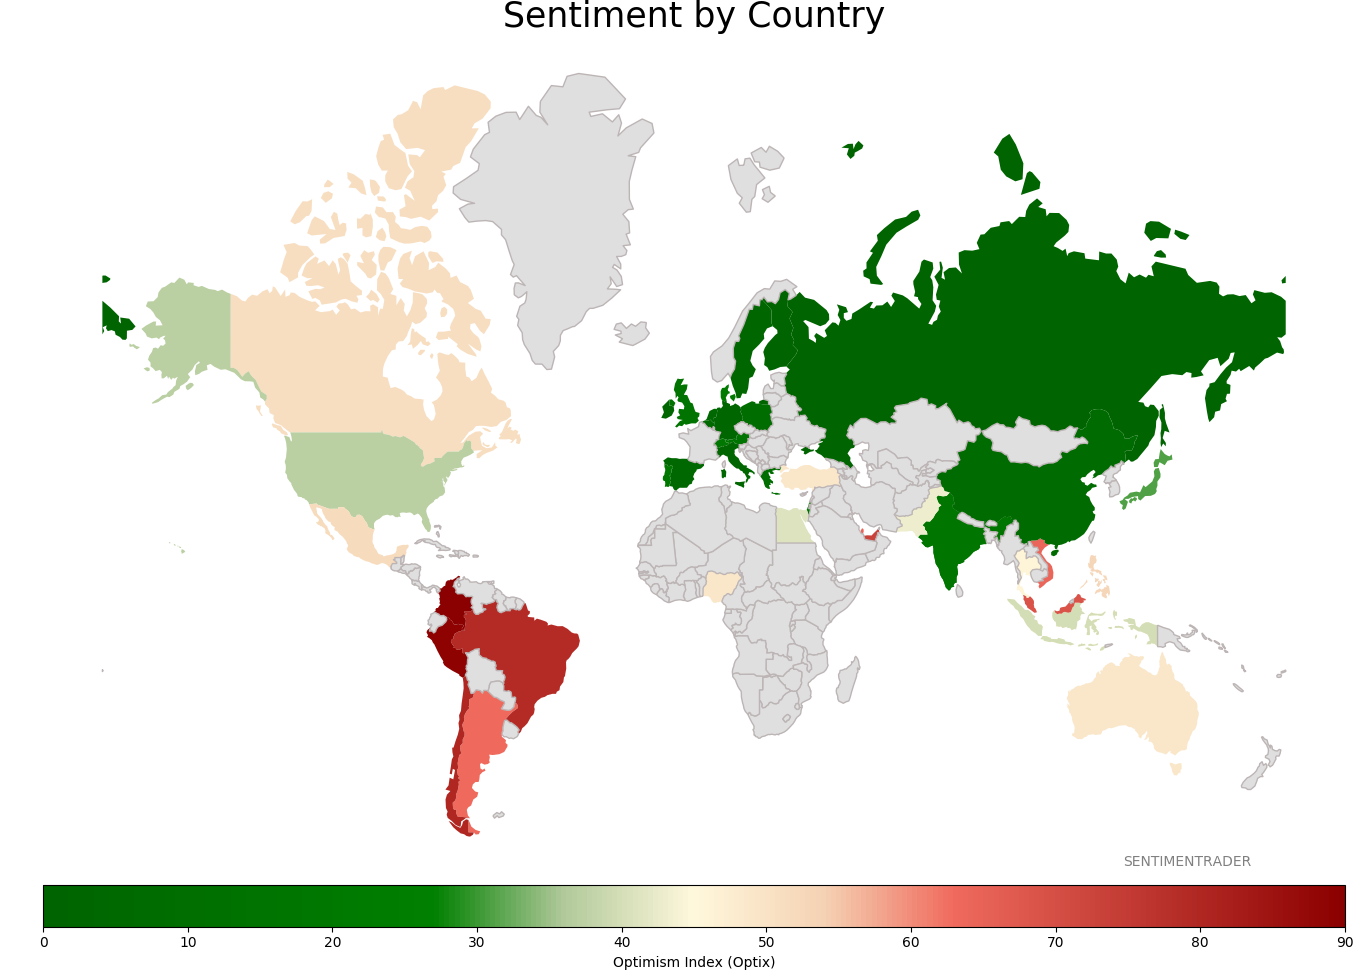
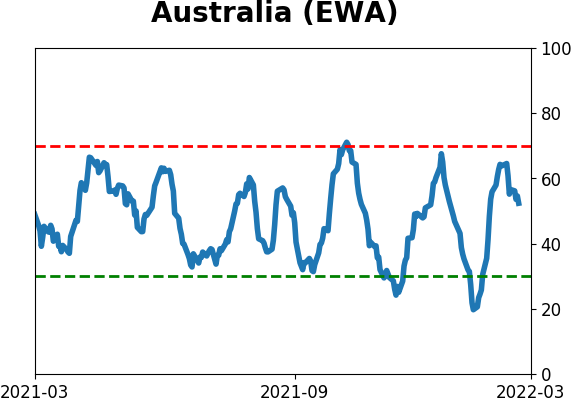
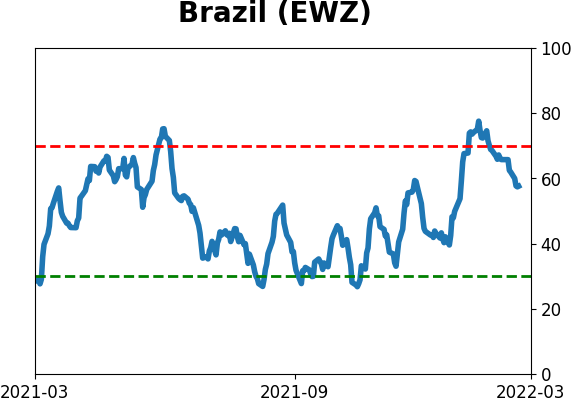
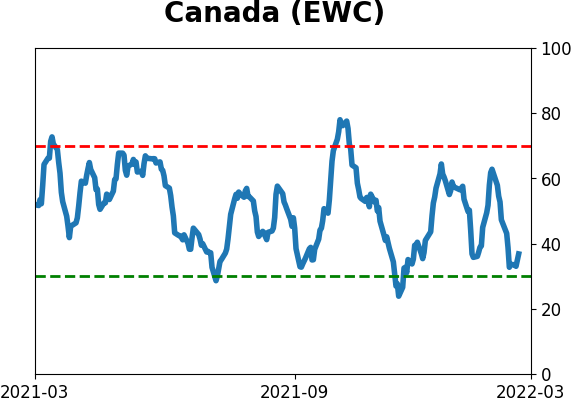
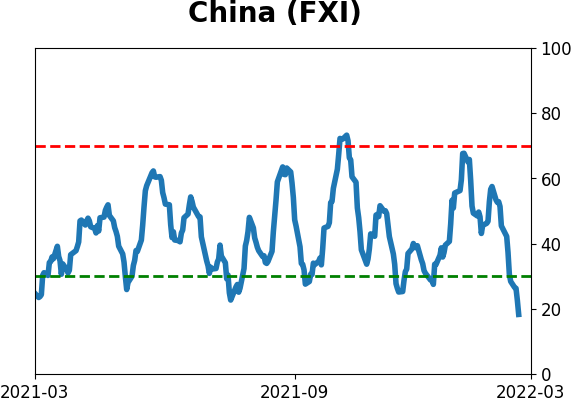
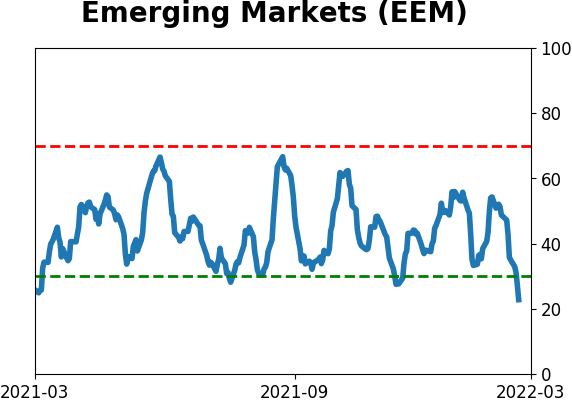
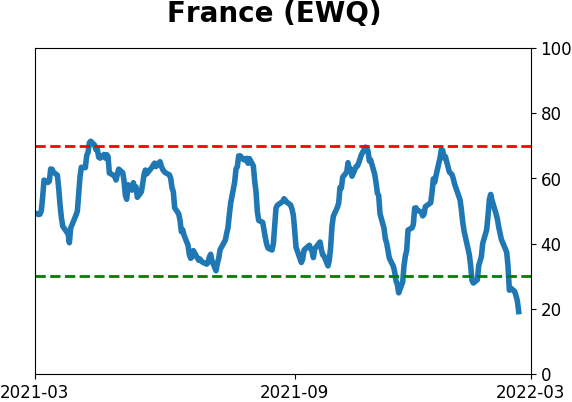
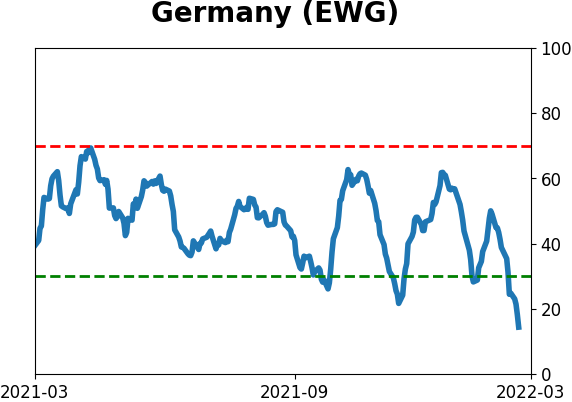
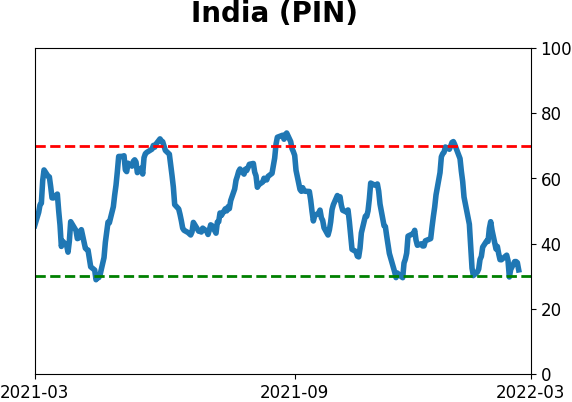
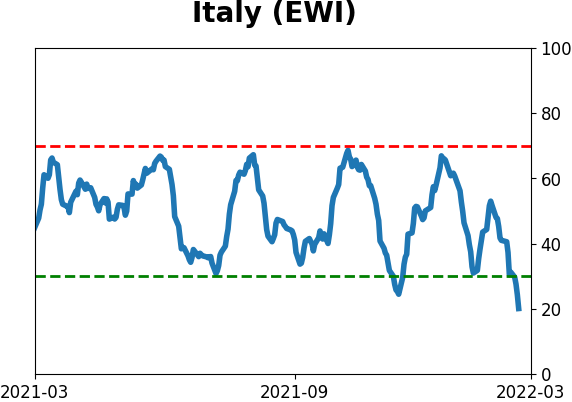
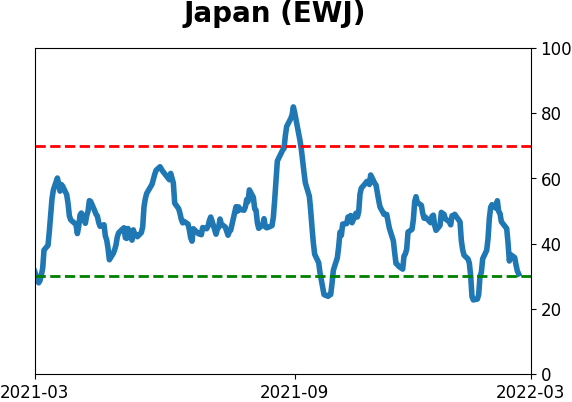
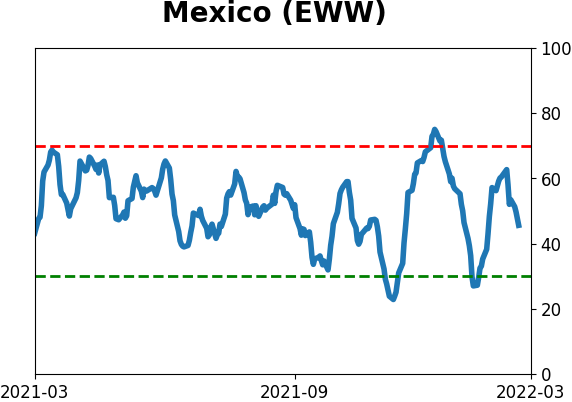
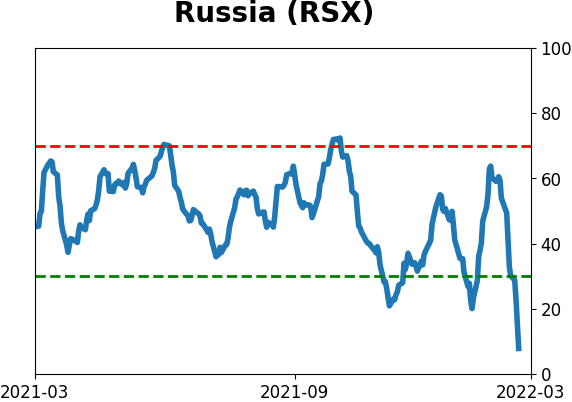
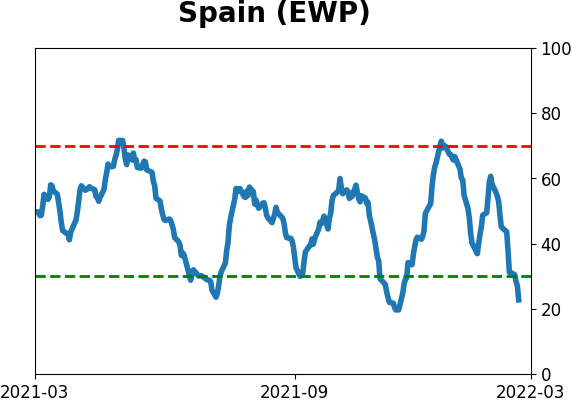
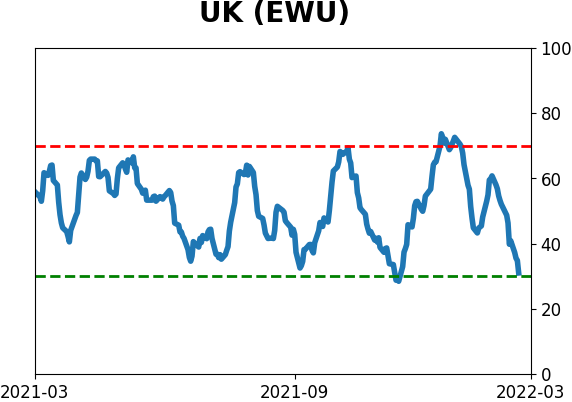
Sentiment Around The World
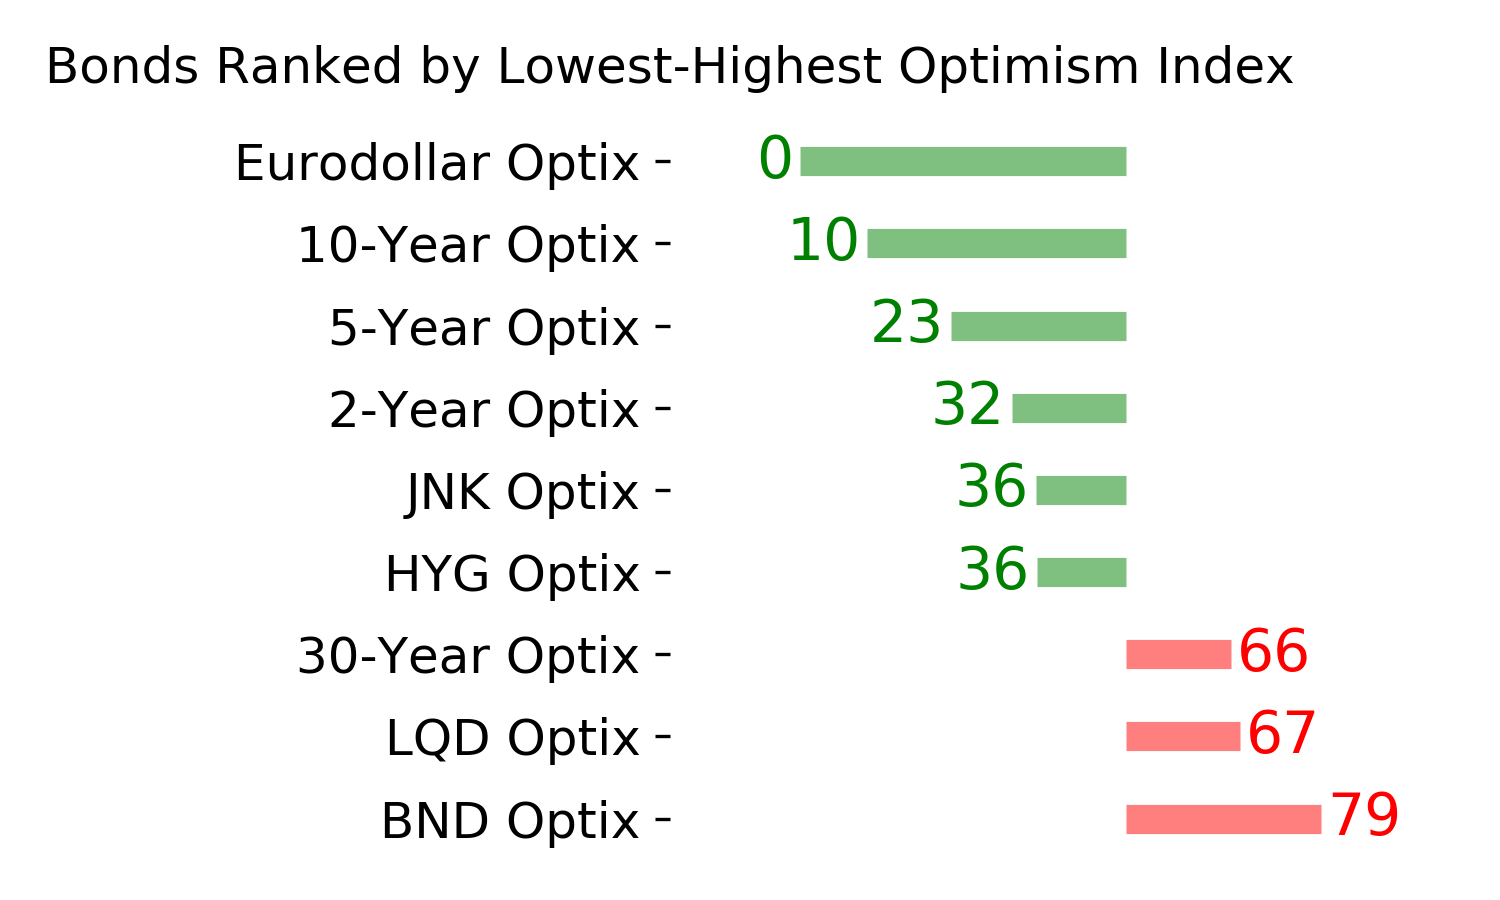
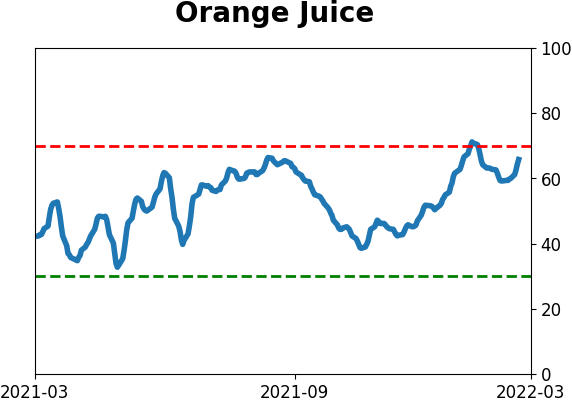
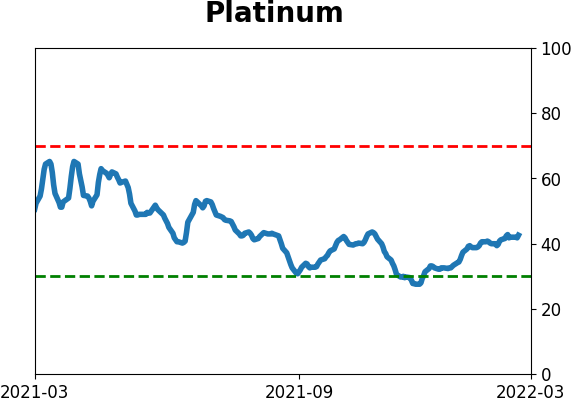
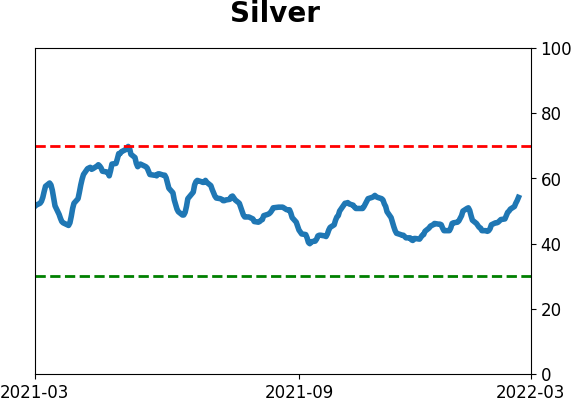
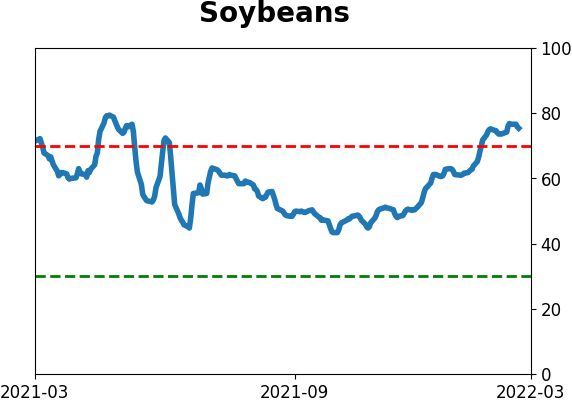
Optimism Index Thumbnails
|
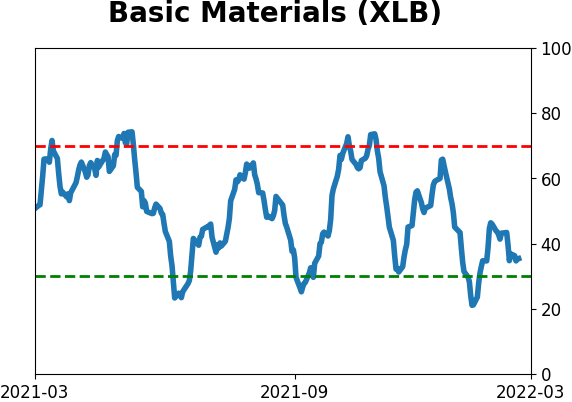
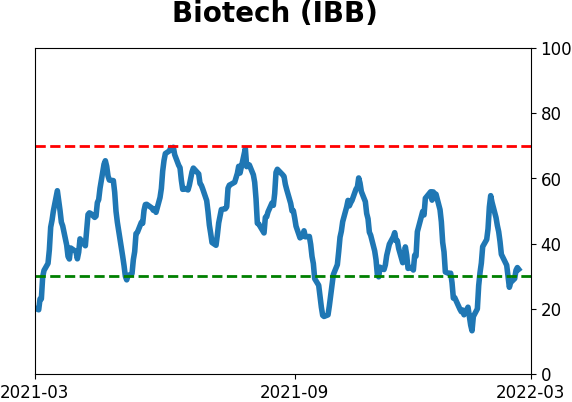
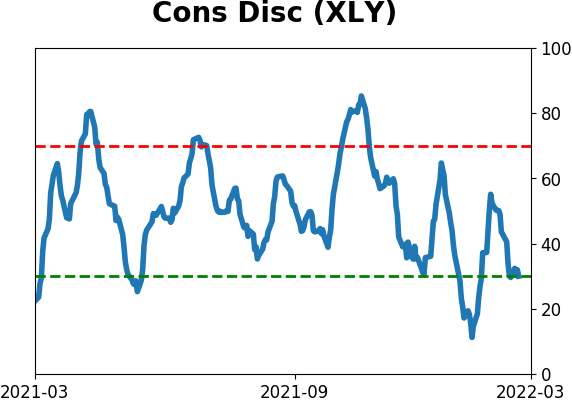
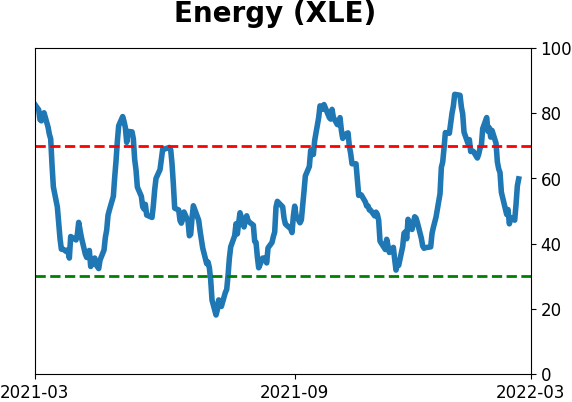
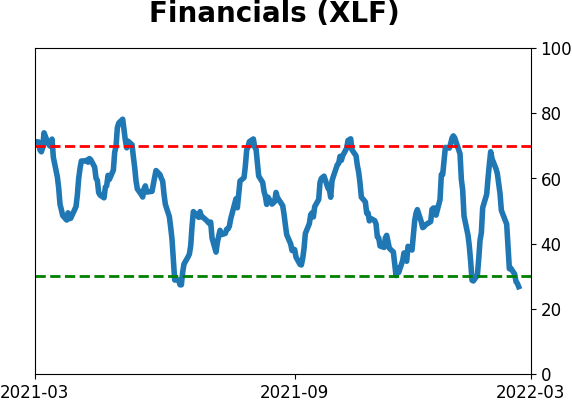
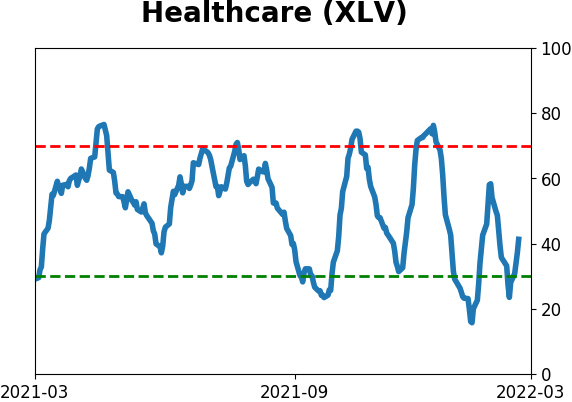
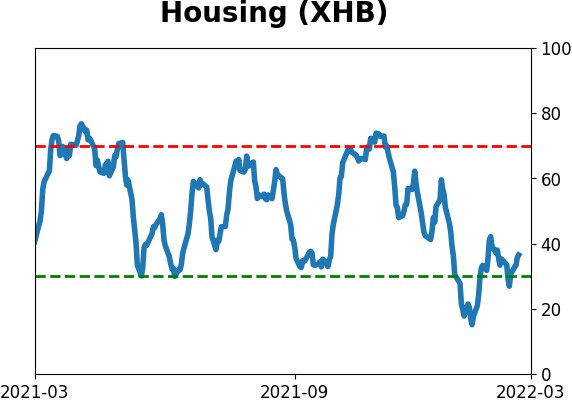
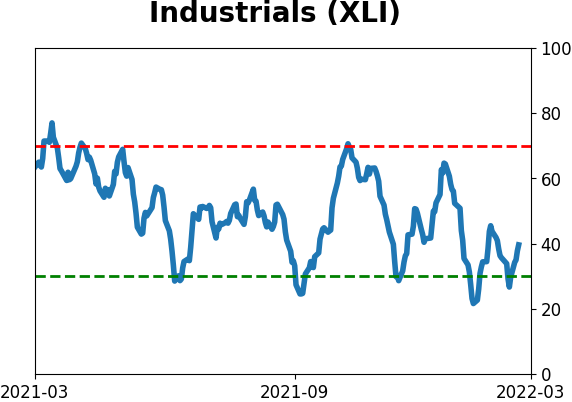
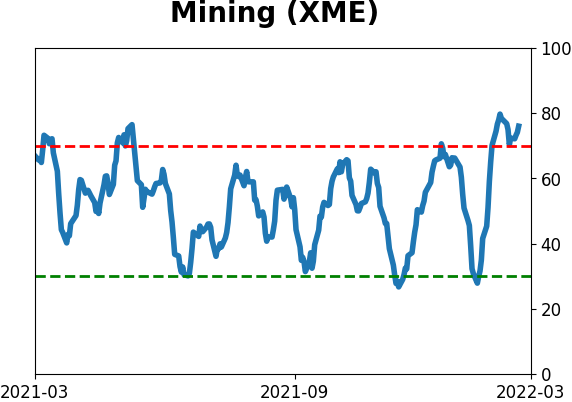
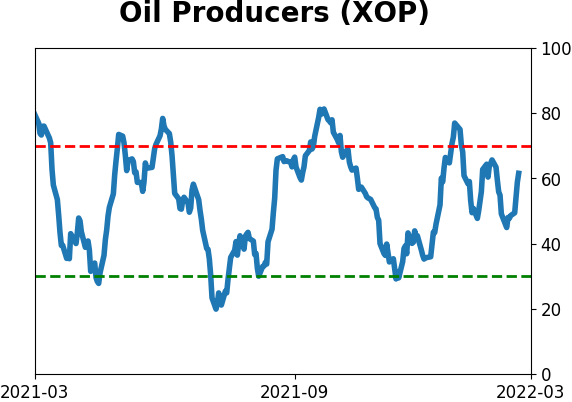
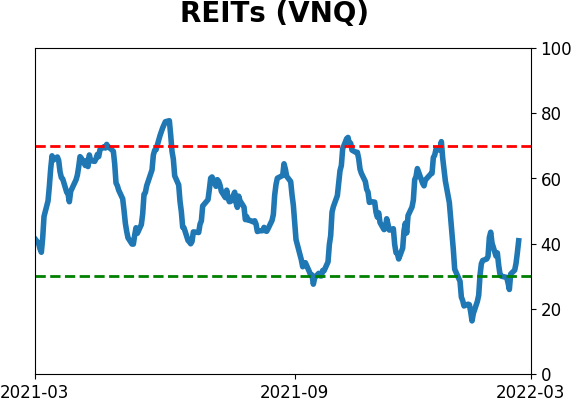
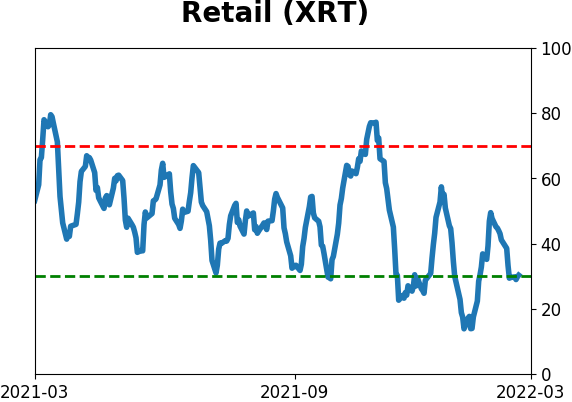
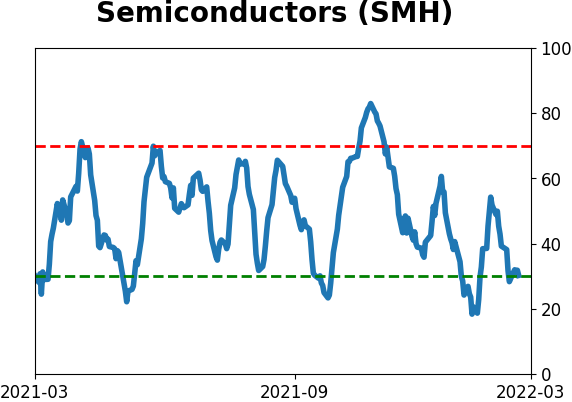
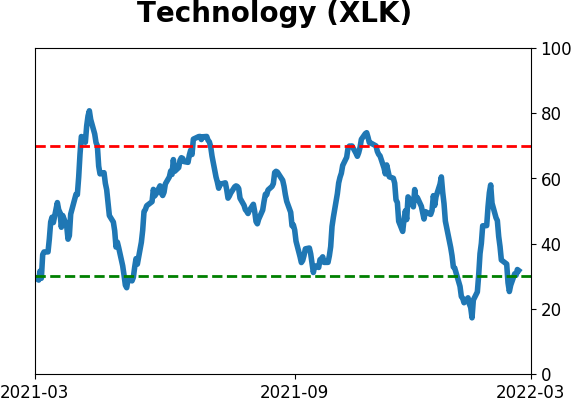
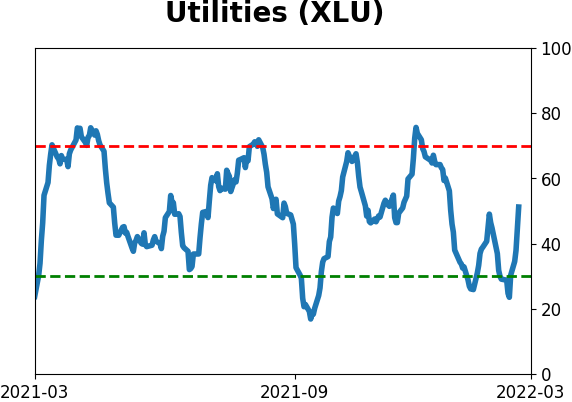
Sector ETF's - 10-Day Moving Average
|
|
|
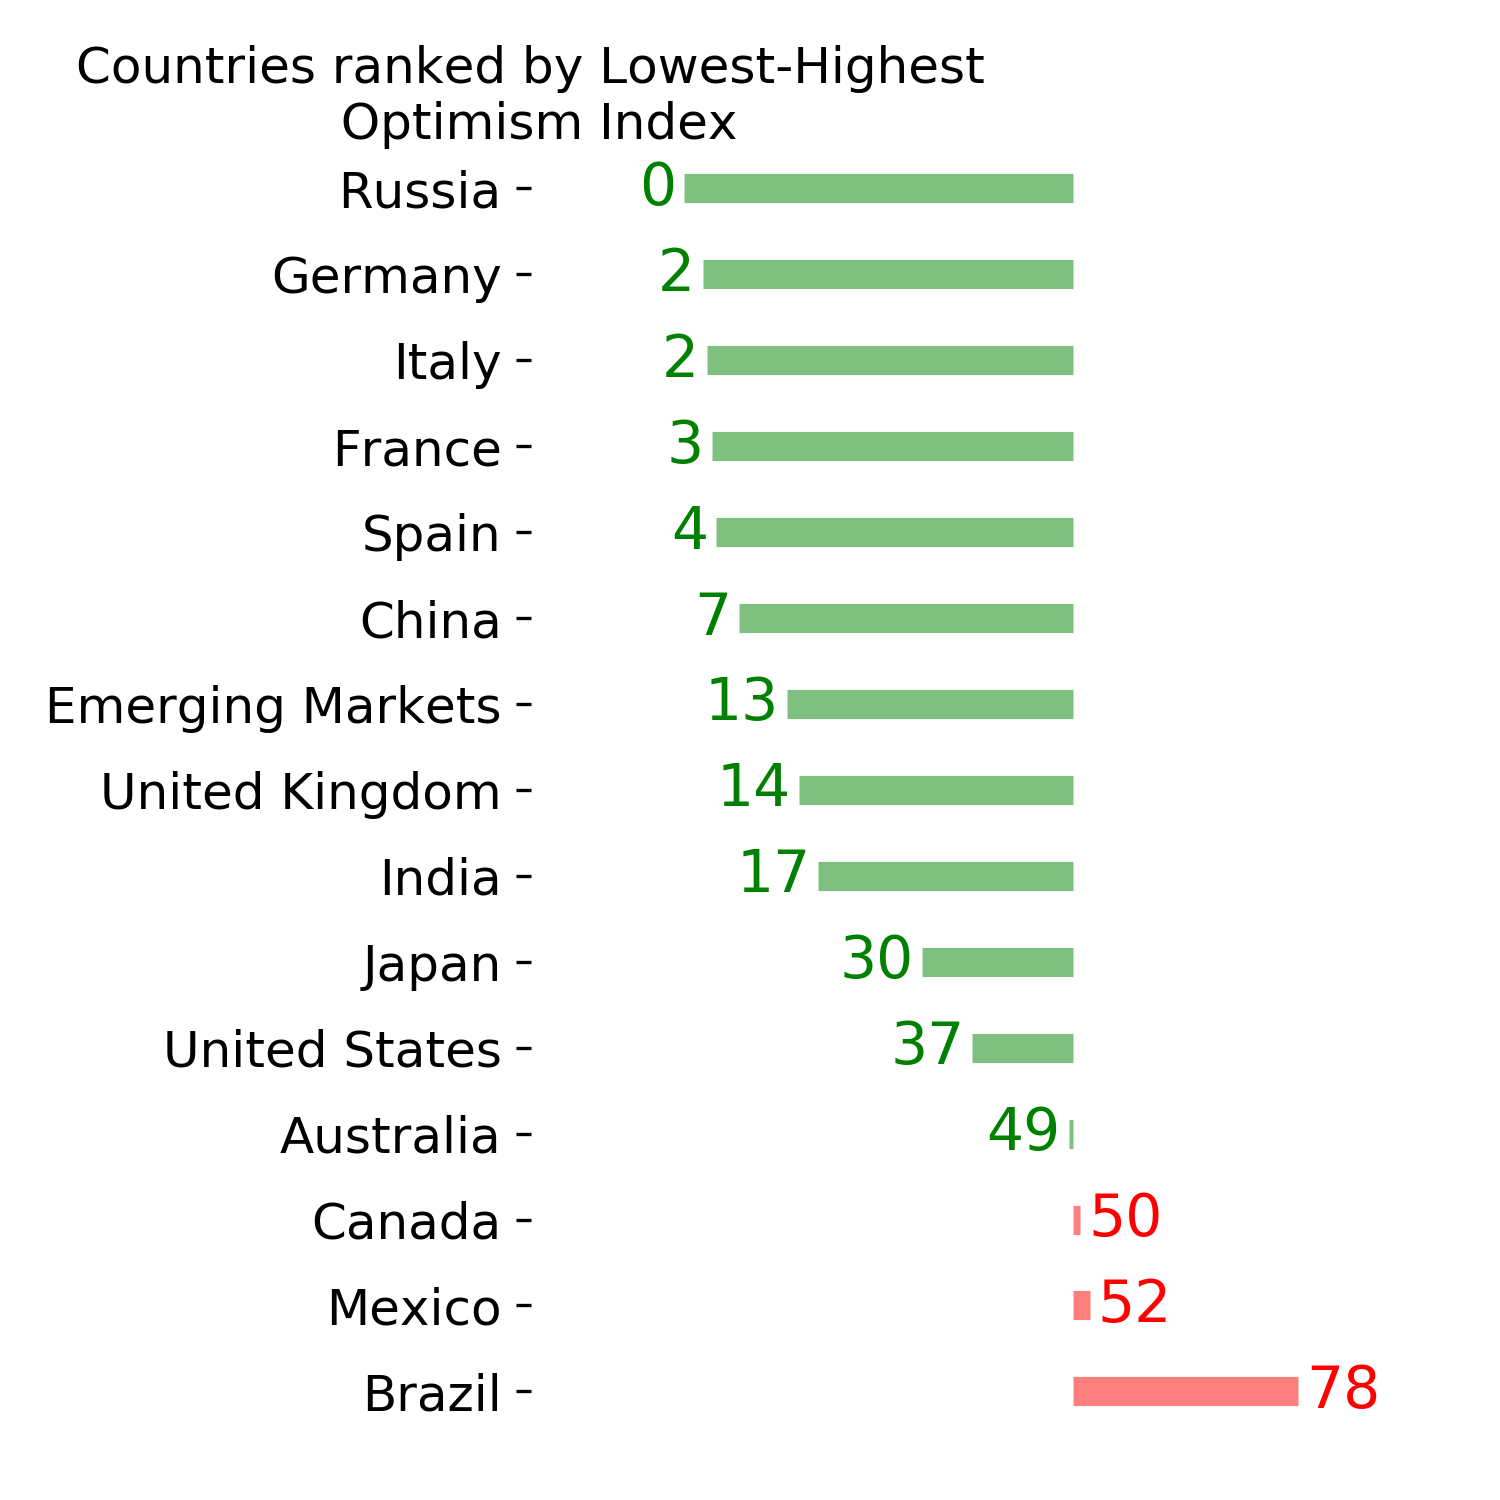
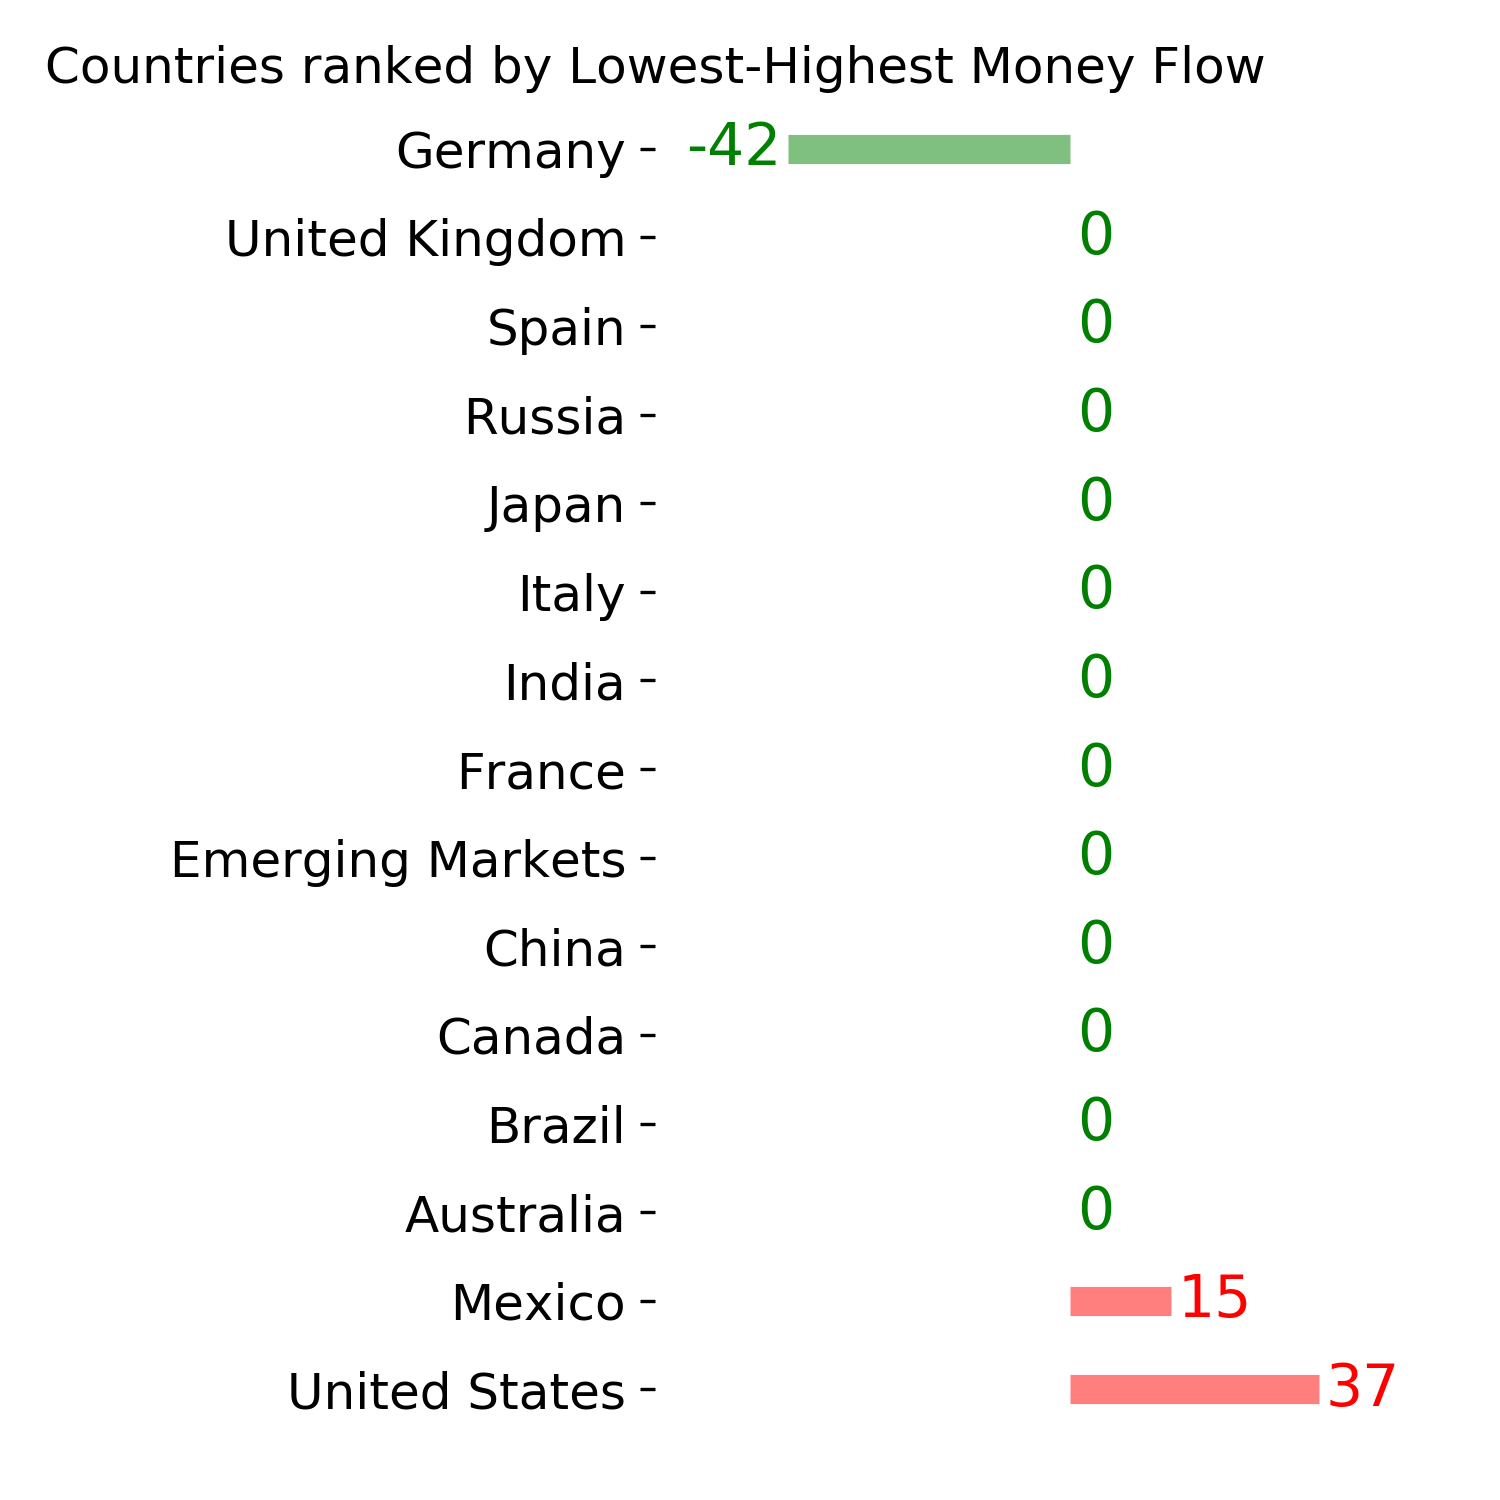
Country ETF's - 10-Day Moving Average
|
|
|
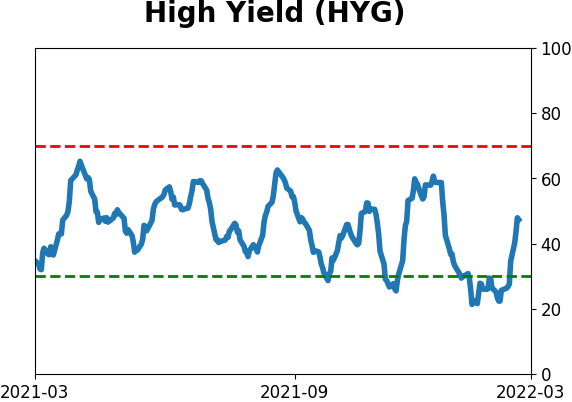
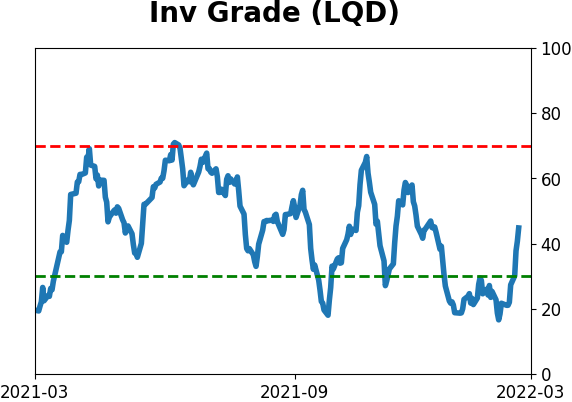
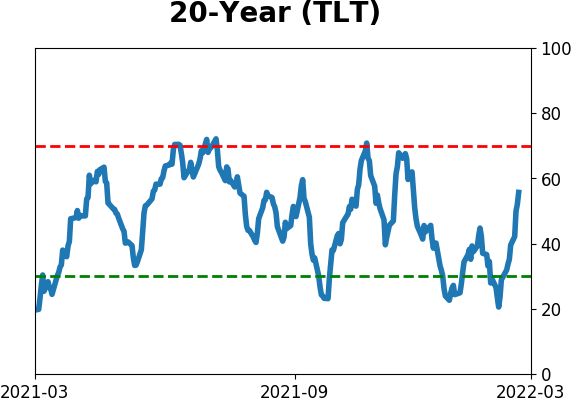
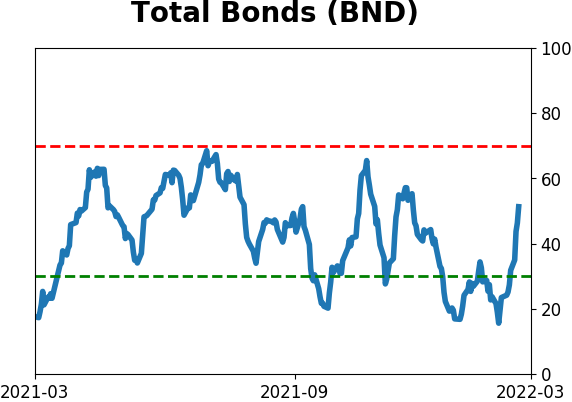
Bond ETF's - 10-Day Moving Average
|
|
|
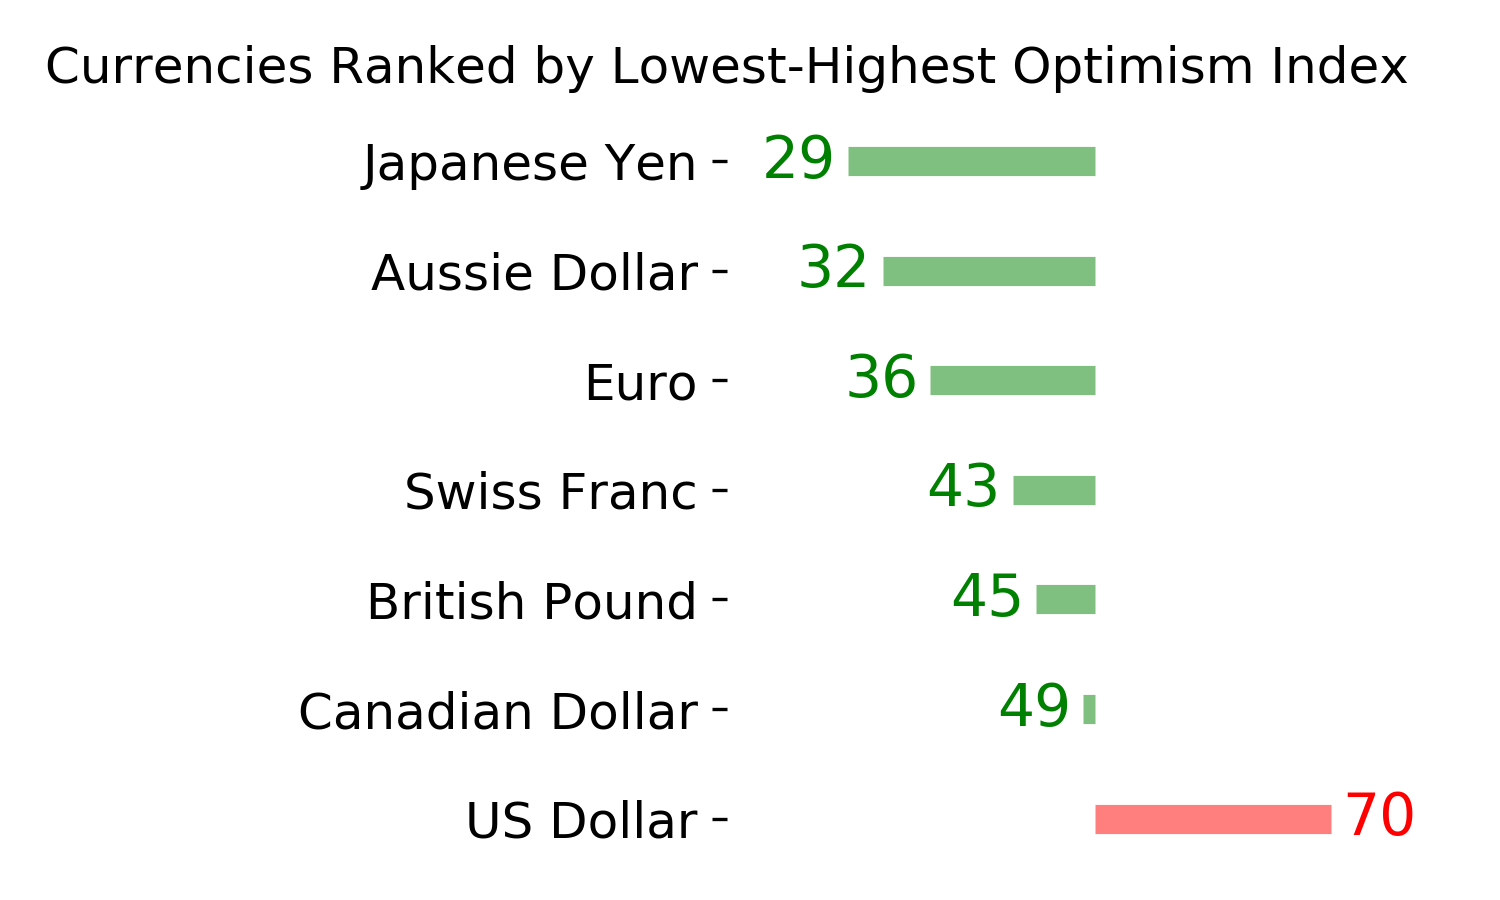
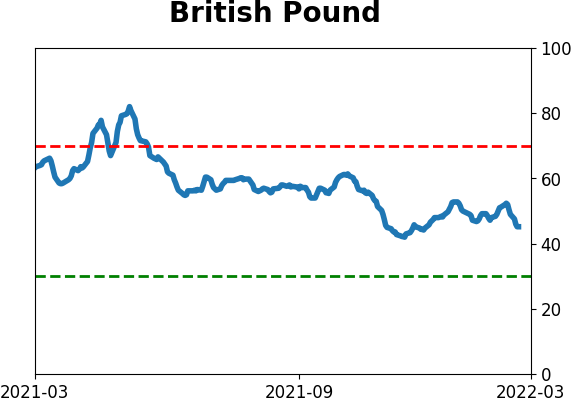
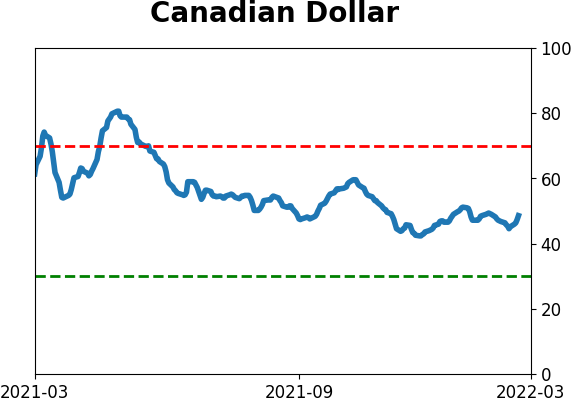
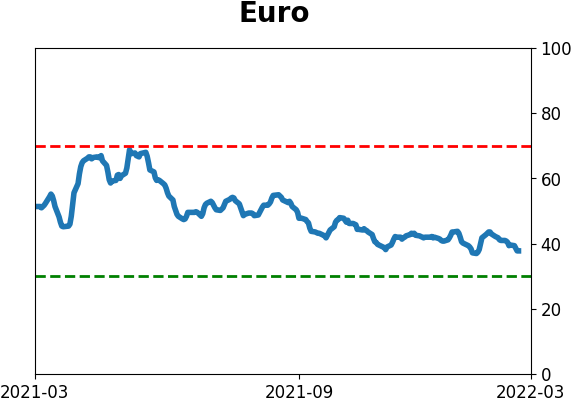
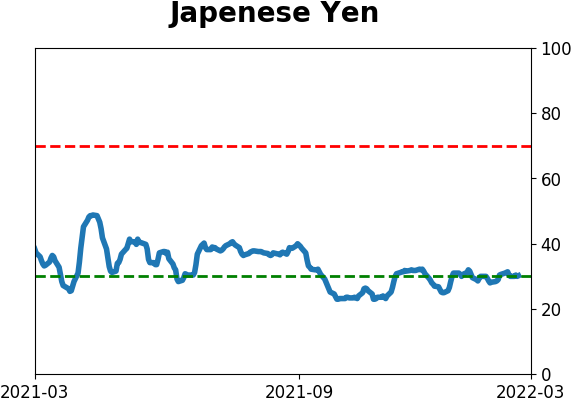
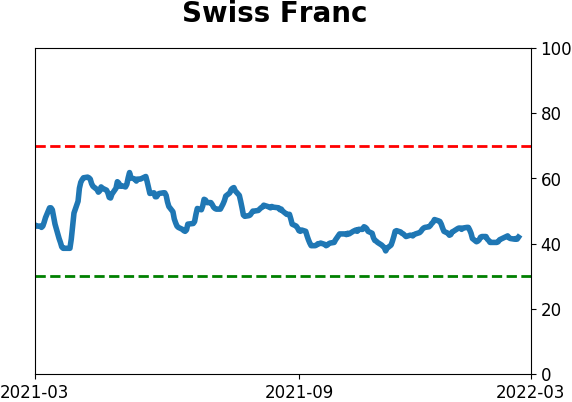
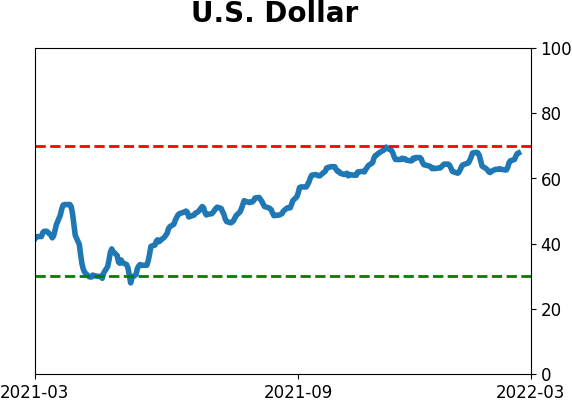
Currency ETF's - 5-Day Moving Average
|
|
|
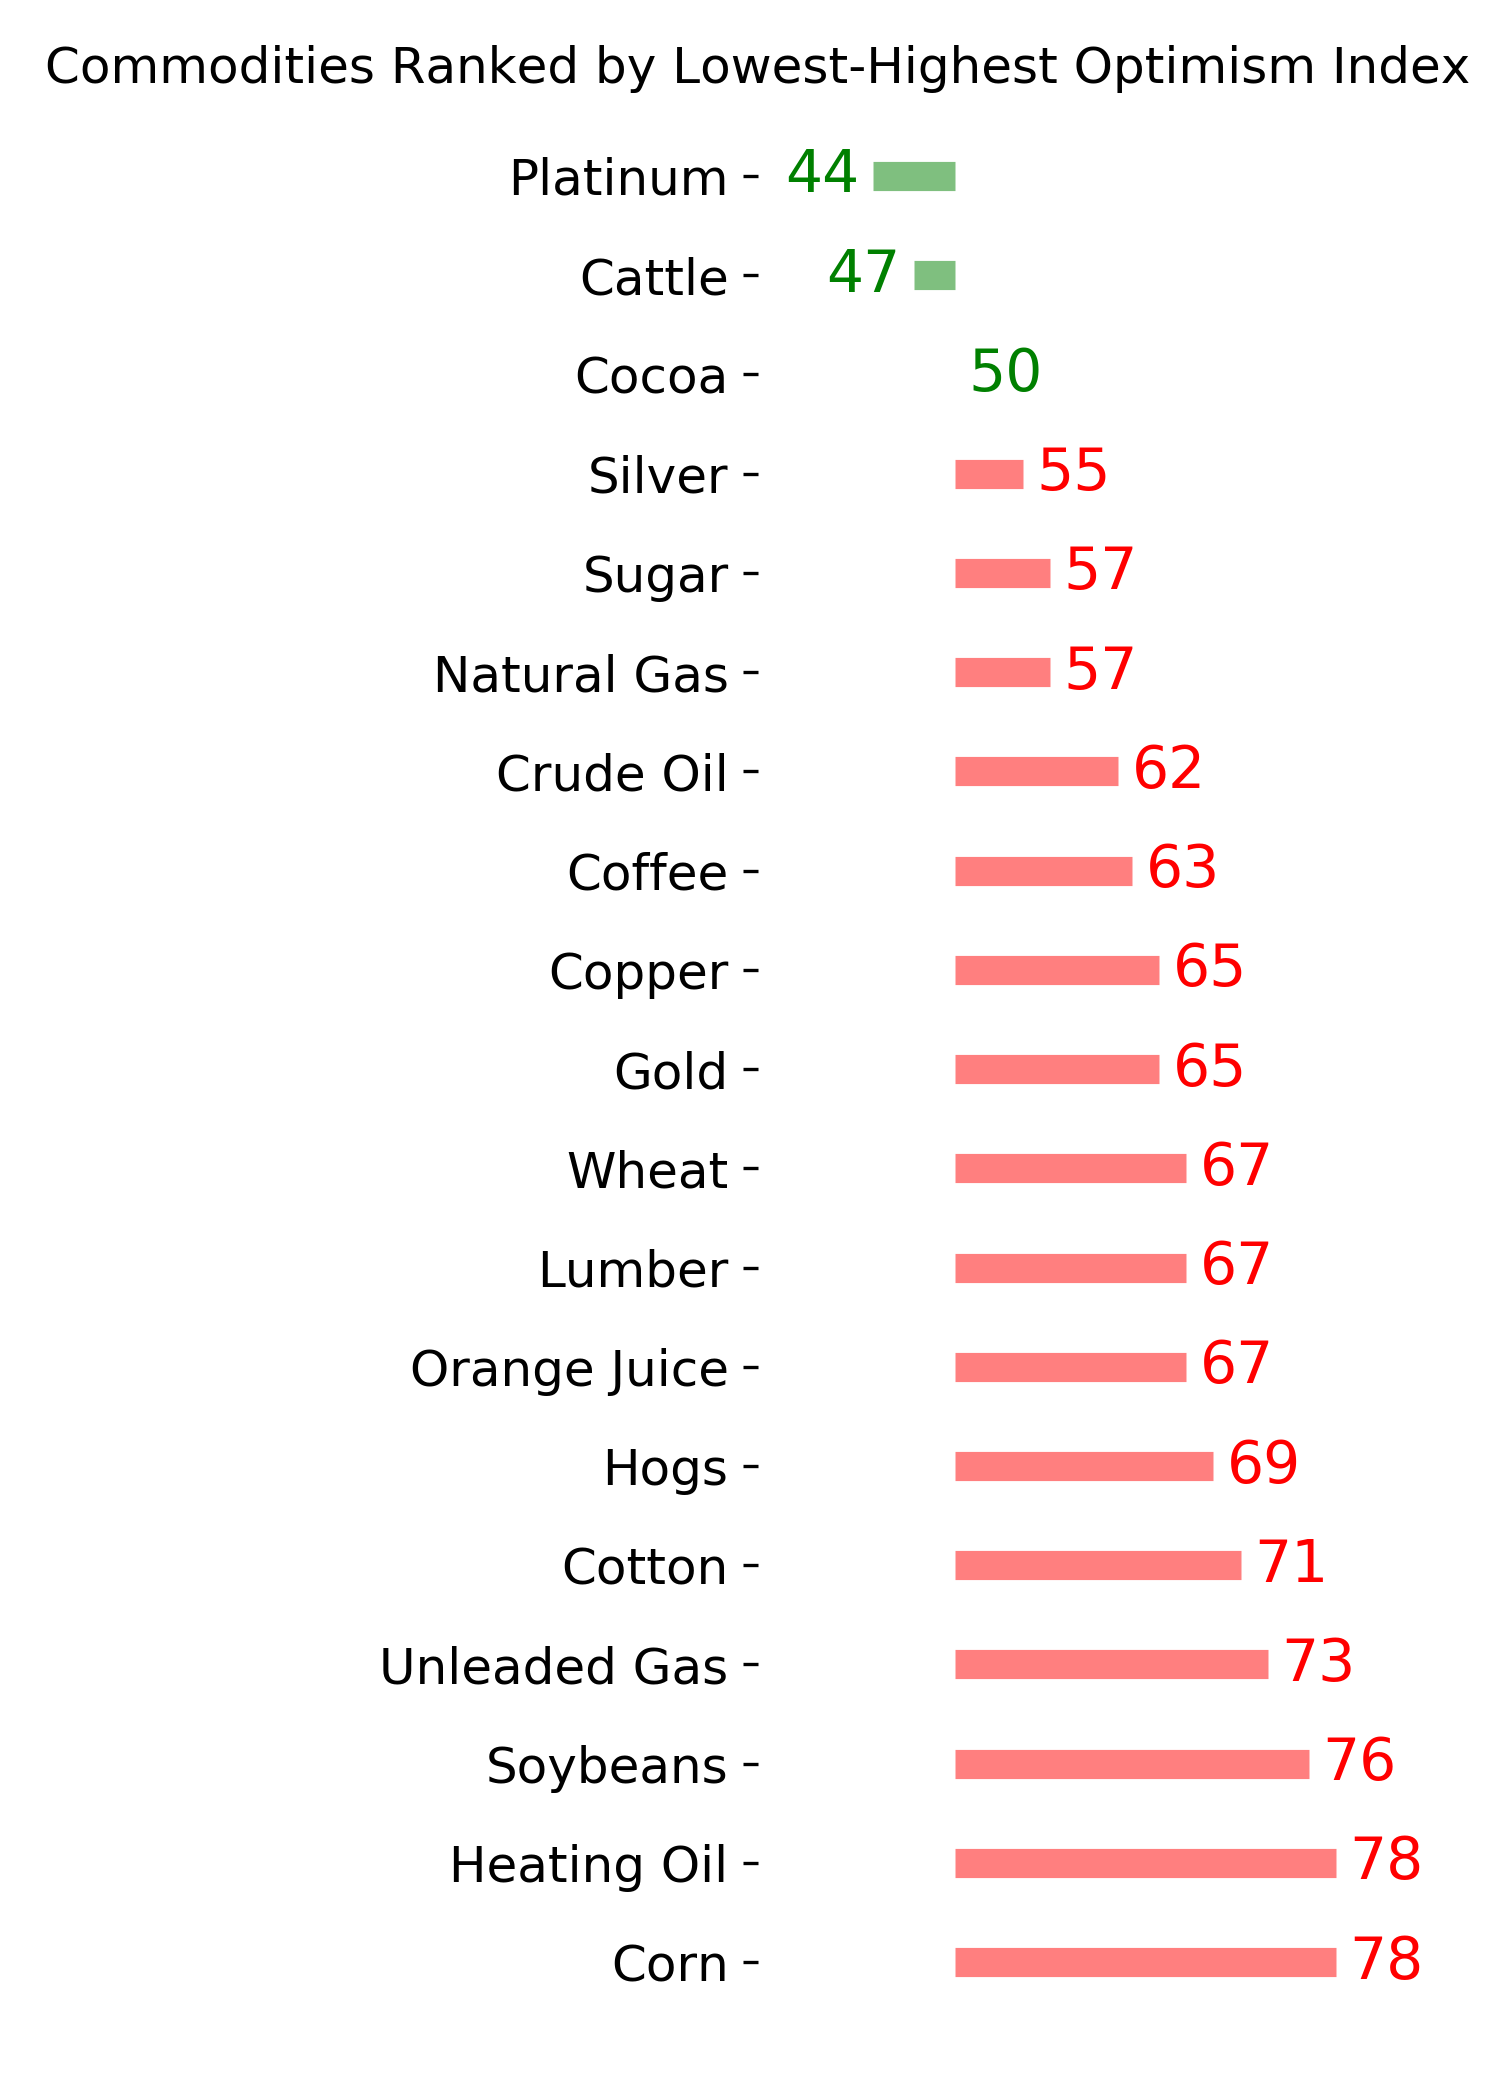
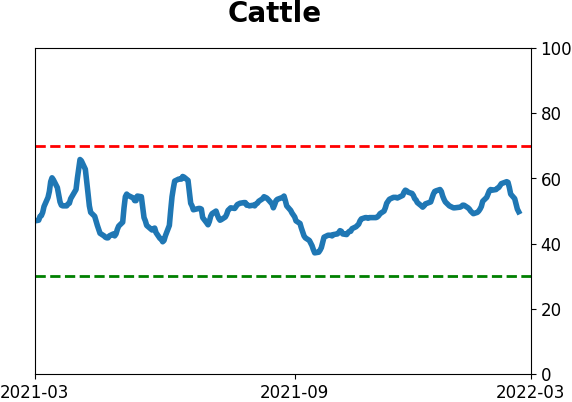
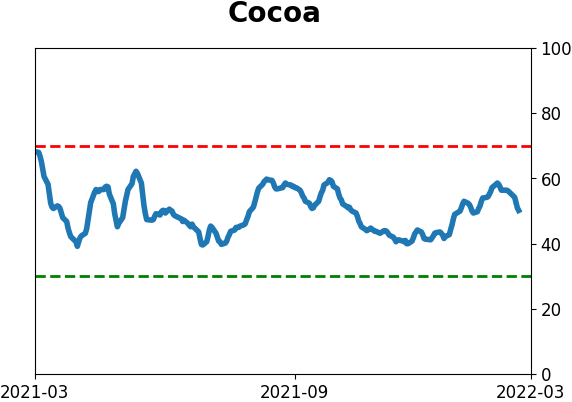
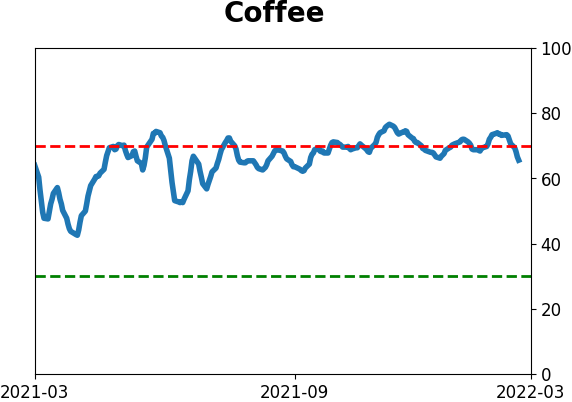
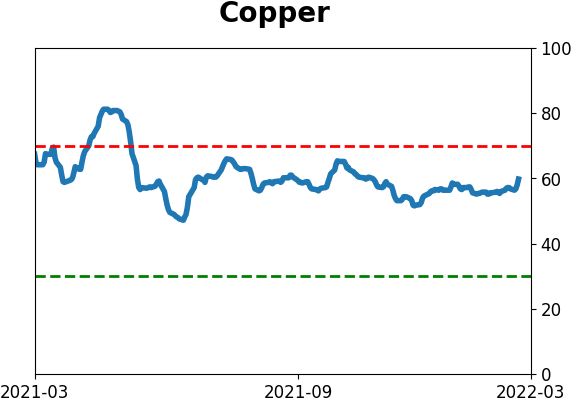
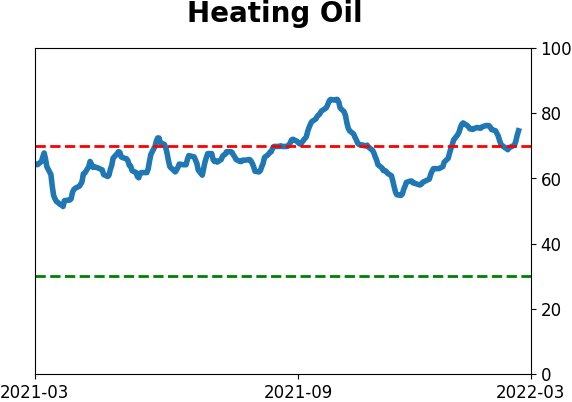
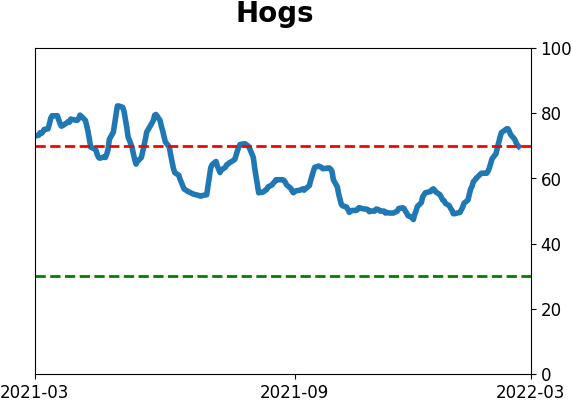
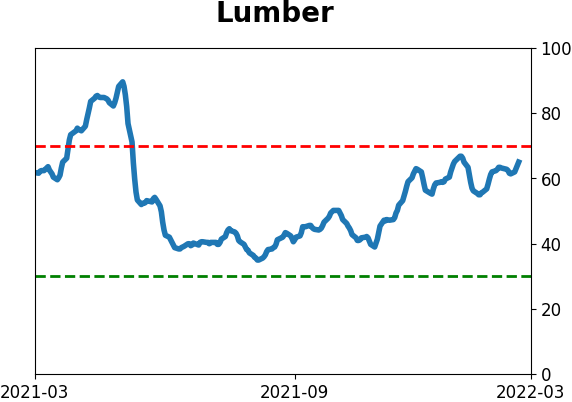
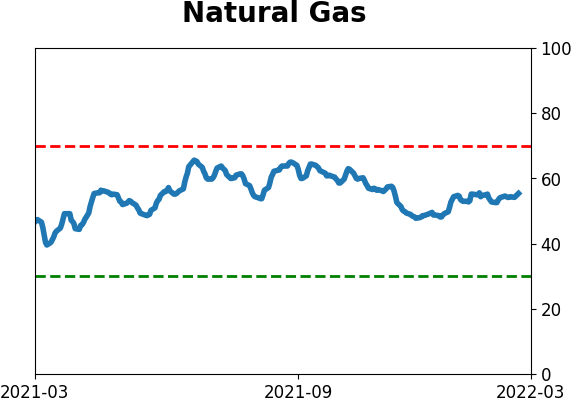
Commodity ETF's - 5-Day Moving Average
|
|