Headlines
|
|
Sentiment on stocks nears record vs bonds and gold:
Over the past two weeks, sentiment on stocks has far surpassed sentiment on "safe havens" like bonds and gold. When the spread has been this wide in the past, stocks tended to underperform both bonds and gold in the months ahead.
Bottom Line:
See the Outlook & Allocations page for more details on these summaries STOCKS: Weak sell
We're in an extremely speculative environment that is enough to suggest a defensive posture. Internal breadth and momentum have mostly remained positive, so a more strenuous sell wouldn't trigger unless that changed. BONDS: Weak buy
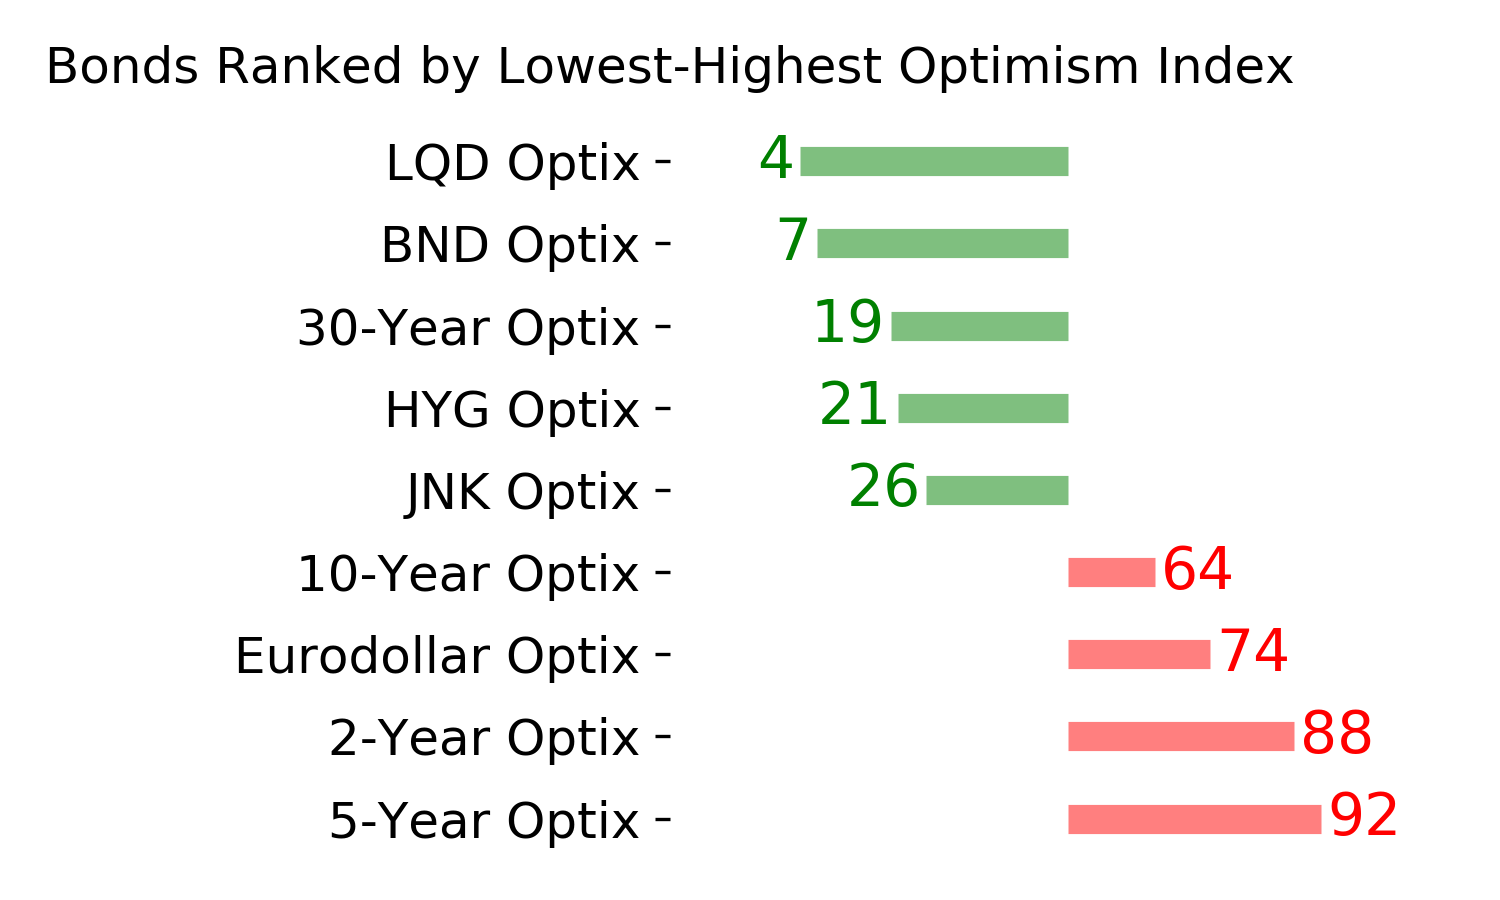
Various parts of the market have been hit in recent weeks, with mild oversold conditions. The Bond Optimism Index is now about as low as it gets during healthy bond market environments. GOLD: Weak buy
A dollar trying to rebound from a severe short position has weighed on gold and miners. The types of signals they've given in recent weeks, within the context of their recent surge, have usually resulted in higher prices over a medium- to long-term time frame.
|
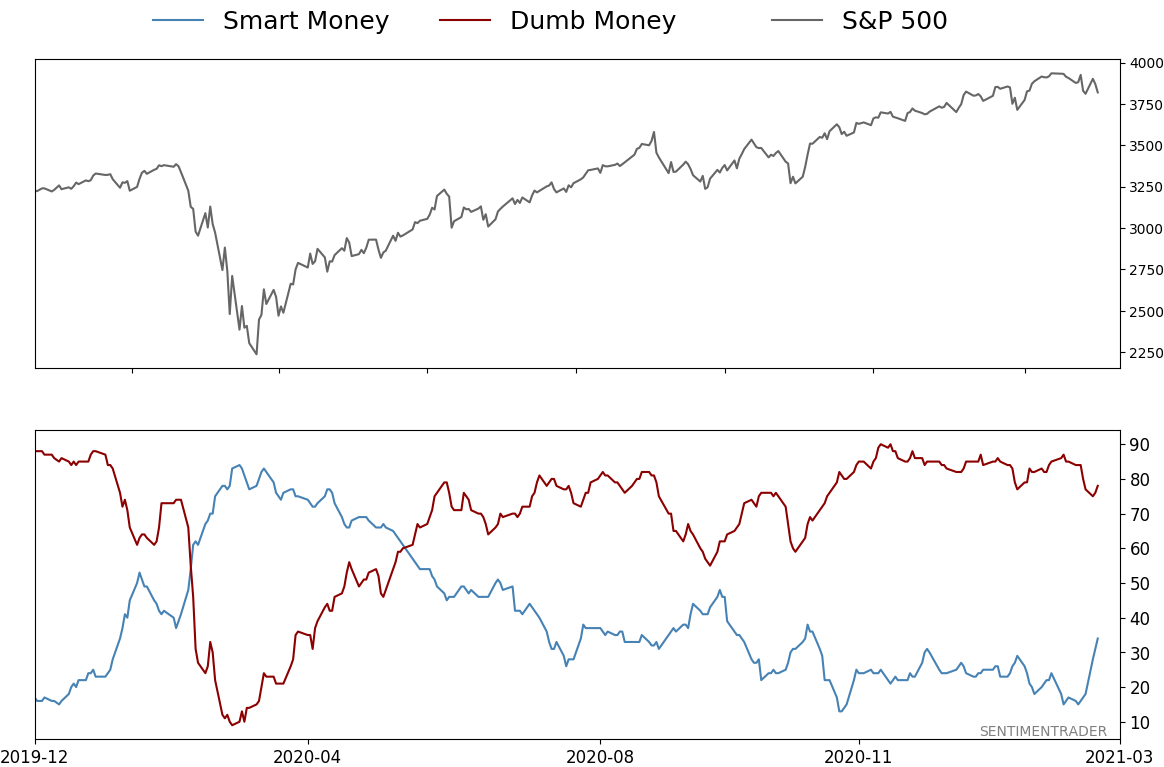
Smart / Dumb Money Confidence
|
Smart Money Confidence: 34%
Dumb Money Confidence: 78%
|
|
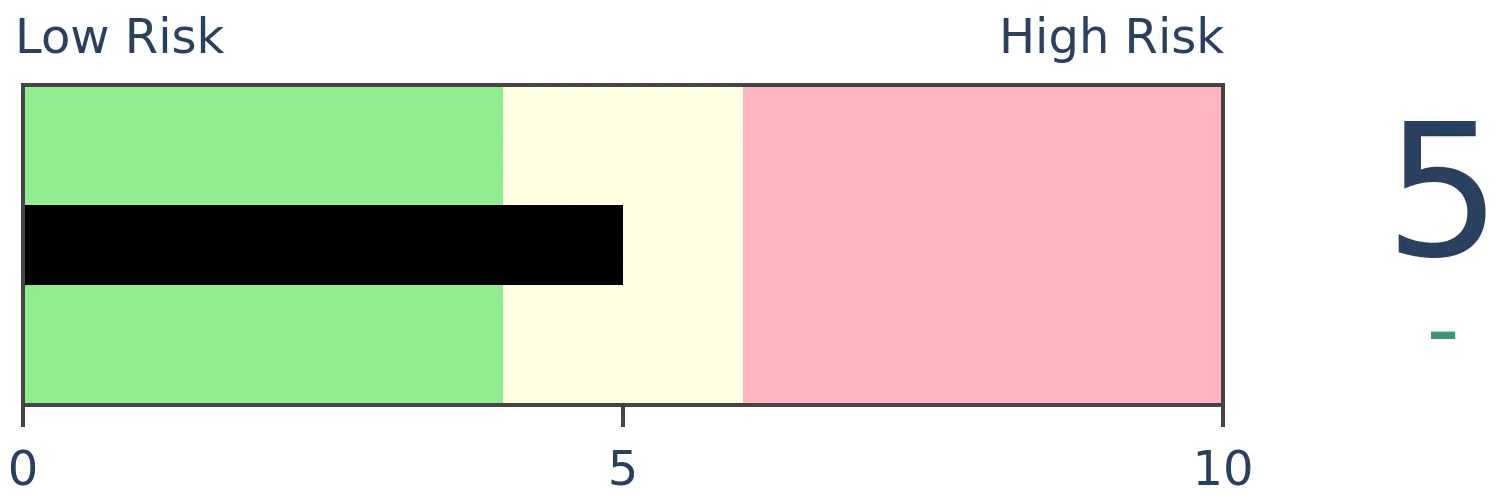
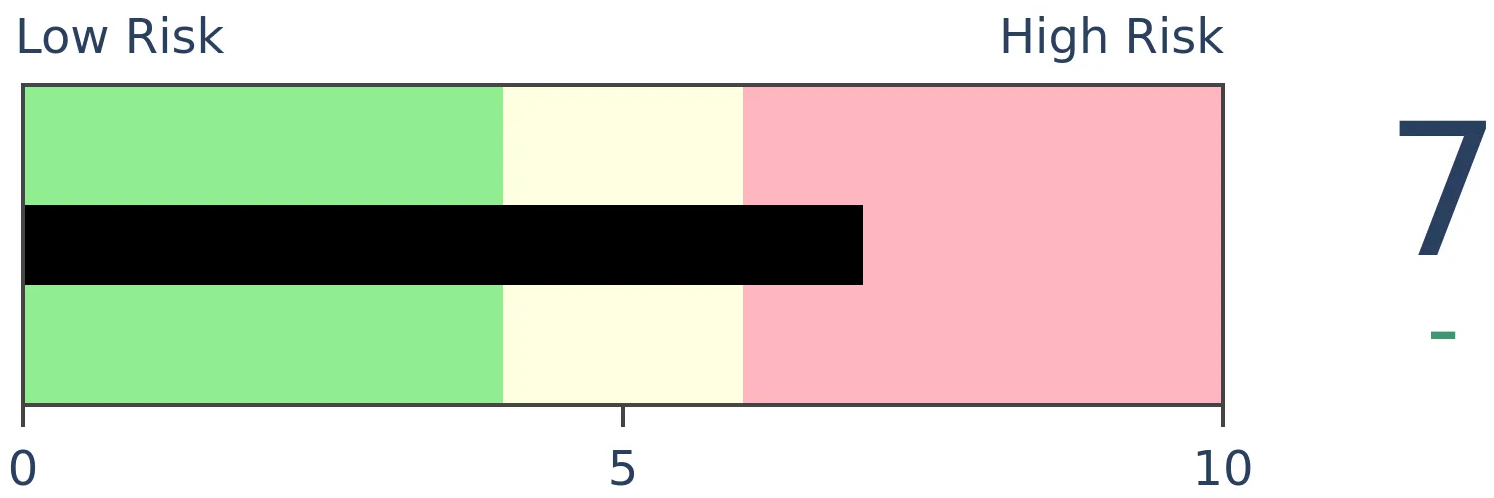
Risk Levels
Stocks Short-Term
|
Stocks Medium-Term

|
|
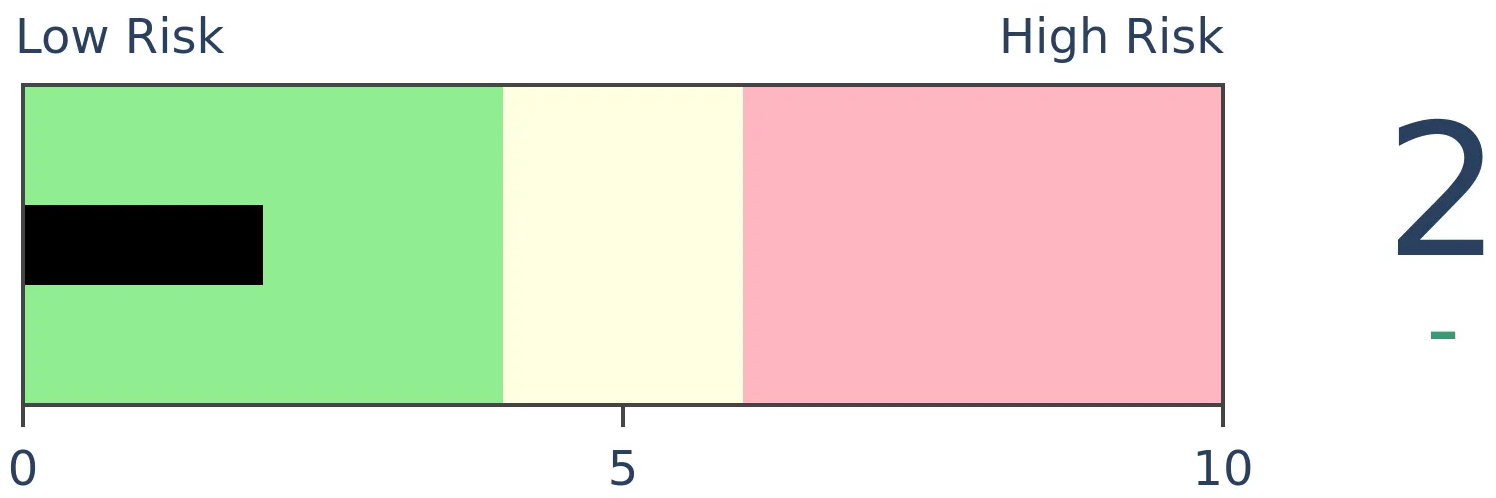
Bonds

|
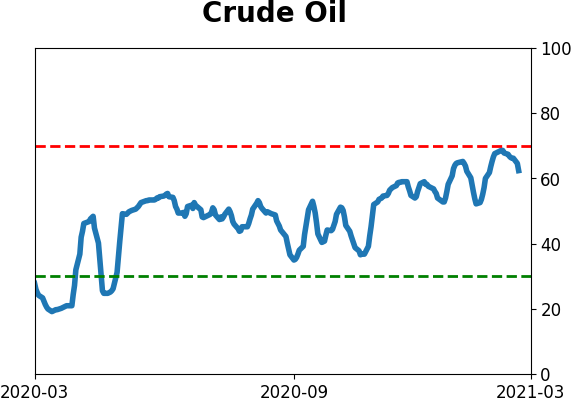
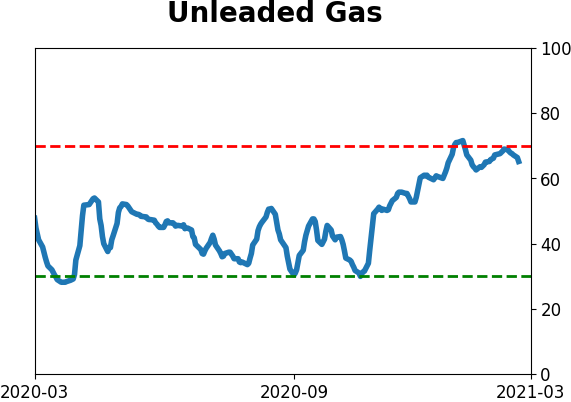
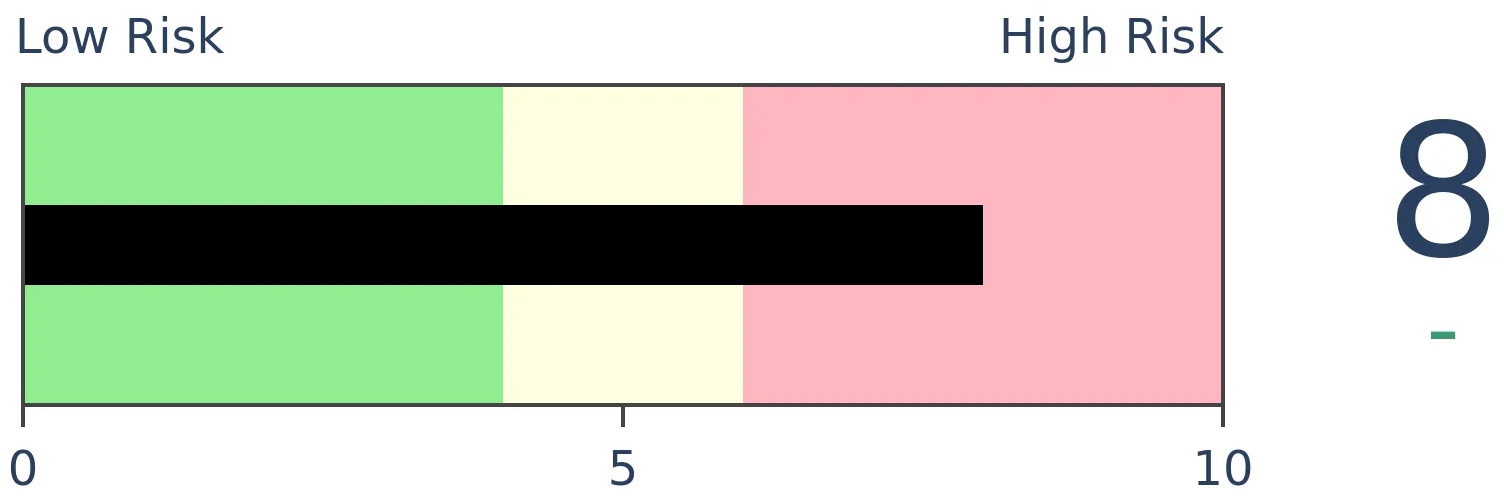
Crude Oil
|
|
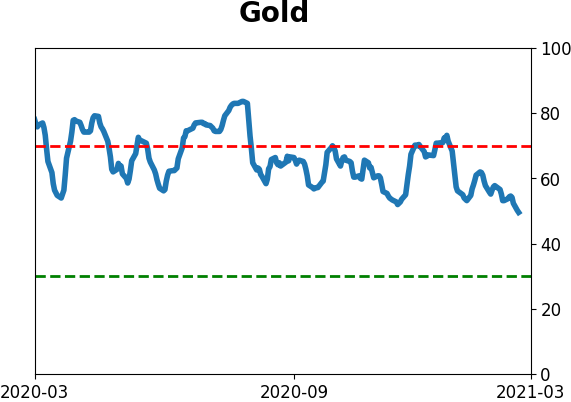
Gold
|
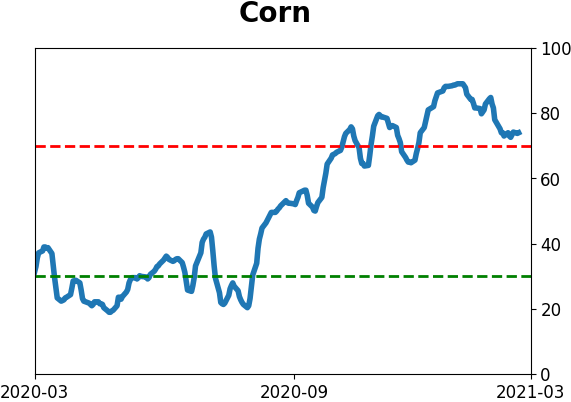
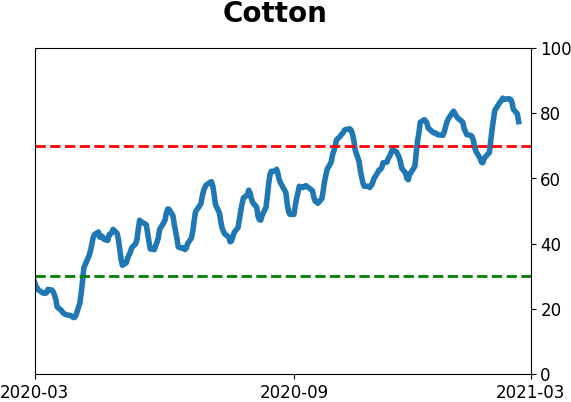
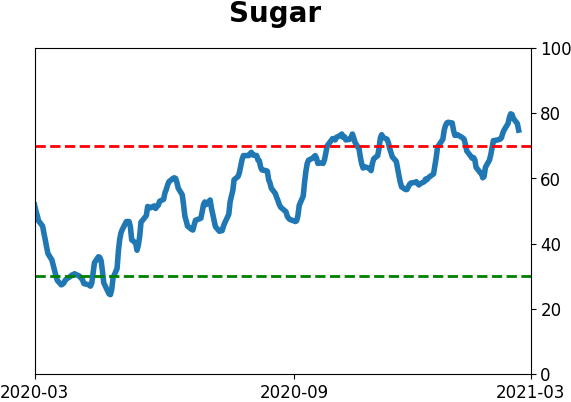
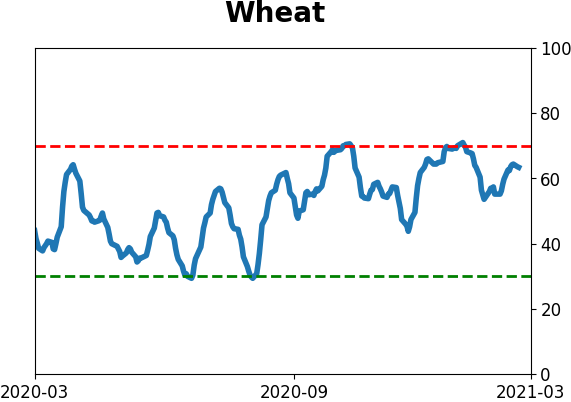
Agriculture
|
|
Research
BOTTOM LINE
Over the past two weeks, sentiment on stocks has far surpassed sentiment on "safe havens" like bonds and gold. When the spread has been this wide in the past, stocks tended to underperform both bonds and gold in the months ahead.
FORECAST / TIMEFRAME
None
|
If you ever look at the Market Overview on the Dashboard, then one thing may stick out in recent days - sentiment on stocks has stayed stubbornly high while it has soured markedly on bonds and gold.
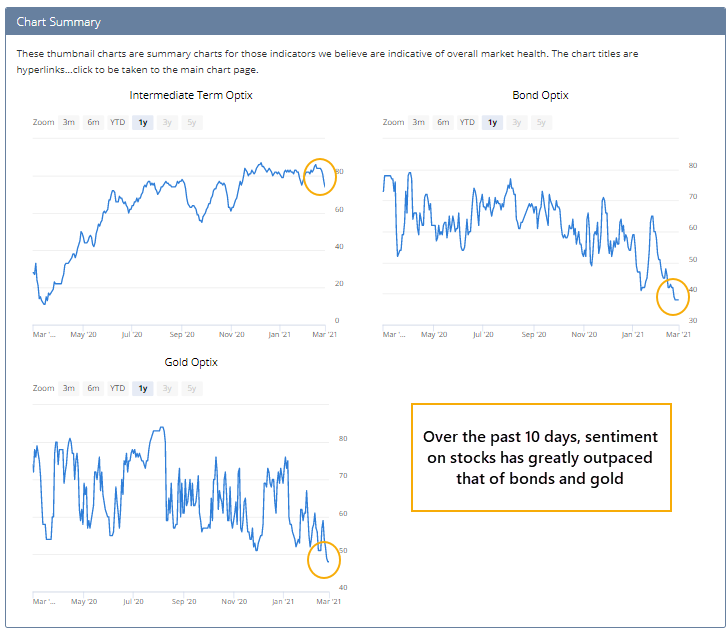
At various times over the years, we've looked at similar bouts of relative sentiment extremes between stocks and supposed safe havens like bonds and gold. This one sticks out as being among the most severe.
Over the past 10 days, the Medium-Term Optimism Index (Optix) for stocks has been more than 35 points above the average Optix for bonds and gold. This is the widest spread in 4 years.
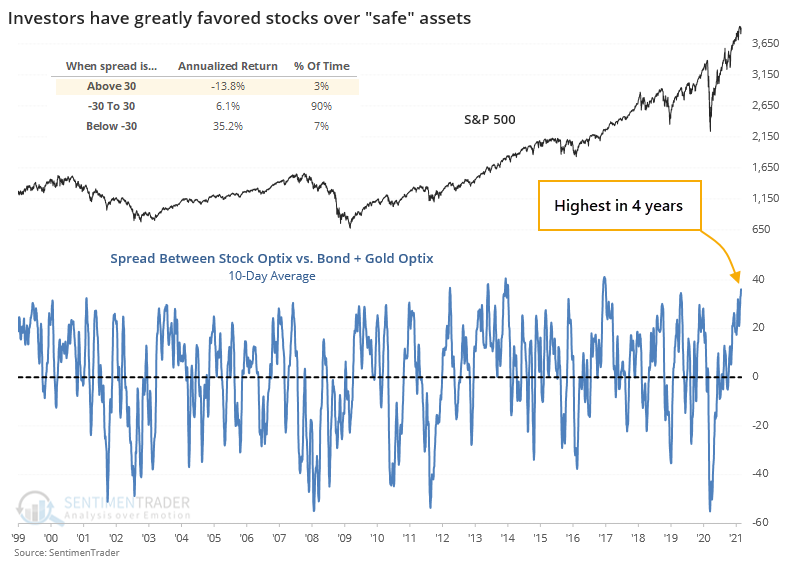
We can see from the chart that when the spread has been above +30 points, the S&P's annualized return was -13.8%, versus +35.2% when the spread was below -30.
If we take a signal-based approach and buy the S&P when the spread first crosses above +30 for the first time in a couple of weeks, then we get the following forward returns.
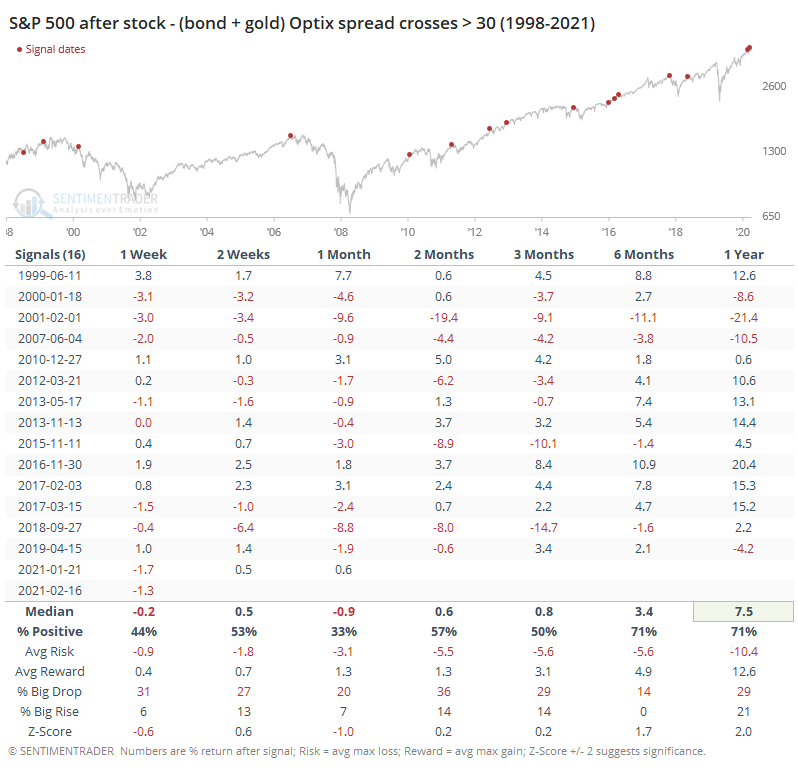
The S&P tended to struggle over the next month or so. Even up to 3 months later, its returns were middling, with more risk than reward. It wasn't until 6-12 months later that it showed decent returns.
In terms of relative performance, the table below shows performance in the ratio of the S&P 500 to 10-year Treasury note futures.
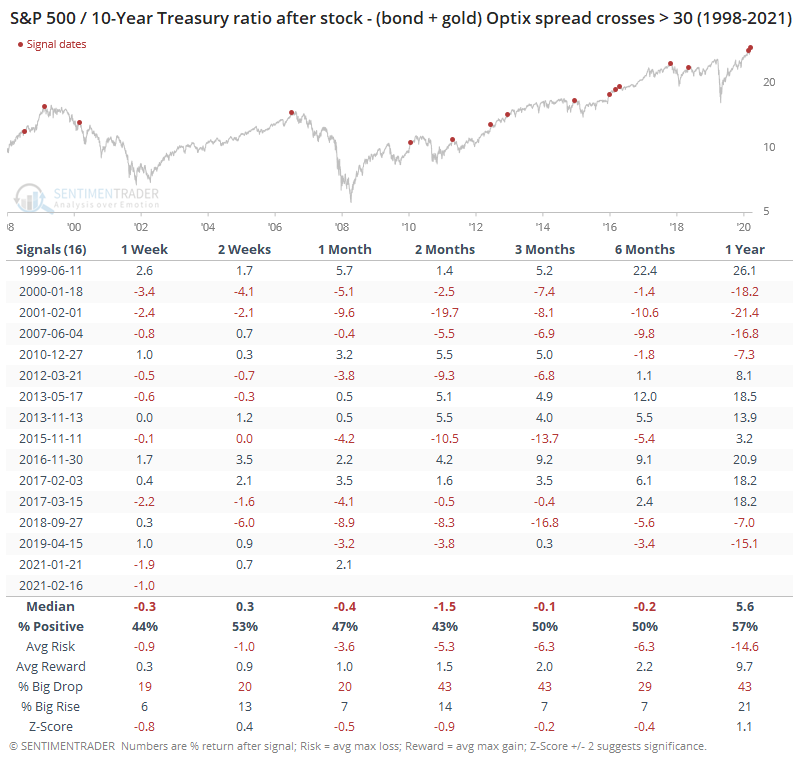
Here, we can see fairly consistent weakness in stocks vs. bonds, with a very poor risk/reward ratio even up to 6 months later. There was a much higher chance to see a big drop in the ratio than a big rise.
The S&P's performance against gold showed similar characteristics.
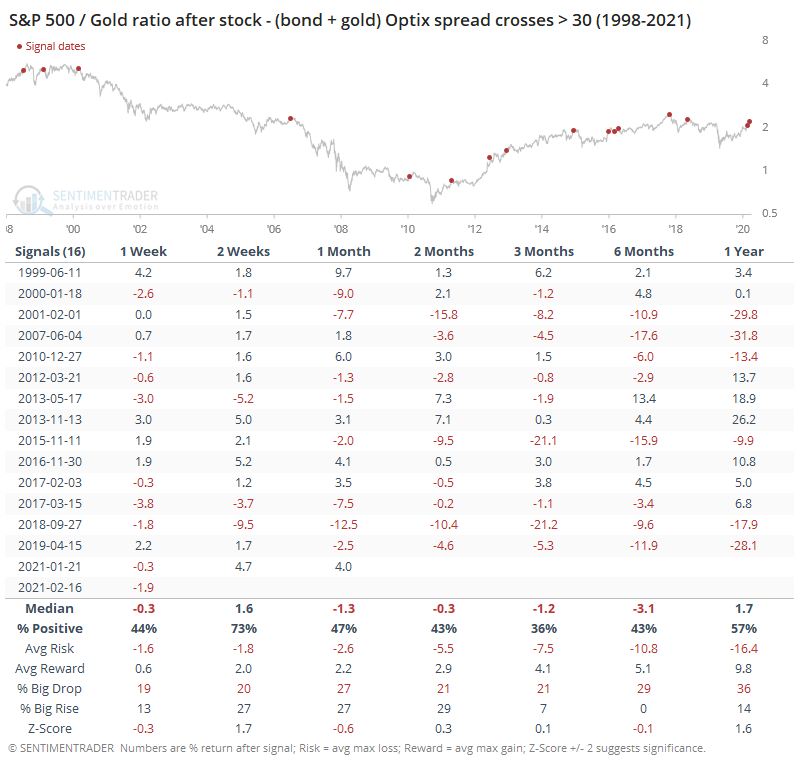
This was even more consistent than the ratio of stocks to bonds. Against gold, the S&P declined more consistently over the medium-term.
All markets are a tradeoff against another as investors decide where their money will be treated more fairly. When sentiment has swung toward one asset in a way that's out of whack with history, investors tend to swing in the other direction. That should be a headwind for stocks and tailwind for bonds and gold from here.
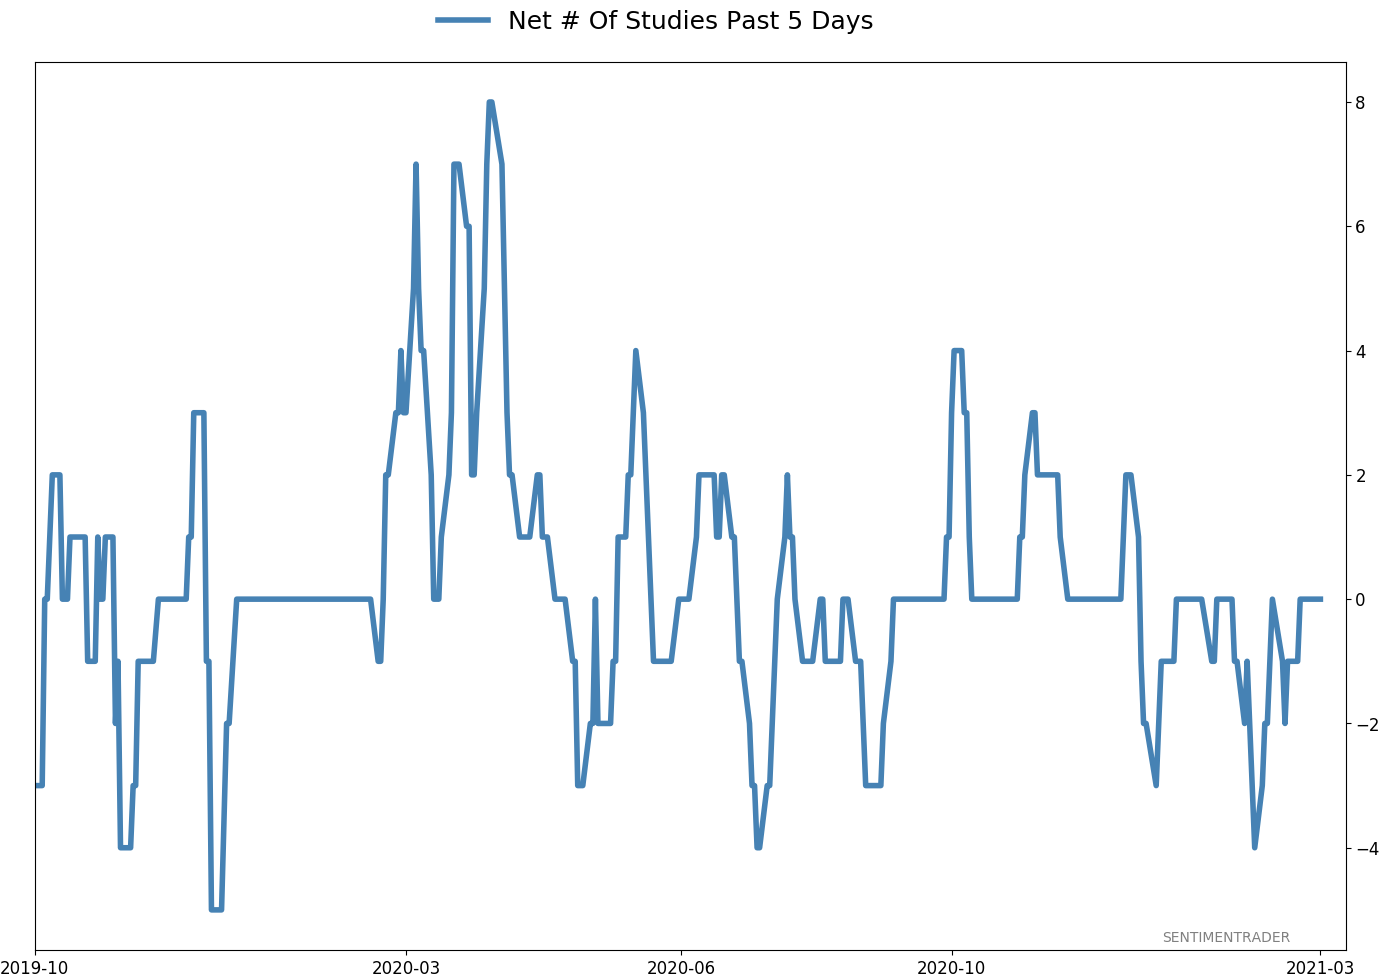
Active Studies
| Time Frame | Bullish | Bearish | | Short-Term | 0 | 0 | | Medium-Term | 2 | 8 | | Long-Term | 16 | 3 |
|
Indicators at Extremes
Portfolio
| Position | Description | Weight % | Added / Reduced | Date | | Stocks | RSP | 4.9 | Reduced 4% | 2021-02-09 | | Bonds | 30.0% BND, 8.8% SCHP | 38.8 | Added 15.1% | 2021-02-18 | | Commodities | GCC | 2.3 | Reduced 2.1%
| 2020-09-04 | | Precious Metals | GDX | 9.0 | Added 0.1% | 2021-02-18 | | Special Situations | 7.3% XLE, 4.8% PSCE | 12.1 | Reduced 5.6% | 2021-02-18 | | Cash | | 32.8 | | |
|
Updates (Changes made today are underlined)
With a market that has seen the kinds of broad participation and big breath thrusts like we did in the fall, it's hard to become too negative. Those kinds of conditions have consistently preceded higher returns over the next 6-12 months. It's the interim that's more of an issue. Even conditions like that haven't prevented some shorter-term pullbacks. And when we combine an environment where speculation is rampant and recent days have seen an increase in cracks under the surface of the indexes, it's enough to become more defensive over a short- to medium-term time frame. We still don't have much confirmation from the price action in the indexes, so those who are more conservative would likely wait before increasing cash levels. I've decreased risk exposure a bit more, mainly in terms of energy stocks and the ANGL fund, while adding more to the broader bond market. RETURN YTD: 5.6% 2020: 8.1%, 2019: 12.6%, 2018: 0.6%, 2017: 3.8%, 2016: 17.1%, 2015: 9.2%, 2014: 14.5%, 2013: 2.2%, 2012: 10.8%, 2011: 16.5%, 2010: 15.3%, 2009: 23.9%, 2008: 16.2%, 2007: 7.8%
|
|
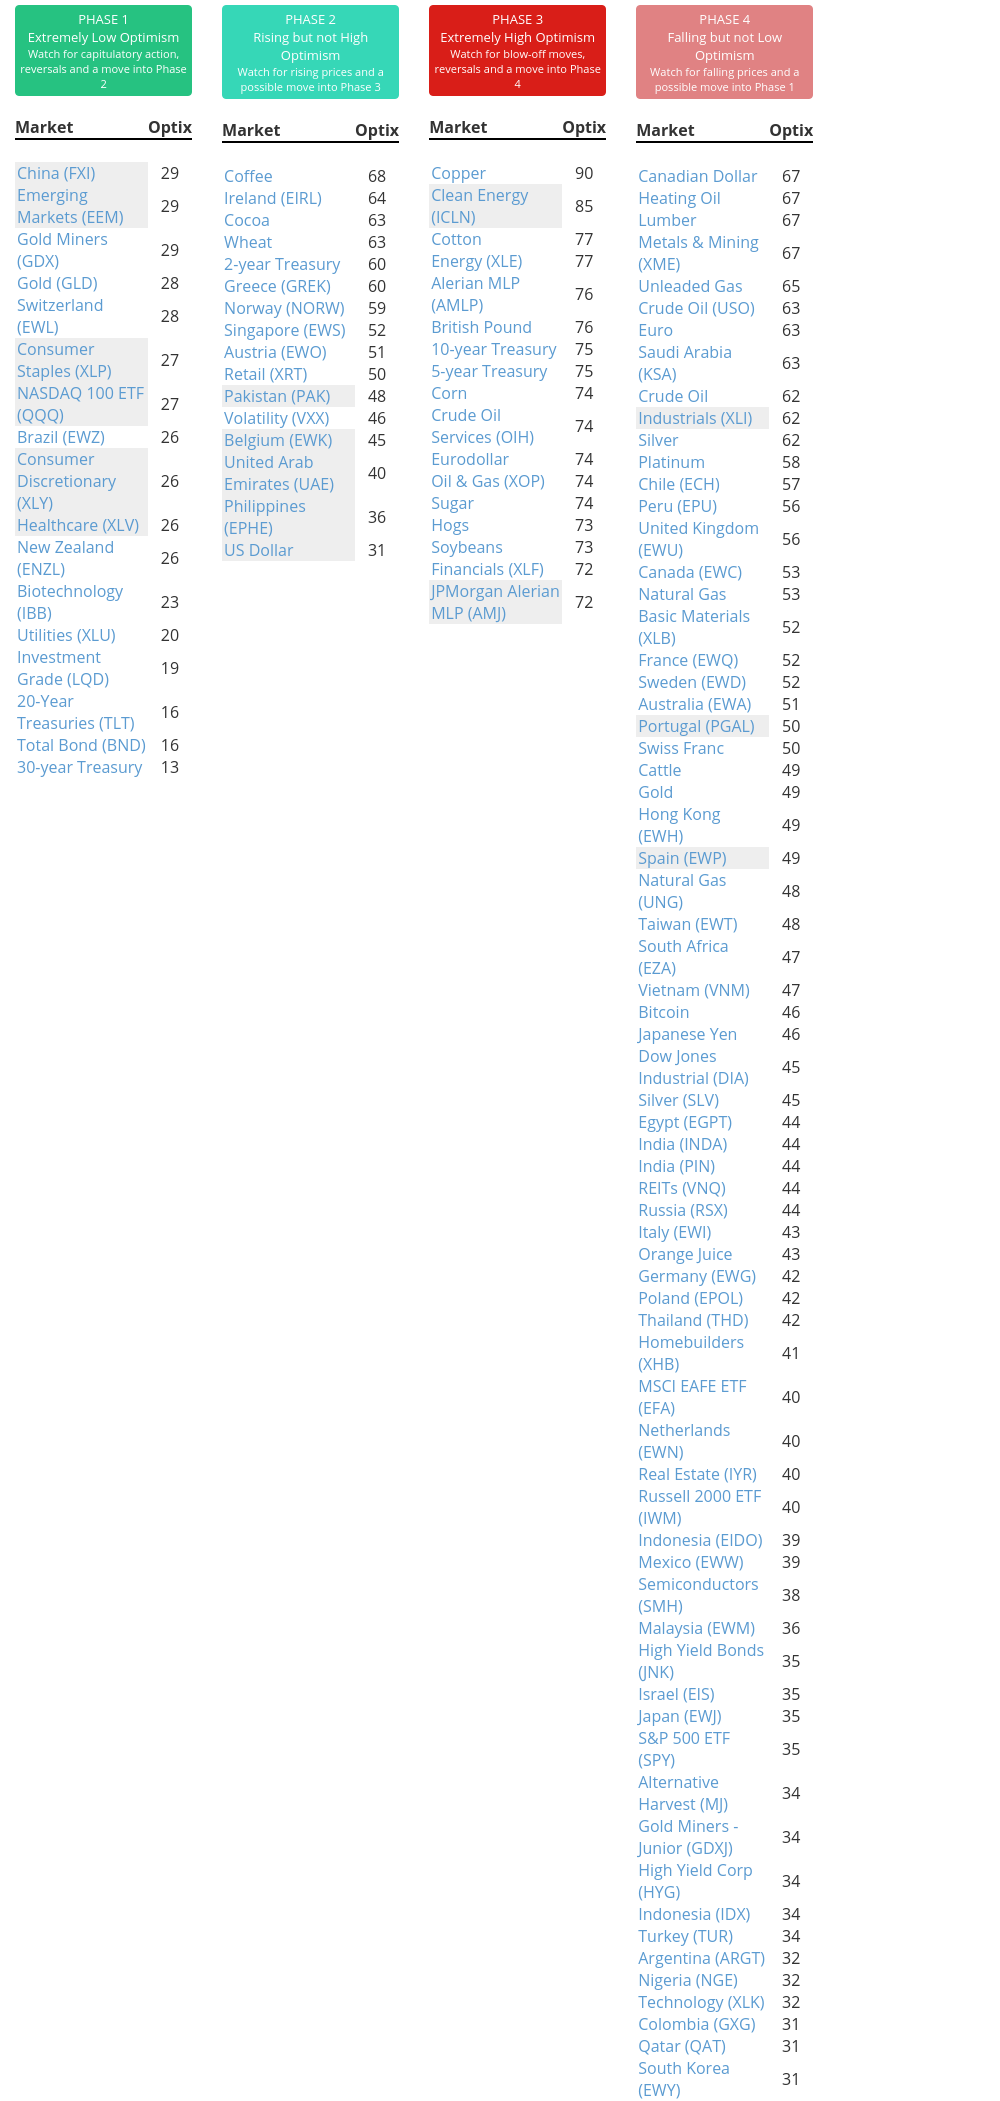
Phase Table
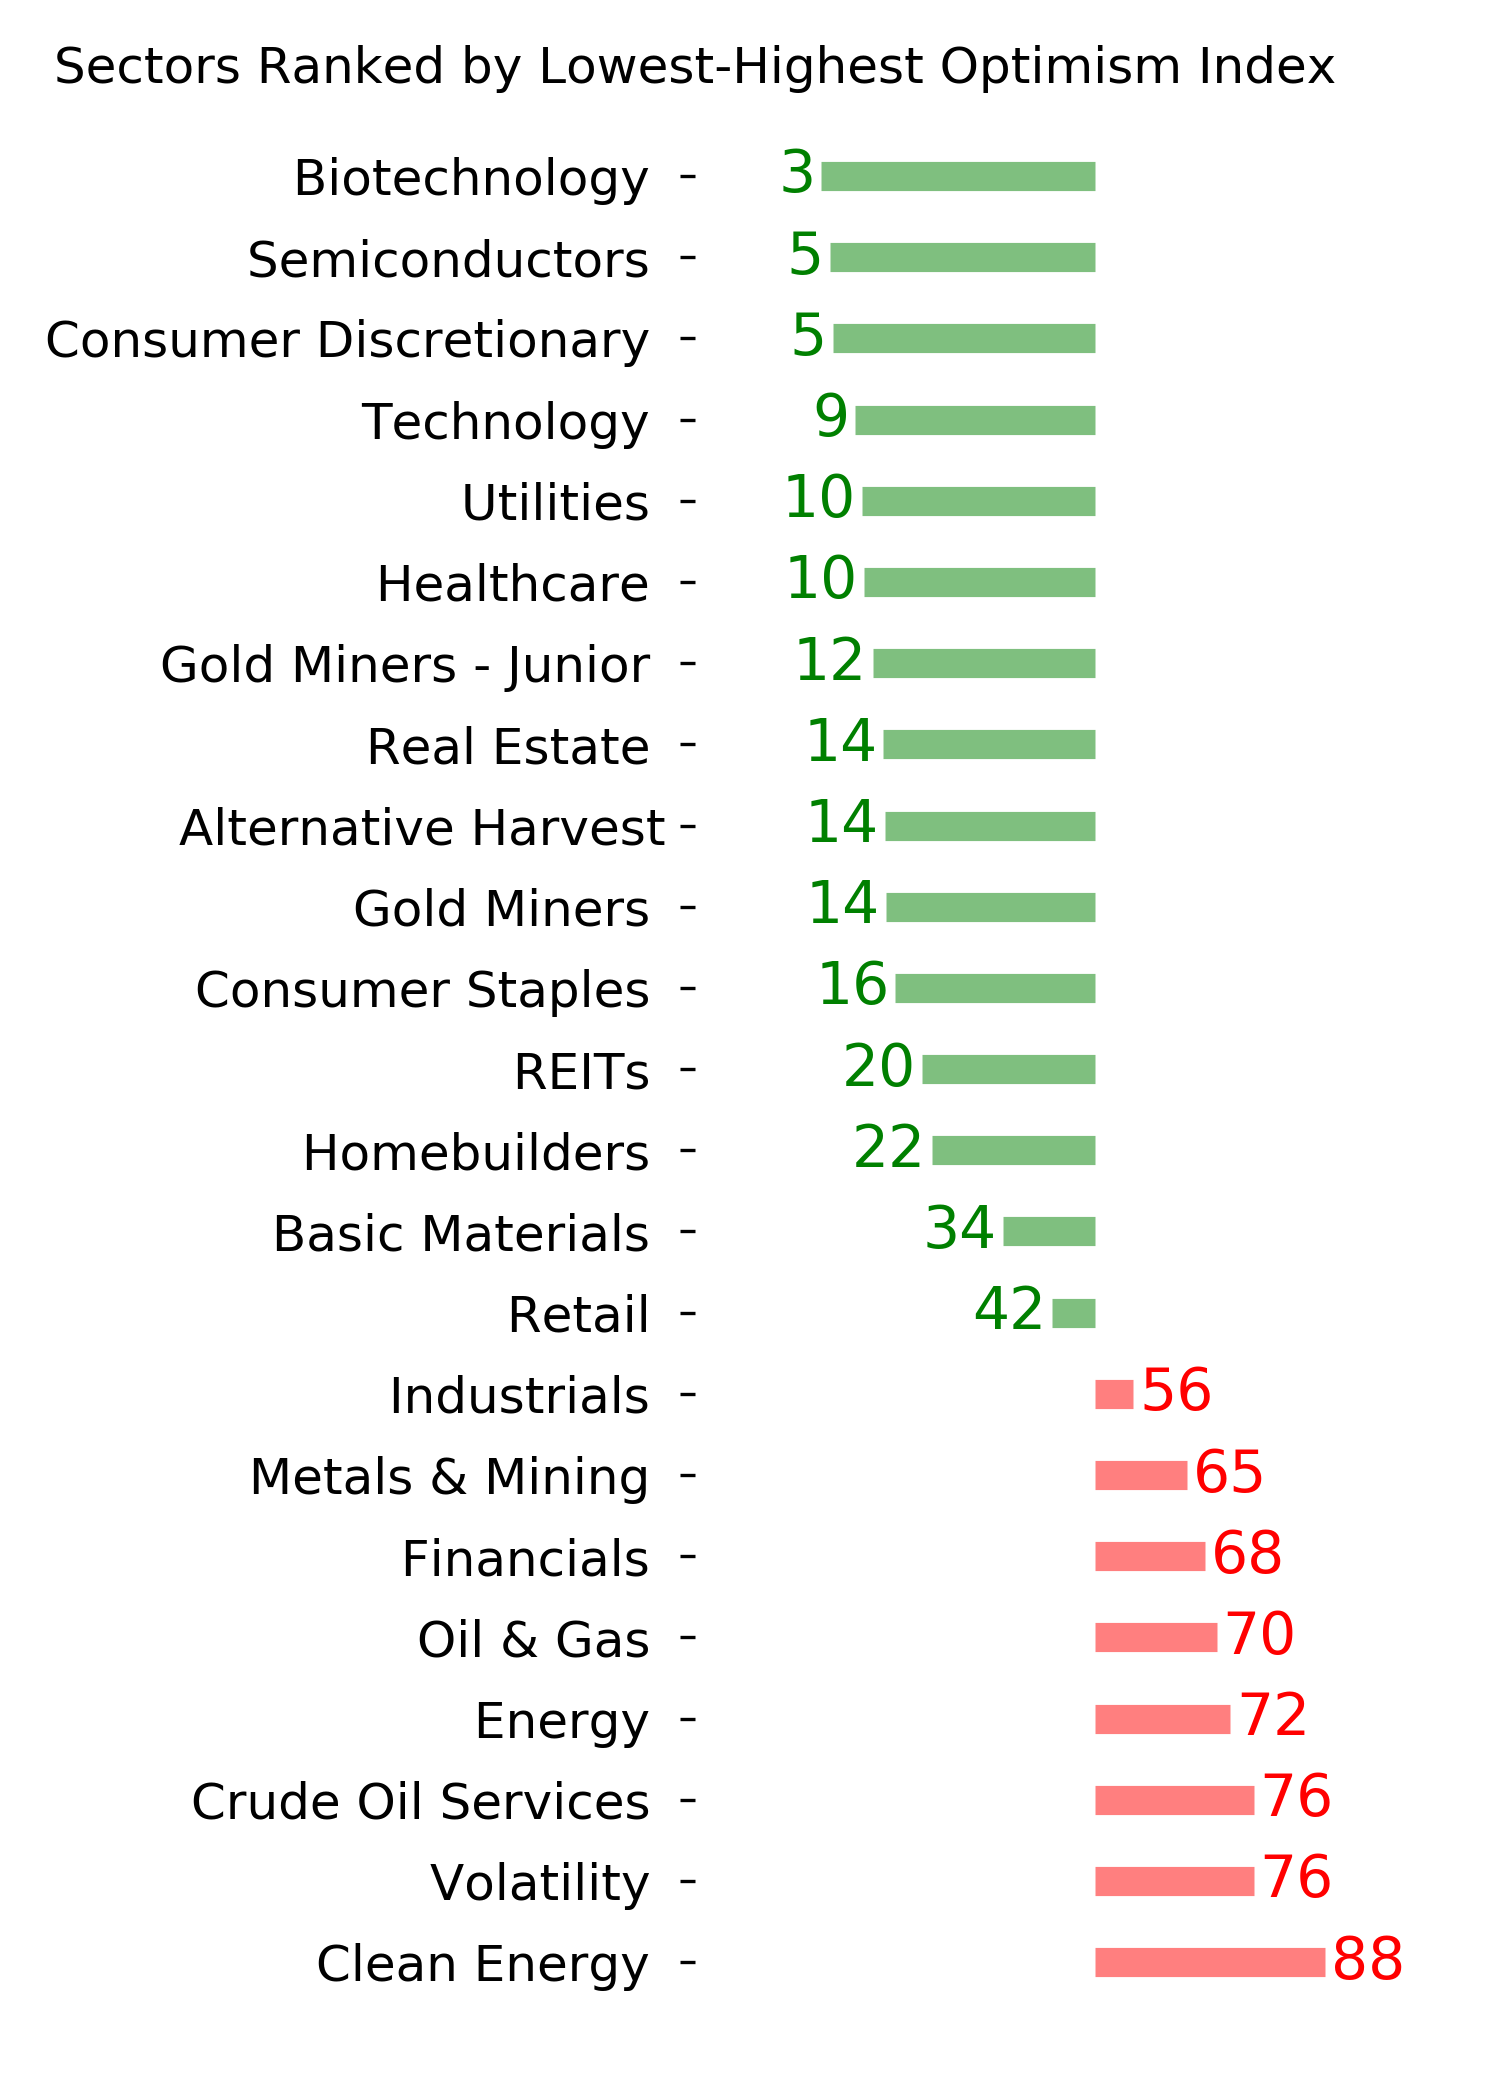
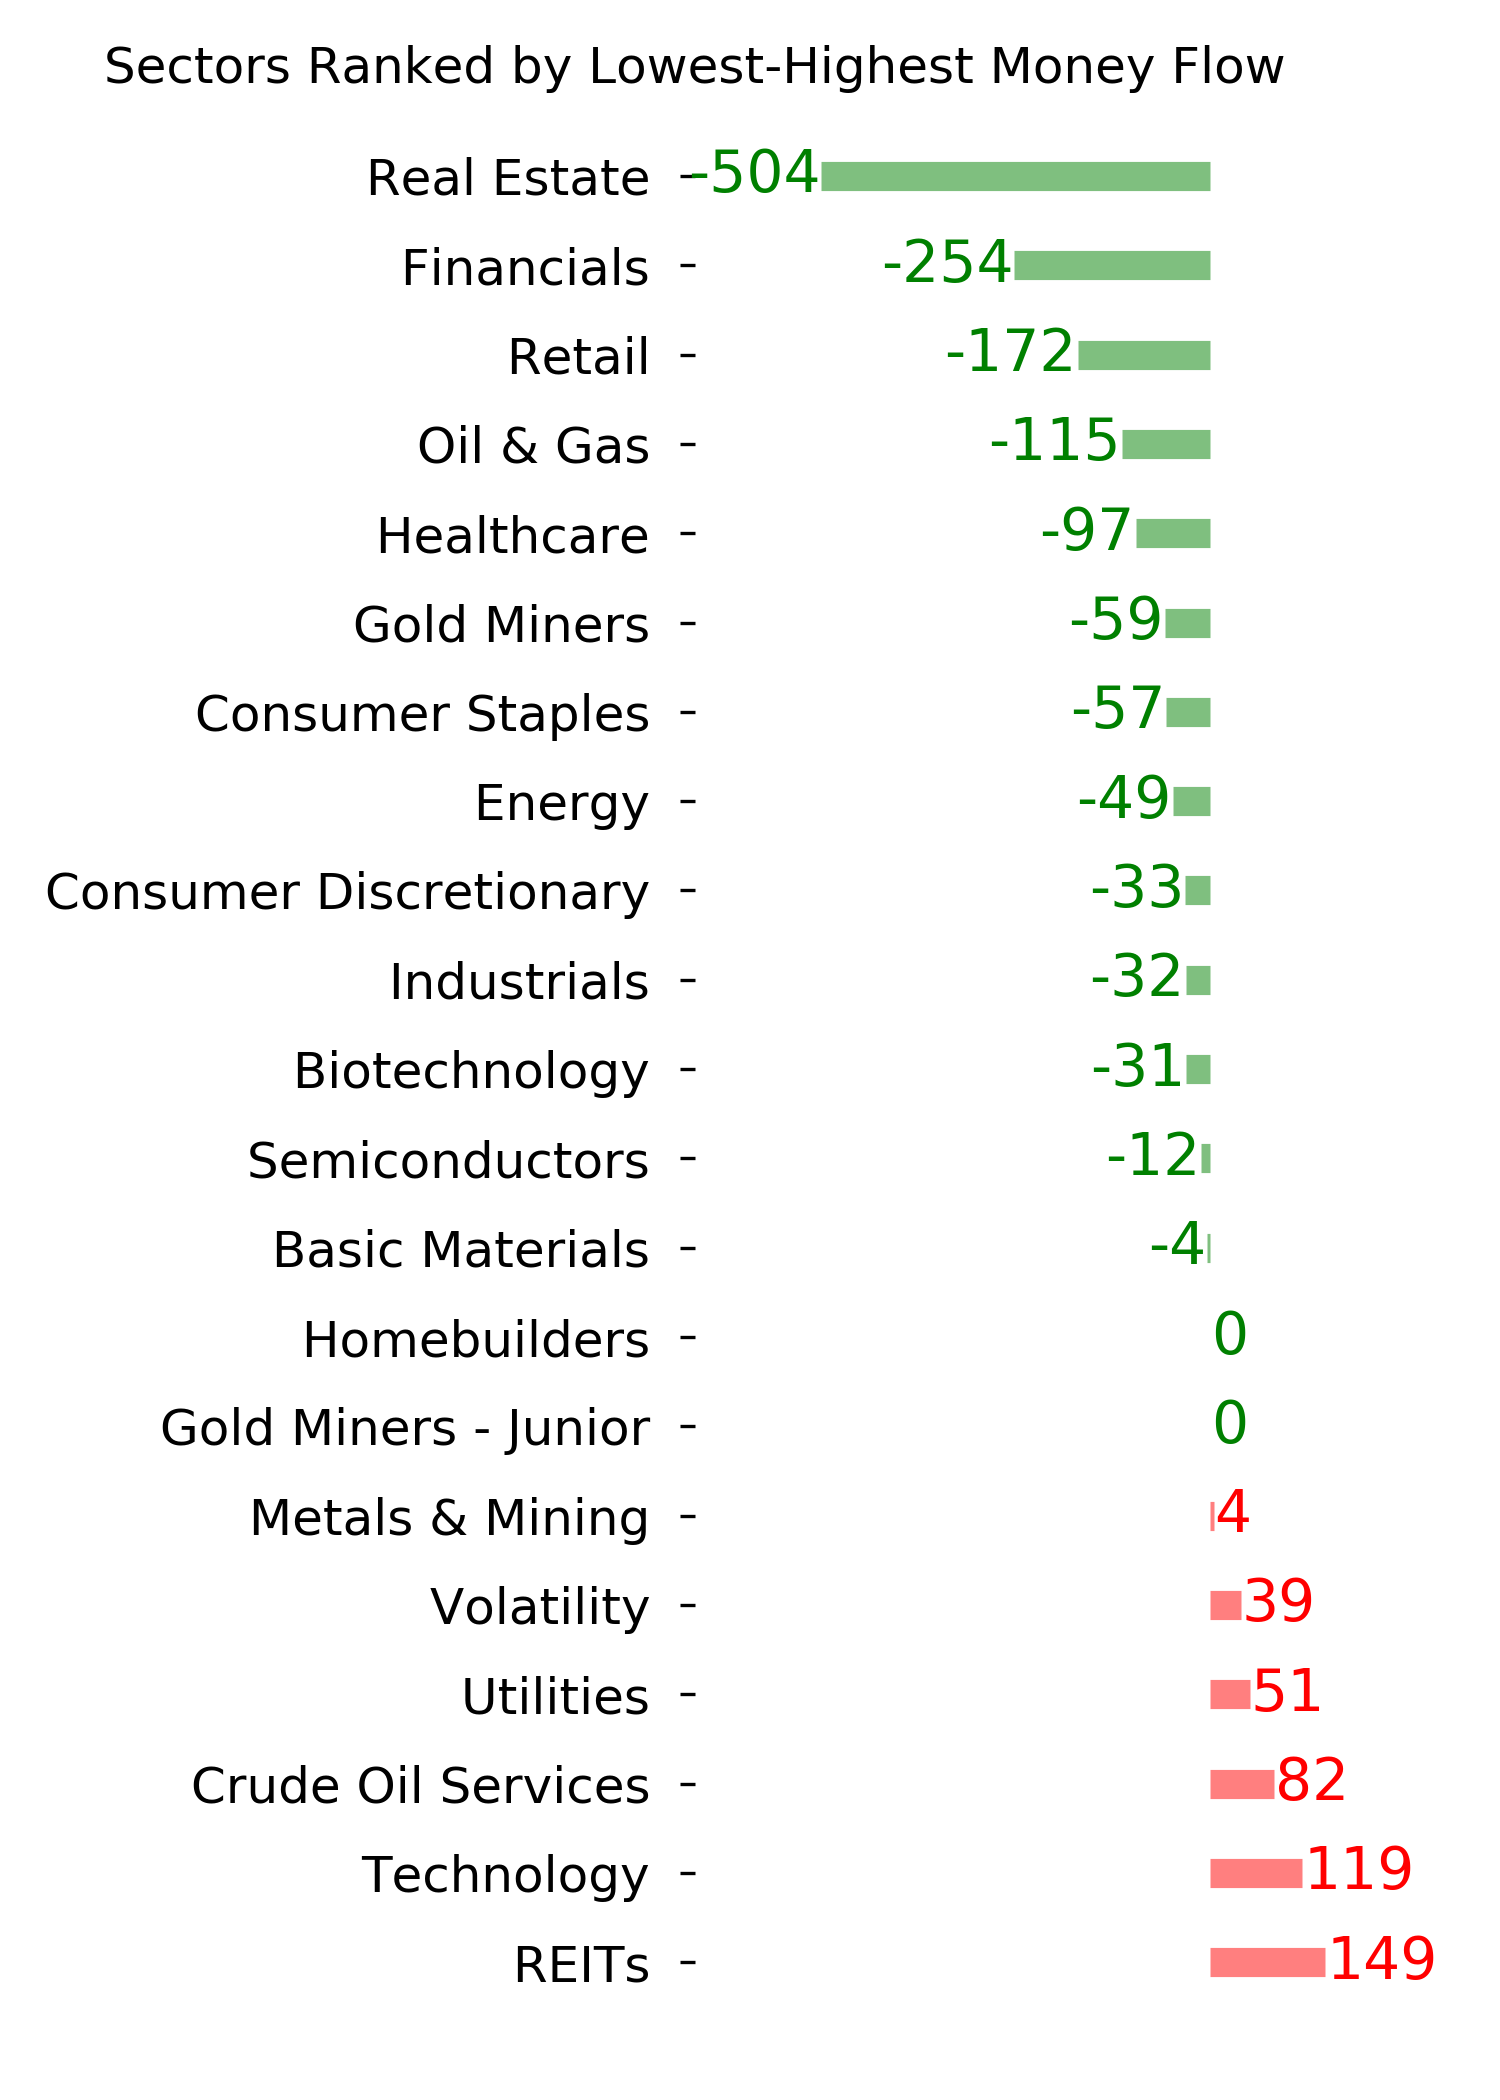
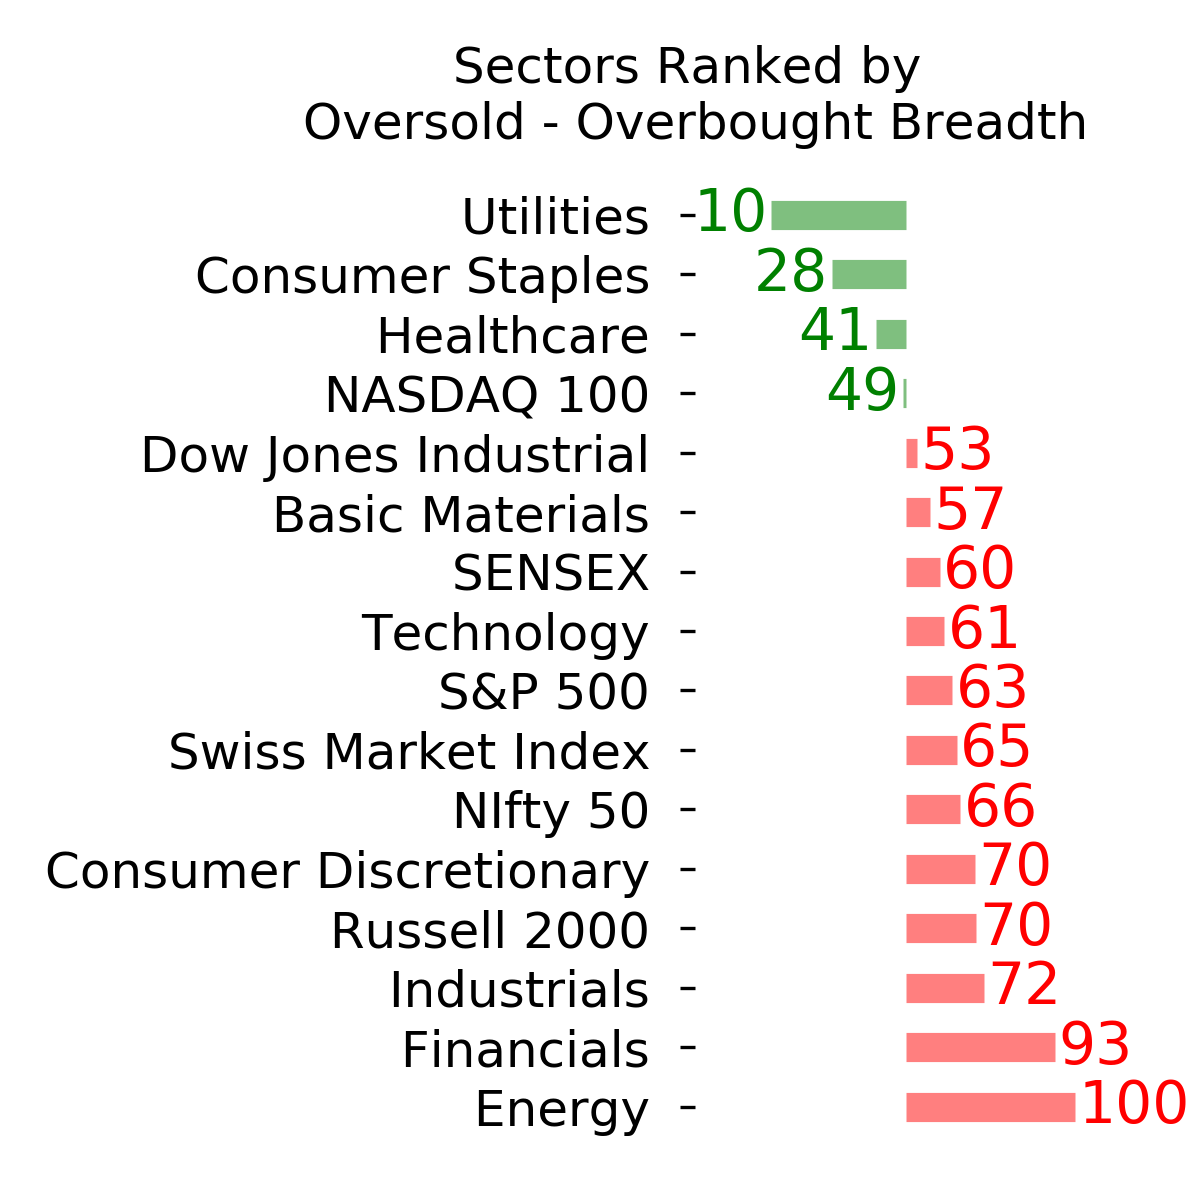
Ranks
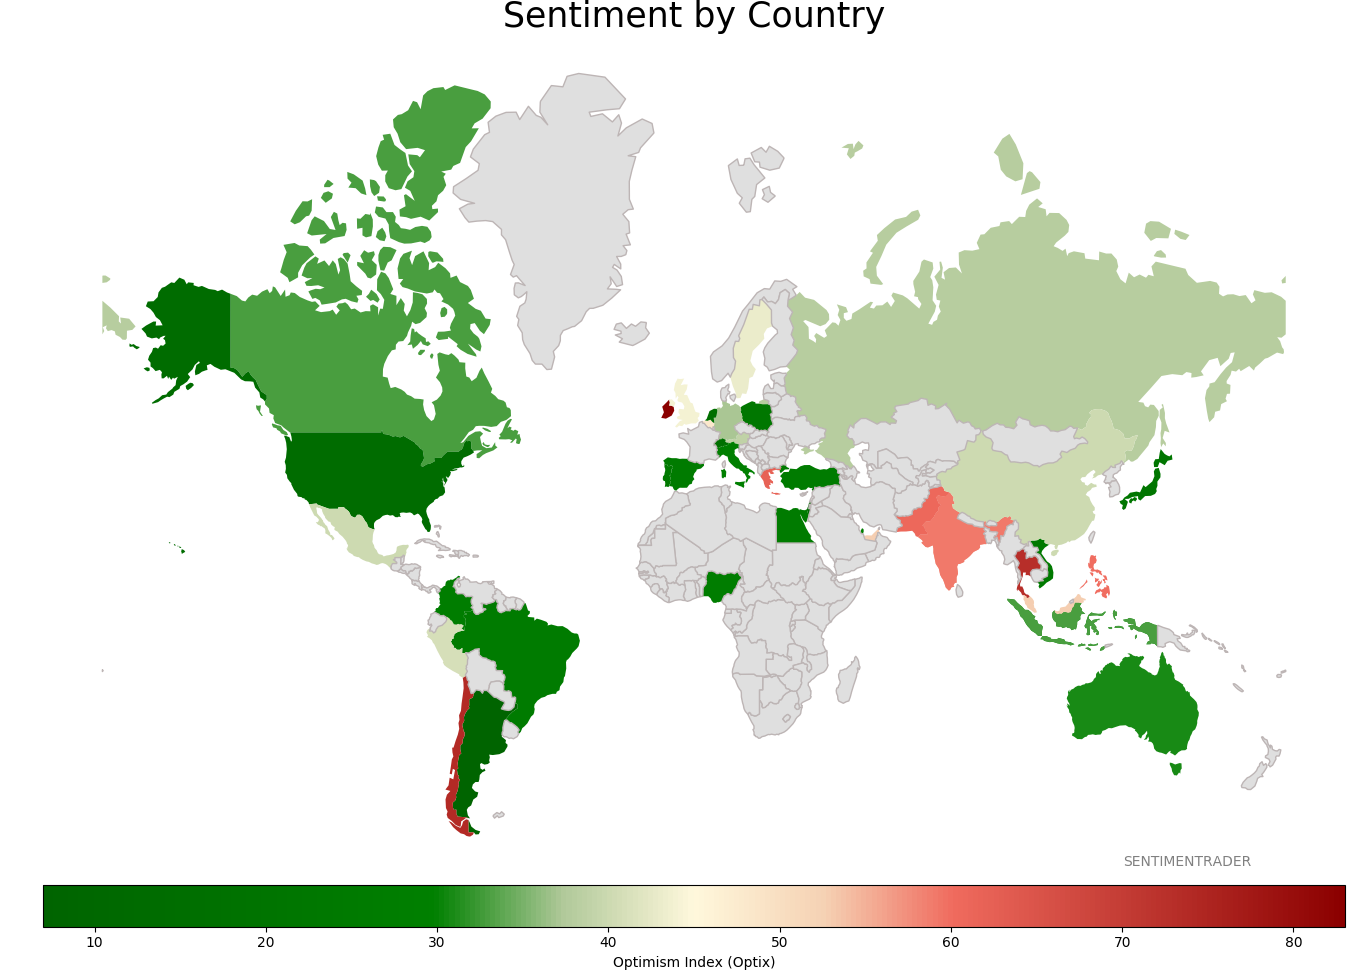
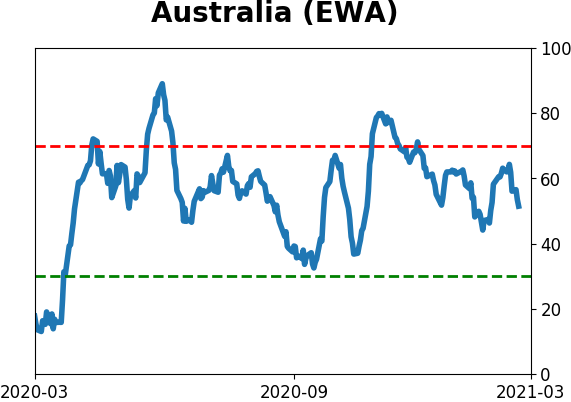
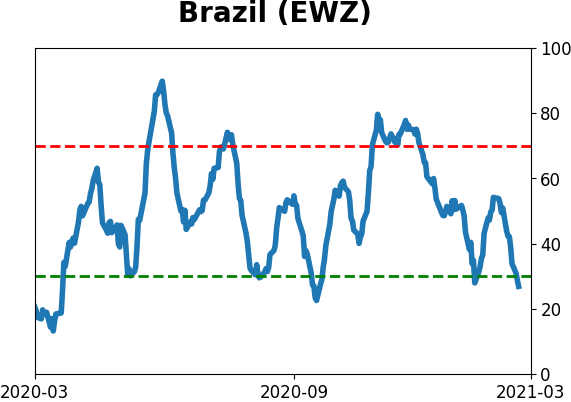
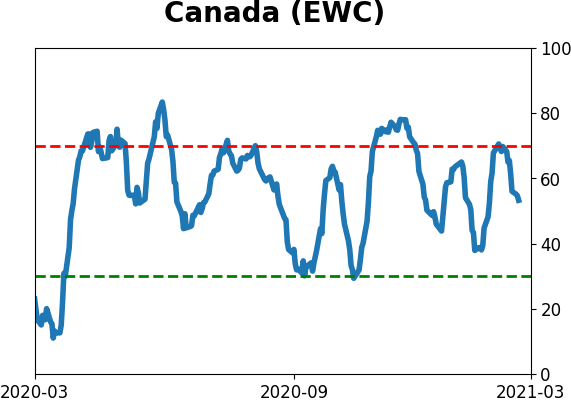
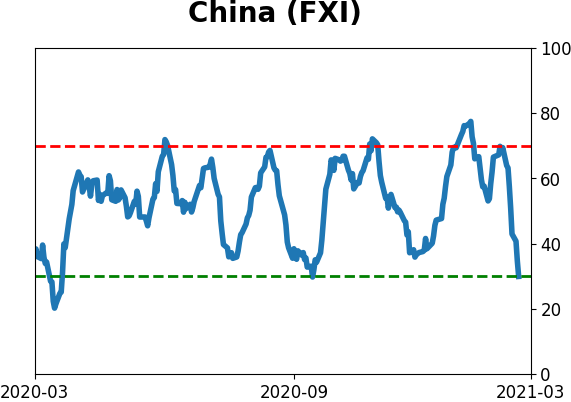
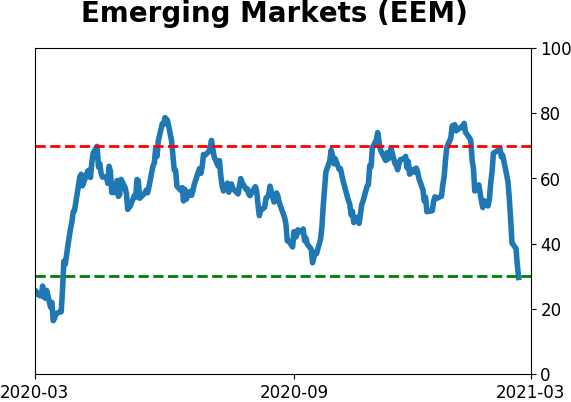
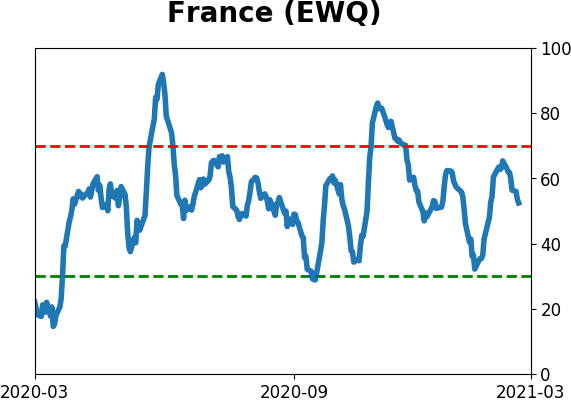
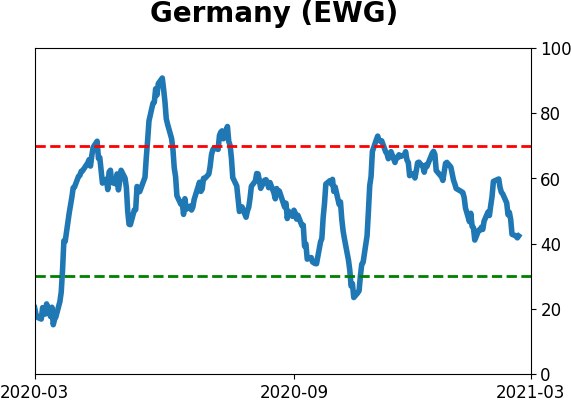
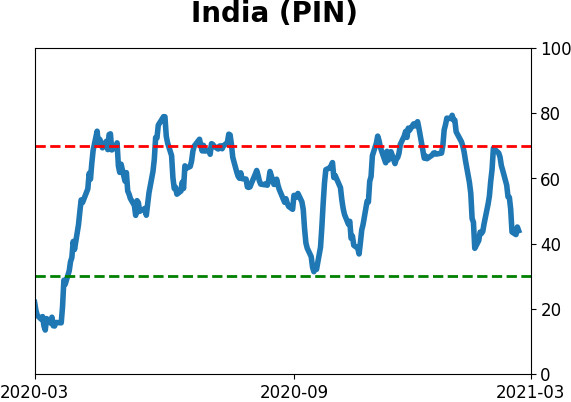
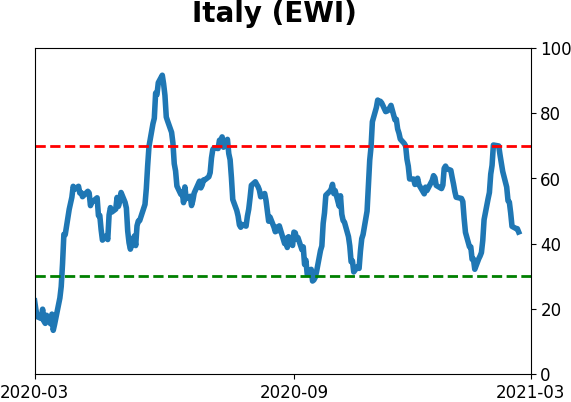
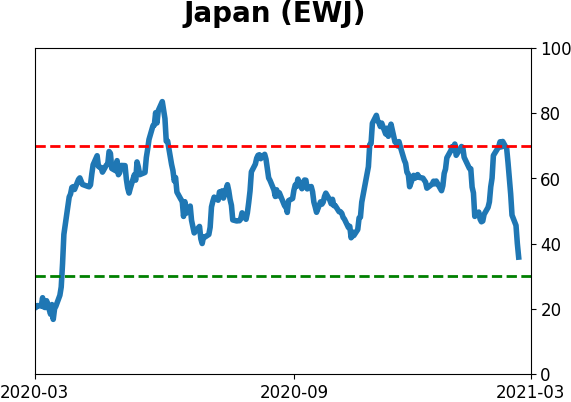
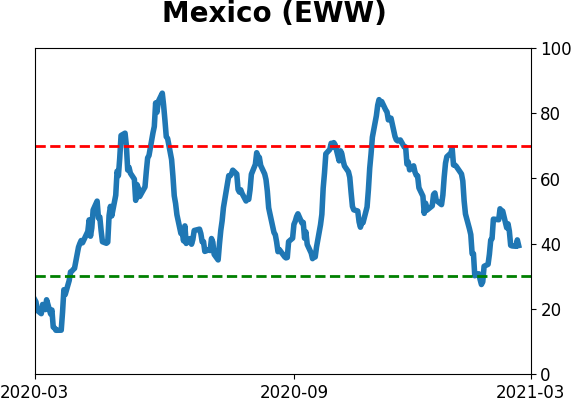
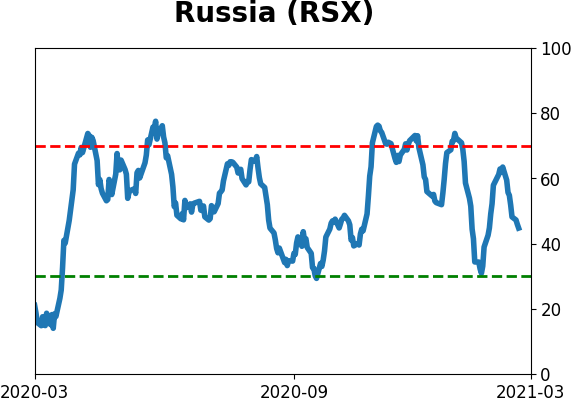
Sentiment Around The World
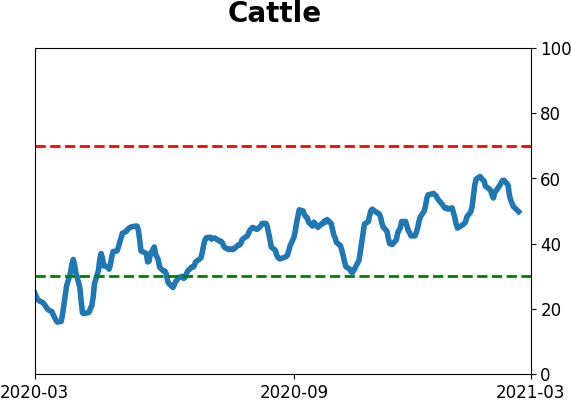
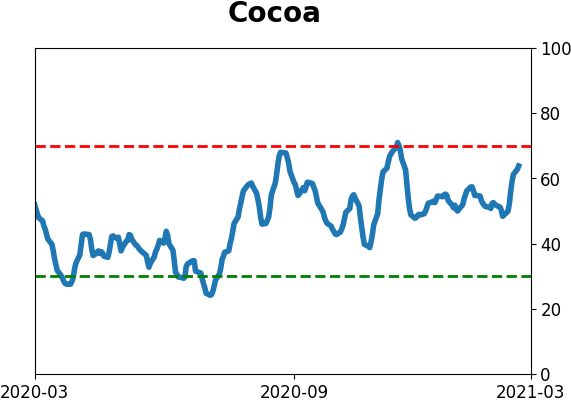
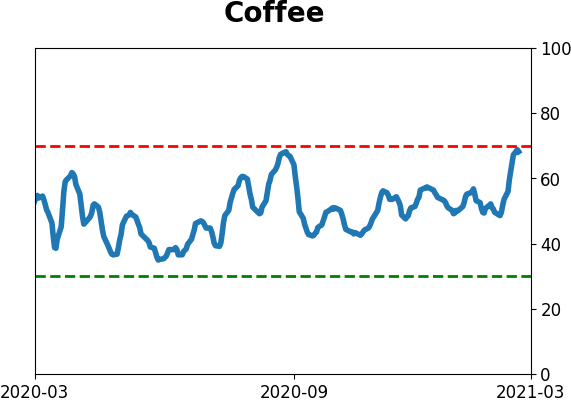
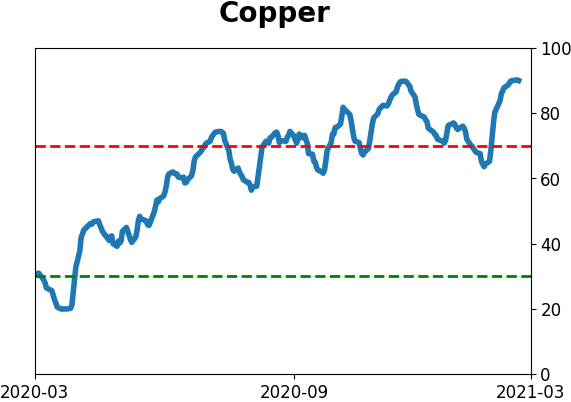
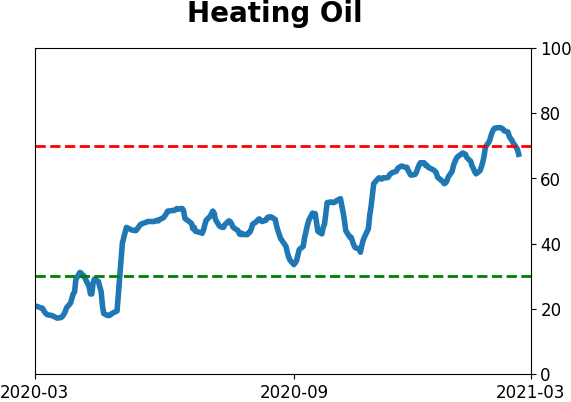
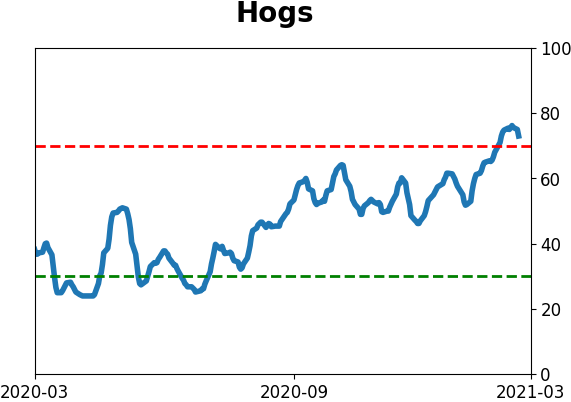
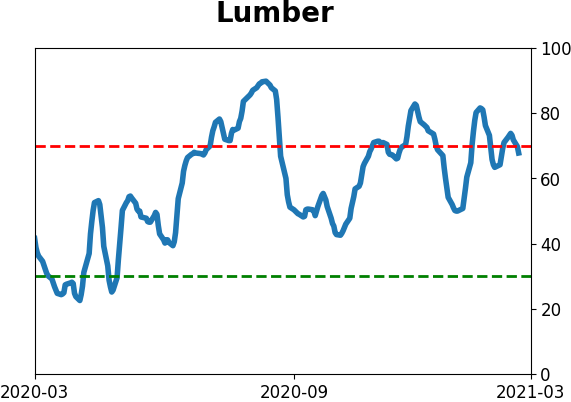
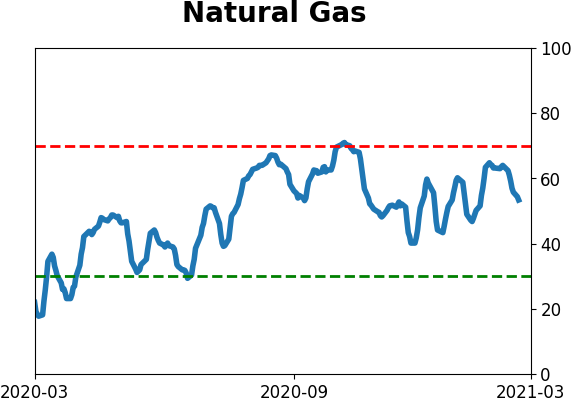
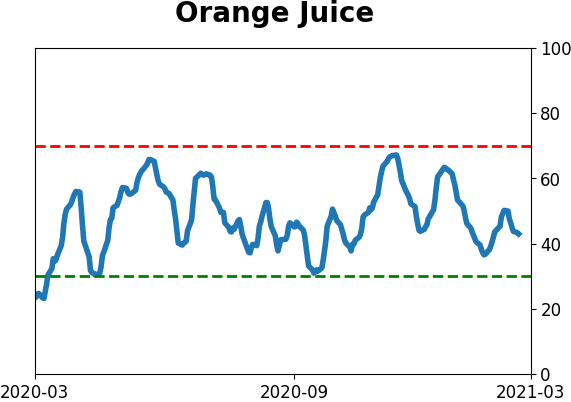
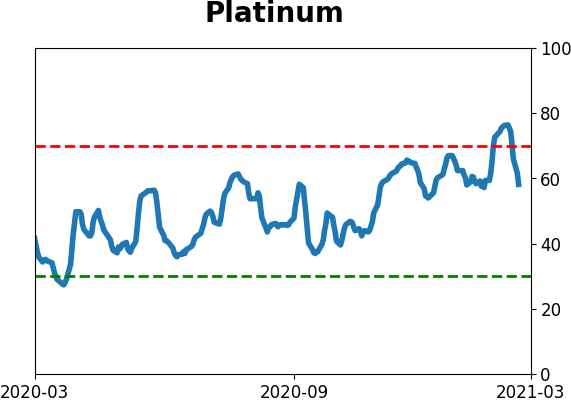
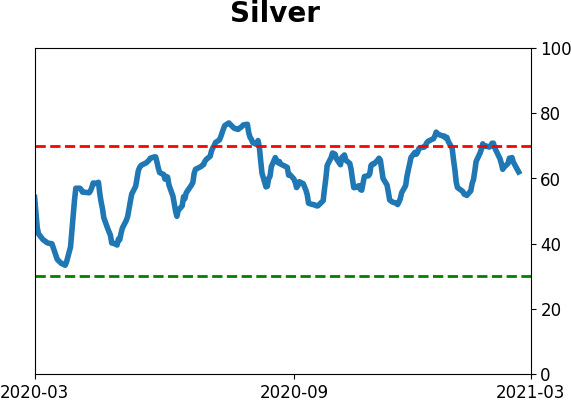
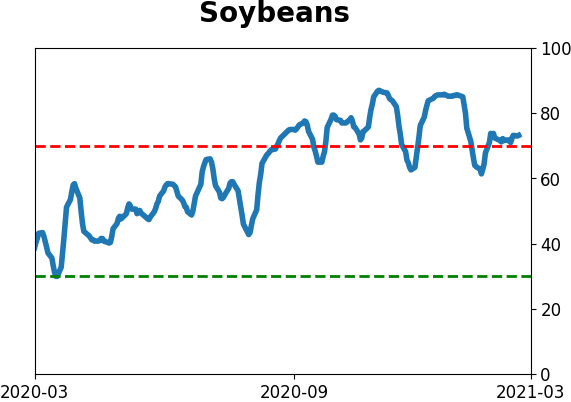
Optimism Index Thumbnails
|
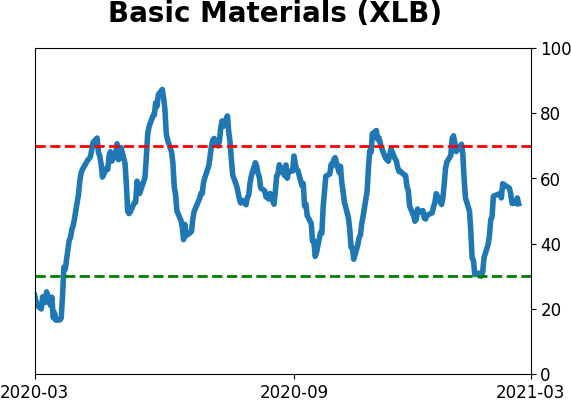
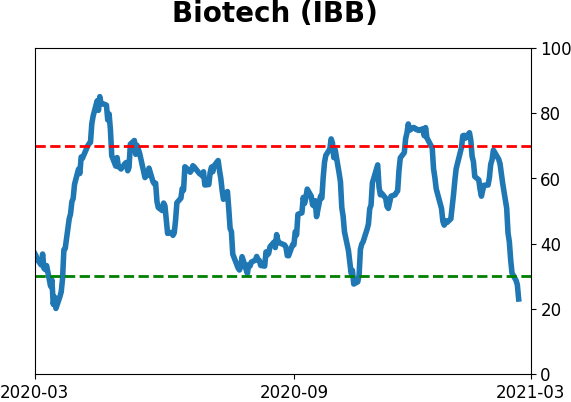
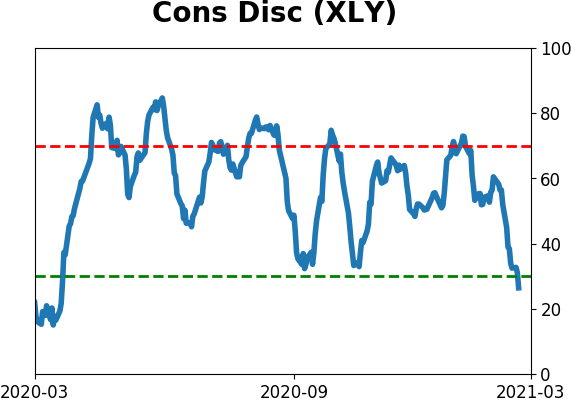
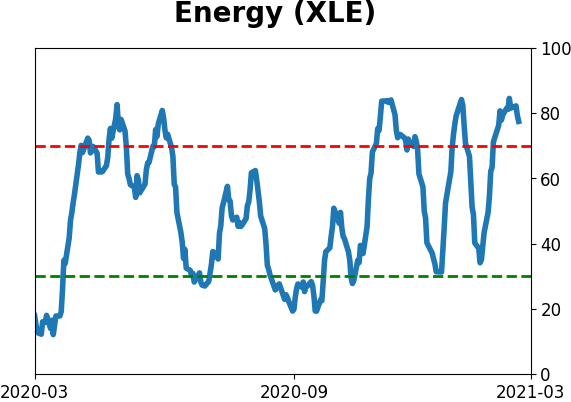
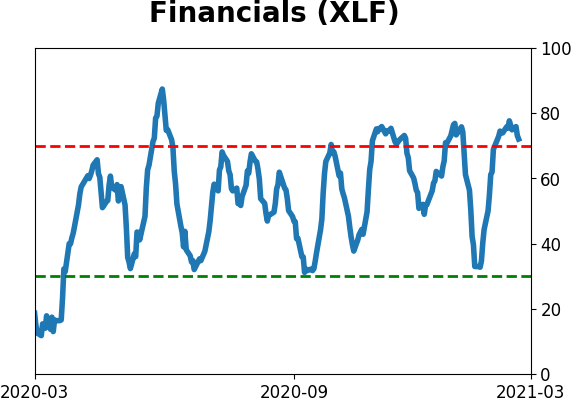
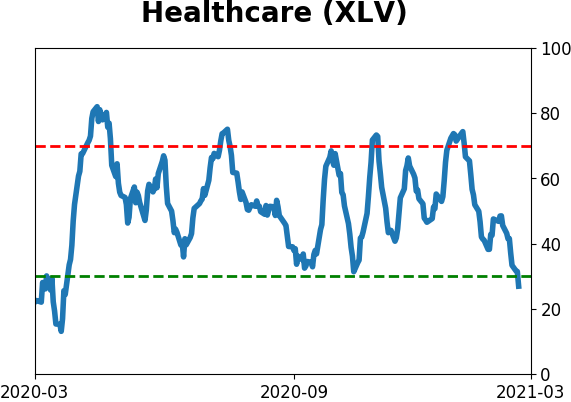
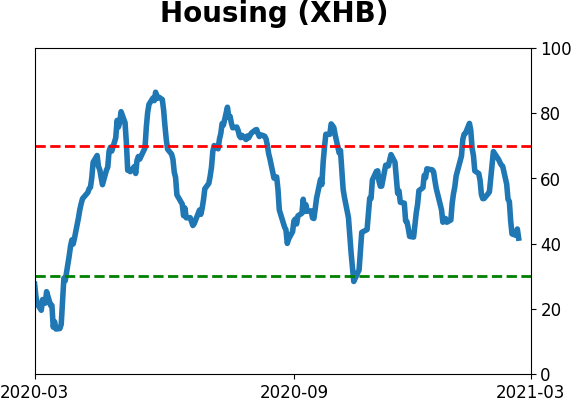
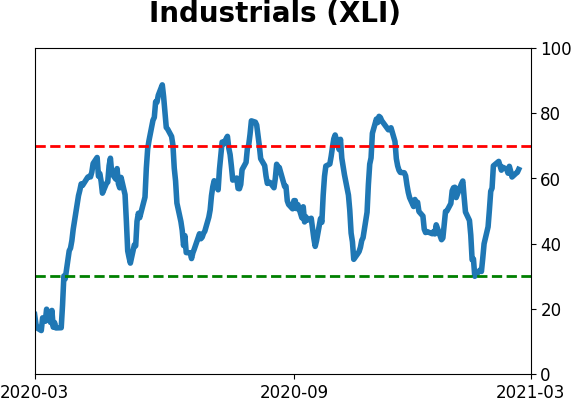
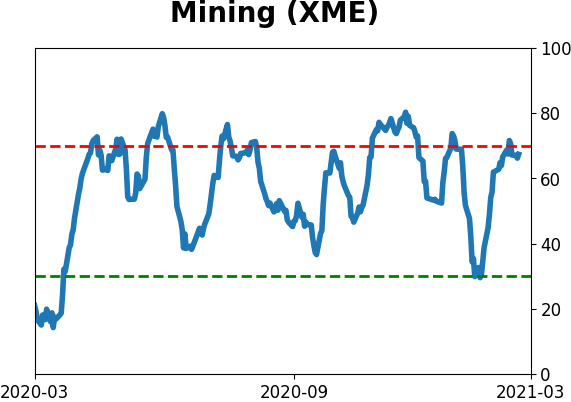
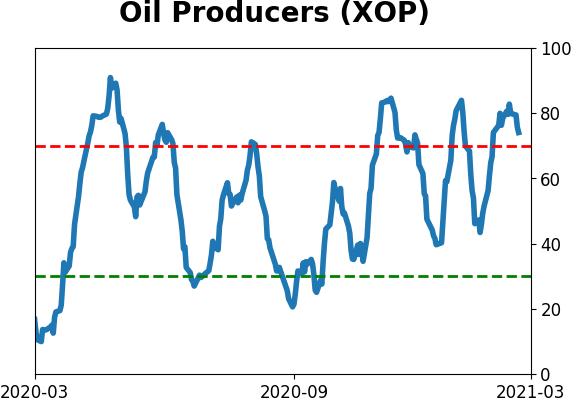
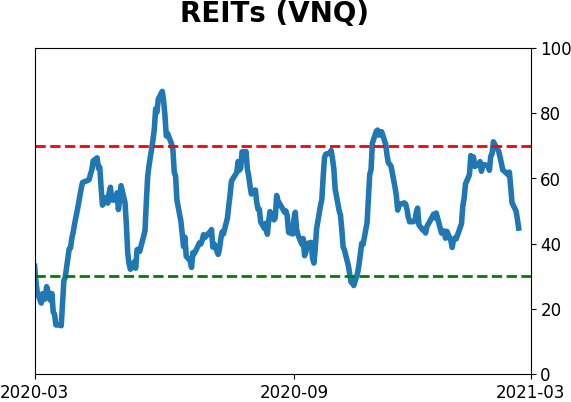
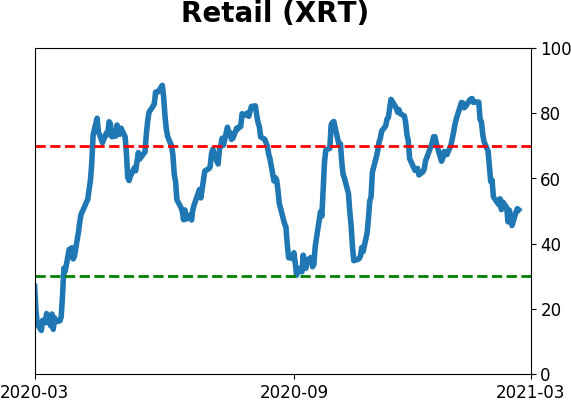
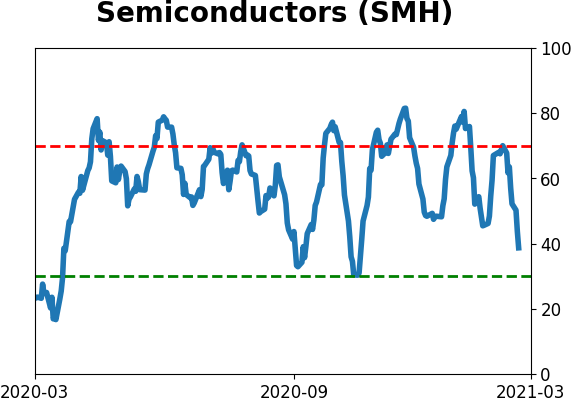
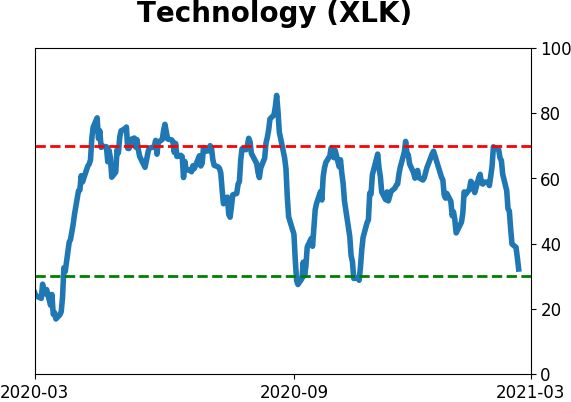
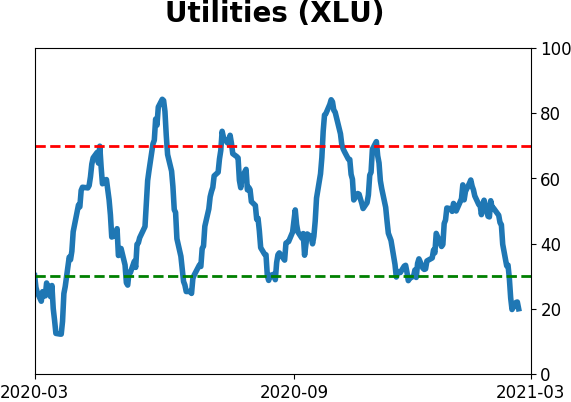
Sector ETF's - 10-Day Moving Average
|
|
|
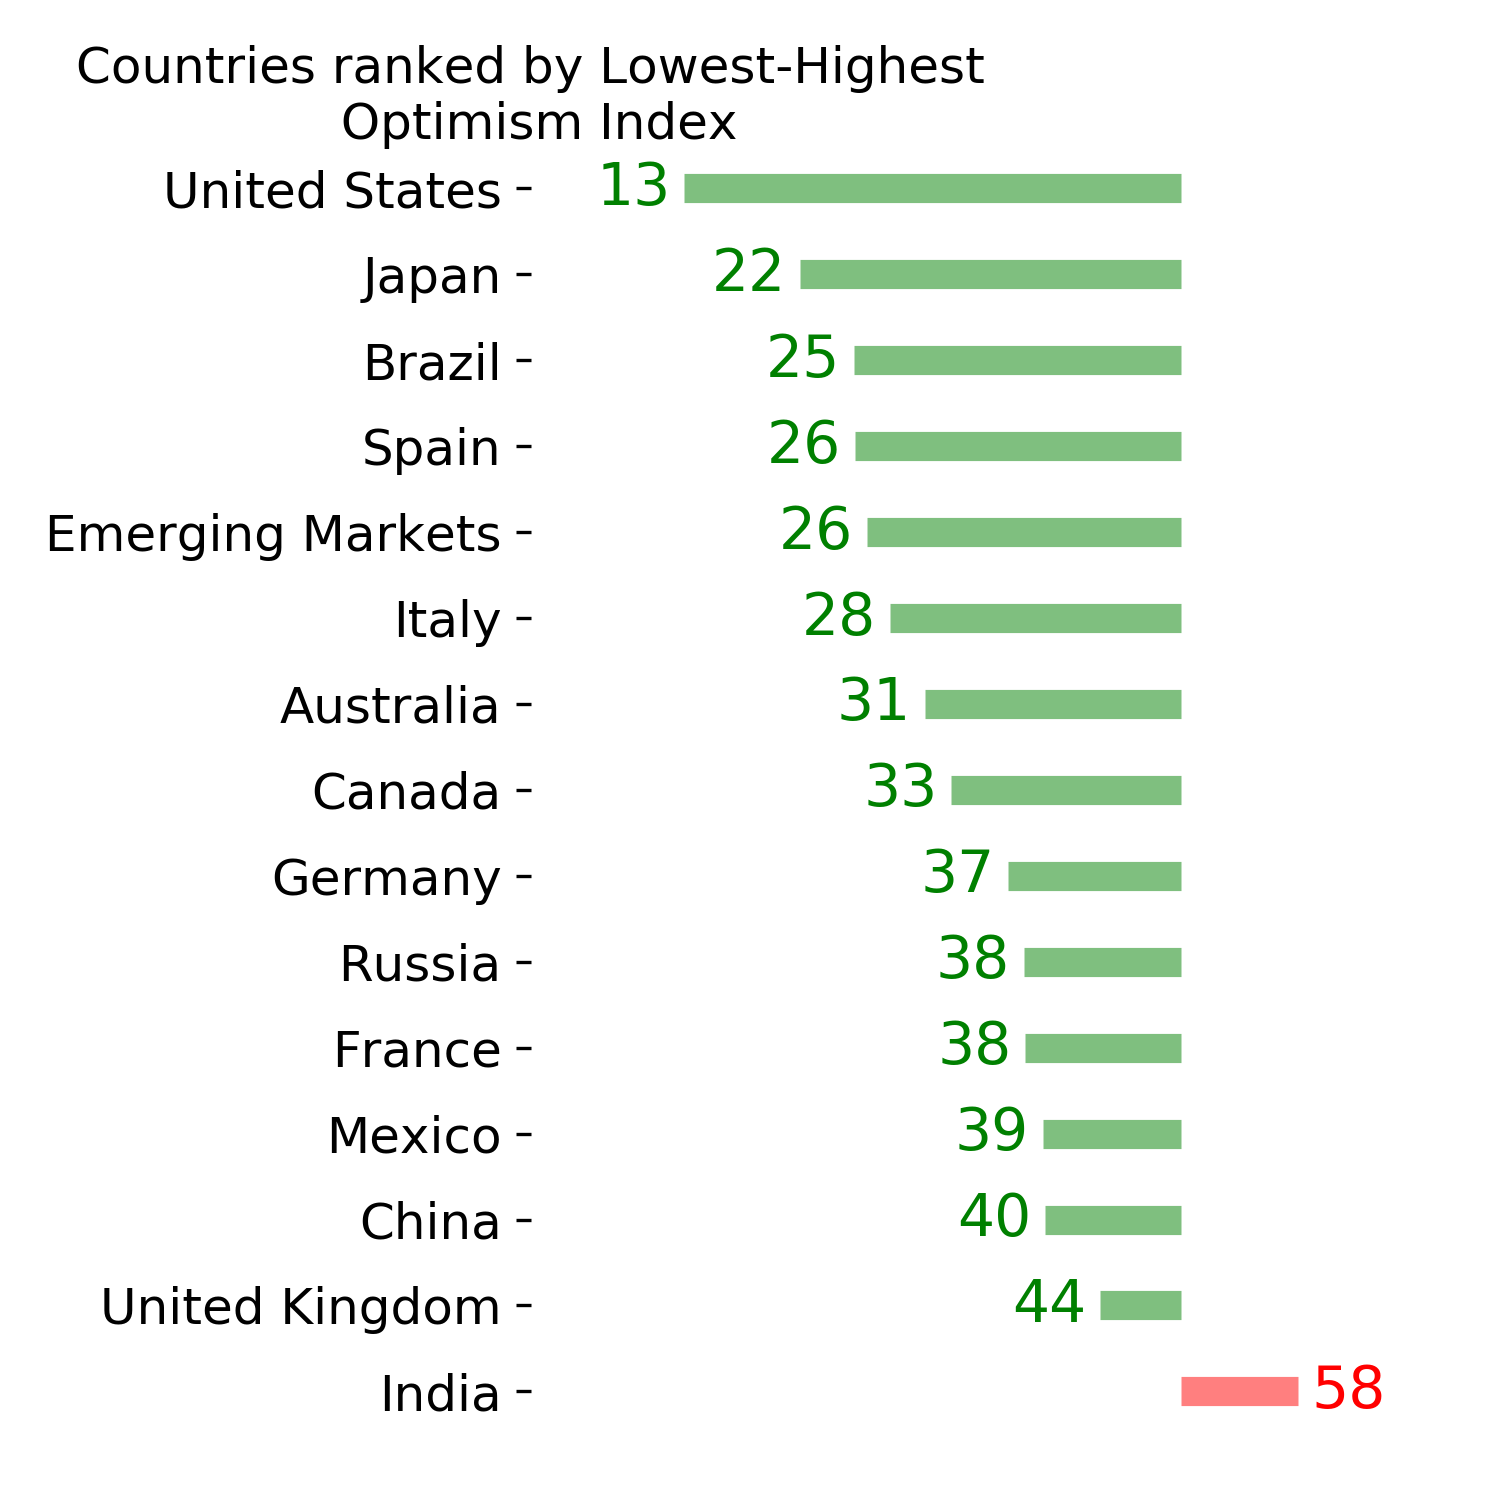
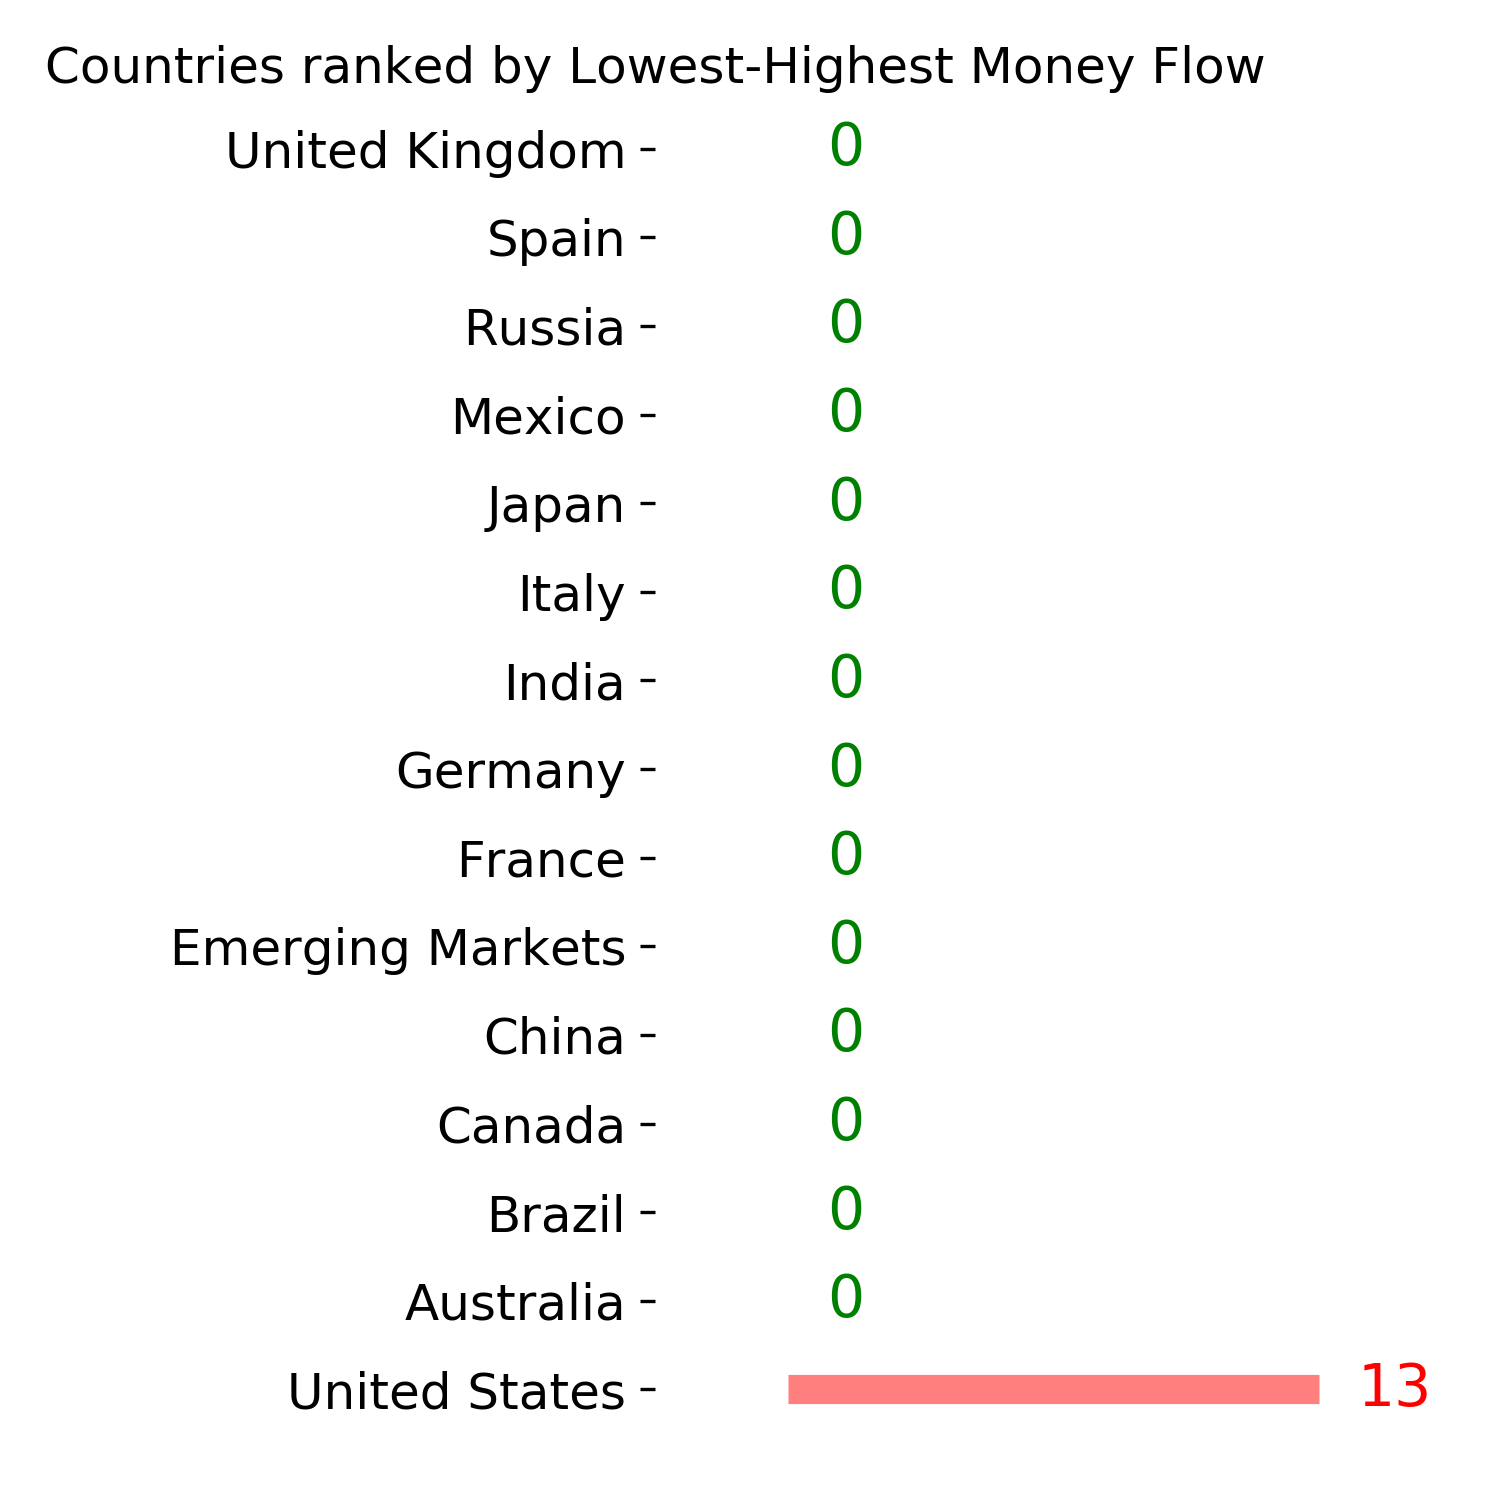
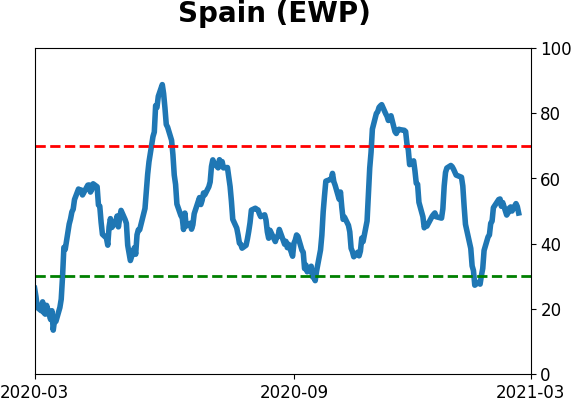
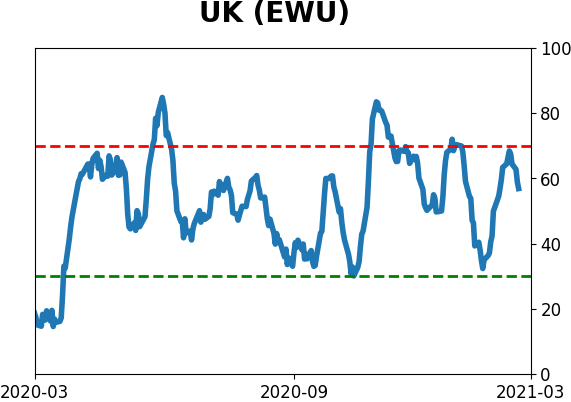
Country ETF's - 10-Day Moving Average
|
|
|
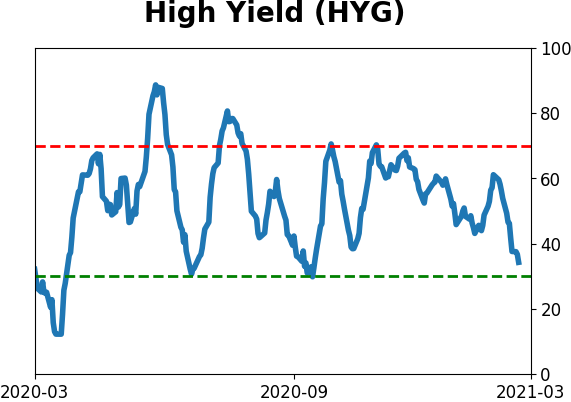
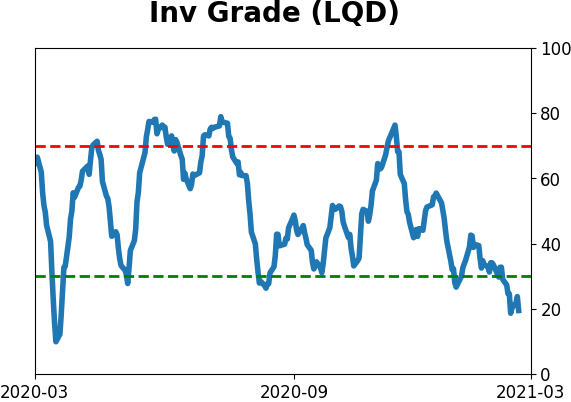
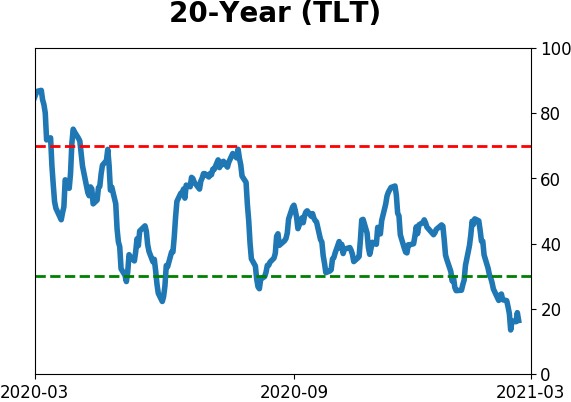
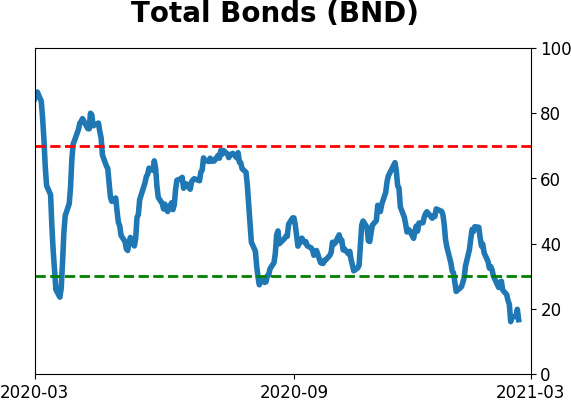
Bond ETF's - 10-Day Moving Average
|
|
|
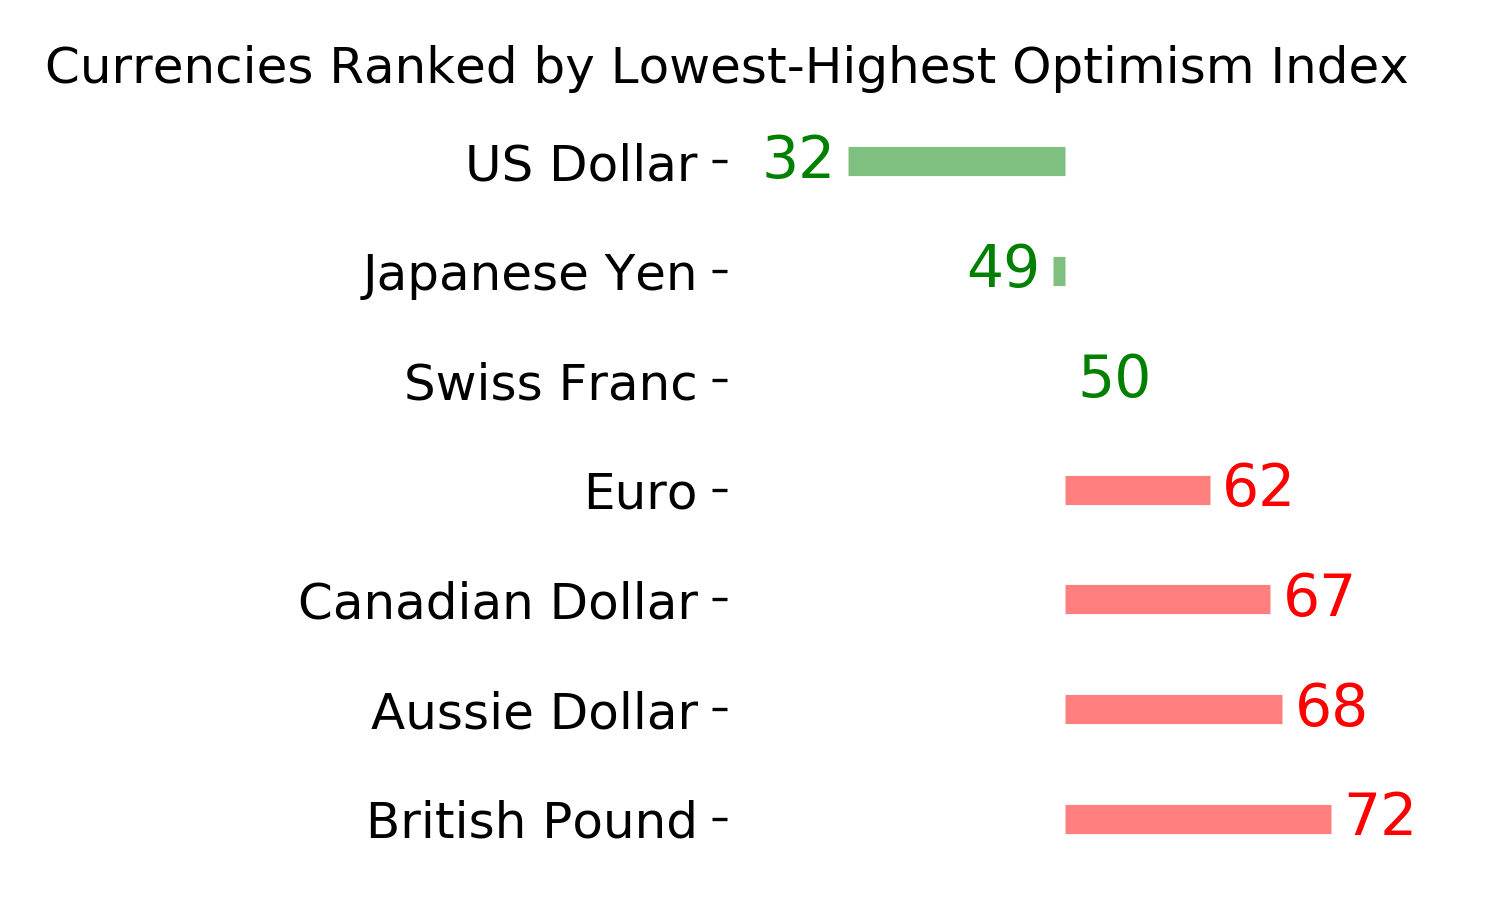
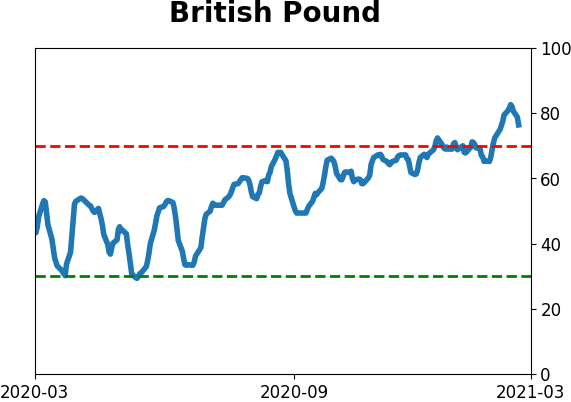
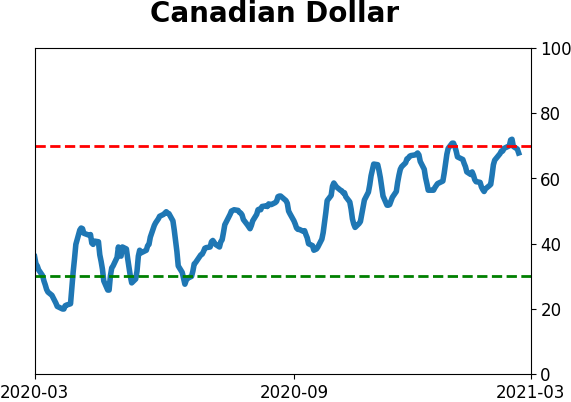
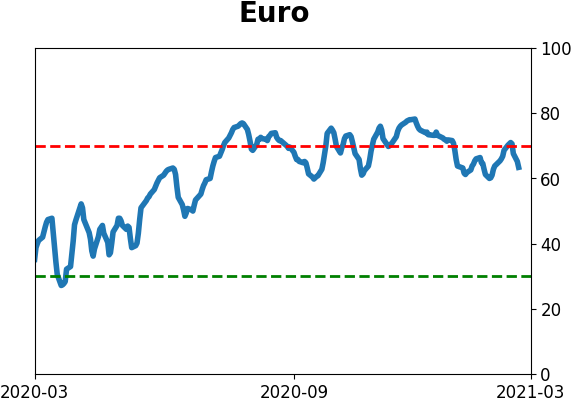
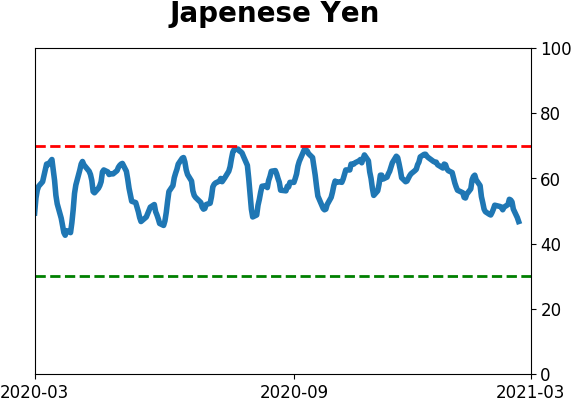
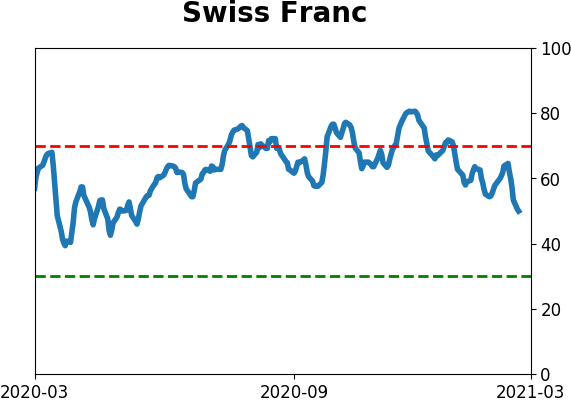
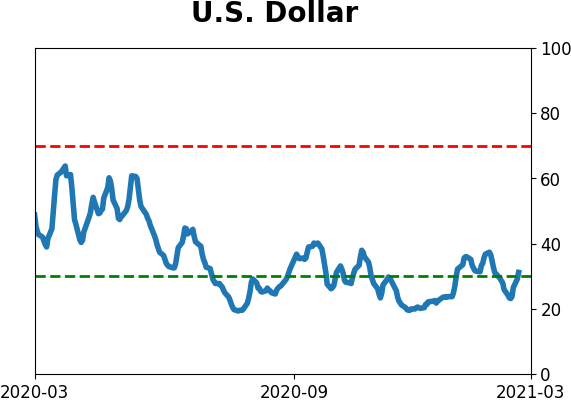
Currency ETF's - 5-Day Moving Average
|
|
|
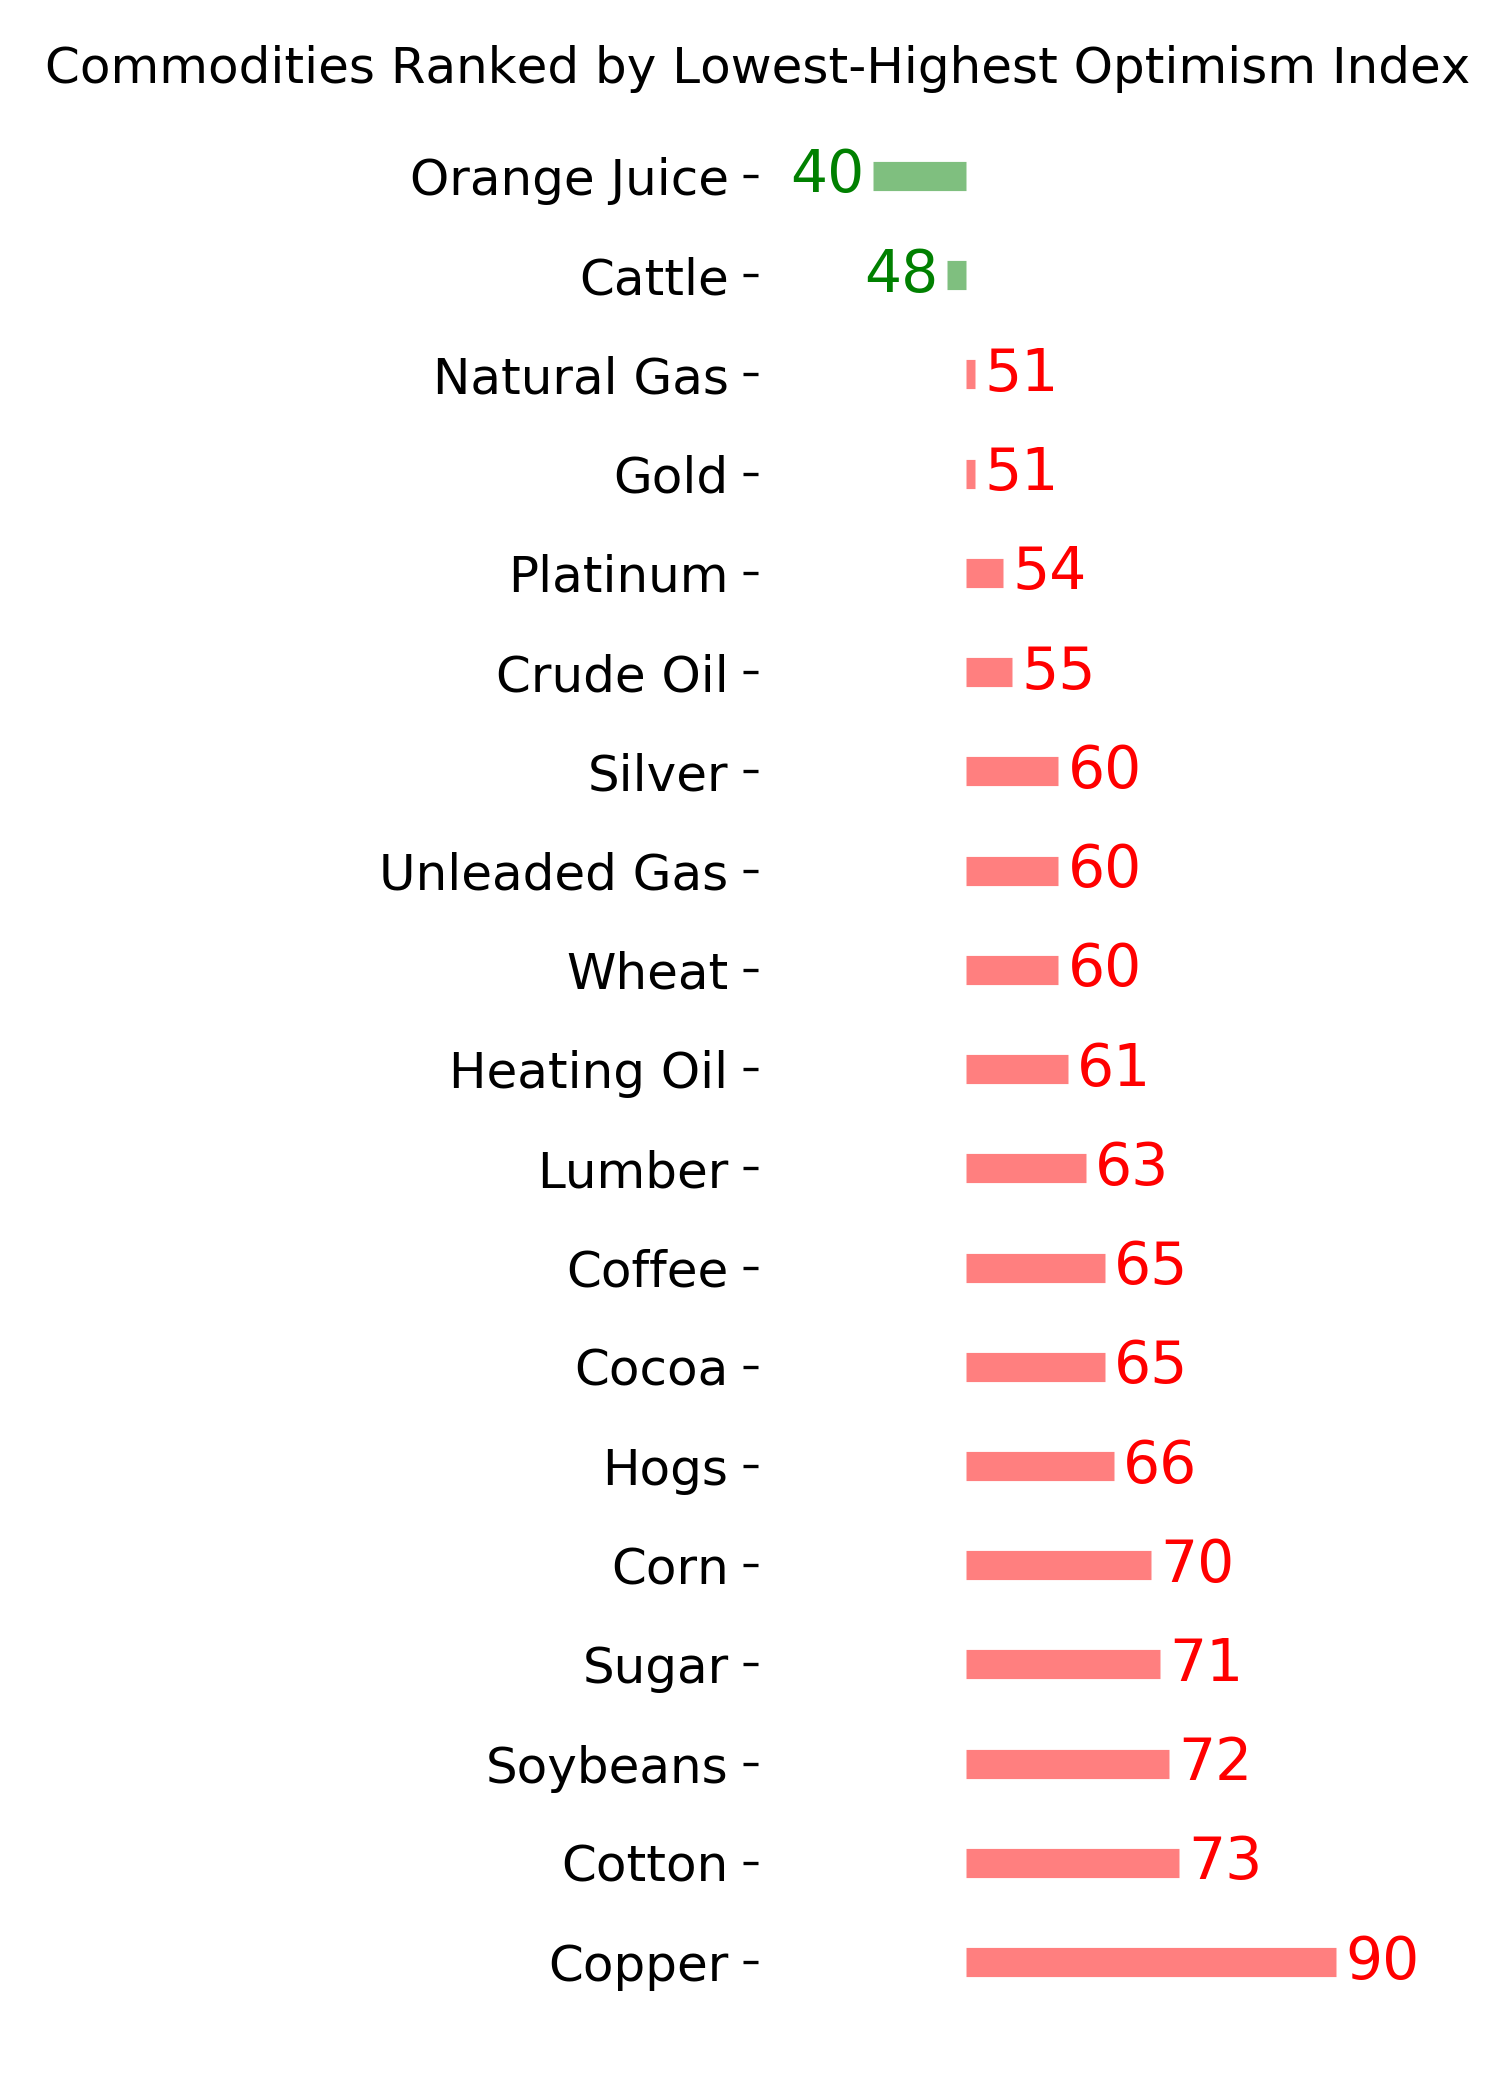
Commodity ETF's - 5-Day Moving Average
|
|