Headlines
|
|
New lows are expanding in defensive sectors:
One and three-month lows in defensive sectors are outpacing the lows in cyclical sectors, which is unusual for corrections or bear markets. Typically, when this occurs, the broad market is closer to the end of a corrective phase rather than the beginning of one. After similar conditions, the S&P 500 tends to rally over the ensuing months.
|
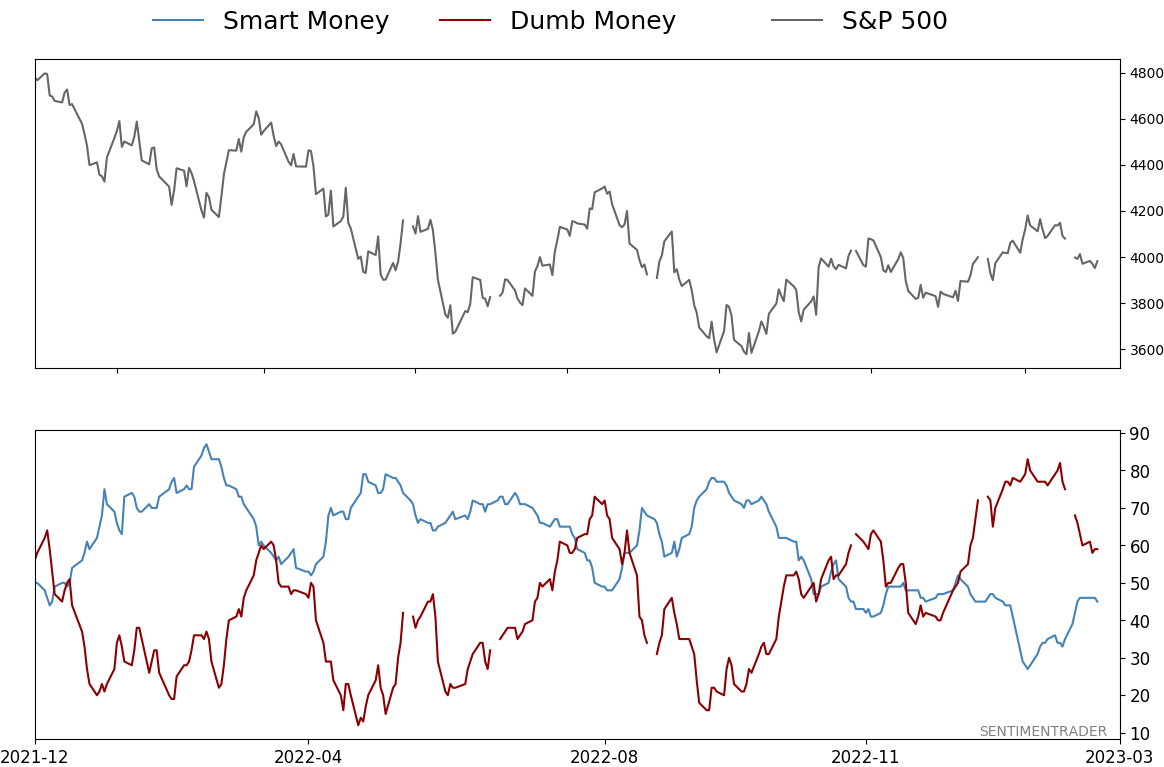
Smart / Dumb Money Confidence
|
Smart Money Confidence: 45%
Dumb Money Confidence: 59%
|
|
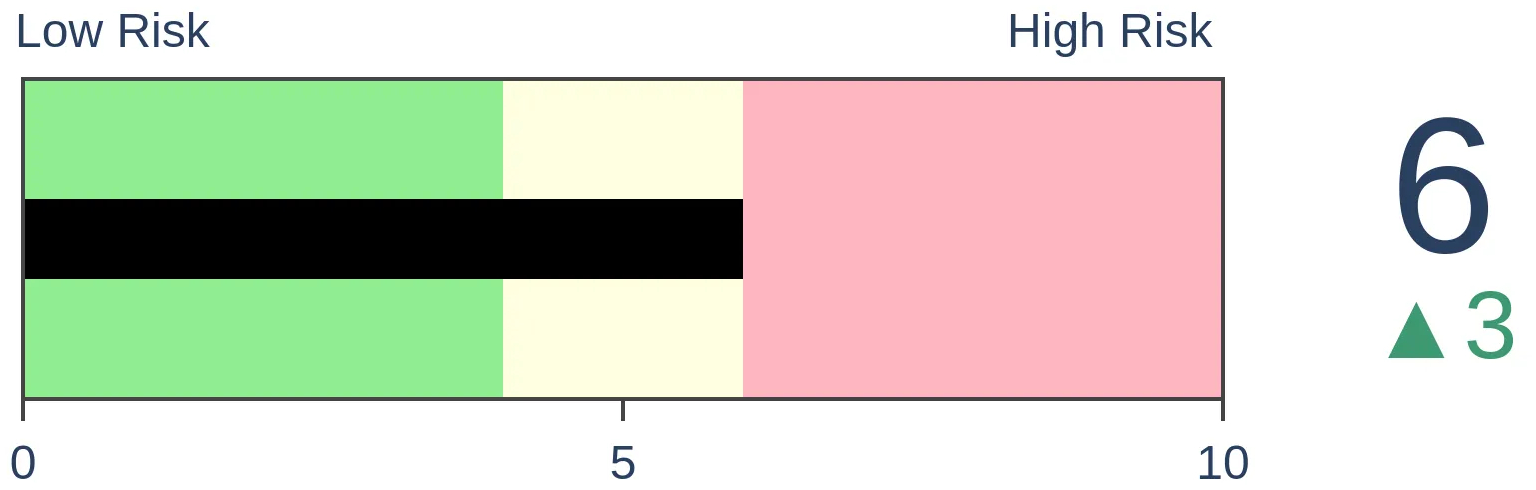
Risk Levels
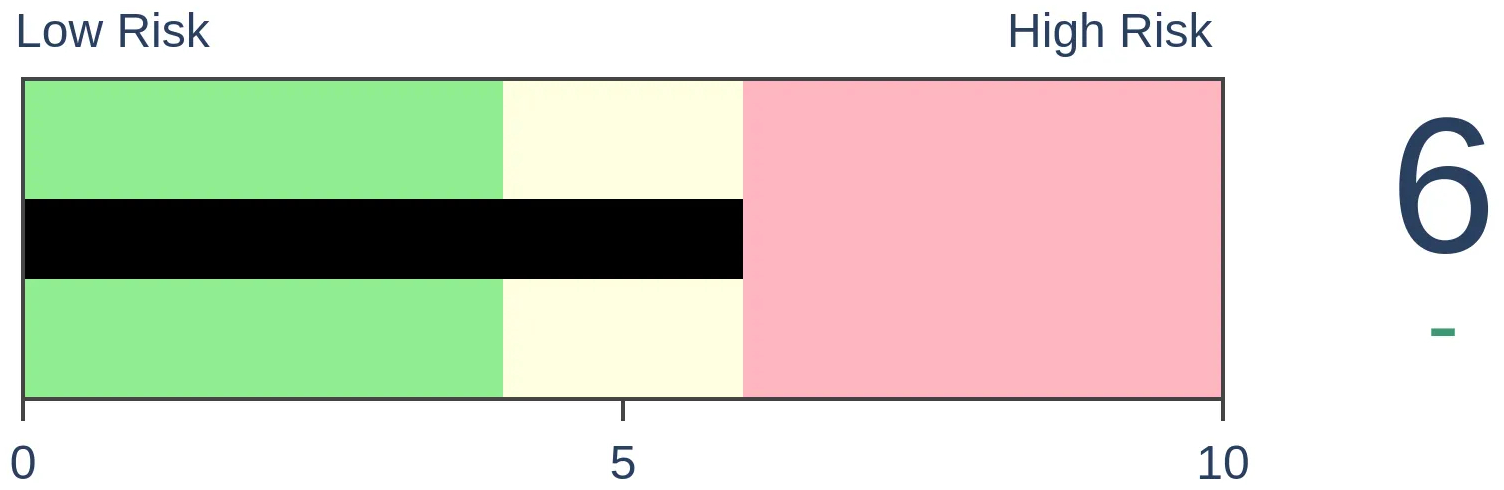
Stocks Short-Term
|
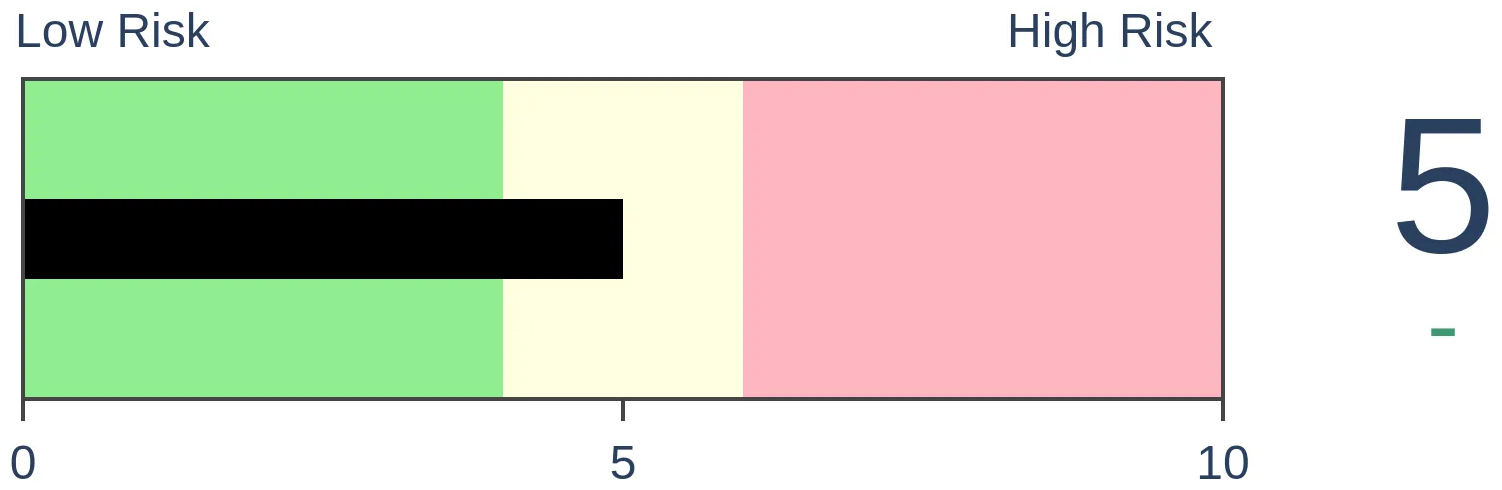
Stocks Medium-Term
|
|
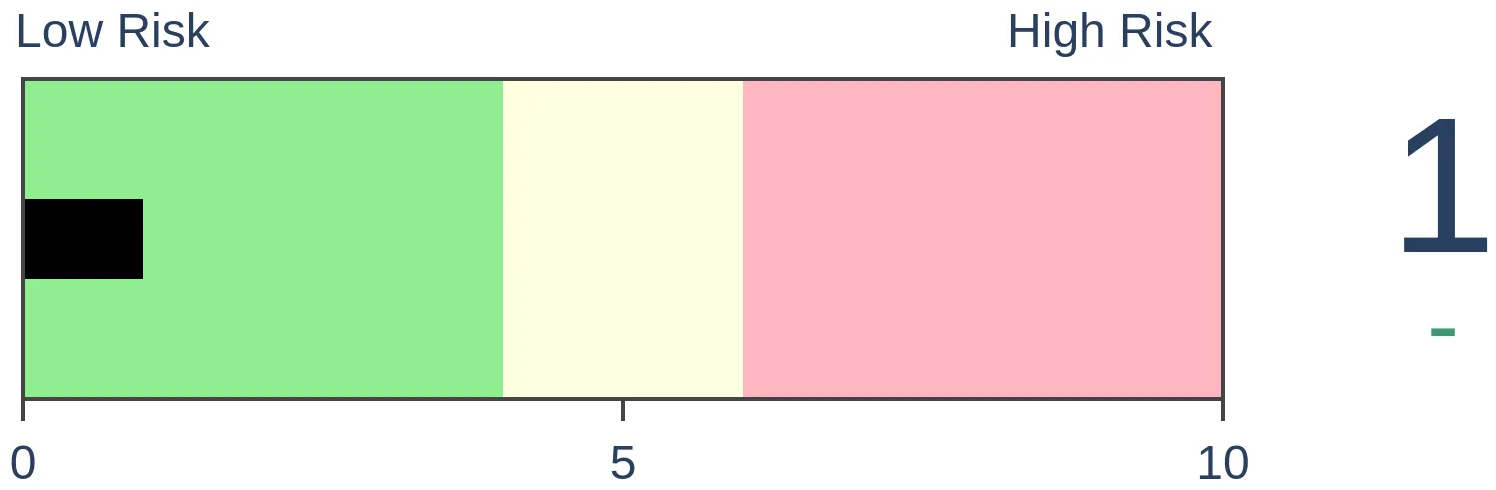
Bonds
|
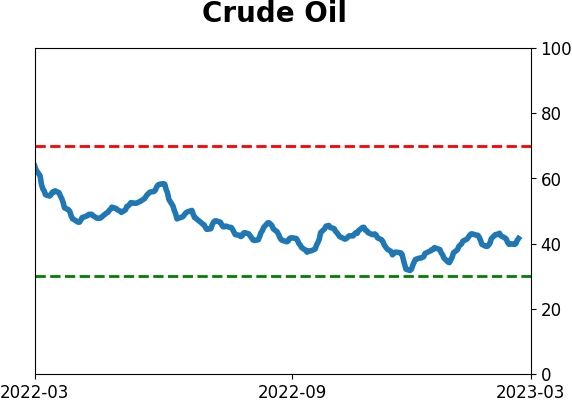
Crude Oil
|
|
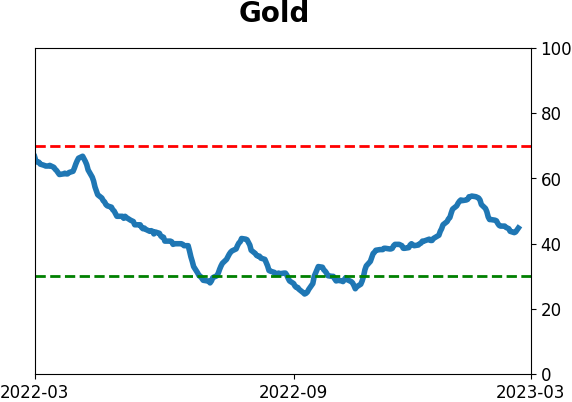
Gold

|
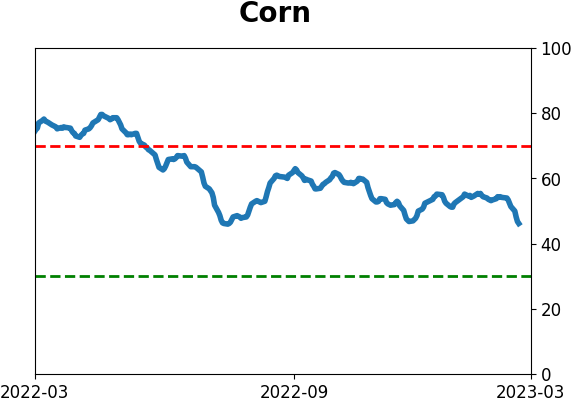
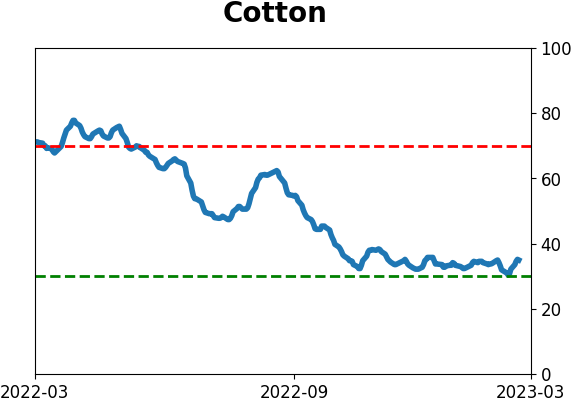
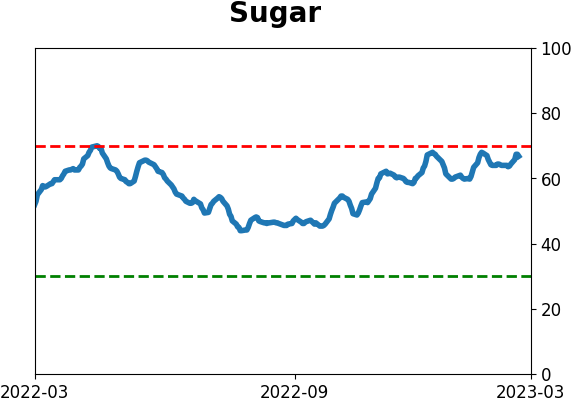
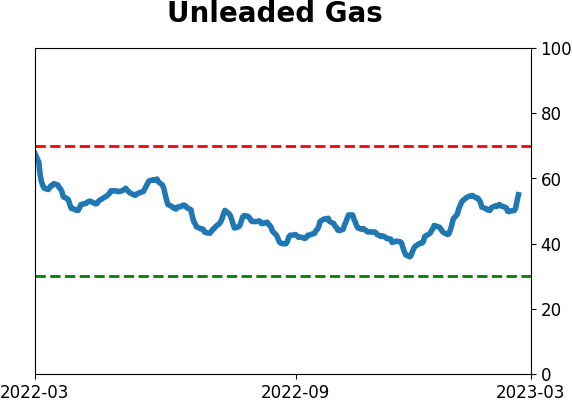
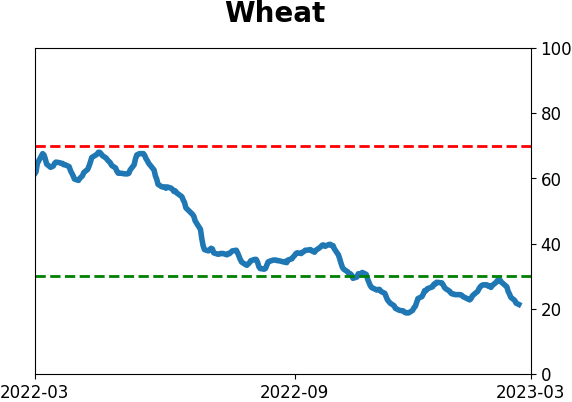
Agriculture

|
|
Research
By Dean Christians
BOTTOM LINE
One and three-month lows in defensive sectors are outpacing the lows in cyclical sectors, which is unusual for corrections or bear markets. Typically, when this occurs, the broad market is closer to the end of a corrective phase rather than the beginning of one. After similar conditions, the S&P 500 tends to rally over the ensuing months.
FORECAST / TIMEFRAME
None
|
Key points:
- Defensive sectors are driving the expansion in the percentage of one and three-month lows
- When defensive sector lows dominate, the S&P 500 is typically near the end of a pullback
Usually, an expansion in new lows is an unwelcome development
The S&P 500 continues to drift lower with a pullback of almost 5.5% from the February high. Except for 2023-02-21, when the NYSE advance/decline ratio reached -7/1, the correction has been orderly and unusual.
Typically, cyclical sectors in a correction or bear market lead the expansion in new lows as investors jettison risky groups. However, new lows in defensive sectors have dominated in the current pullback.
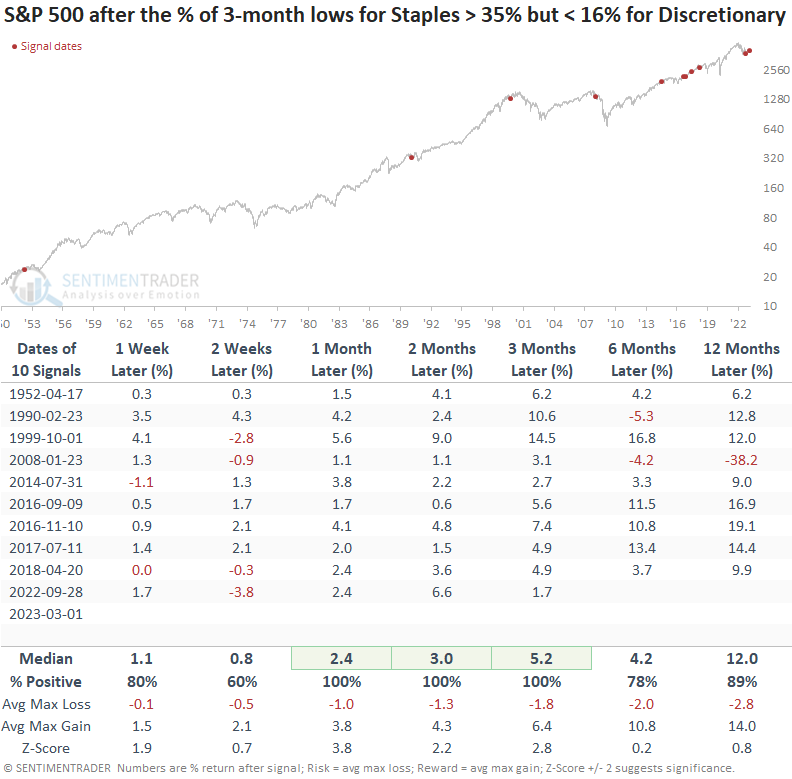
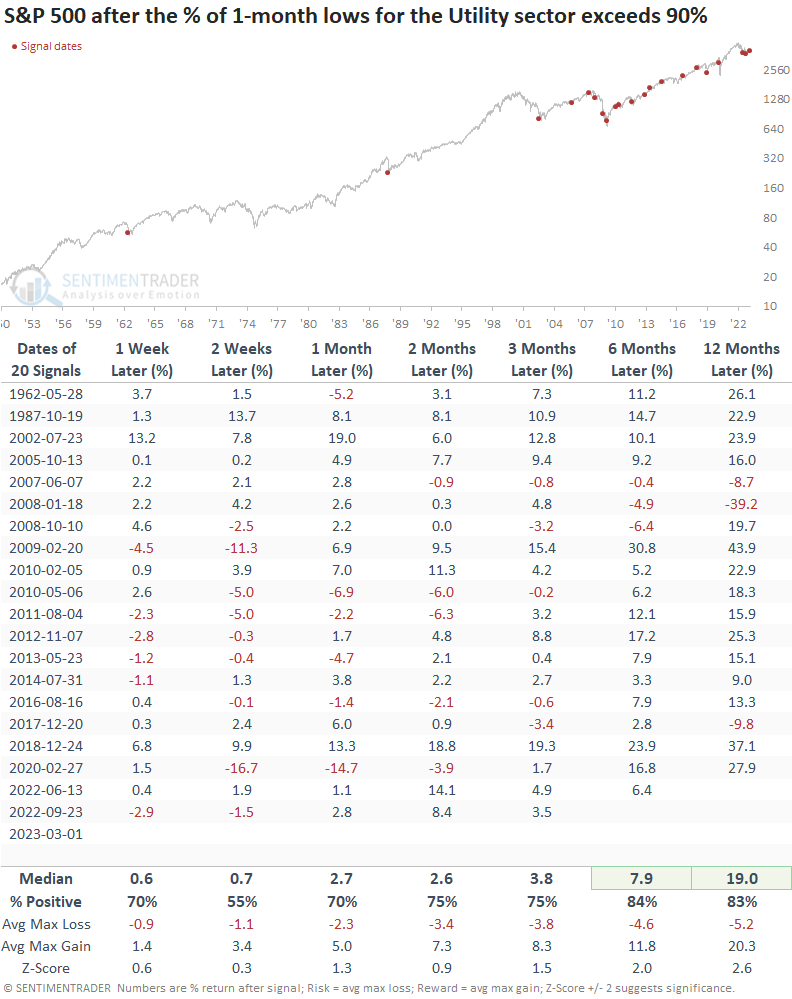
For instance, over 35% of S&P 500 Consumer Staples stocks closed at a three-month low on Wednesday. At the same time, only 12.5% of Consumer Discretionary stocks closed at a three-month low. And over 90% of S&P 500 utility sector stocks closed at a one-month low, far outpacing any cyclical sector.
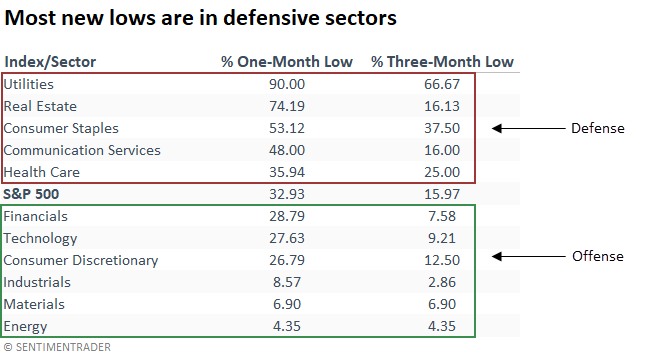
New lows in the things we need are outpacing new lows in the things we want
When three-month lows for the Consumer Staples sector exceed 35%, and three-month lows for the Consumer Discretionary sector are less than 16%, the S&P 500 shows a strong tendency to rally over the next few months.
While the January 2008 signal was a significant failure on a long-term basis, it showed a gain across several time frames.
Investors abandon the utility sector, which bodes well for the broad market
When more than 90% of S&P 500 Utility sector stocks close at a one-month low, the S&P 500 tends to trend upward, especially over medium and long-term time frames.
The two previous signals in 2022 occurred near significant bottoms that led to explosive counter-trend rallies.
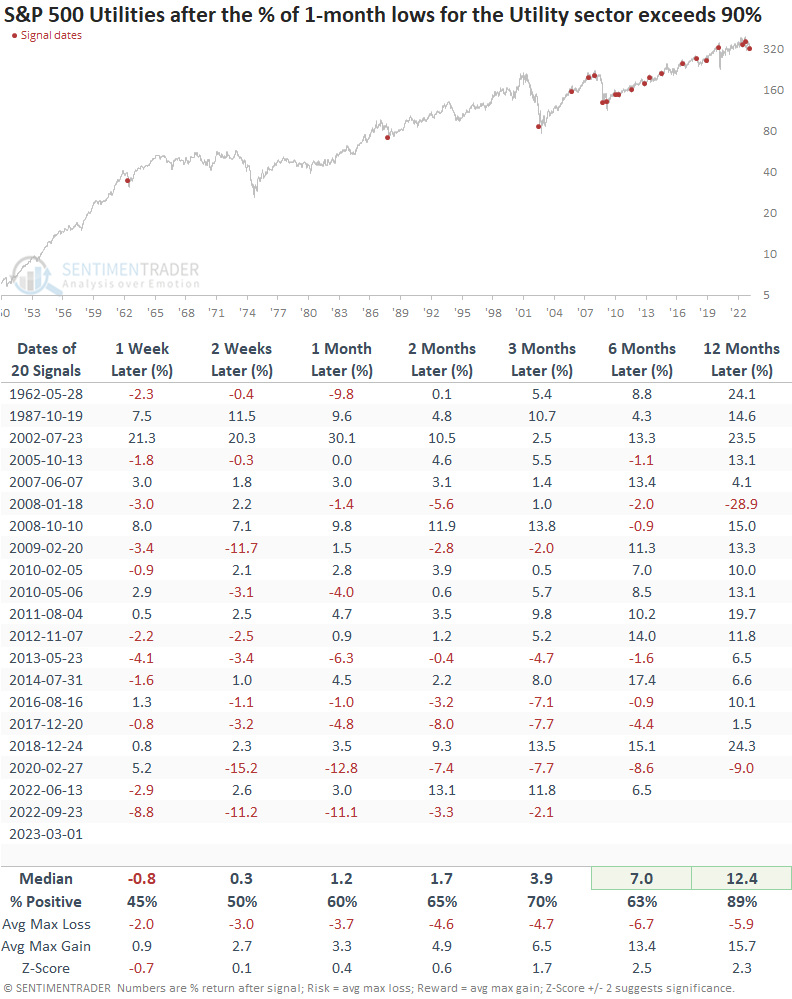
Utilities show somewhat soft results over the next few months but significantly better outcomes over the long term, especially a year later, which offers a win rate of 89%.
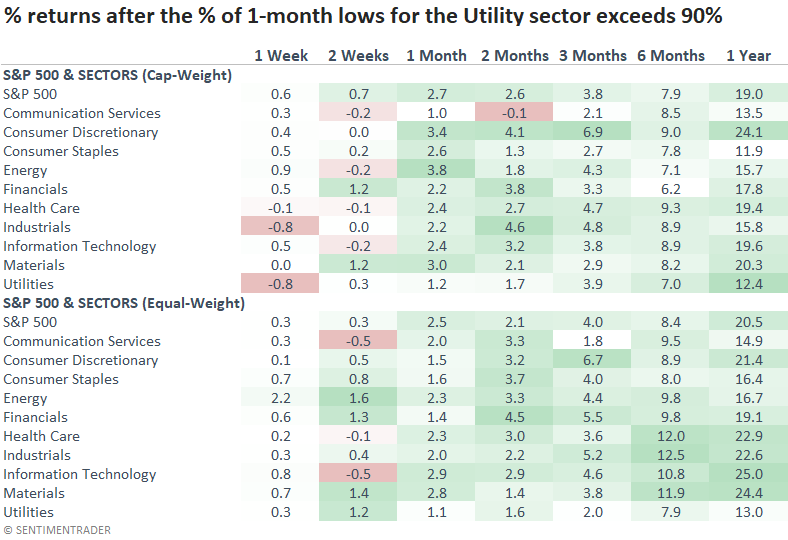
When I apply the utility signals to sectors, cyclical groups outperform the defensive ones except for Health Care over long-term horizons.
What the research tells us...
Typically, when investors give up on defensive sectors and hit the sell button, the broad market is closer to the end of a corrective phase versus the beginning of one. When three-month lows in the Consumer Staples sector outpace the lows in the Consumer Discretionary sector, or an overwhelming number of Utility sector stocks close at a one-month low, the S&P 500 tends to rally over the ensuing months. If this time is different, investors may have decided they would rather own a 6-month T-Bill yielding over 5%.
Indicators at Extremes
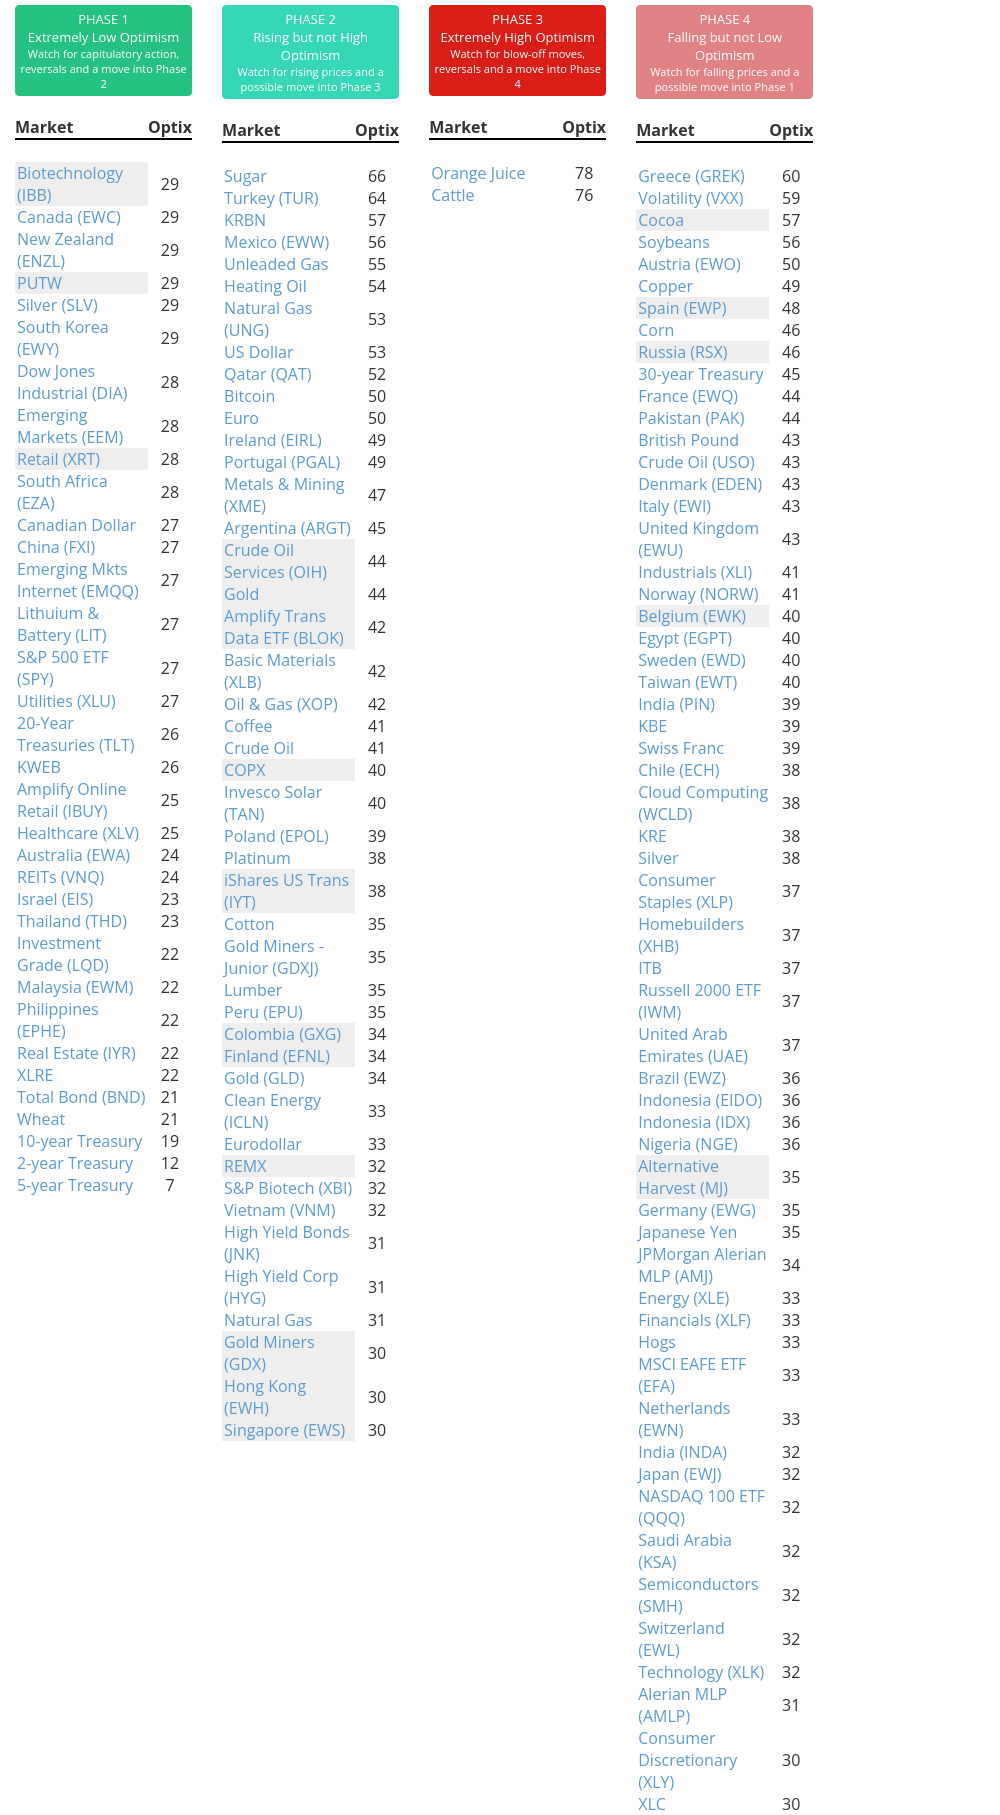
Phase Table
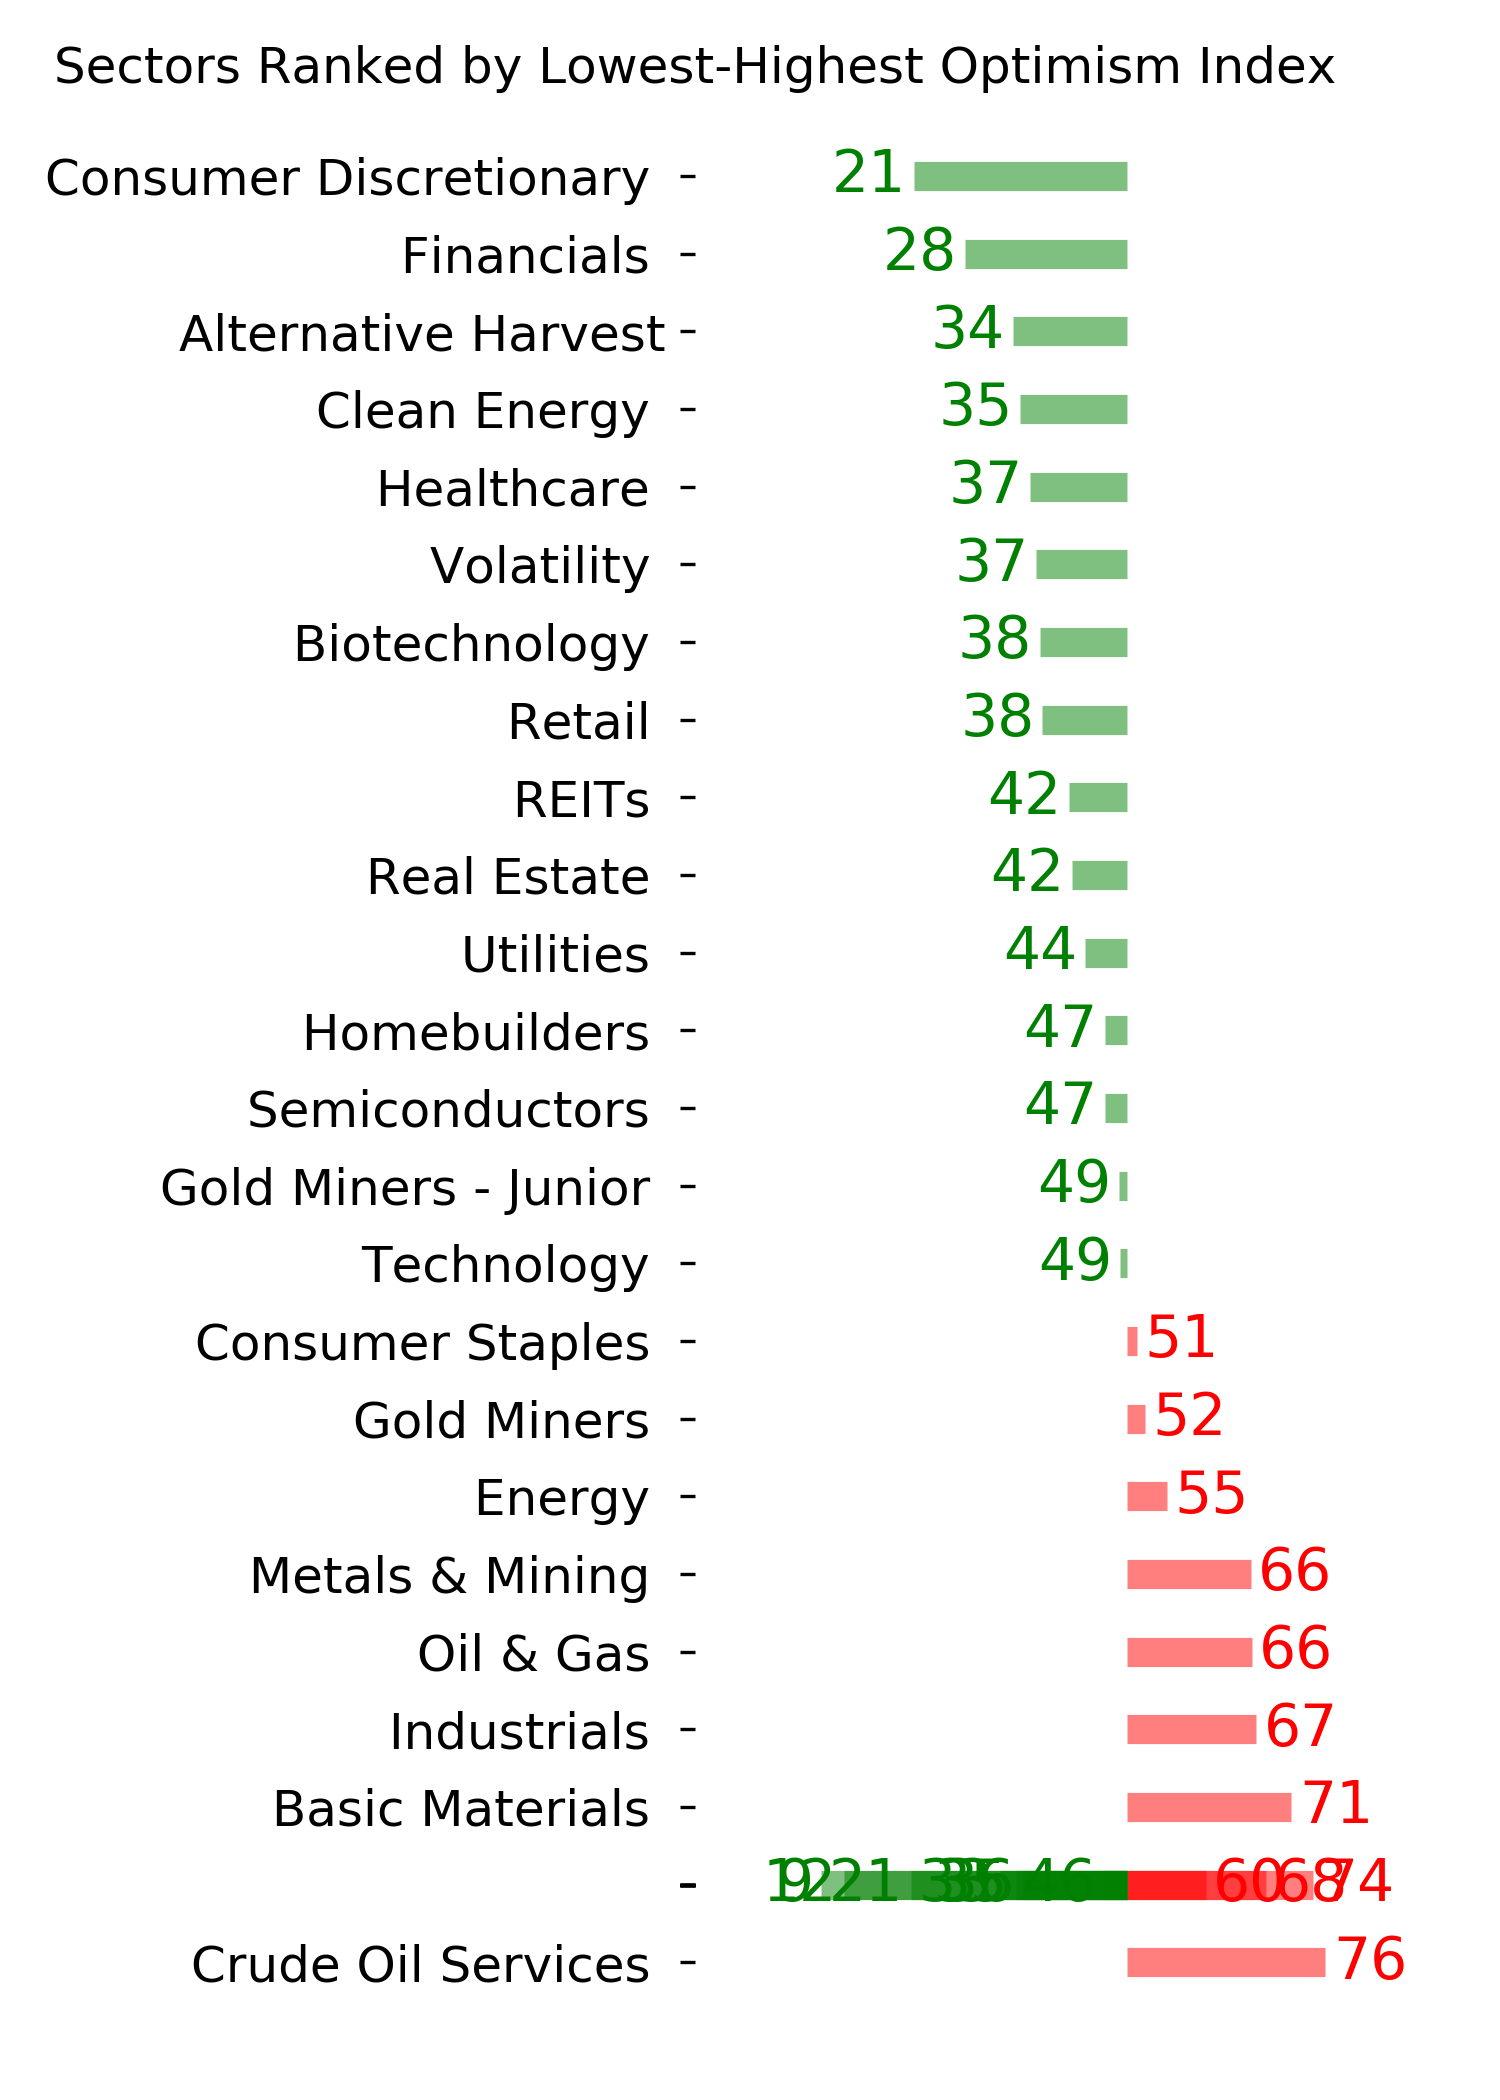
Ranks
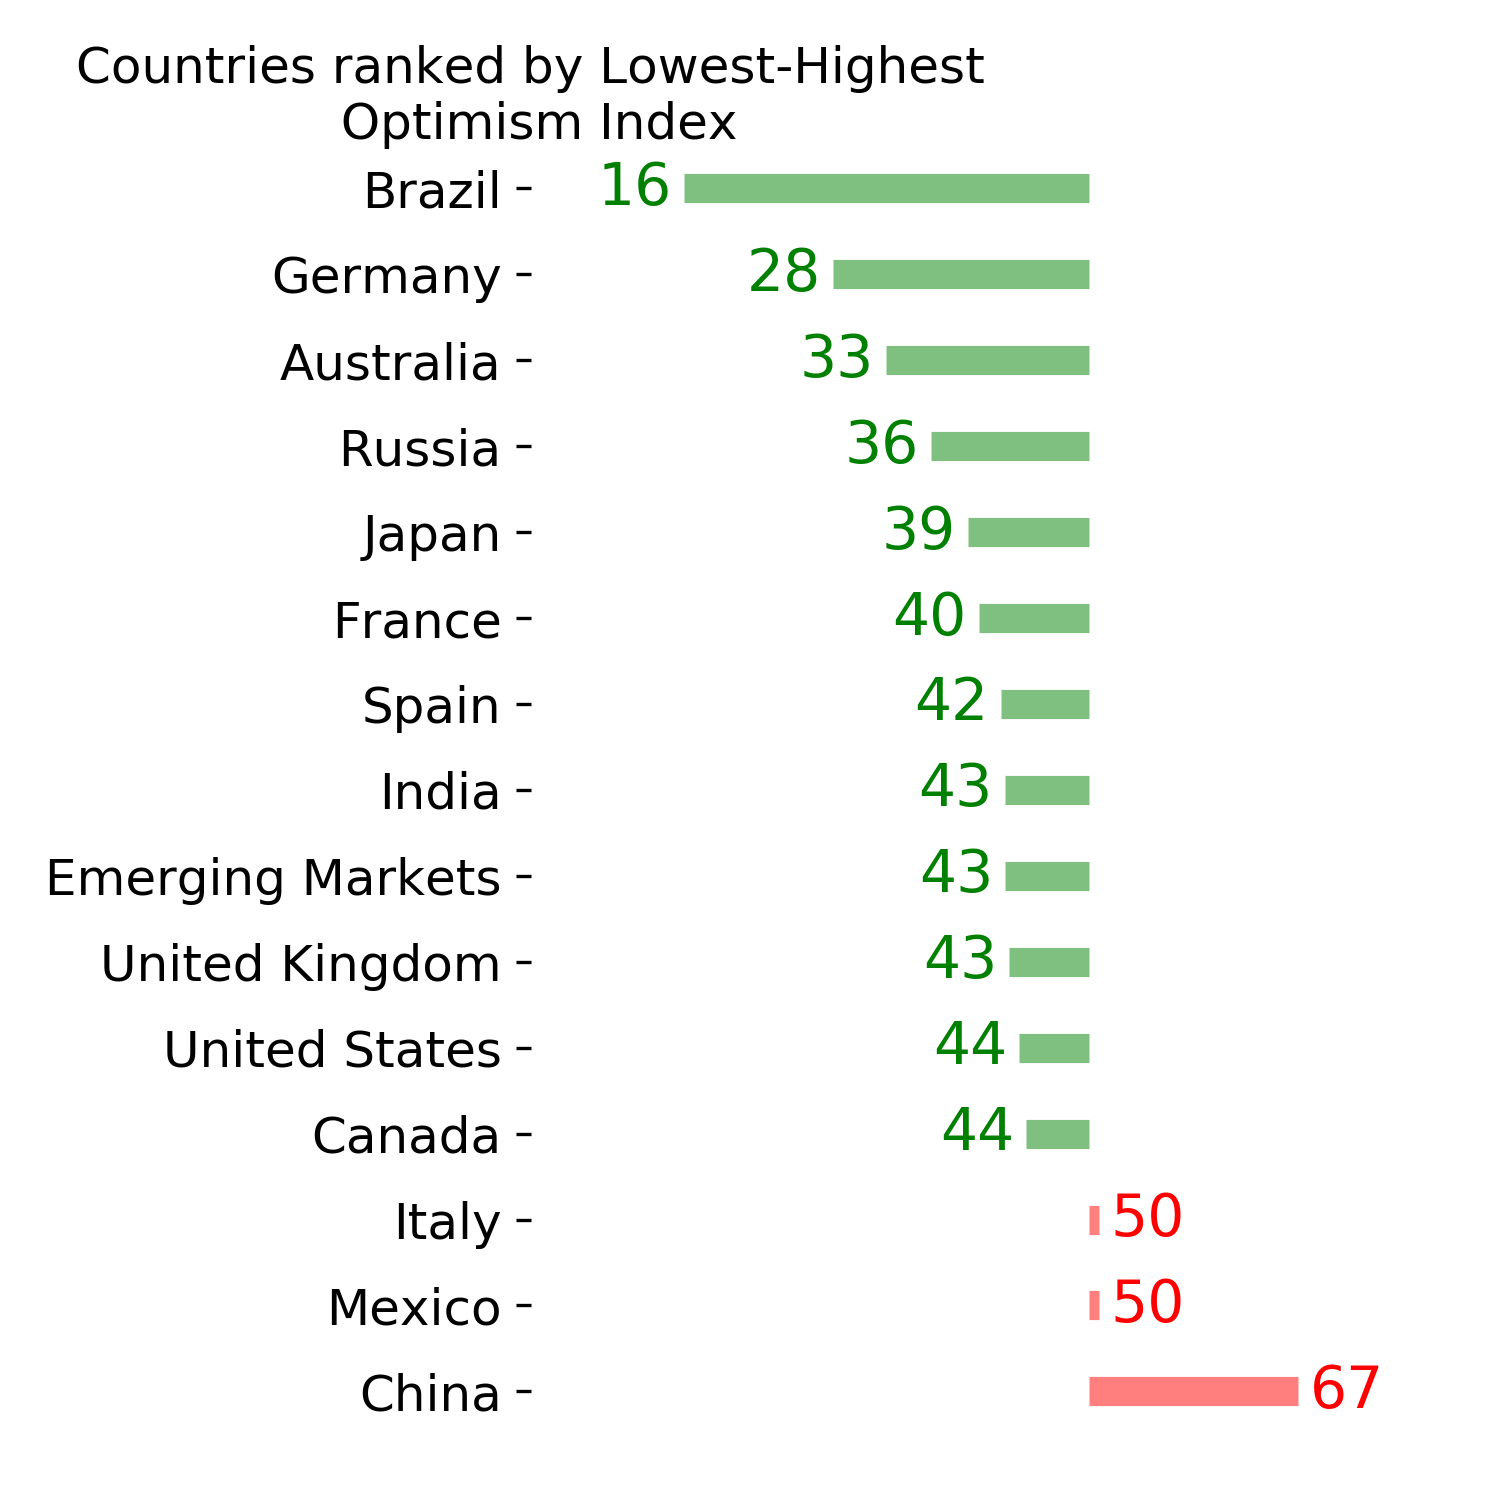
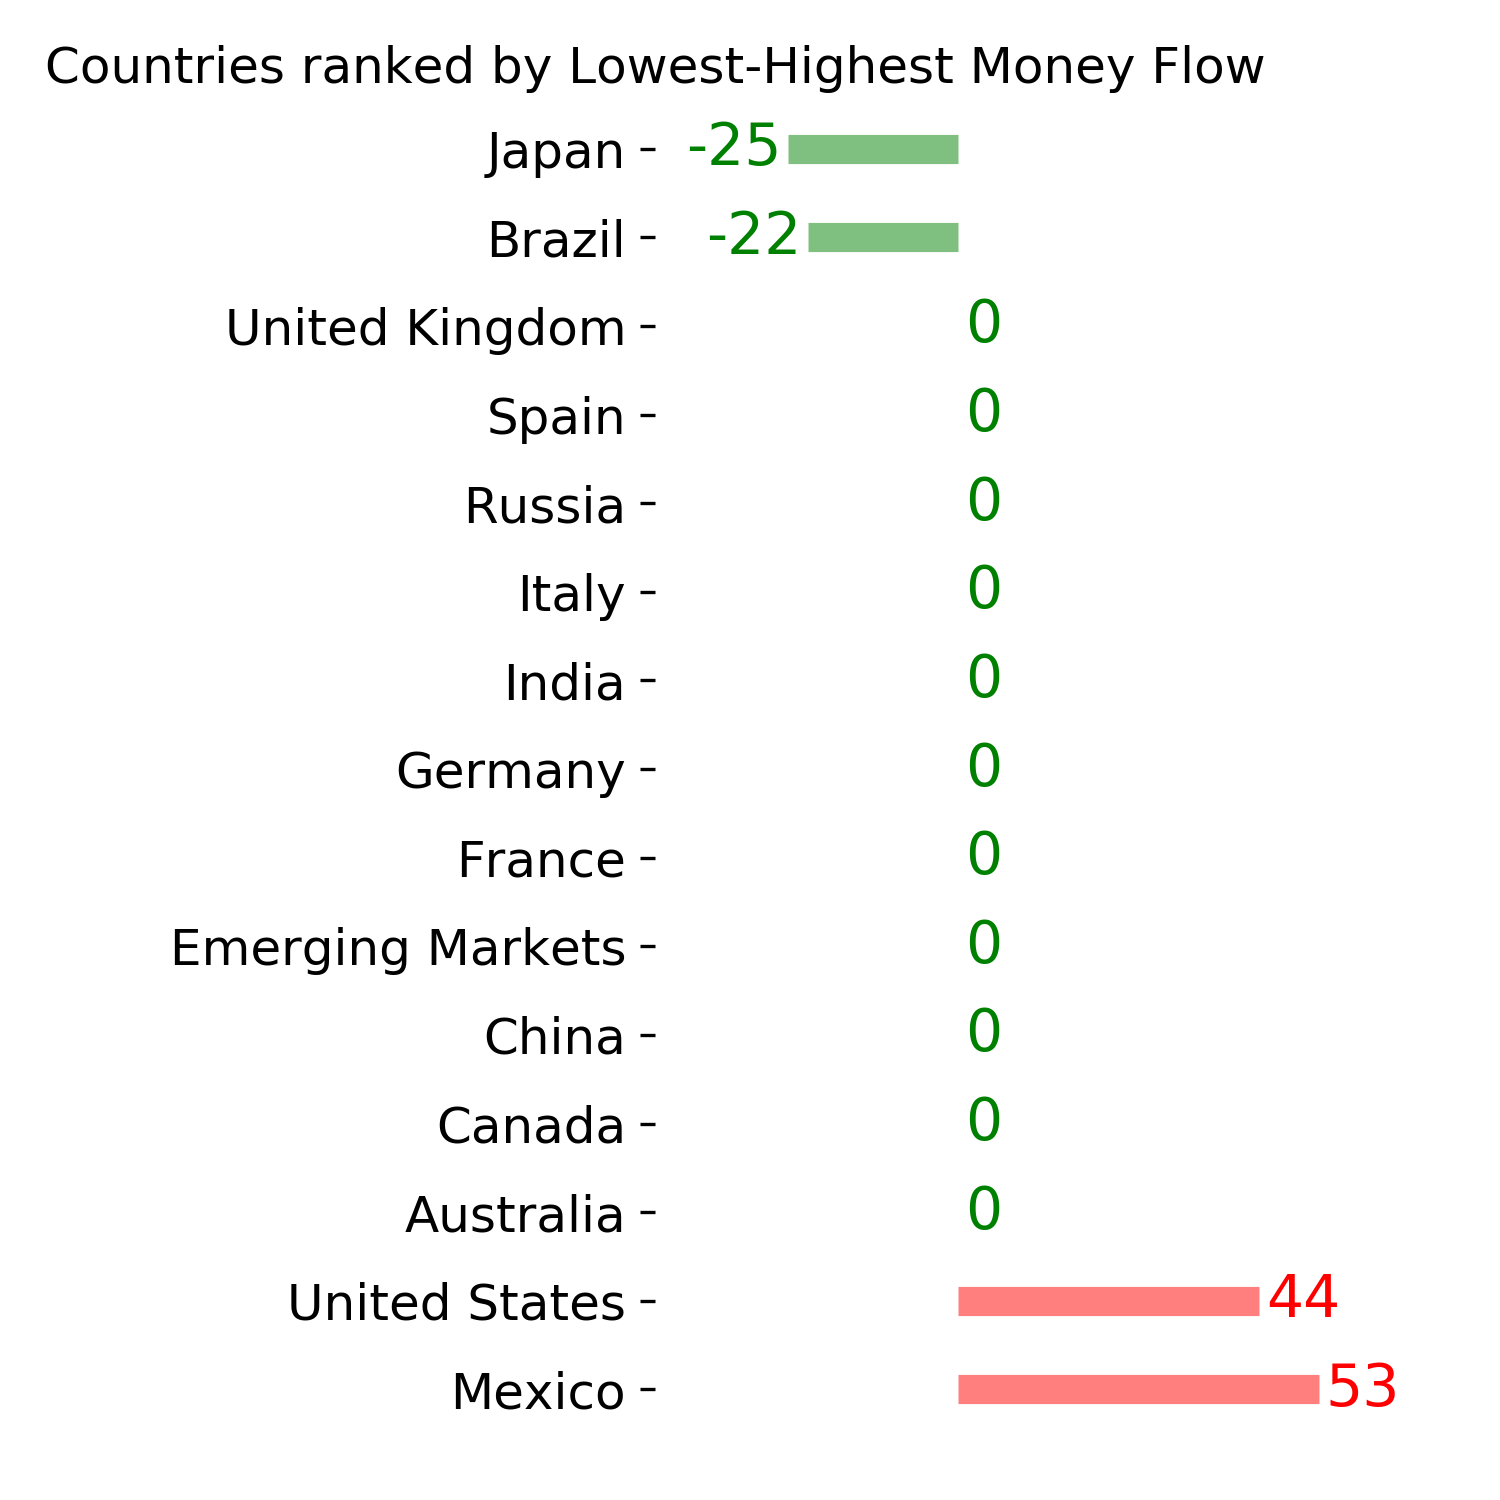
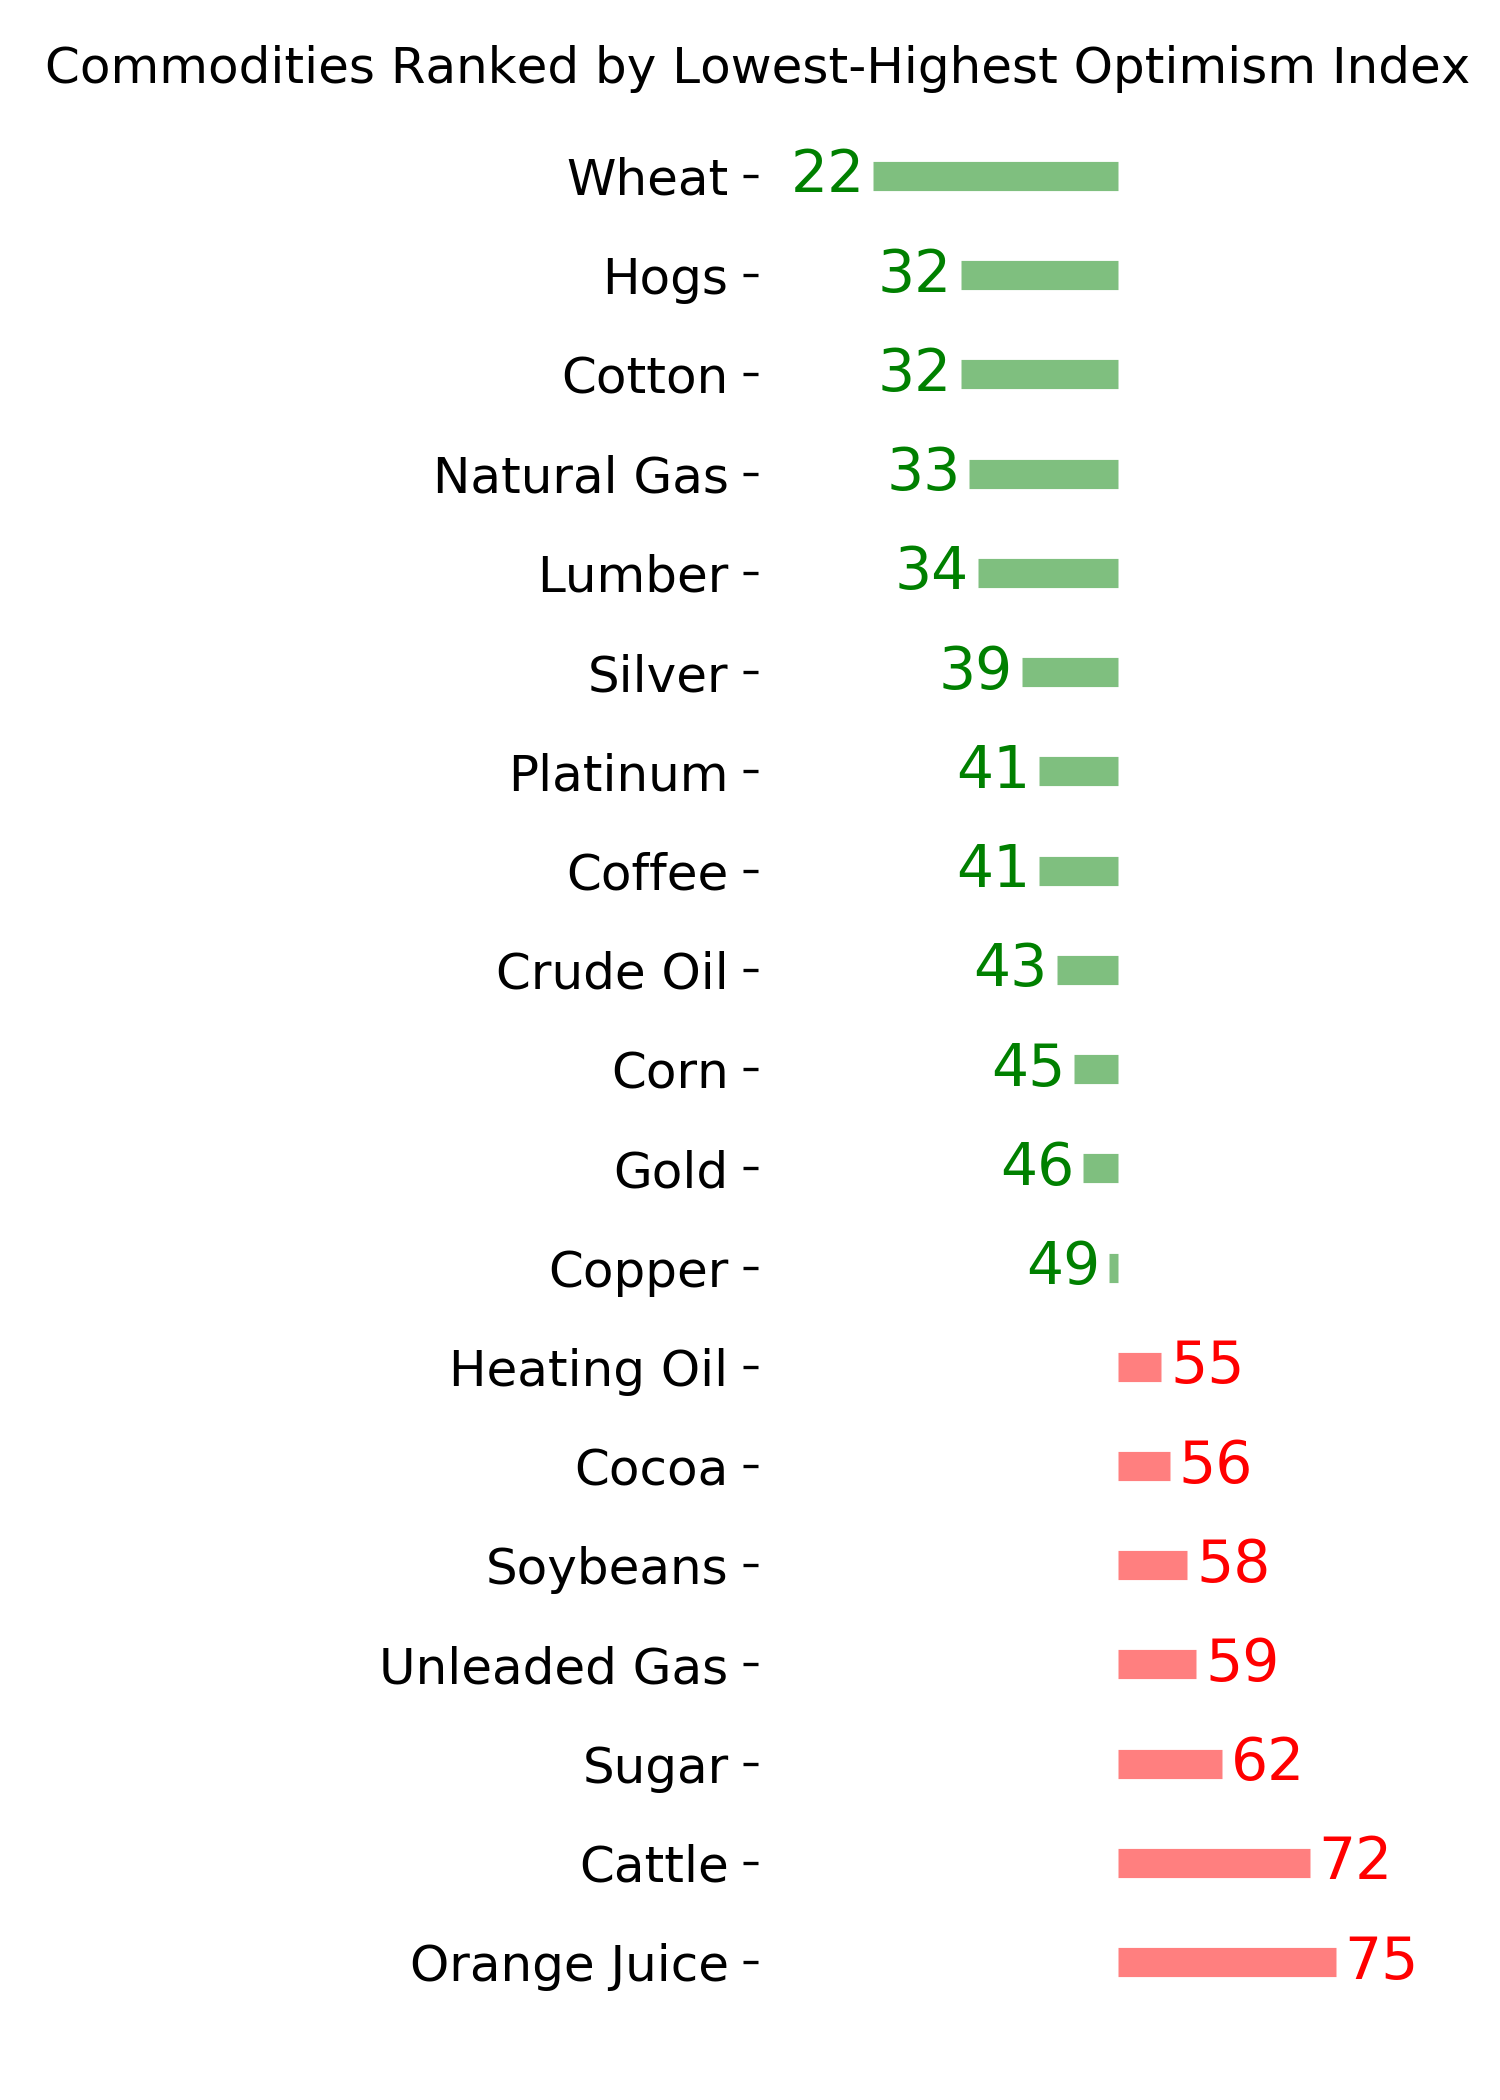
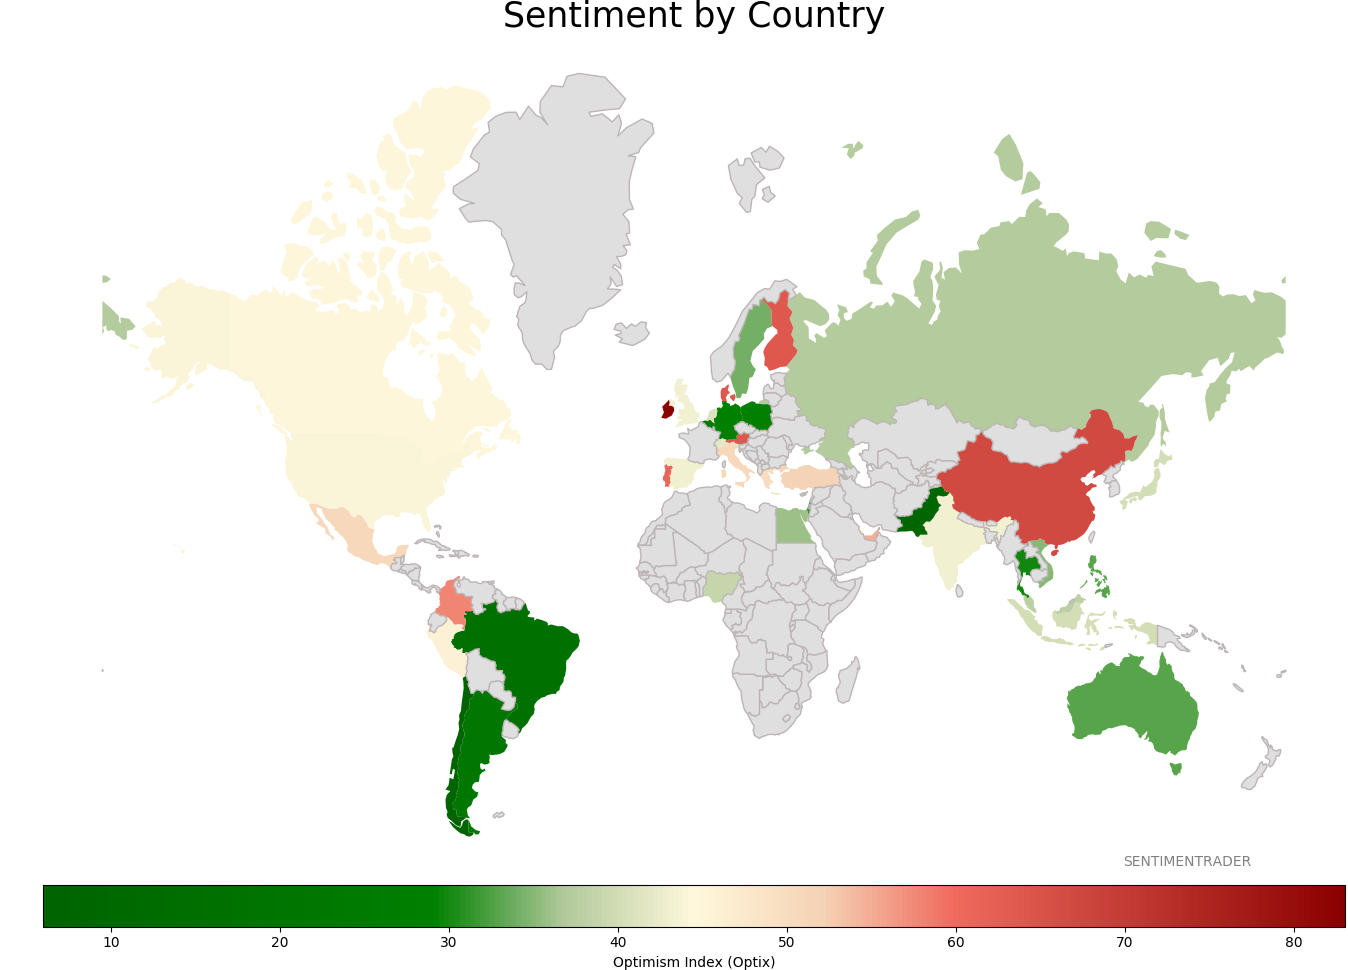
Sentiment Around The World
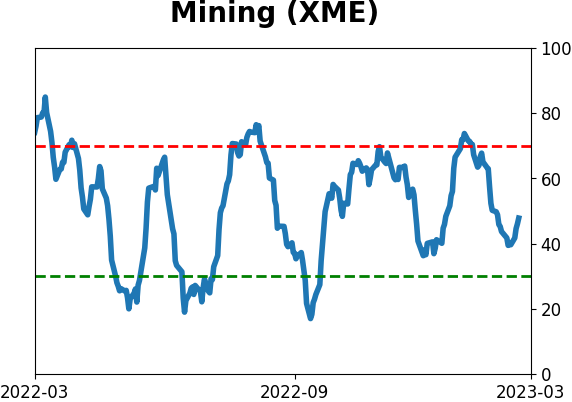
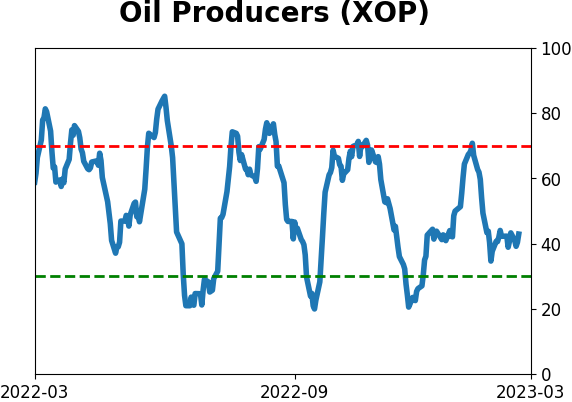
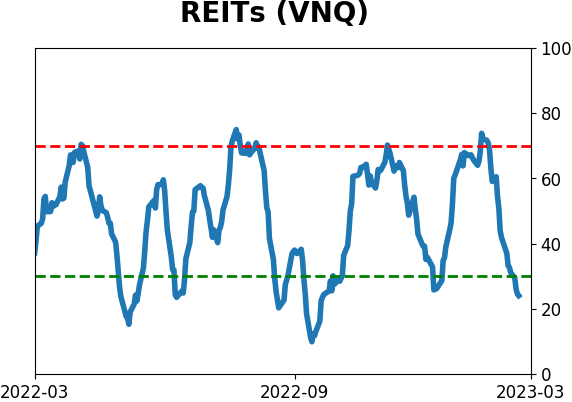
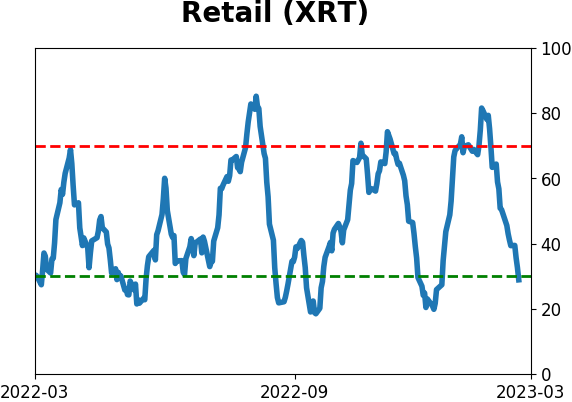
Optimism Index Thumbnails
|
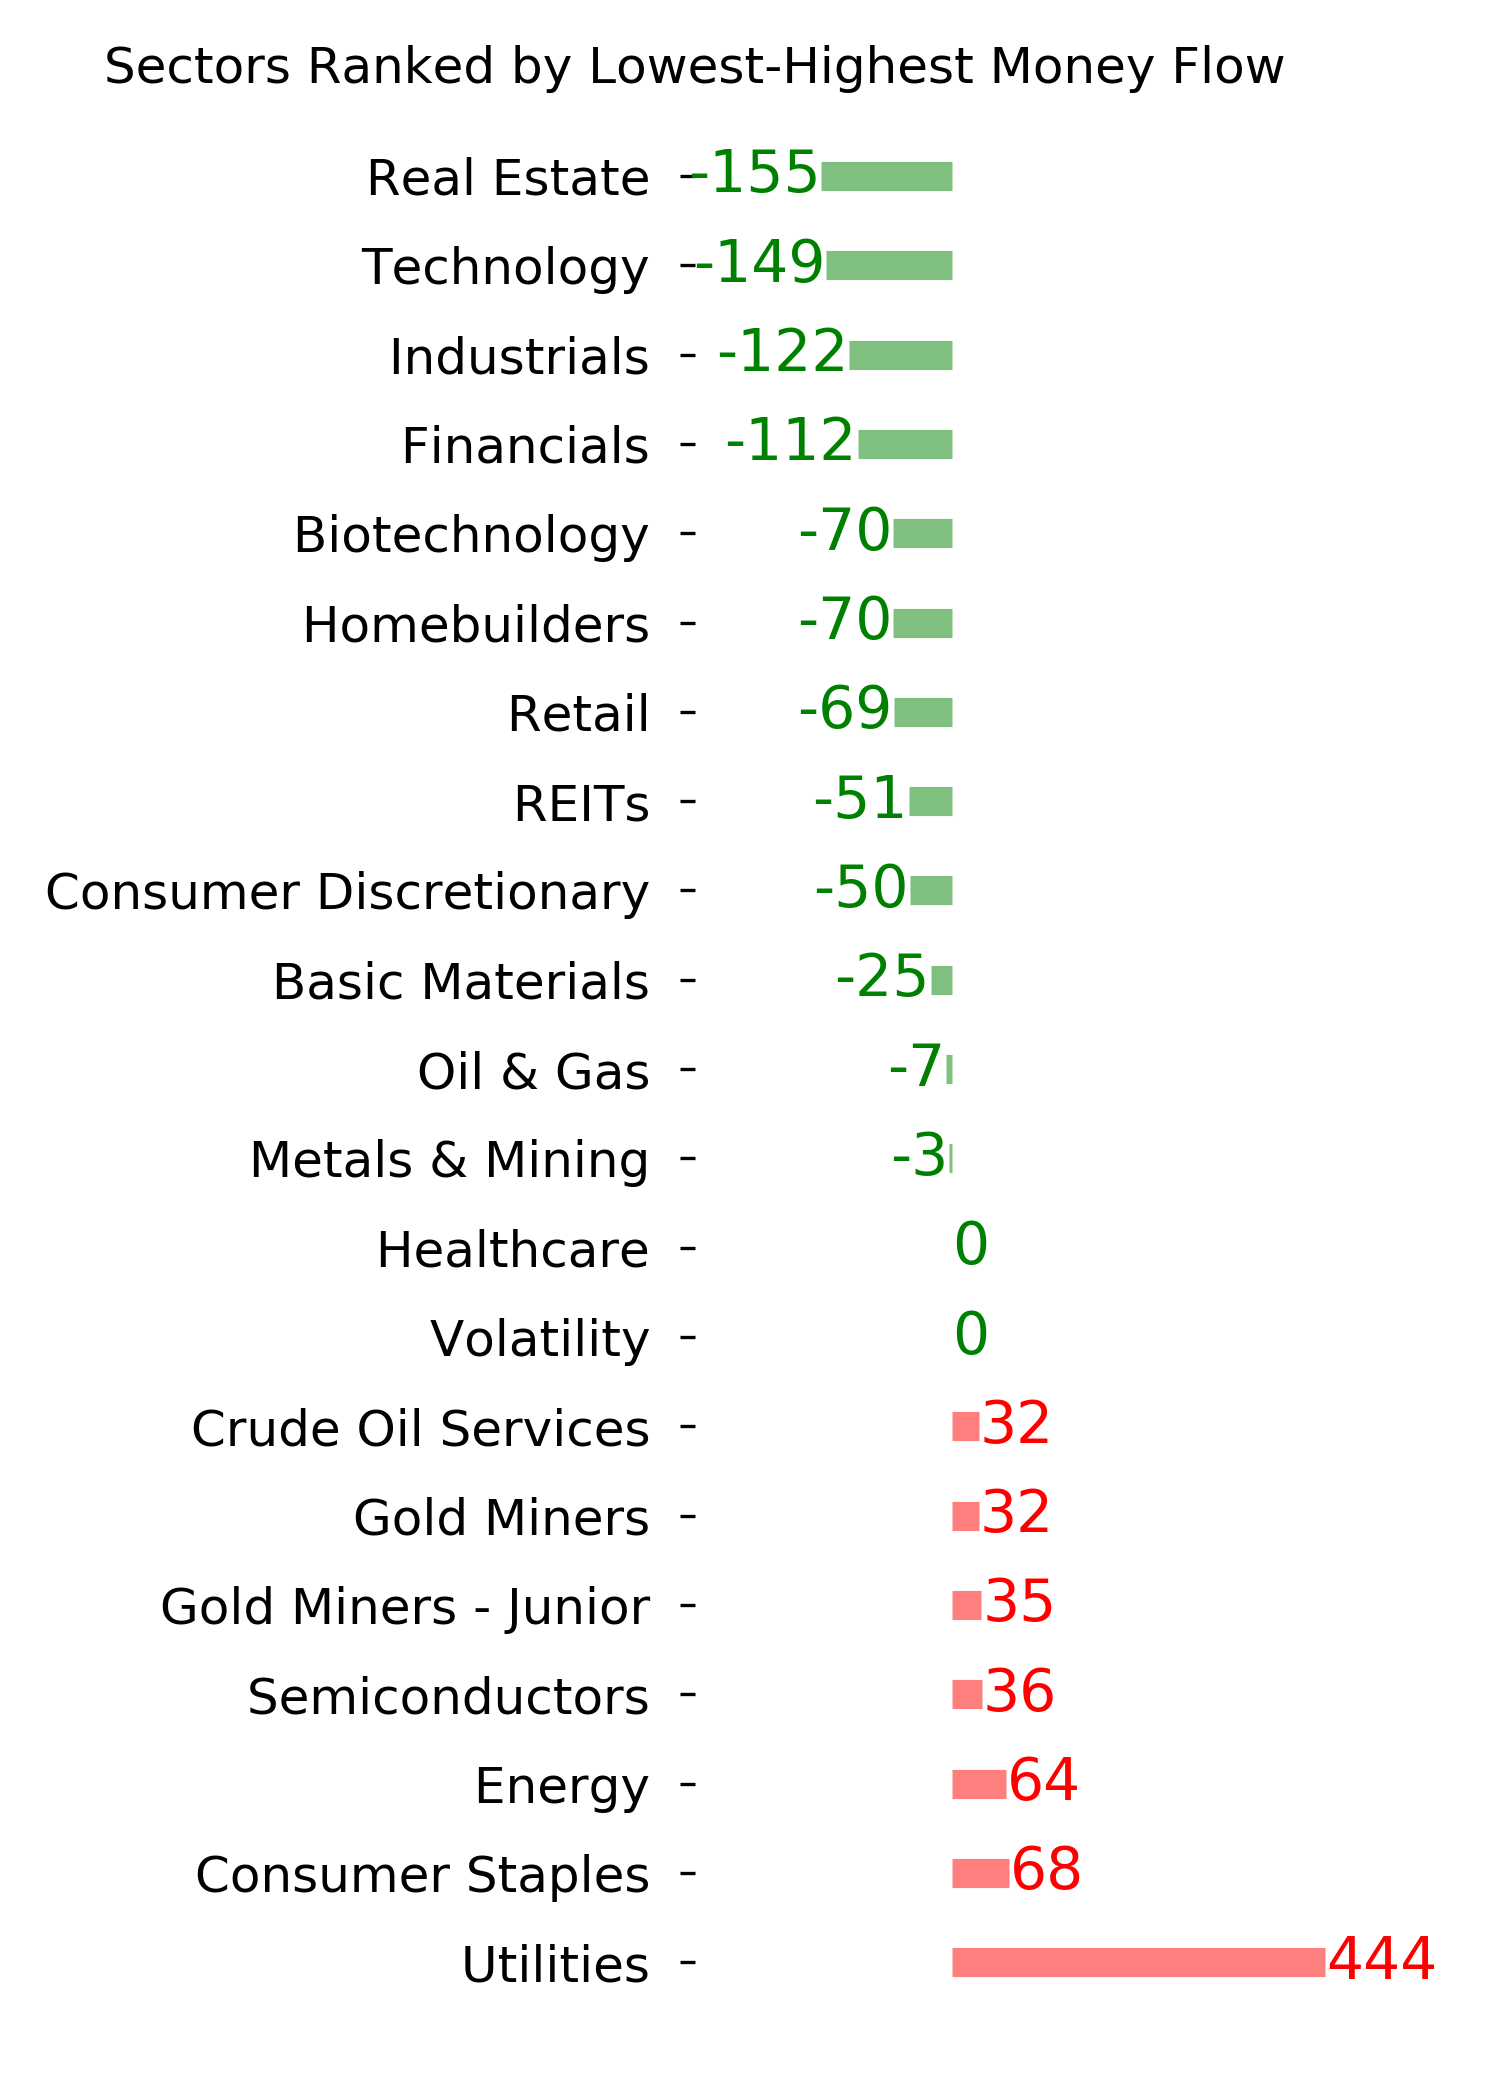
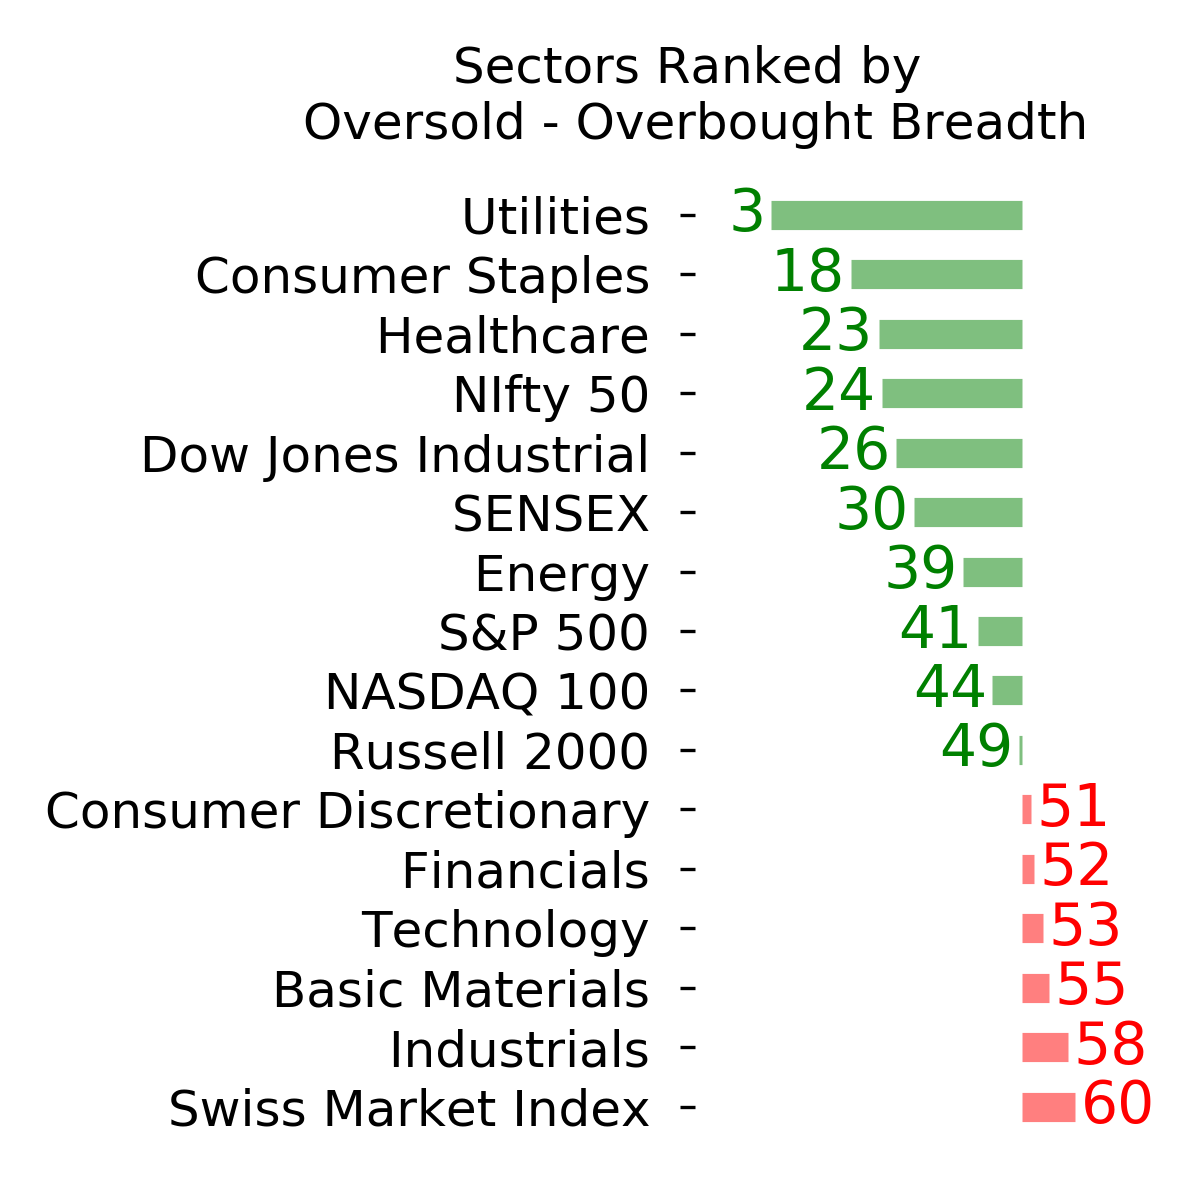
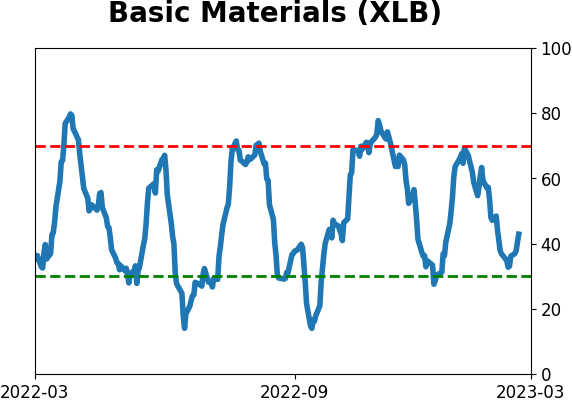
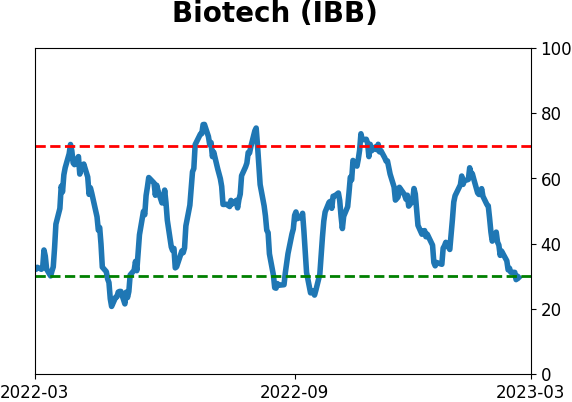
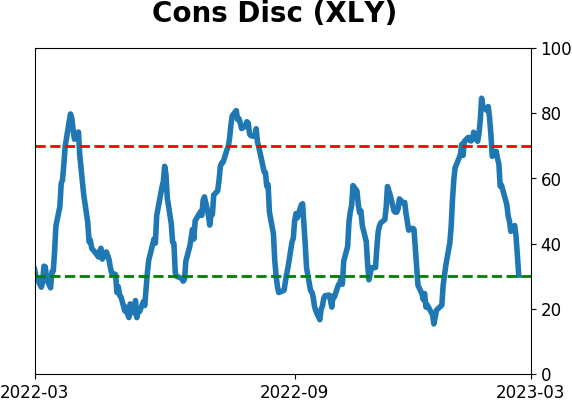
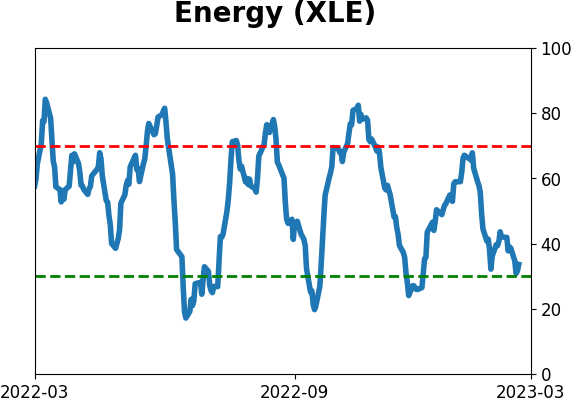
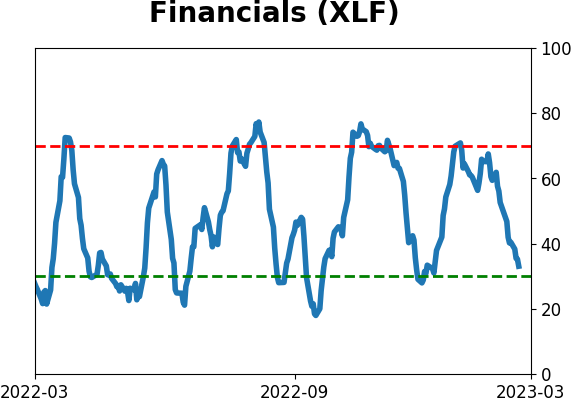
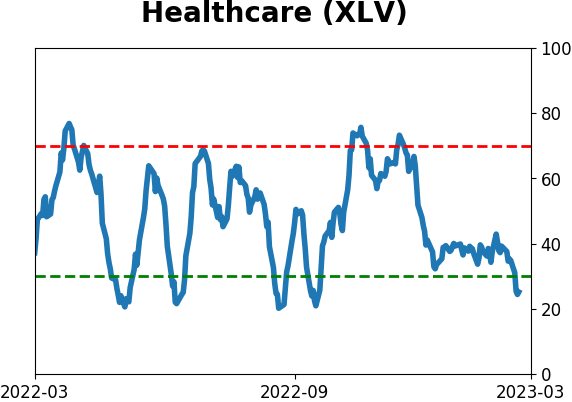
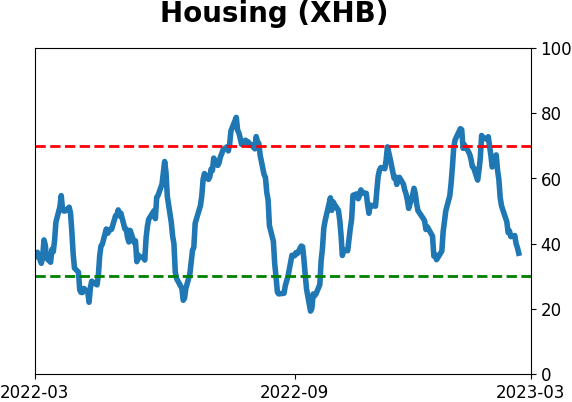
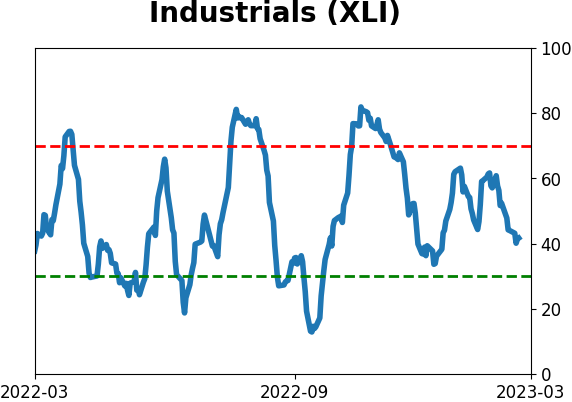
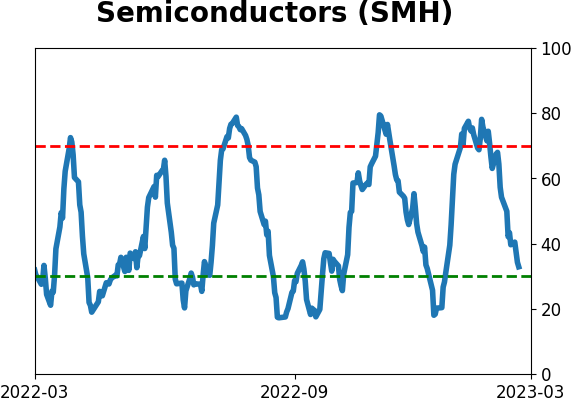
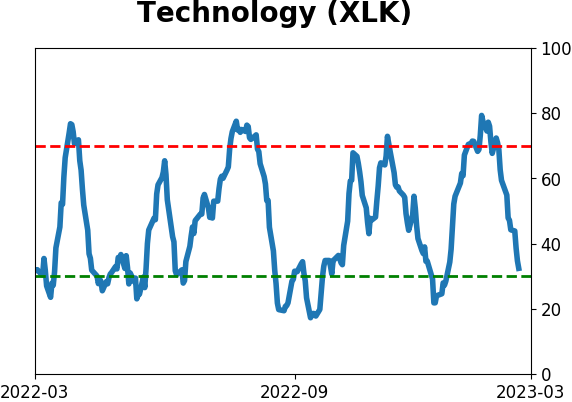
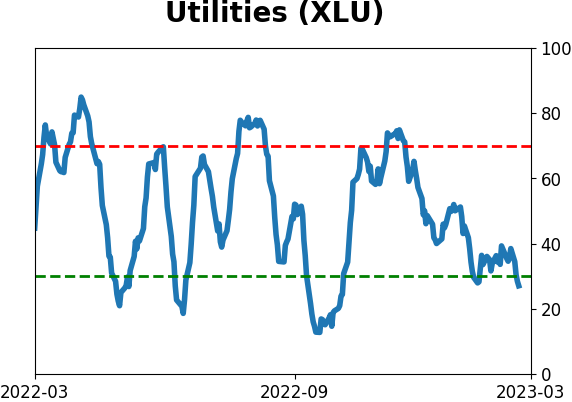
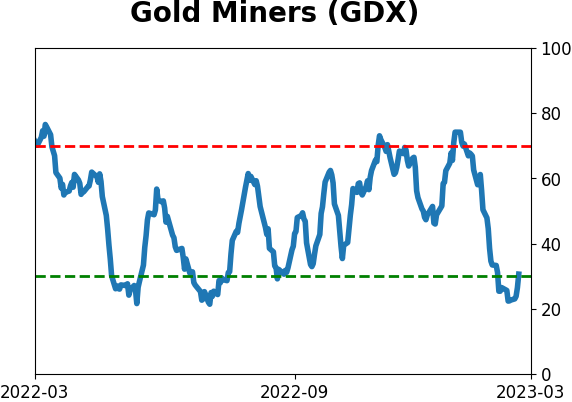
Sector ETF's - 10-Day Moving Average
|
|
|
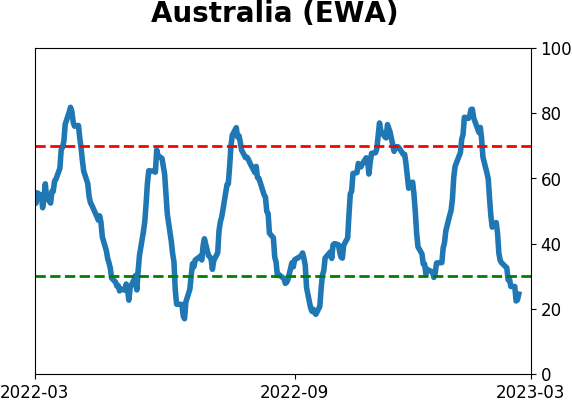
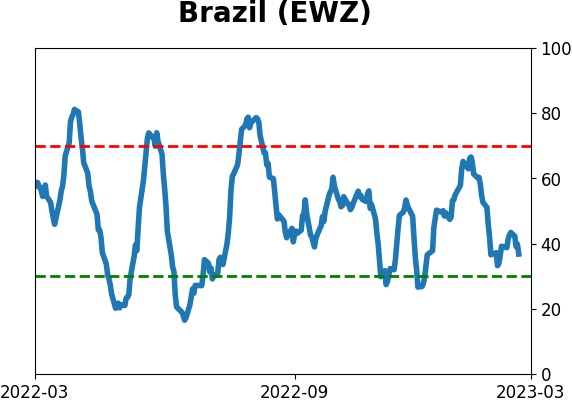
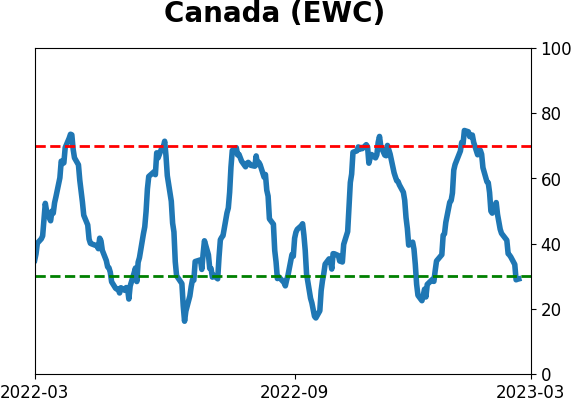
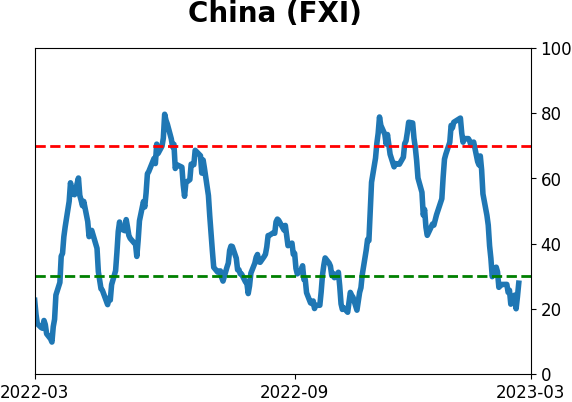
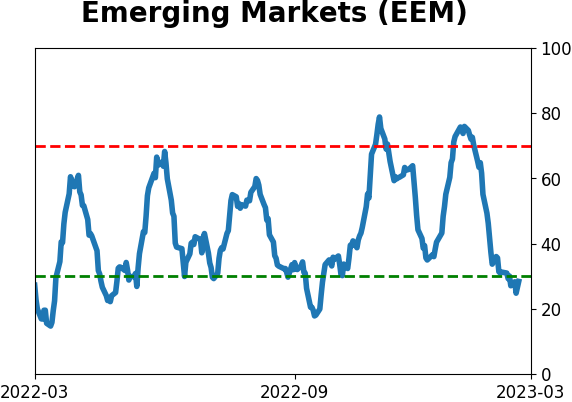
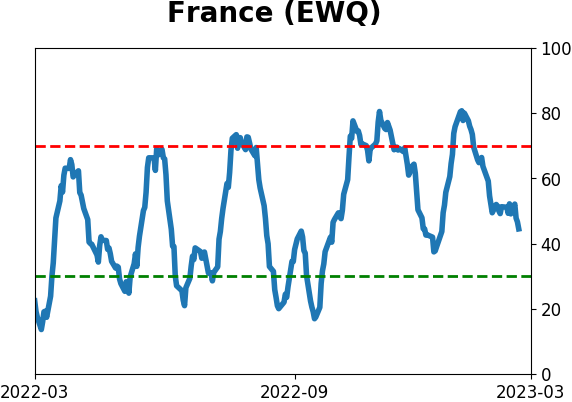
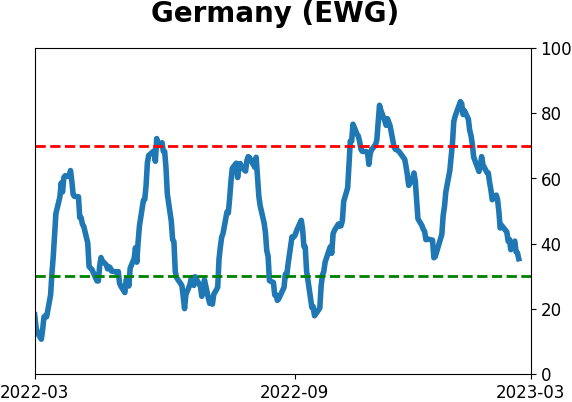
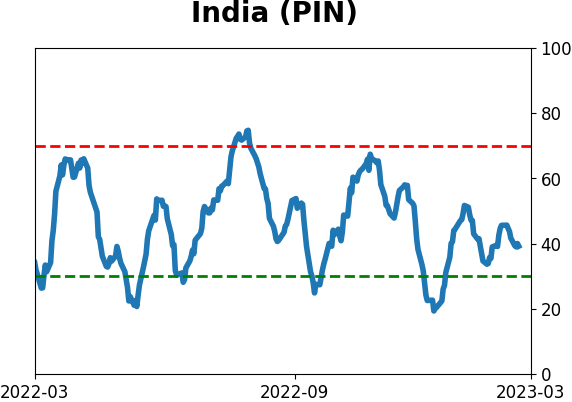
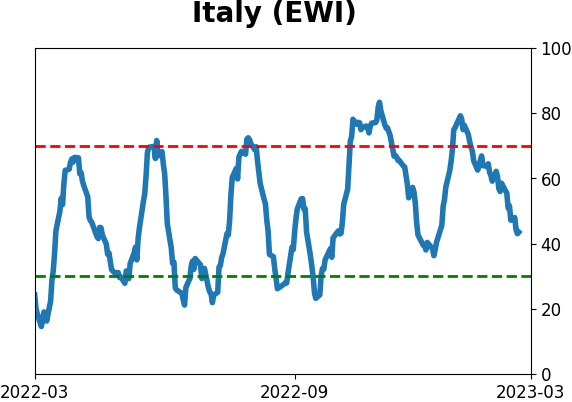
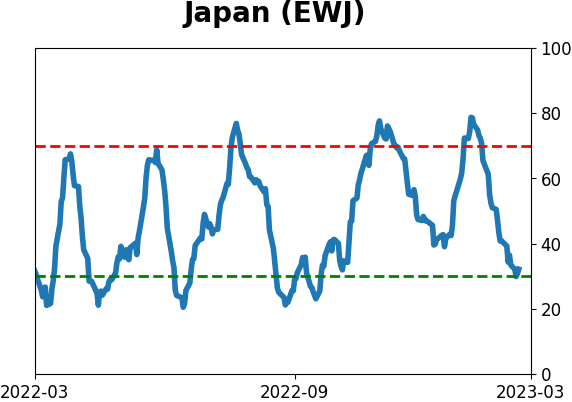
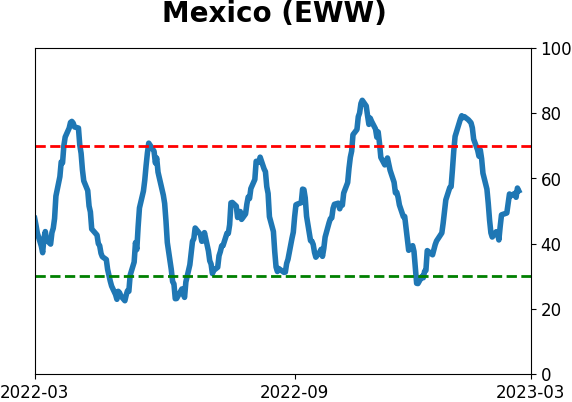
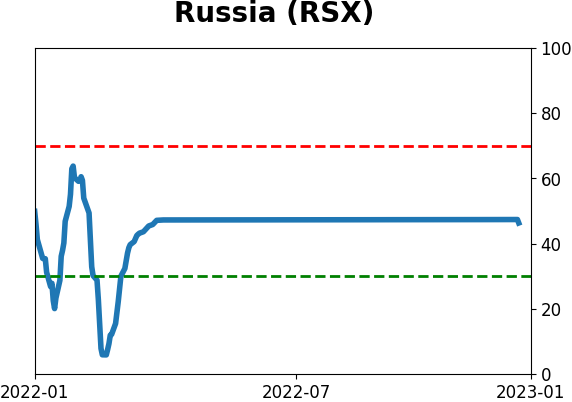
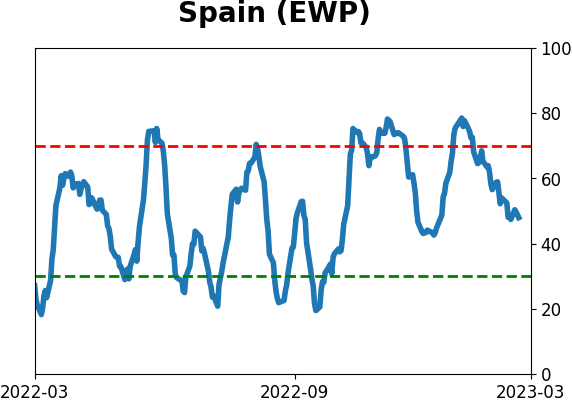
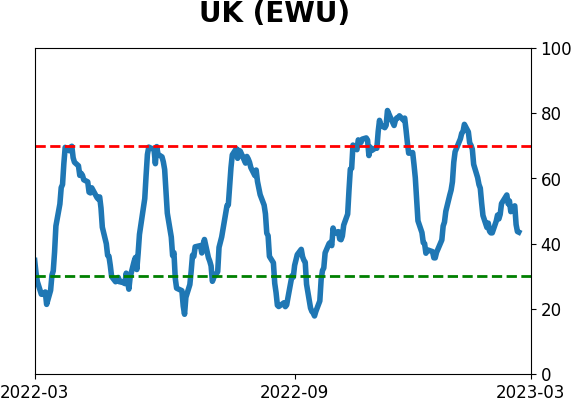
Country ETF's - 10-Day Moving Average
|
|
|
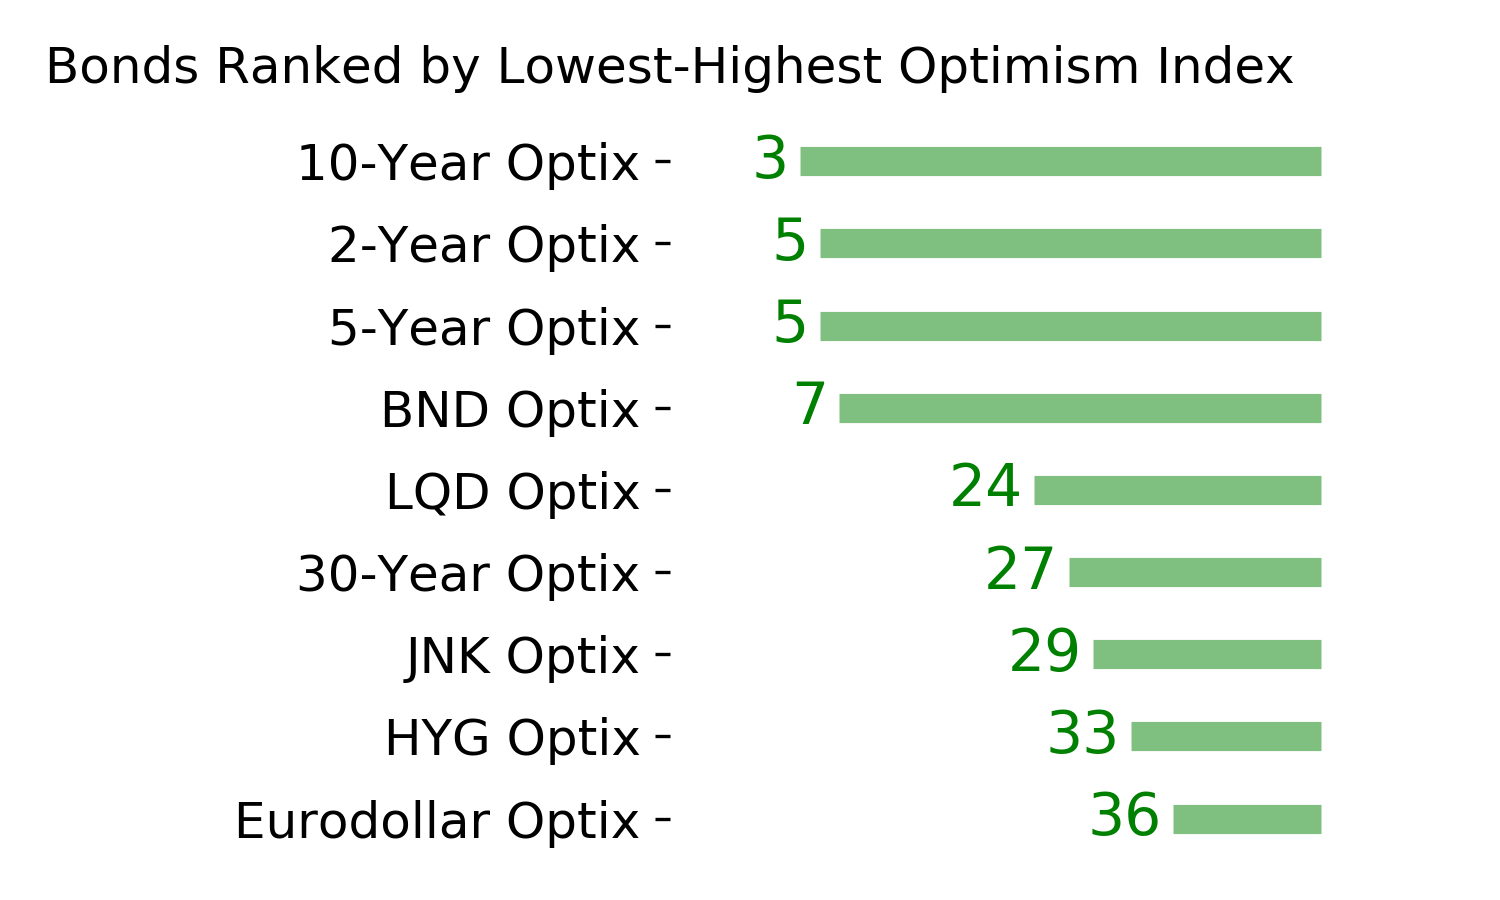
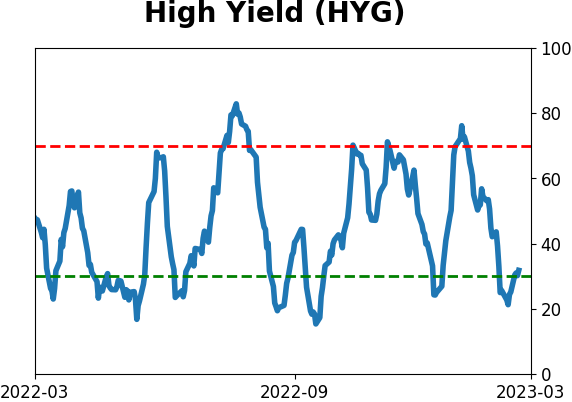
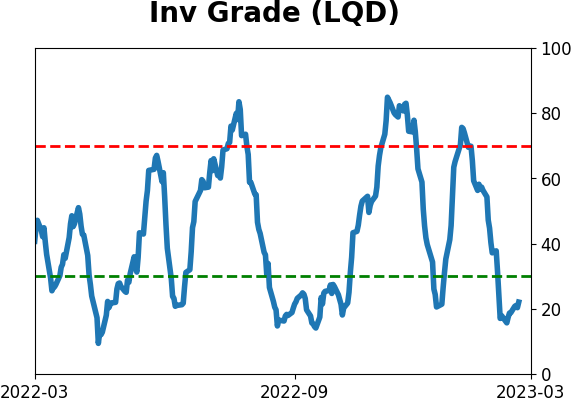
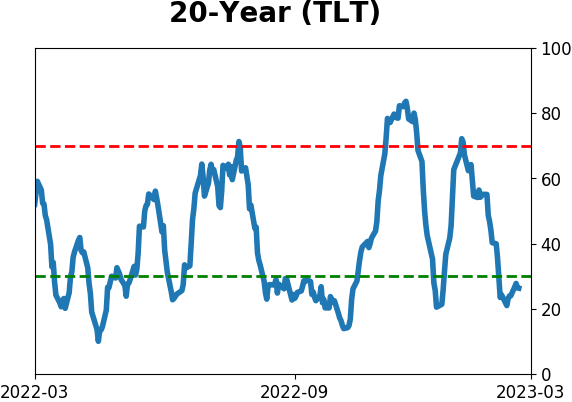
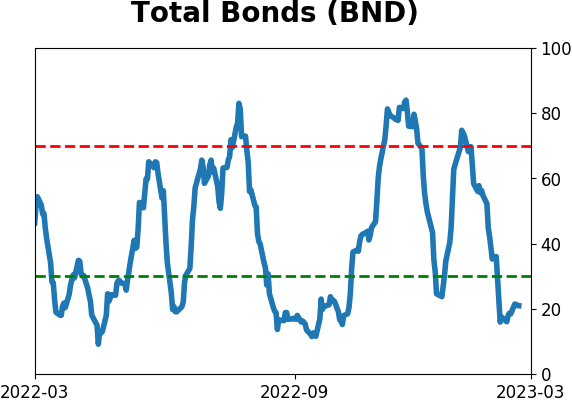
Bond ETF's - 10-Day Moving Average
|
|
|
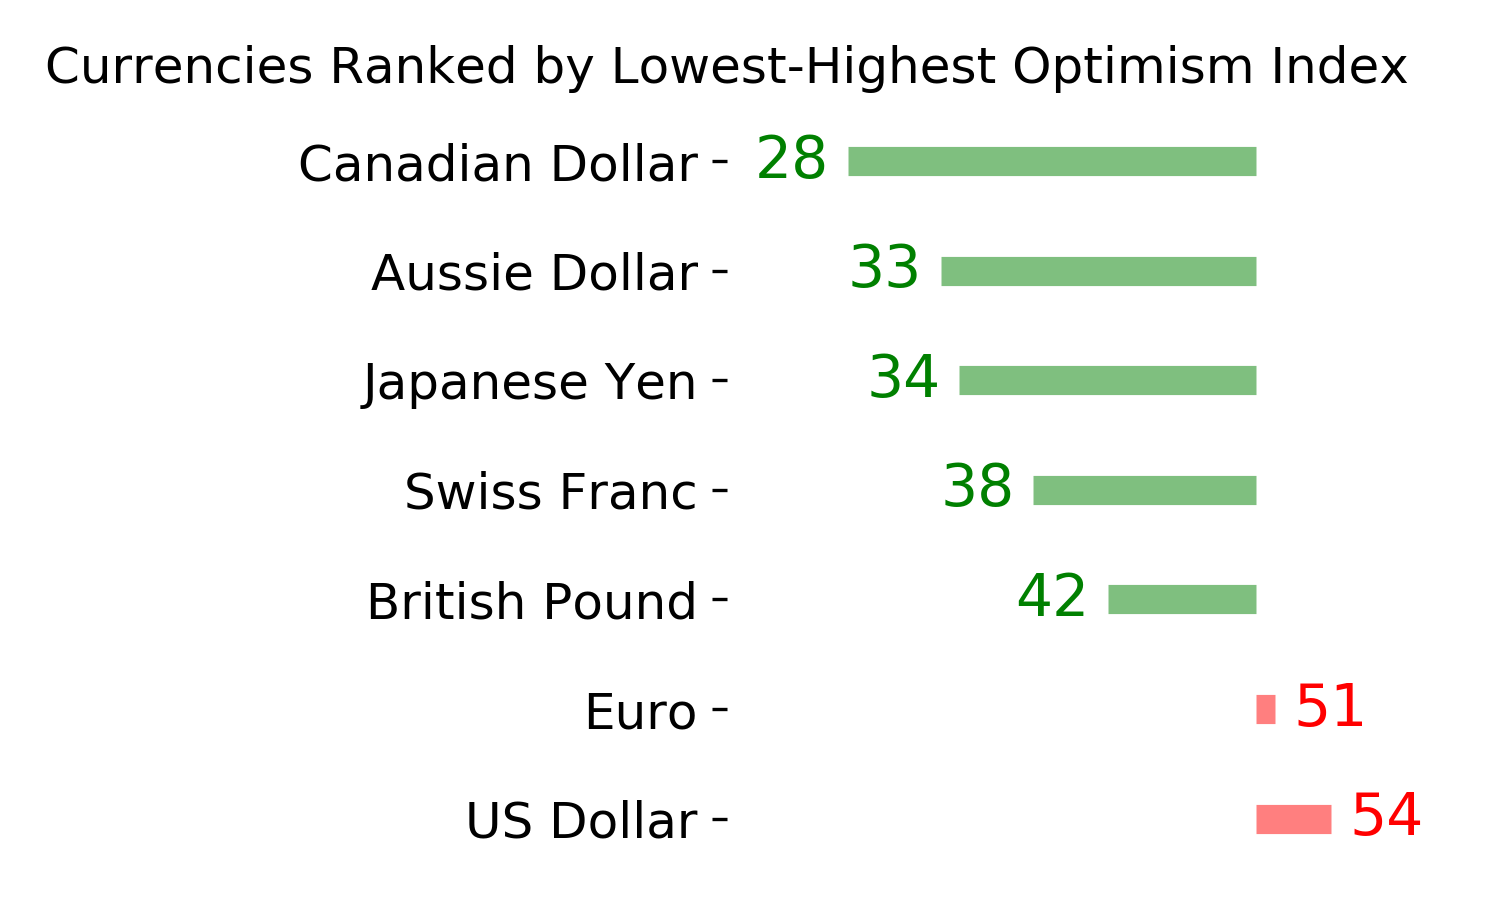
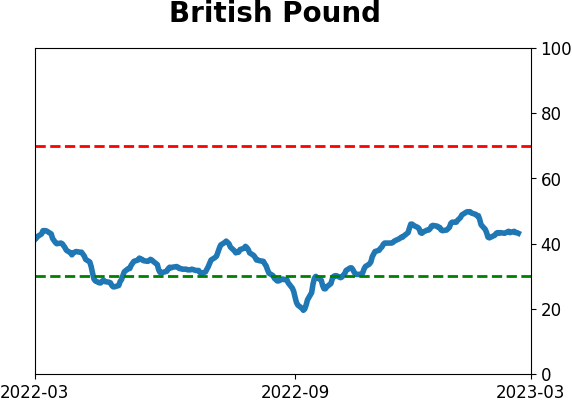
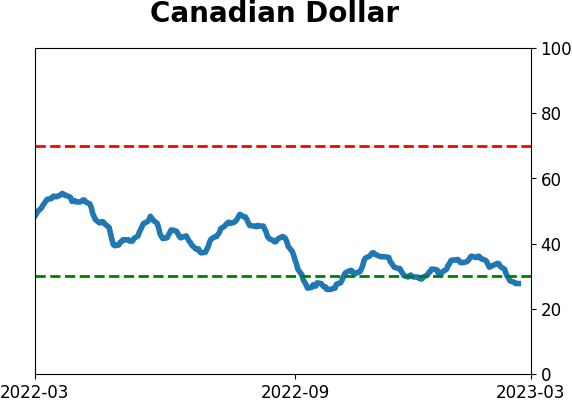
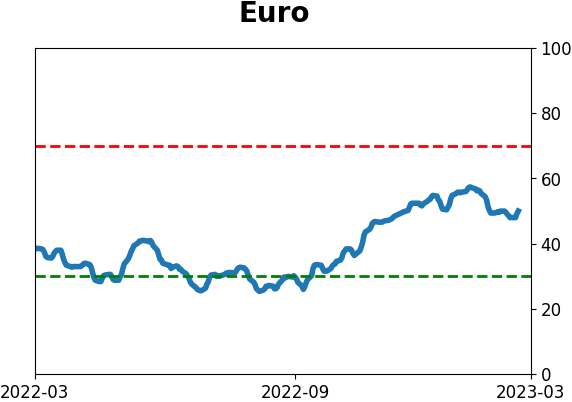
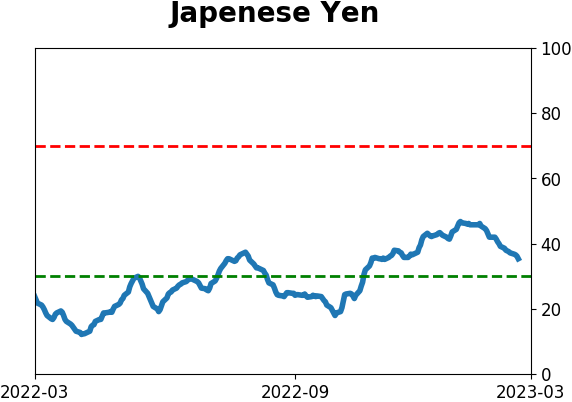
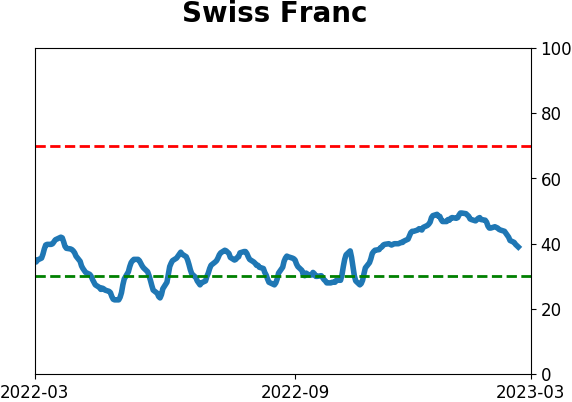
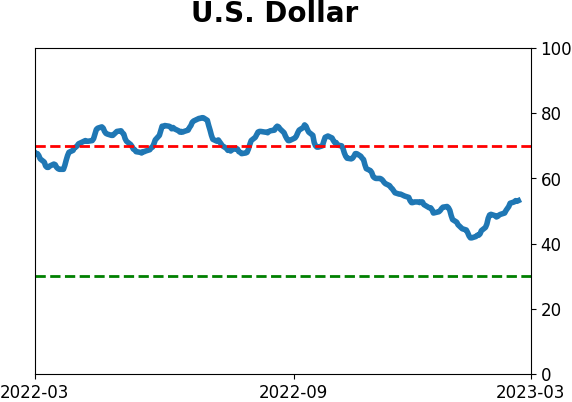
Currency ETF's - 5-Day Moving Average
|
|
|
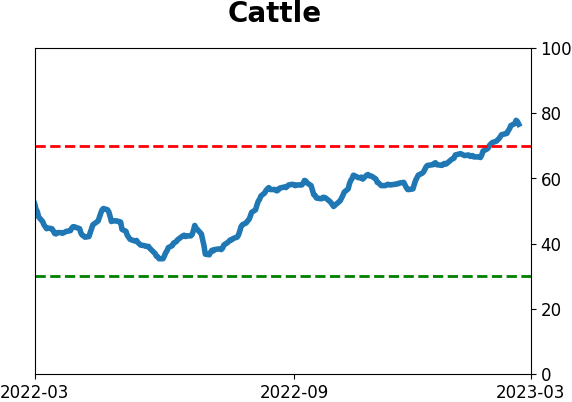
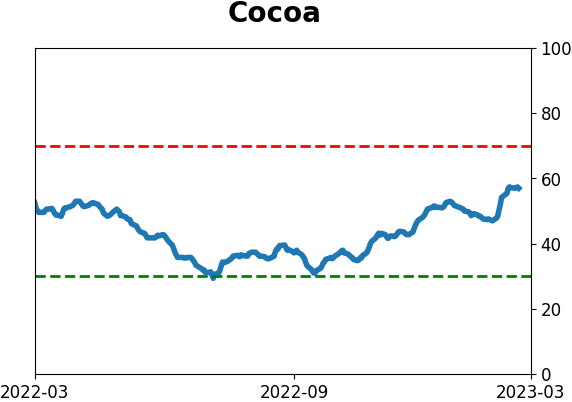
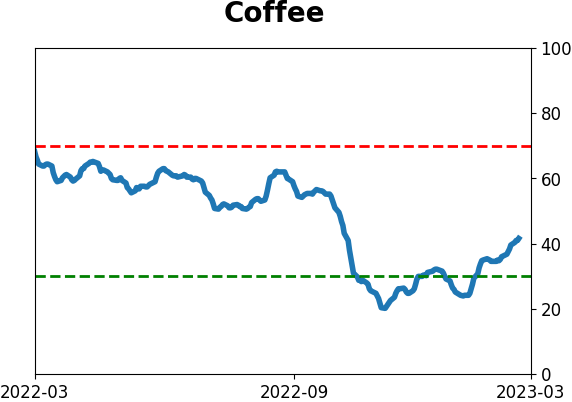
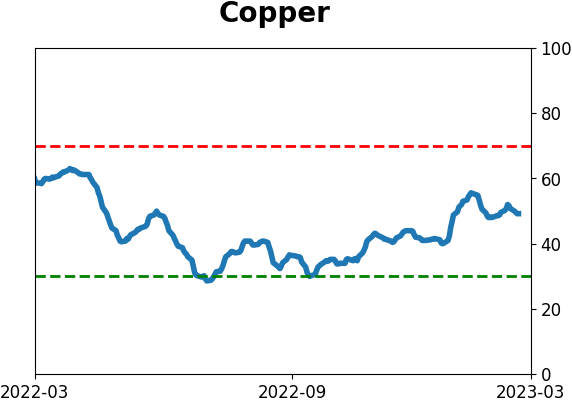
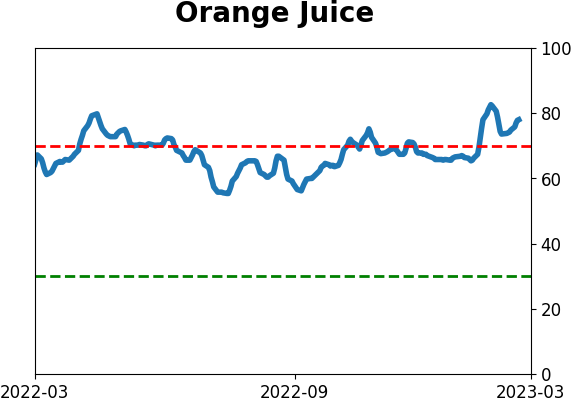
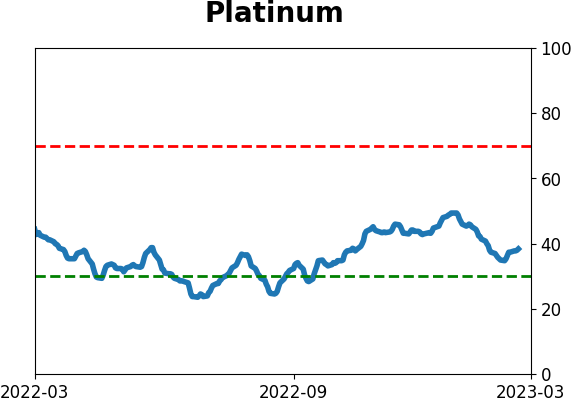
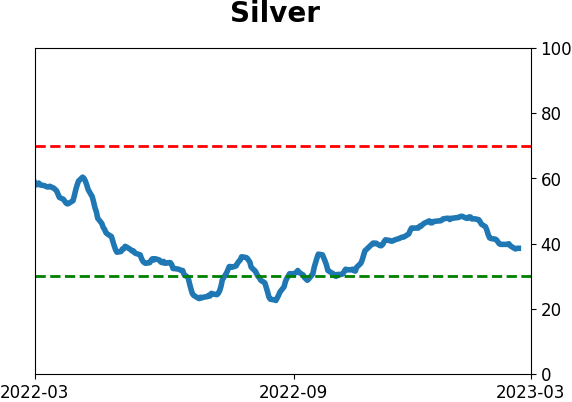
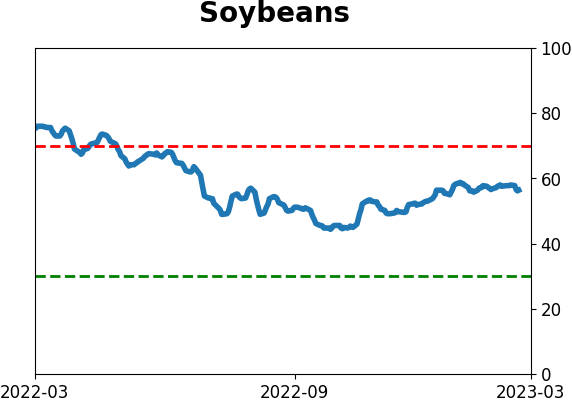
Commodity ETF's - 5-Day Moving Average
|
|