Headlines
|
|
The Panic Button has NOT been pressed:
There are a bevy of concerns buffetting investors, but they aren't panicking. There is widespread evidence of pessimism, but not outright panic. The Panic Button indicator that spike in 2015-16 and 2020 has barely budged. That has been a good sign as the S&P 500 has entered corrections.
|
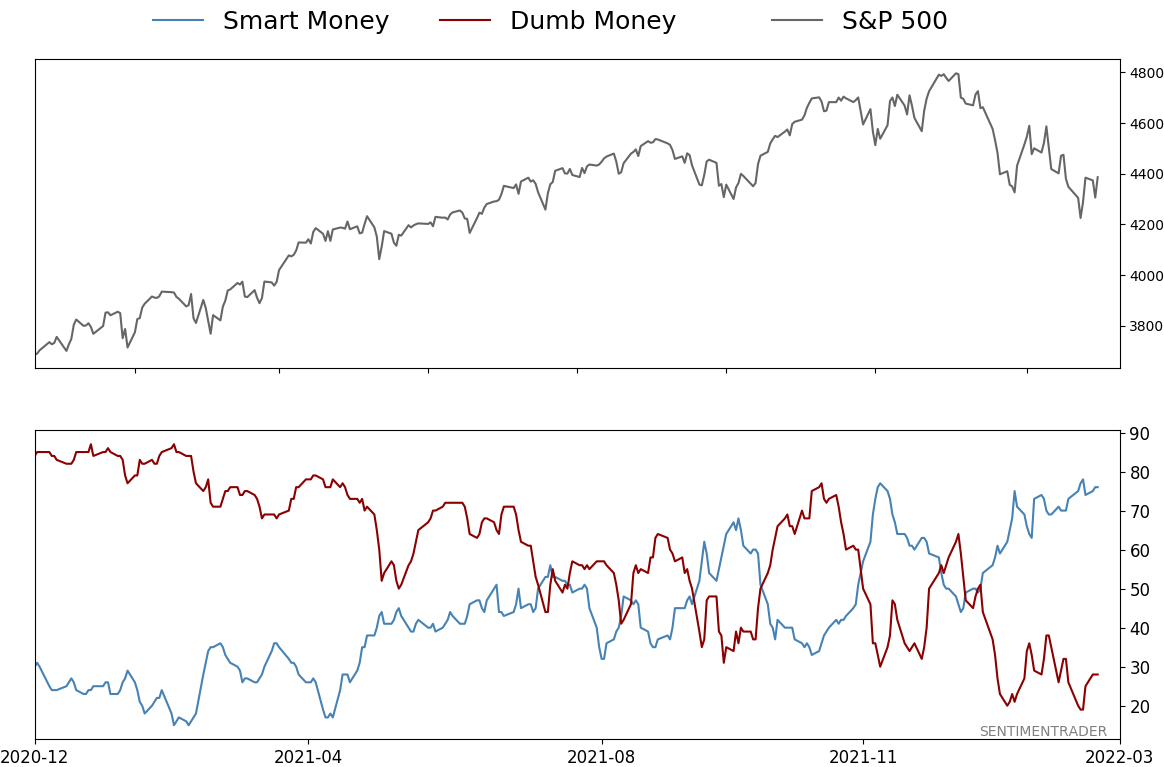
Smart / Dumb Money Confidence
|
Smart Money Confidence: 76%
Dumb Money Confidence: 28%
|
|
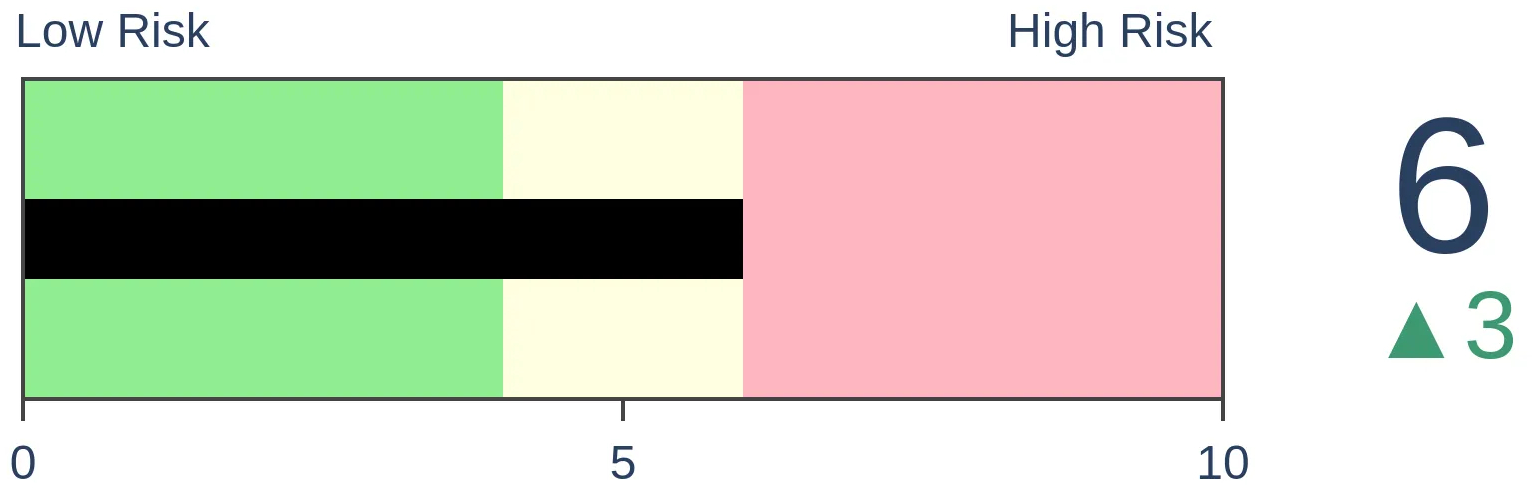
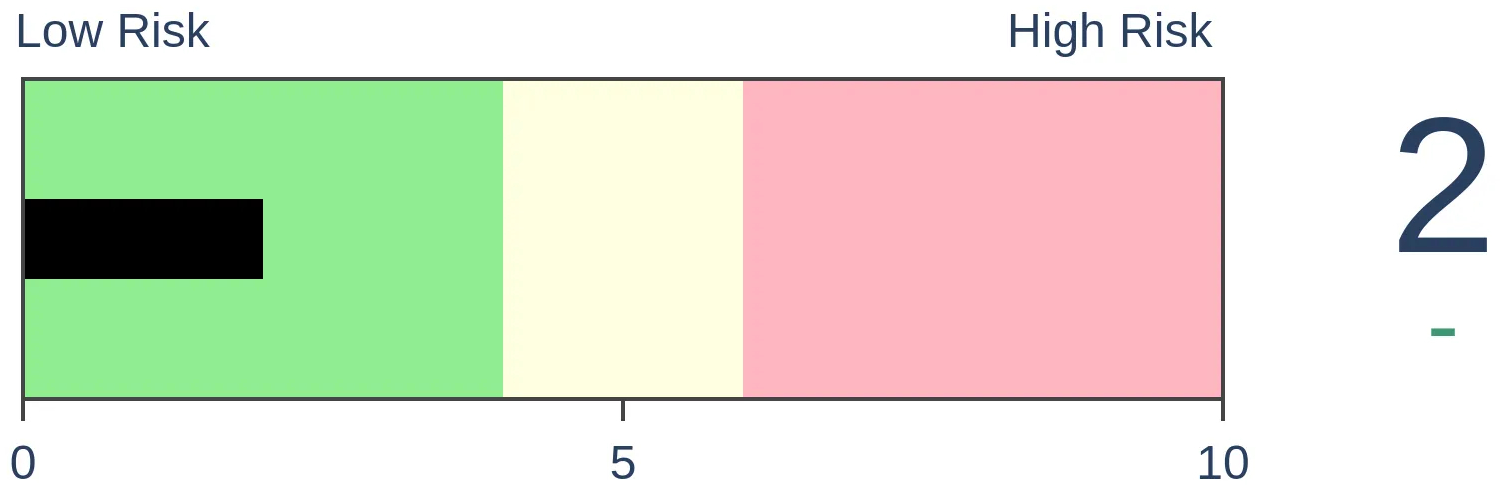
Risk Levels
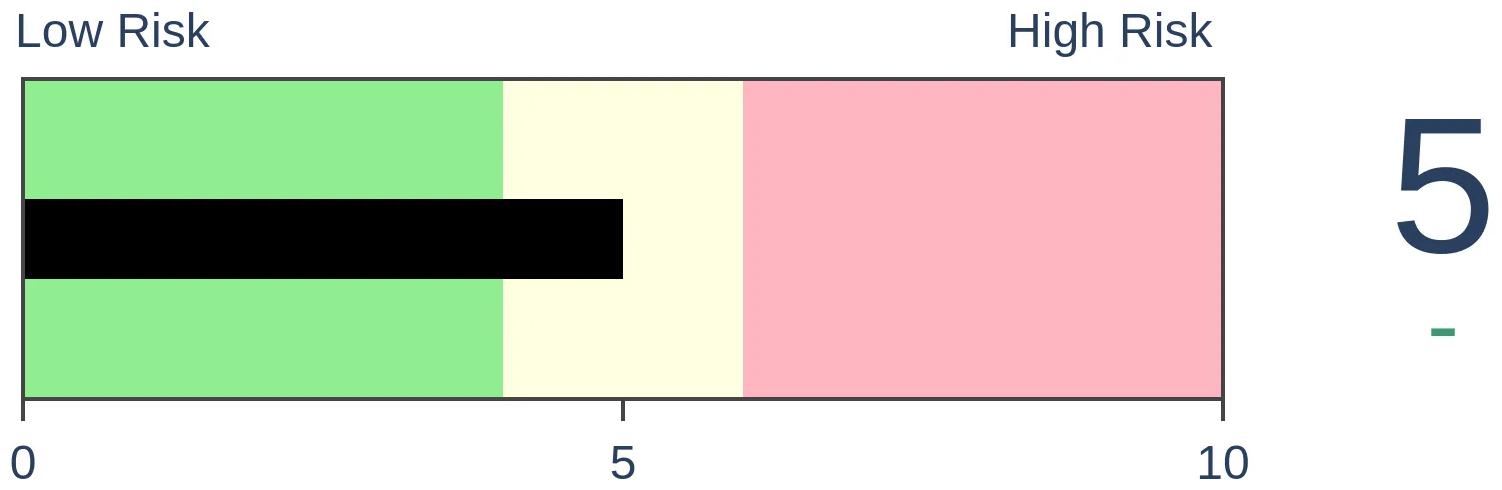
Stocks Short-Term
|
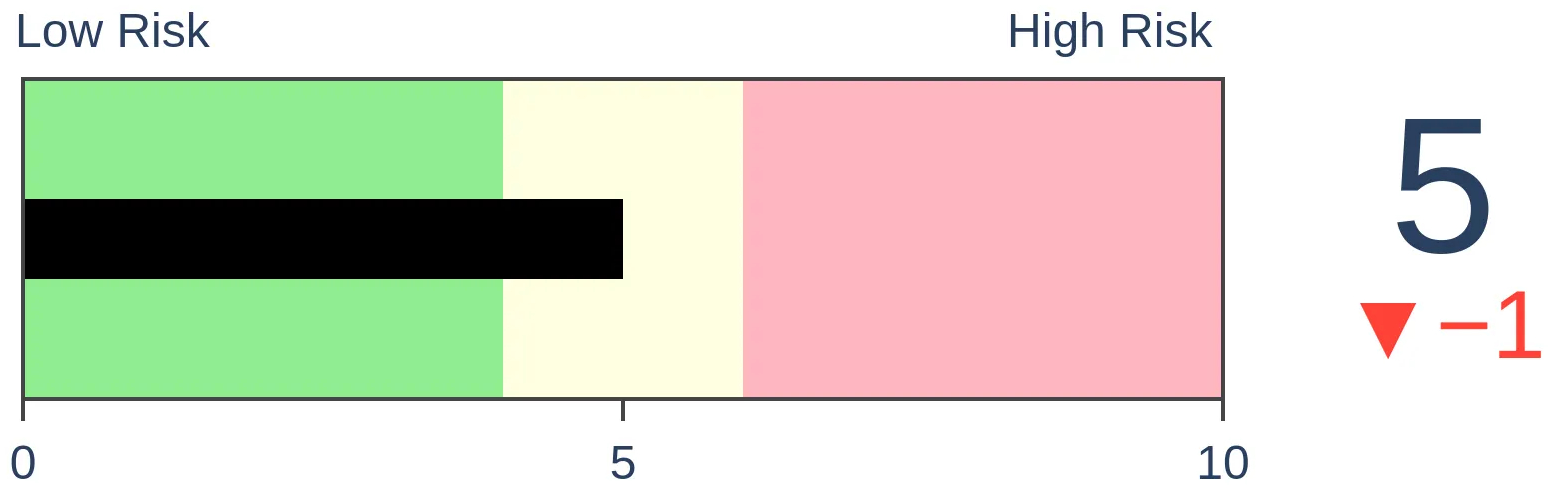
Stocks Medium-Term
|
|
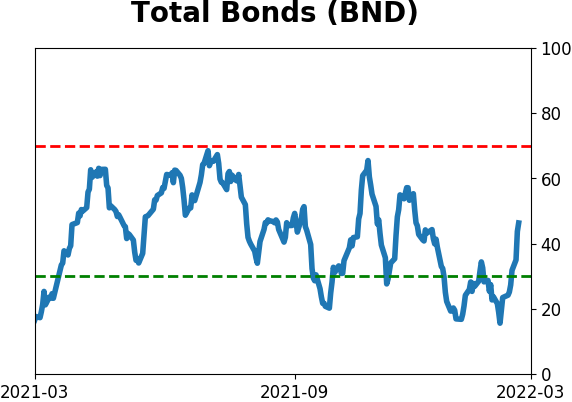
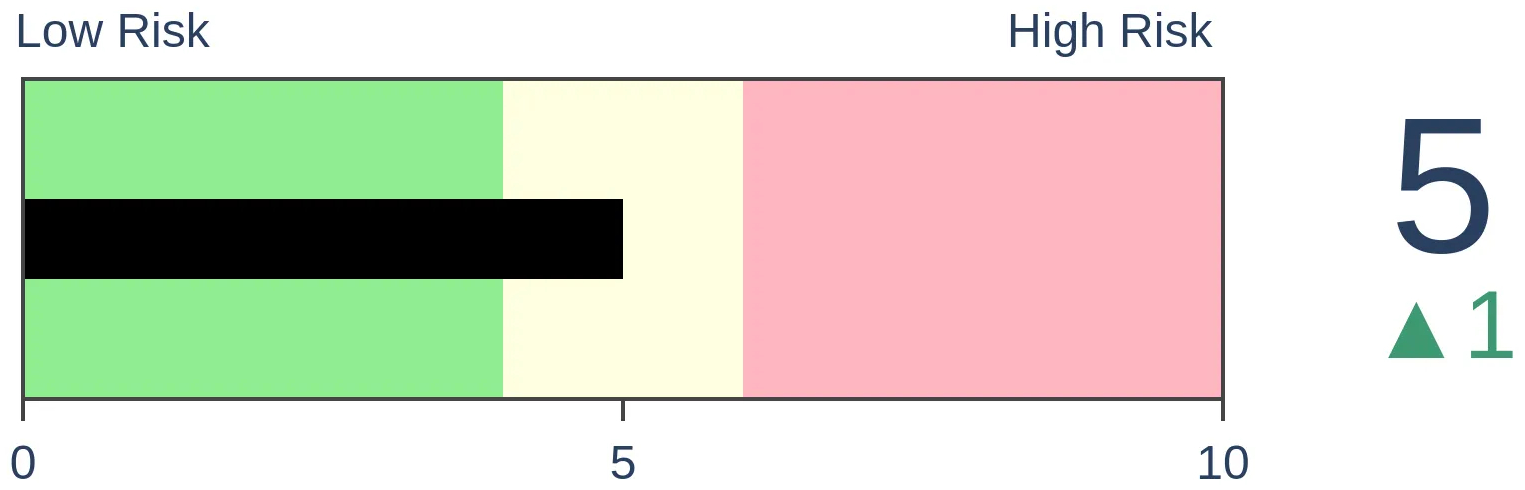
Bonds

|
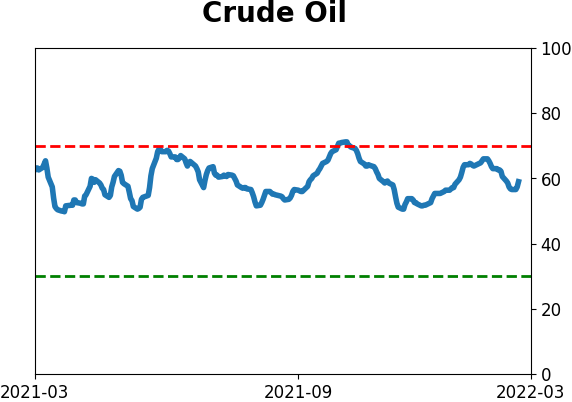
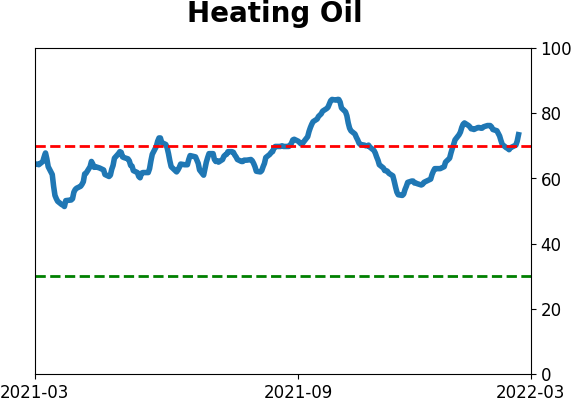
Crude Oil
|
|
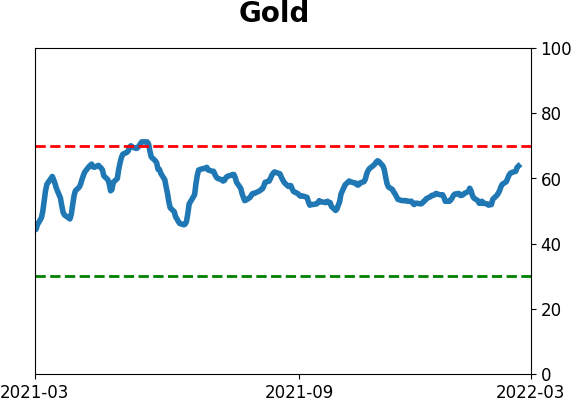
Gold
|
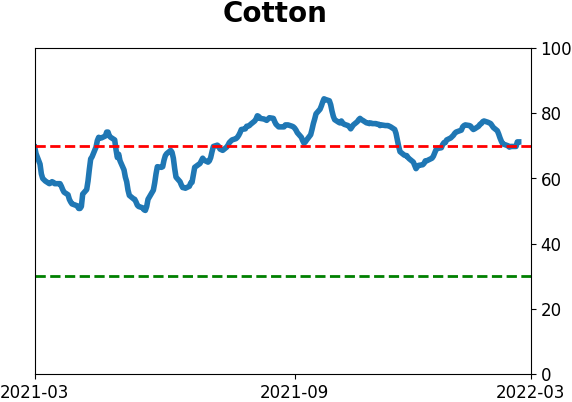
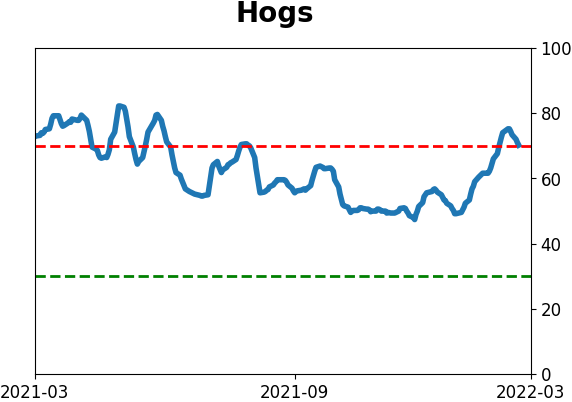
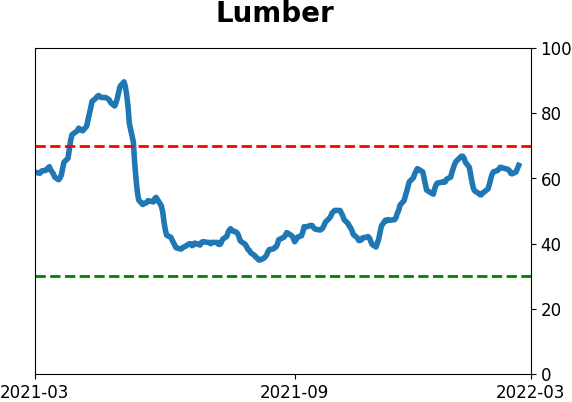
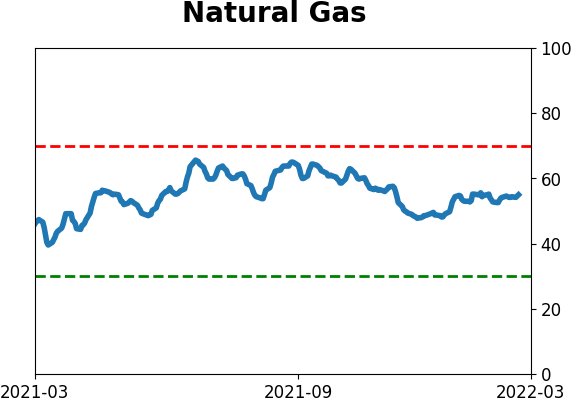
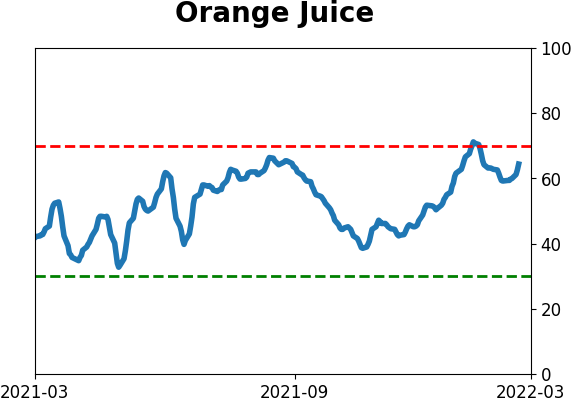
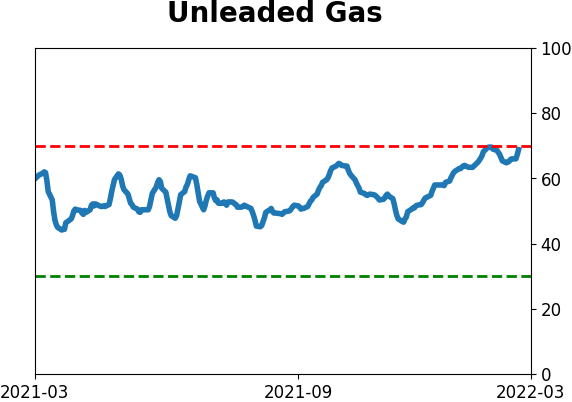
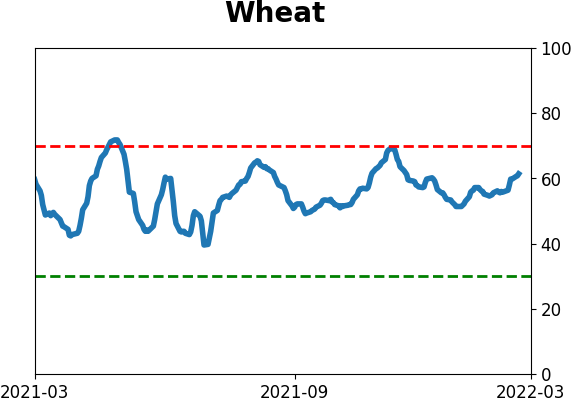
Agriculture
|
|
Research
By Jason Goepfert
BOTTOM LINE
There are a bevy of concerns buffetting investors, but they aren't panicking. There is widespread evidence of pessimism, but not outright panic. The Panic Button indicator that spike in 2015-16 and 2020 has barely budged. That has been a good sign as the S&P 500 has entered corrections.
FORECAST / TIMEFRAME
None
|
Key points:
- The Panic Button indicator has barely moved and is showing no signs of investor panic
- When the indicator is at a low level as the S&P 500 enters a correction, it has preceded good long-term returns
- Returns were worse when the Panic Button was high but not extreme
Despite concerns, there is no sign of panic
If ever there was a time for investors to panic, now is about as good a time as any. After all, we're dealing with:
- The harshest geopolitical climate in decades
- The potential end to a decade-long boom
- Rapidly rising interest rates with an unfriendly Fed
- Recent record valuations
- The pricking of a speculative bubble
- 40-year high in inflation
- Domestic unrest
- Record-low confidence in politicians and media
The one-two combination of skyrocketing inflation and a potential multi-country war should have been the last straw. Curiously, however, investors haven't panicked.
Sure, some readings show pessimism, like retail traders buying puts. But the Panic Button has not been pressed. The Panic Button incorporates volatility, interest rates, liquidity, bond spreads, and default protection costs to highlight those periods of outright terror when markets tank. When there is a crisis that spreads across markets and geographies, these measures tend to rise in tandem.
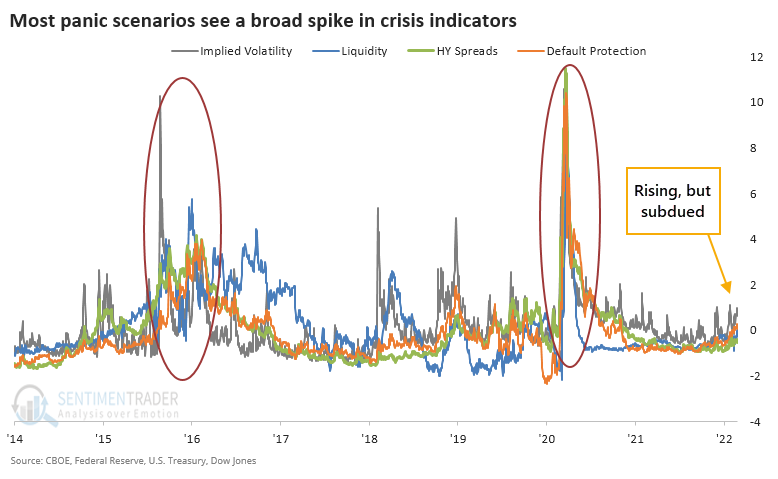
We discussed the Panic Button after it was triggered in January 2016 and March 2020, but it has been curiously flaccid lately. It's still sitting at zero. Stocks perform best when there is not a heightened sense of panic (the vast majority of days) or when there is extreme panic. It's the middle-ground when there is trouble enough to trigger only a little bit of panic that's the most dangerous time for equities.
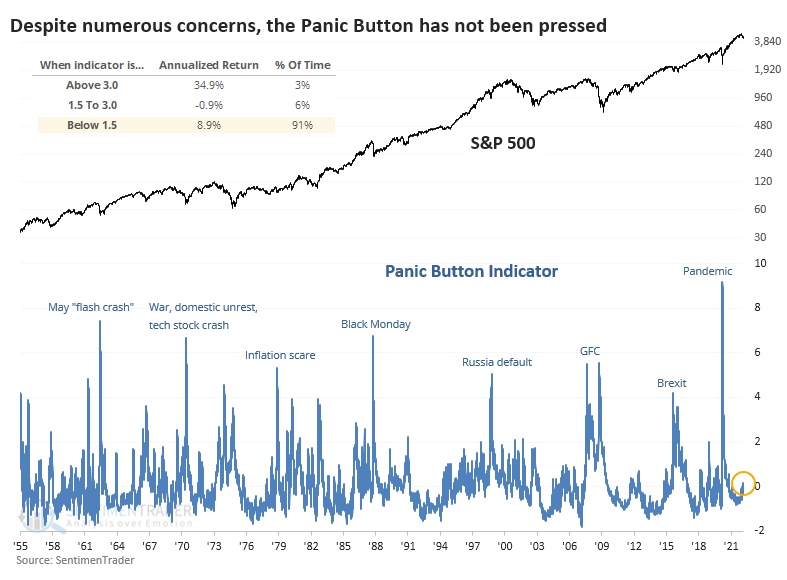
Typically, we look to fade extremes. When investors panic in both directions, markets have a high probability of going the other direction. So, when we've looked at the Panic Button in the past, it was related to a high reading.
Since investors have not panicked this time, perhaps that's a bad sign. To check, the table below shows every time over the past 70 years when the S&P 500 fell into a correction, but the Panic Button was moribund, not rising above 0.5.
It's somewhat surprising that while medium-term returns were nothing special, and there was a double-digit loss in there, it was mostly a non-event. And over the next year, the S&P 500 showed a positive return after 10 out of 11 signals.
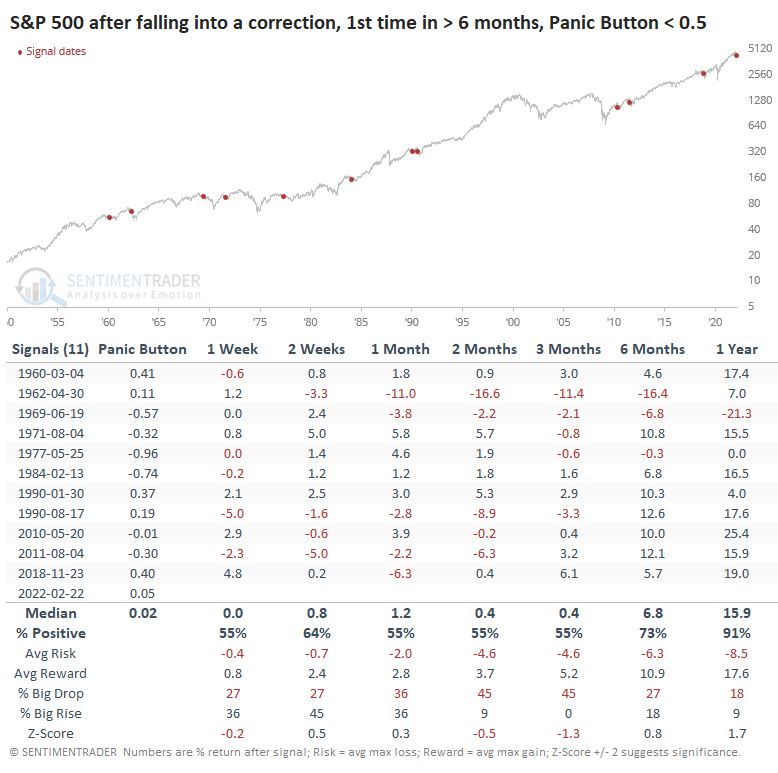
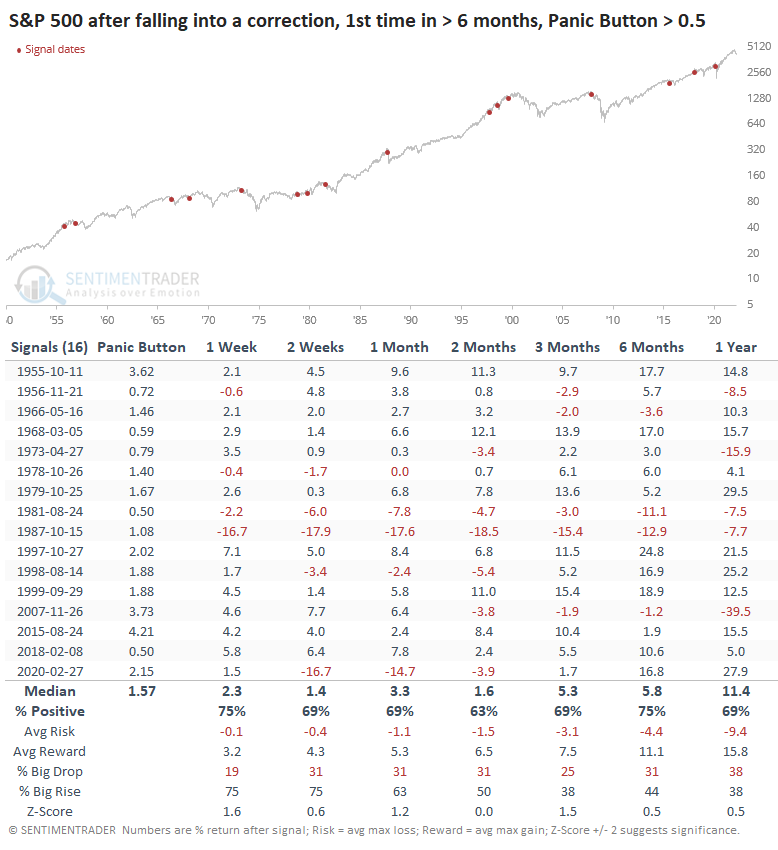
Interestingly, the longer-term returns were better than when the Panic Button was high when the S&P fell into a correction. After those signals, the S&P was higher only 69% of the time a year later.
What the research tells us...
With sensitive indicators like the Panic Button, there are two generally bullish regimes: 1) when investors panic and it records an extremely high reading, and 2) when market stresses are not deemed to be existential, and the Panic Button remains low. When the Panic Button is high but not extreme, that's not a great situation because it indicates there's "something" to be worried about, but sentiment hasn't been washed out yet. Currently, we're seeing condition #2. As general believers in the mean-reversion nature of human behavior, we'd rather fade a true extreme. Still, the current correction appears to be relatively benign according to metrics that tend to reflect the opposite.
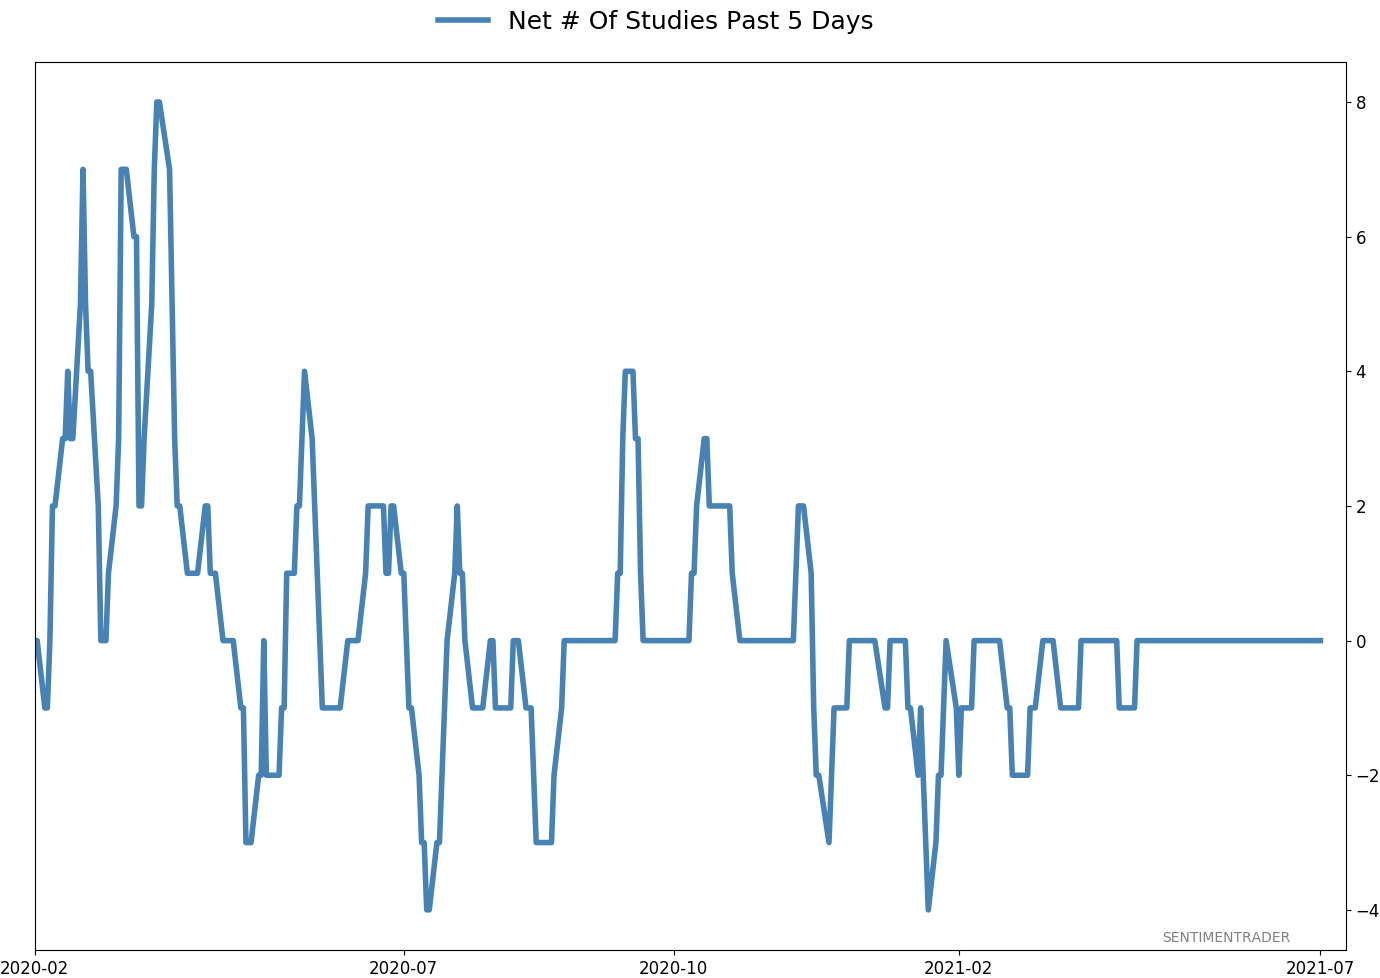
Active Studies
| Time Frame | Bullish | Bearish | | Short-Term | 3 | 0 | | Medium-Term | 20 | 2 | | Long-Term | 15 | 5 |
|
Indicators at Extremes
Portfolio
| Position | Description | Weight % | Added / Reduced | Date | | Stocks | RSP | 21.4 | Added 10.2% | 2022-01-28 | | Bonds | 32.7% BND, 7.1% SCHP | 40.1 | Added 8.3% | 2021-10-26 | | Commodities | GCC | 2.4 | Reduced 2.1%
| 2020-09-04 | | Precious Metals | GDX | 4.6 | Reduced 4.2% | 2021-05-19 | | Special Situations | 7.6% KWEB, 4.9% XBI, 3.7% XLE, 1.8% PSCE | 18.0 | Added 4.6% | 2022-02-24 | | Cash | | 13.2 | | |
|
Updates (Changes made today are underlined)
With a typical time frame of several months in this account, I normally don't make changes so quickly. I've added back part of the stock exposure I took off earlier in January due to the washed-out conditions and extreme pessimism we're seeing across a wide array of metrics. The biggest issue is that the environment is unhealthy and we could be in the throes of a protracted bear market. Even so, the readings we've seen recently have a good record at preceding relief rallies, so we'll have to see how that pans out. Bond sentiment is trying to recover from a recent bout of pessimism, and gold stocks are doing their thing which is not much at all. They've been flat for six months. Chinese tech stocks were doing exactly what they're supposed to do, then did *not* by plunging to new lows. This is troubling on a shorter-term time frame, but this was never meant for a trade, rather a multi-year investment. Recent behavior is troubling and I will not be adding any exposure as long as that's the case. RETURN YTD: +0.5% 2021: +8.7%, 2020: +8.1%, 2019: +12.6%, 2018: +0.6%, 2017: +3.8%, 2016: +17.1%, 2015: +9.2%, 2014: +14.5%, 2013: +2.2%, 2012: +10.8%, 2011: +16.5%, 2010: +15.3%, 2009: +23.9%, 2008: +16.2%, 2007: +7.8%
|
|
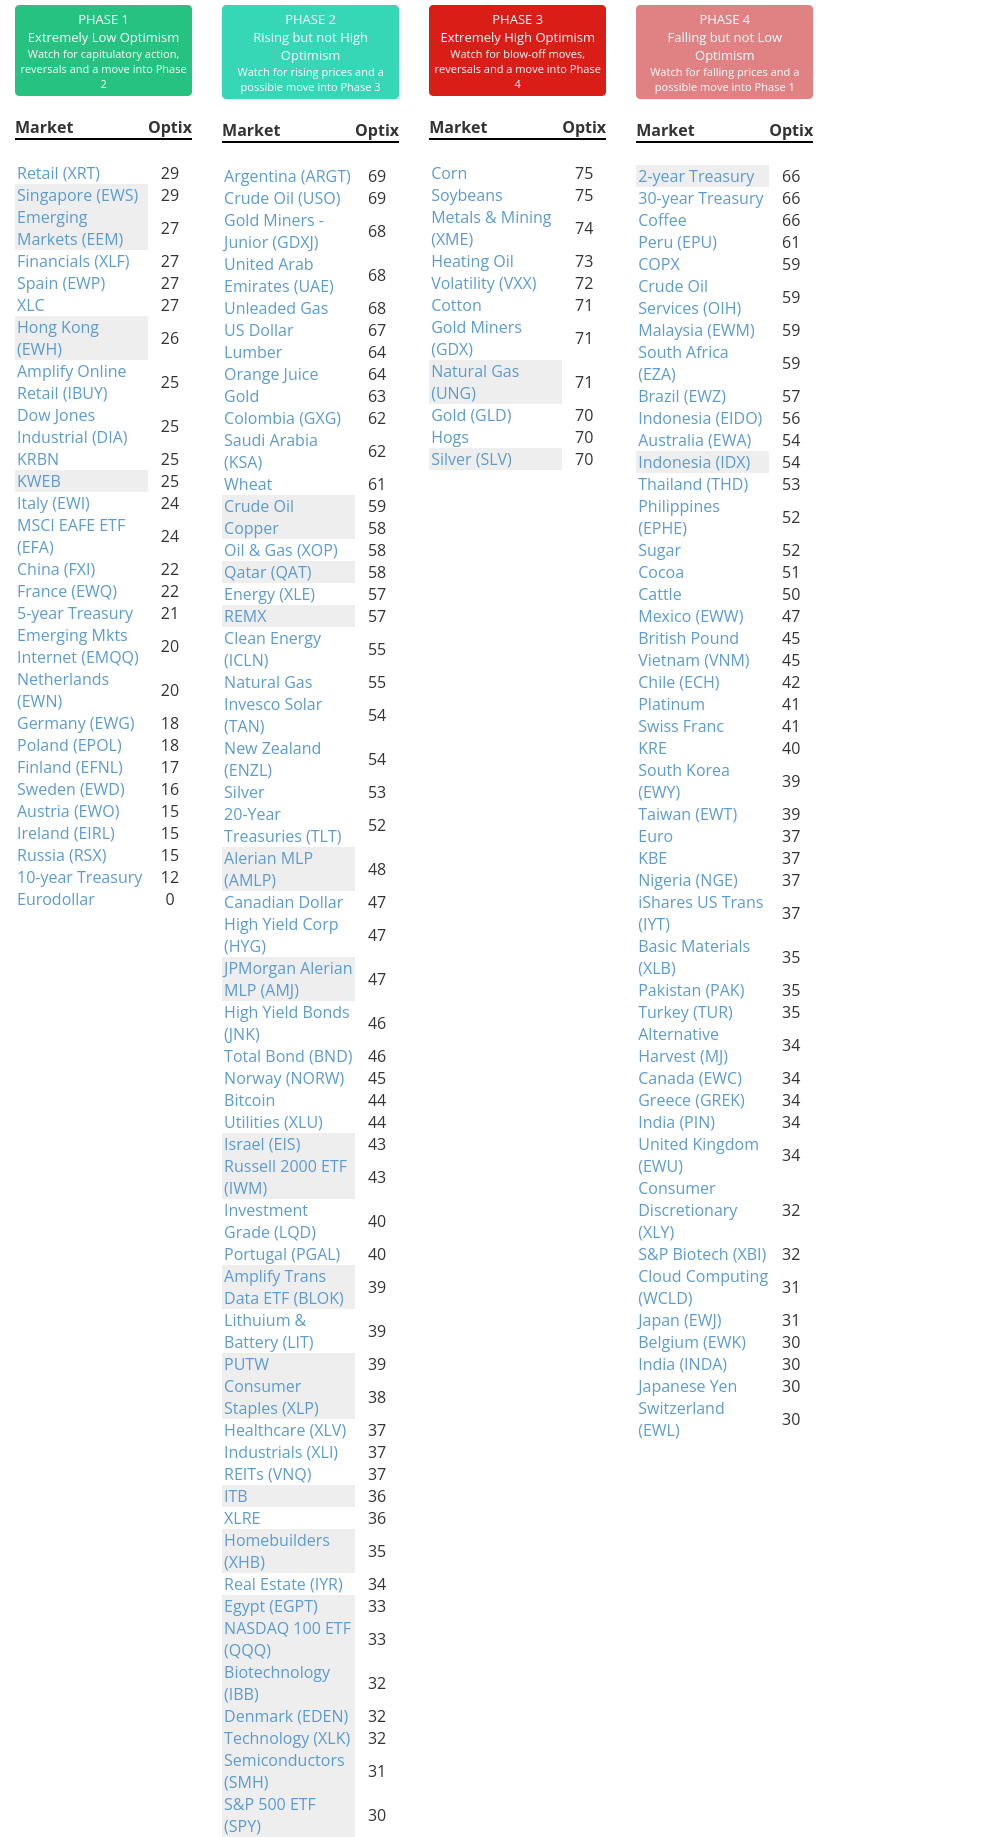
Phase Table
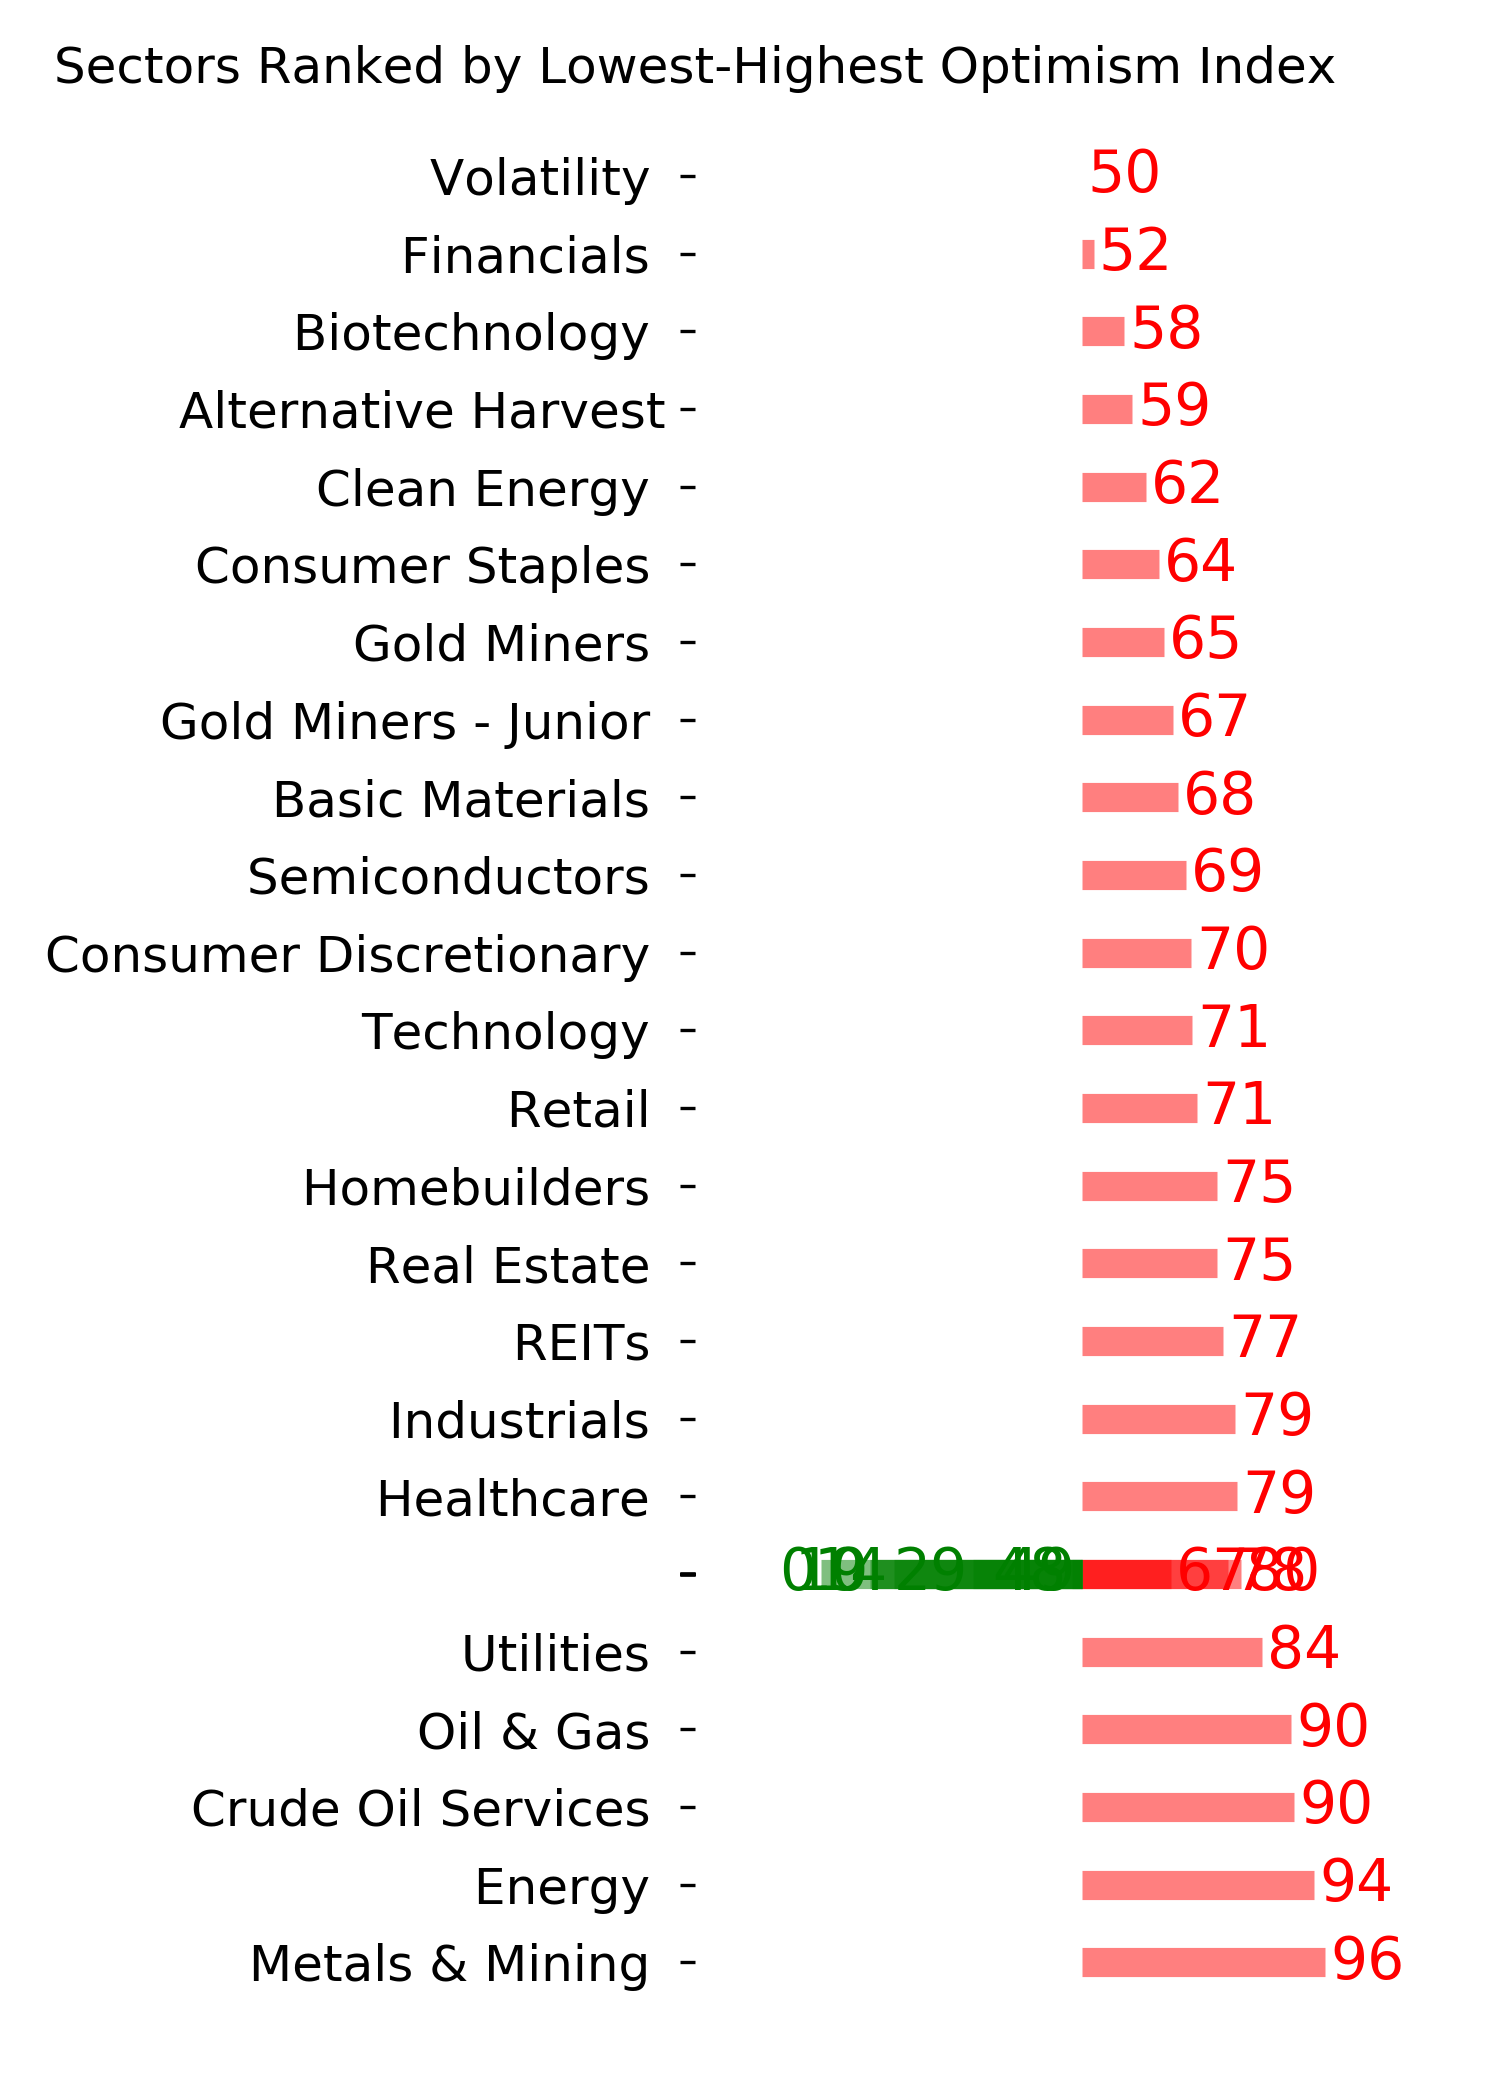
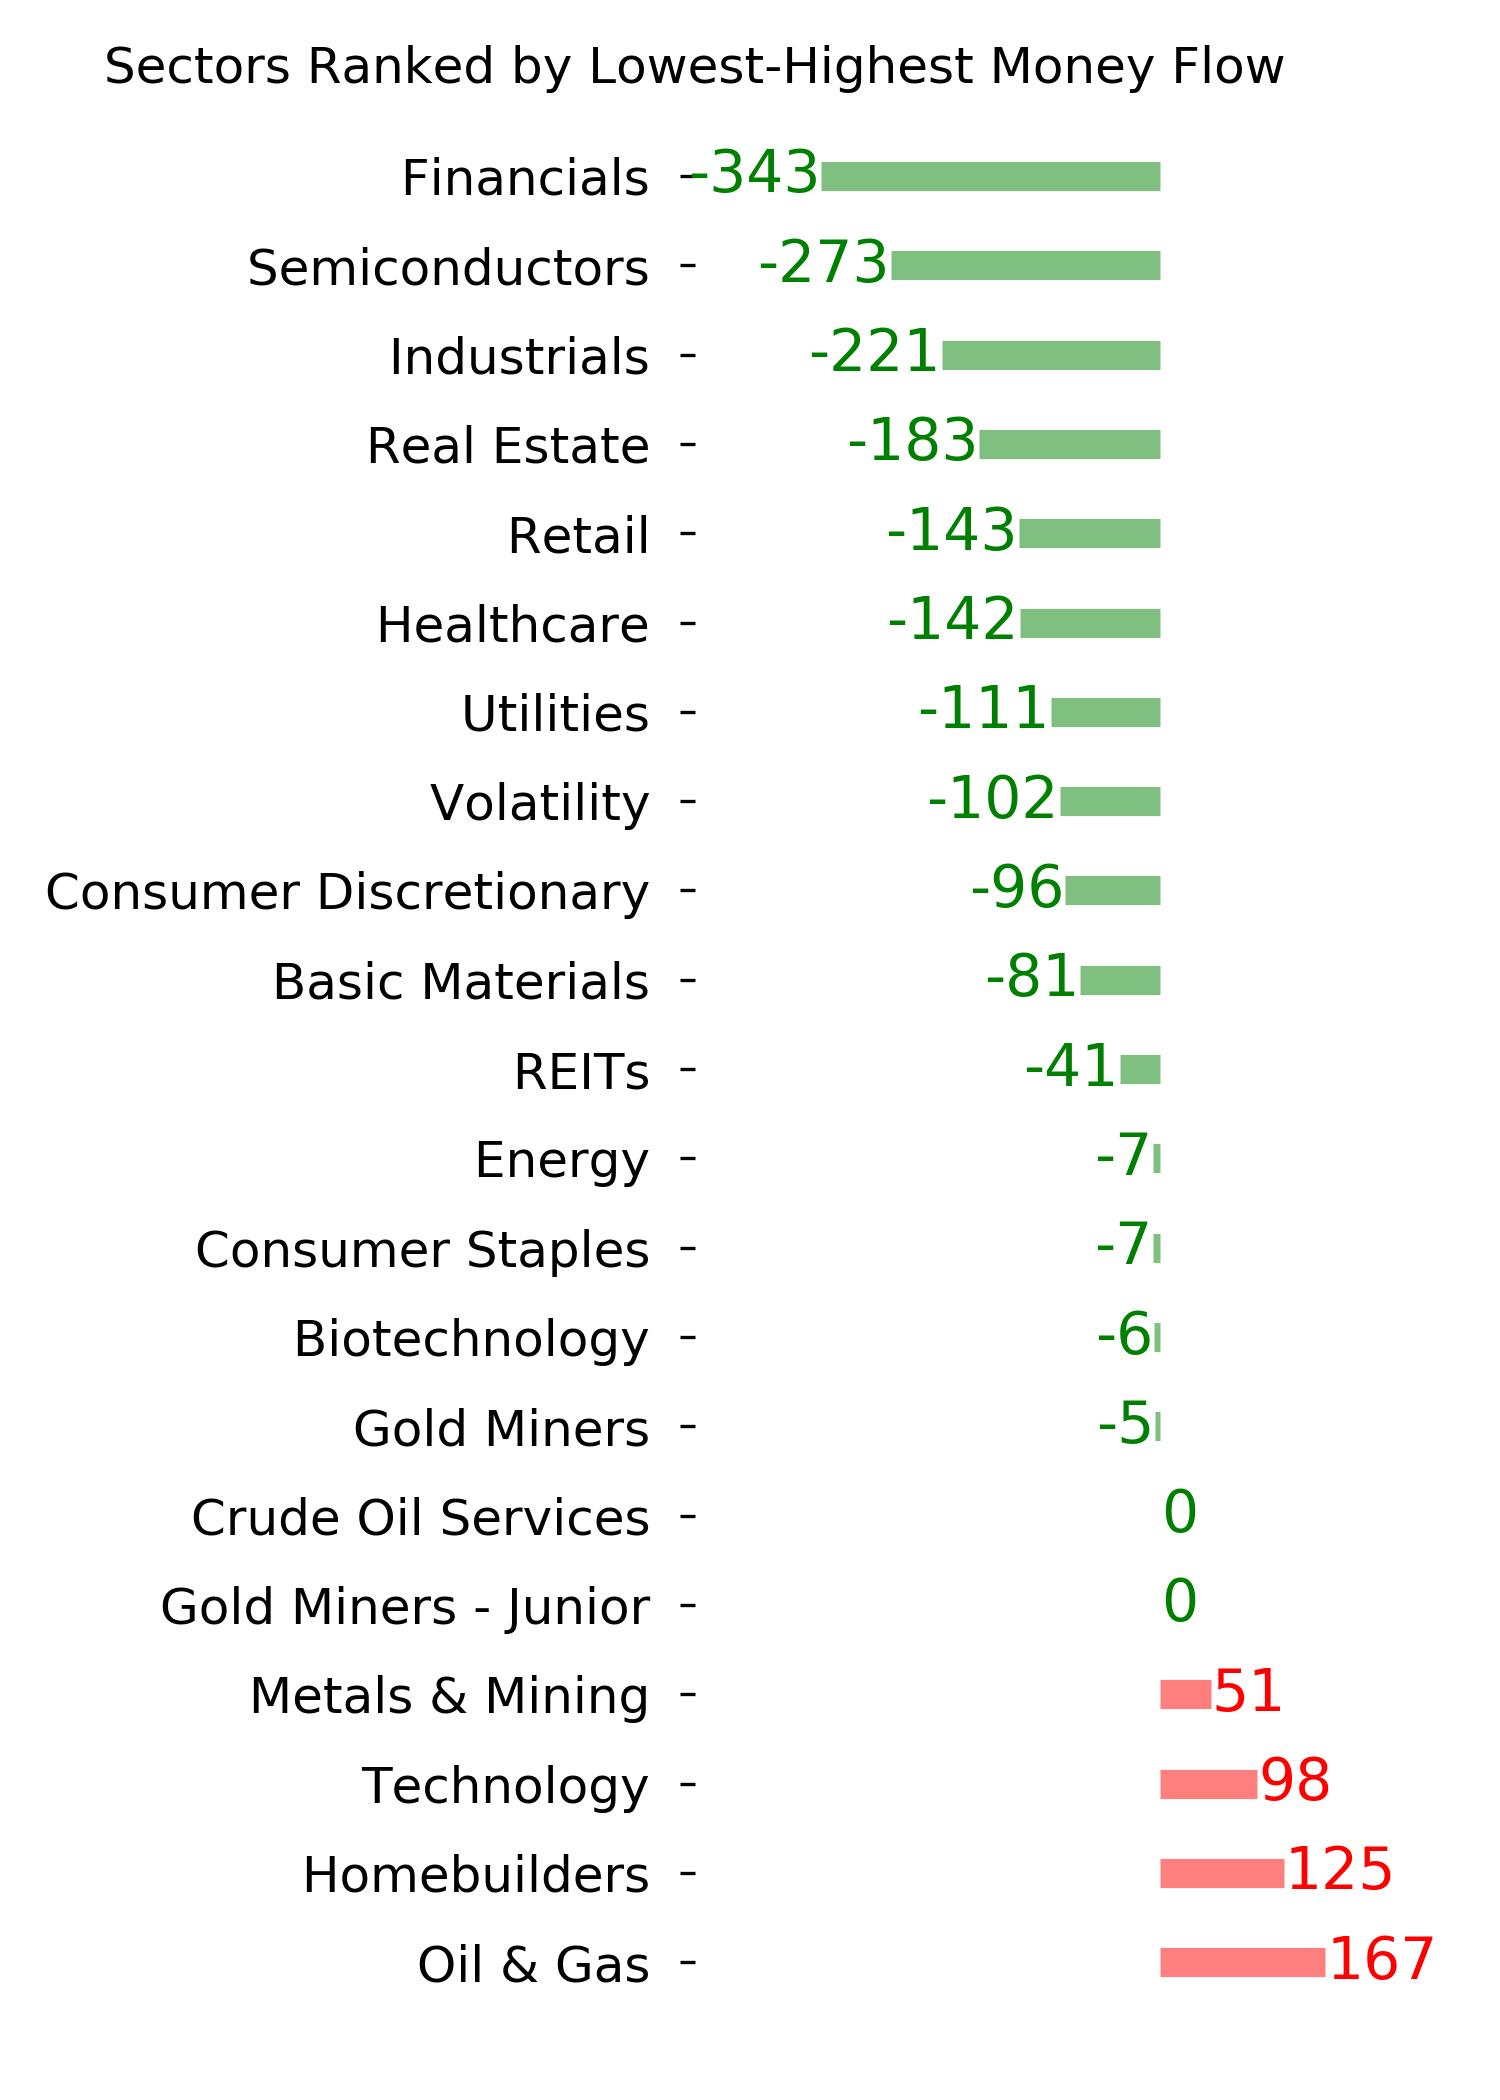
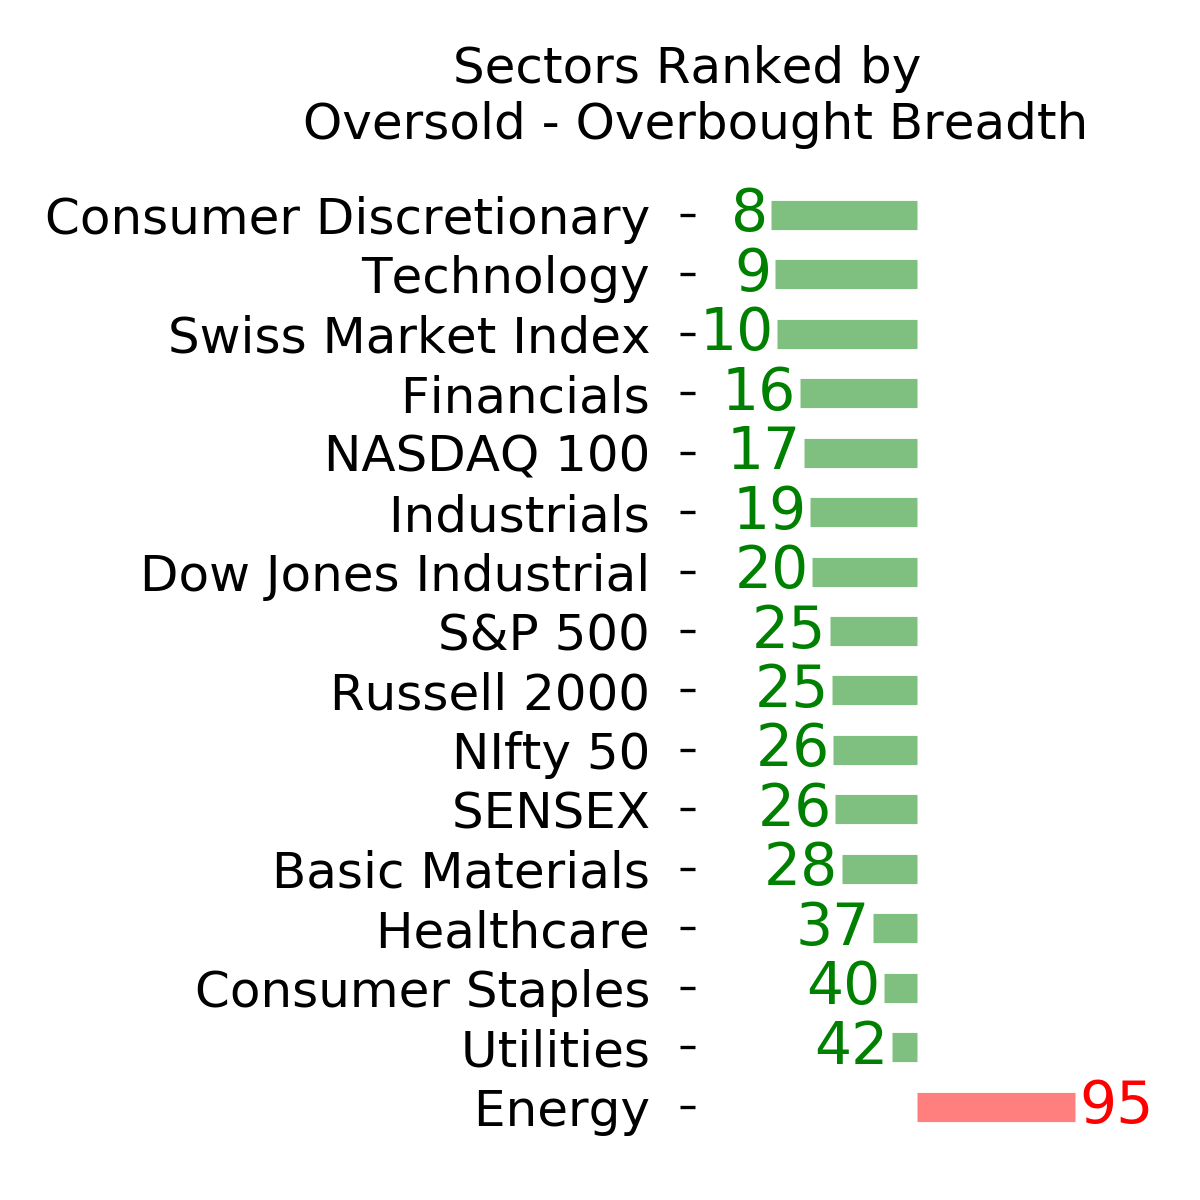
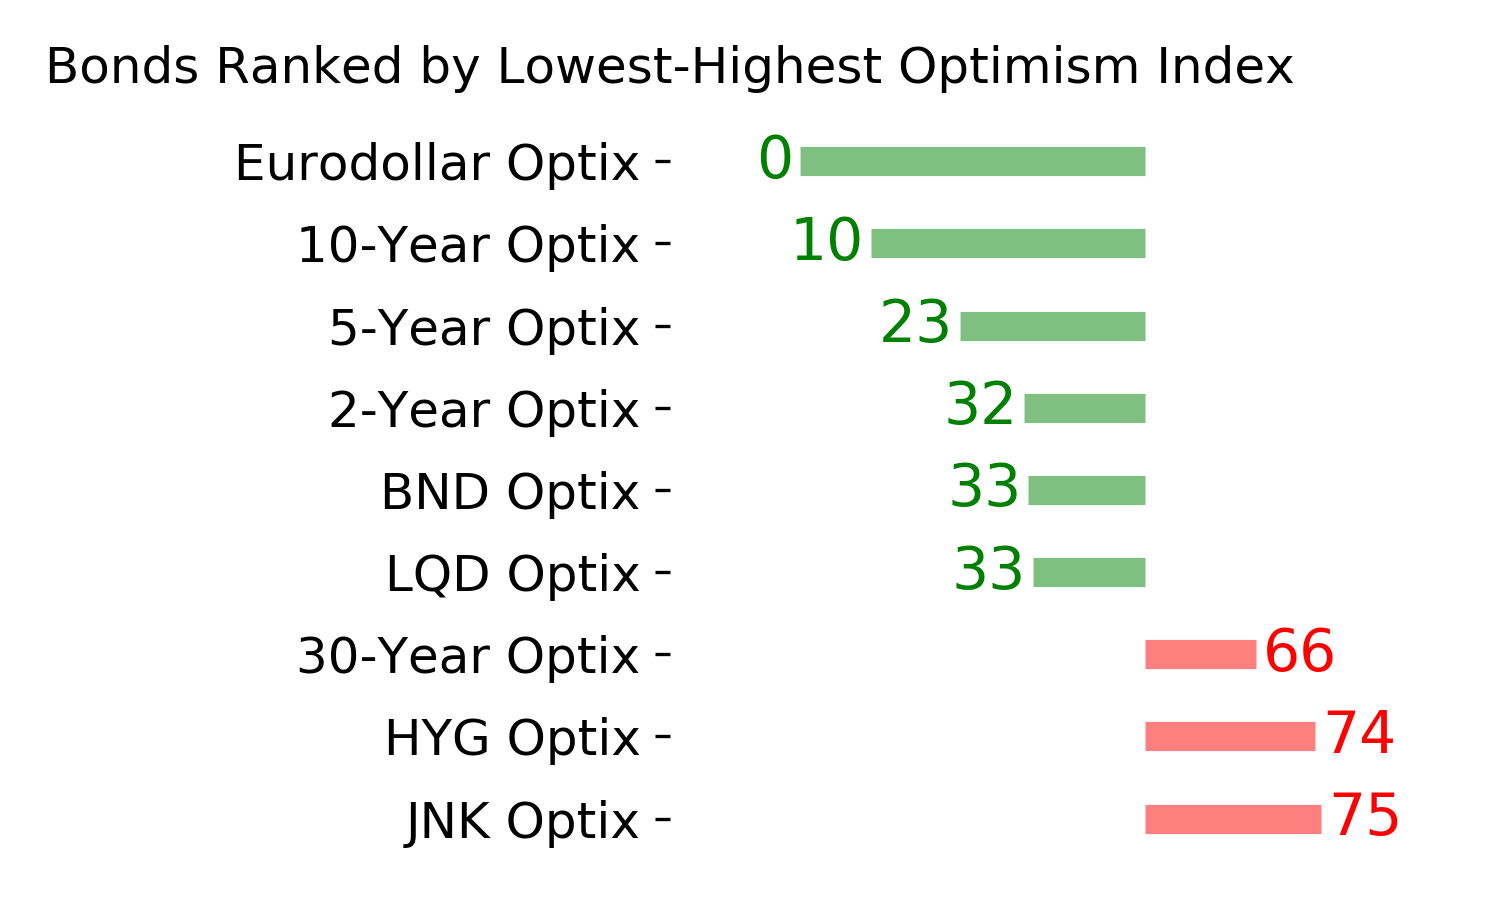
Ranks
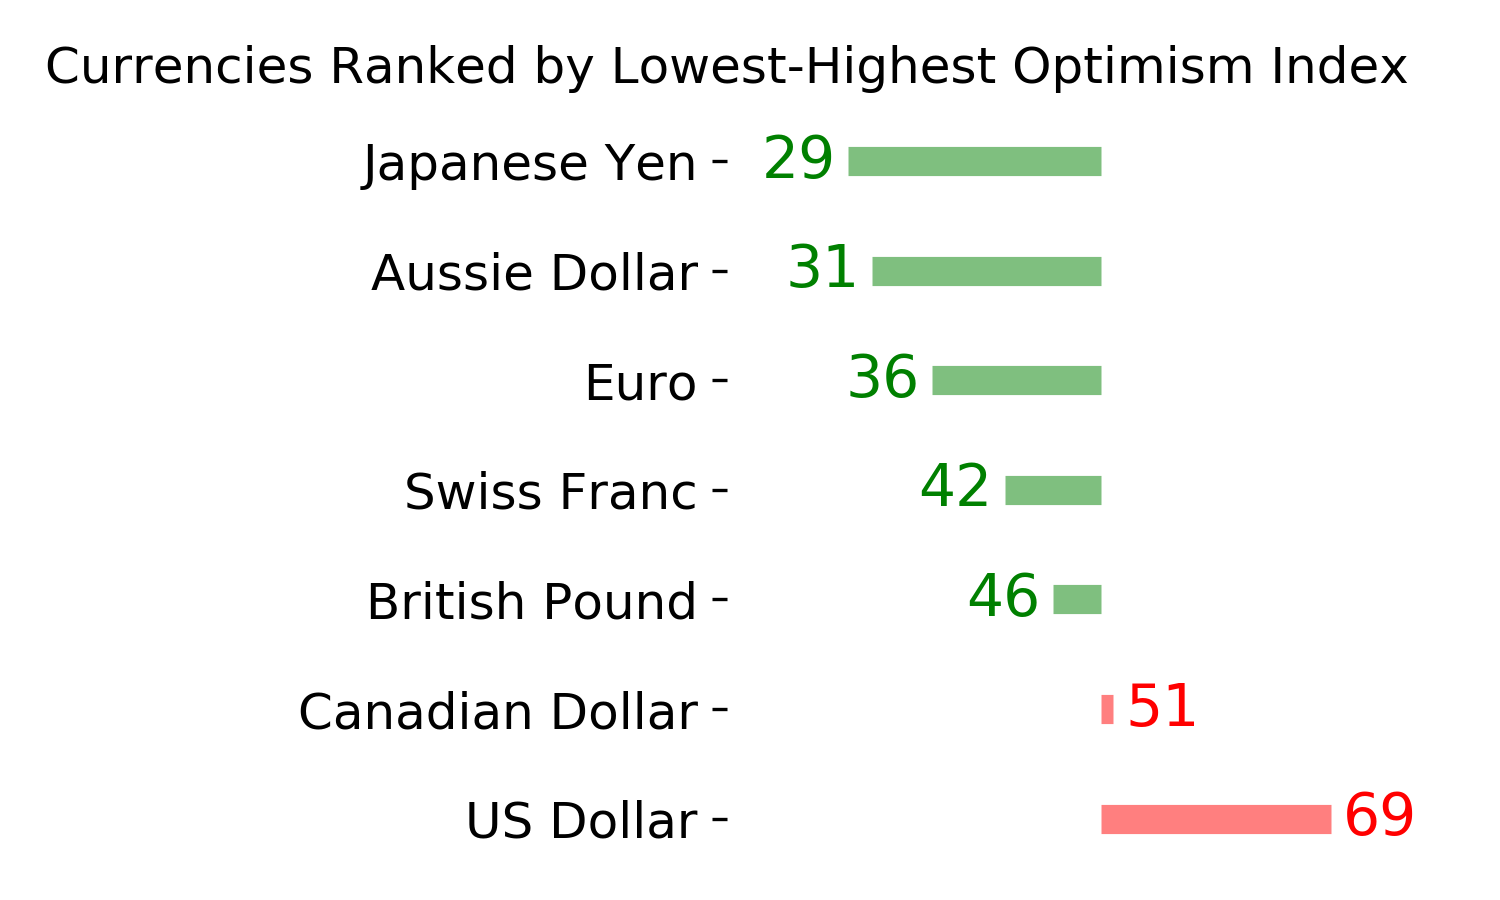
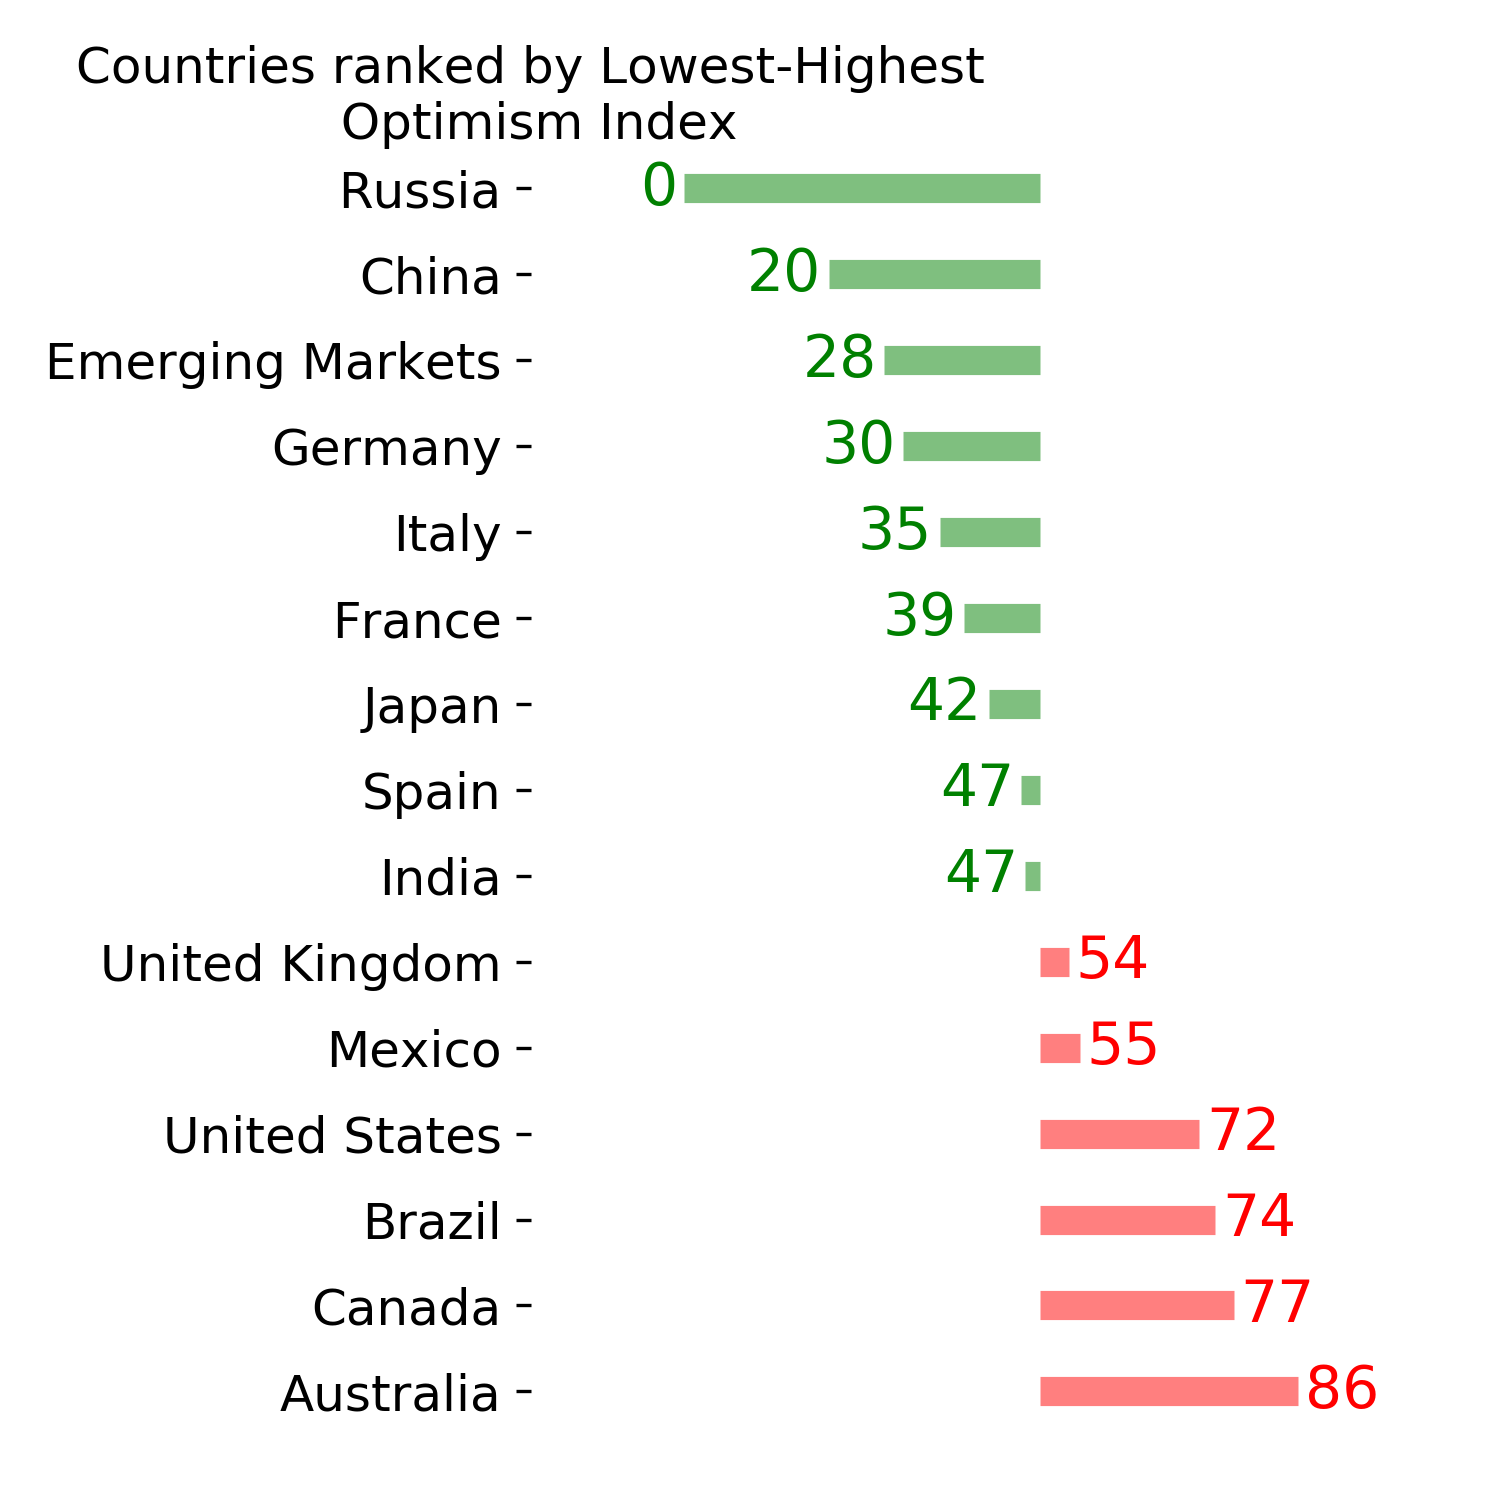
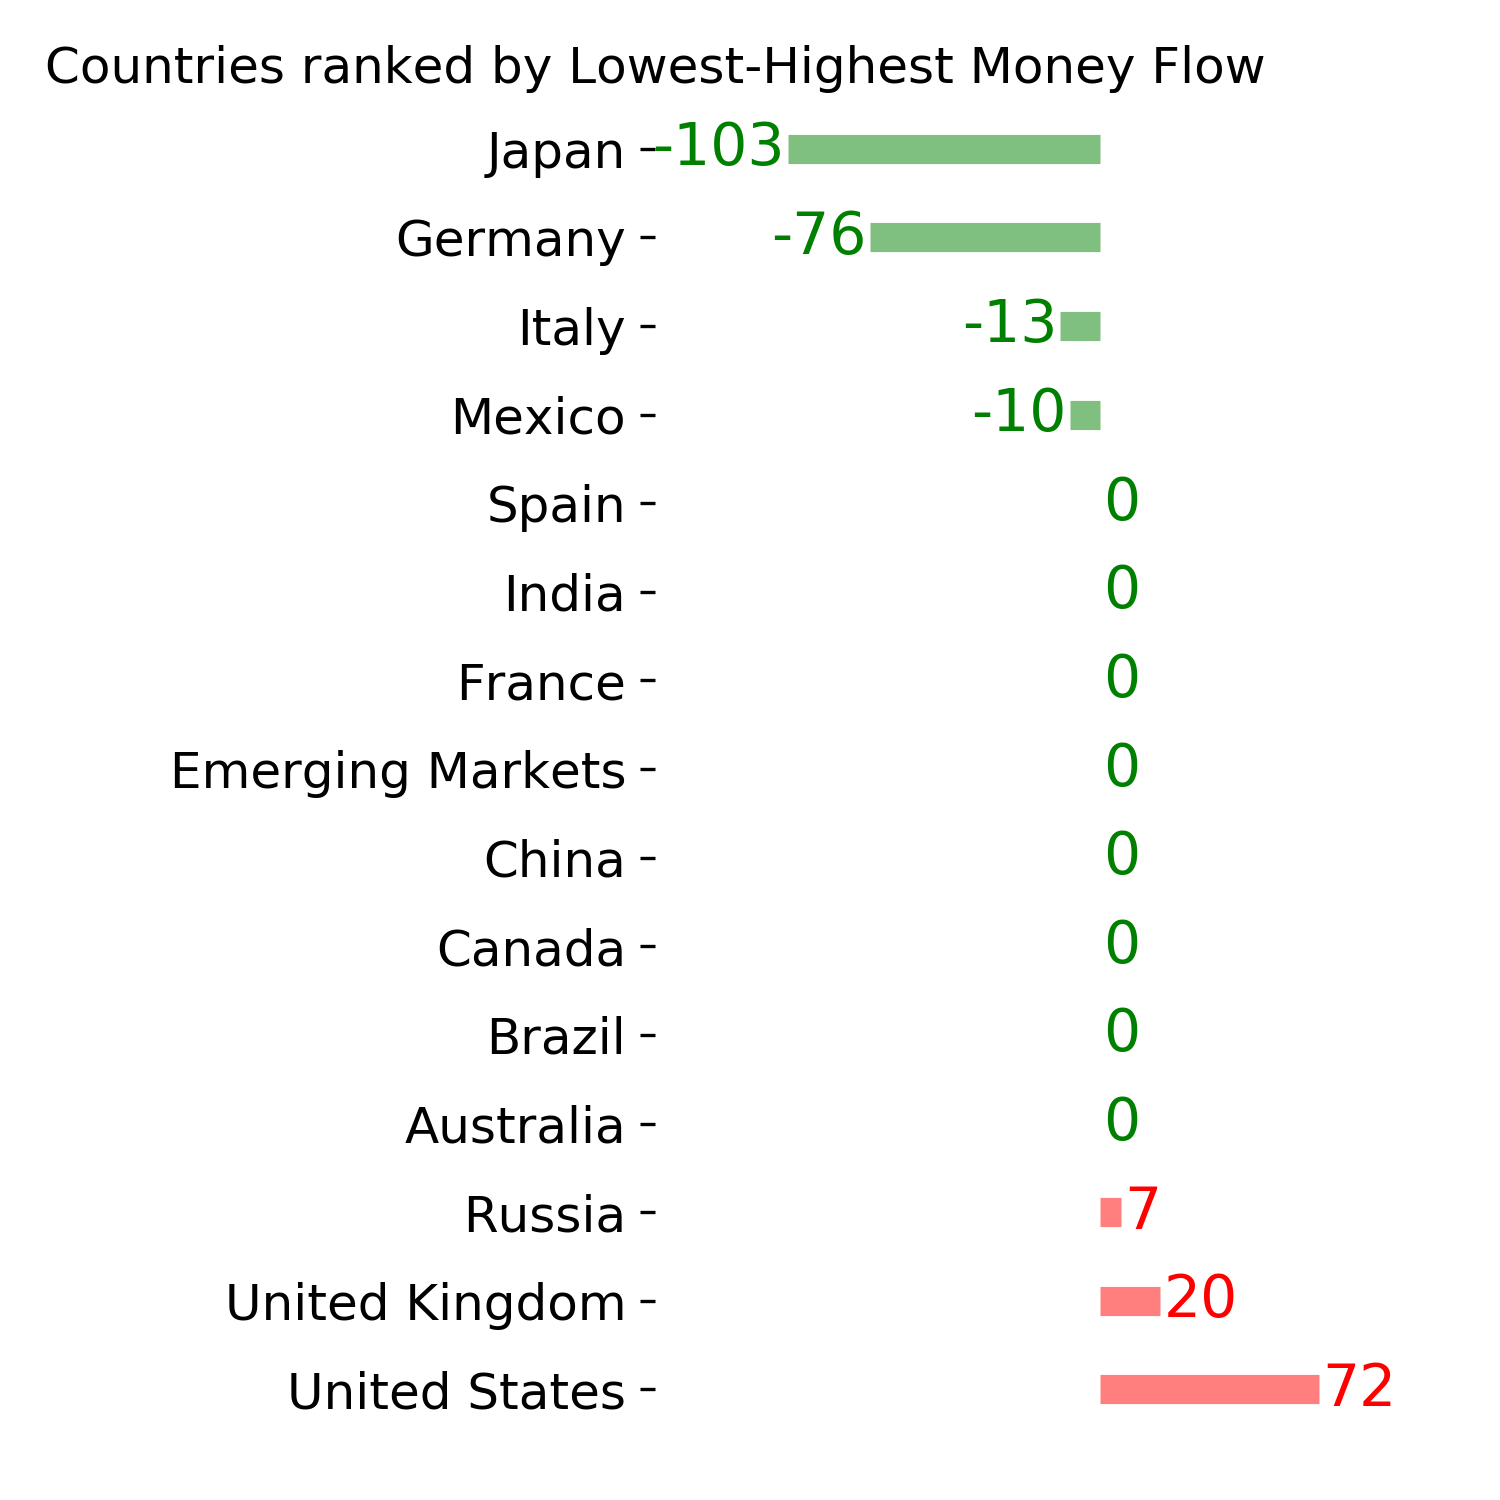
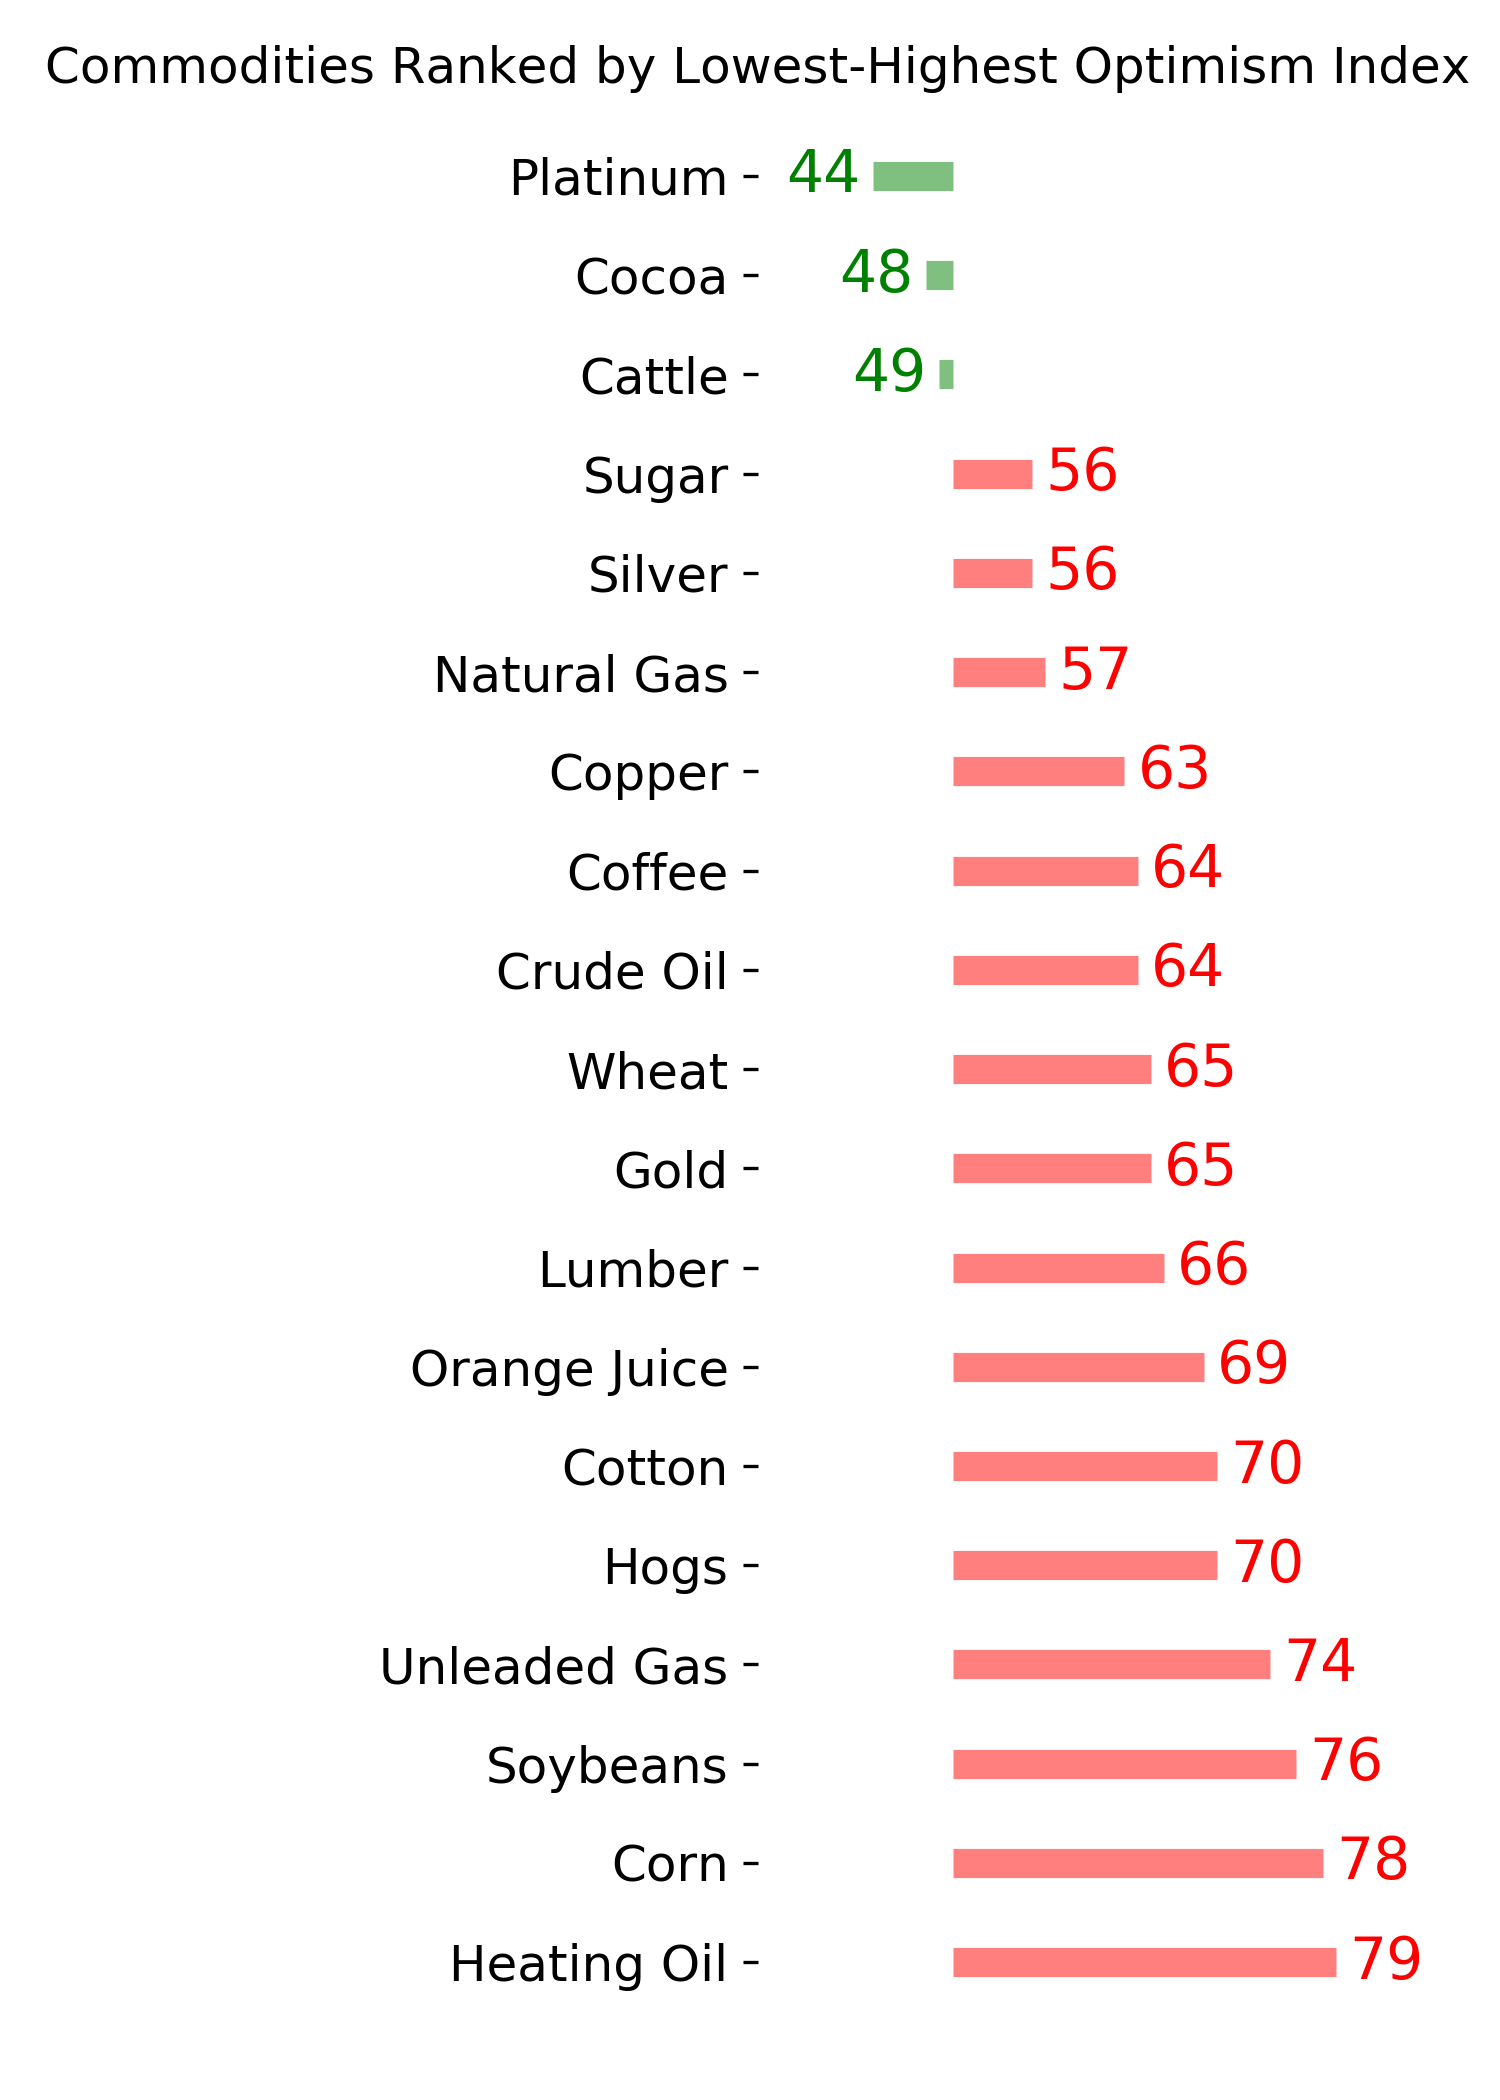
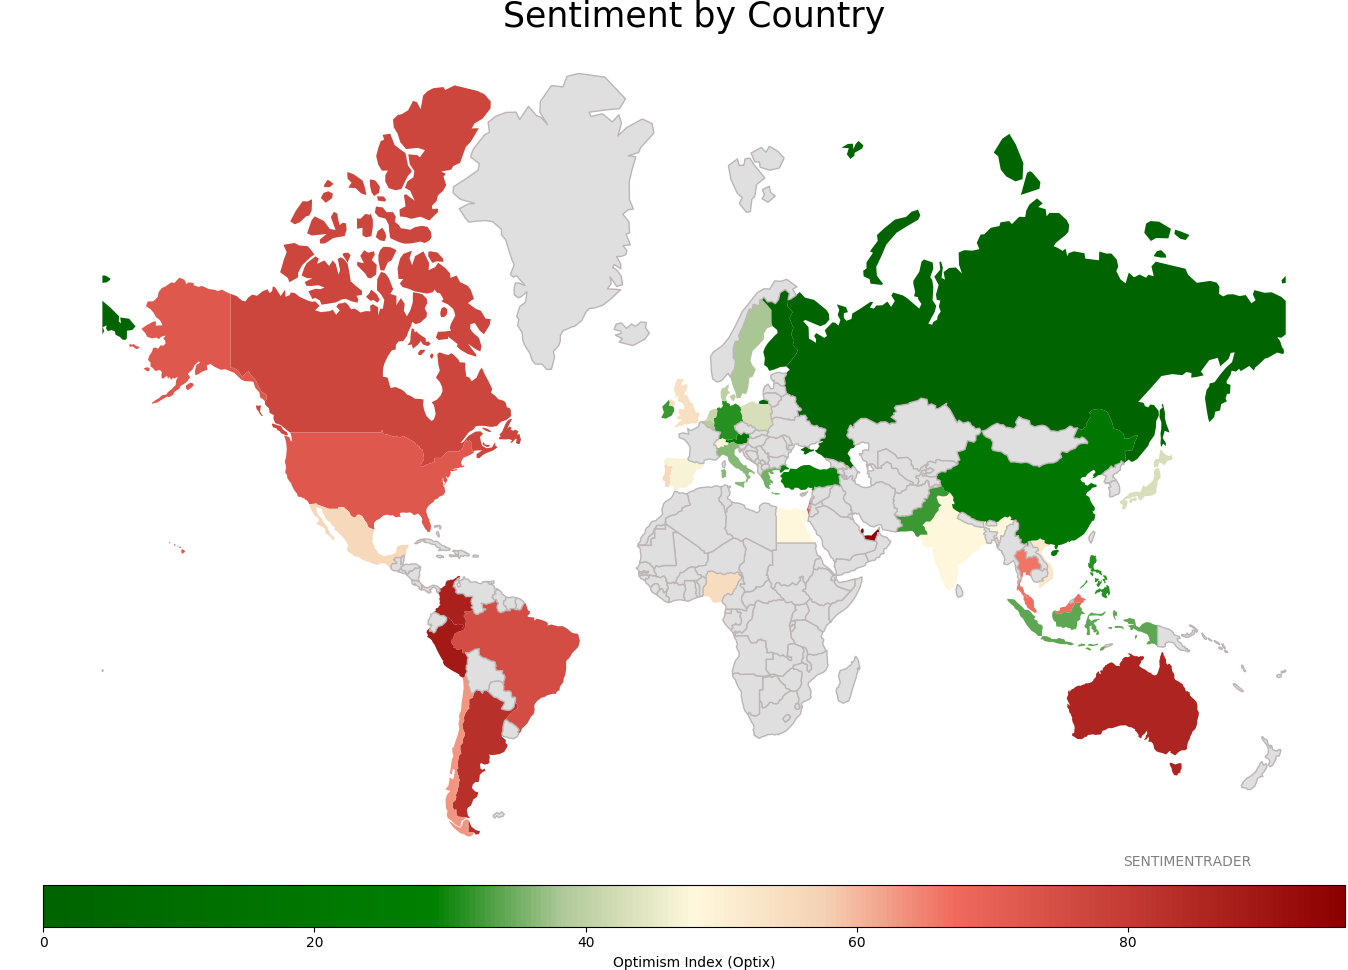
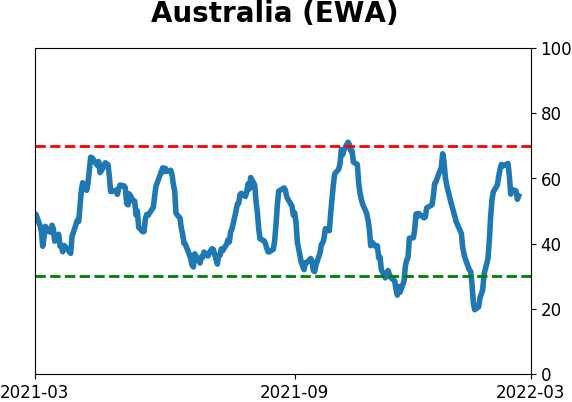
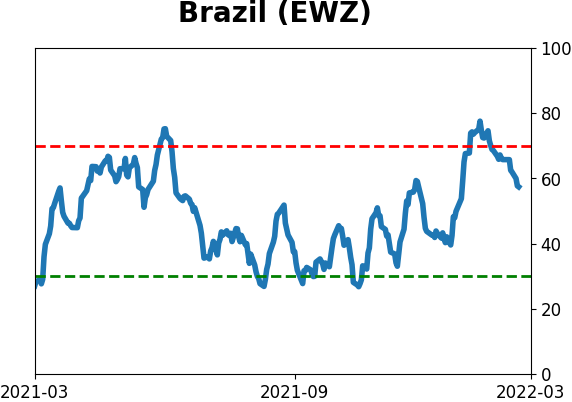
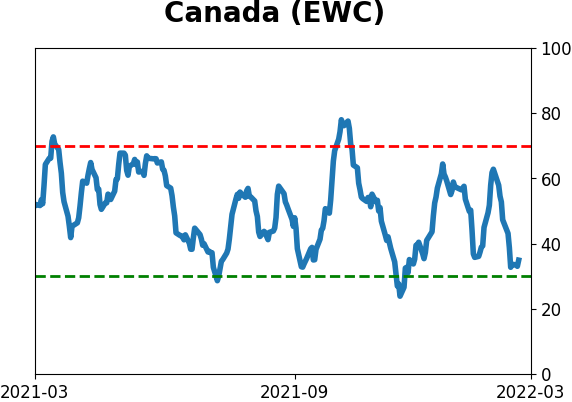
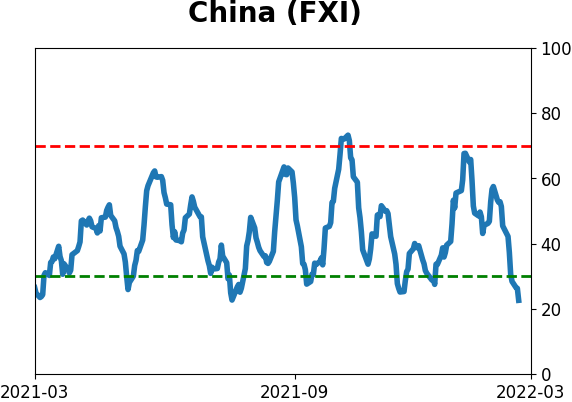
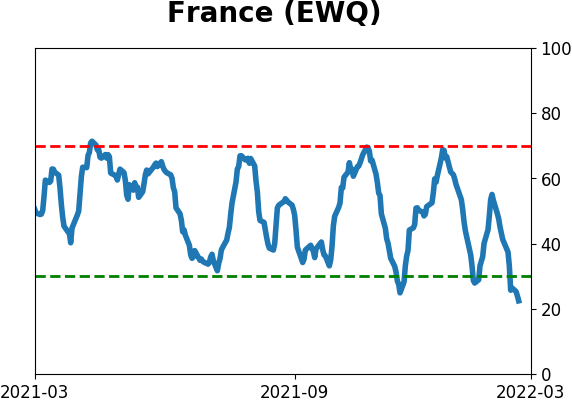
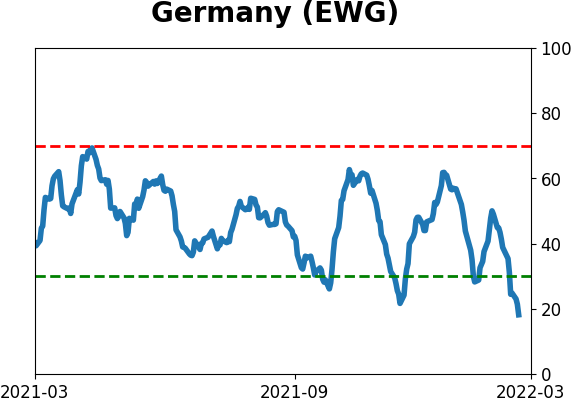
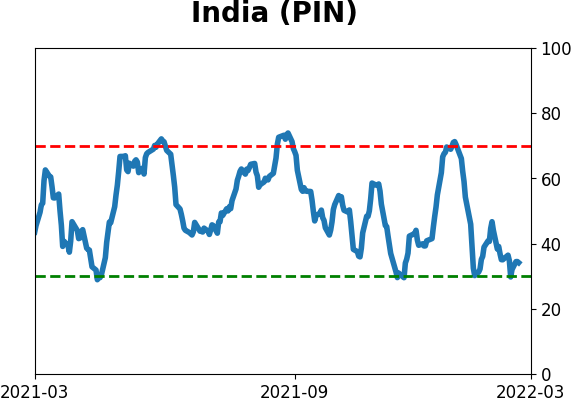
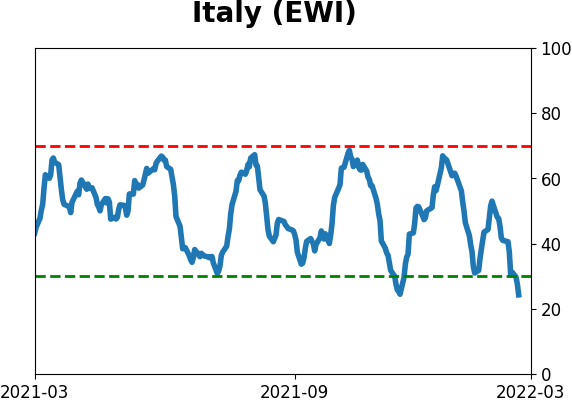
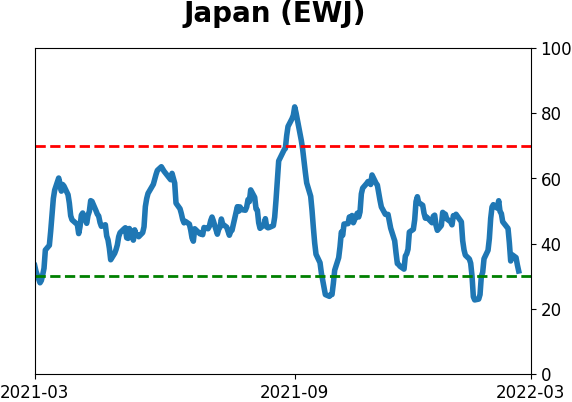
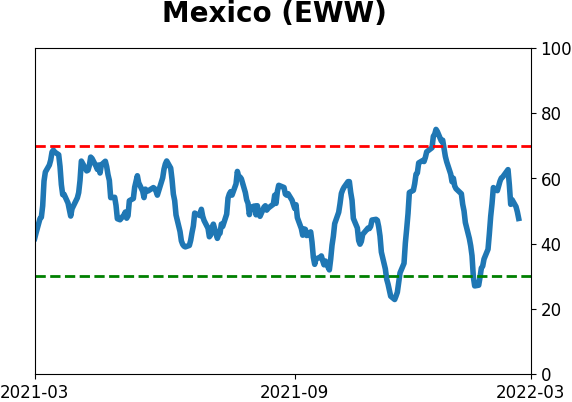
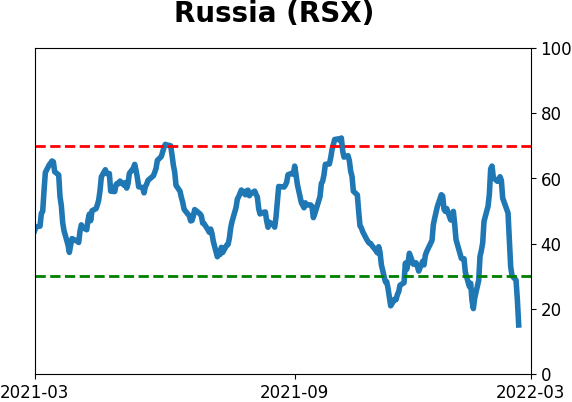
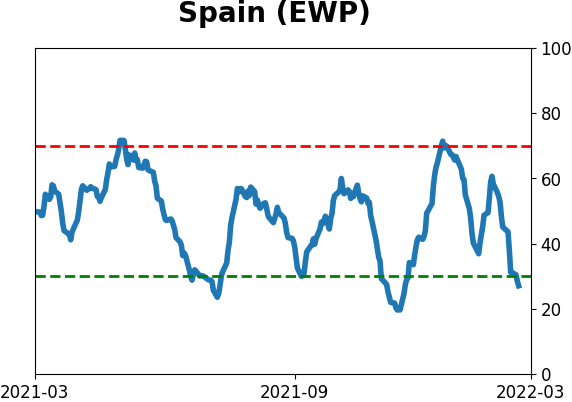
Sentiment Around The World
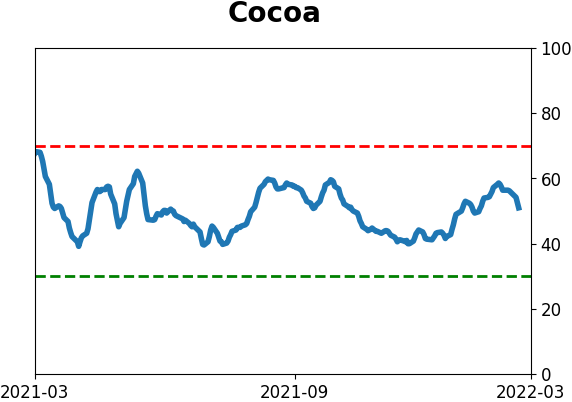
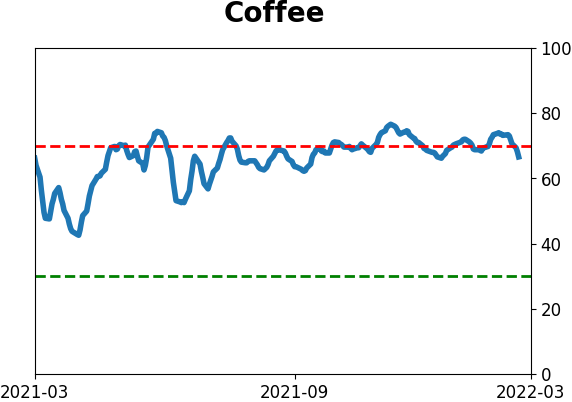
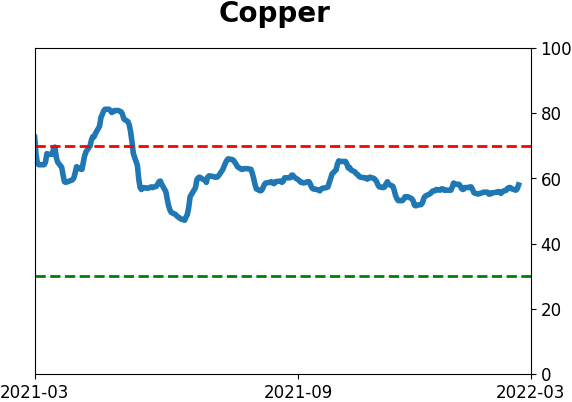
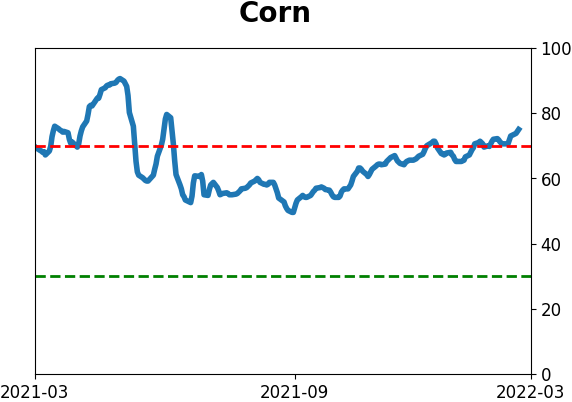
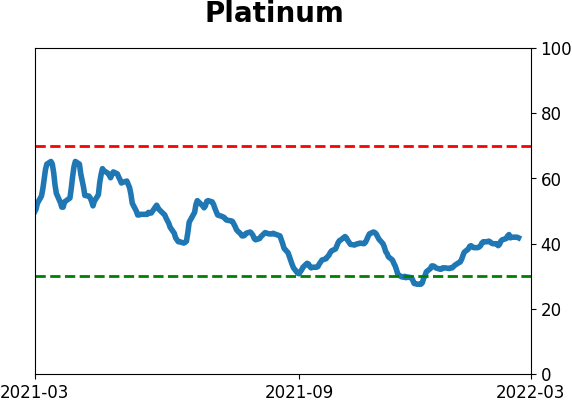
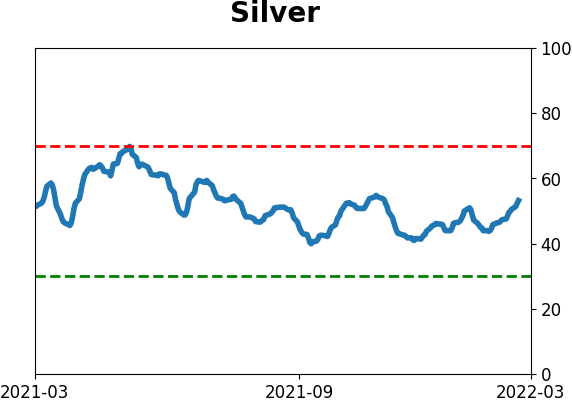
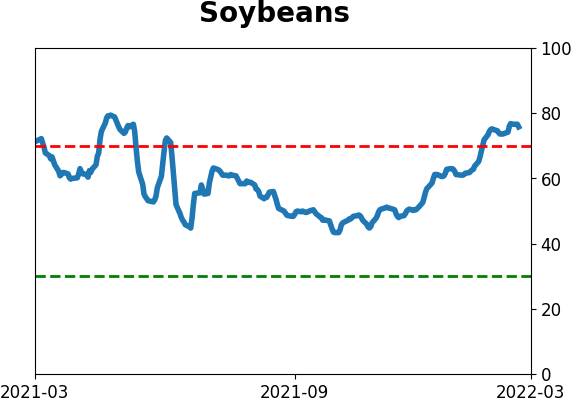
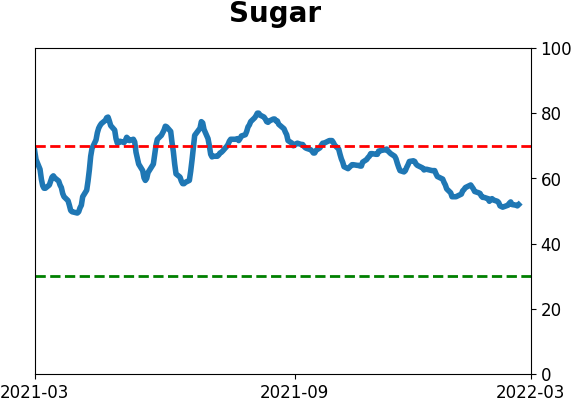
Optimism Index Thumbnails
|
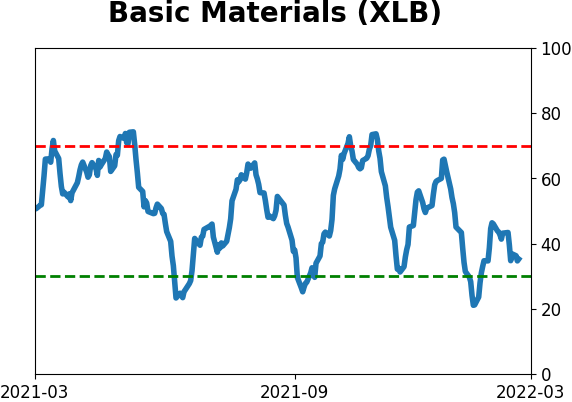
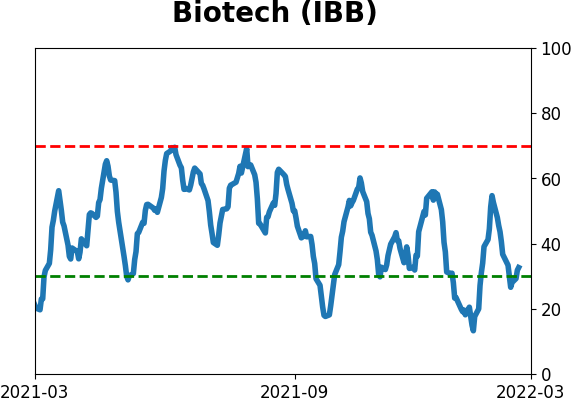
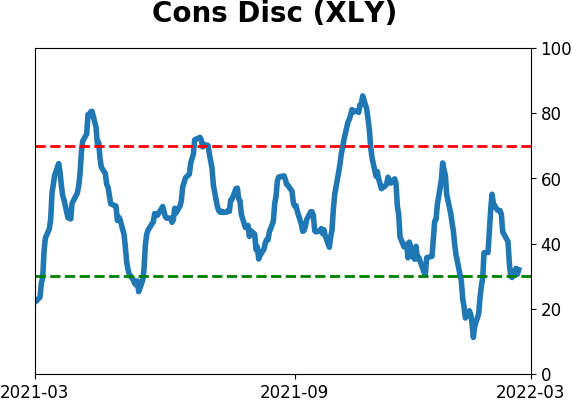
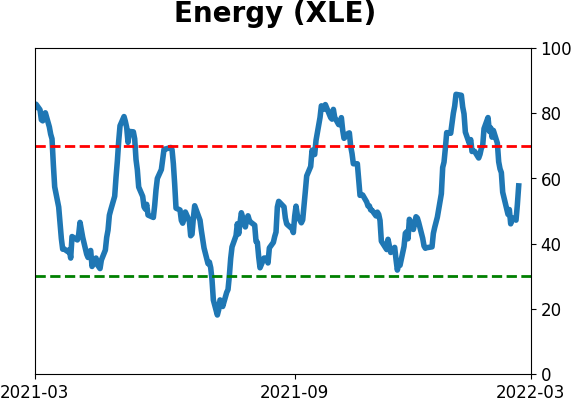
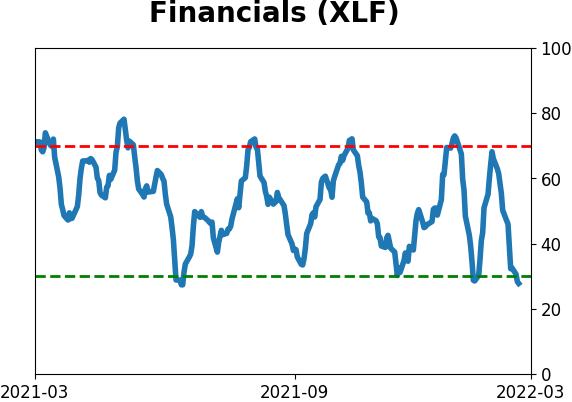
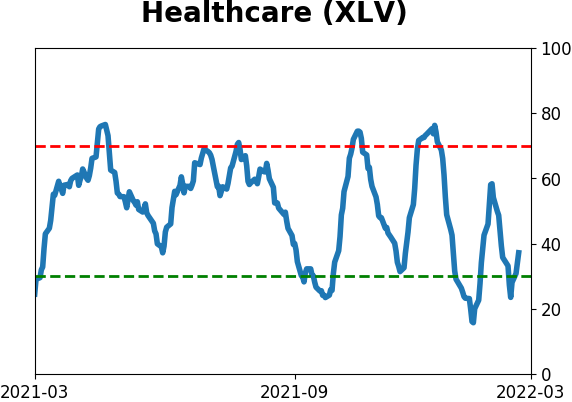
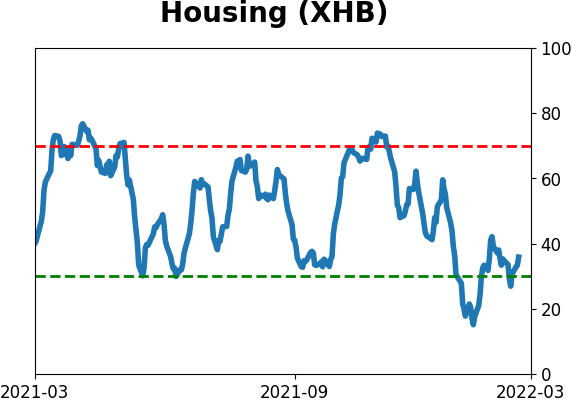
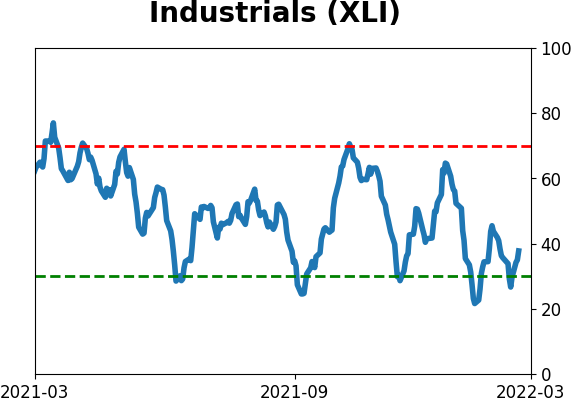
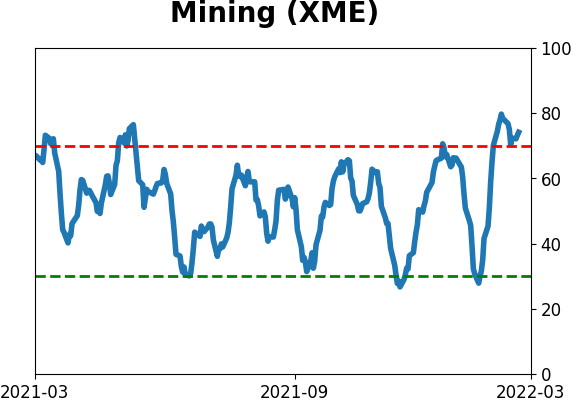
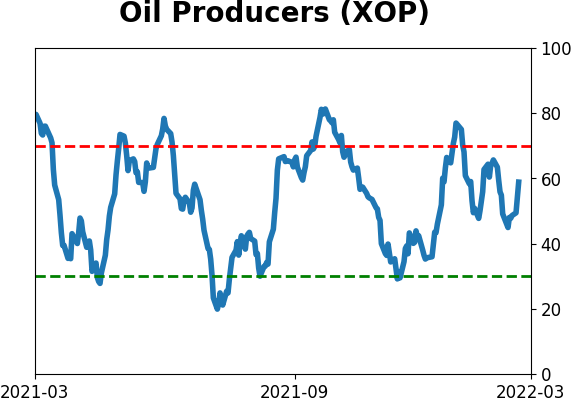
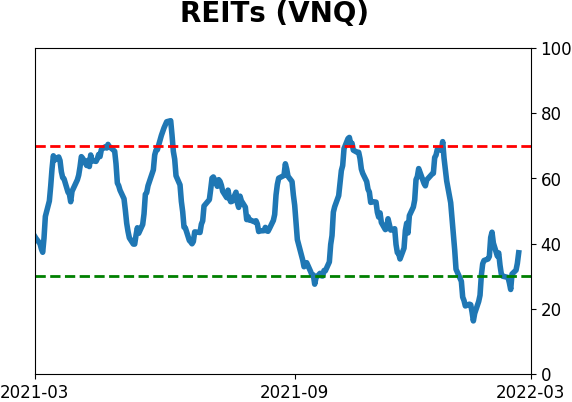
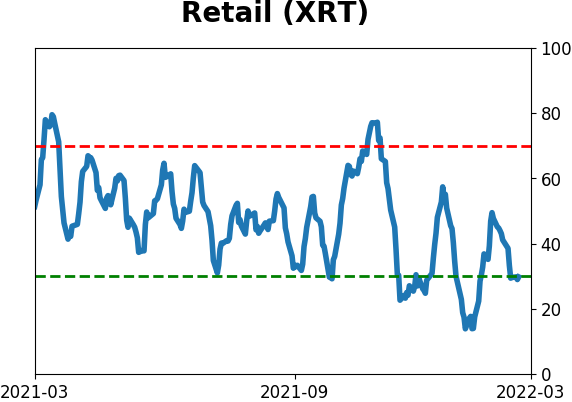
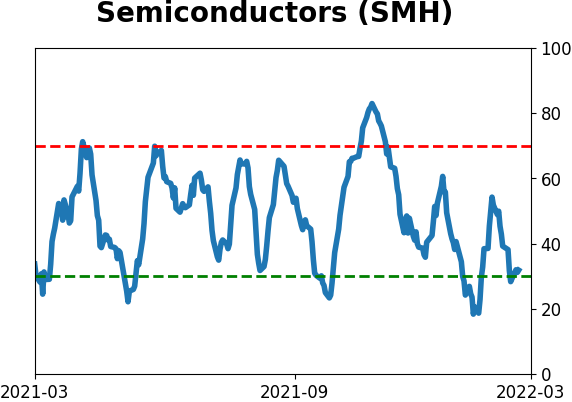
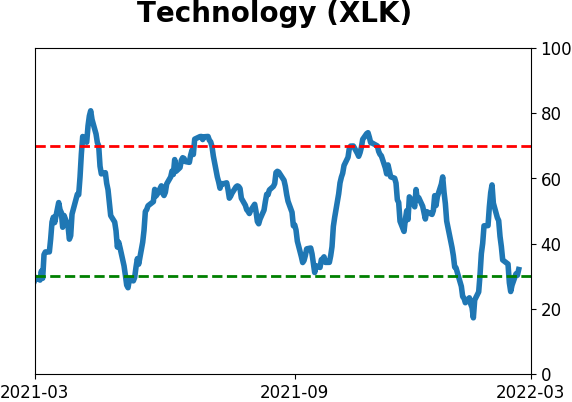
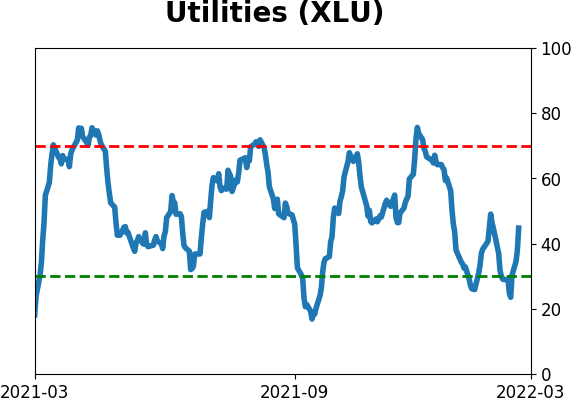
Sector ETF's - 10-Day Moving Average
|
|
|
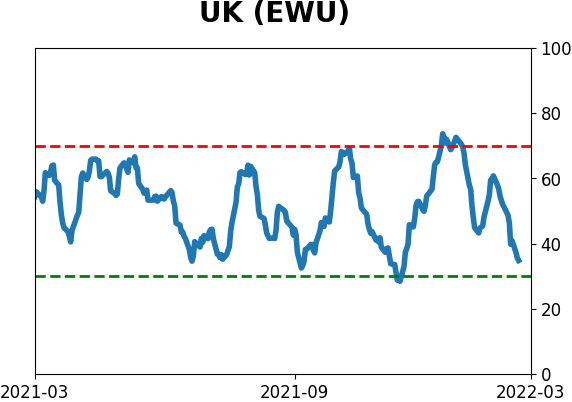
Country ETF's - 10-Day Moving Average
|
|
|
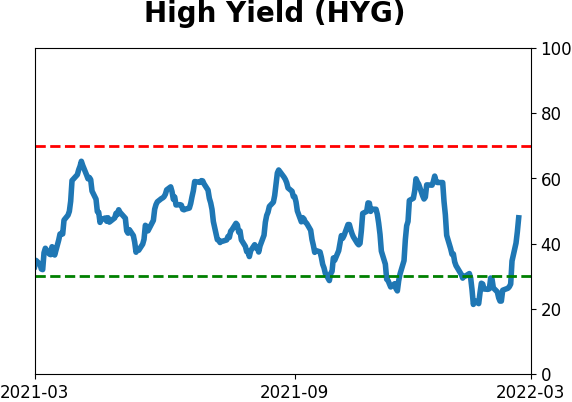
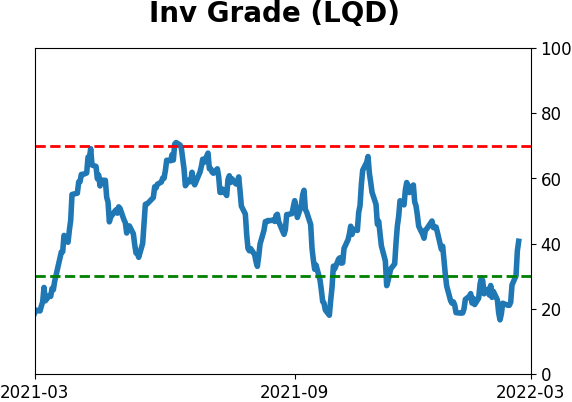
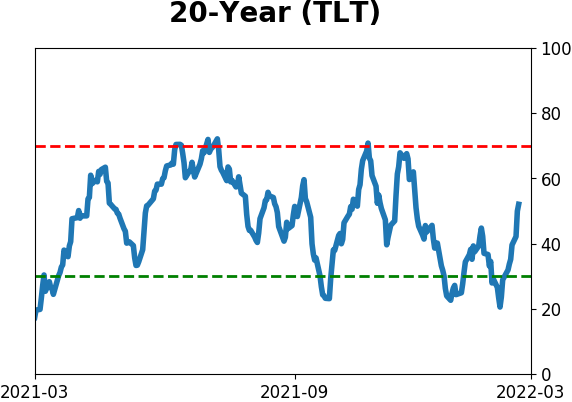
Bond ETF's - 10-Day Moving Average
|
|
|
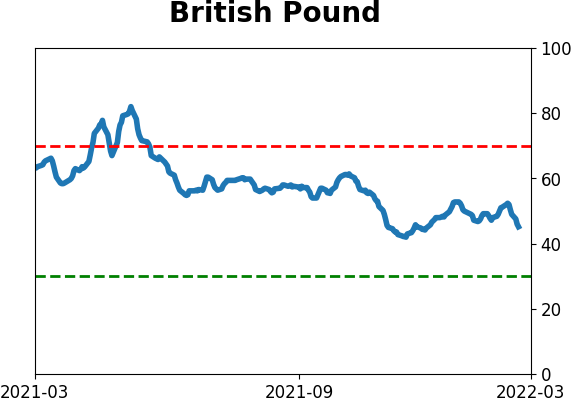
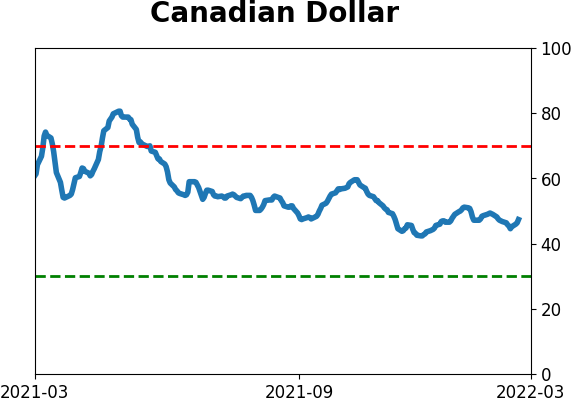
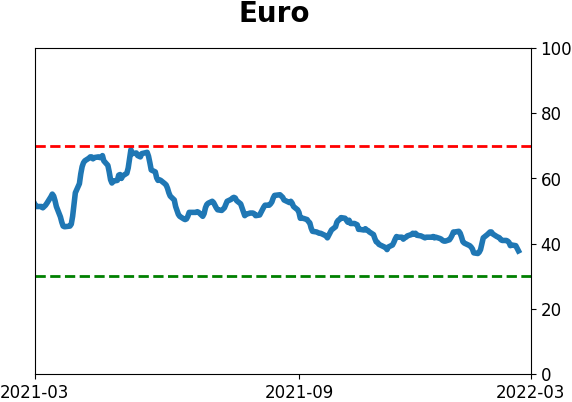
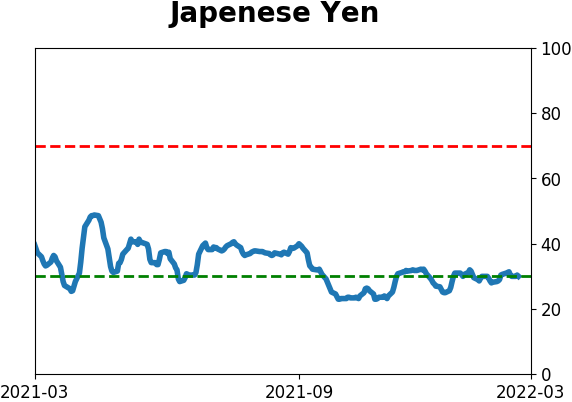
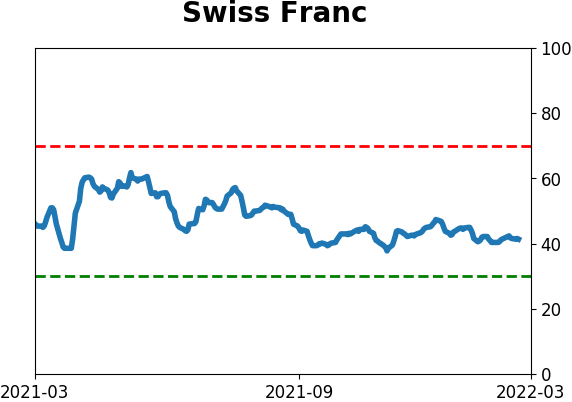
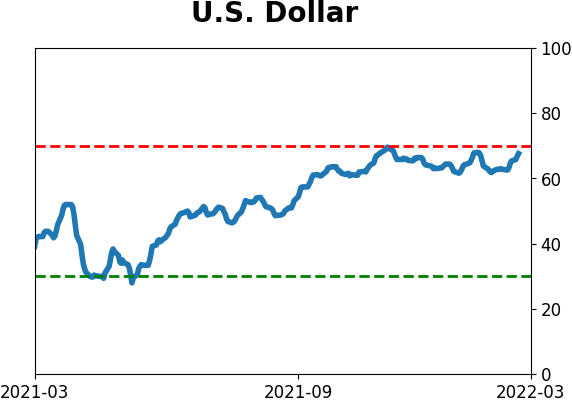
Currency ETF's - 5-Day Moving Average
|
|
|
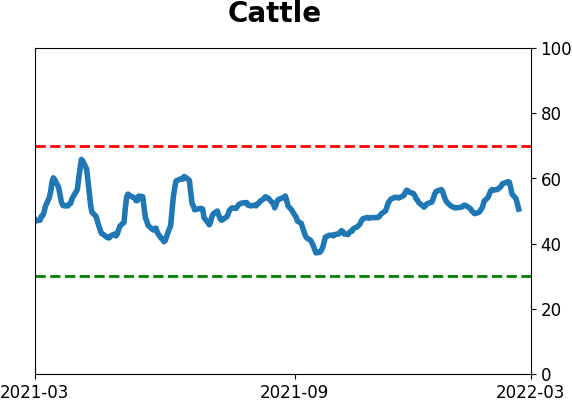
Commodity ETF's - 5-Day Moving Average
|
|