Headlines
|
|
A long cycle from last spring's massive participation in long-term uptrends:
After a historic bout of broad-based buying interest last spring, more than 95% of S&P 500 member stocks traded above their 200-day moving averages. Last week, that dropped below 40%, triggering a long cycle from extremely high participation to a low level. Similar behavior tended to precede multi-month rallies in the index.
|
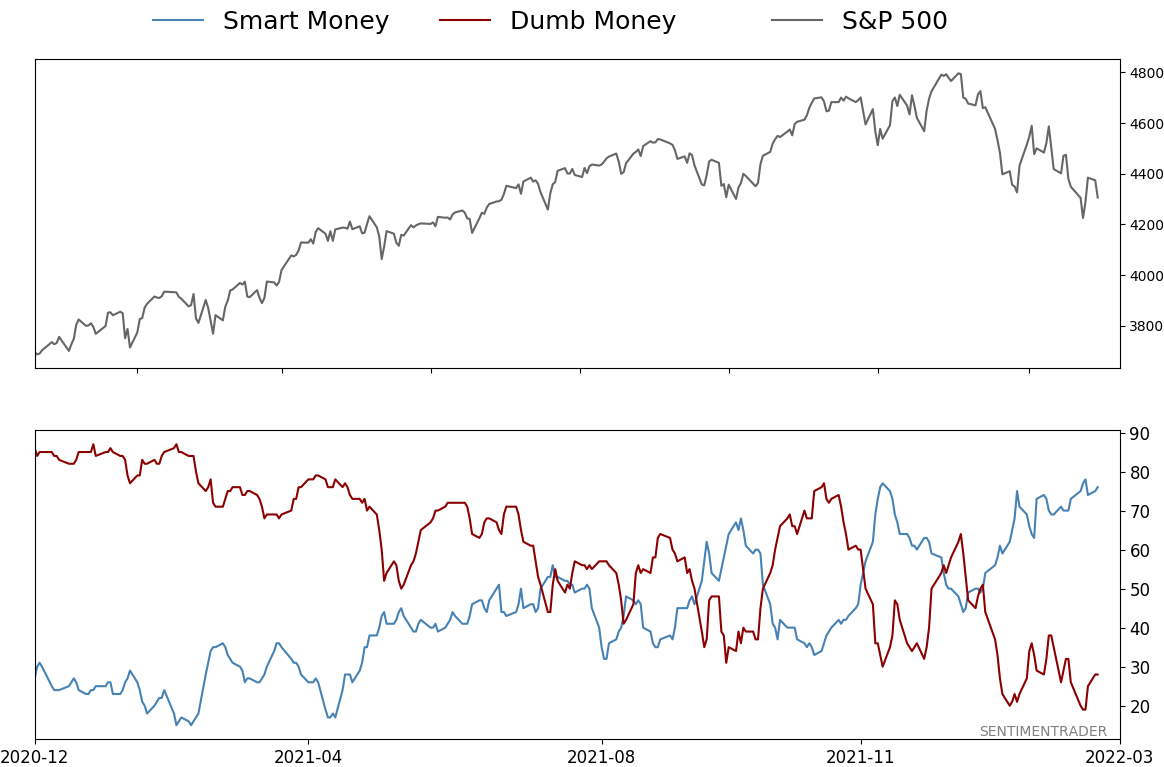
Smart / Dumb Money Confidence
|
Smart Money Confidence: 76%
Dumb Money Confidence: 28%
|
|
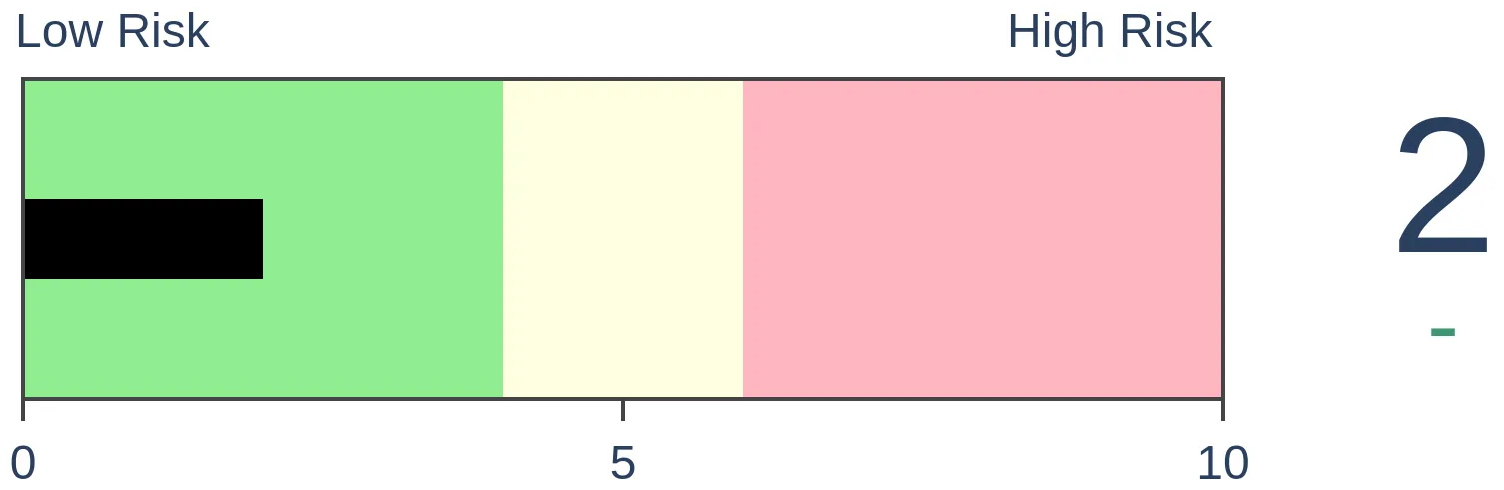
Risk Levels
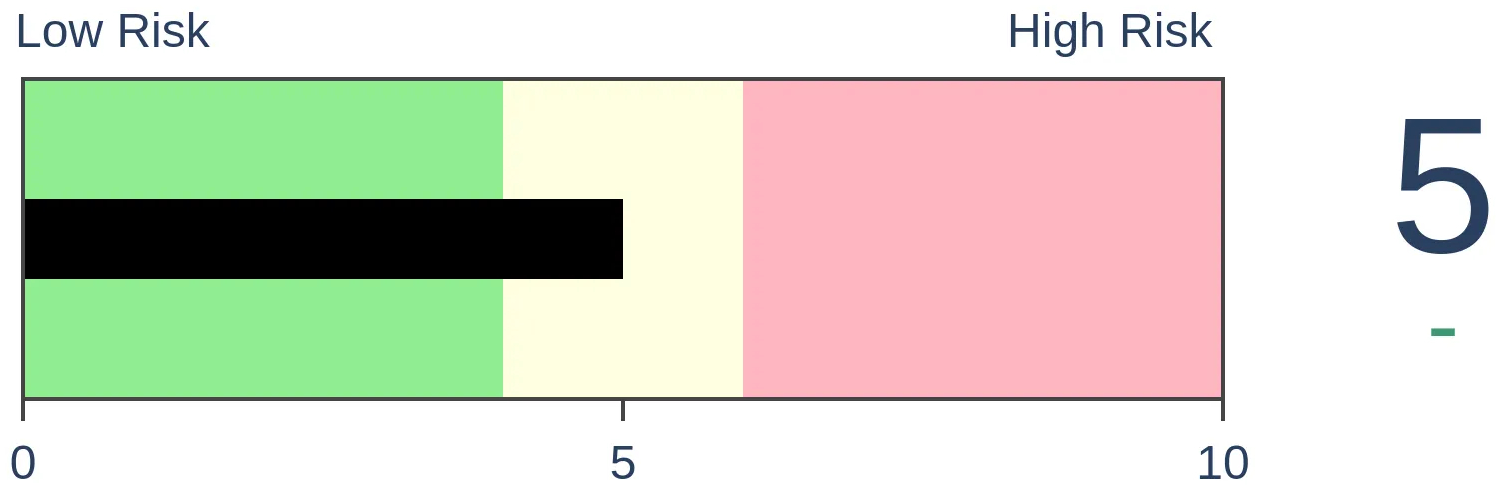
Stocks Short-Term

|
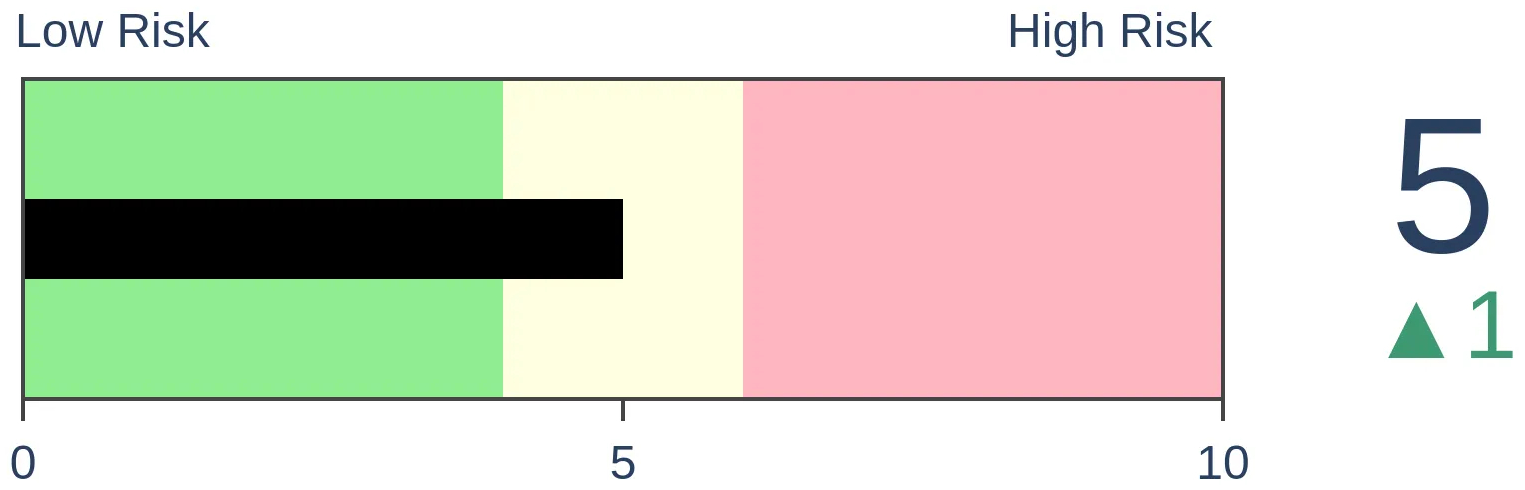
Stocks Medium-Term
|
|
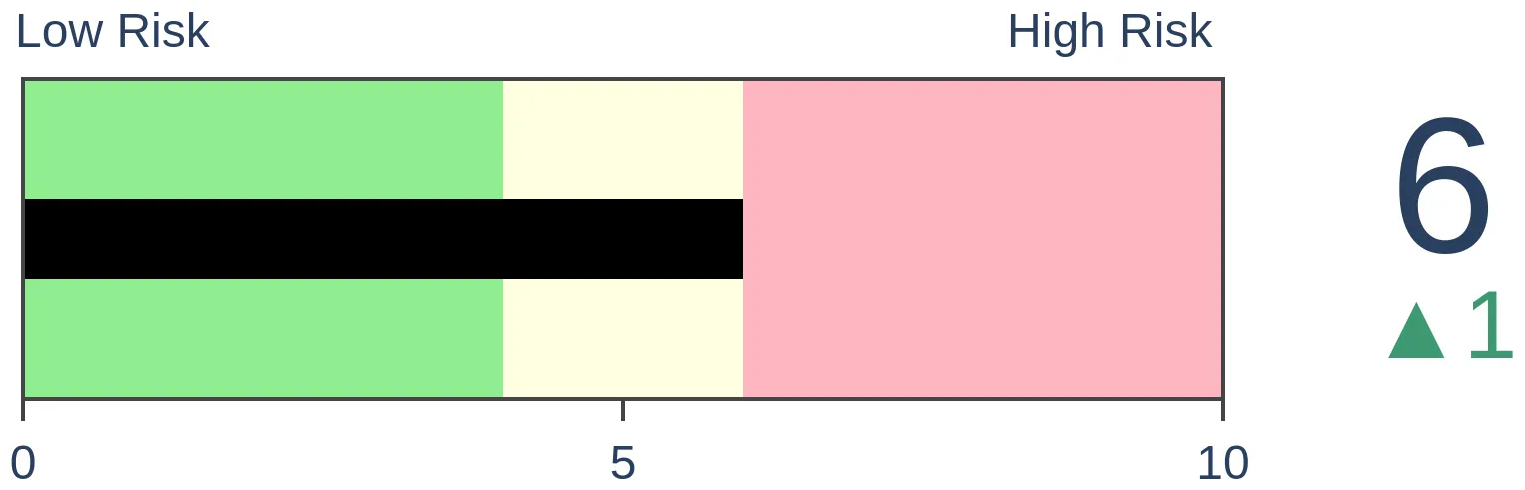
Bonds
|
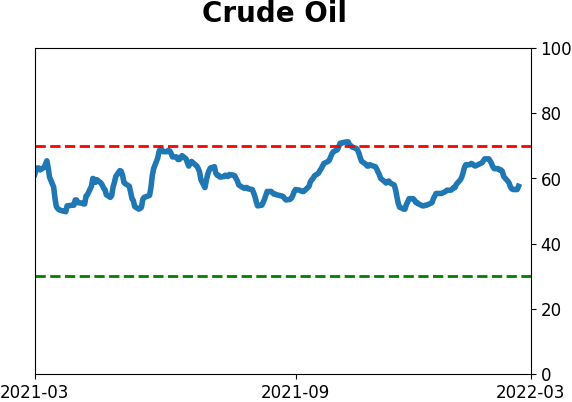
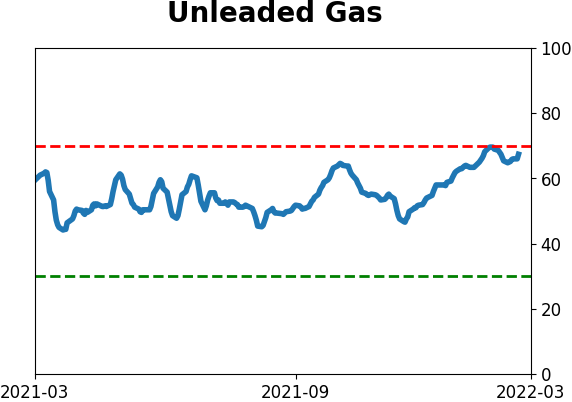
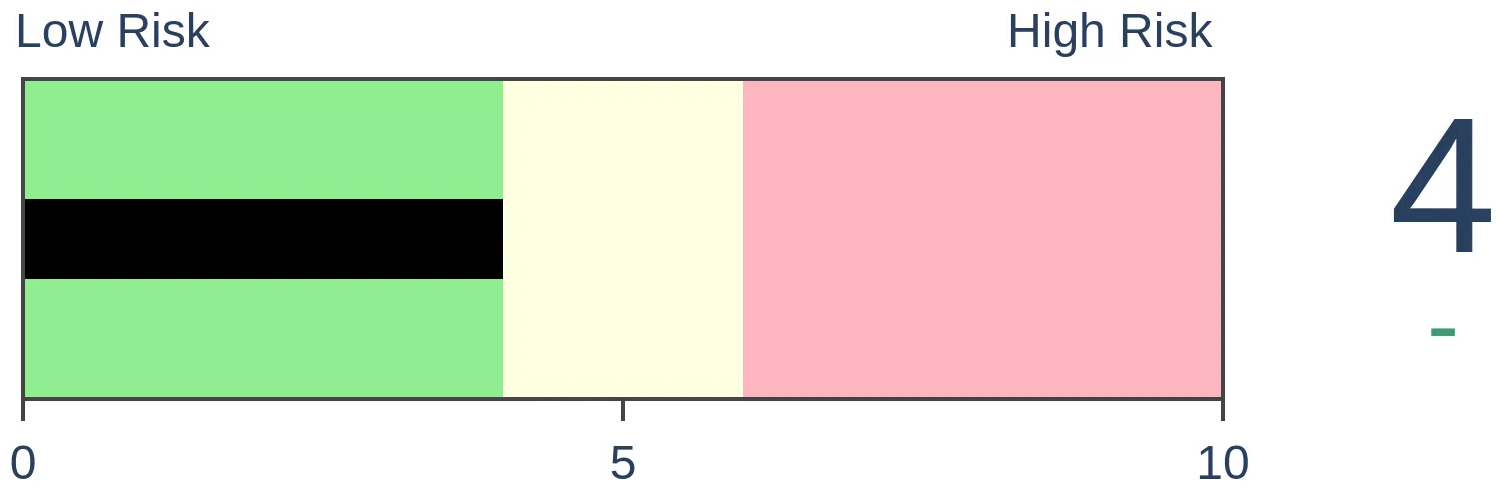
Crude Oil
|
|
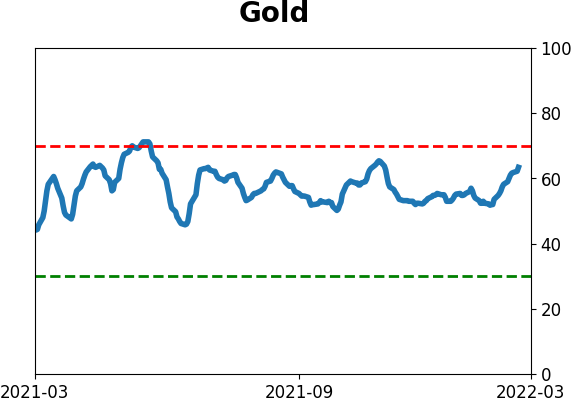
Gold
|
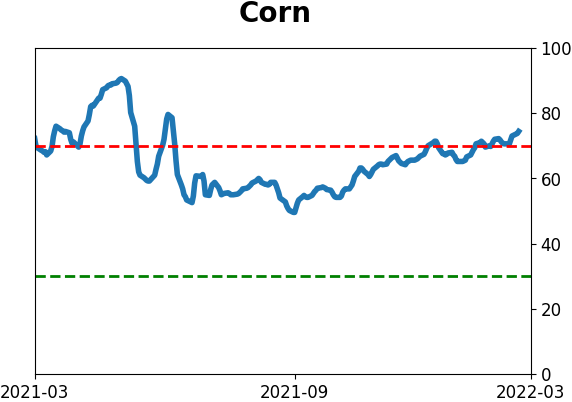
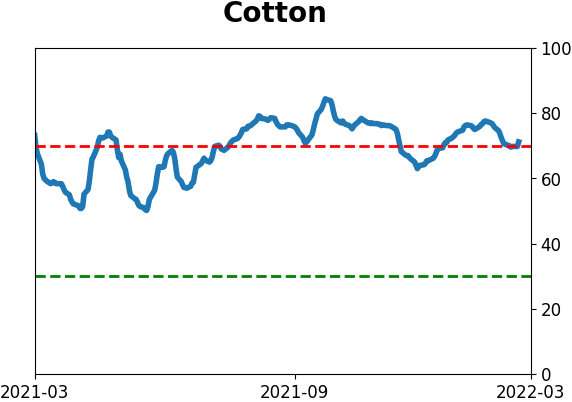
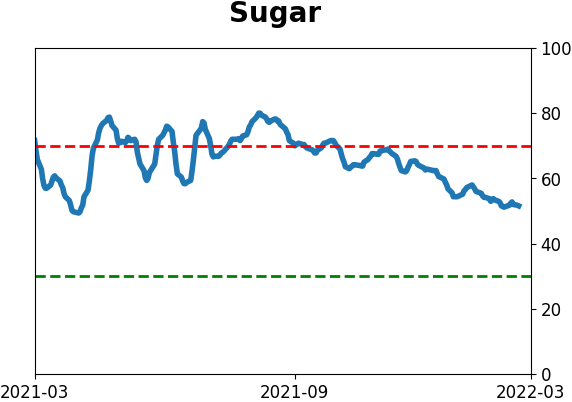
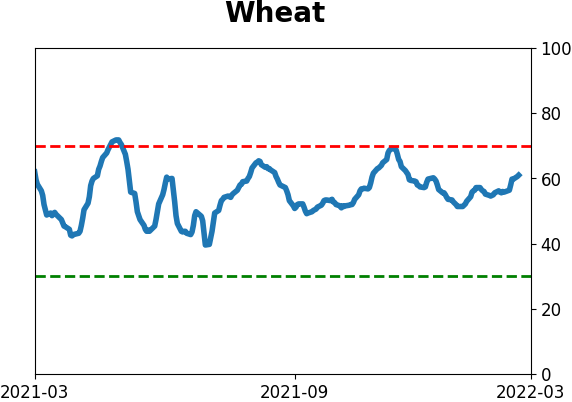
Agriculture
|
|
Research
By Jason Goepfert
BOTTOM LINE
After a historic bout of broad-based buying interest last spring, more than 95% of S&P 500 member stocks traded above their 200-day moving averages. Last week, that dropped below 40%, triggering a long cycle from extremely high participation to a low level. Similar behavior tended to precede multi-month rallies in the index.
FORECAST / TIMEFRAME
SPY -- Up, Medium-Term
|
Key points:
- Last spring, more than 90% of S&P 500 members traded above their 200-day moving averages
- After last week's selling pressure, that figure dropped below 40%
- Long cycles from above 90% to below 40% consistently preceded rebounds in the S&P
From more than 90% of stocks above average to fewer than 40%
Last spring, stocks had one of their best months in history. As we saw at the time, such broad-based buying interest across a wide variety of stocks within the S&P 500 has had a strong tendency to continue in the months ahead, which followed through yet again.
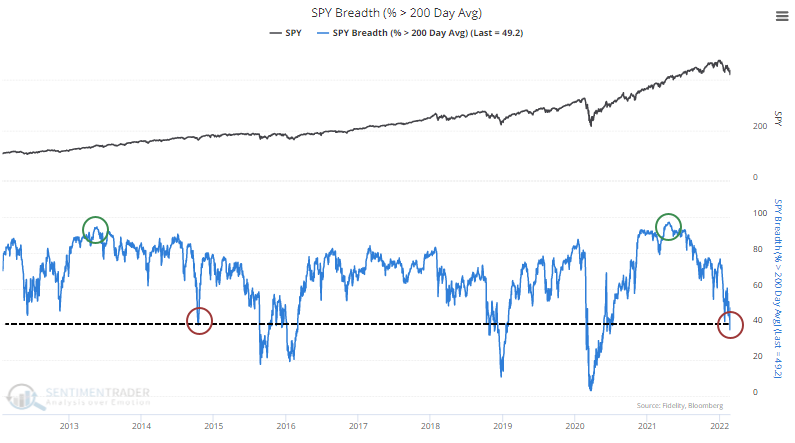
Participation within the S&P peaked in April of last year, with more than 95% of stocks in the index trading above their 200-day moving averages. That was one of the most extreme readings in nearly 100 years.
With the latest leg down last week, that figure eroded significantly, with fewer than 40% of stocks holding above their long-term averages. As we note consistently, healthy markets tend to see this metric hold above 60%, with dips below 40% attracting buyers. So far, that's been the case, but it would be better if we saw this rebound (and hold) above 60%.
Dean noted on Monday that it was a relatively quick reversal from more than 80% of stocks holding above their average to fewer than 50%. Quick reversals above and below those thresholds had a decent track record of preceding rebounds.
If we expand the thresholds to include the extremes over the past year, then the table below shows every time the S&P 500 went from having more than 90% of its member stocks above their 200-day averages to fewer than 40%.
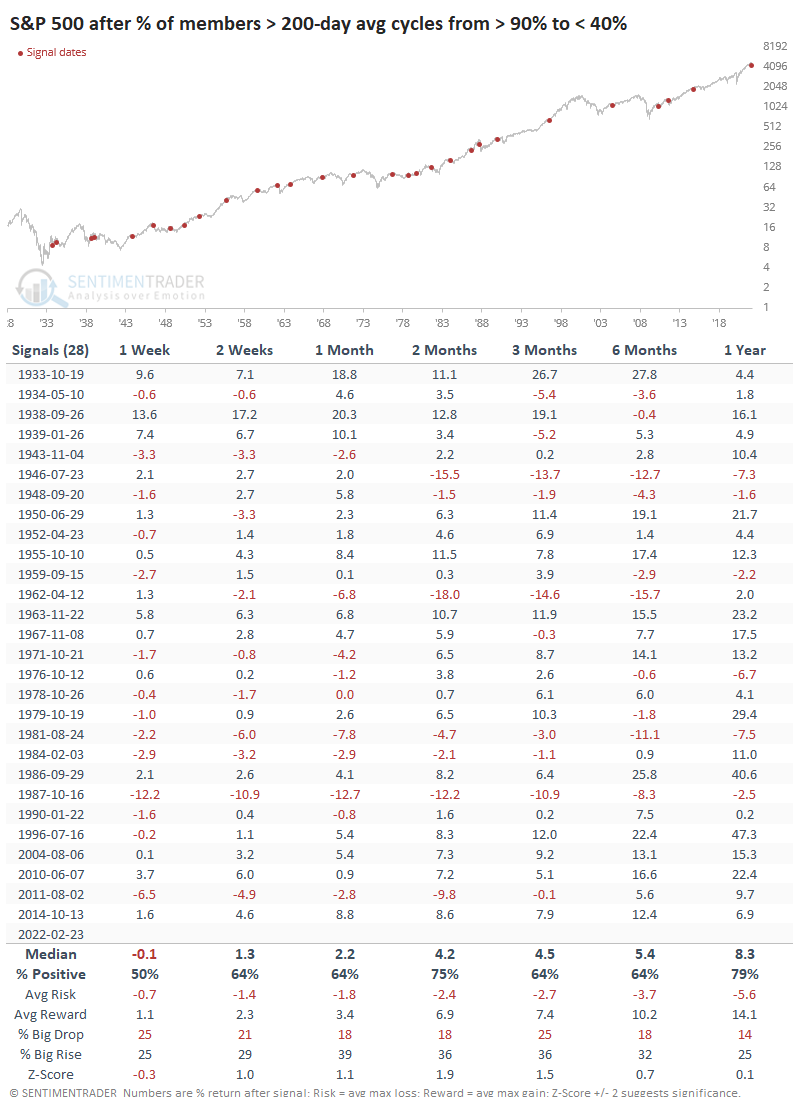
Returns were okay, modestly above any random return. But there were some hefty losses in there, too.
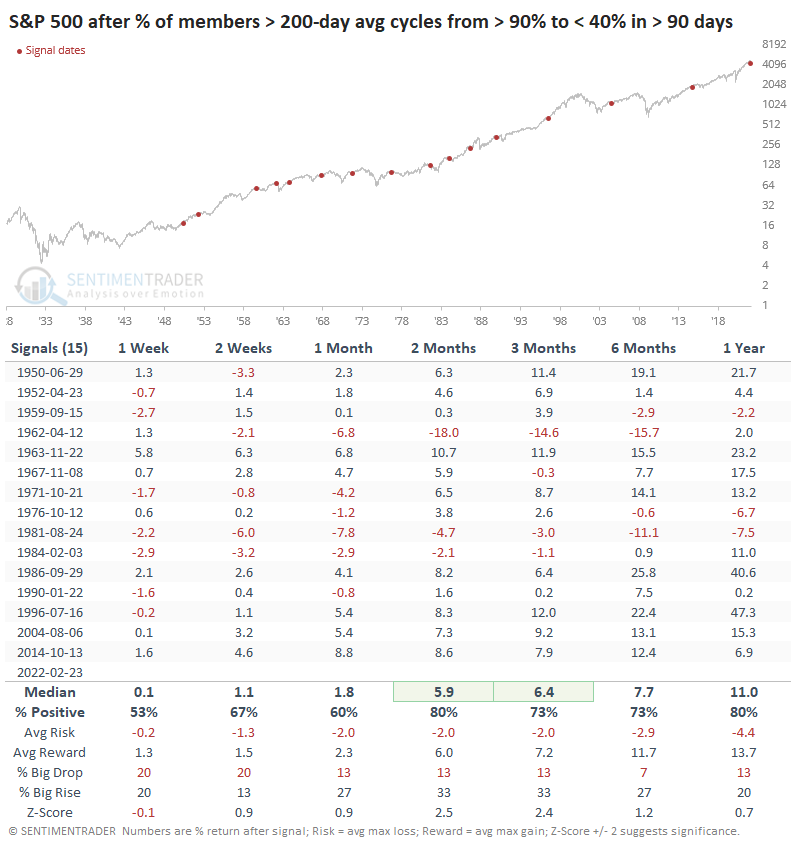
Curiously, it has taken a long time to see this cycle play out. While the trip from above 80% to below 50% happened in under 30 days, it has taken more than 6 months to go from above 90% to below 40%, just like it did in 2014. This tells us that after the massive participation last spring, buyers have been relatively intent on staying involved. Turns out, that's a pretty good sign.
Once we saw fewer than 40% of stocks holding above their 200-day averages, the S&P rebounded consistently over the next 2-3 months and beyond, with a good median return and risk/reward ratio. There was a severe loss in 1962 that took a year to recover, and the signal in 1981 wasn't great, either. Other than that, returns were quite good.
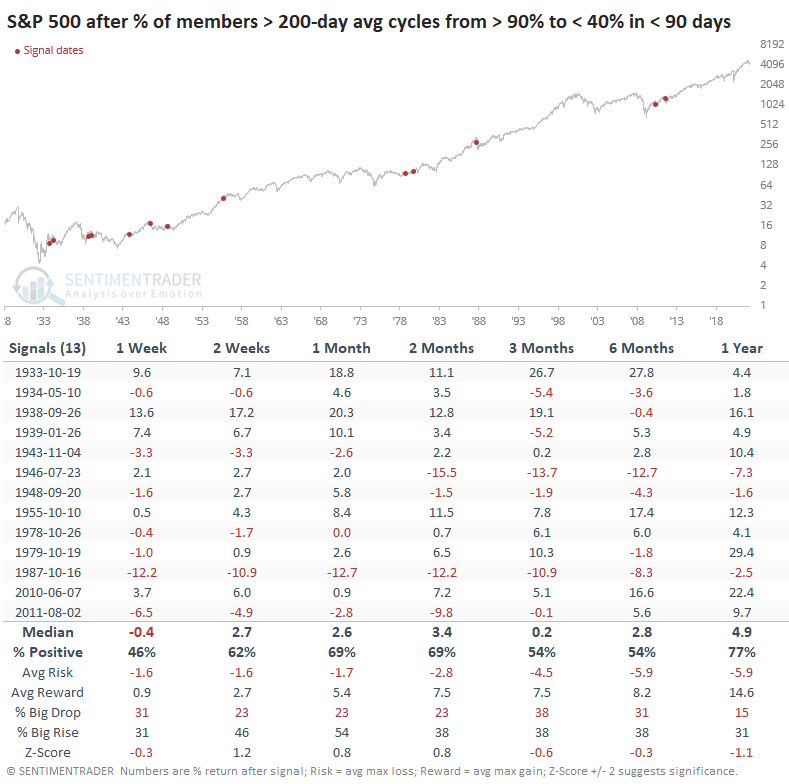
It's notable how much worse the medium-term returns were when it took fewer than 90 days to cycle from above 90% participation to below 40%. These quicker and more severe bouts of selling had more of a tendency to persist in the months ahead.
What the research tells us...
A little less than a year ago, stocks were having one of their best stretches in history. Momentum was incredible, and it was extremely broad-based. There has been internal churn since then, and the last week of semi-panic selling pressure caused even formerly well-bid stocks to decline below their 200-day averages. When we see a long cycle from extremely high participation to below-average levels, it has tended to serve as a decent signal that buyers were about to return, pushing stocks higher for the next 2-3 months.
Active Studies
| Time Frame | Bullish | Bearish | | Short-Term | 3 | 0 | | Medium-Term | 20 | 2 | | Long-Term | 15 | 5 |
|
Indicators at Extremes
Portfolio
| Position | Description | Weight % | Added / Reduced | Date | | Stocks | RSP | 21.4 | Added 10.2% | 2022-01-28 | | Bonds | 32.7% BND, 7.1% SCHP | 40.1 | Added 8.3% | 2021-10-26 | | Commodities | GCC | 2.4 | Reduced 2.1%
| 2020-09-04 | | Precious Metals | GDX | 4.6 | Reduced 4.2% | 2021-05-19 | | Special Situations | 7.6% KWEB, 4.9% XBI, 3.7% XLE, 1.8% PSCE | 18.0 | Added 4.6% | 2022-02-24 | | Cash | | 13.2 | | |
|
Updates (Changes made today are underlined)
With a typical time frame of several months in this account, I normally don't make changes so quickly. I've added back part of the stock exposure I took off earlier in January due to the washed-out conditions and extreme pessimism we're seeing across a wide array of metrics. The biggest issue is that the environment is unhealthy and we could be in the throes of a protracted bear market. Even so, the readings we've seen recently have a good record at preceding relief rallies, so we'll have to see how that pans out. Bond sentiment is trying to recover from a recent bout of pessimism, and gold stocks are doing their thing which is not much at all. They've been flat for six months. Chinese tech stocks were doing exactly what they're supposed to do, then did *not* by plunging to new lows. This is troubling on a shorter-term time frame, but this was never meant for a trade, rather a multi-year investment. Recent behavior is troubling and I will not be adding any exposure as long as that's the case. RETURN YTD: +0.4% 2021: +8.7%, 2020: +8.1%, 2019: +12.6%, 2018: +0.6%, 2017: +3.8%, 2016: +17.1%, 2015: +9.2%, 2014: +14.5%, 2013: +2.2%, 2012: +10.8%, 2011: +16.5%, 2010: +15.3%, 2009: +23.9%, 2008: +16.2%, 2007: +7.8%
|
|
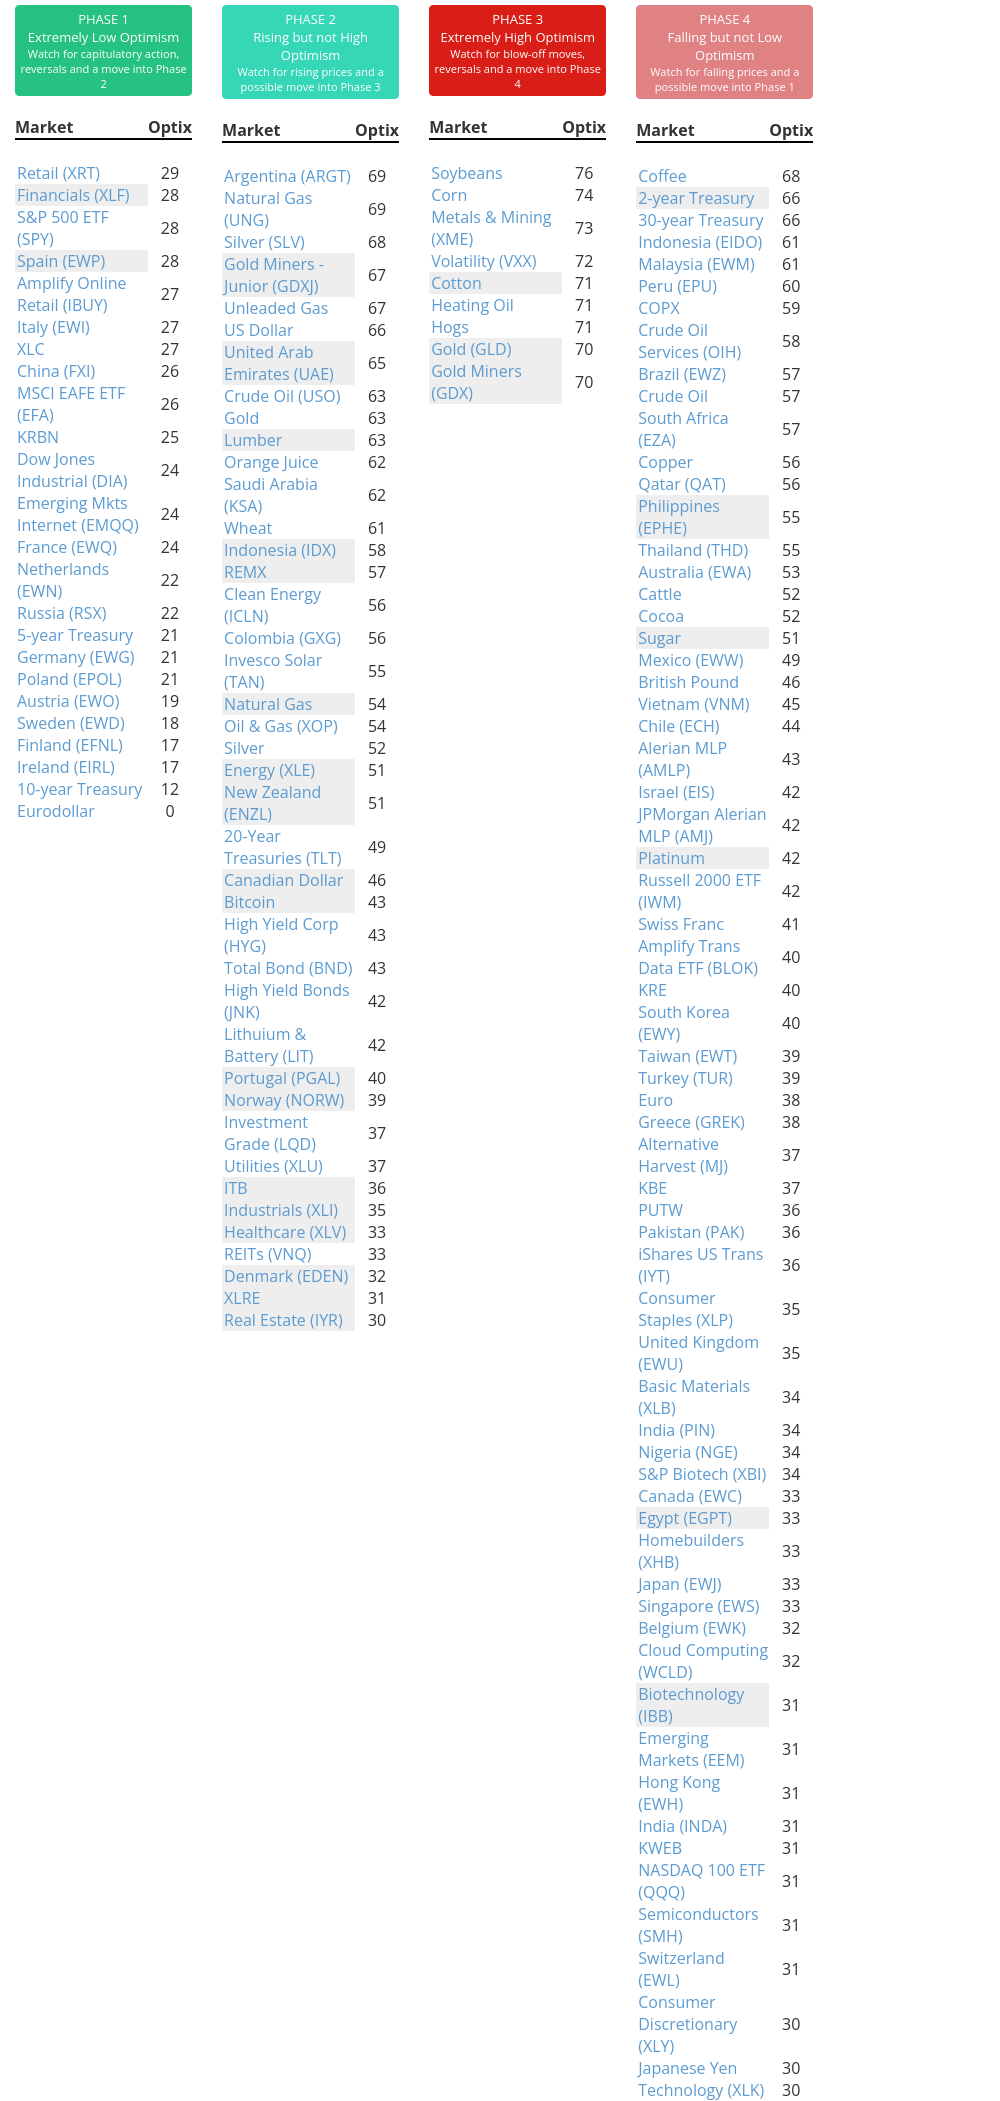
Phase Table
Ranks
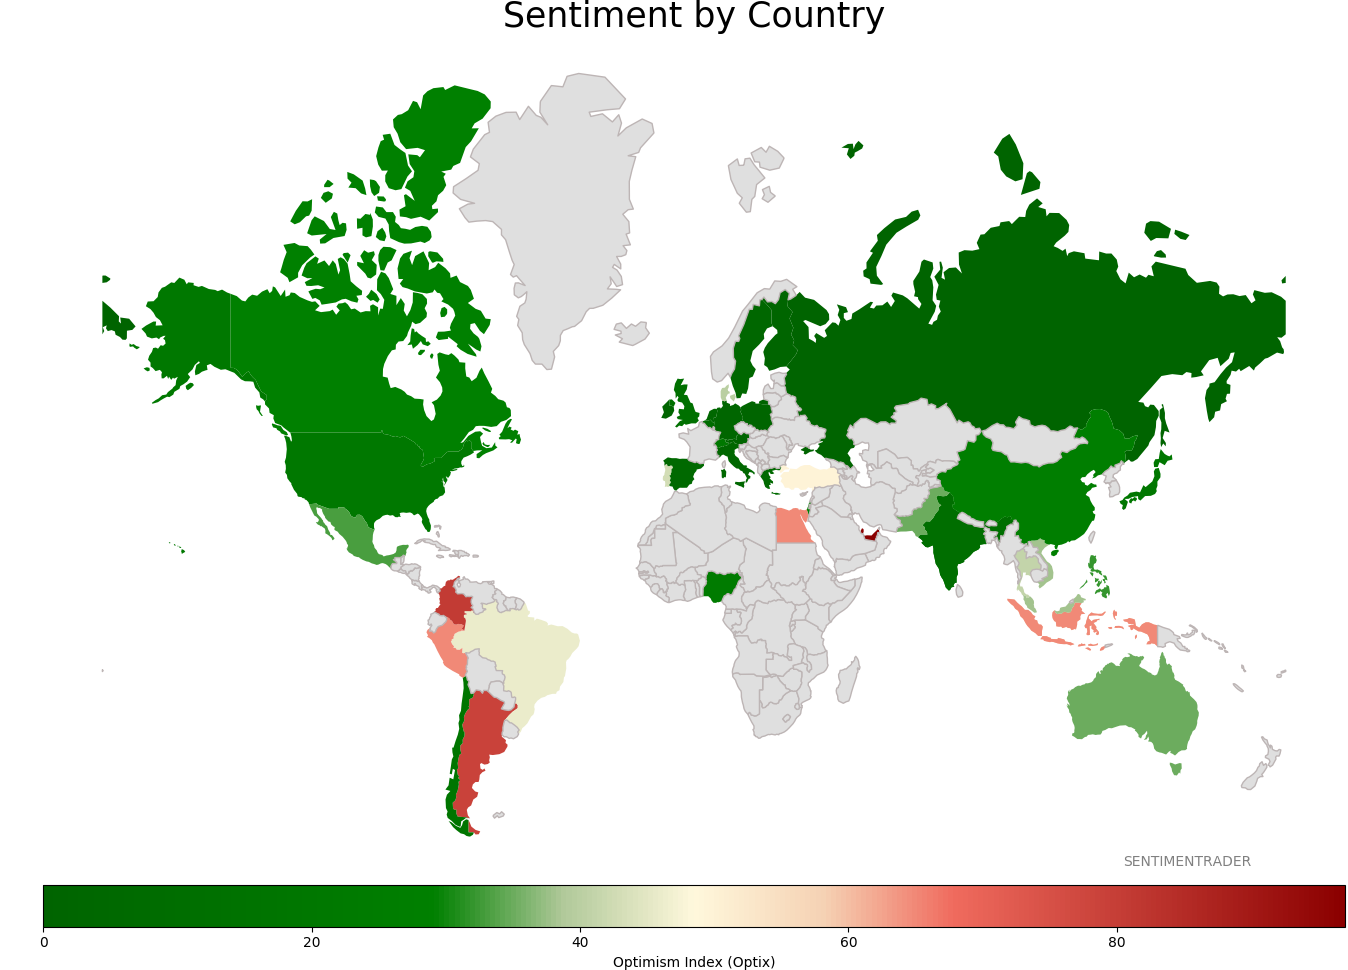
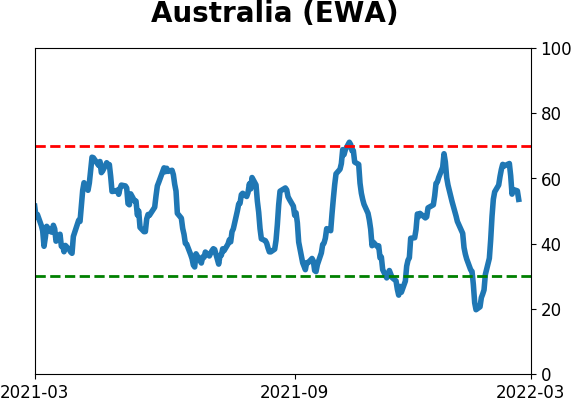
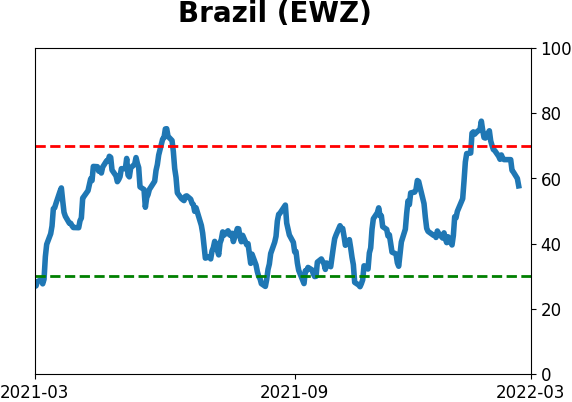
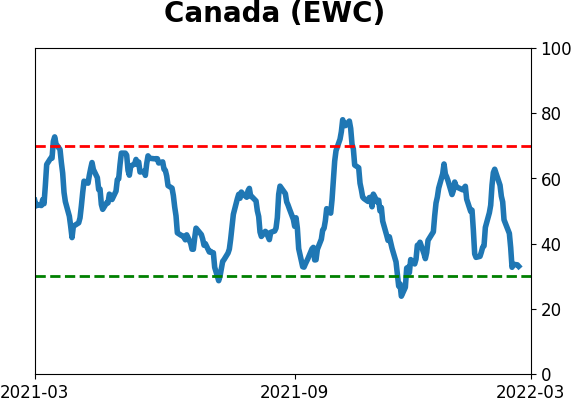
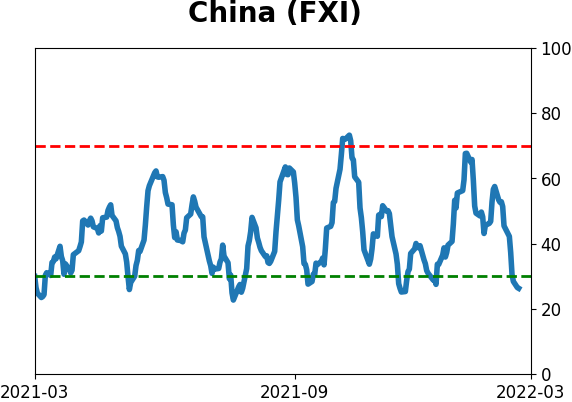
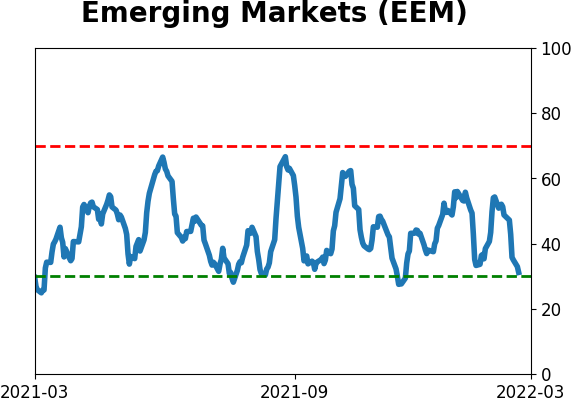
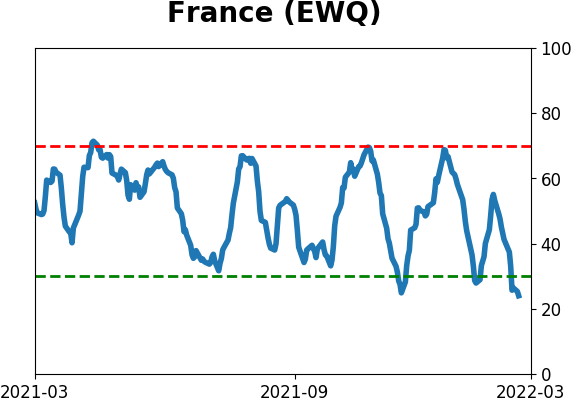
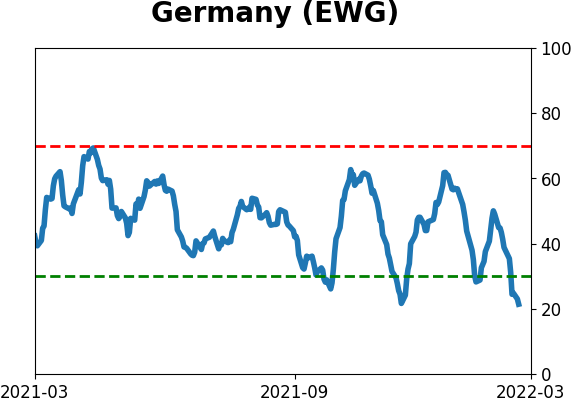
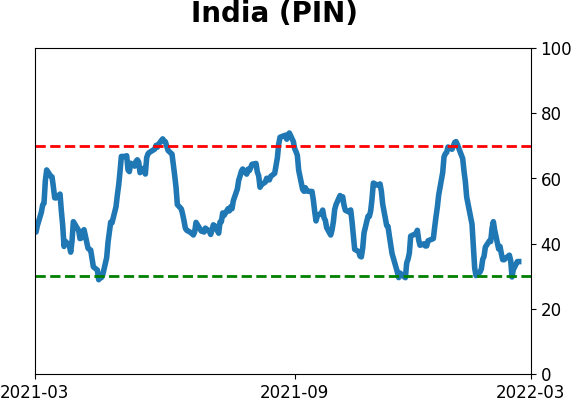
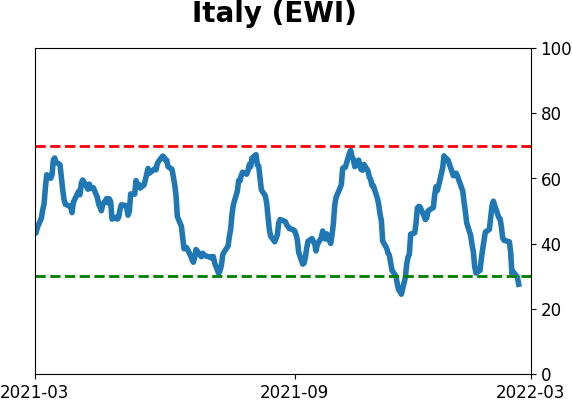
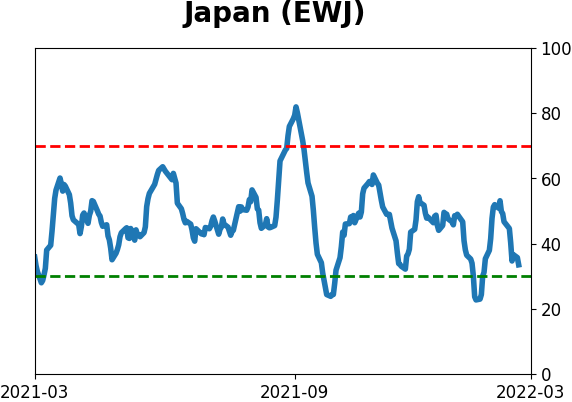
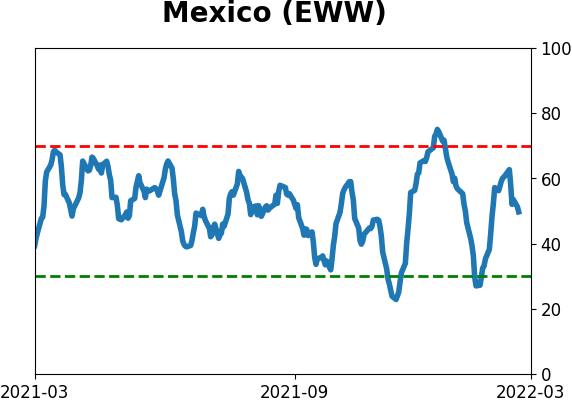
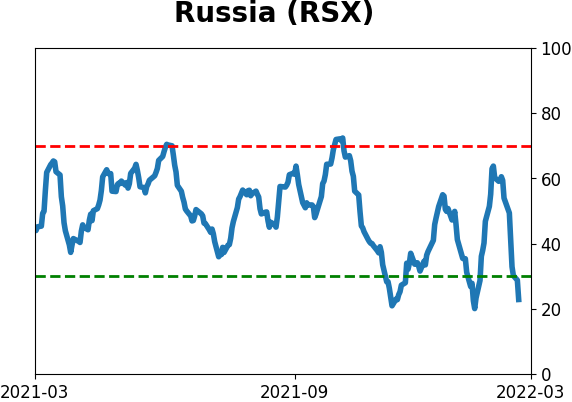
Sentiment Around The World
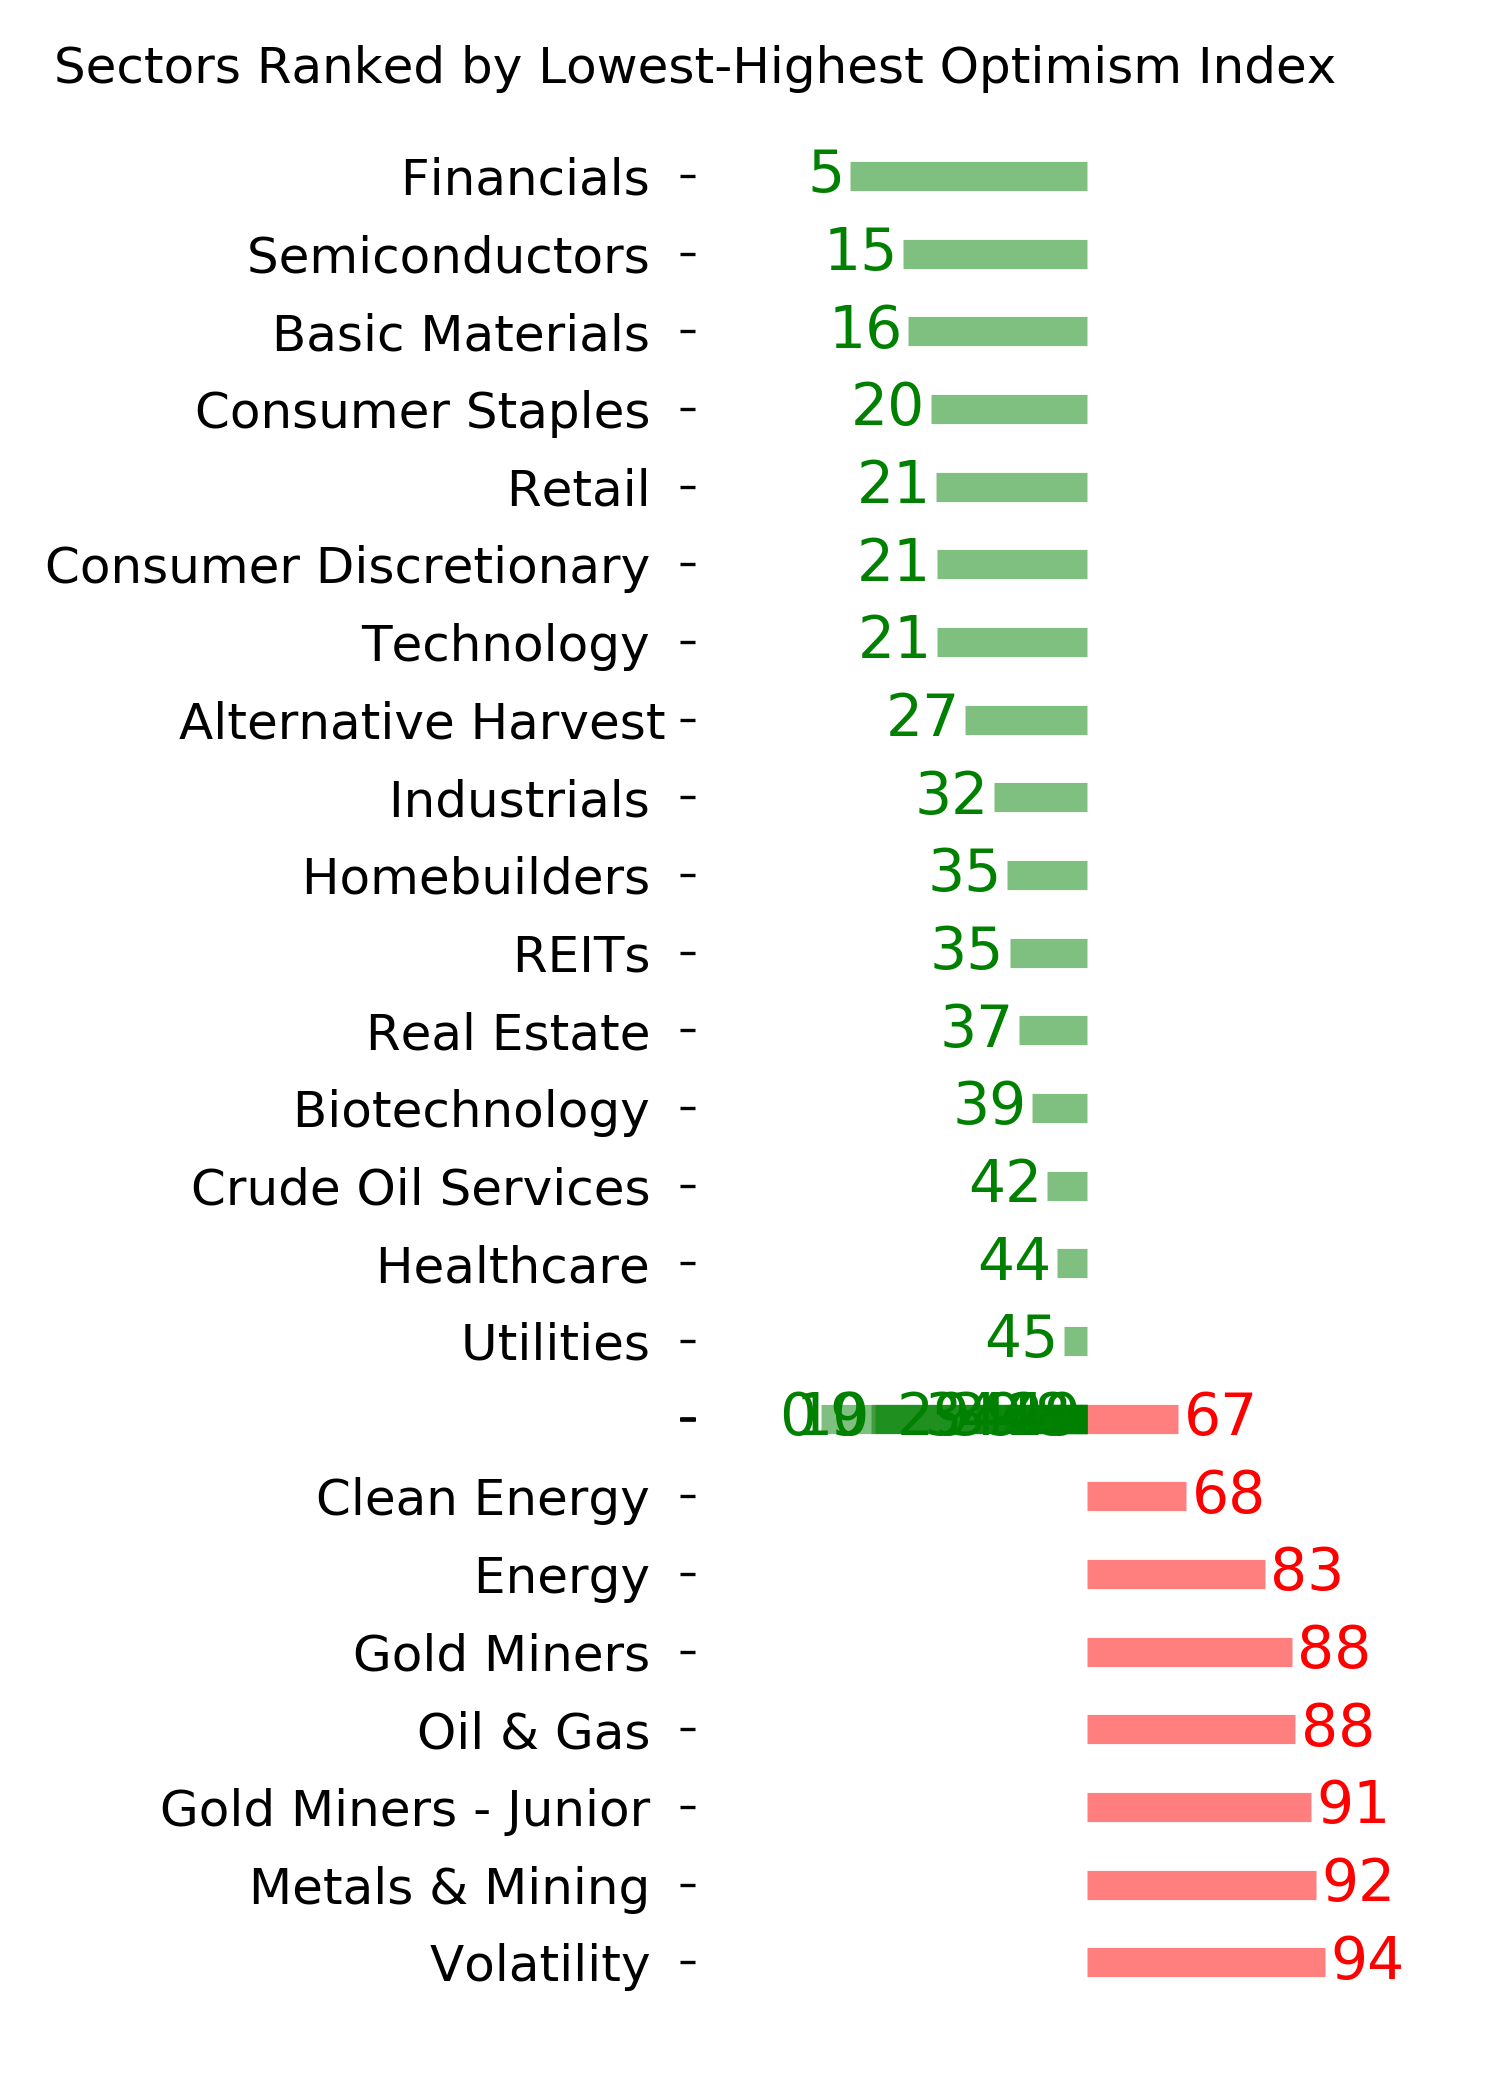
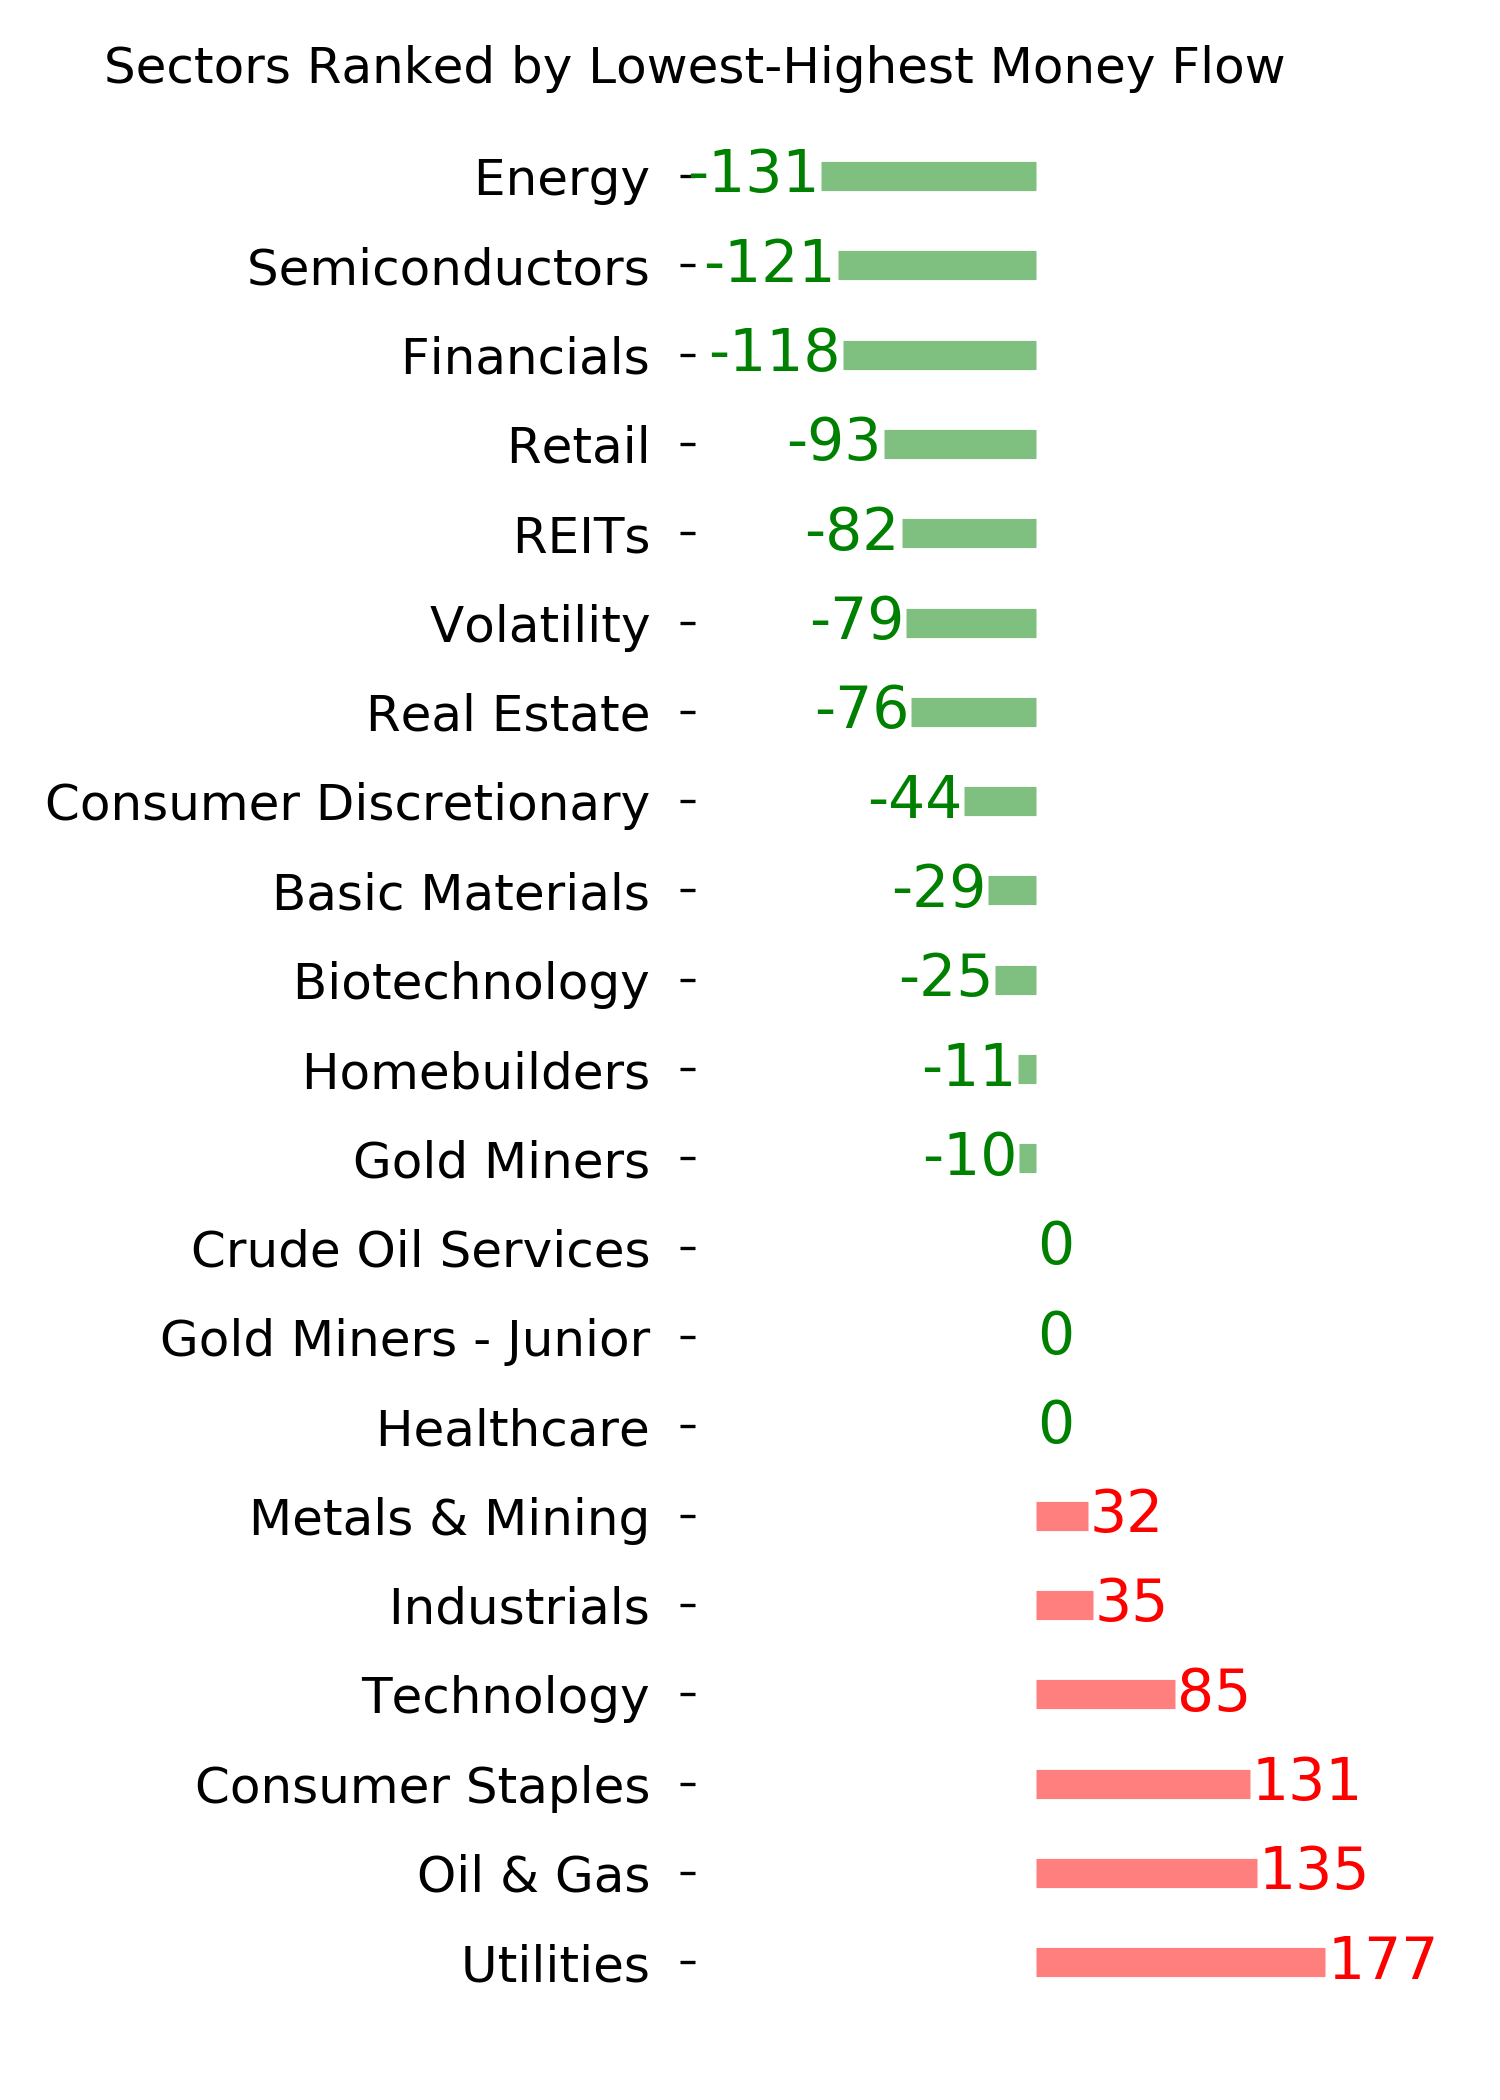
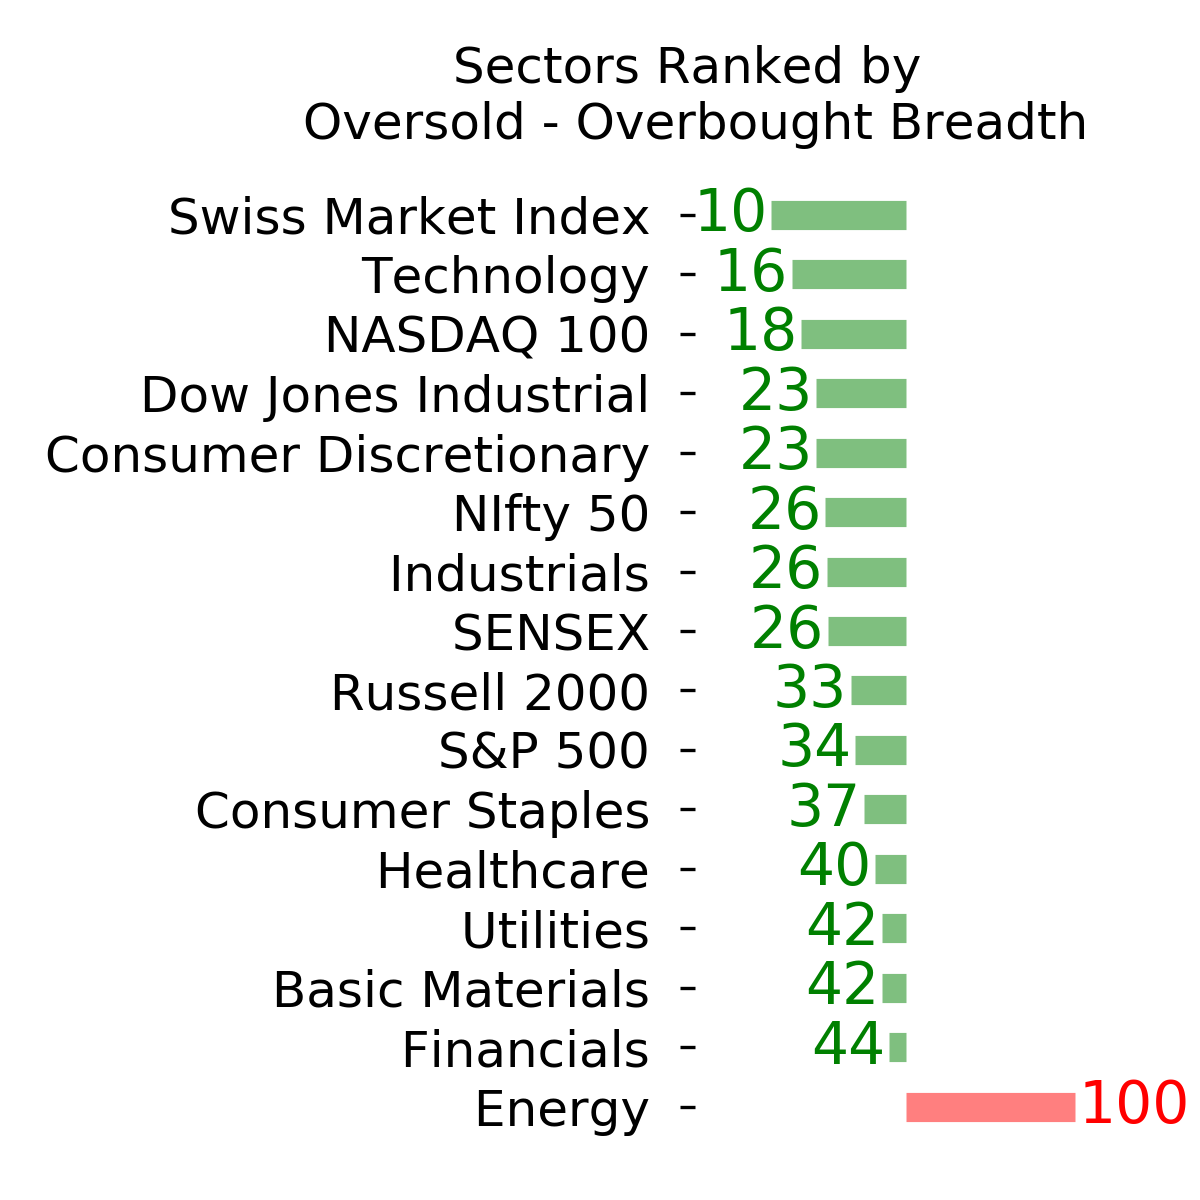
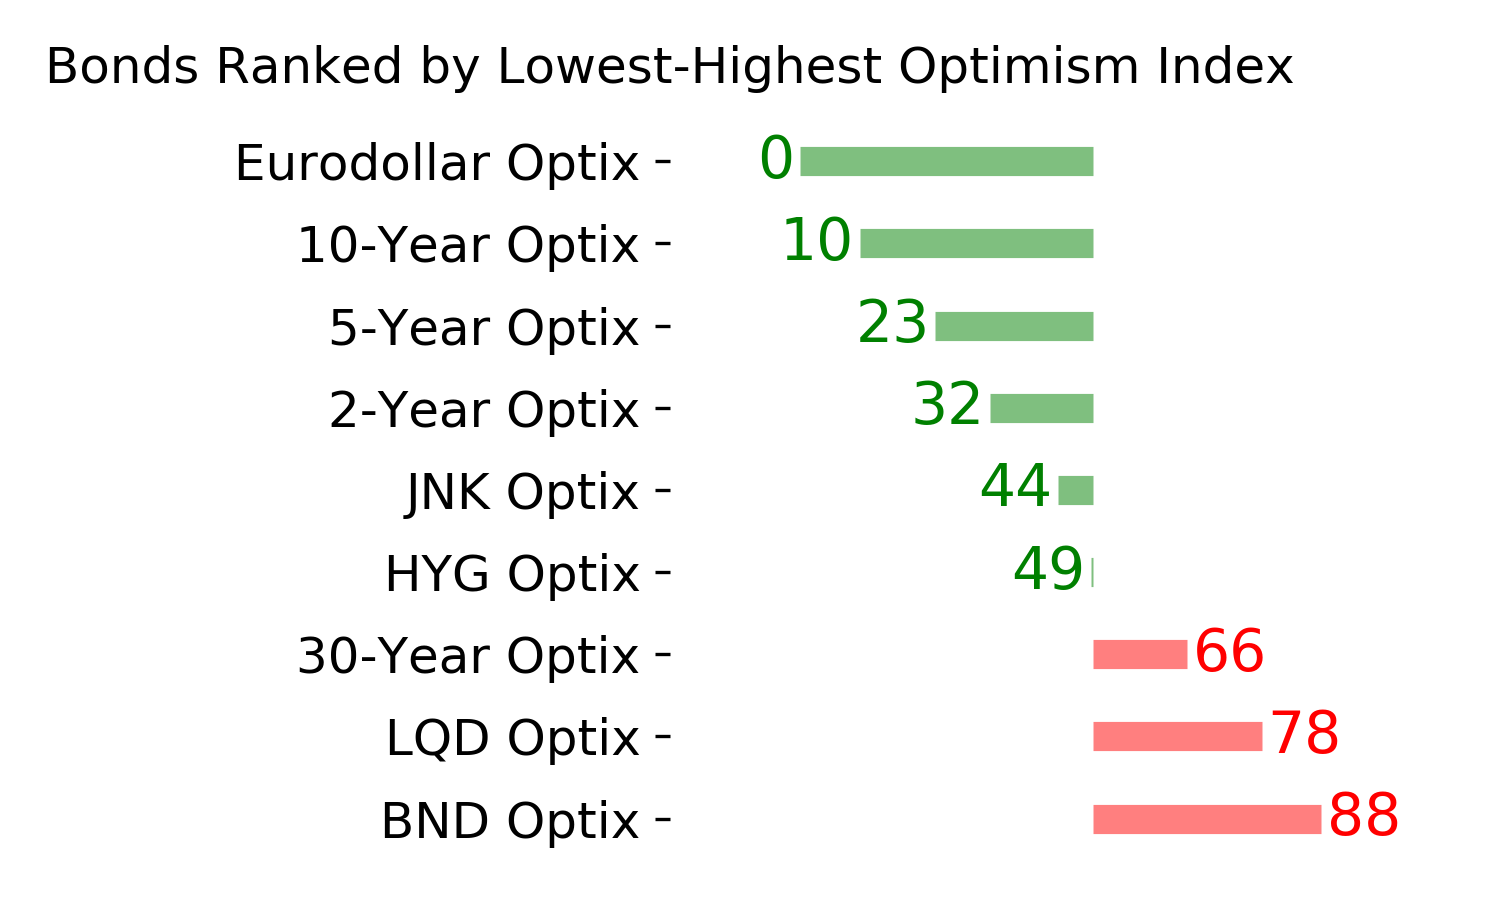
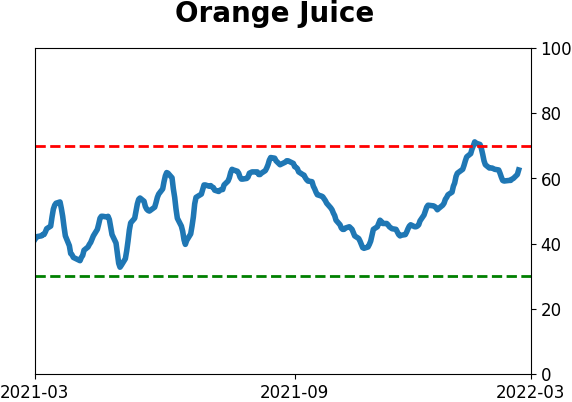
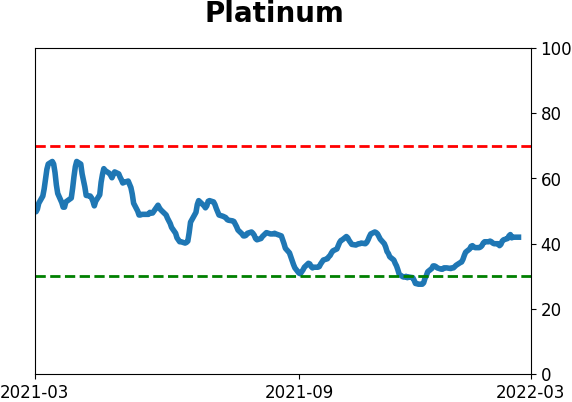
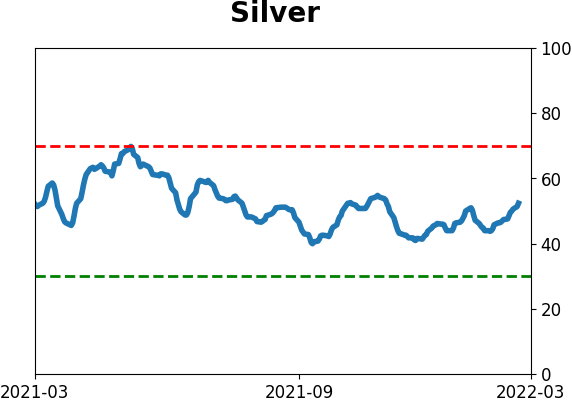
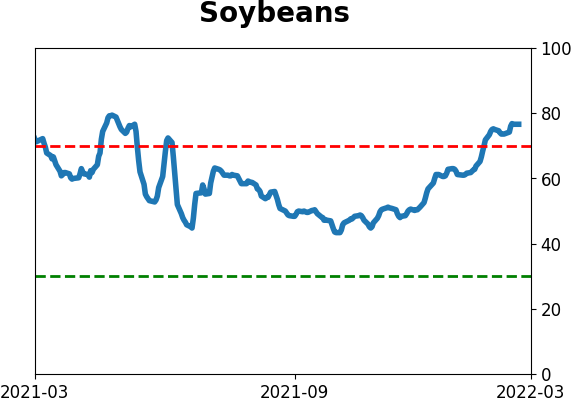
Optimism Index Thumbnails
|
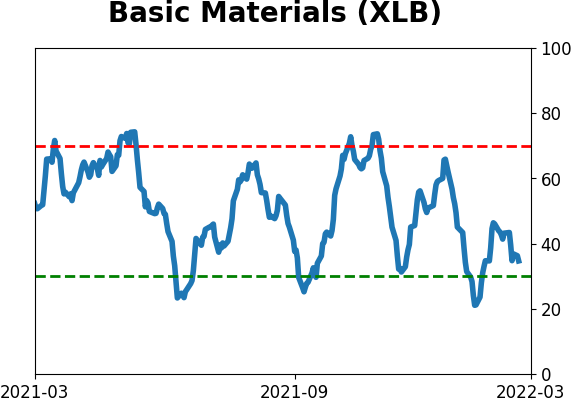
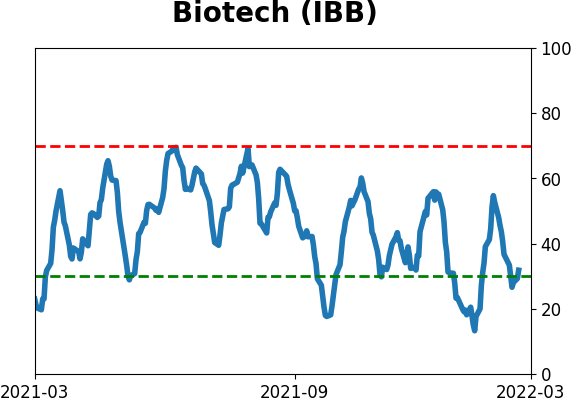
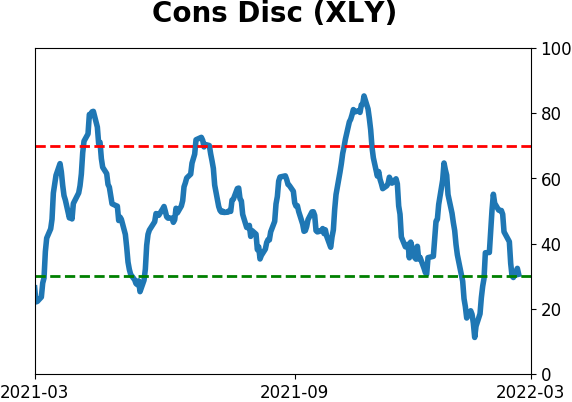
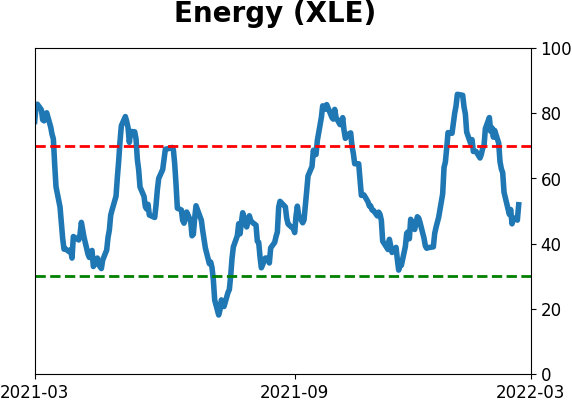
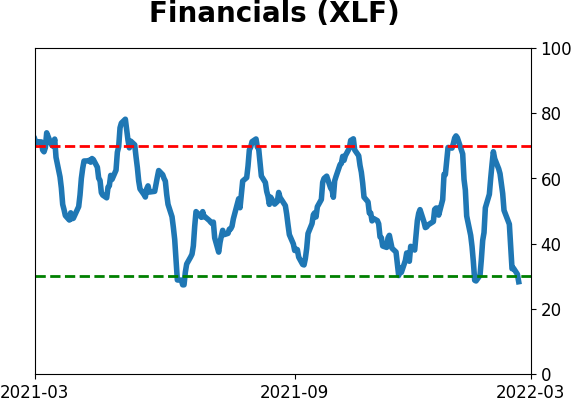
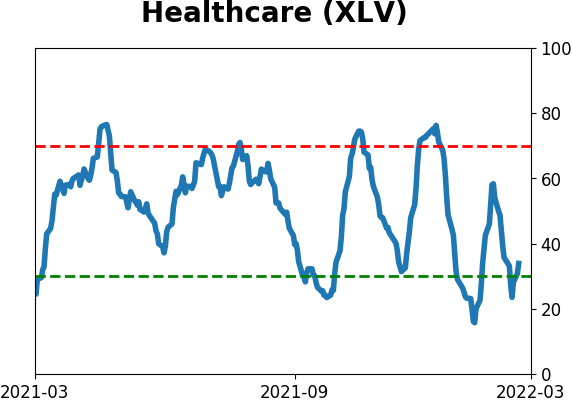
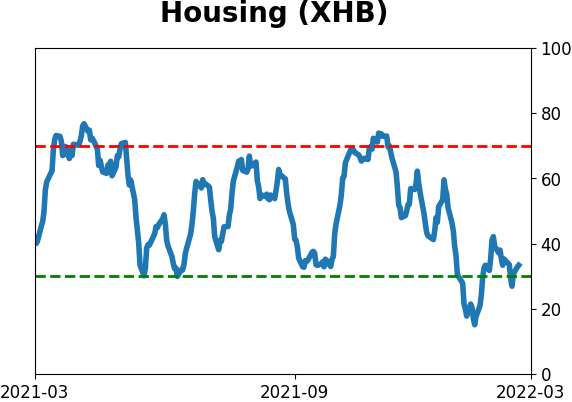
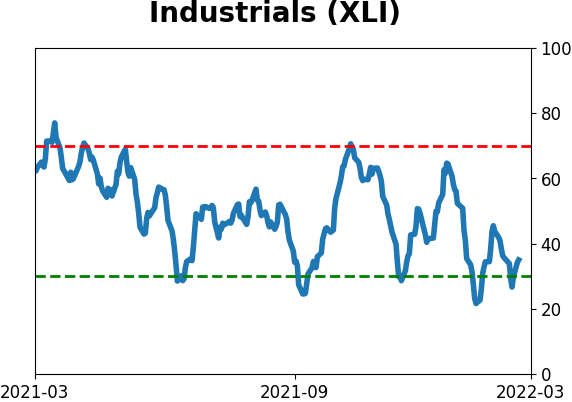
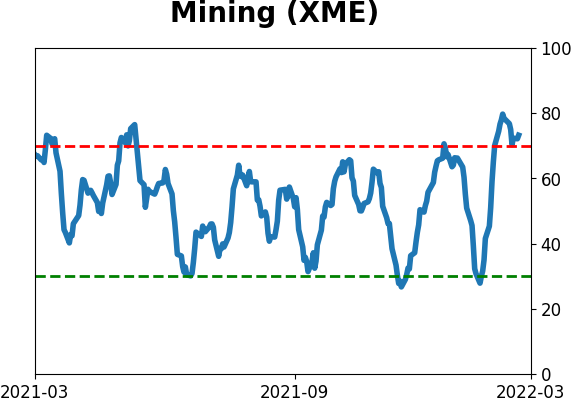
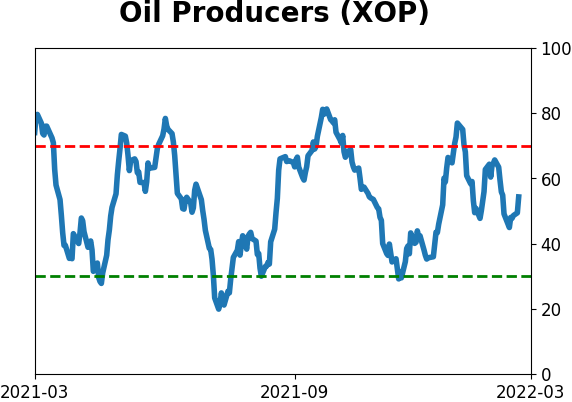
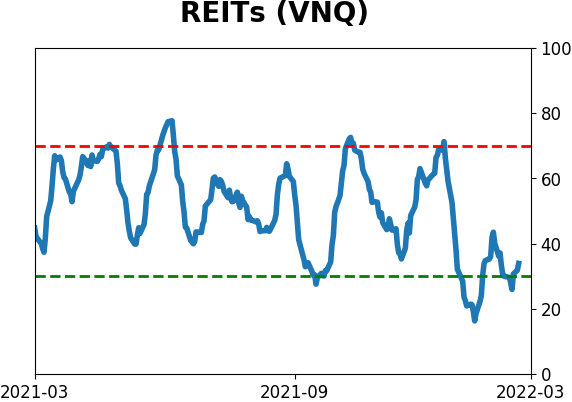
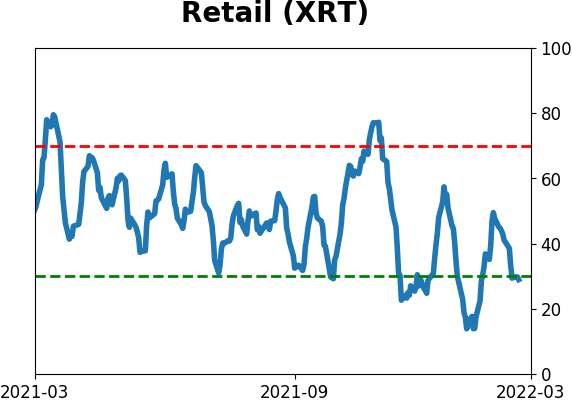
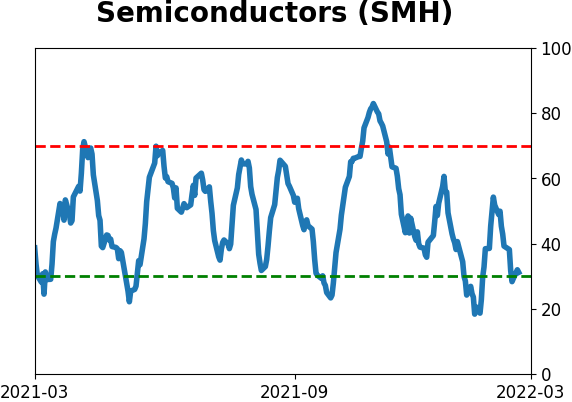
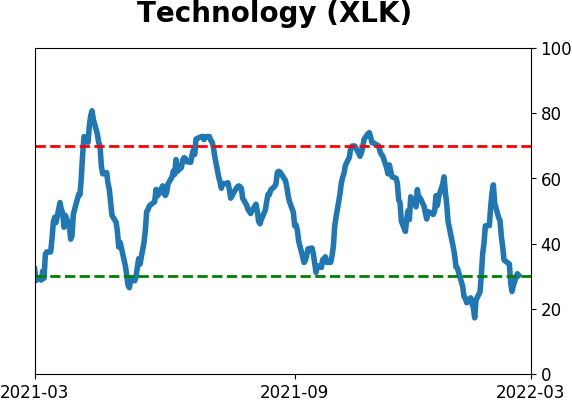
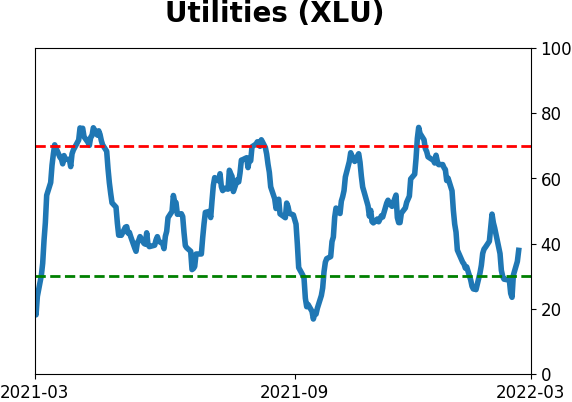
Sector ETF's - 10-Day Moving Average
|
|
|
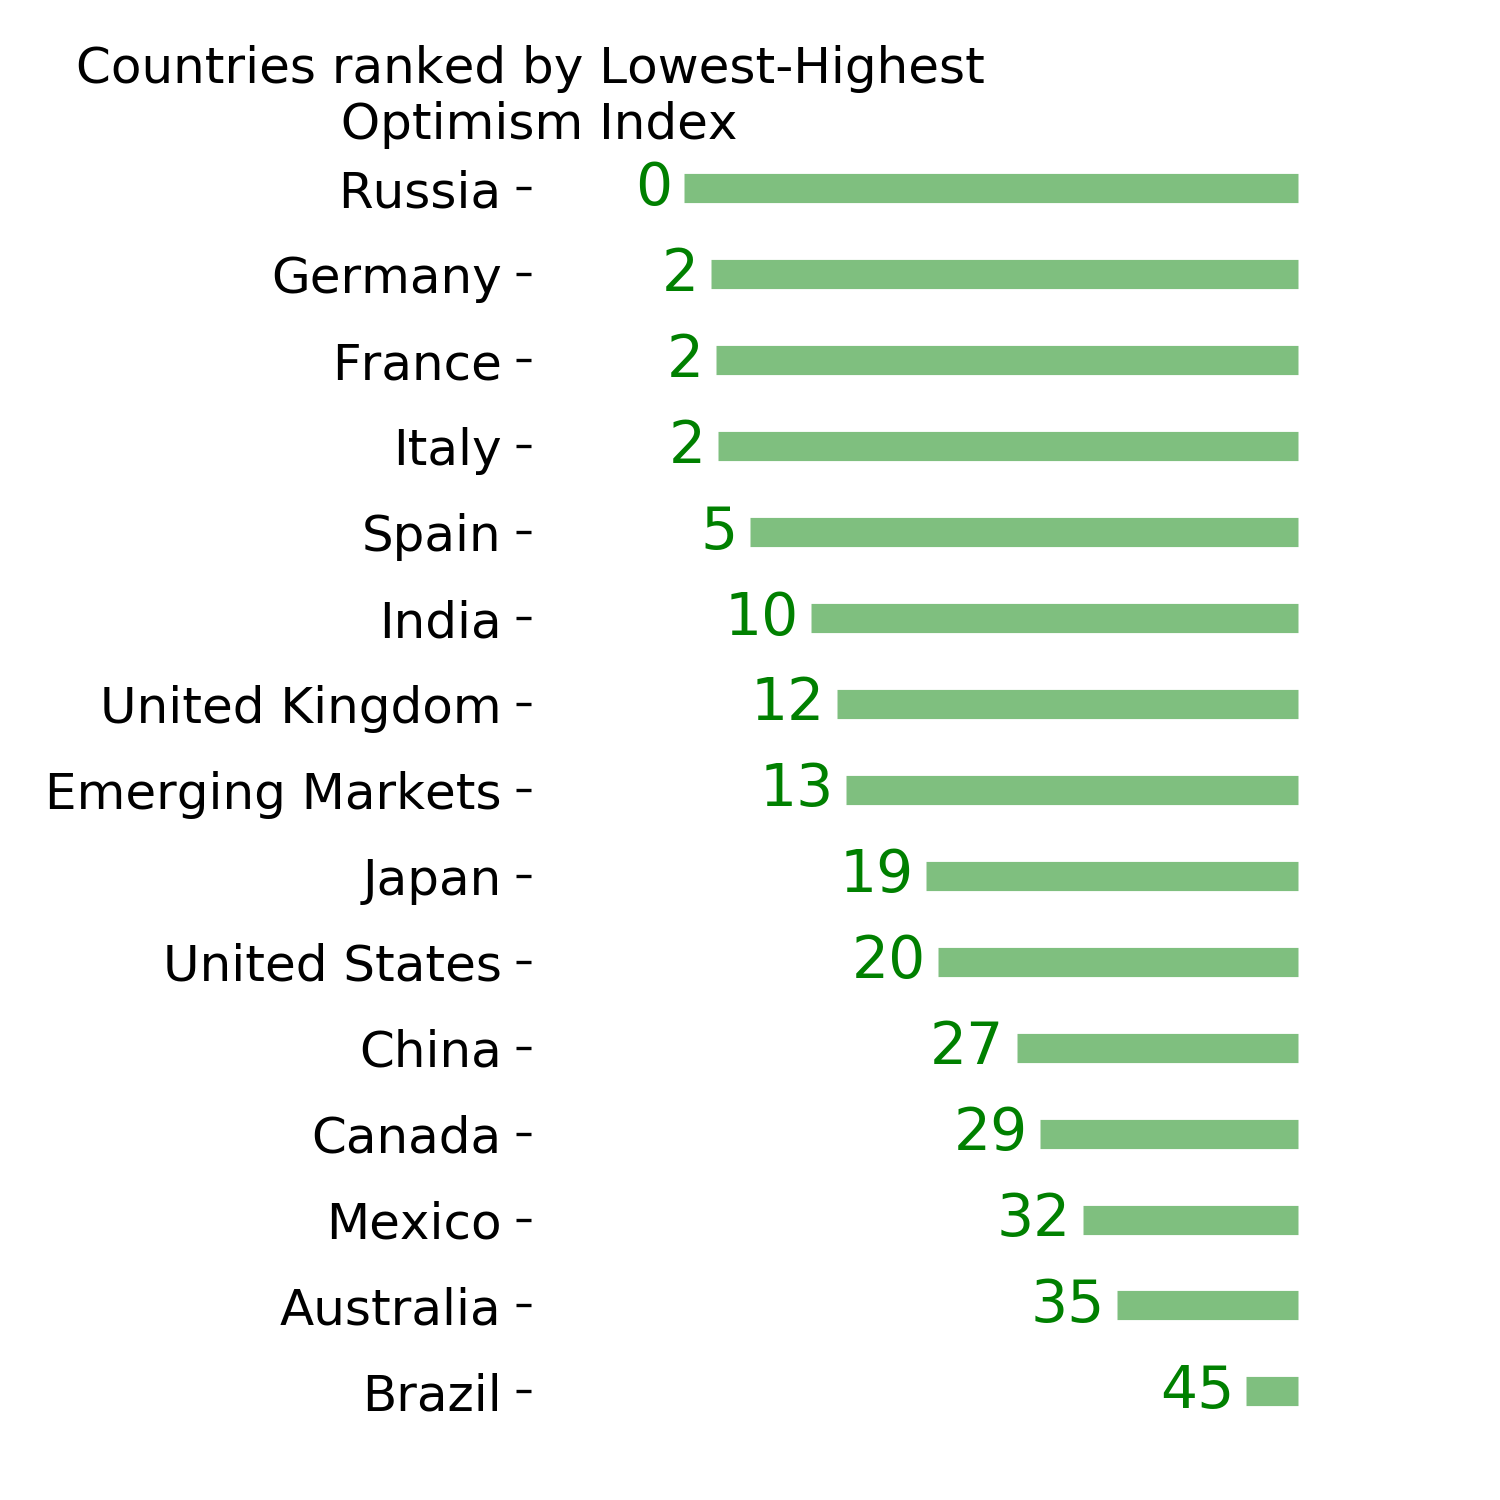
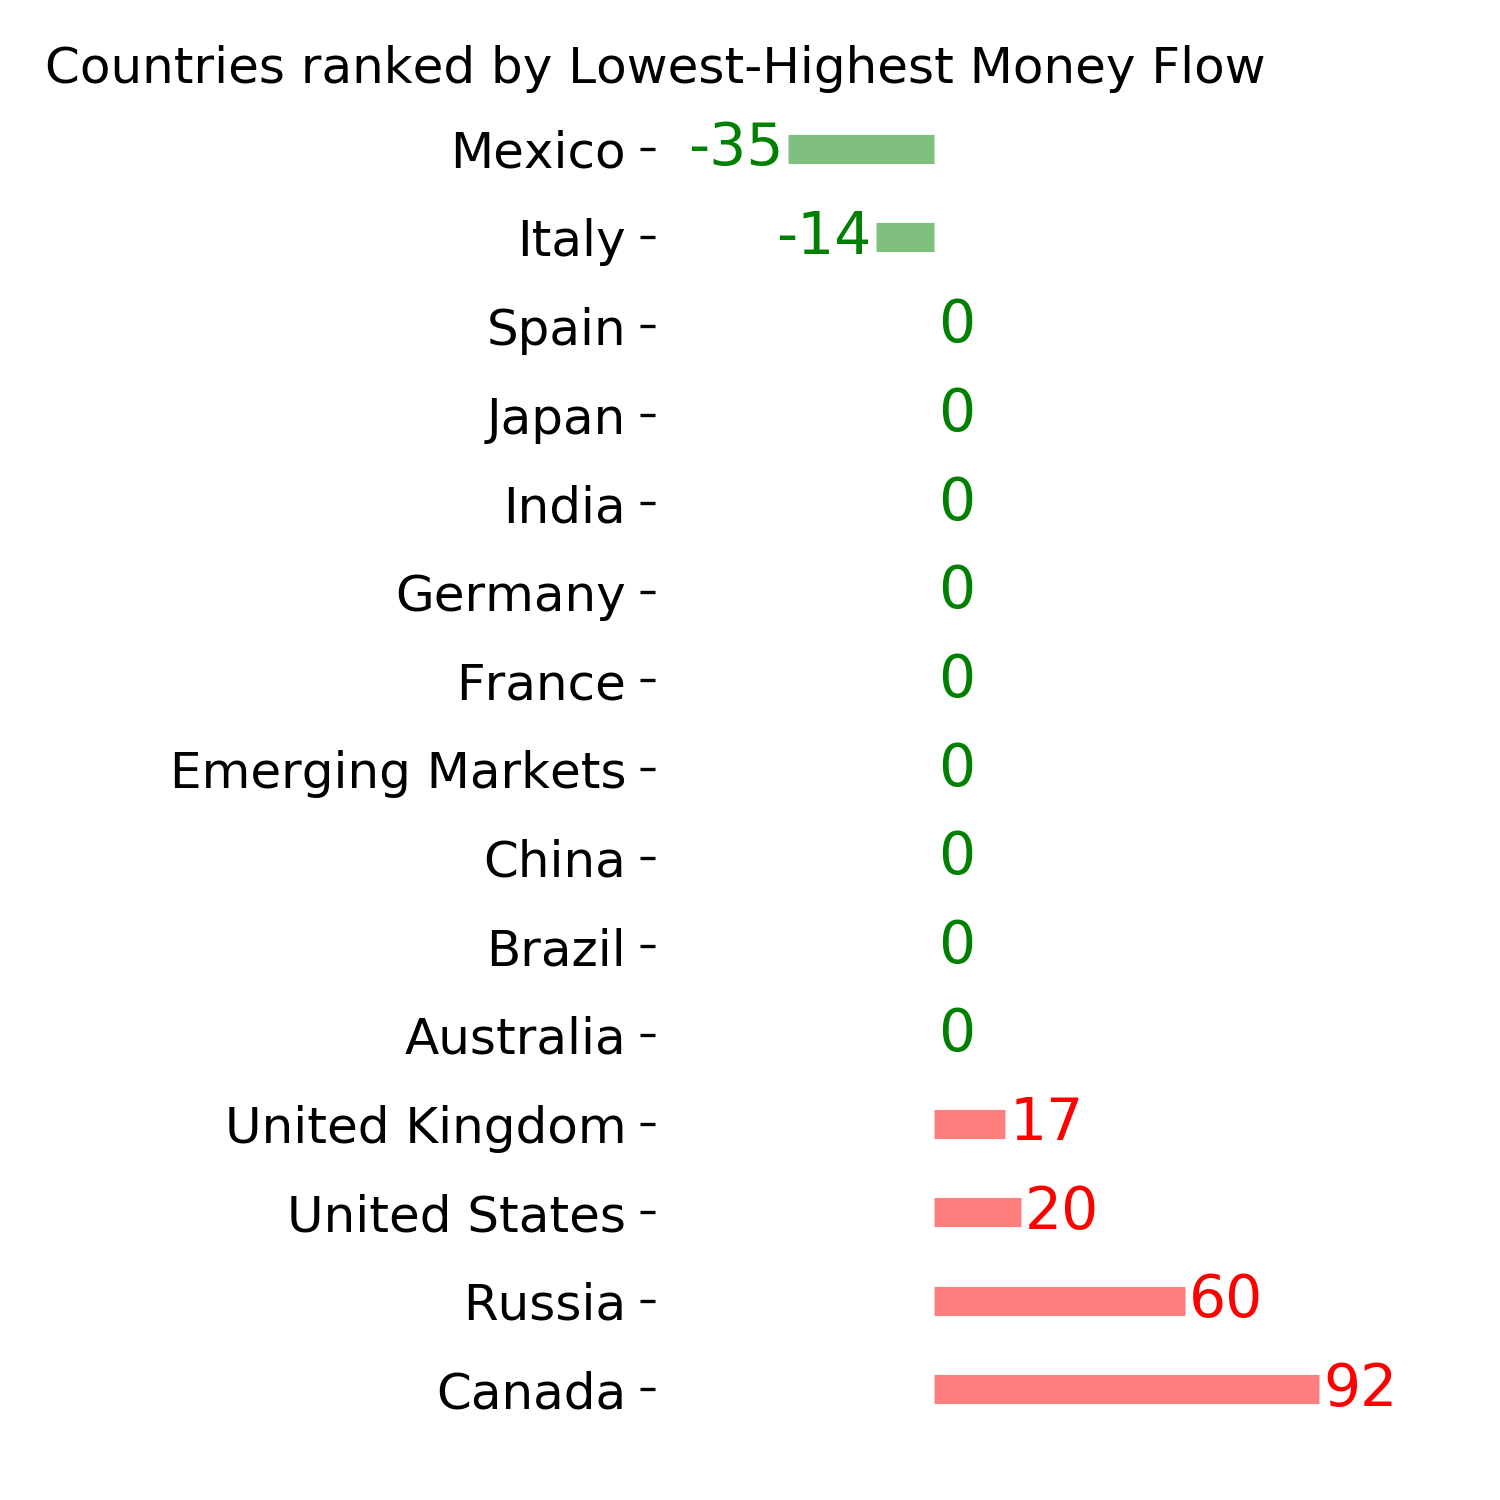
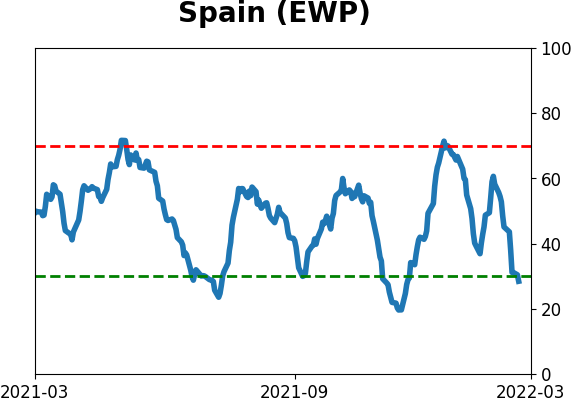
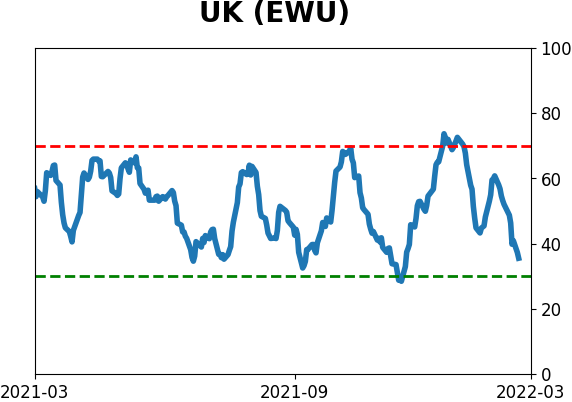
Country ETF's - 10-Day Moving Average
|
|
|
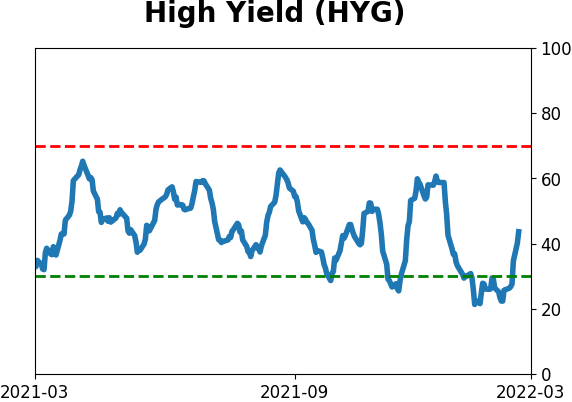
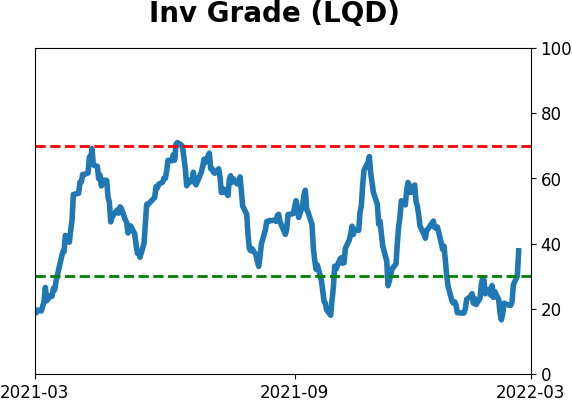
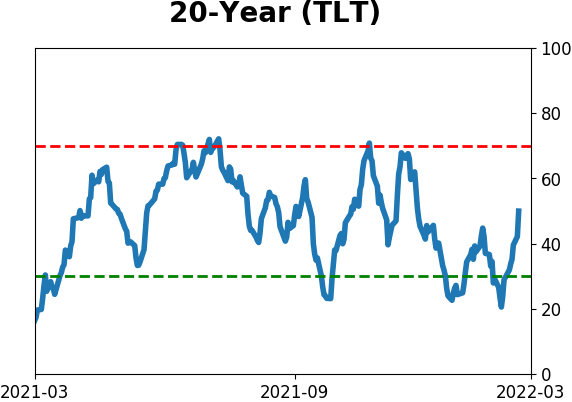
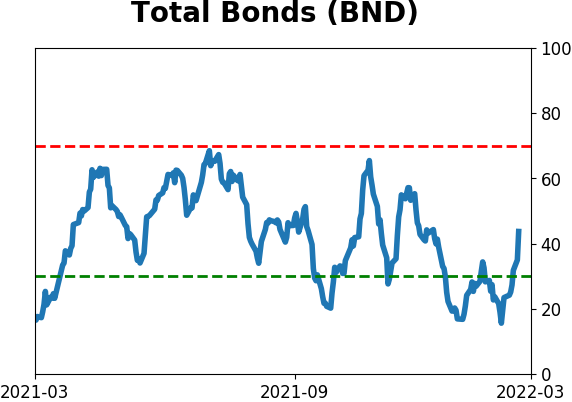
Bond ETF's - 10-Day Moving Average
|
|
|
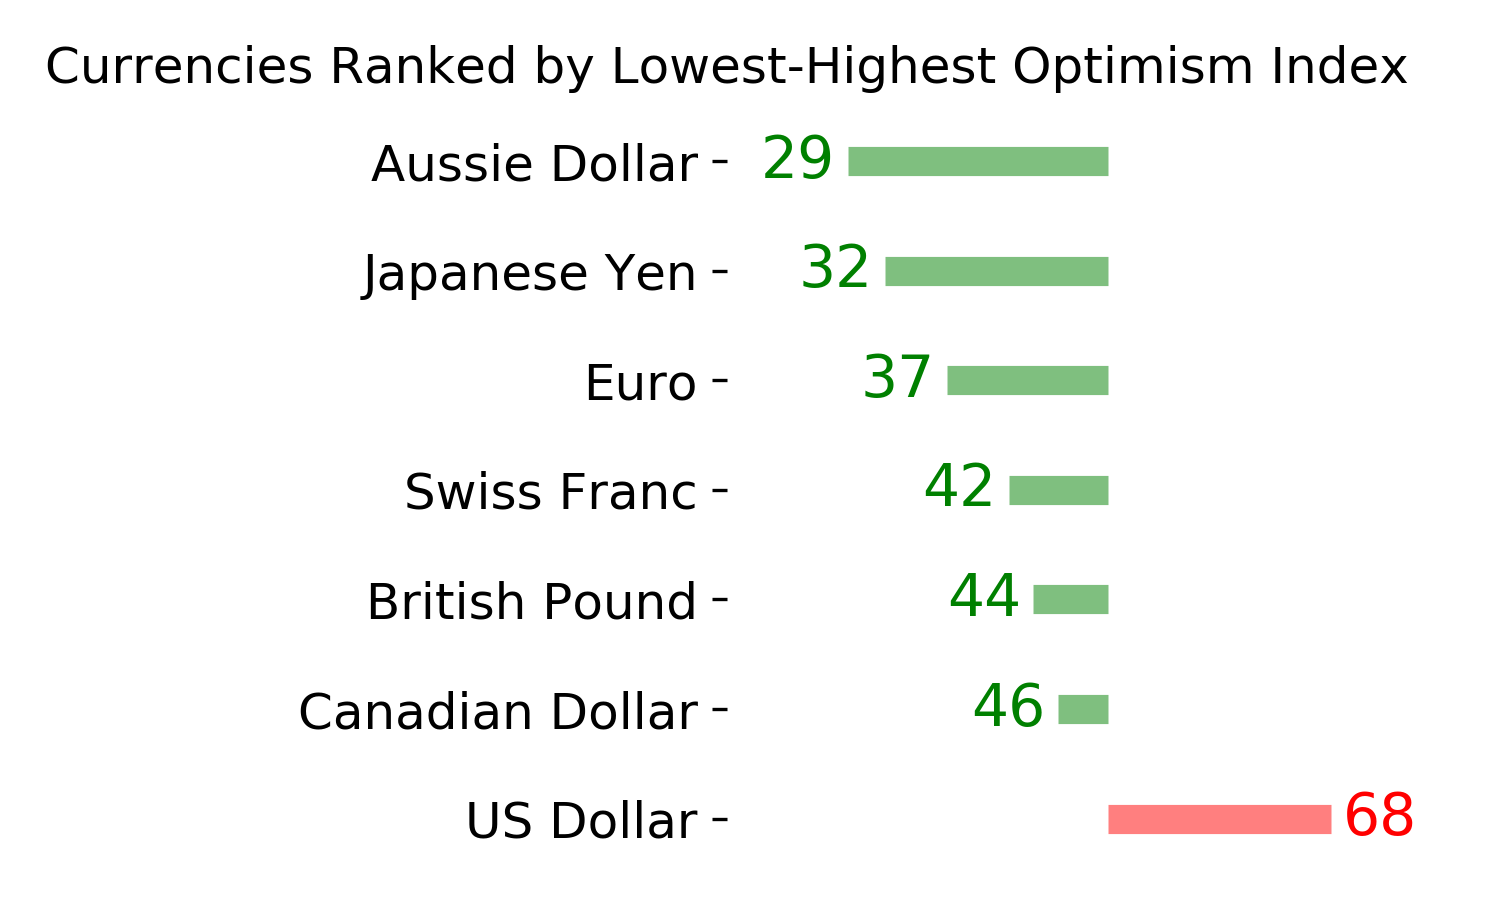
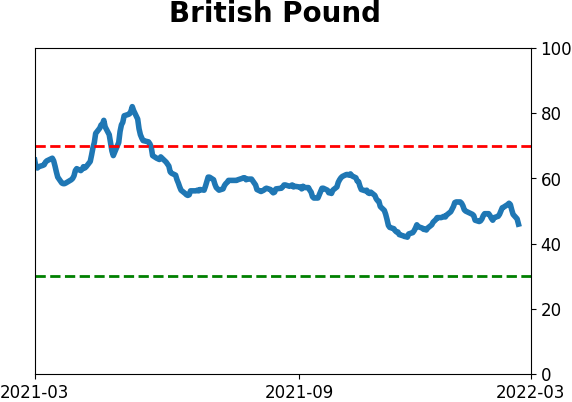
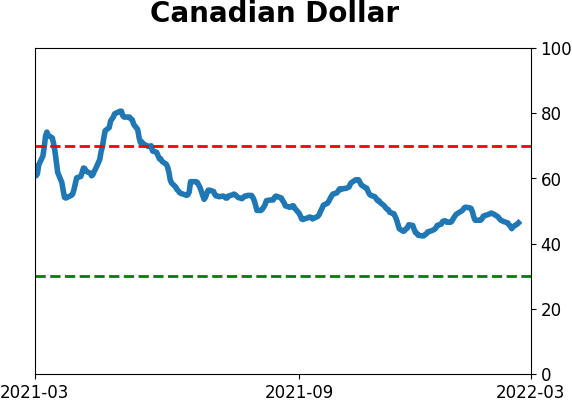
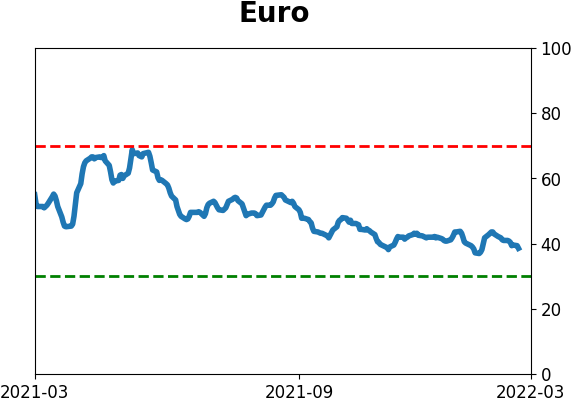
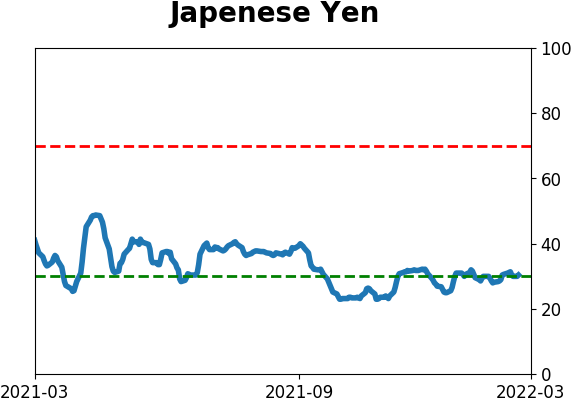
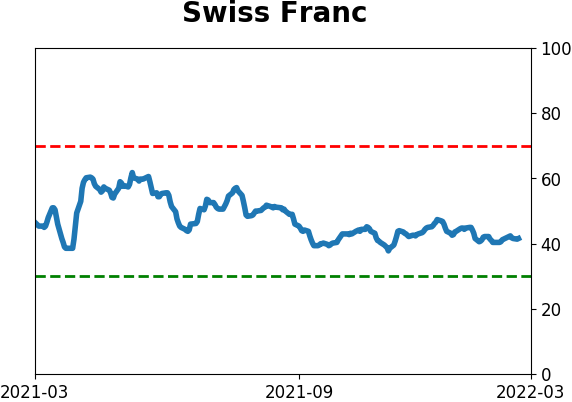
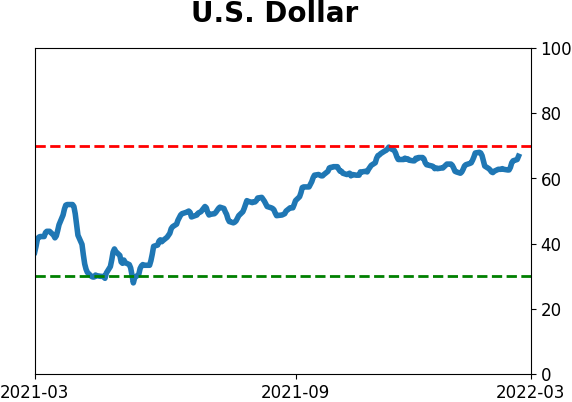
Currency ETF's - 5-Day Moving Average
|
|
|
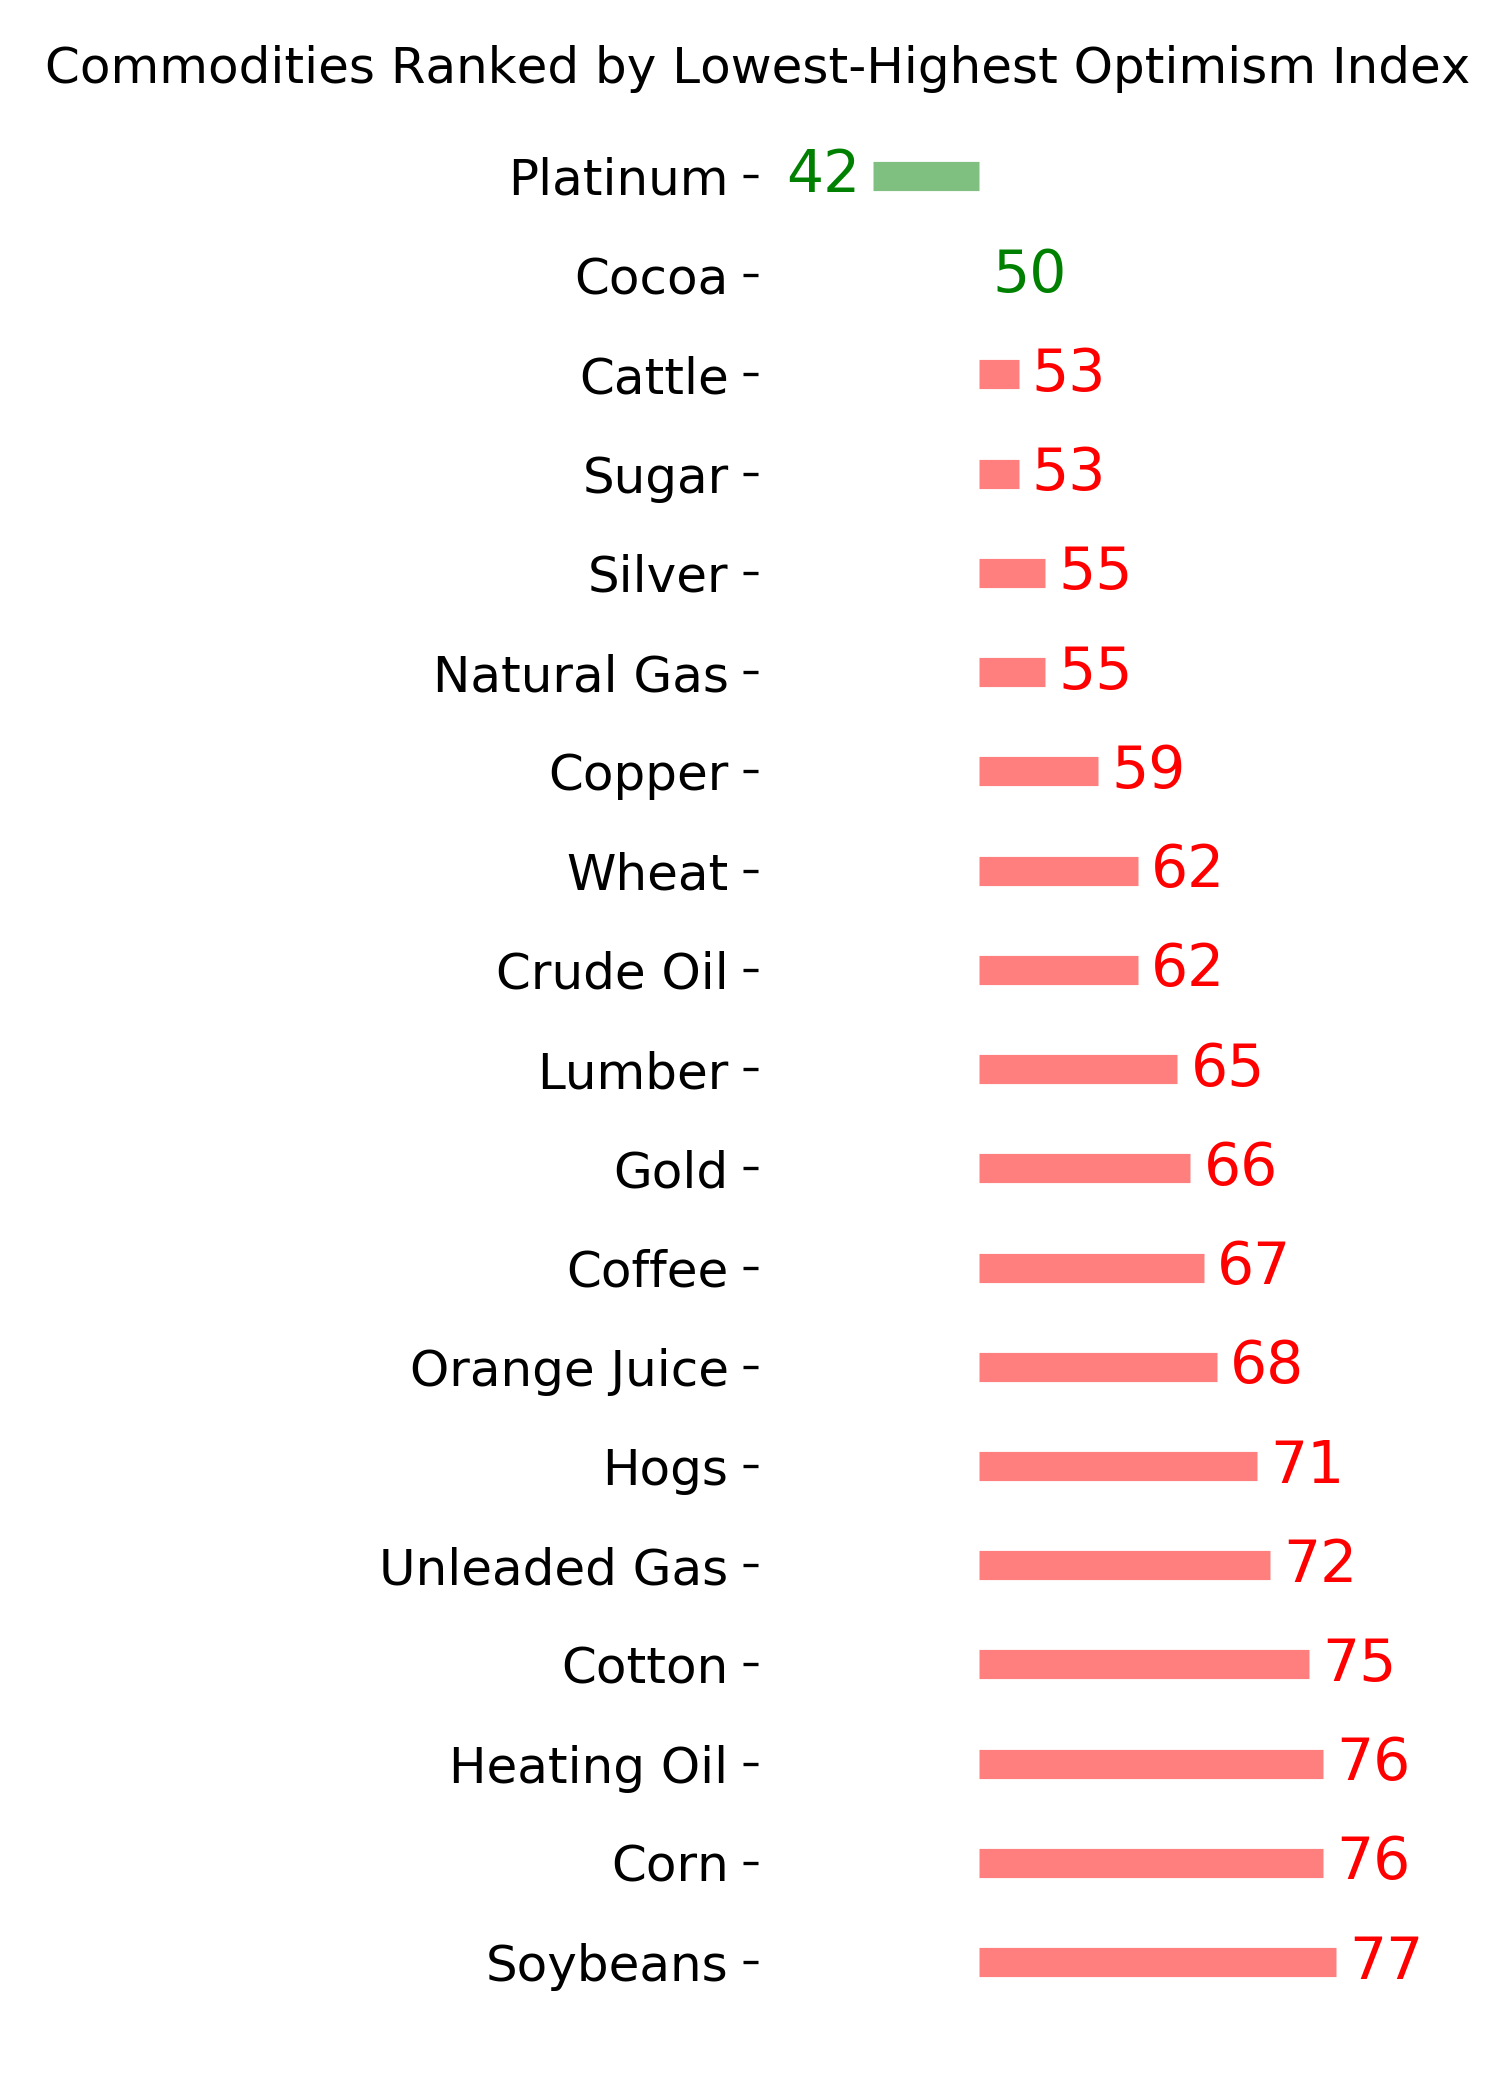
Commodity ETF's - 5-Day Moving Average
|
|