Headlines
|
|
New highs continue to build but haven't erased 2022's misery:
Issues hitting 52-week highs on the NYSE are dominating those falling to 52-week lows. That's been the case for a few months, but it still hasn't reversed the damage from 2022 and even 2023. The Cumulative New HIgh / New Low Line is about 7% below its peak as the S&P 500 records record highs. Previous divergences preceded interim gains but long-term losses except for 1995.
|
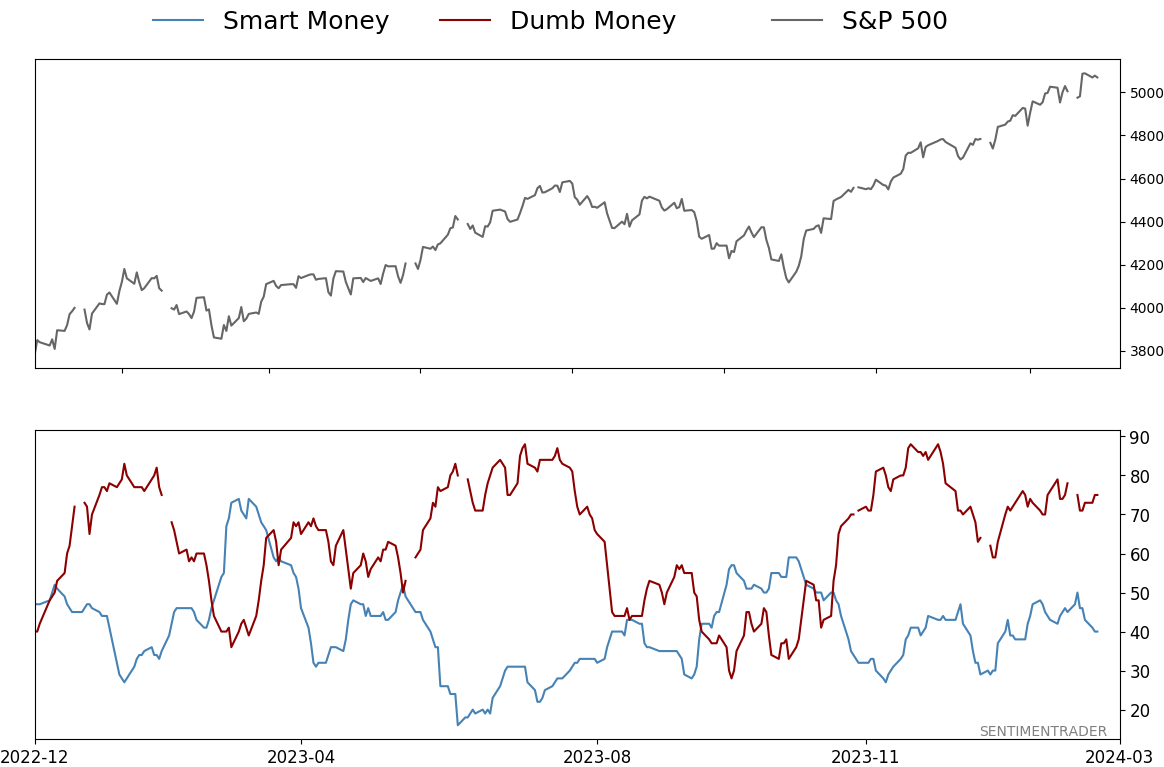
Smart / Dumb Money Confidence
|
Smart Money Confidence: 40%
Dumb Money Confidence: 75%
|
|
Risk Levels
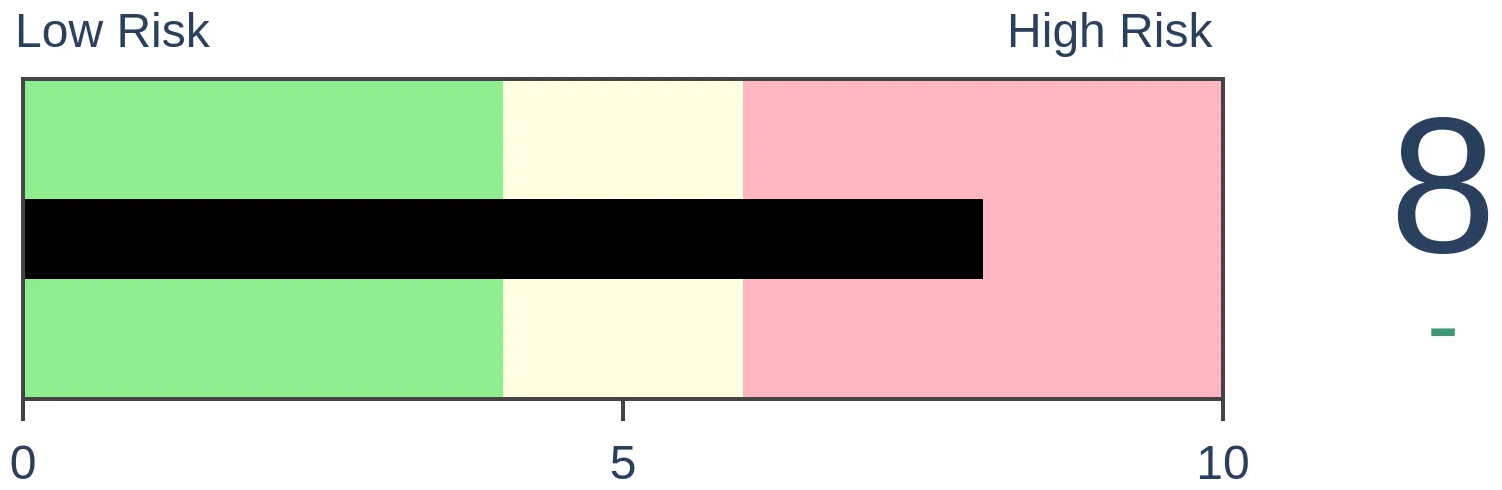
Stocks Short-Term
|
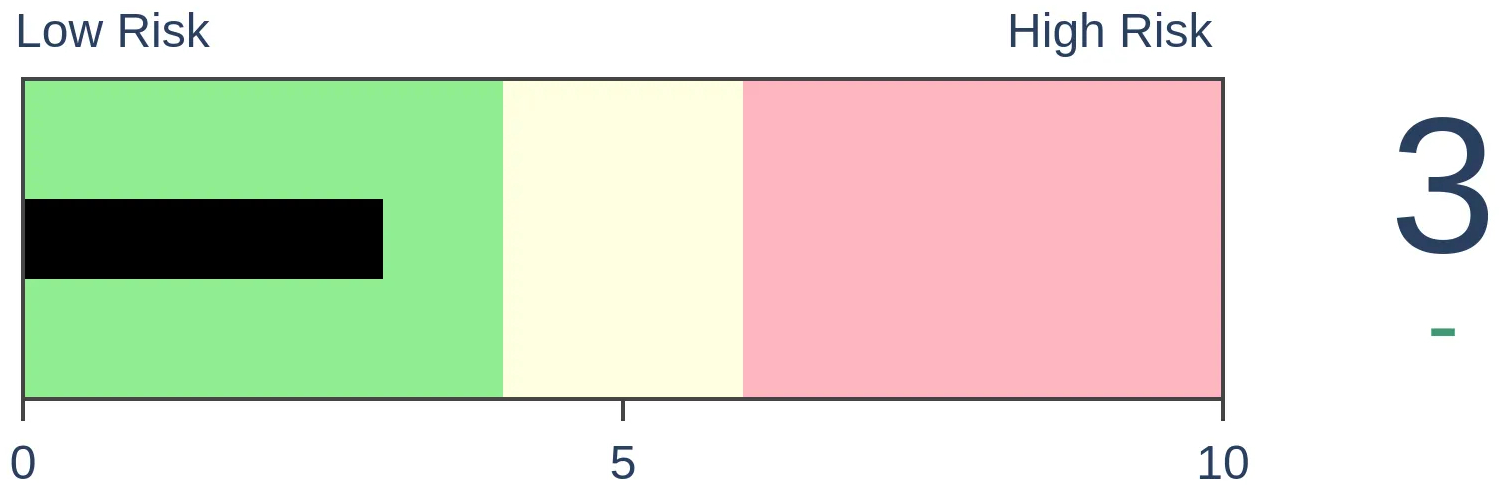
Stocks Medium-Term
|
|
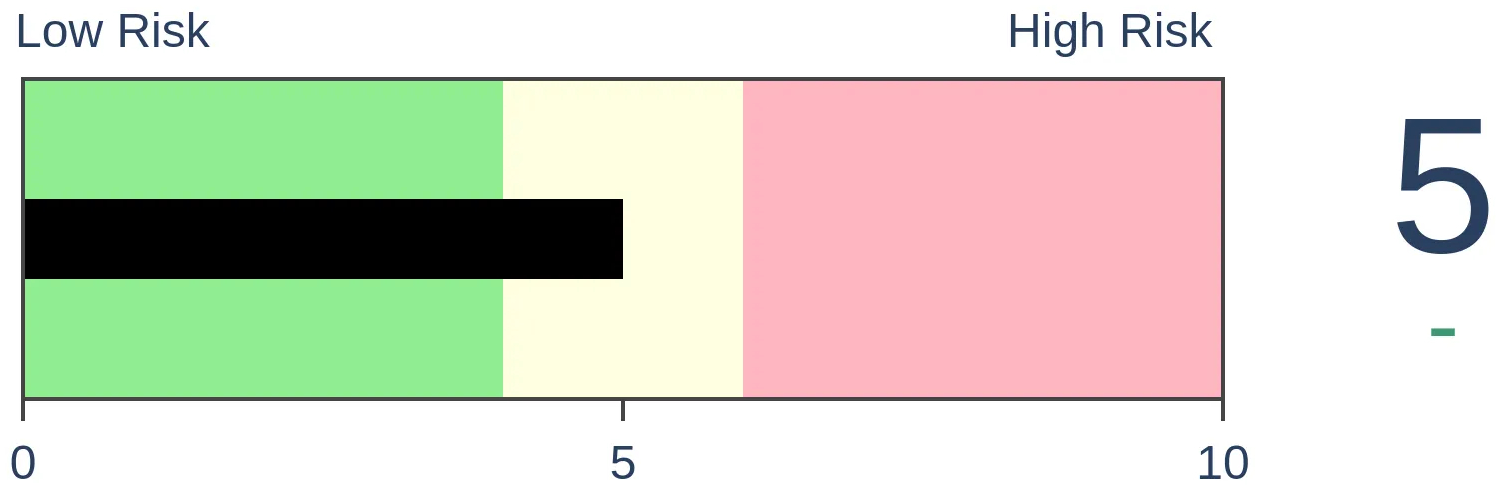
Bonds
|
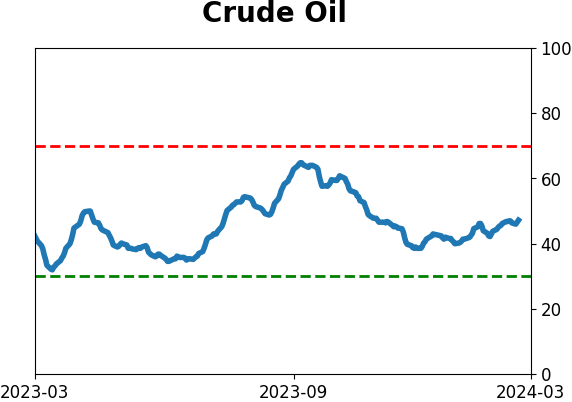
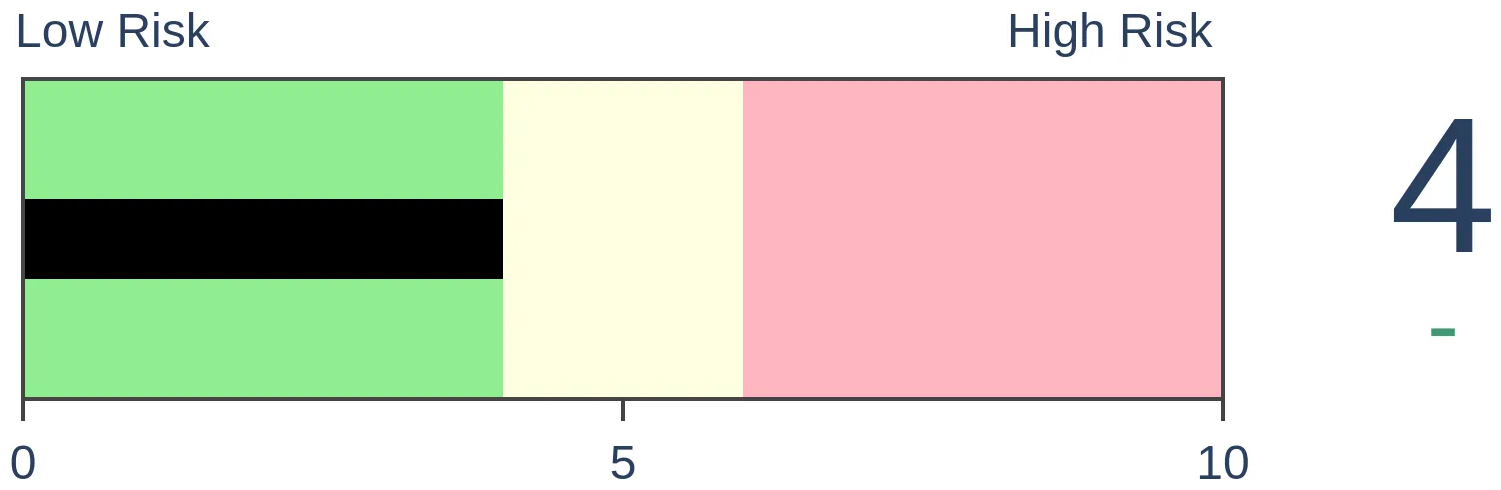
Crude Oil
|
|
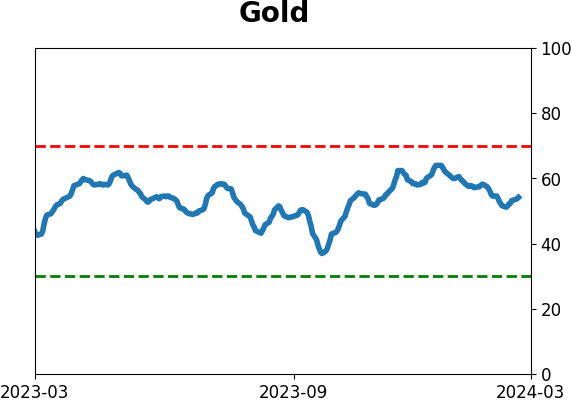
Gold
|
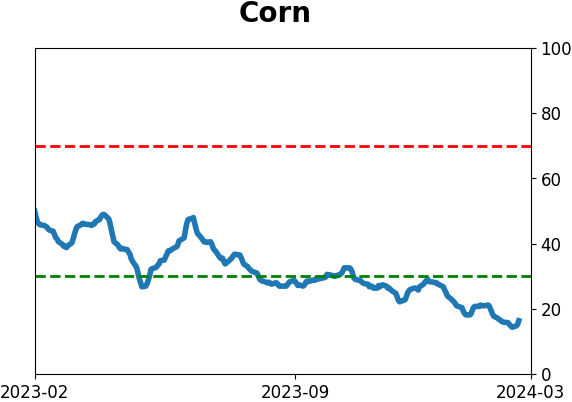
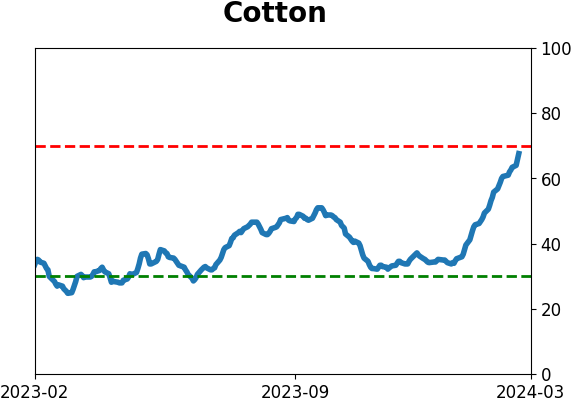
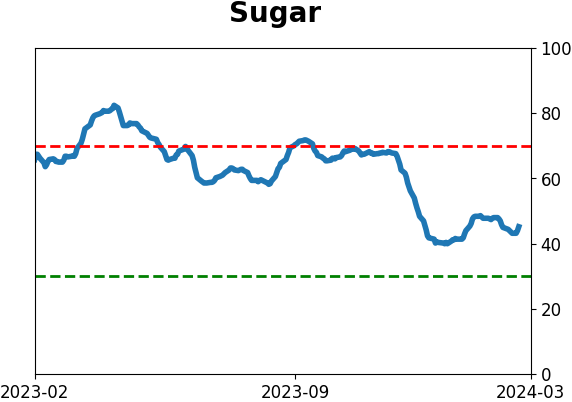
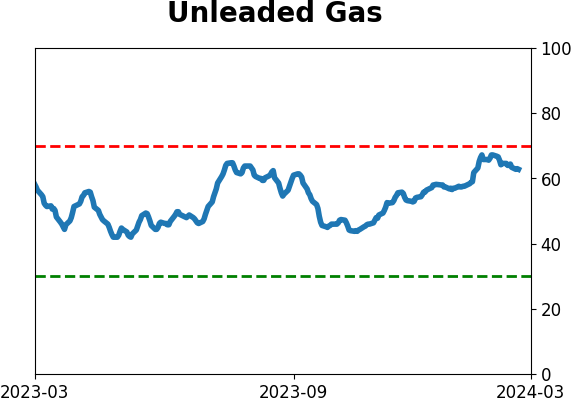
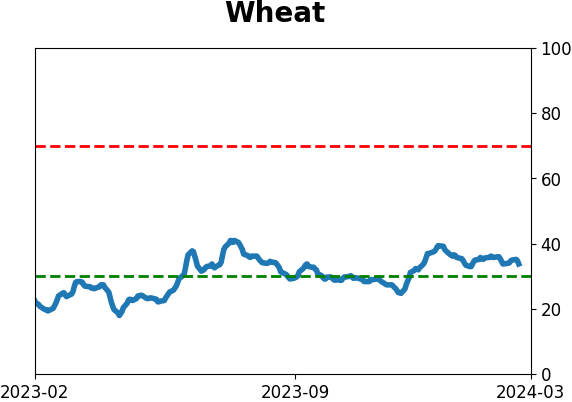
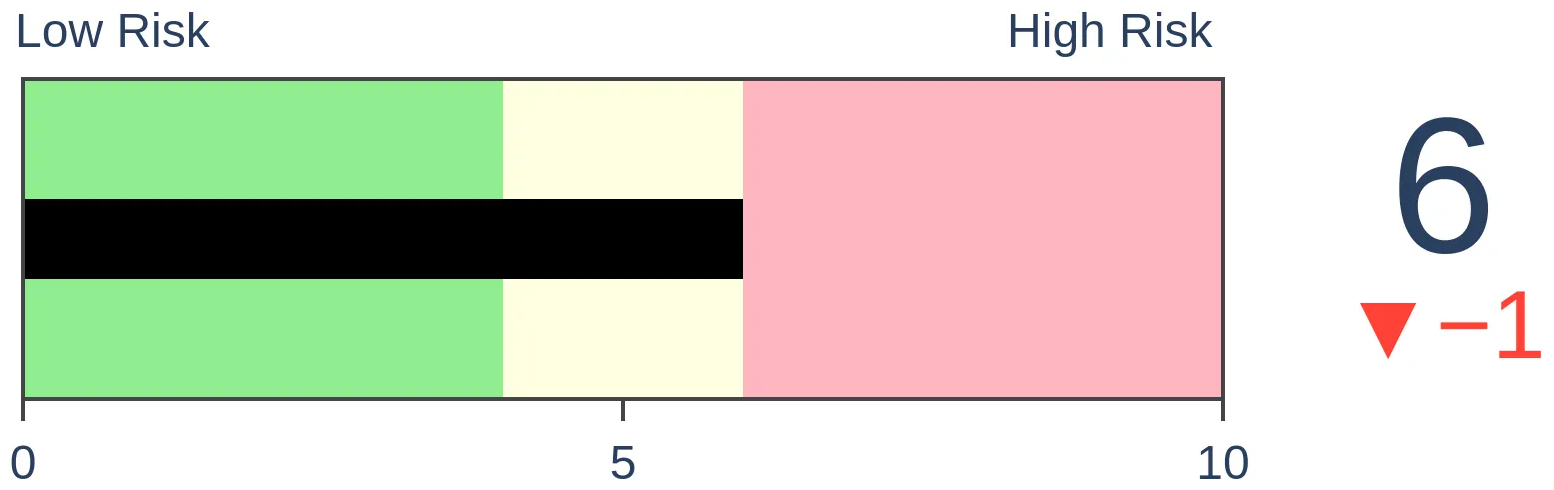
Agriculture

|
|
Research
By Jason Goepfert
BOTTOM LINE
Issues hitting 52-week highs on the NYSE are dominating those falling to 52-week lows. That's been the case for a few months, but it still hasn't reversed the damage from 2022 and even 2023. The Cumulative New HIgh / New Low Line is about 7% below its peak as the S&P 500 records record highs. Previous divergences preceded interim gains but long-term losses except for 1995.
FORECAST / TIMEFRAME
None
|
Key points:
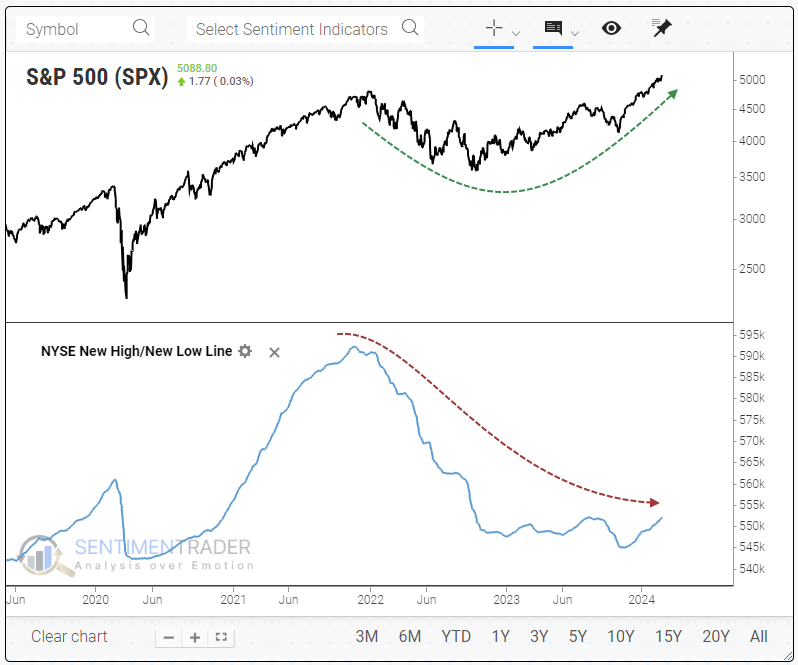
- The Cumulative New High/New Low Line for the NYSE is turning higher but is still off nearly 7% from its peak
- This is forming a divergence with indexes like the S&P 500 that are trading at record highs
- Similar divergences over the past 60 years preceded more gains in the interim but longer-term losses, with one major exception
New highs are dominating but haven't made up for years of the reverse
One of the hallmarks of a sustainable bull market is that more component stocks, bonds, or whatever, consistently reach 52-week highs than fall to 52-week lows.
That's the case now and has been for a few months. Even across the very broad NYSE exchange, more issues have been recording new highs than lows. That's good, and it's what should be happening as indexes like the S&P 500 record record highs.
It's also a stark change from 2022 and even most of 2023.
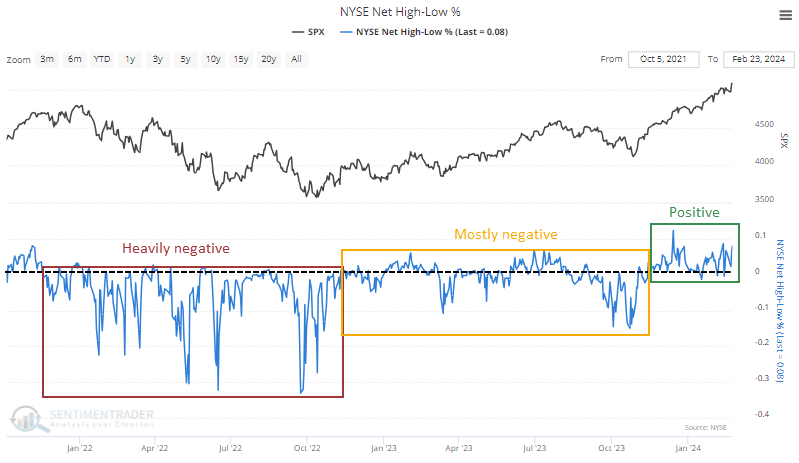
Here's the wrinkle, though. So many issues fell to 52-week lows in 2022, and 2023 didn't help matters much, that the past few months haven't made much of a difference in the Cumulative New High/New Low Line. It has started to curl up but remains about 7% below its high even as the S&P soared.
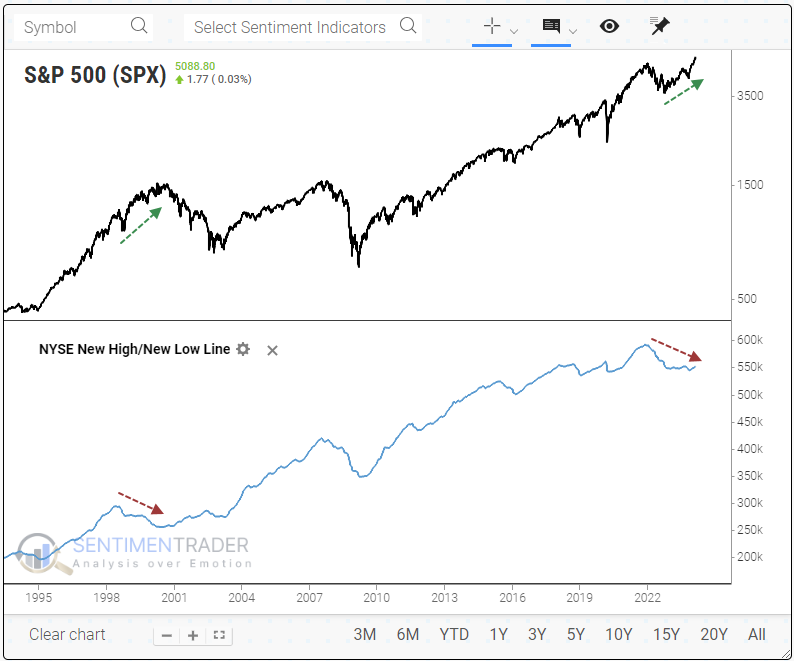
If we zoom out and take a long-term look at the cumulative new high/new low line, we can see that the only time in 25 years when we witnessed something similar was during the internet bubble years. Cue the scary music.
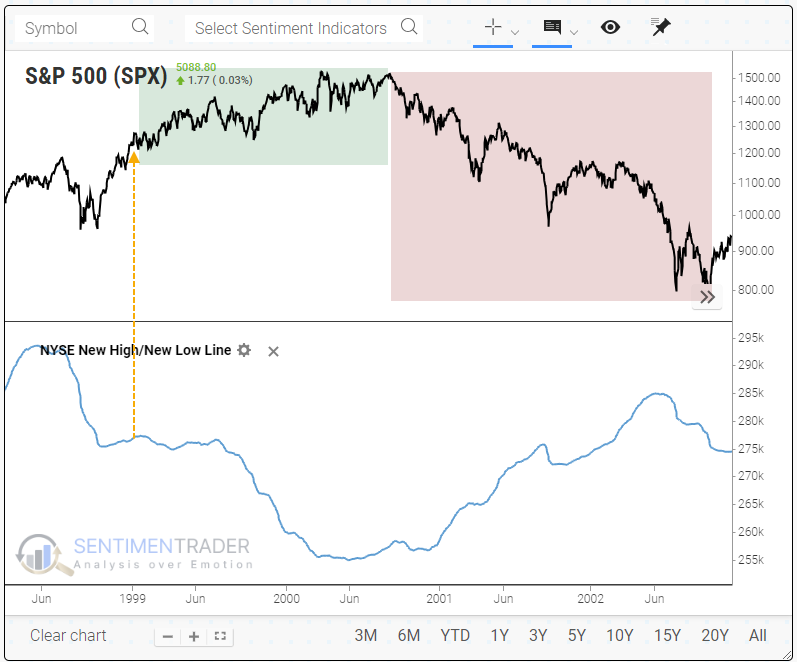
Okay, record scratch. Based on that example, it's not quite time to sell everything and go to cash.
When we zoom in and look at that time frame, we can see that the divergence occurred in early 1999, and many indexes, including the S&P 500, continued to rally strongly for months or even over a year before peaking as the divergence widened.
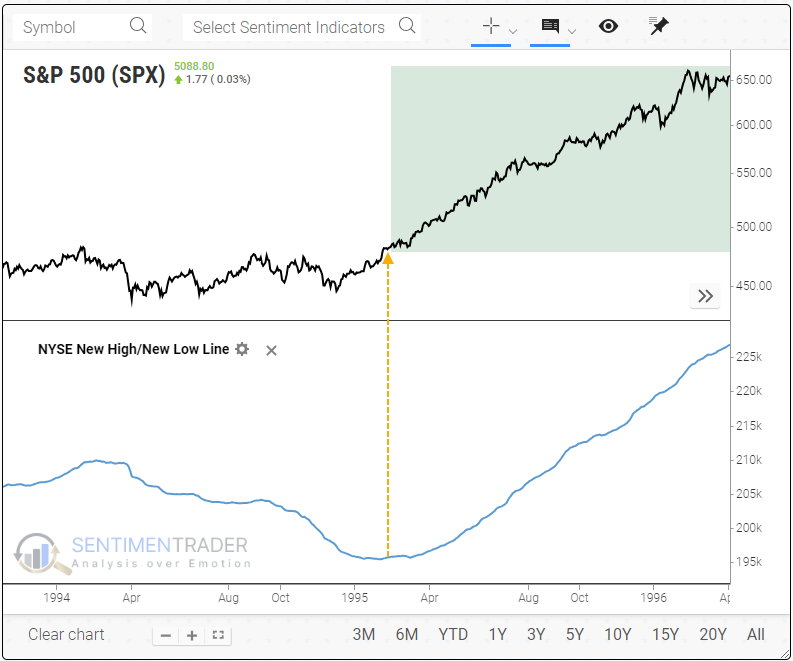
The divergence before that was in 1995. Anyone around then or who has studied history would immediately understand that it was not bearish at all; it preceded one of the great creeper uptrends of all time.
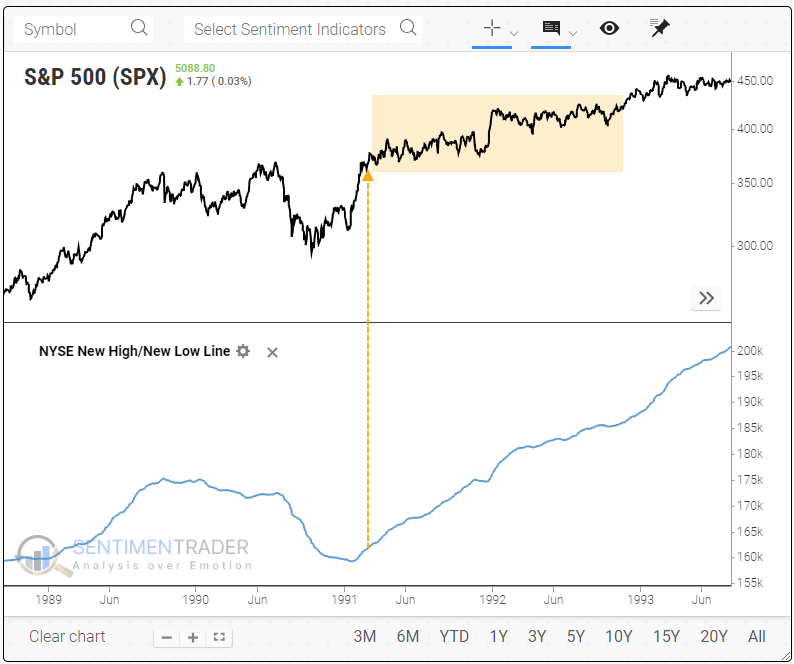
When we scroll backward, we can see that the next divergence occurred in 1991. This one didn't precede a collapse like post-2000 or a phenomenal run-up like 1995-instead, the S&P just kind of chopped higher for months on end. Returns were mostly positive, but frustratingly so, and it was not a good time for trend-followers.
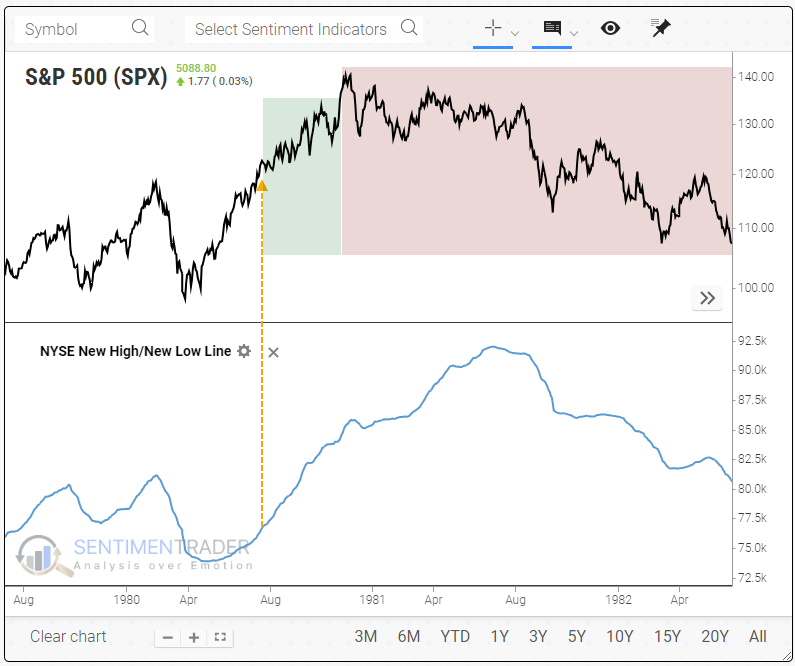
Continuing our scrolling through history, the next divergence was a decade earlier, in 1980. Like the internet bubble years, the S&P rallied for months after this divergence in the new high/new low line, but it resulted in a significant peak that erased all the gains and then some.
Before that instance, 1972 also recorded a negative divergence. This one saw the S&P chop around for a few months and then explode to new highs, which marked a major peak and significant pain for investors.
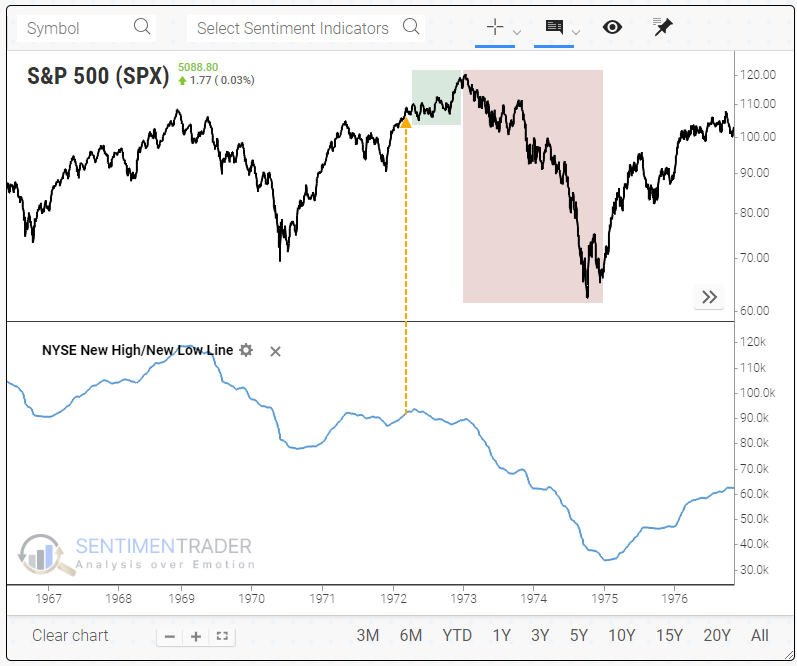
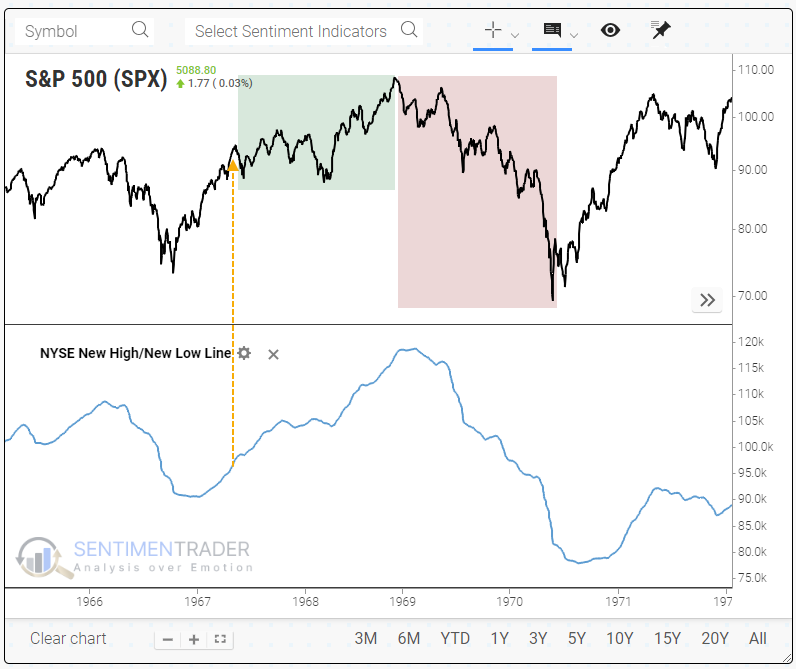
Something similar happened after the first divergence in 1967. The S&P swung around in a wide range and then spurted to a new high, which was the bull market peak that wiped out years' worth of gains.
What the research tells us...
Divergences between a price index and an indicator are tricky beasts. They have been useful many times in recent decades, but they can persist for weeks, months, or even years, which makes timing extremely difficult. We would never use them as a trigger; they are more valuable as a heads-up that something under the surface isn't quite right, and we should be wary of becoming too aggressive with the existing trend.
That has also been the case with the cumulative new high/new low line. Only one time when this divergence occurred did the S&P rally strongly, in 1995. All the others saw either muted gains or a further rally that was then erased in a corrective period.
Indicators at Extremes
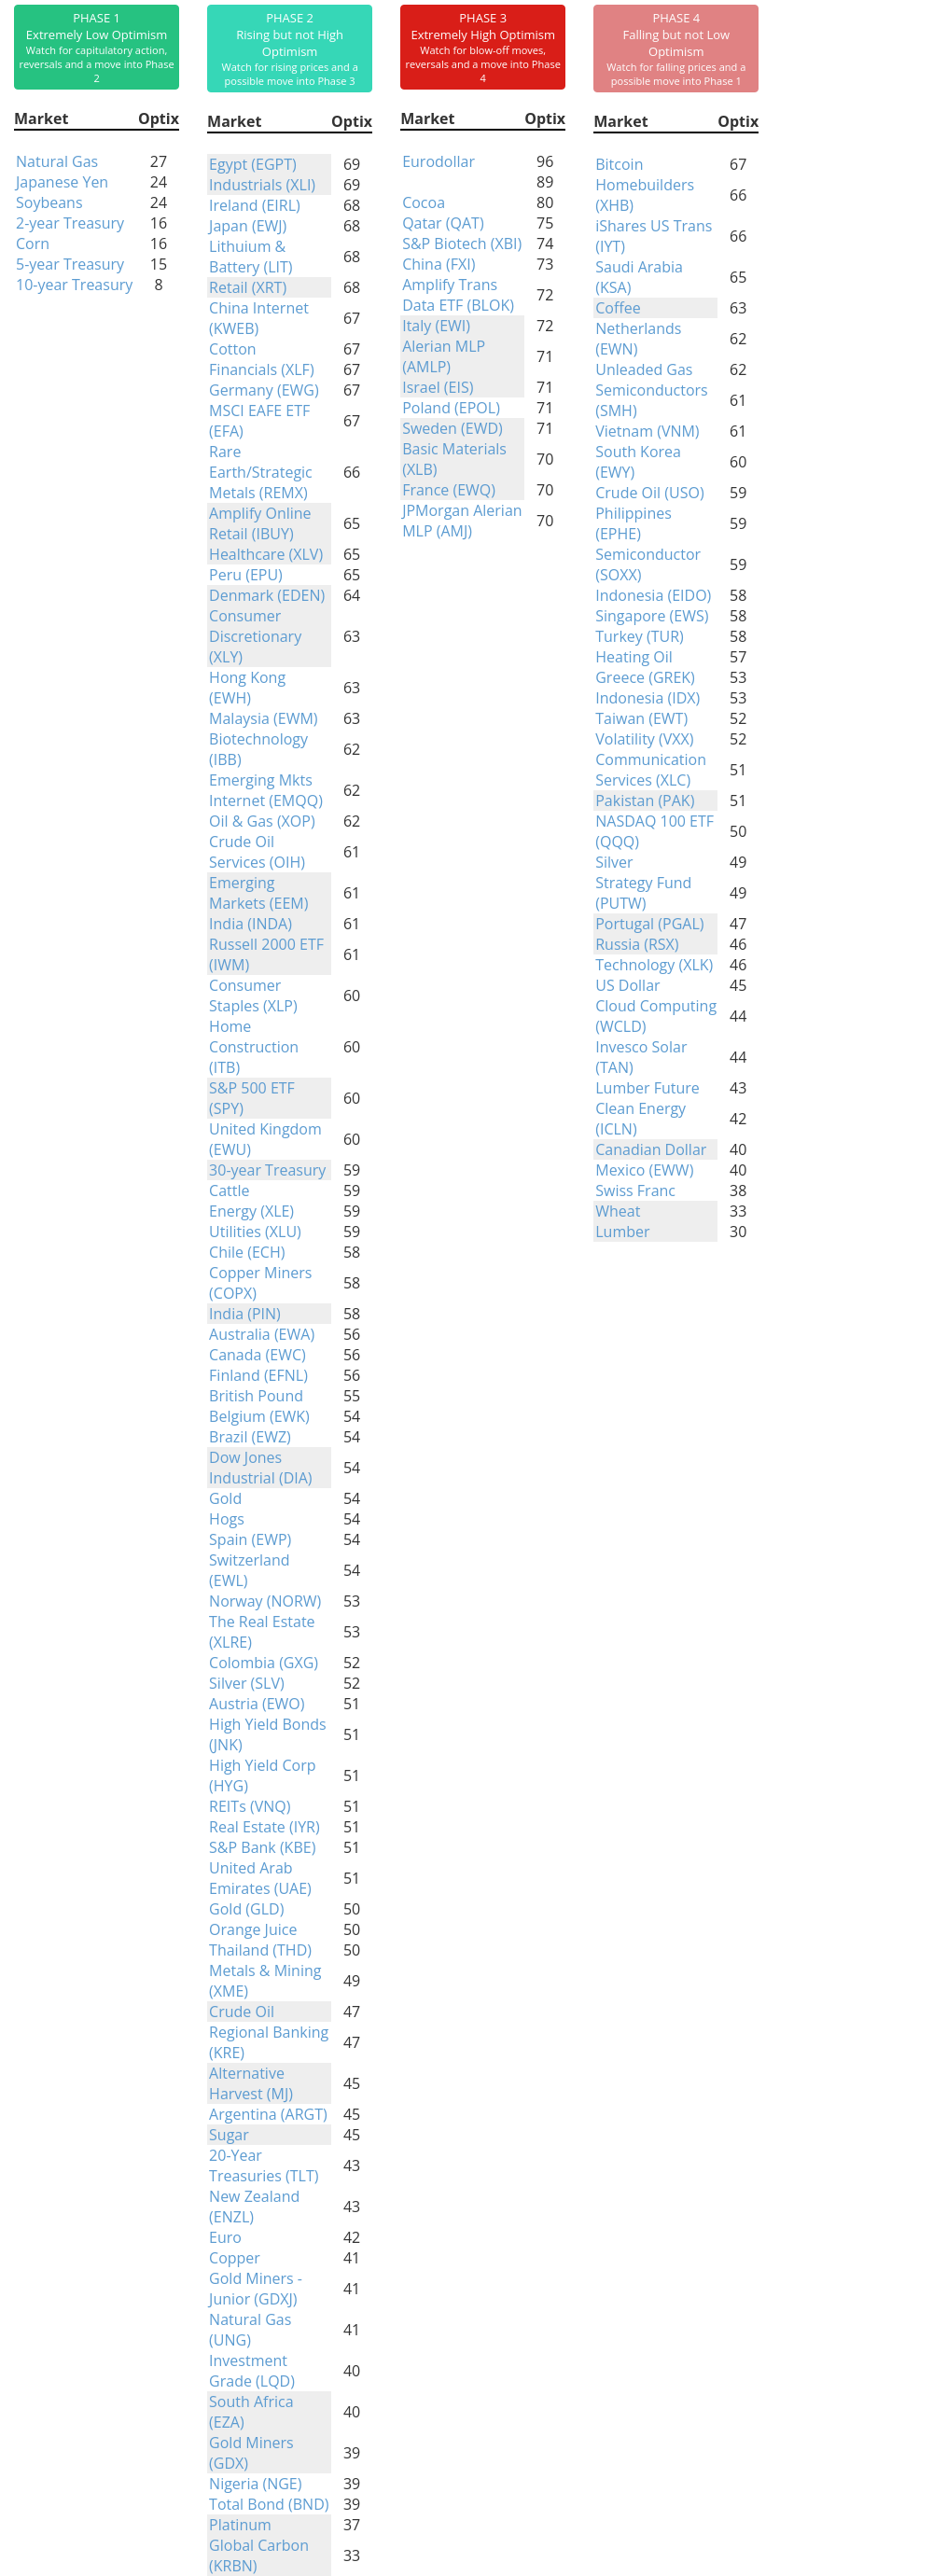
Phase Table
Ranks
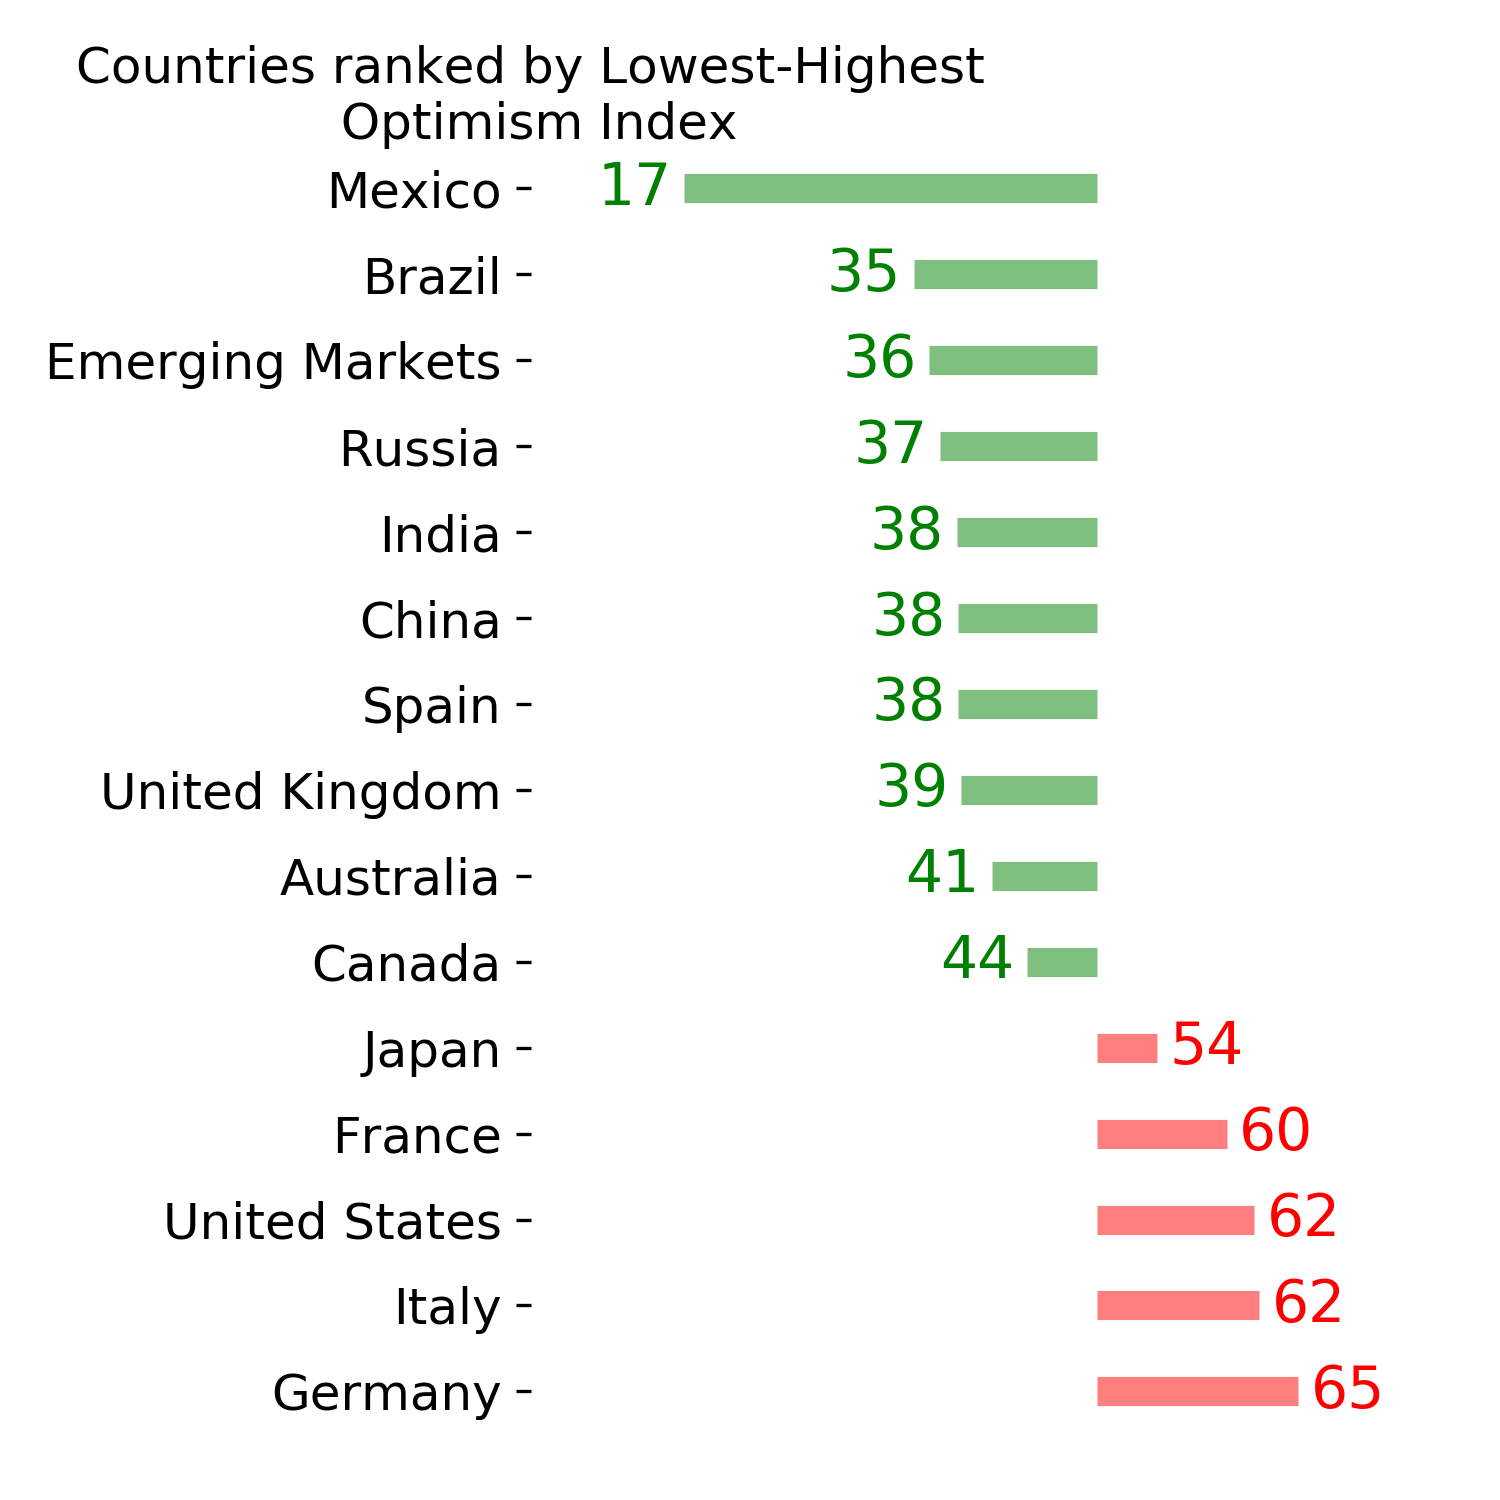
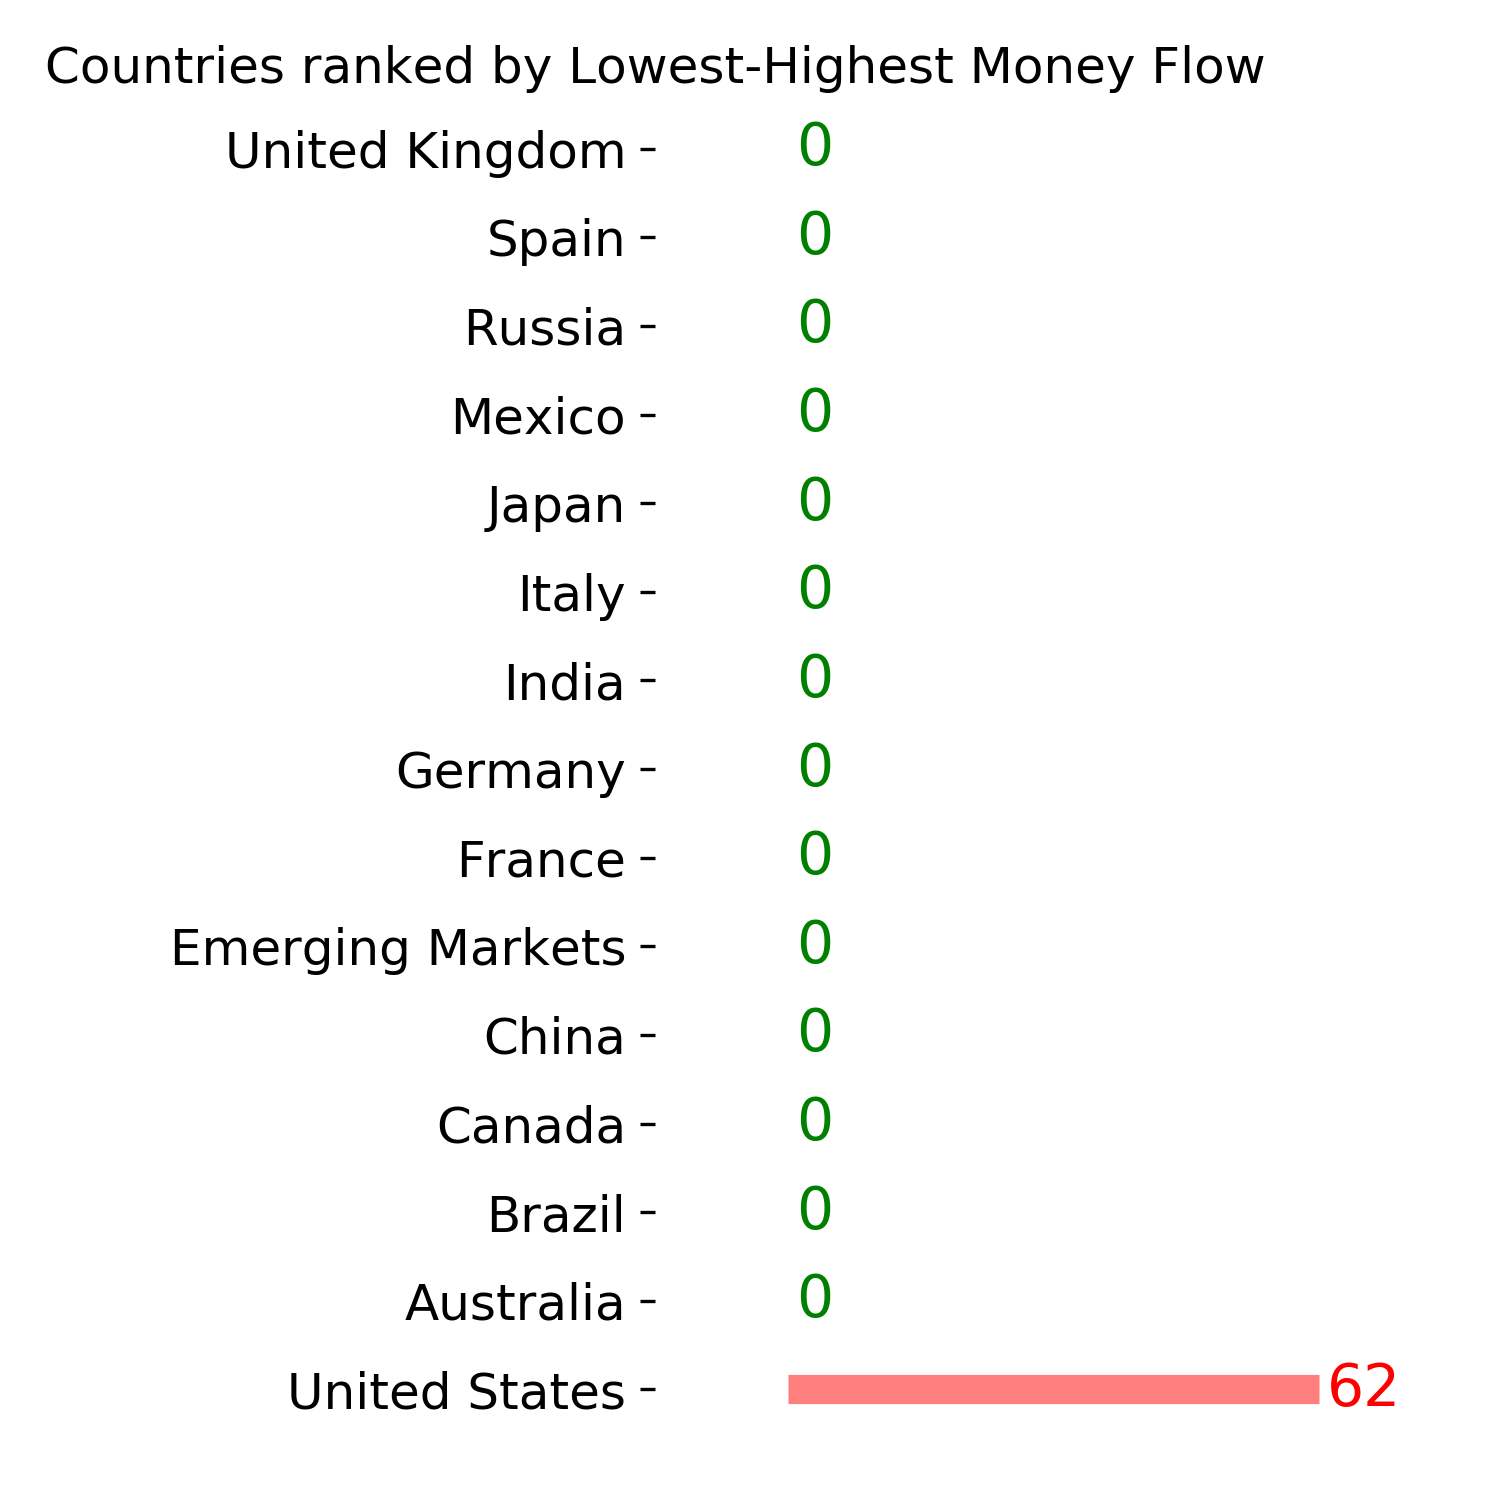
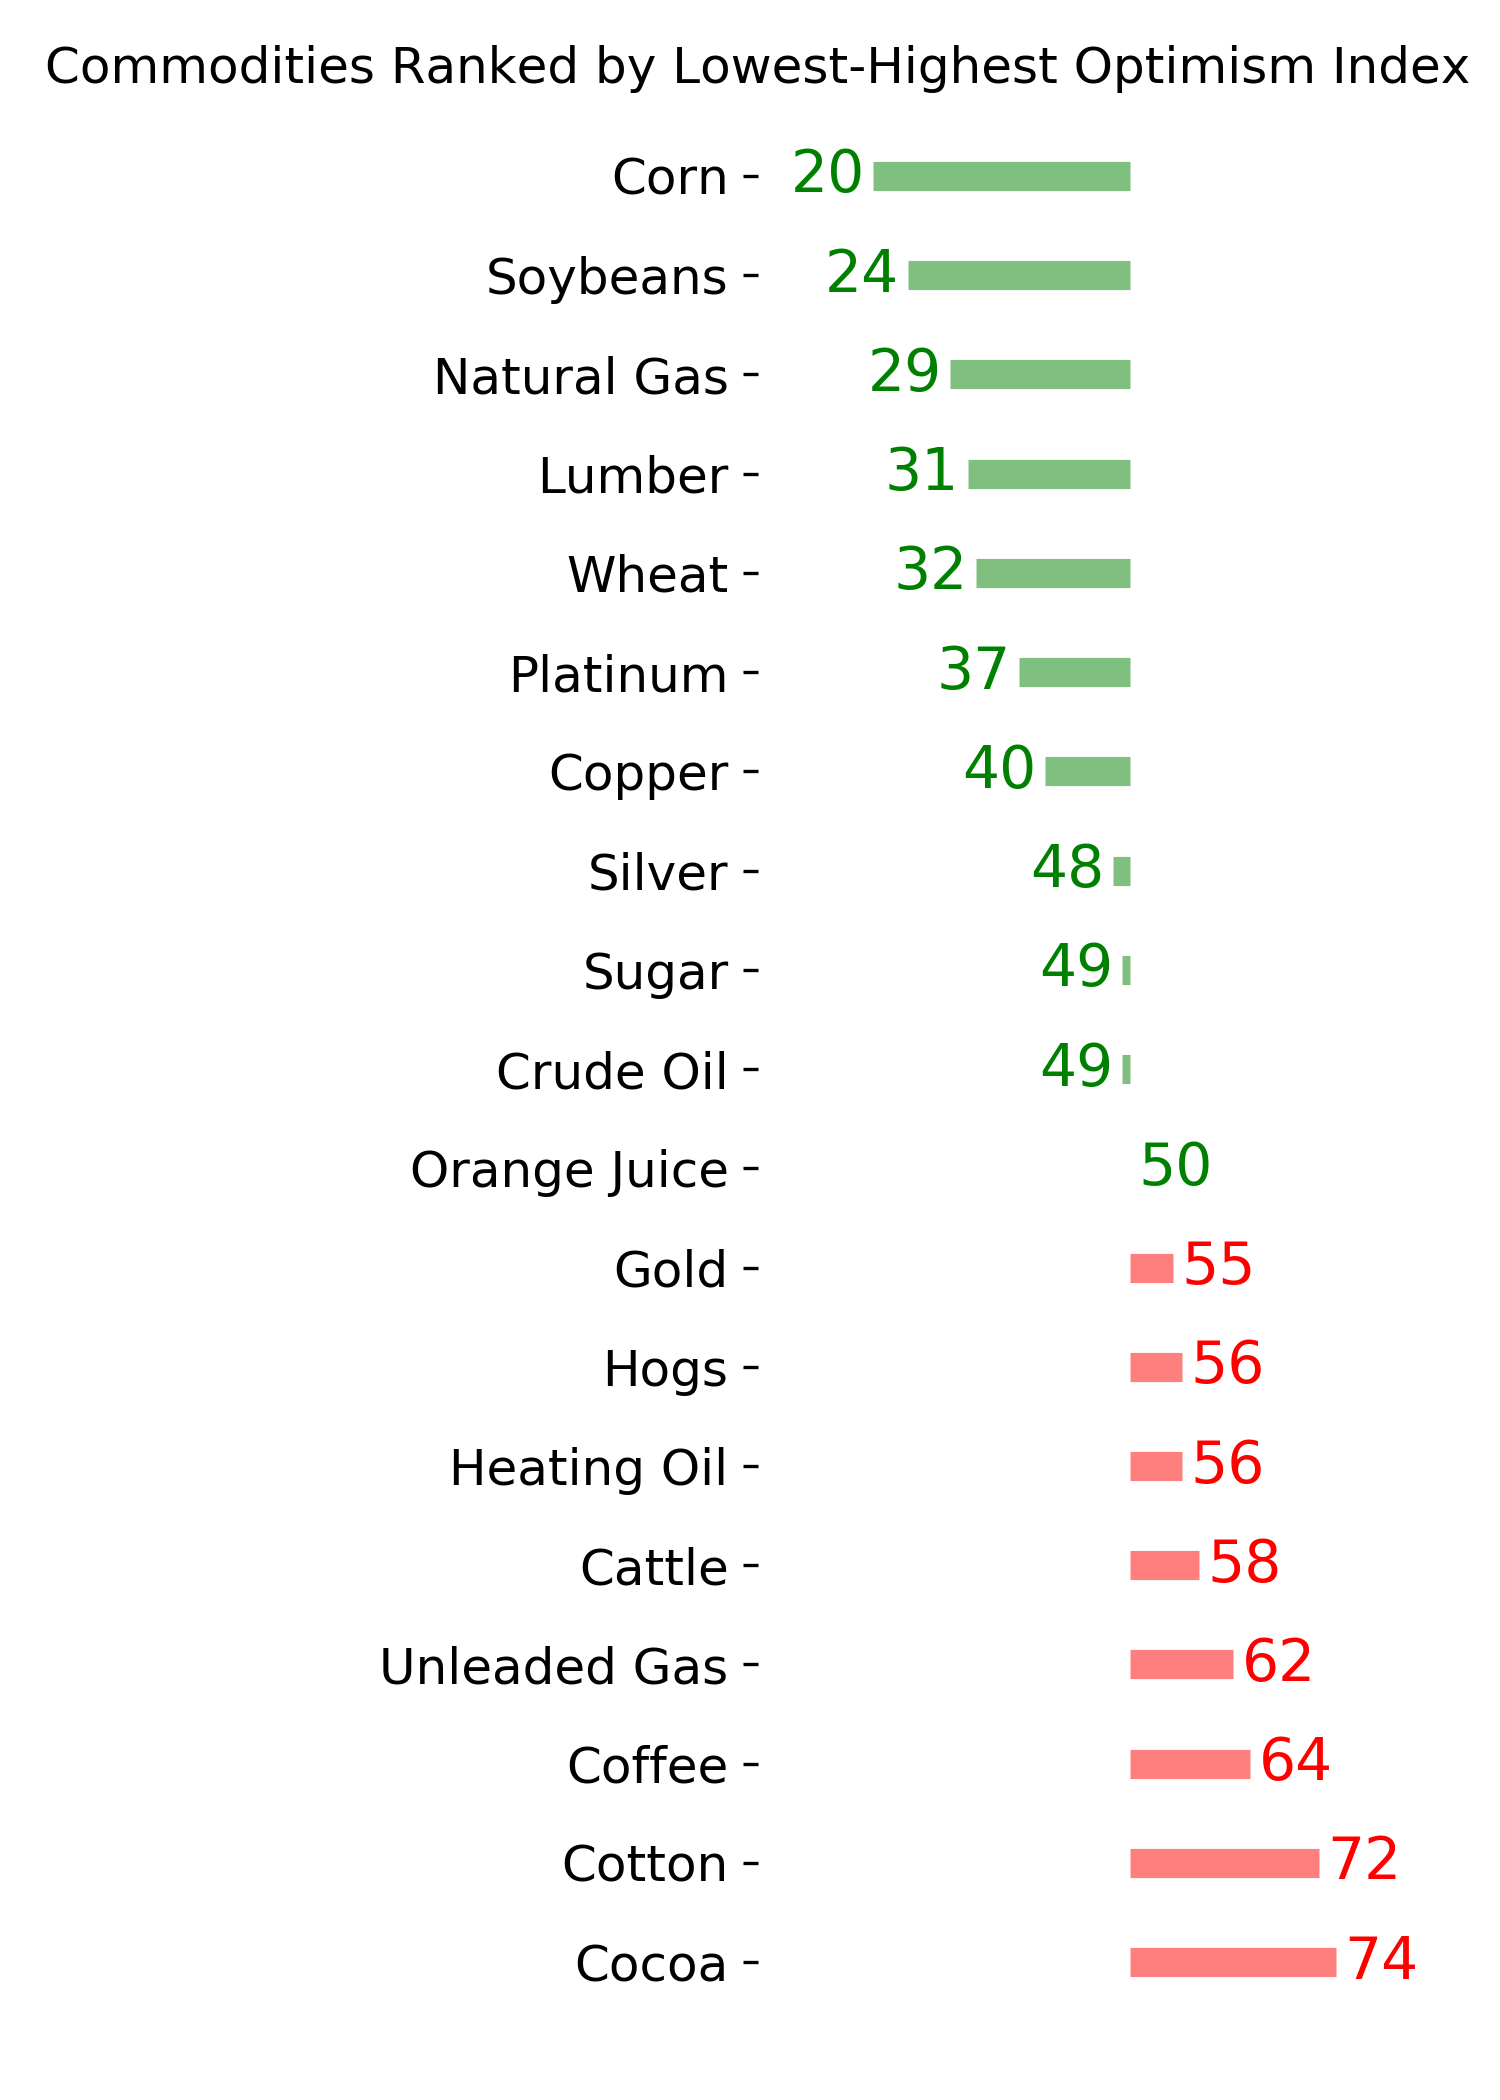
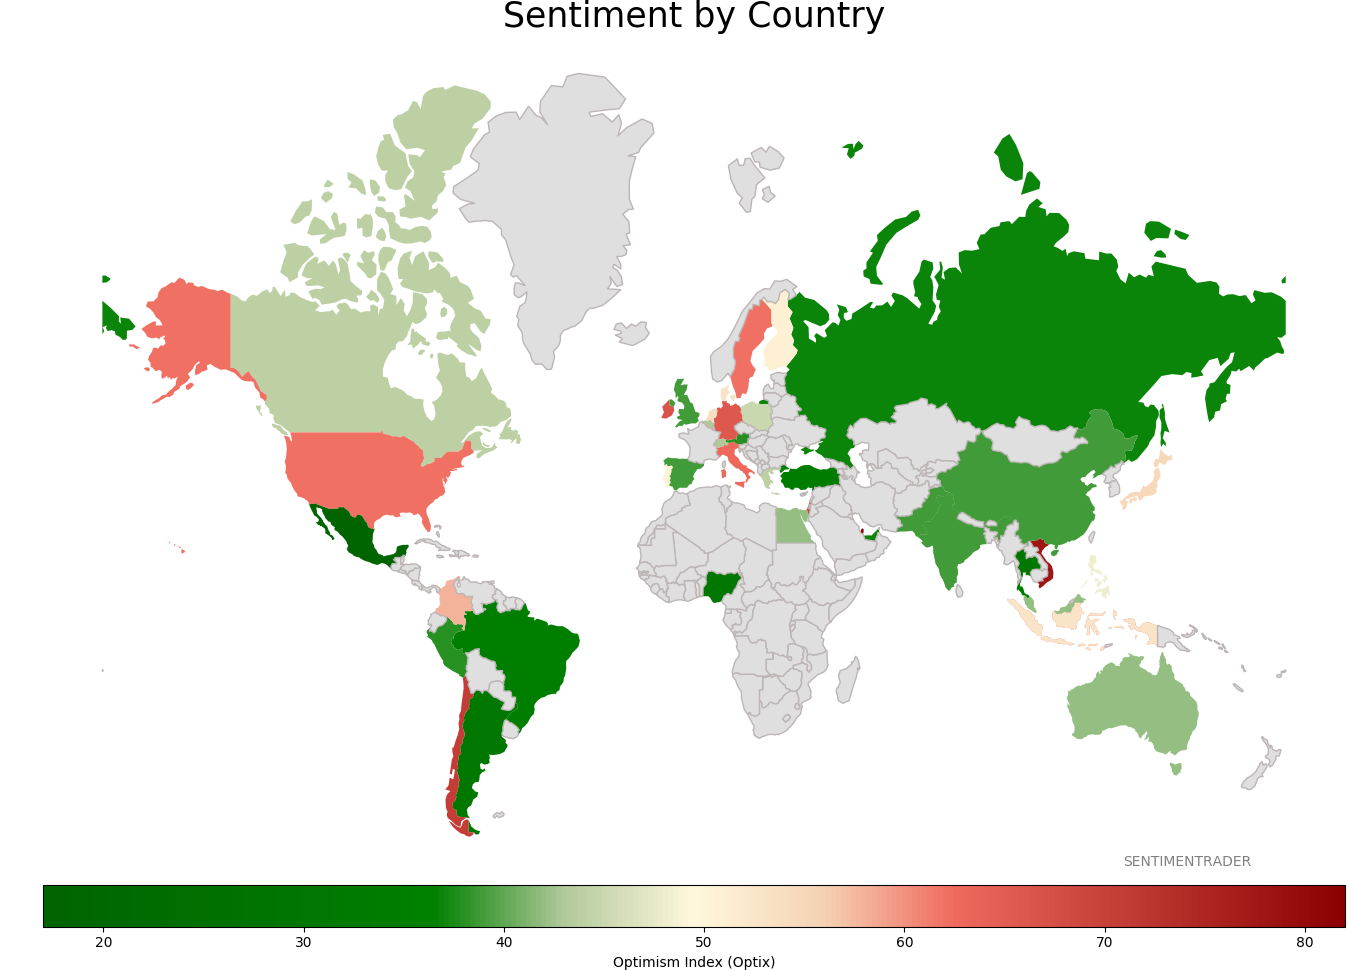
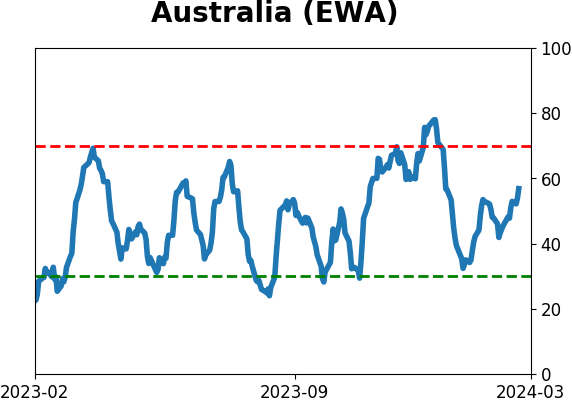
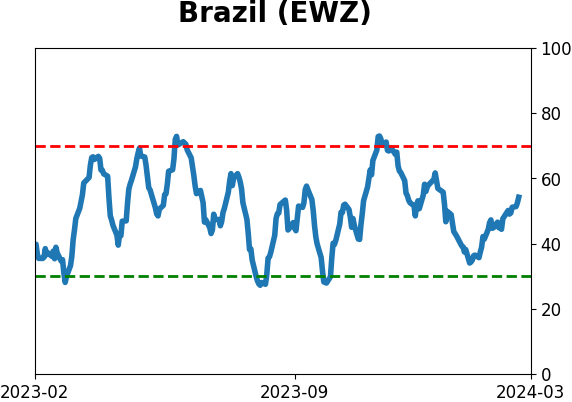
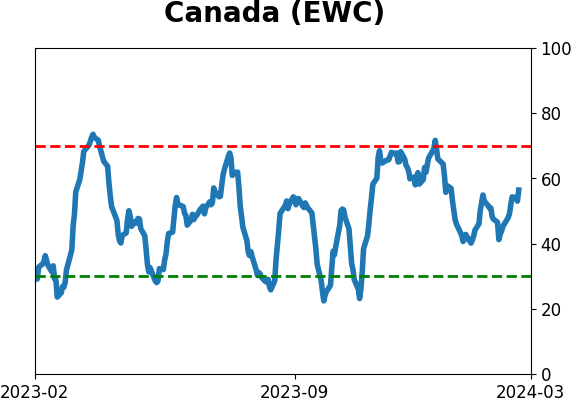
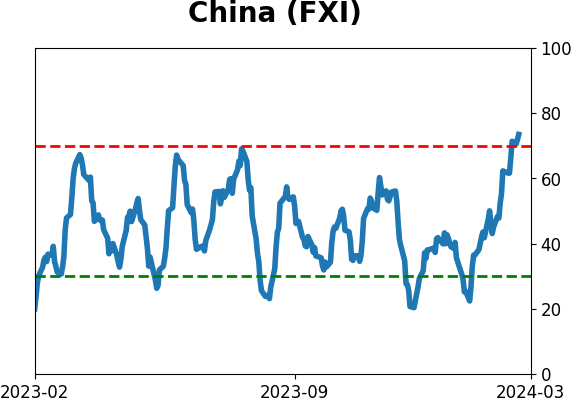
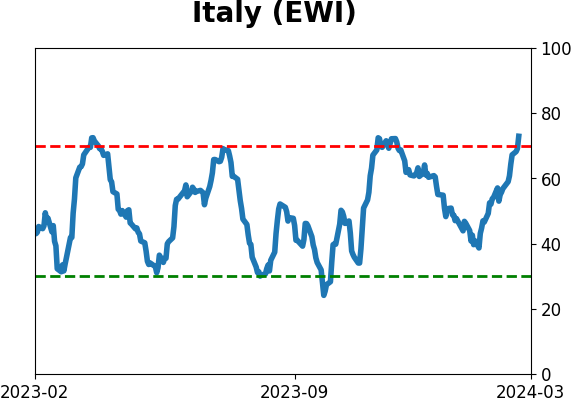
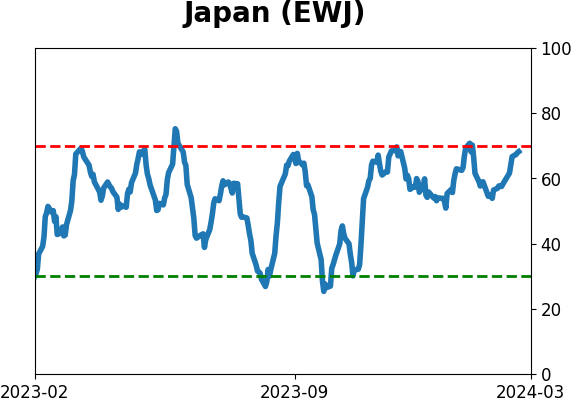
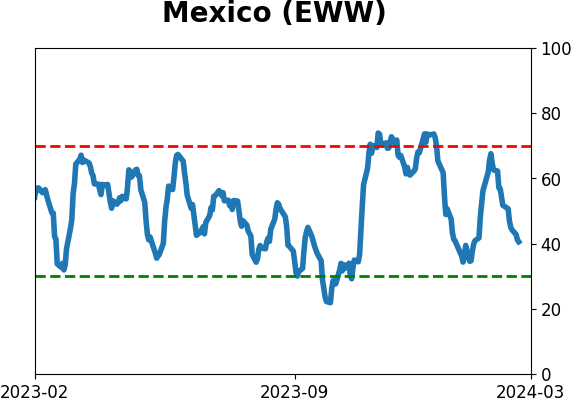
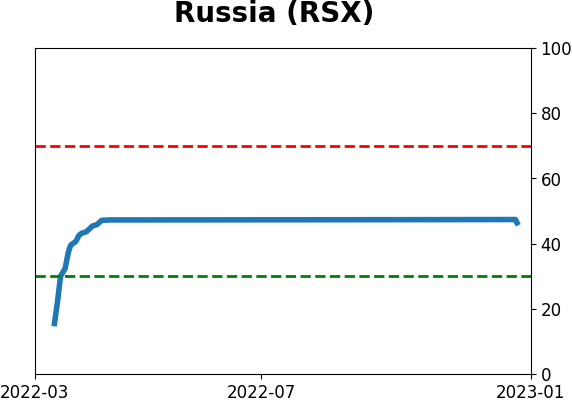
Sentiment Around The World
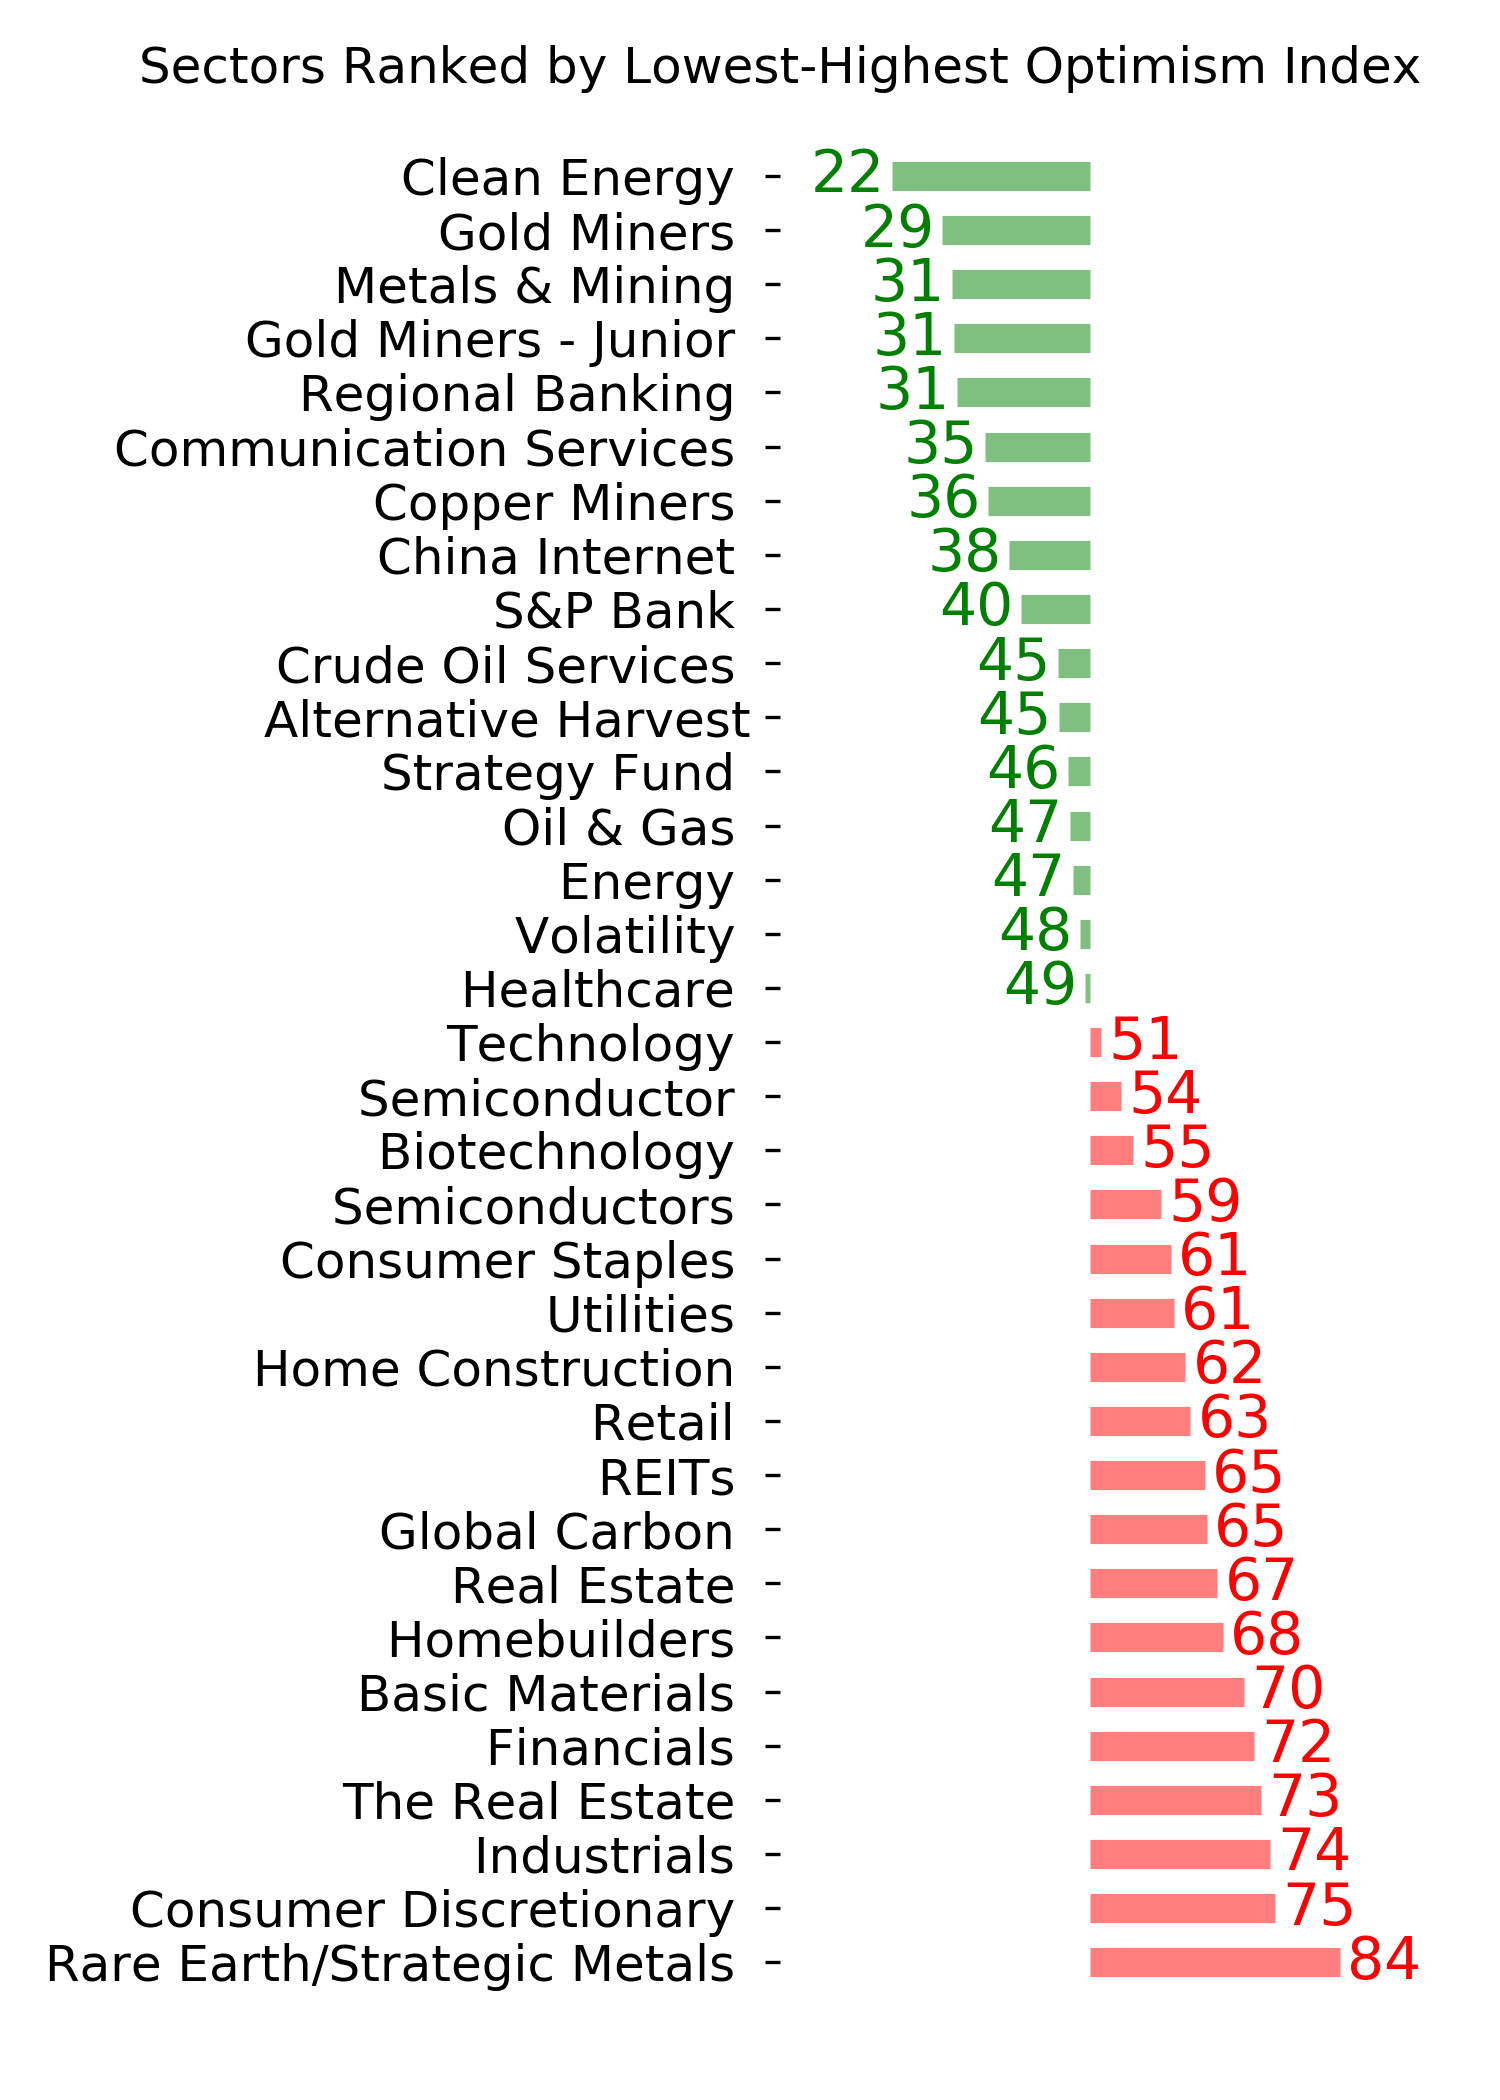
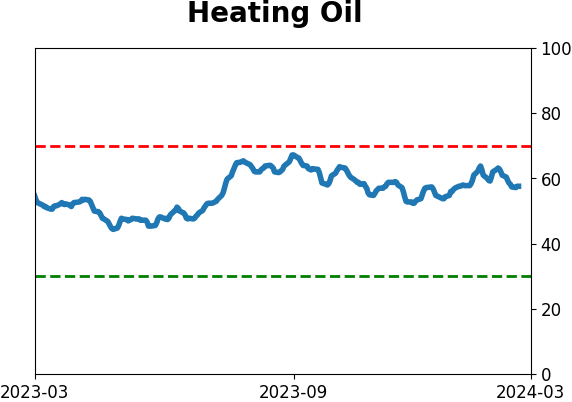
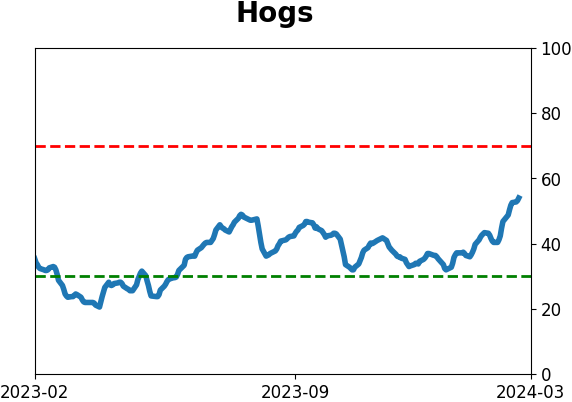
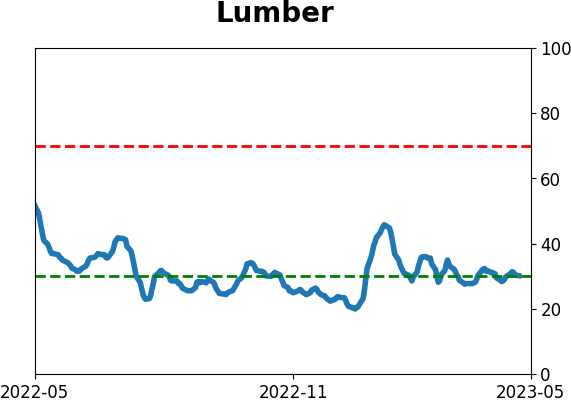
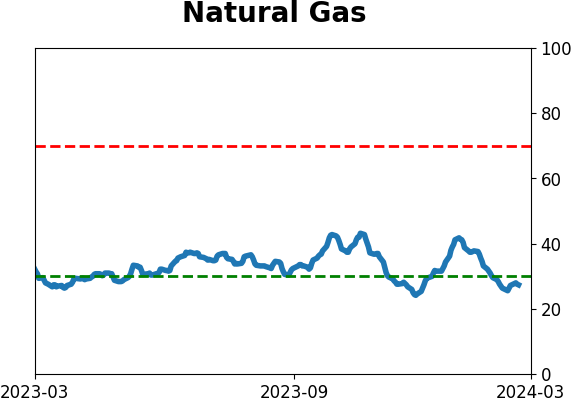
Optimism Index Thumbnails
|
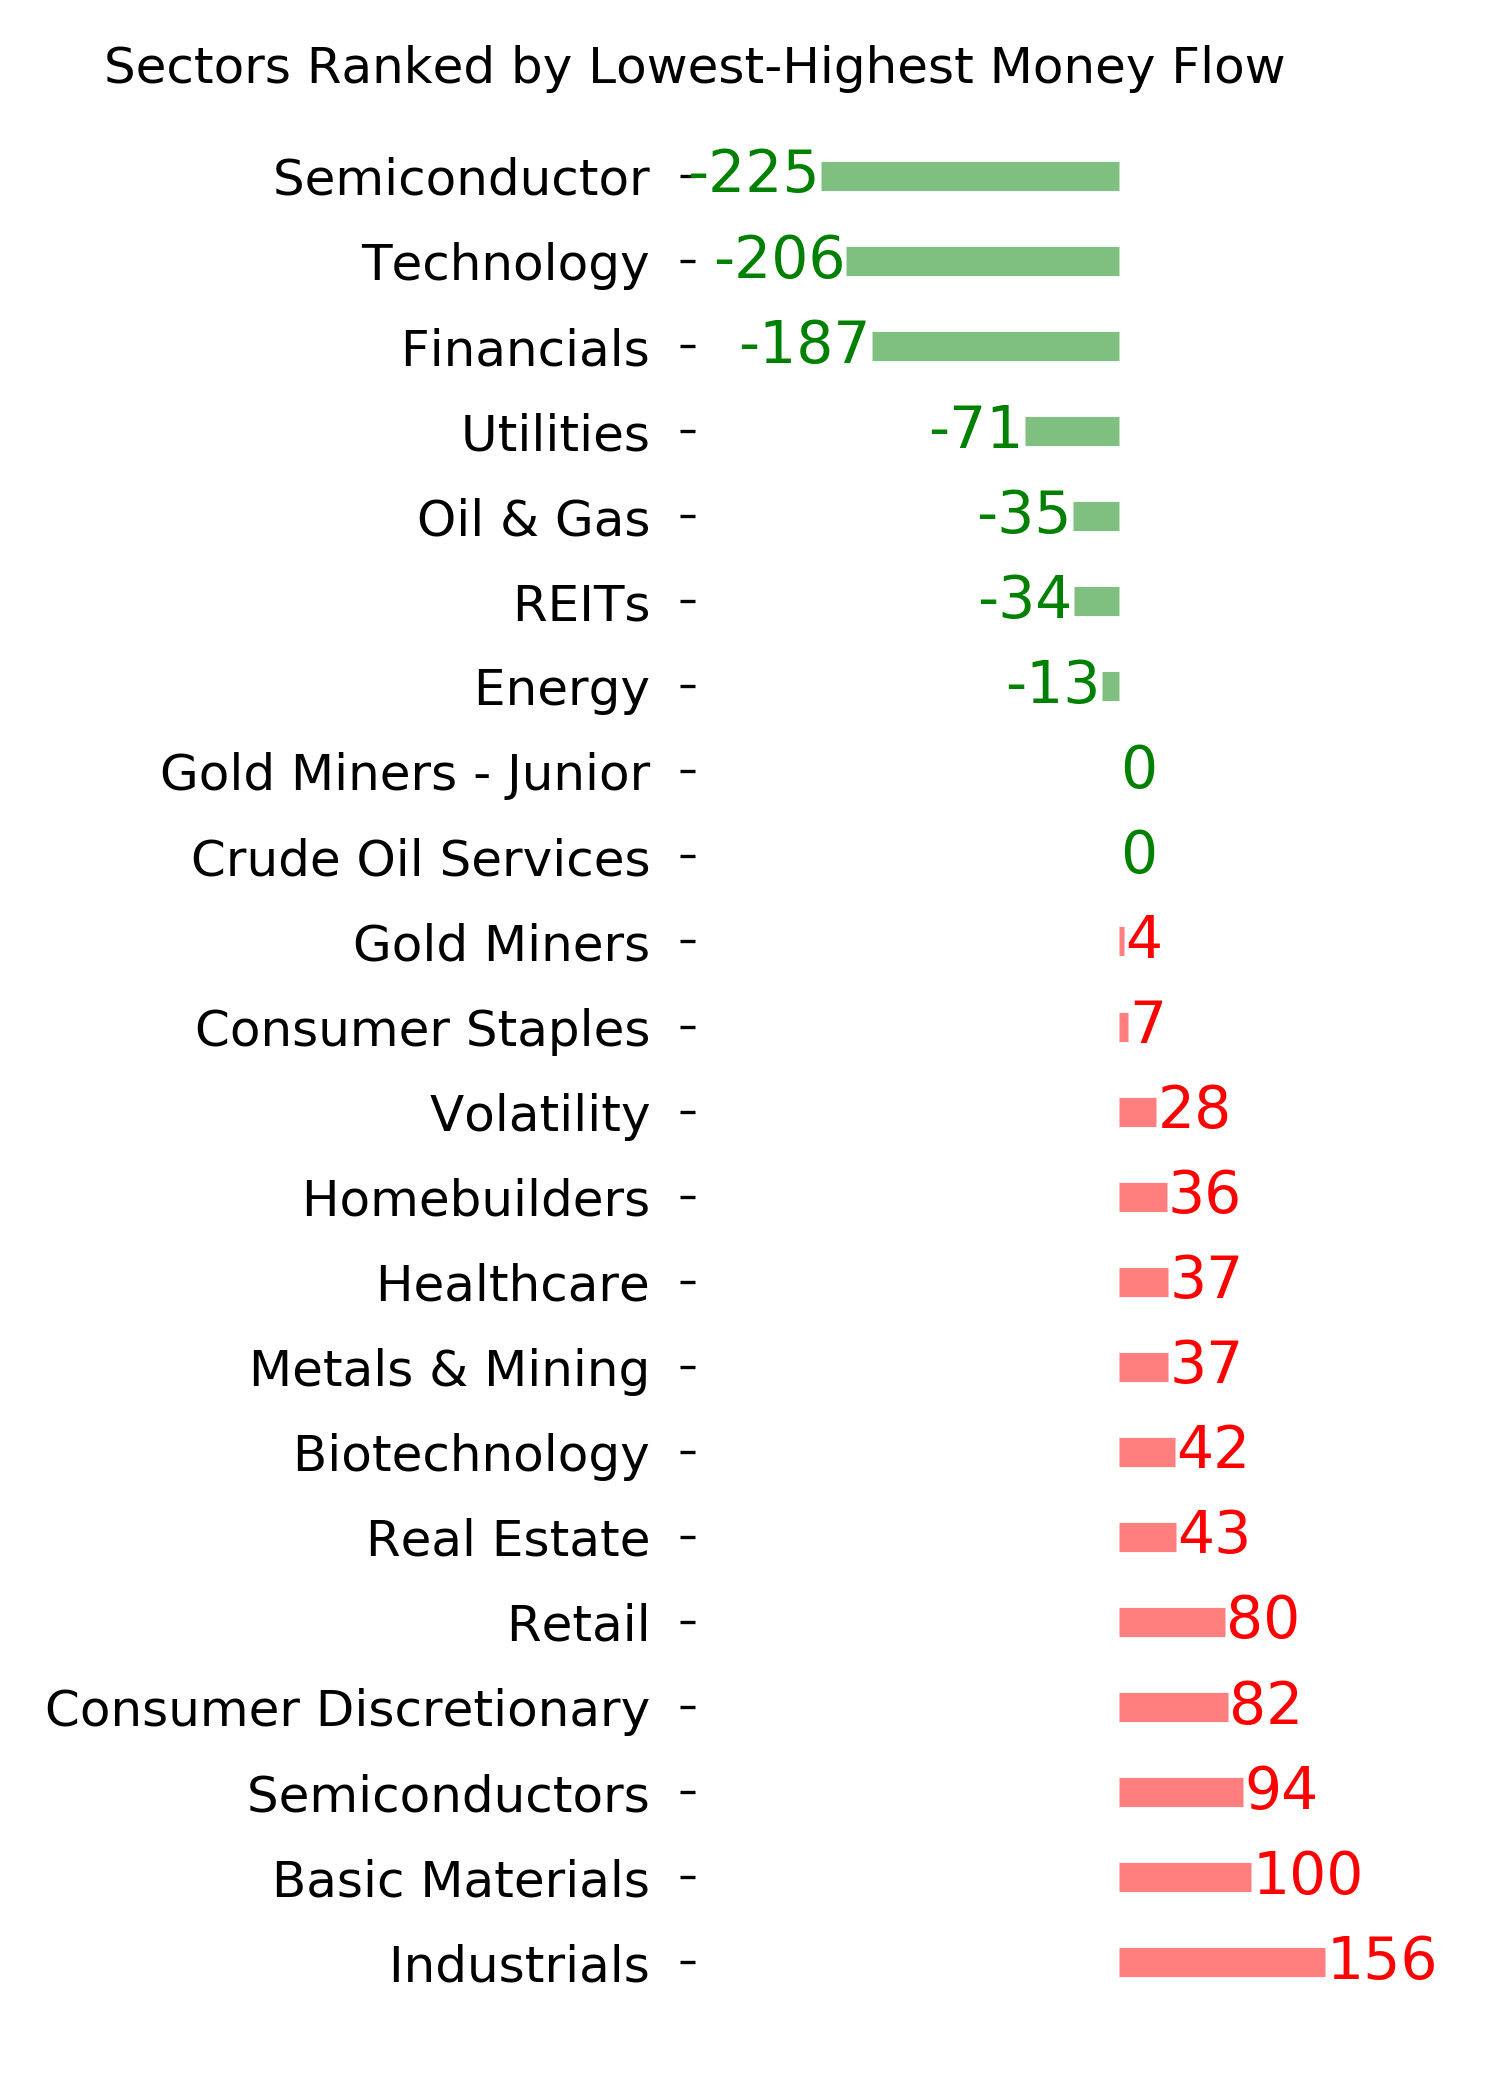
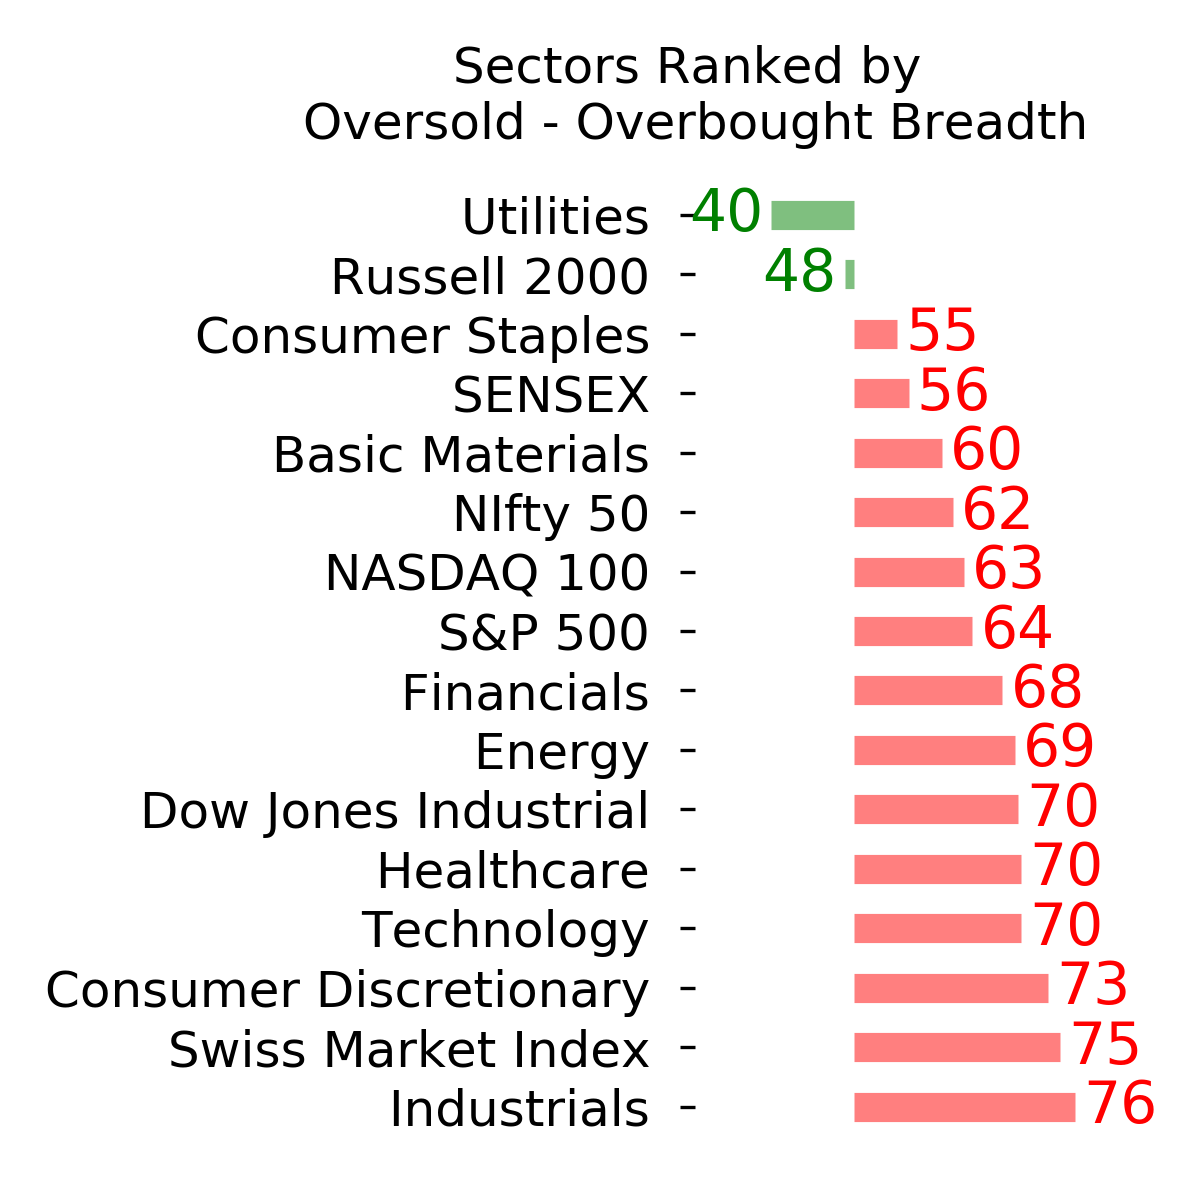
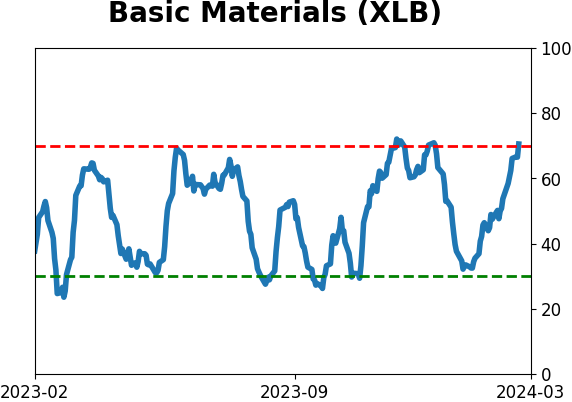
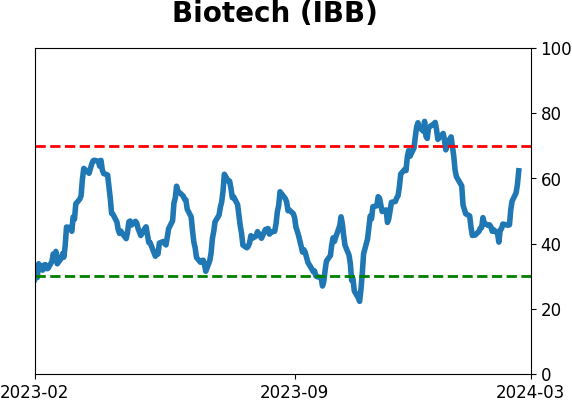
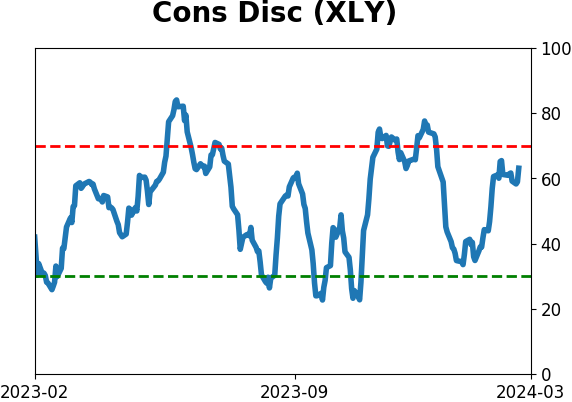
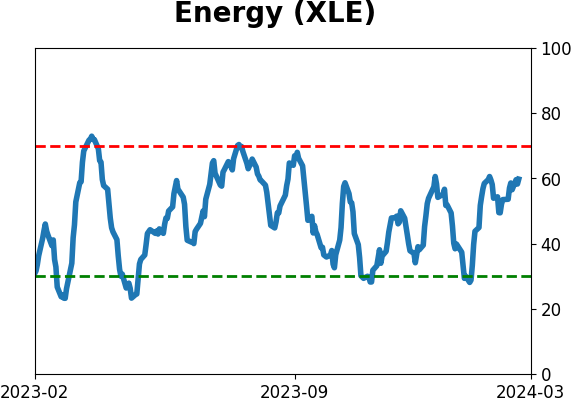
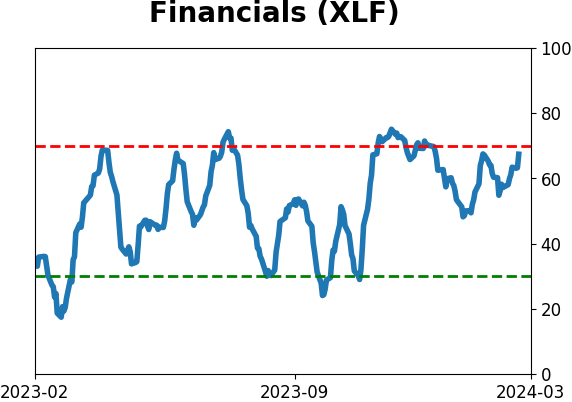
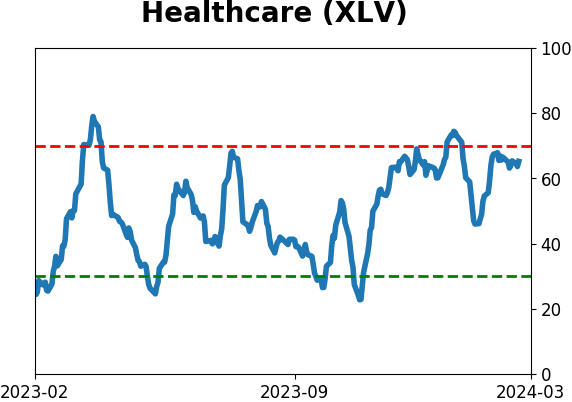
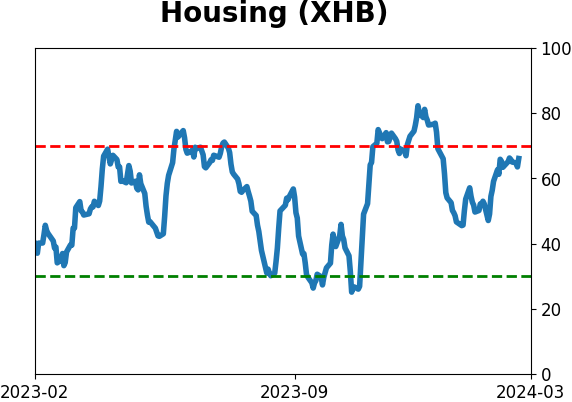
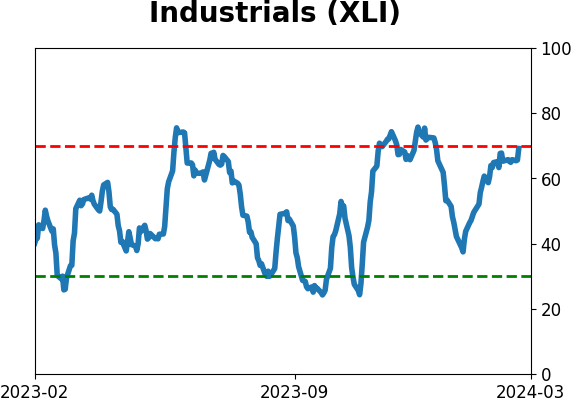
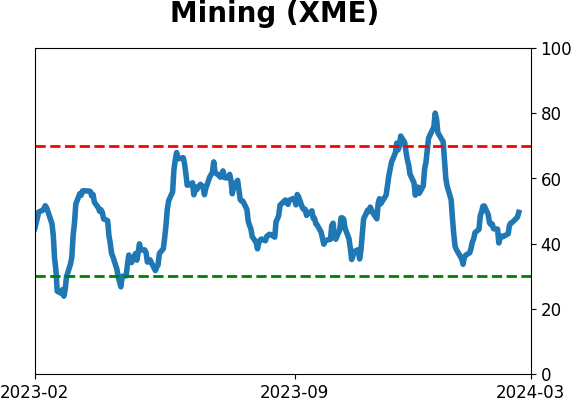
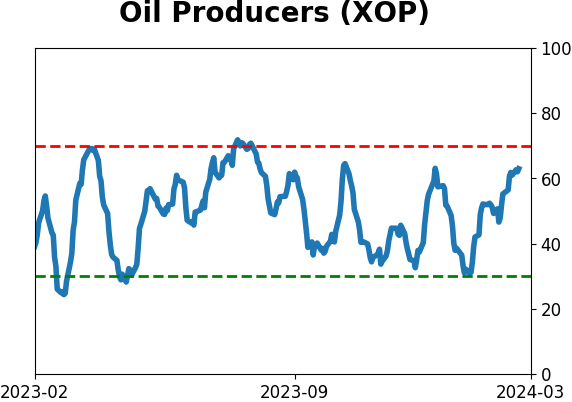
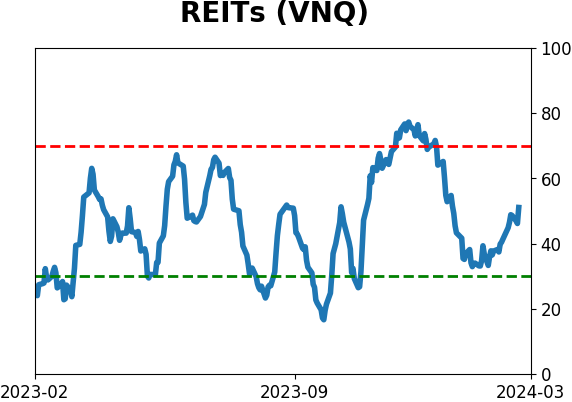
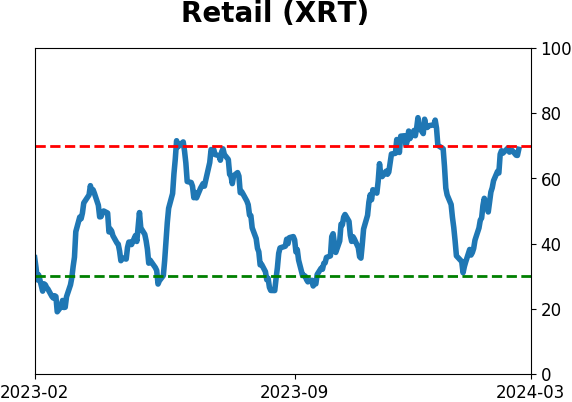
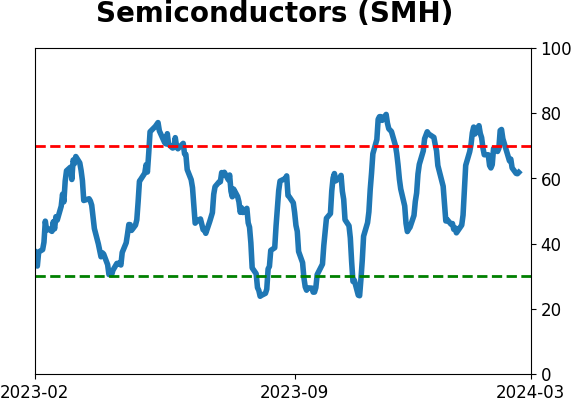
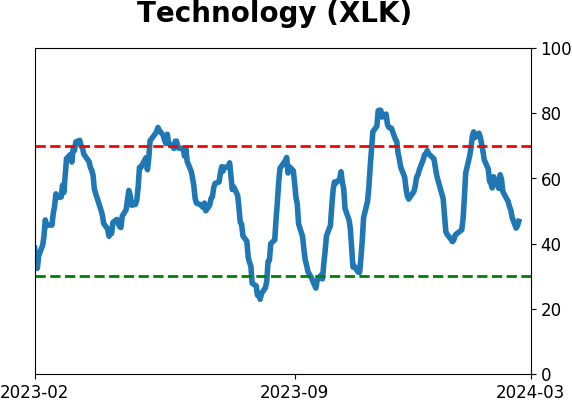
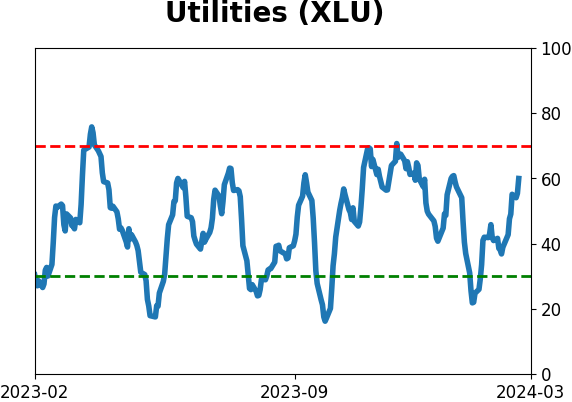
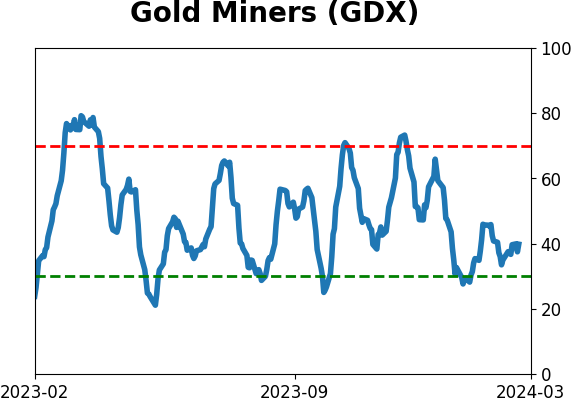
Sector ETF's - 10-Day Moving Average
|
|
|
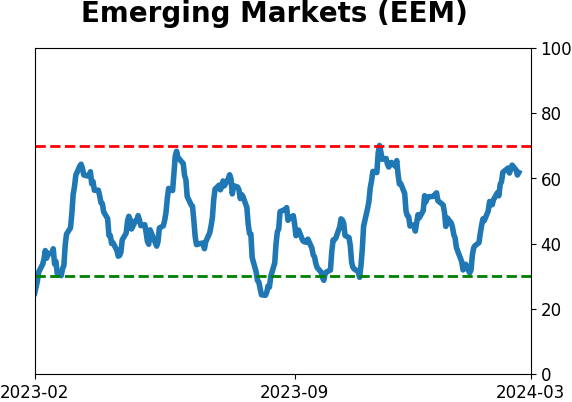
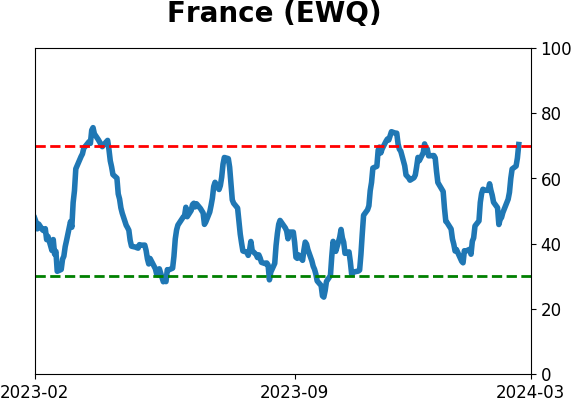
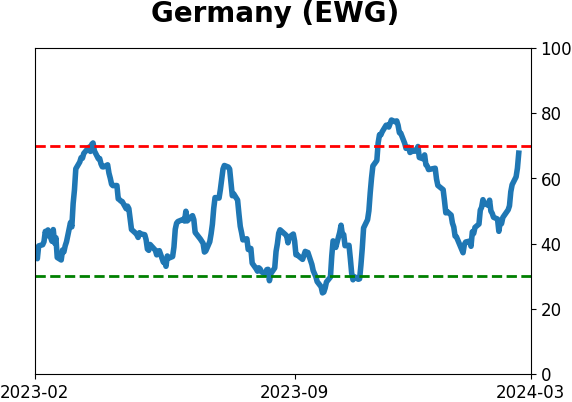
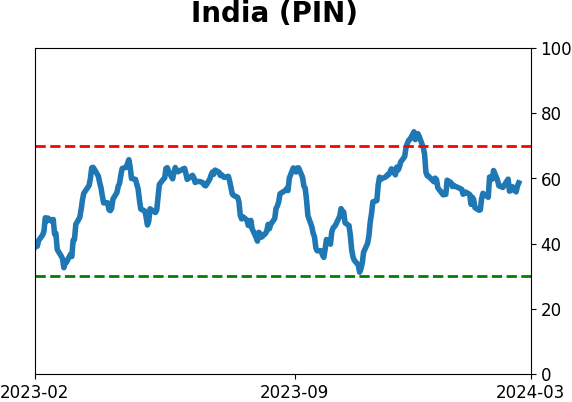
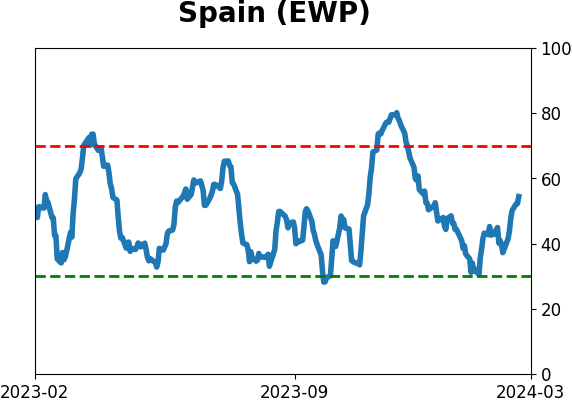
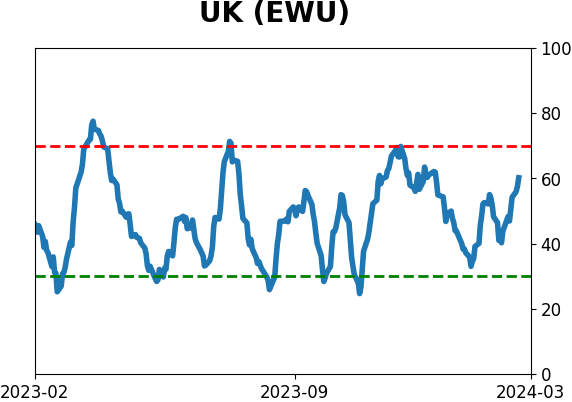
Country ETF's - 10-Day Moving Average
|
|
|
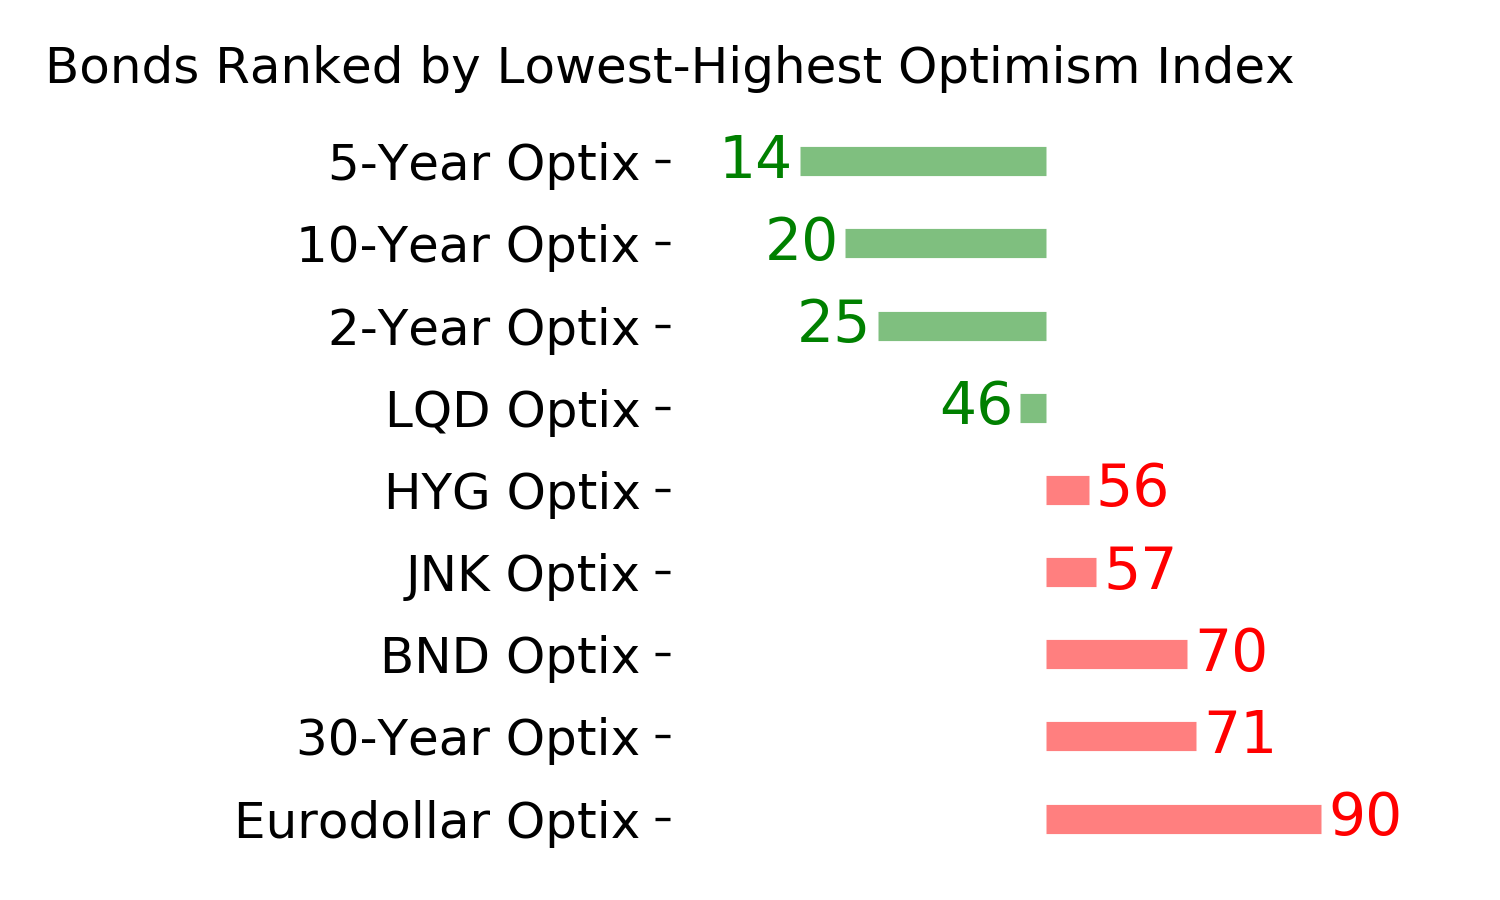
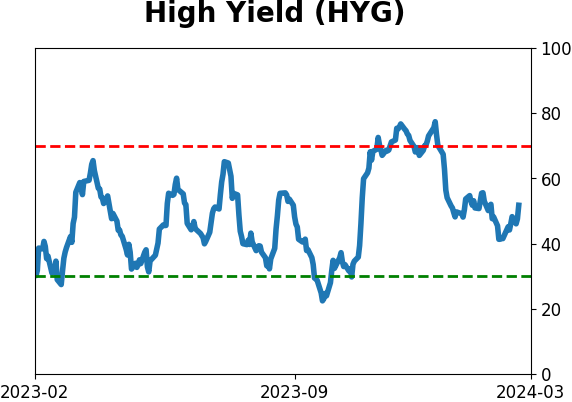
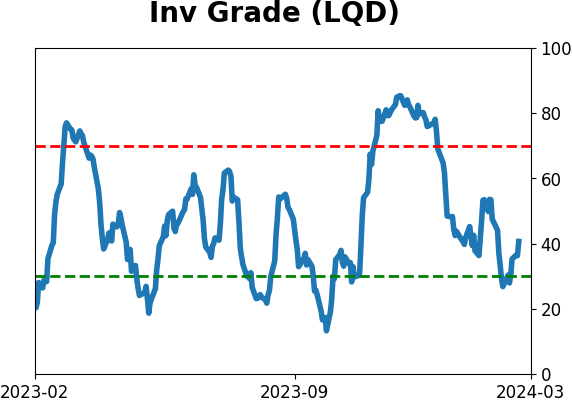
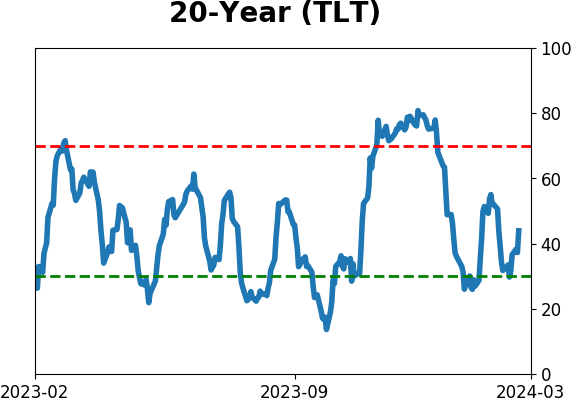
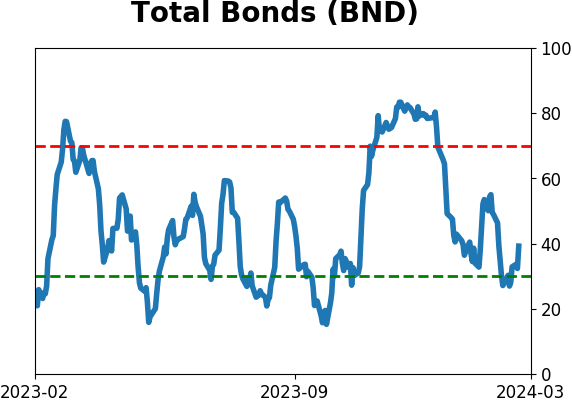
Bond ETF's - 10-Day Moving Average
|
|
|
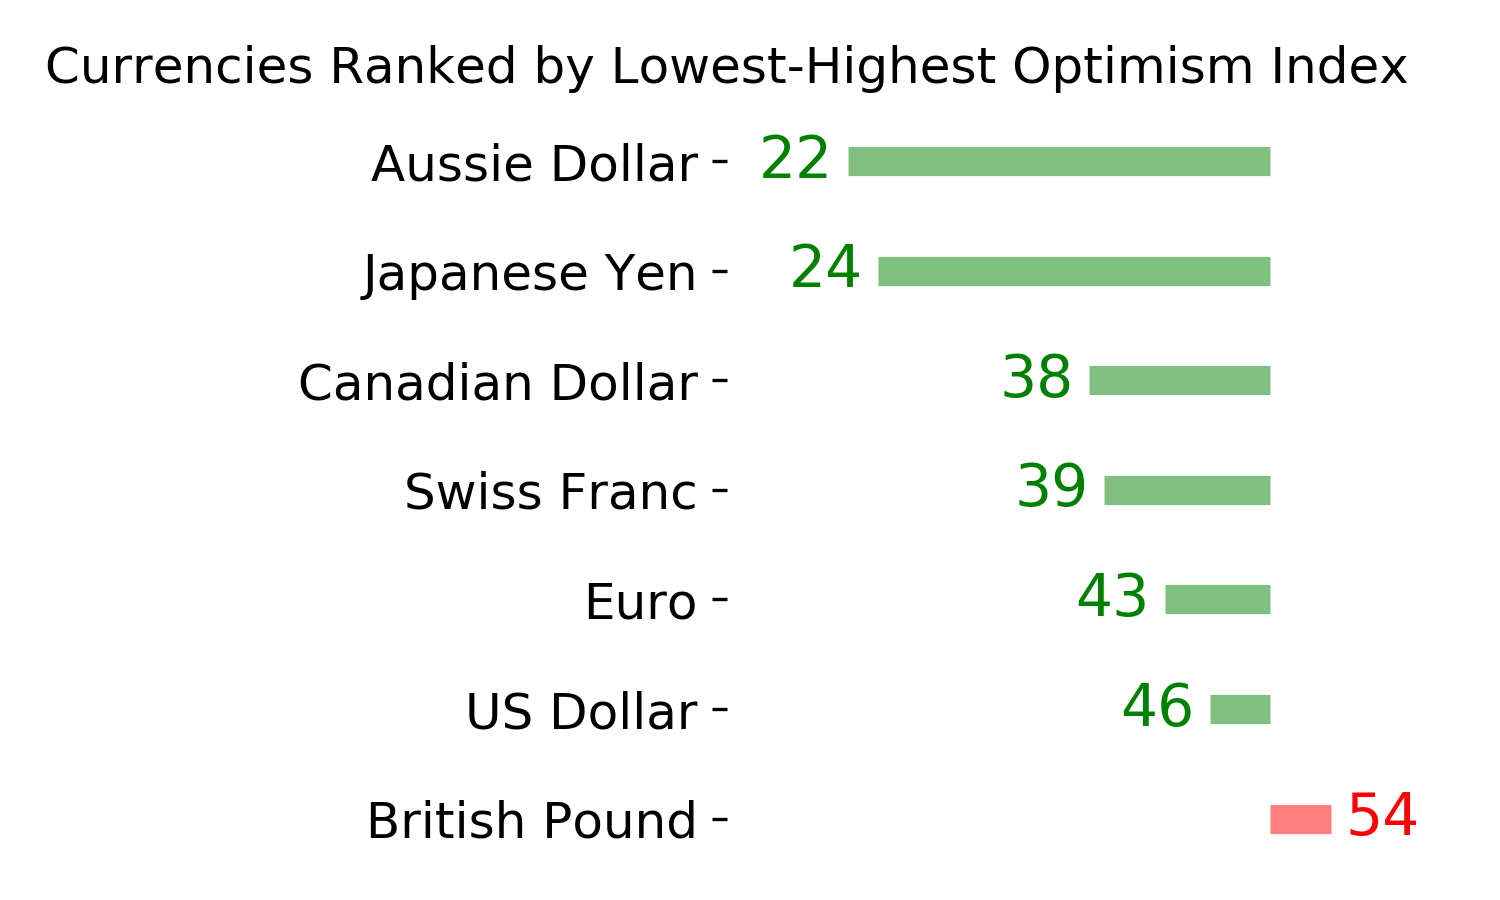
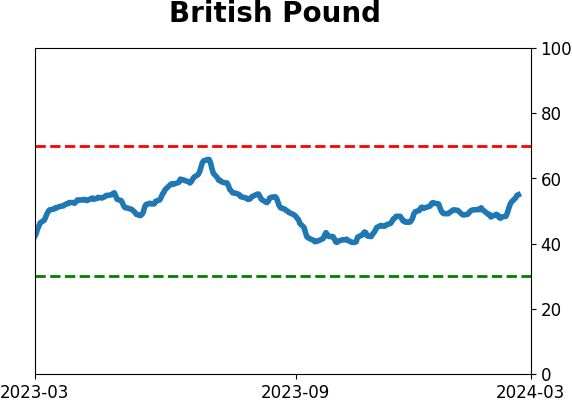
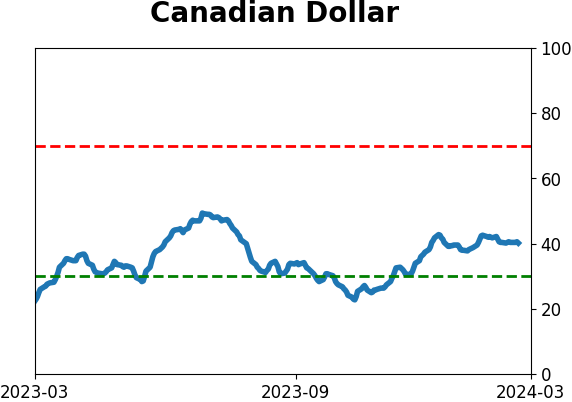
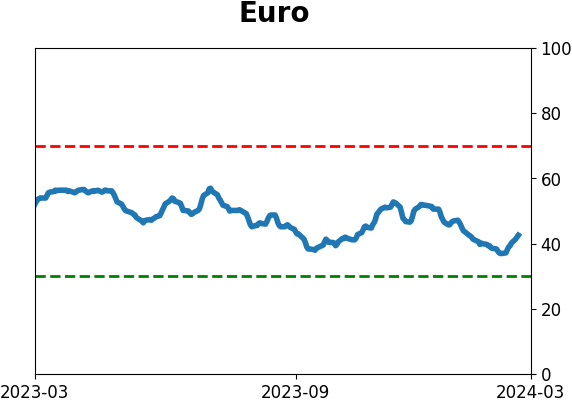
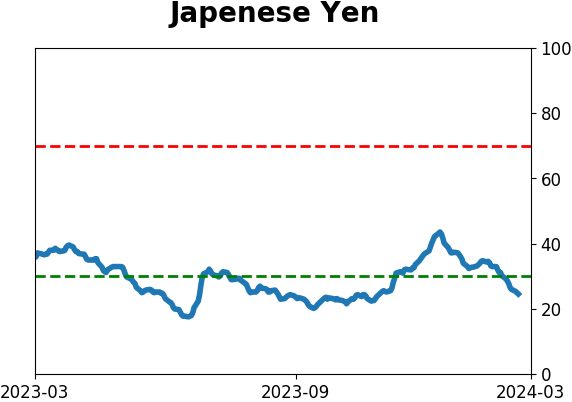
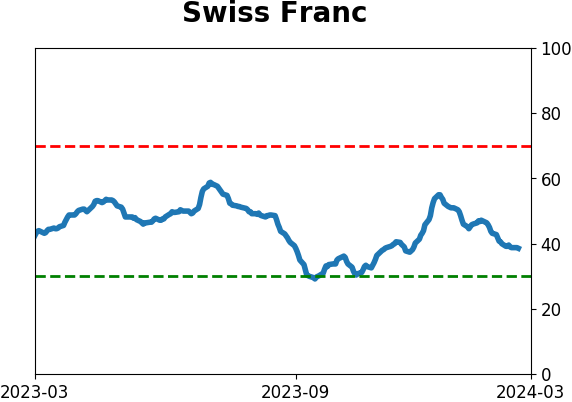
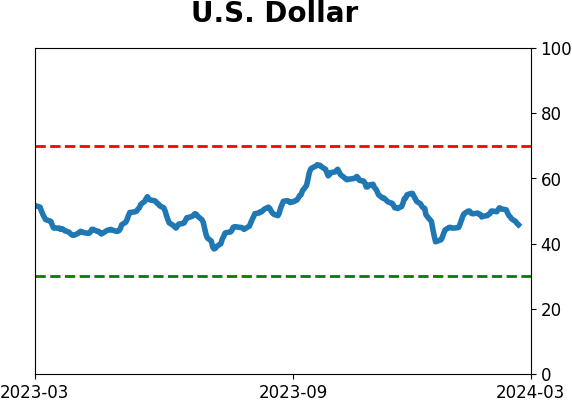
Currency ETF's - 5-Day Moving Average
|
|
|
Commodity ETF's - 5-Day Moving Average
|
|