Headlines
|
|
Retail options traders are not buying the massive price reversals:
The S&P 500 enjoyed a massive price reversal last week, including more than 10% of its member stocks. Reversals are unreliable predictors, however, and small options traders used the week to buy a historic amount of put options. That has typically preceded long-term gains for stocks.
|
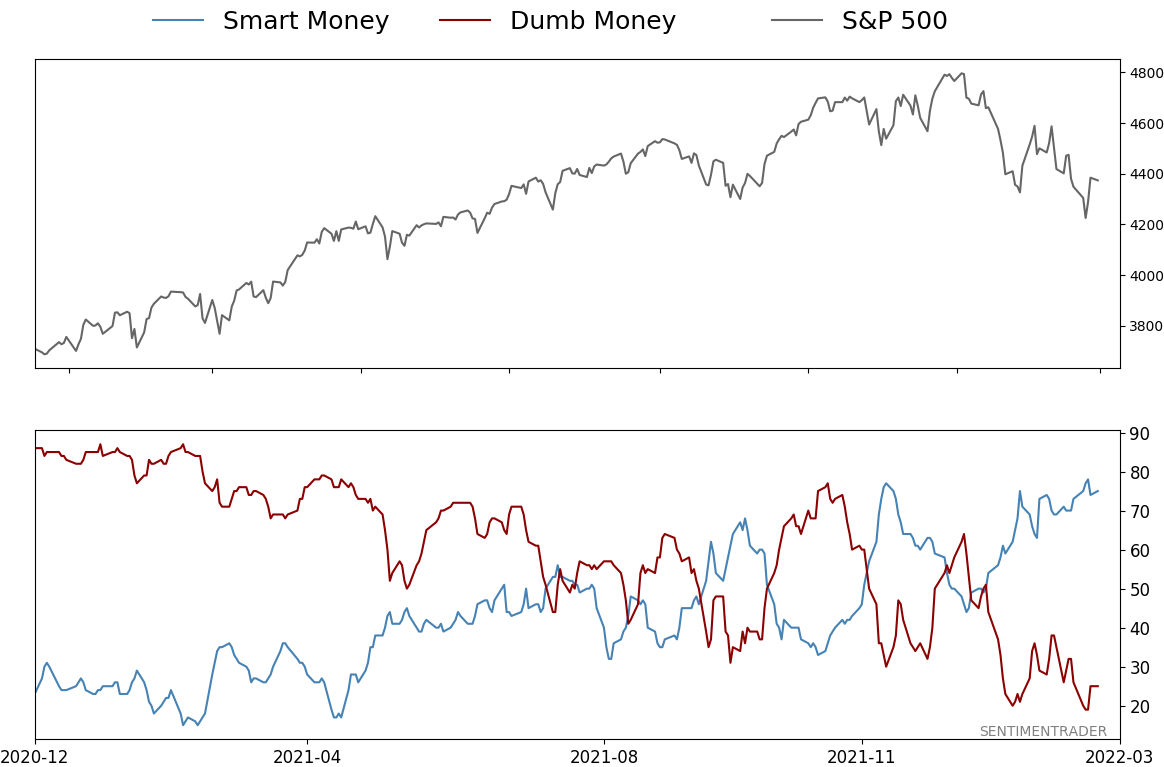
Smart / Dumb Money Confidence
|
Smart Money Confidence: 75%
Dumb Money Confidence: 25%
|
|
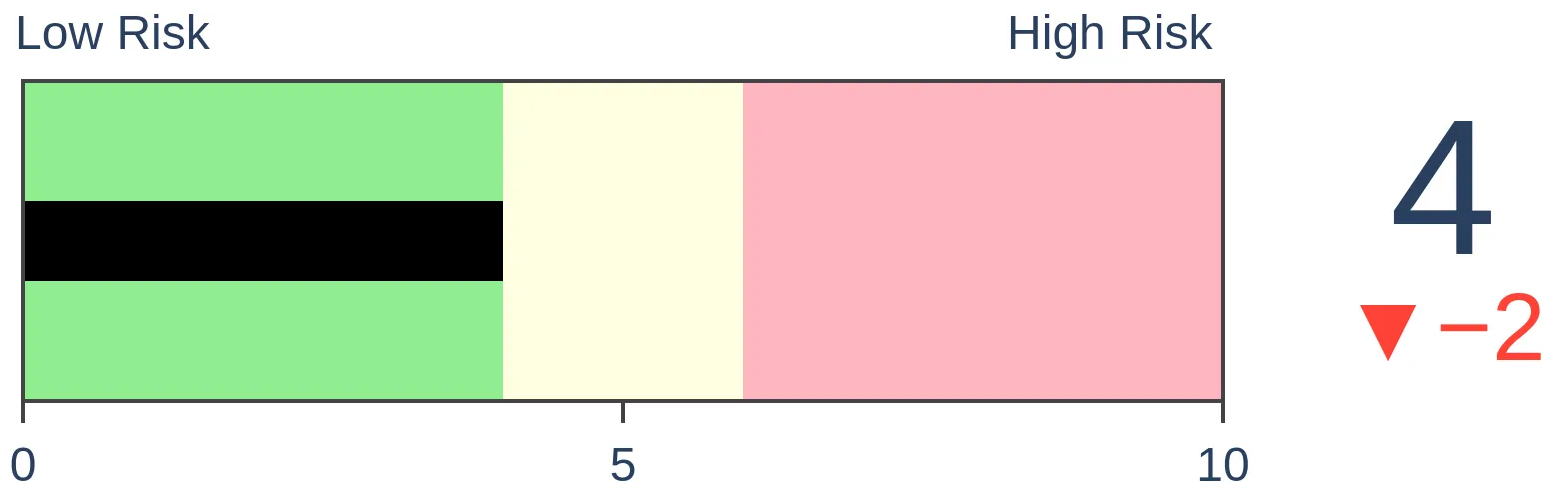
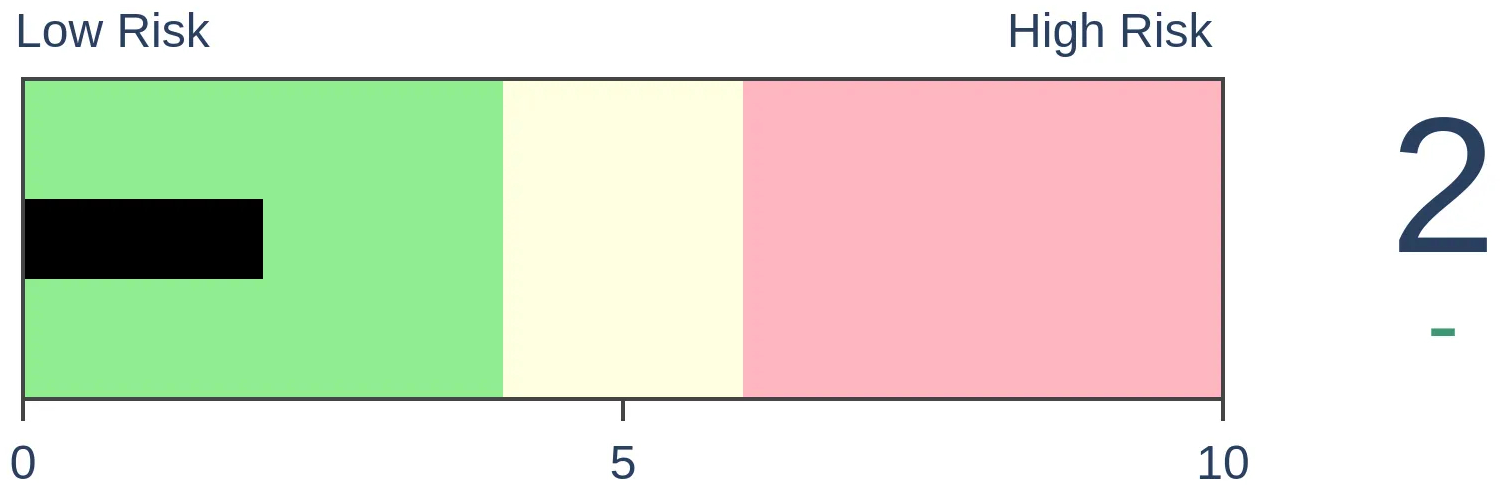
Risk Levels
Stocks Short-Term
|
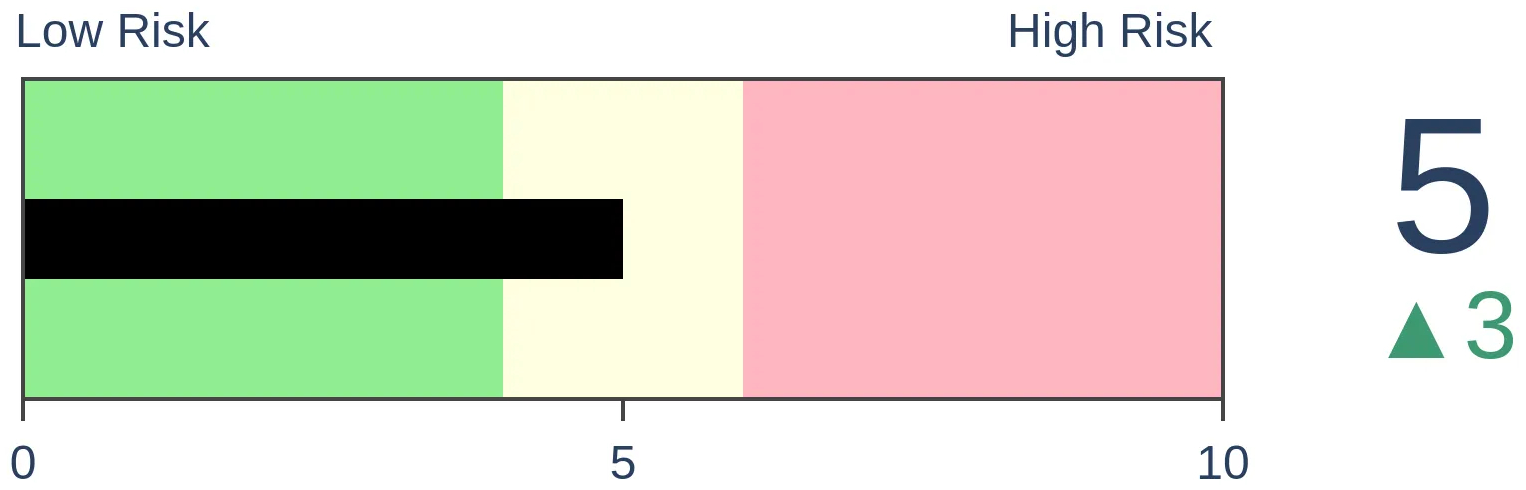
Stocks Medium-Term
|
|
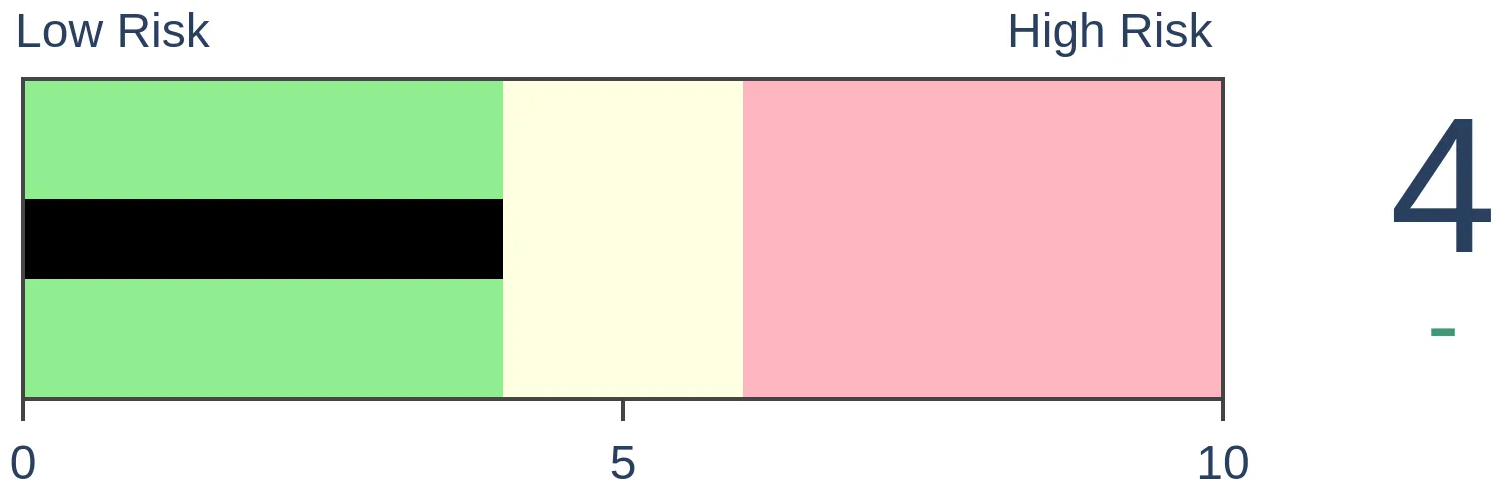
Bonds
|
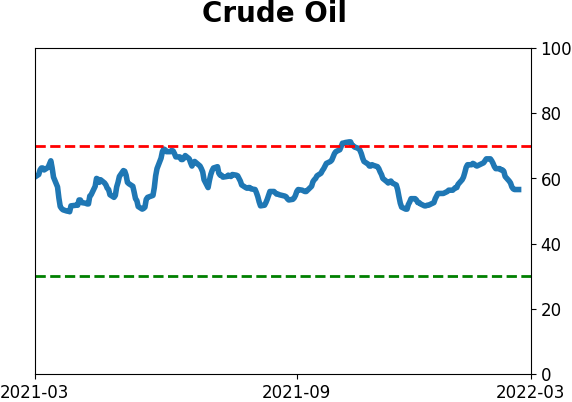
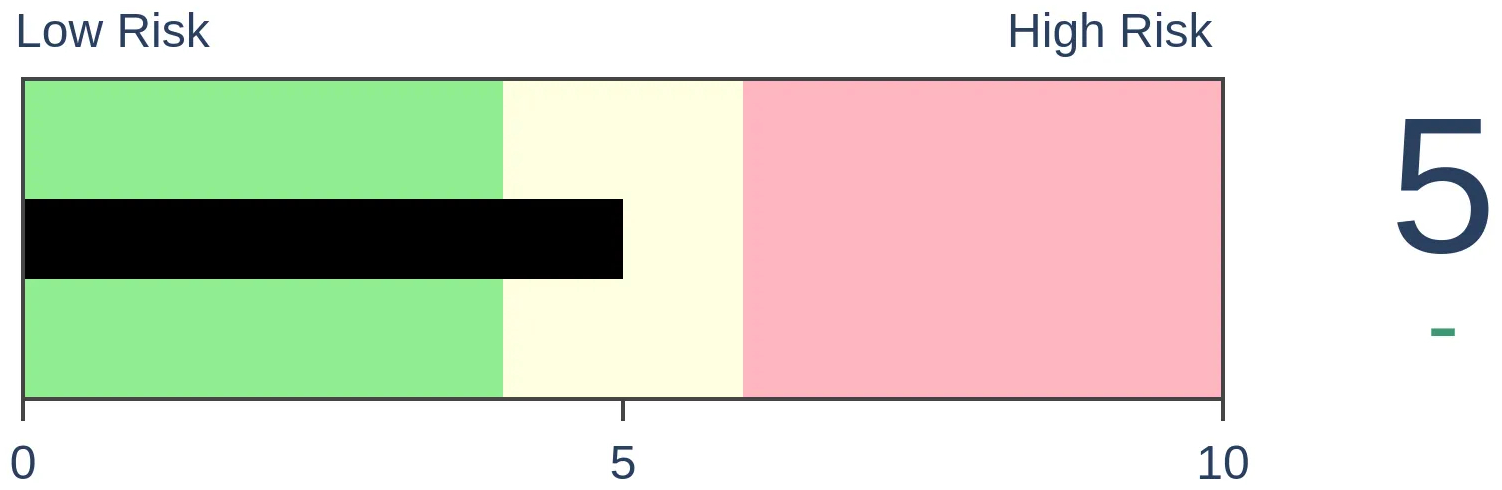
Crude Oil
|
|
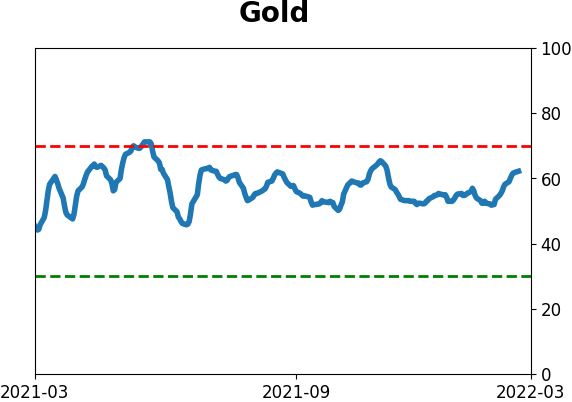
Gold
|
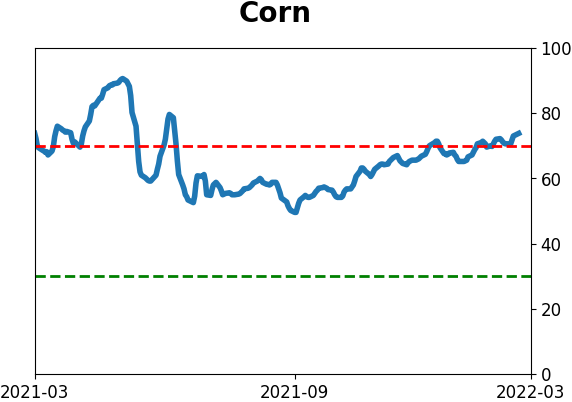
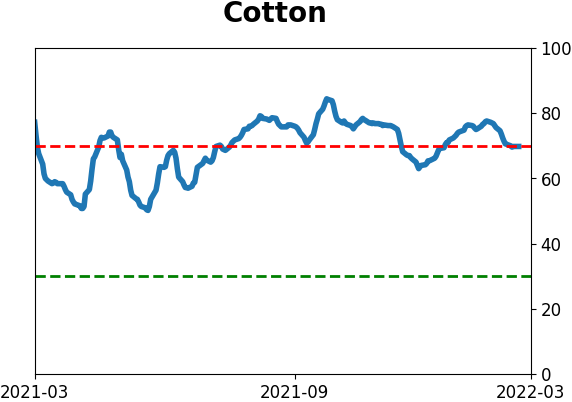
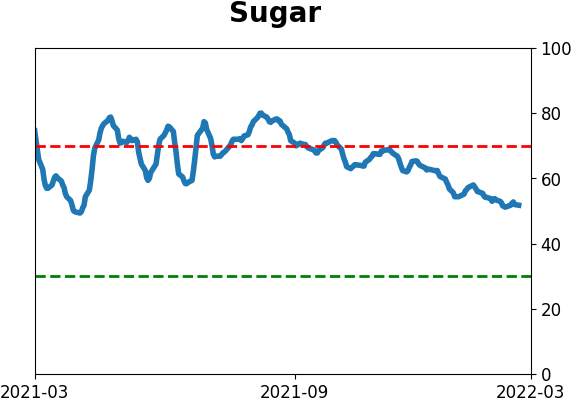
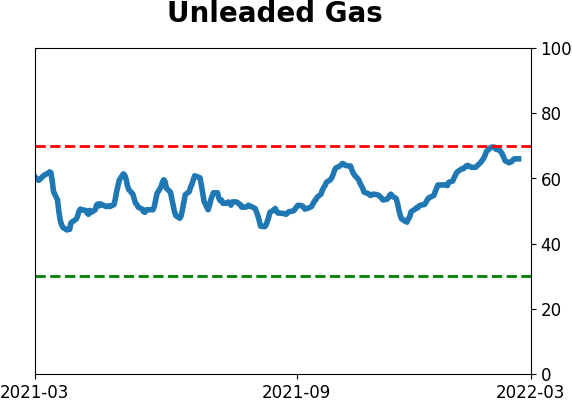
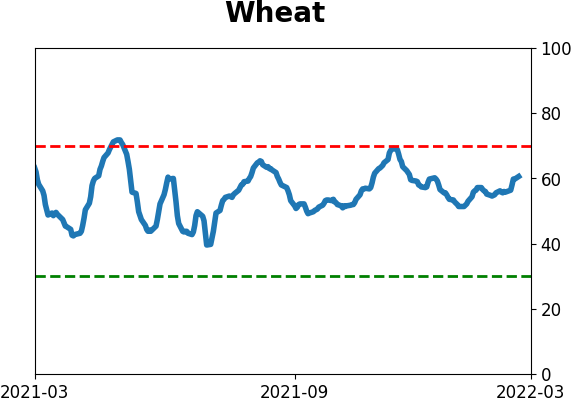
Agriculture

|
|
Research
By Jason Goepfert
BOTTOM LINE
The S&P 500 enjoyed a massive price reversal last week, including more than 10% of its member stocks. Reversals are unreliable predictors, however, and small options traders used the week to buy a historic amount of put options. That has typically preceded long-term gains for stocks.
FORECAST / TIMEFRAME
None
|
Key points:
- Major price reversals in the S&P 500 are unreliable predictors of future gains
- Small options traders aren't buying it and are paying up massively for downside protection
- That has triggered a spike in dealer exposure and potential future buying demand
Massive price reversals are unreliable
Last week's reversal was one for the record books. While reversals always look impressive on a chart, generating a bevy of excited chatter and headlines, they are unreliable patterns. And retail traders aren't buying into the hype.
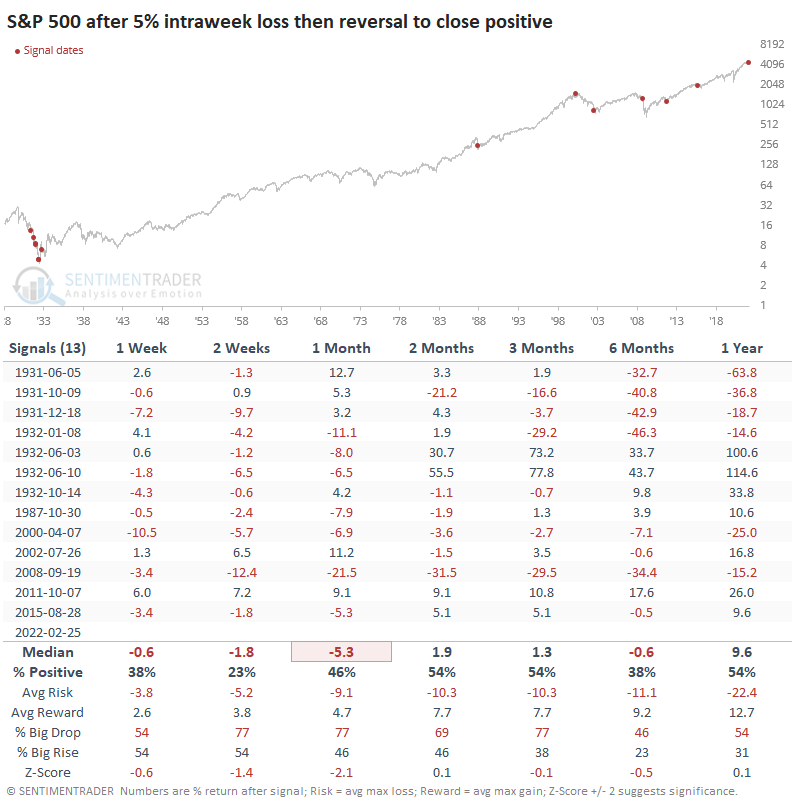
Last week marked one of only about a dozen instances since 1928 when the S&P 500 fell more than 5% during its worst point during a calendar week and then reversed to close above the prior week's close. Out of the 13 precedents, 12 showed a loss in the S&P at some point between 2-8 weeks later. The only exception was the ultimate bottom in October 2011.
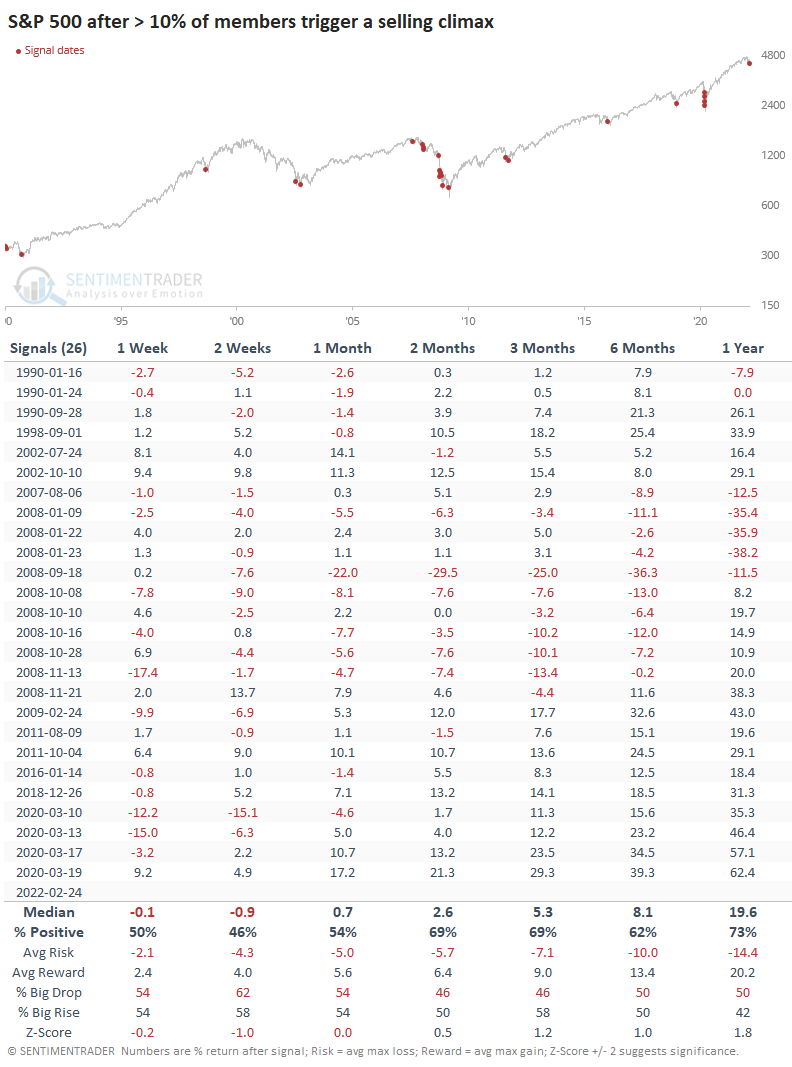
According to Optuma calculations, more than 10% of stocks within the S&P 500 triggered a daily selling climax on Thursday. This happens when the stock dips to a one-year low then reverses to close in positive territory. Once again, short-term returns were not impressive, with more losses than gains. Long-term returns were significantly better, though there were massive losses if relying on these reversals in 2008.
Retail options traders are not buying into it
Two weeks ago, small options traders spent a tremendous amount of their volume on protective put options. They took a mild break after markets initially rebounded but now are at it again.
Last week, they spent 29% of their volume on buying put options to open, among the highest levels in 22 years. They still spent 37% of their volume on buying call options to open, a high amount historically but the lowest since April 2020.
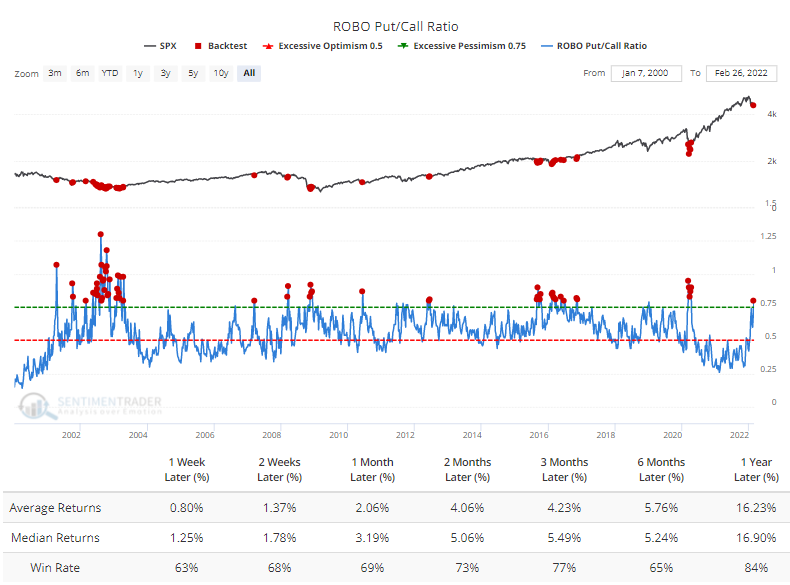
Even so, the ROBO Put/Call Ratio jumped to 80%, one of the highest readings in years. The Backtest Engine shows good (not great) returns.
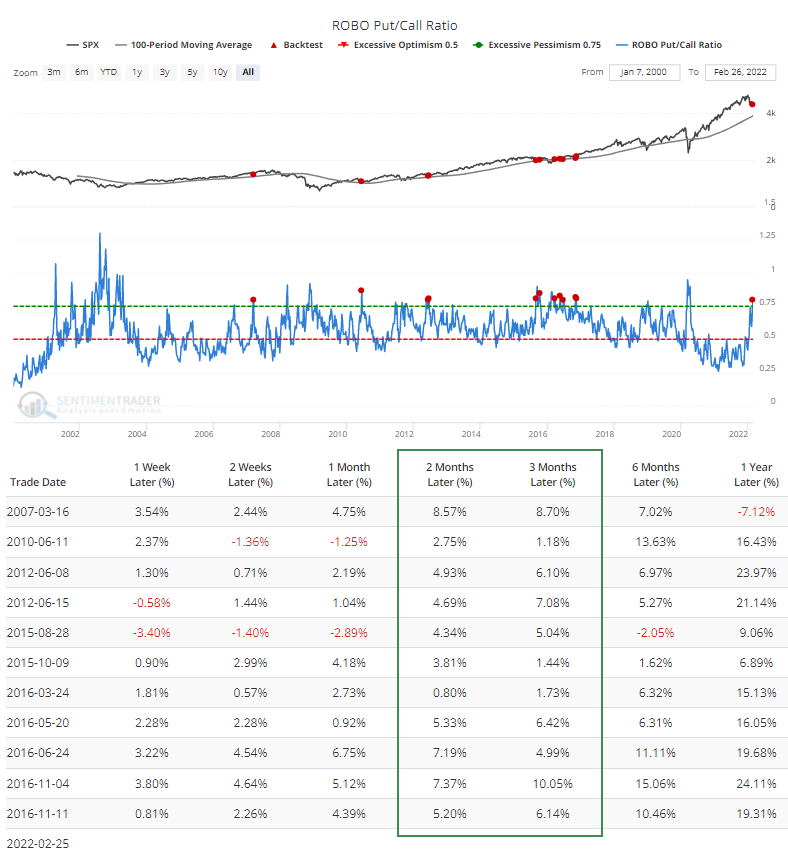
The worst returns came during the waterfall declines near the end of the most vicious bear markets. One difference this time is that stock indexes are not mired in a deep and lengthy bear market at this point. When we add that the S&P 500 needs to be trading above its 100-week moving average, the Backtest Engine showed pristine forward returns.
Traders are spending more on protection
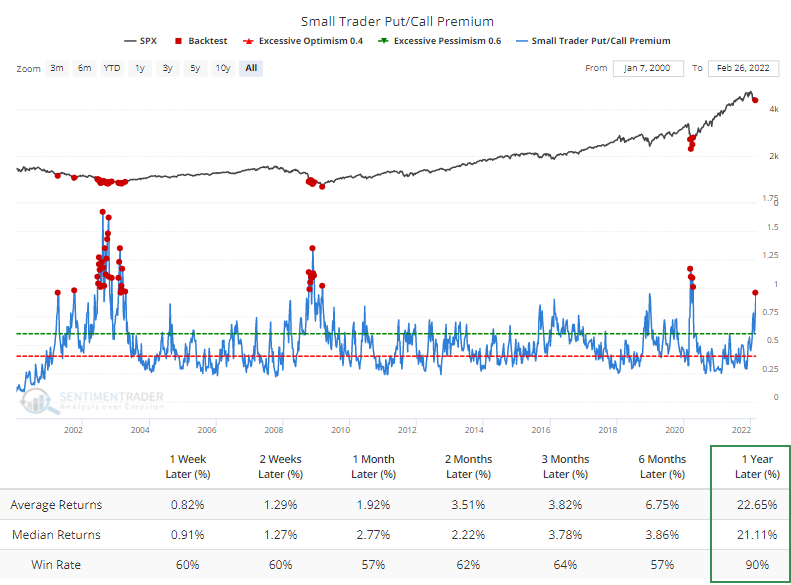
Due to the rising cost of hedges as implied volatility soars, small traders spent almost as much premium on buying put options as buying call options, approaching a very rare flip for these optimistic traders.
Last week, the smallest of options traders bought $4.3 billion worth of put options and $4.5 billion worth of call options. So, their spending on hedges was 96% of their spending on speculation, one of the highest ratios in 22 years. The Backtest Engine shows only modestly positive medium-term returns but excellent long-term ones. That's because this kind of behavior only occurred during the depths of the worst declines of the past two decades.
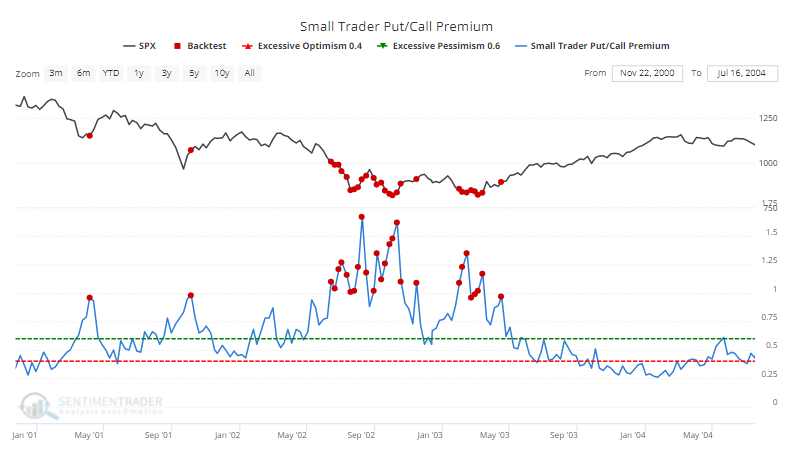
Zooming in on the 2001-02 bear market, such heavy relative hedging behavior occurred at the bottoms in 2001. But during the summer of 2002, it preceded the final puke phase, where the medium-term losses occurred. During the bottoming test in early 2003, hedging activity again spiked and preceded massive gains for those taking the opposite side.
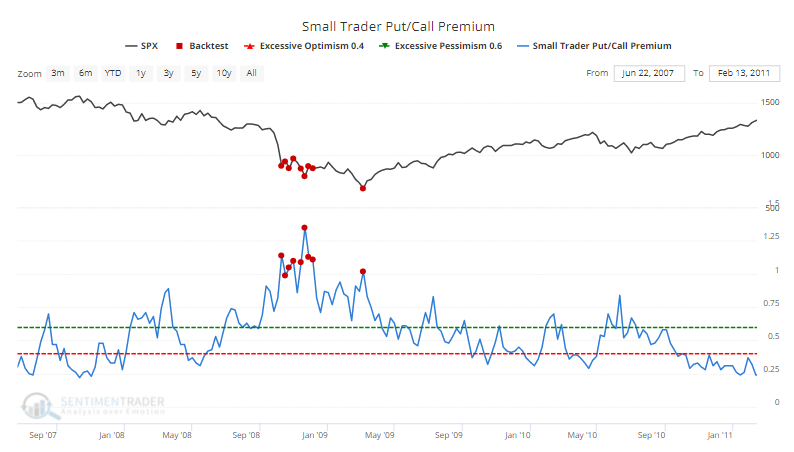
During the 2008 bear market, small traders' hedging activity spiked in October, which led to extremely whippy price action before the final leg lower in early 2009, when traders once again paid dearly for hedges.
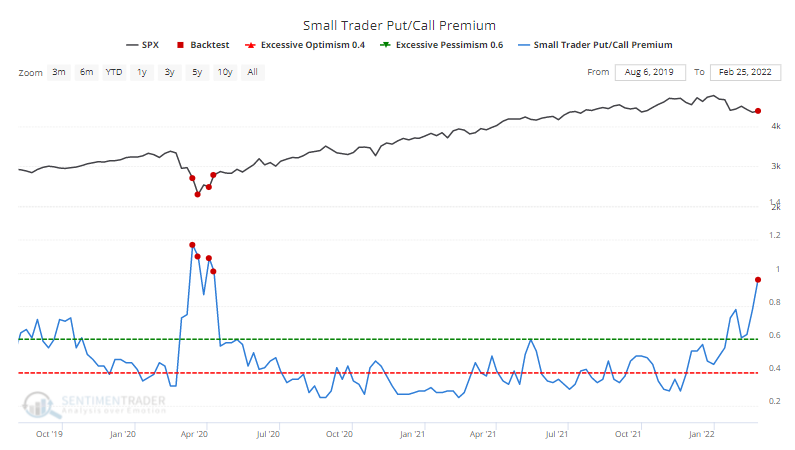
During the 2020 bear market, hedging activity spiked in the week before the final low, then continued in the weeks afterward. All, of course, led to losses for the hedgers if they held onto those positions for any length of time.
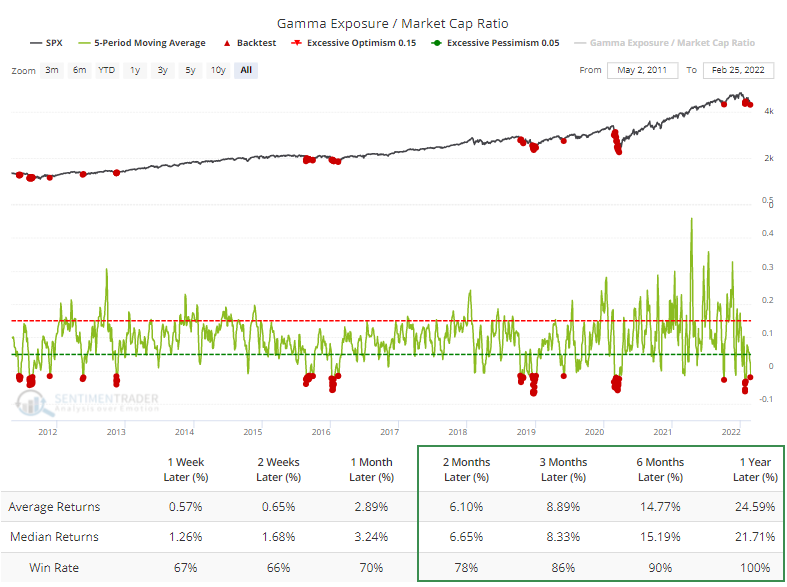
There are two sides to any trade, so somebody takes the other side of this put activity. Estimates of dealer exposure and how much underlying stock they may need to buy or sell are currently showing potential buying demand equivalent to about 0.1% of the S&P 500's market capitalization. That doesn't sound like much, but the Backtest Engine shows excellent medium- to long-term returns when Gamma Exposure has been at this level or beyond.
What the research tells us...
With valuations historically high, geopolitics taking a decidedly uncertain tone, and a Federal Reserve that may now be a headwind for investors, market behavior over the past month has a kind of January 2008 type of feel. The market environment is unhealthy, and investors are in clear risk-off mode. The only saving grace for bulls may be that sentiment has shifted so far to the bearish side that we should be in for a relief rally lasting weeks or perhaps even months. During unhealthy markets, sentiment extremes need to be truly extreme beyond question, and that's arguable at best at this point. Prices should work higher, but confidence cannot be high.
Active Studies
| Time Frame | Bullish | Bearish | | Short-Term | 3 | 0 | | Medium-Term | 18 | 2 | | Long-Term | 15 | 5 |
|
Indicators at Extremes
Portfolio
| Position | Description | Weight % | Added / Reduced | Date | | Stocks | RSP | 21.4 | Added 10.2% | 2022-01-28 | | Bonds | 32.7% BND, 7.1% SCHP | 40.1 | Added 8.3% | 2021-10-26 | | Commodities | GCC | 2.4 | Reduced 2.1%
| 2020-09-04 | | Precious Metals | GDX | 4.6 | Reduced 4.2% | 2021-05-19 | | Special Situations | 7.6% KWEB, 4.9% XBI, 3.7% XLE, 1.8% PSCE | 18.0 | Added 4.6% | 2022-02-24 | | Cash | | 13.2 | | |
|
Updates (Changes made today are underlined)
With a typical time frame of several months in this account, I normally don't make changes so quickly. I've added back part of the stock exposure I took off earlier in January due to the washed-out conditions and extreme pessimism we're seeing across a wide array of metrics. The biggest issue is that the environment is unhealthy and we could be in the throes of a protracted bear market. Even so, the readings we've seen recently have a good record at preceding relief rallies, so we'll have to see how that pans out. Bond sentiment is trying to recover from a recent bout of pessimism, and gold stocks are doing their thing which is not much at all. They've been flat for six months. Chinese tech stocks were doing exactly what they're supposed to do, then did *not* by plunging to new lows. This is troubling on a shorter-term time frame, but this was never meant for a trade, rather a multi-year investment. Recent behavior is troubling and I will not be adding any exposure as long as that's the case. RETURN YTD: +0.1% 2021: +8.7%, 2020: +8.1%, 2019: +12.6%, 2018: +0.6%, 2017: +3.8%, 2016: +17.1%, 2015: +9.2%, 2014: +14.5%, 2013: +2.2%, 2012: +10.8%, 2011: +16.5%, 2010: +15.3%, 2009: +23.9%, 2008: +16.2%, 2007: +7.8%
|
|
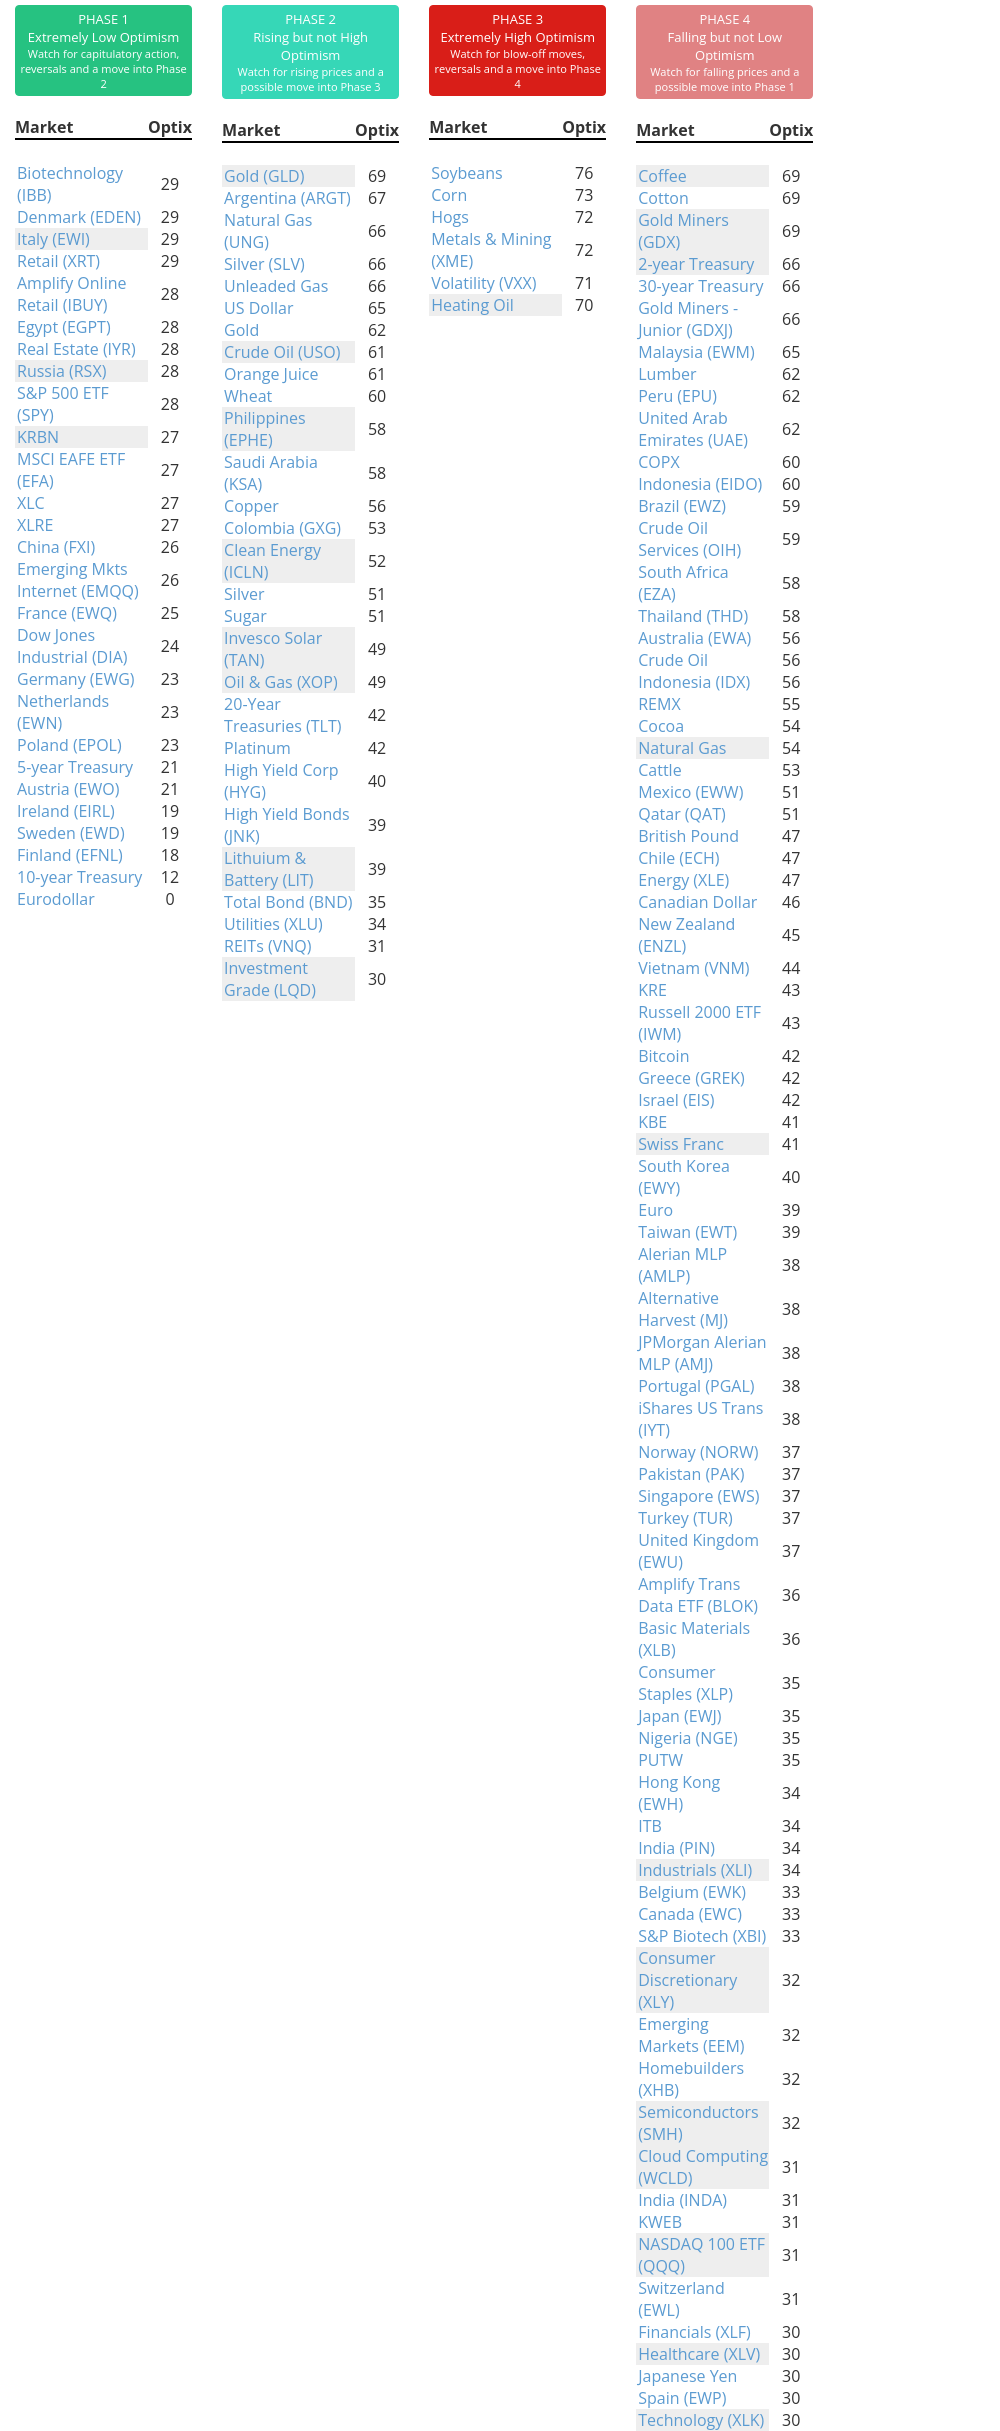
Phase Table
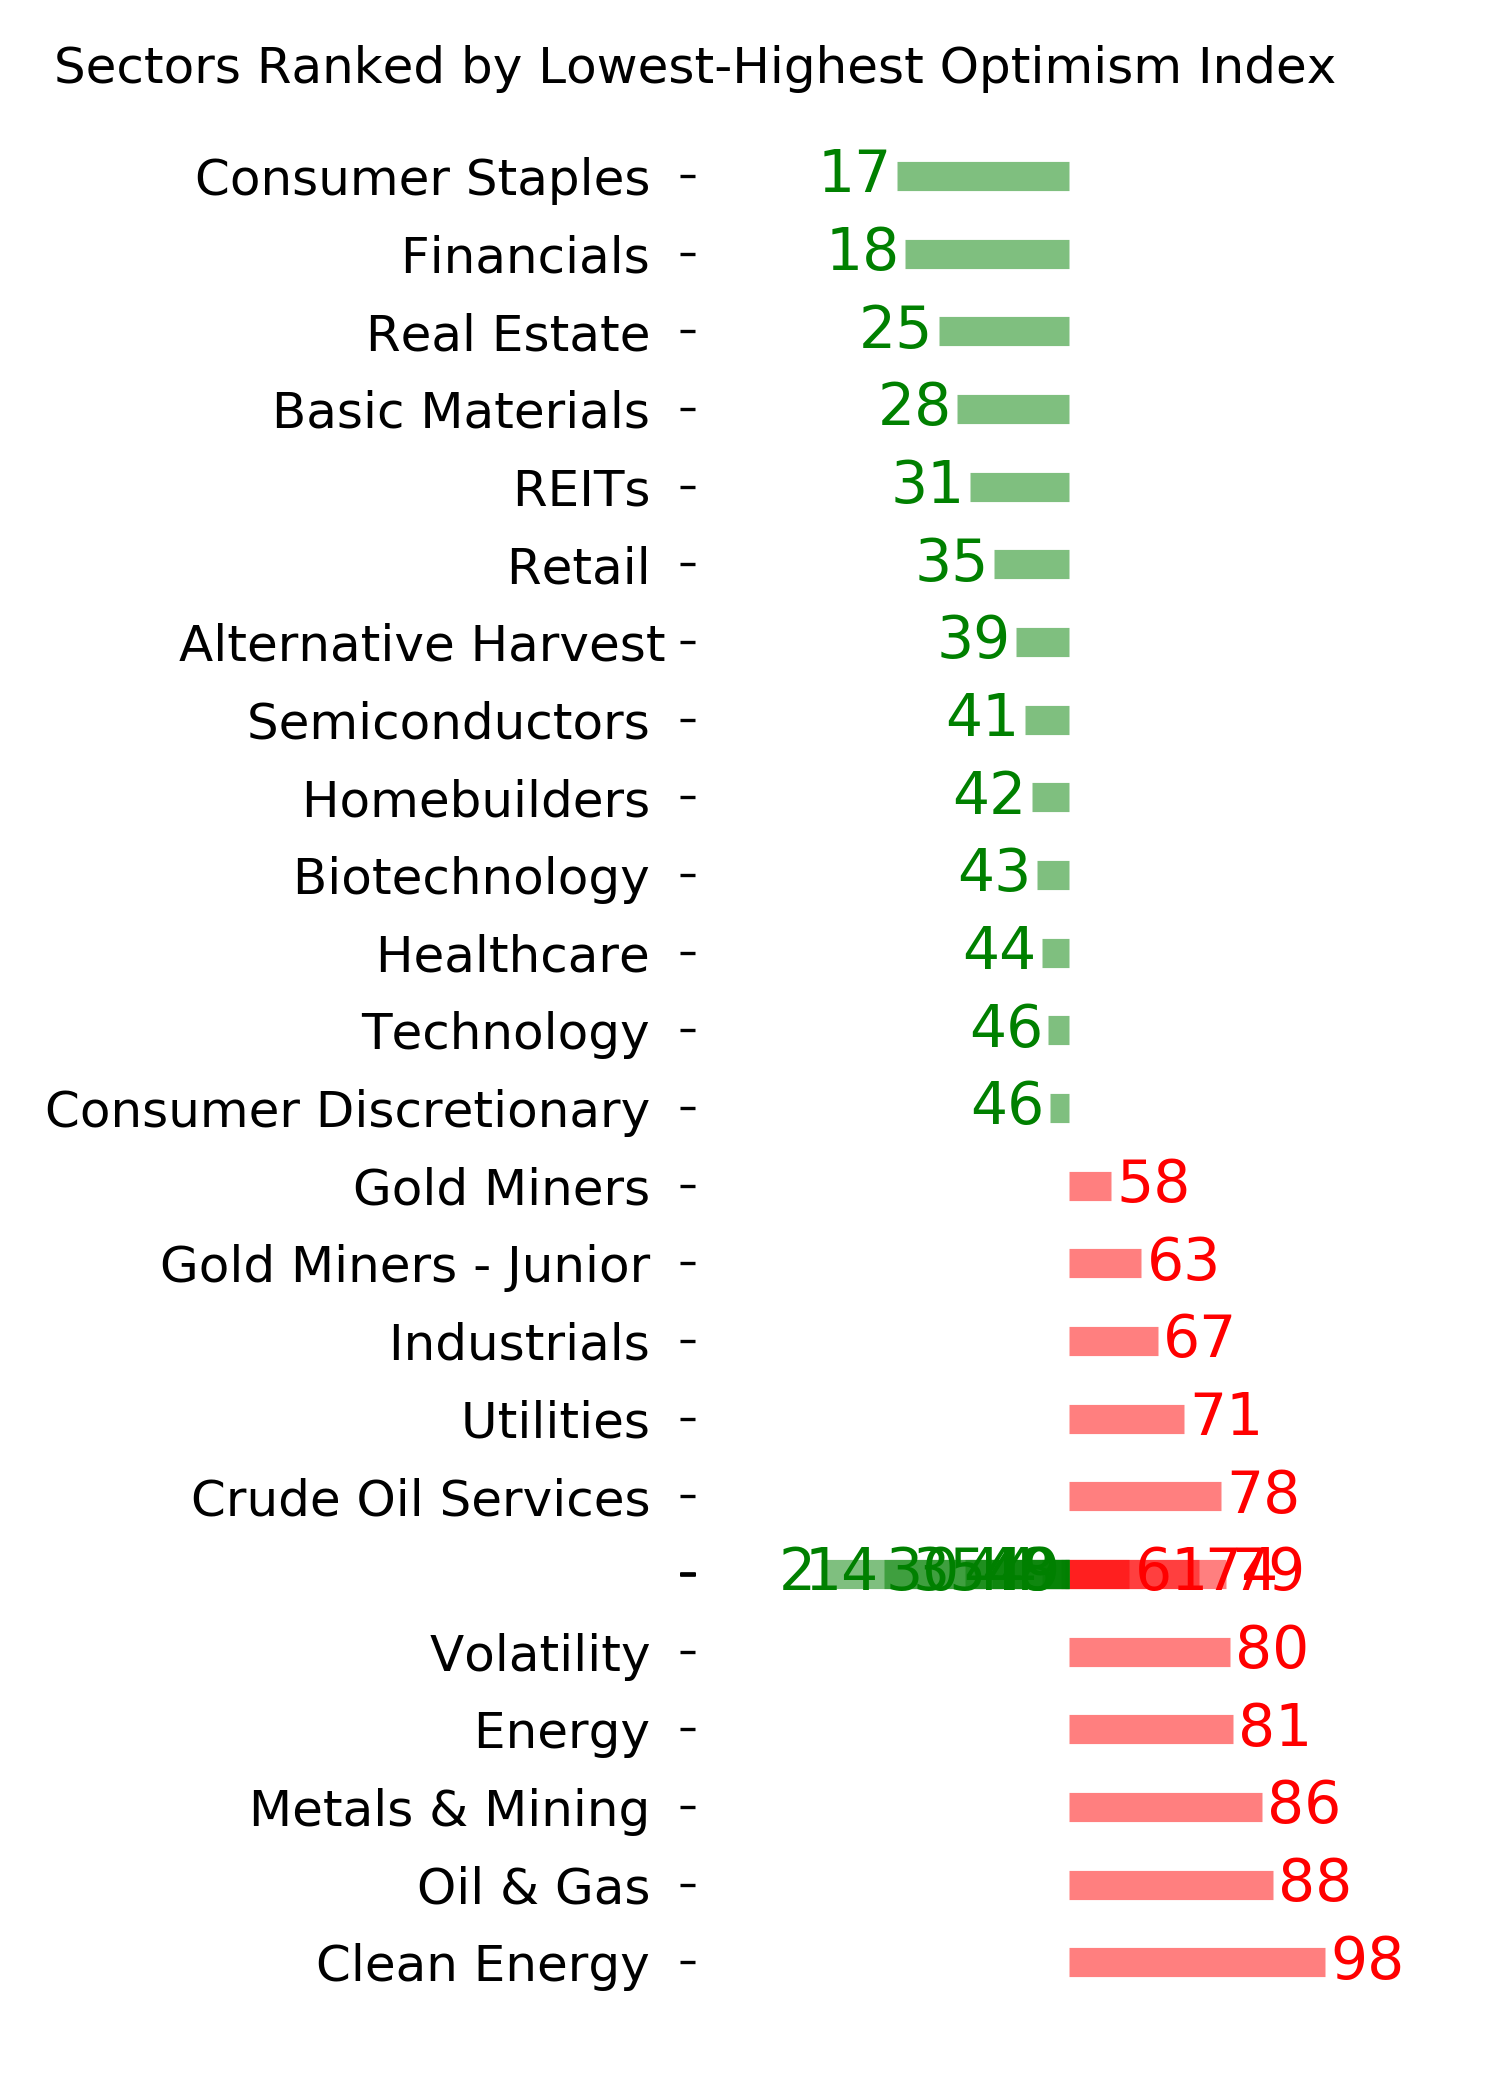
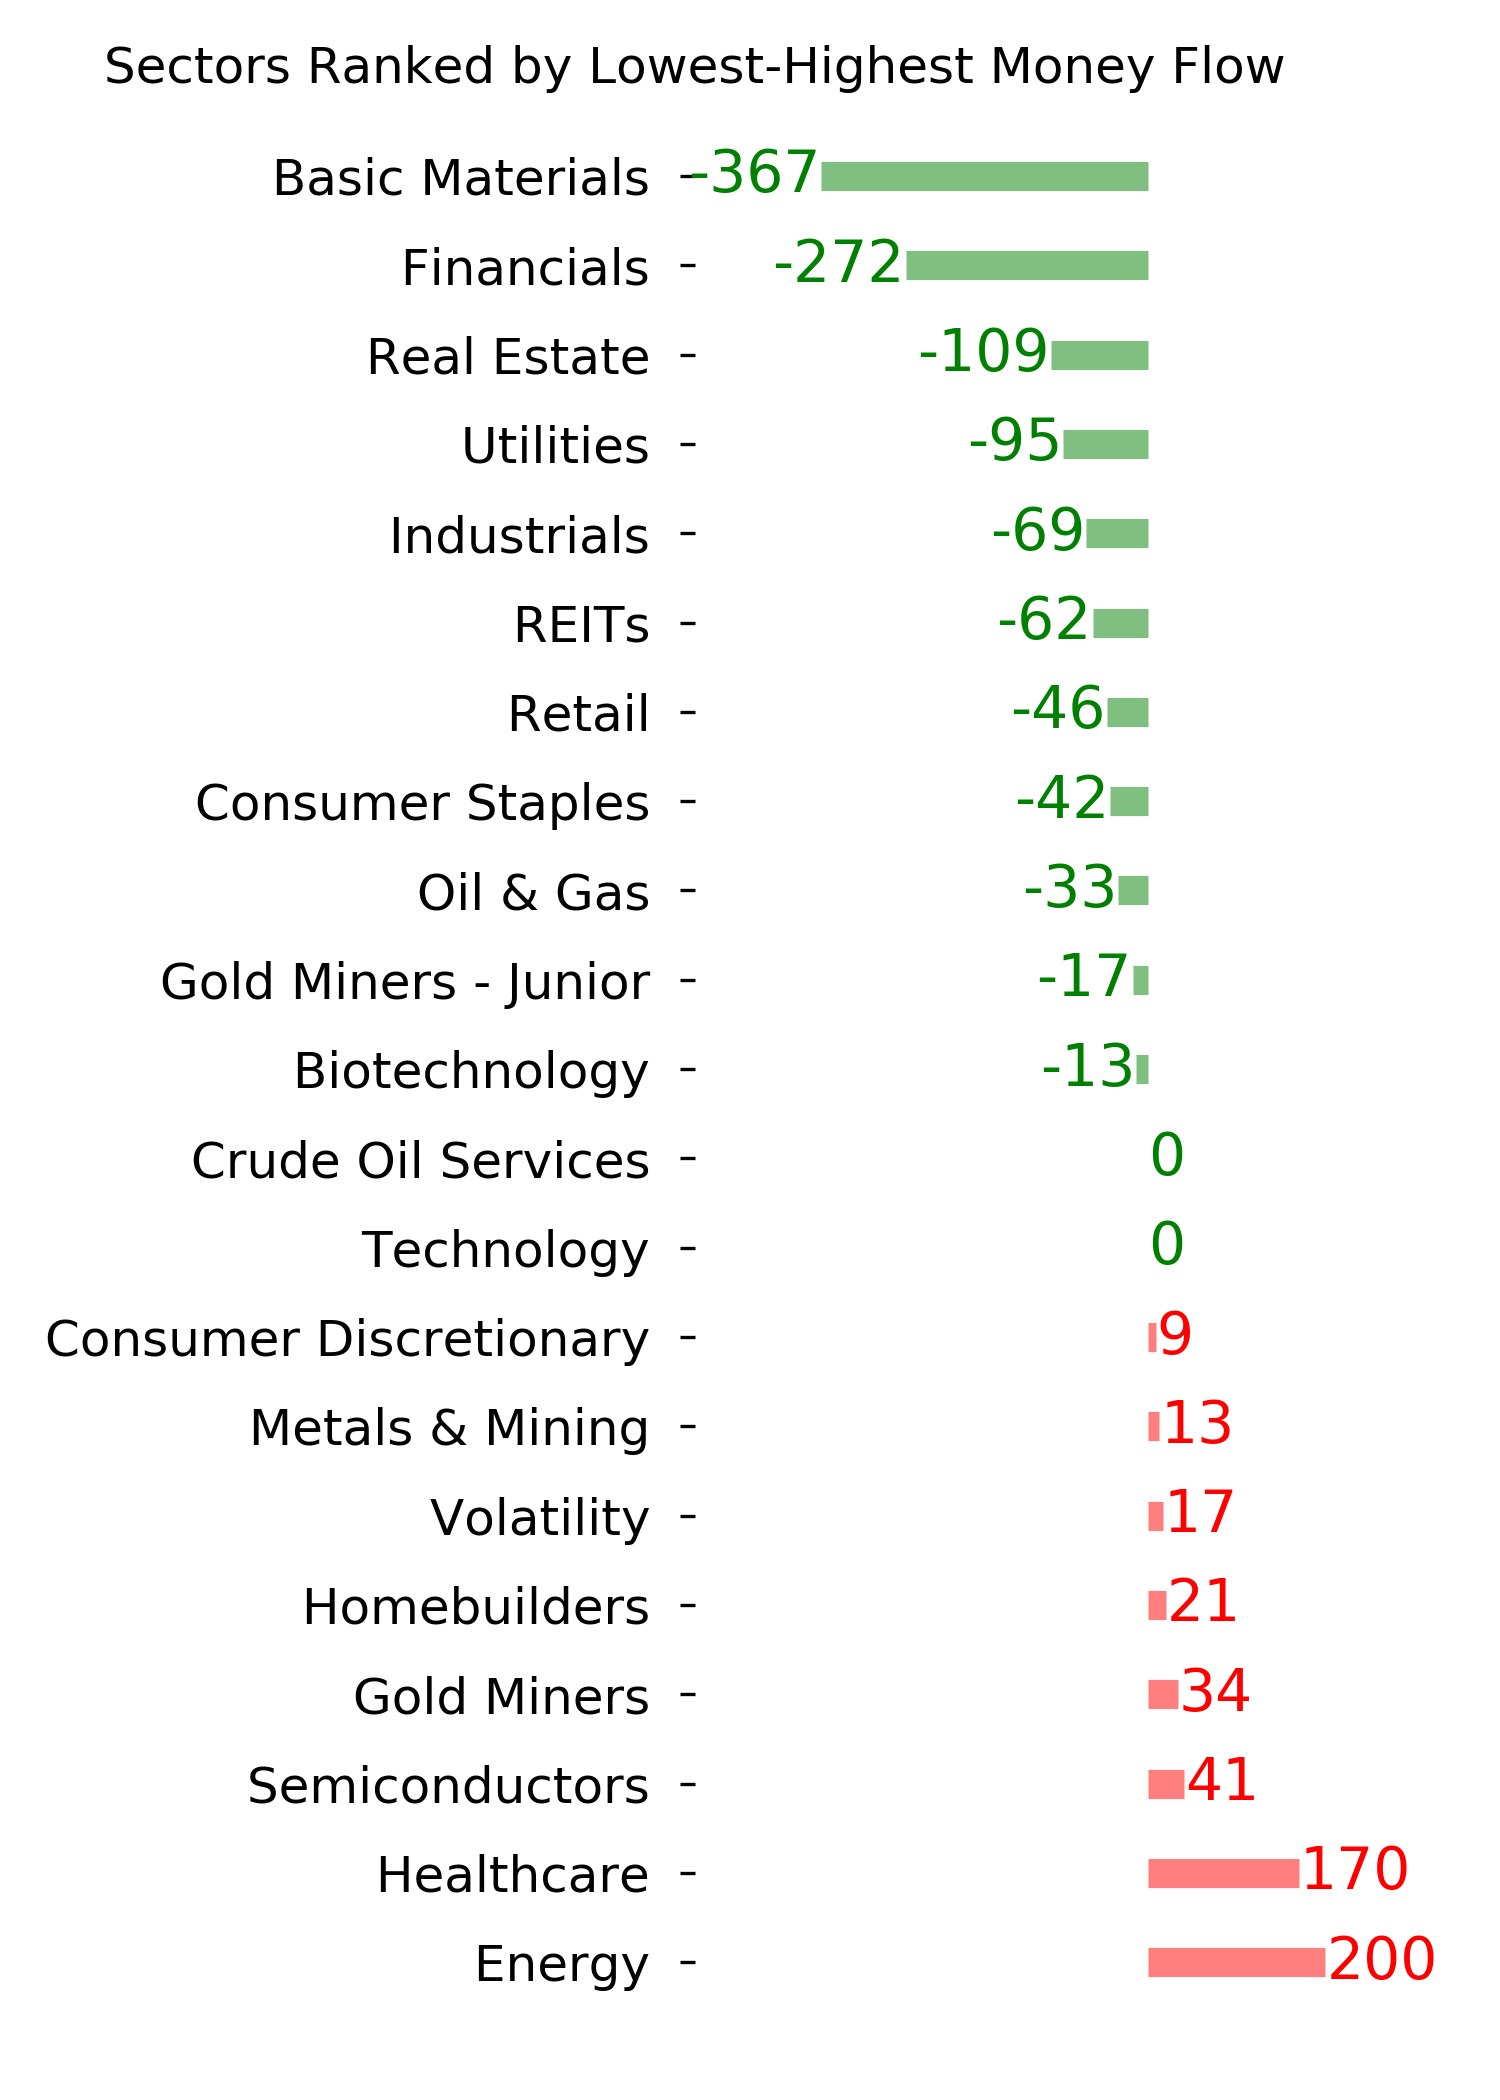
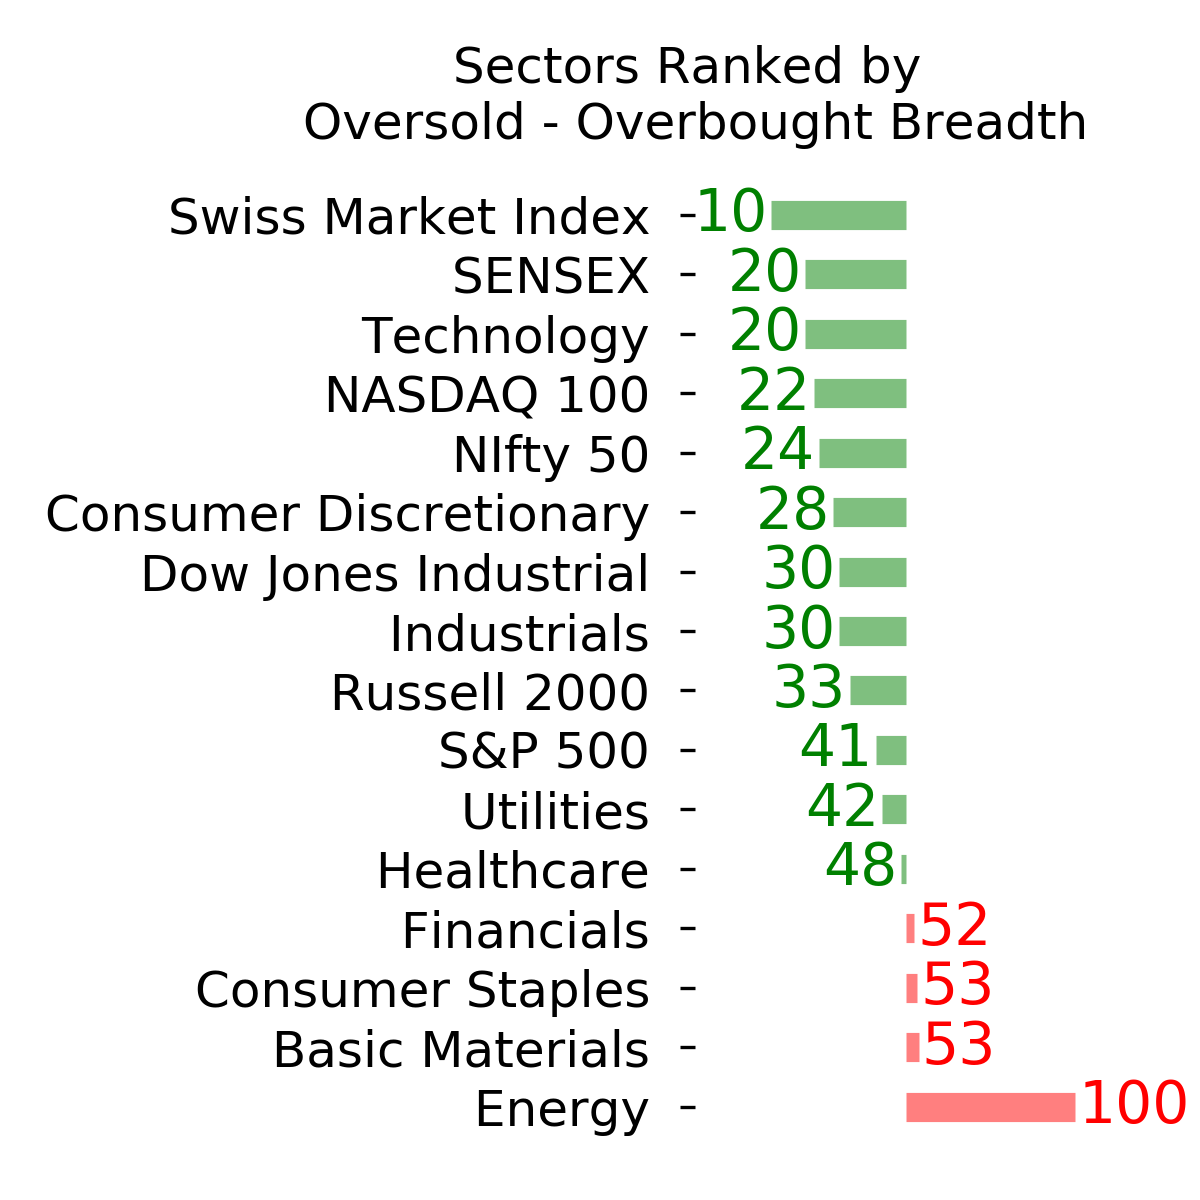
Ranks
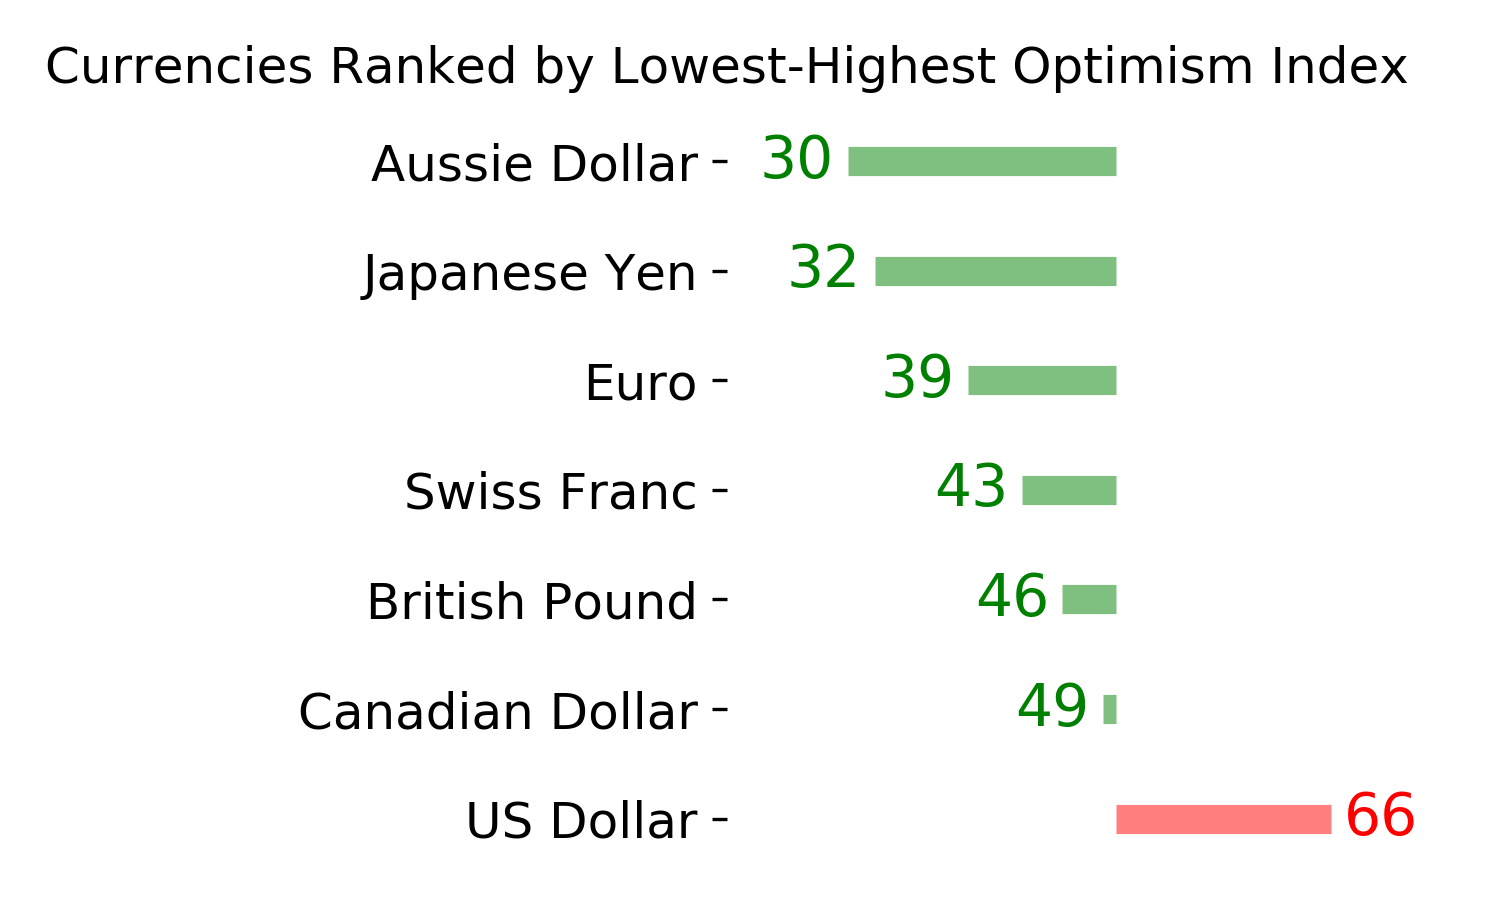
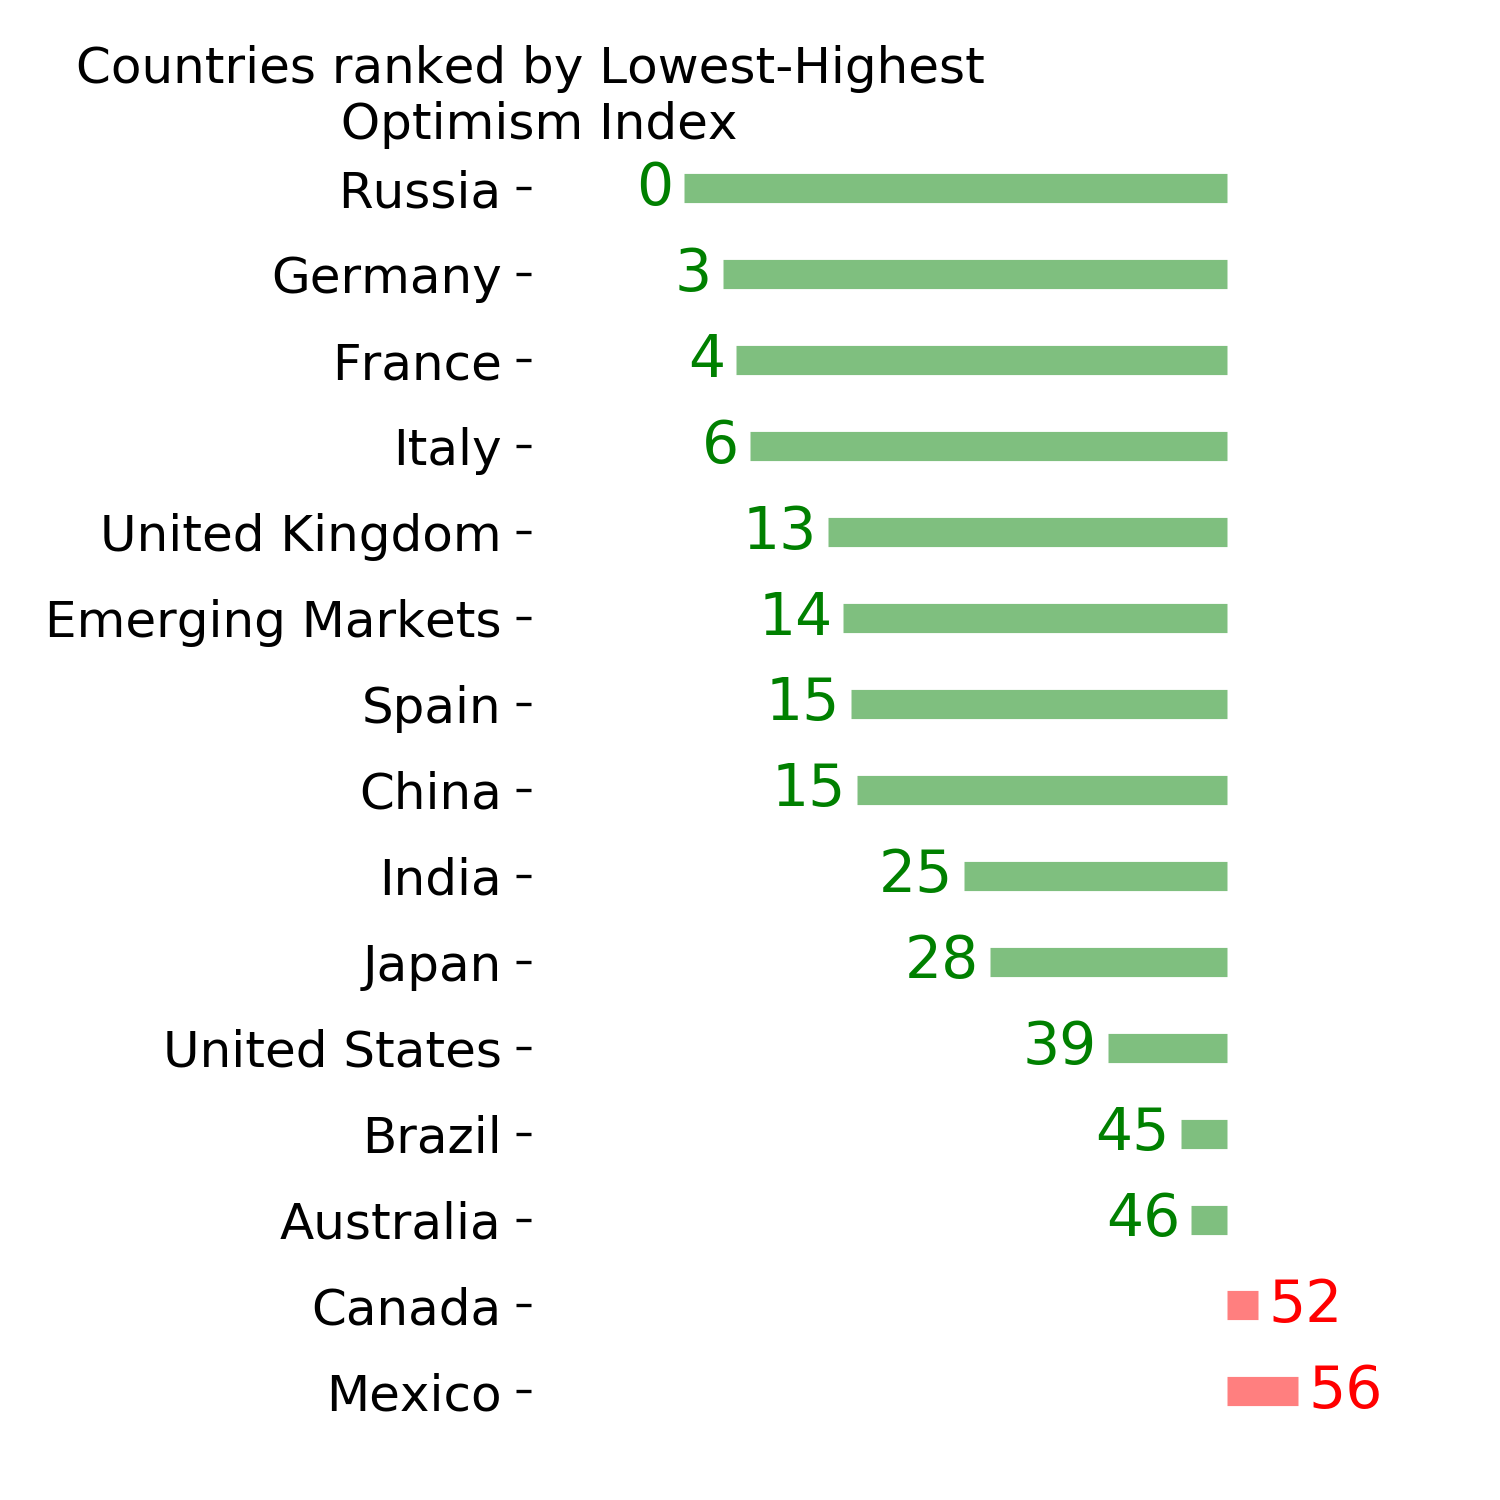
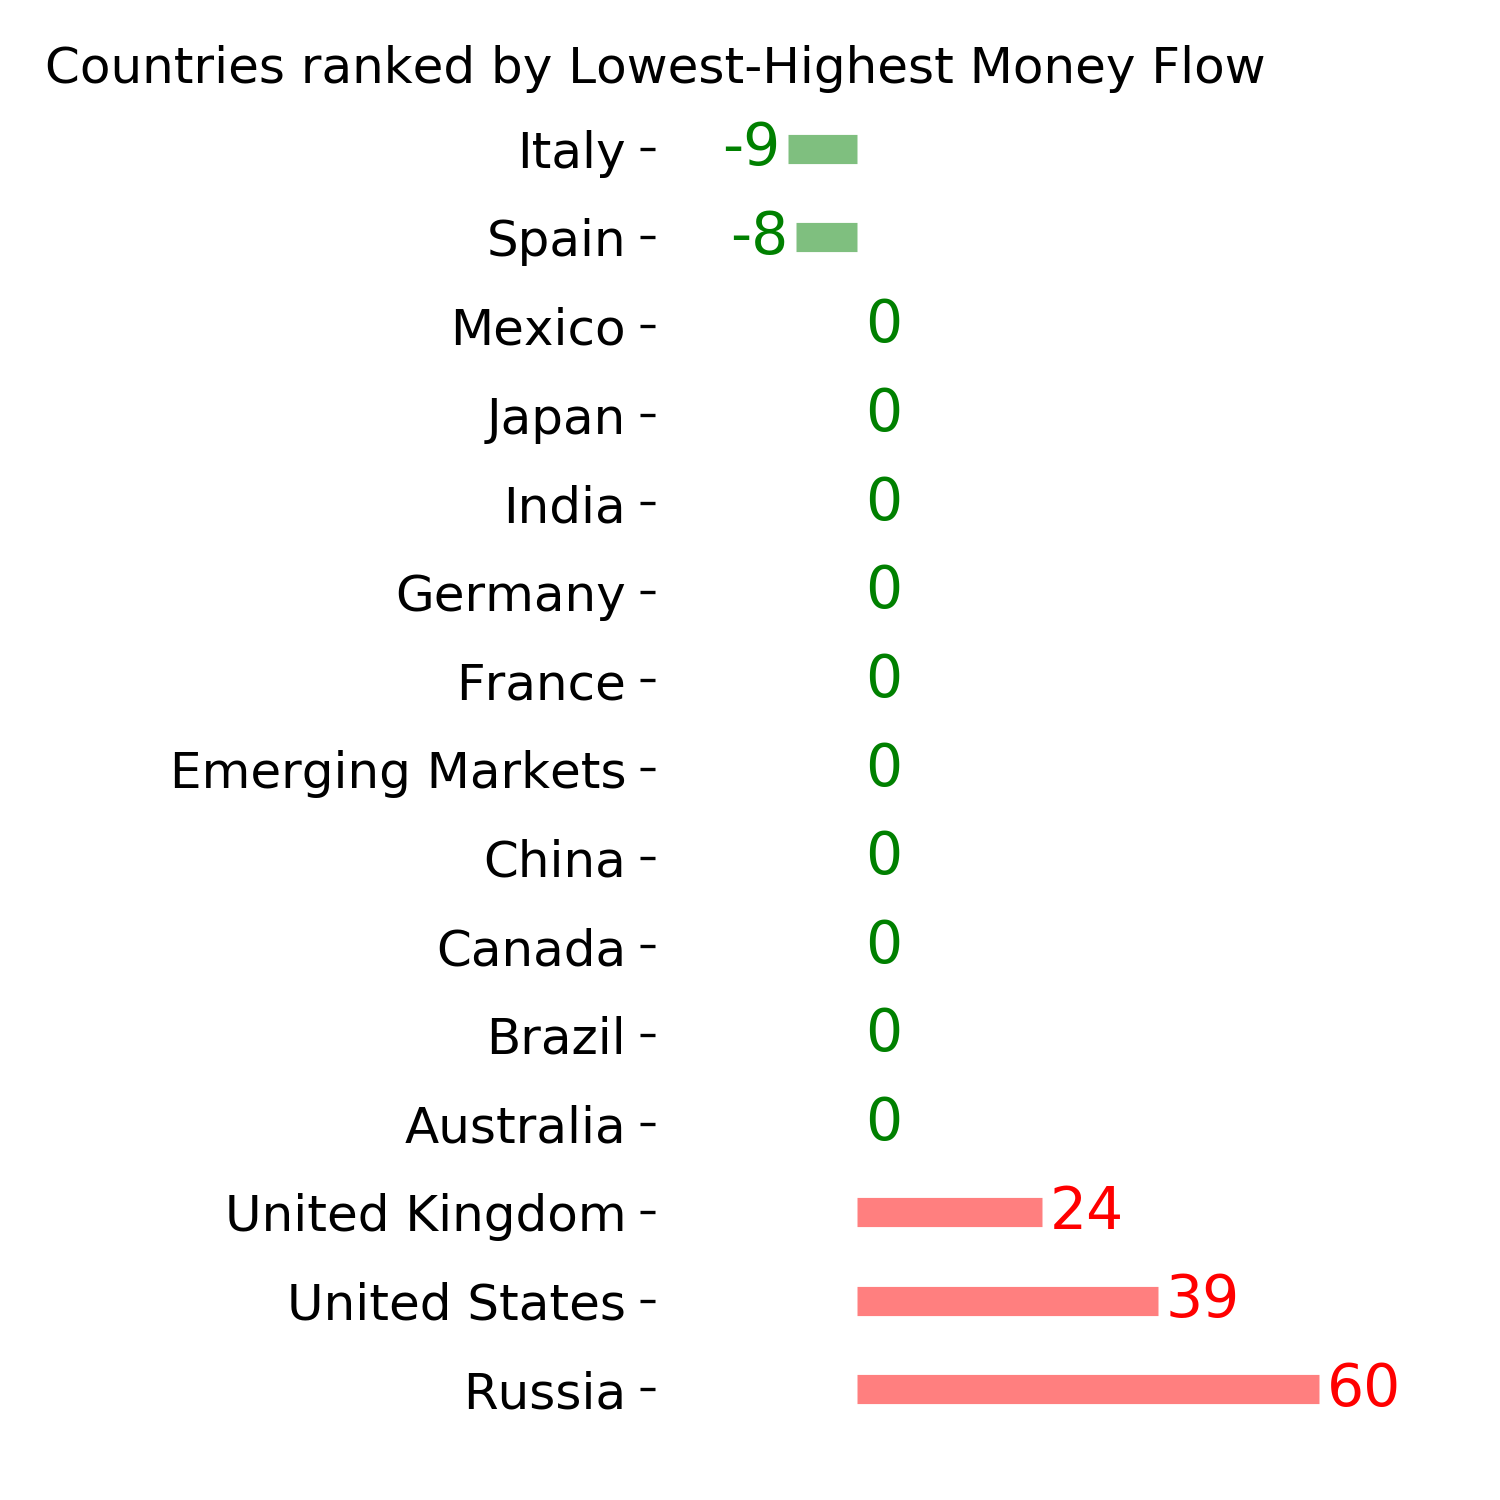
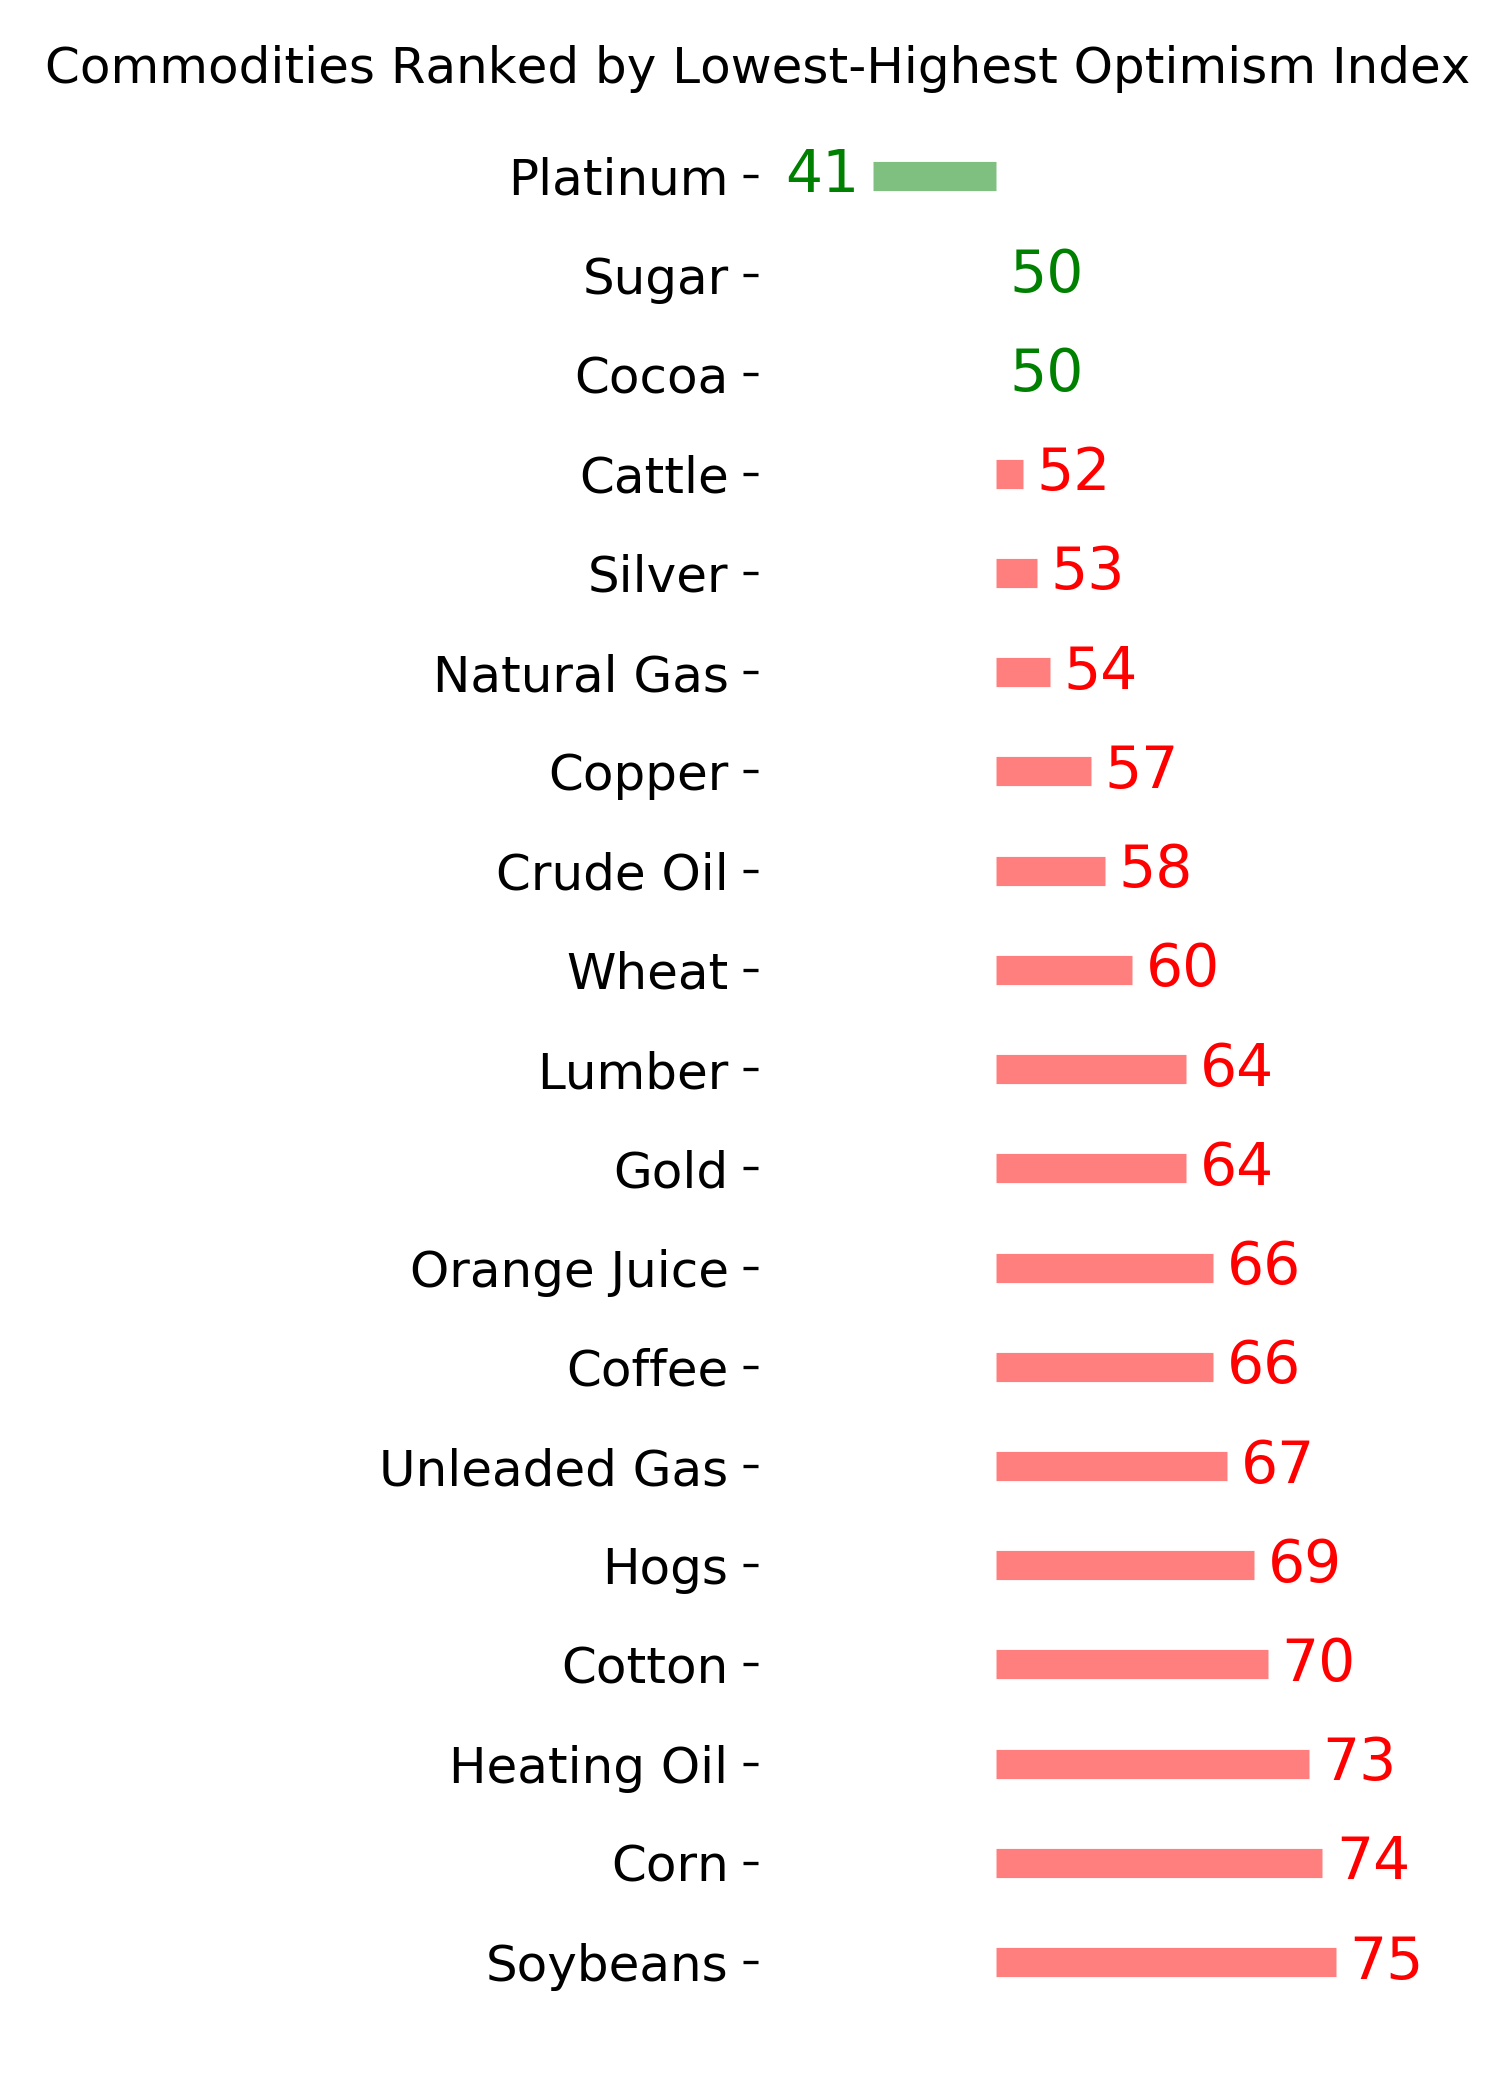
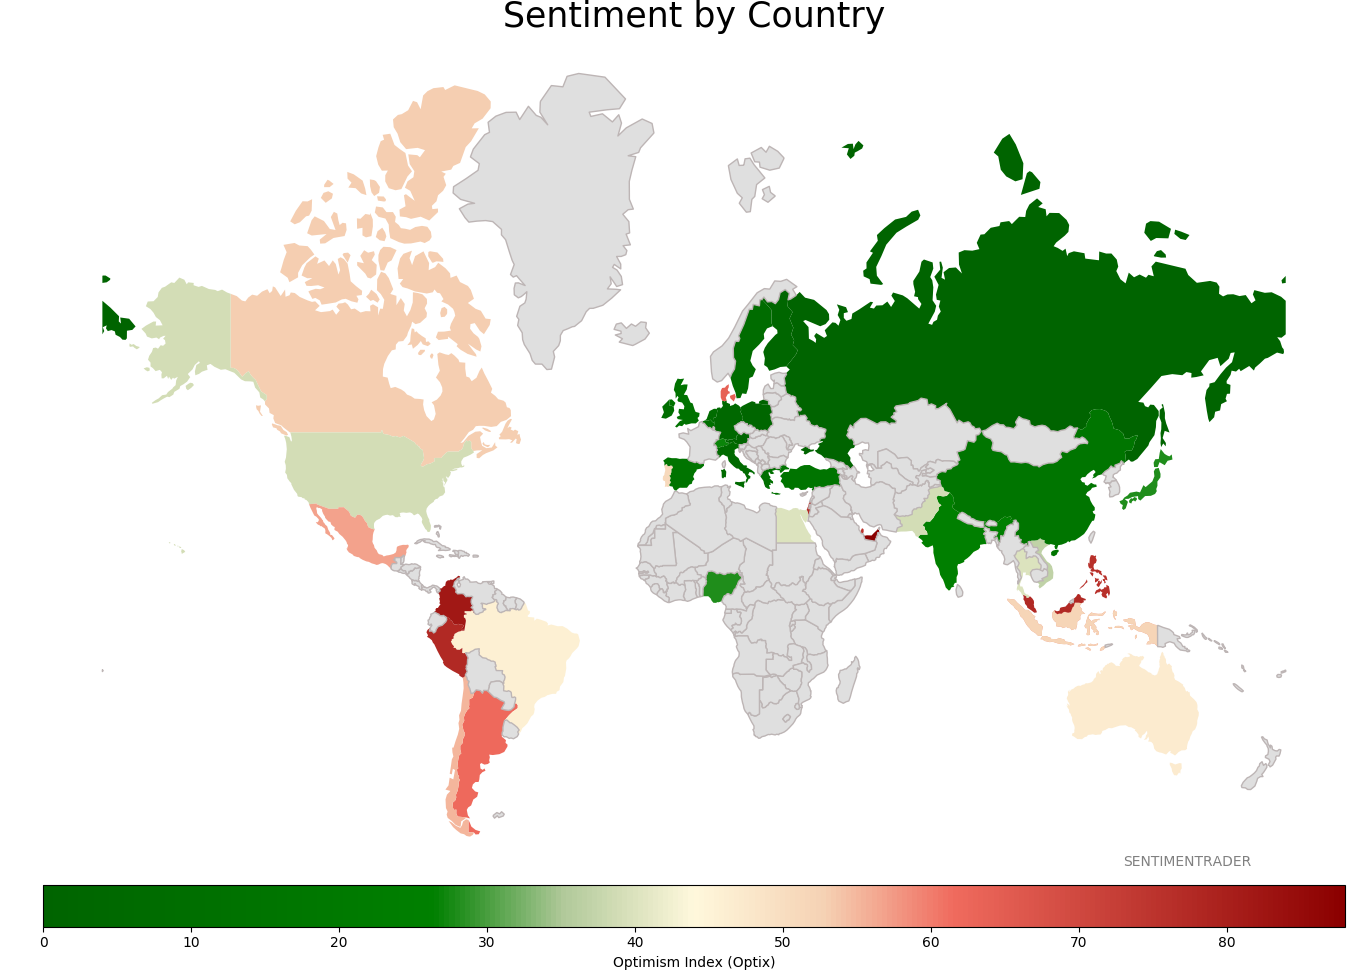
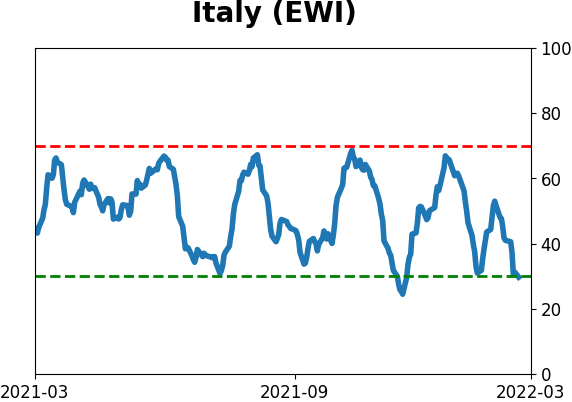
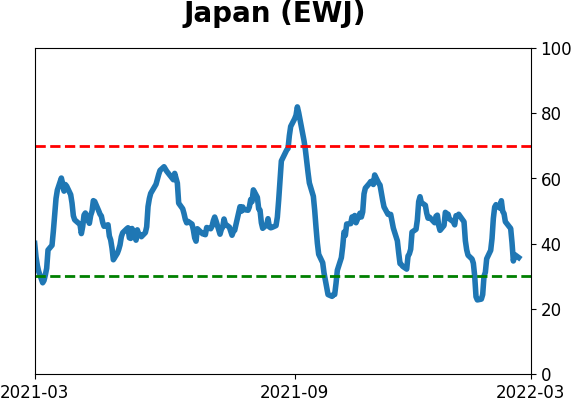
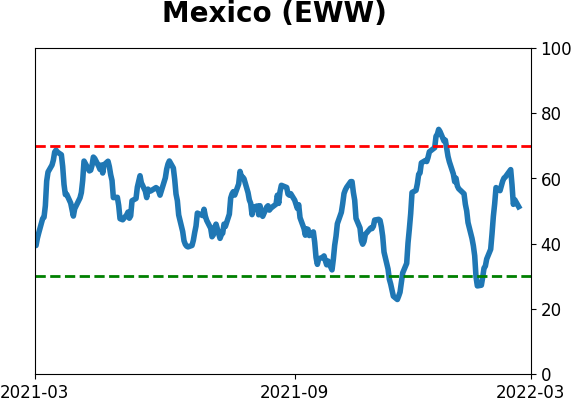
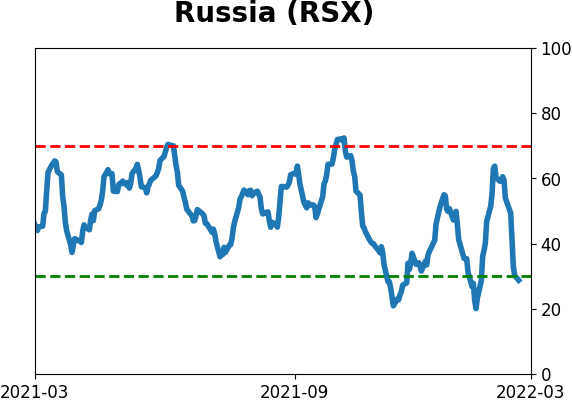
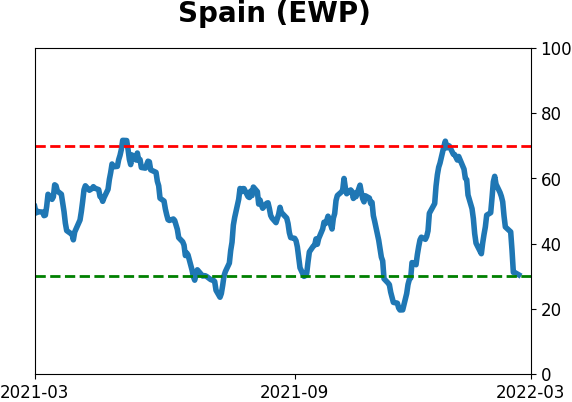
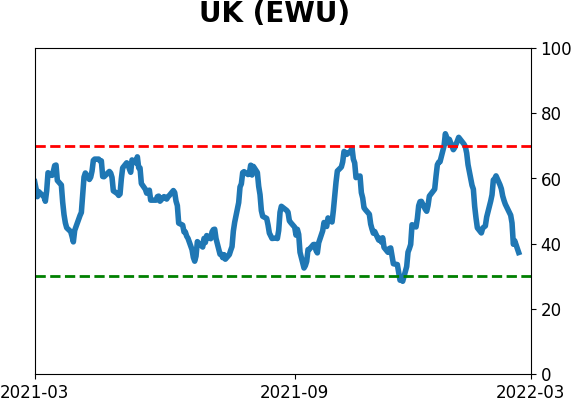
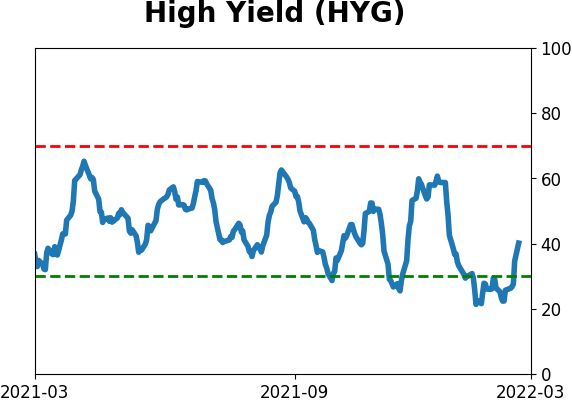
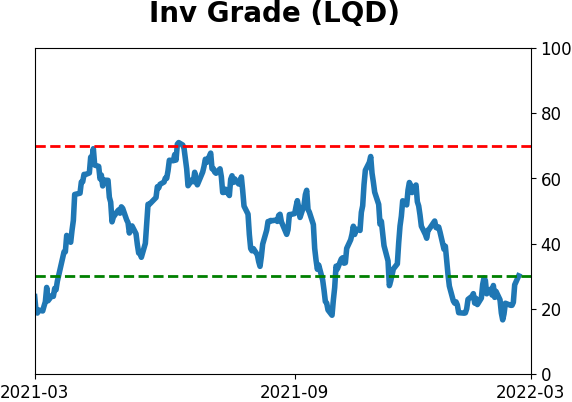
Sentiment Around The World
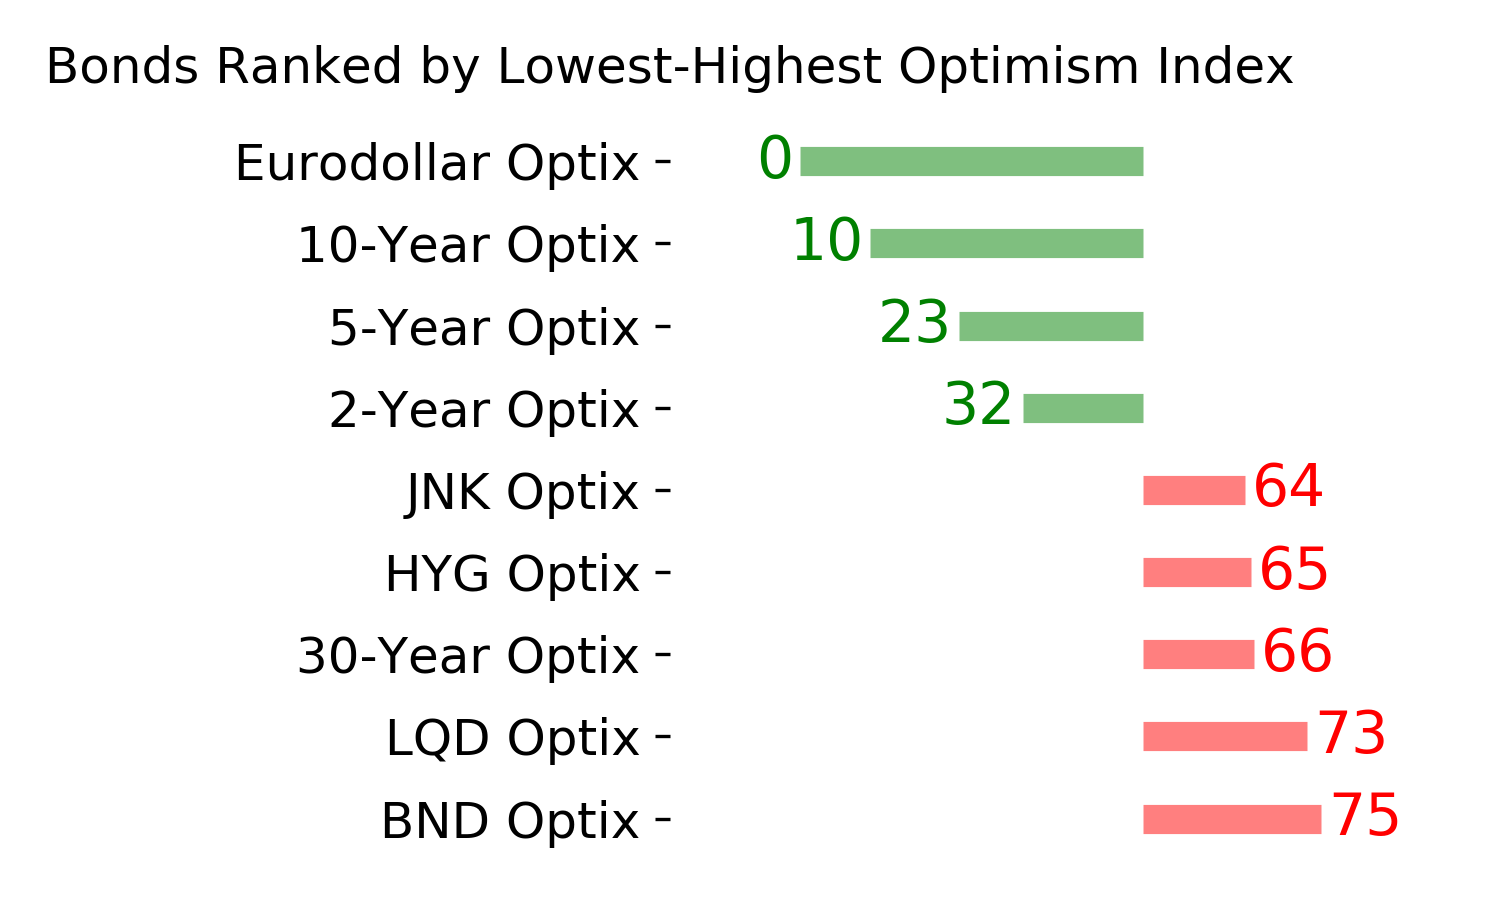
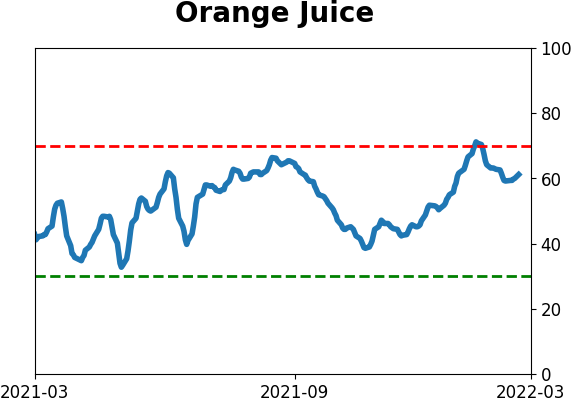
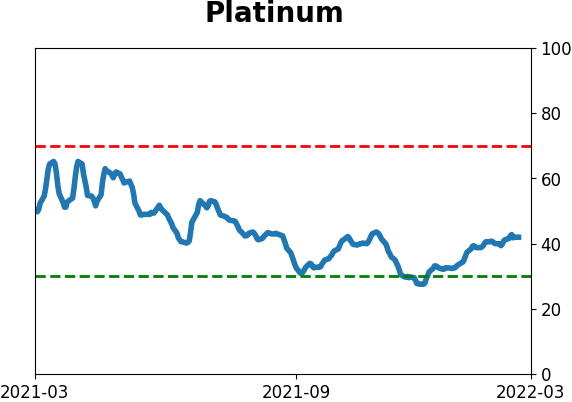
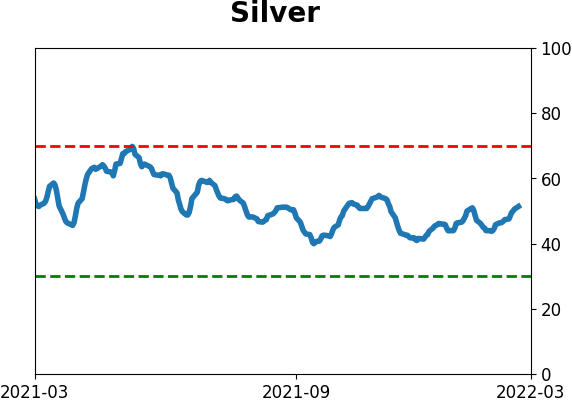
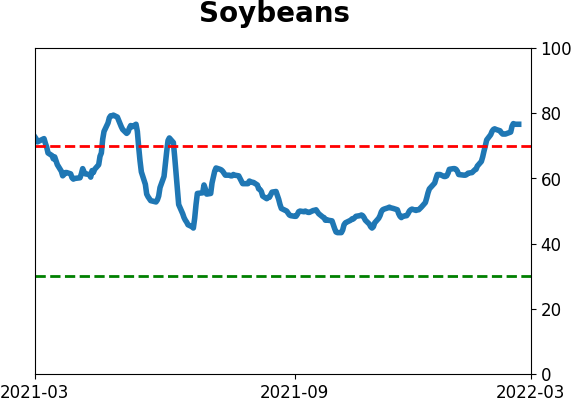
Optimism Index Thumbnails
|
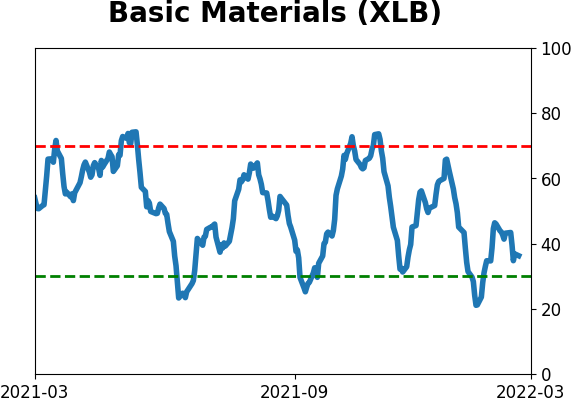
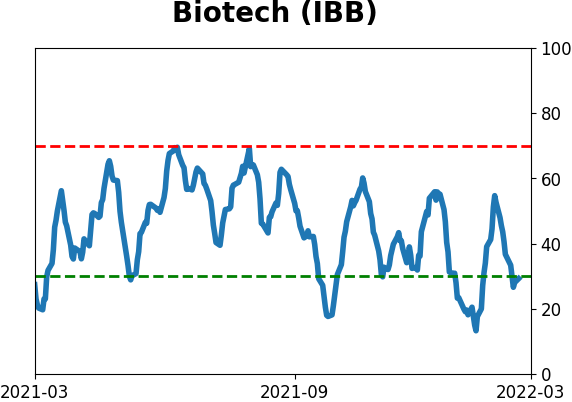
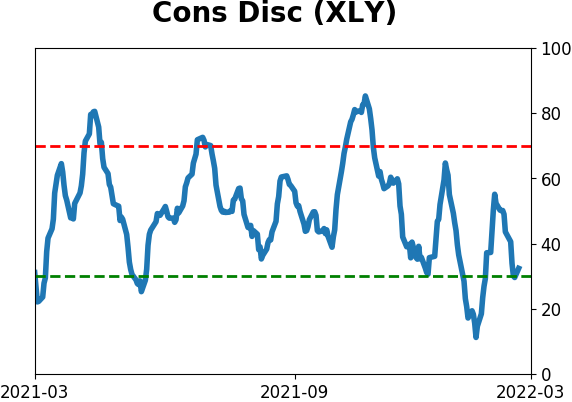
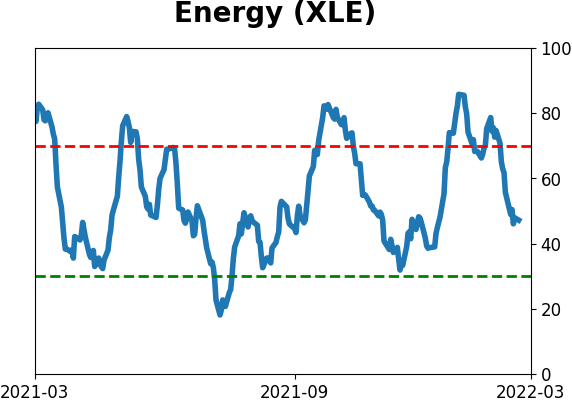
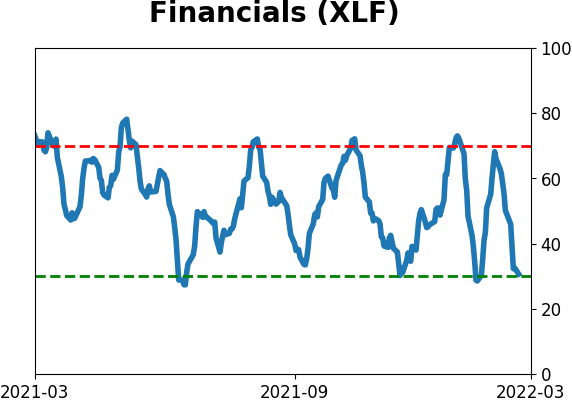
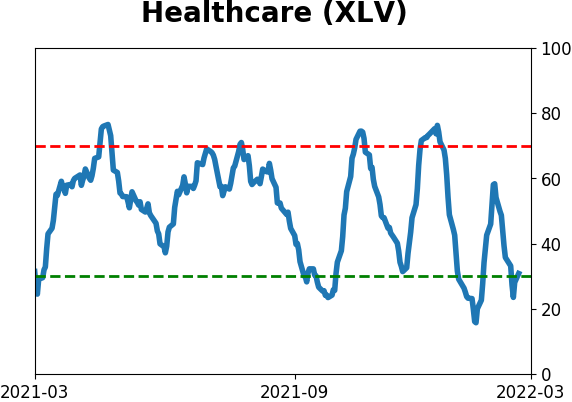
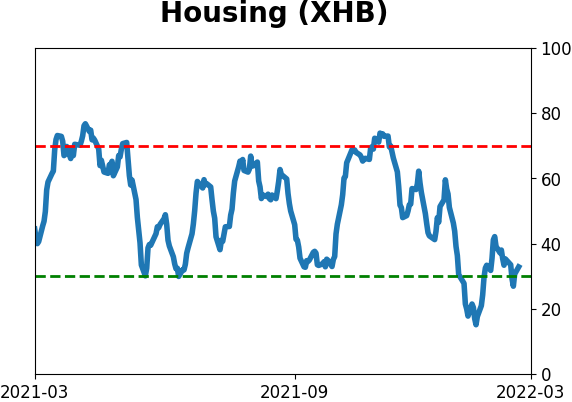
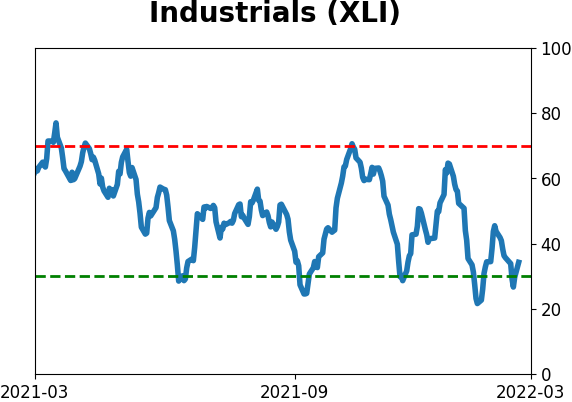
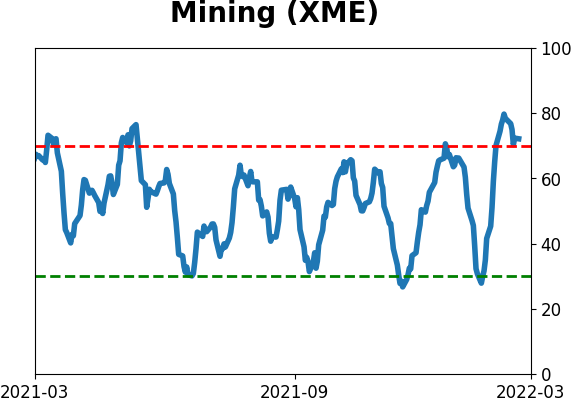
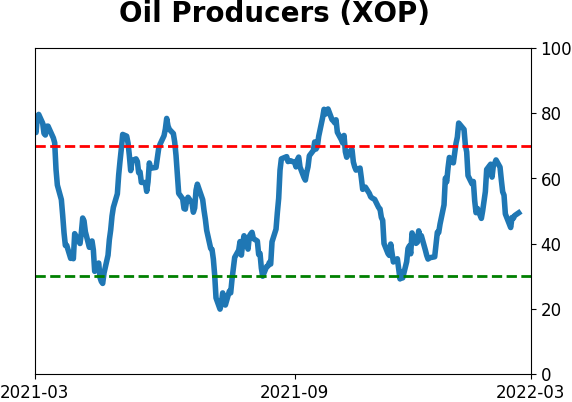
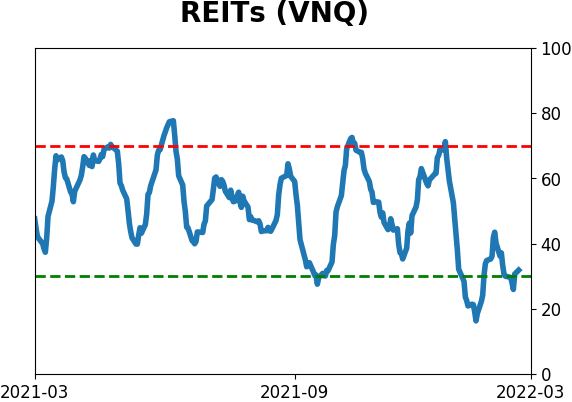
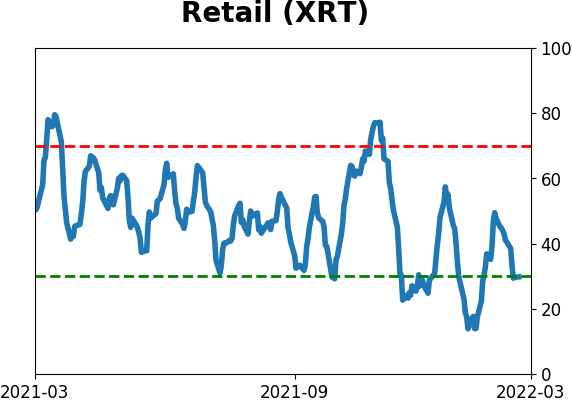
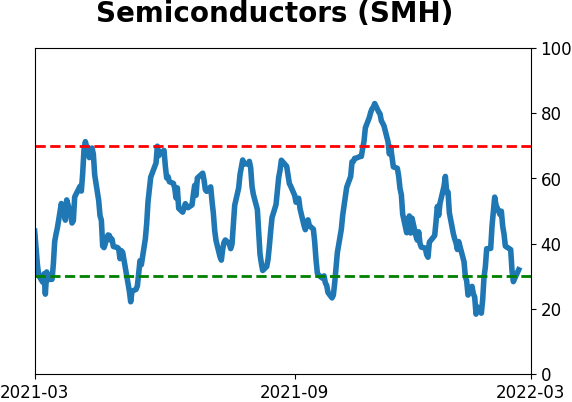
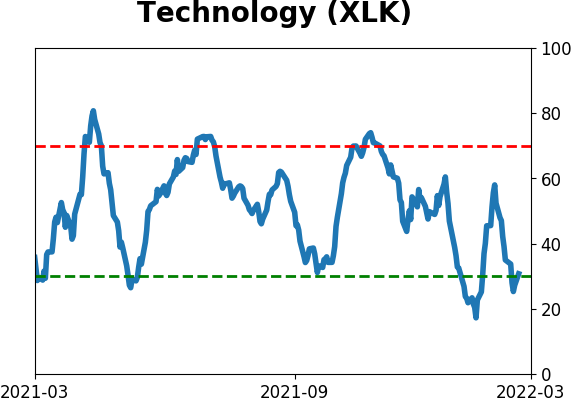
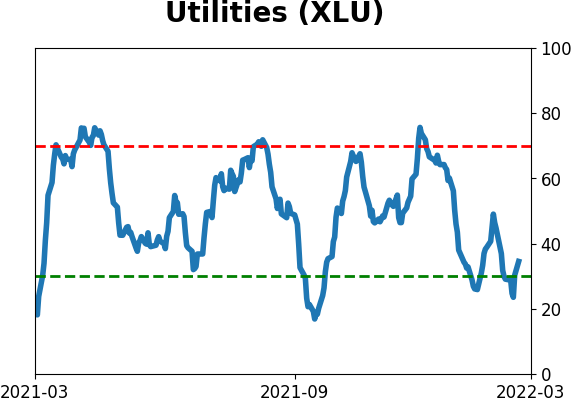
Sector ETF's - 10-Day Moving Average
|
|
|
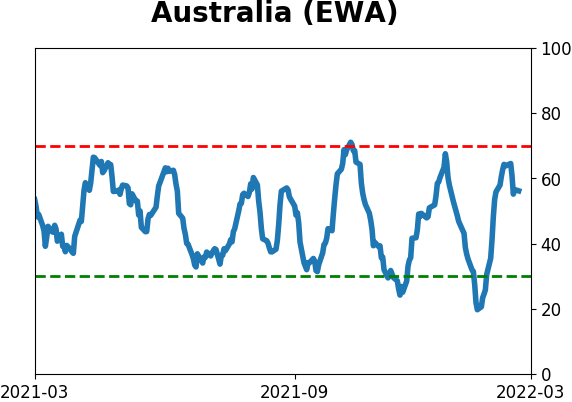
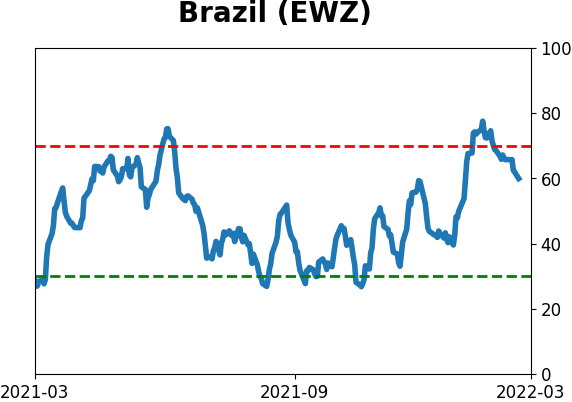
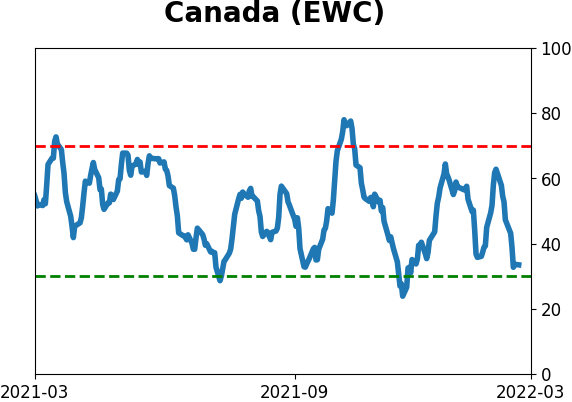
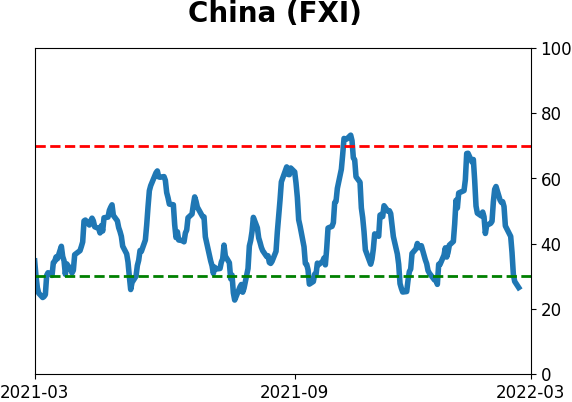
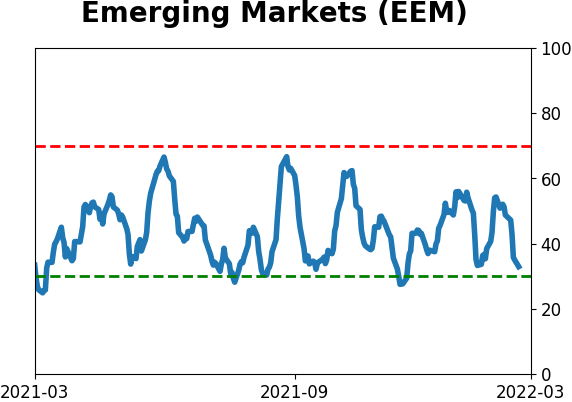
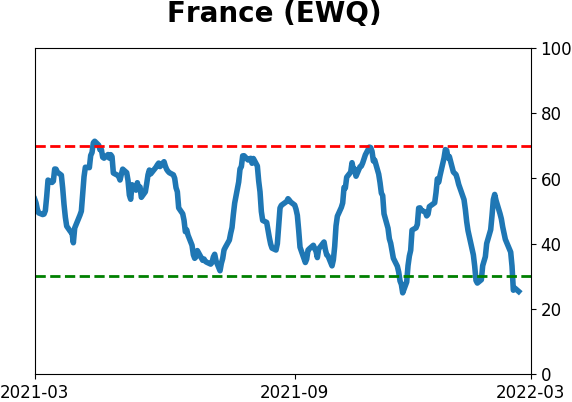
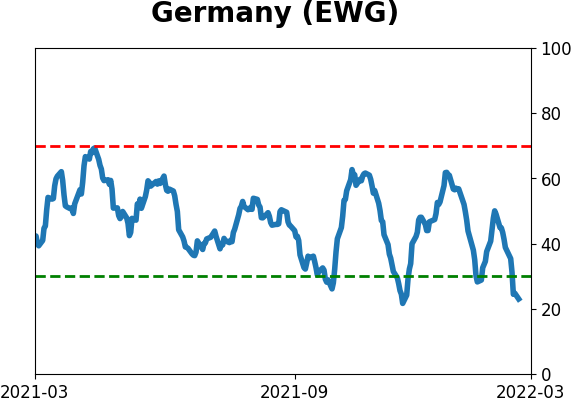
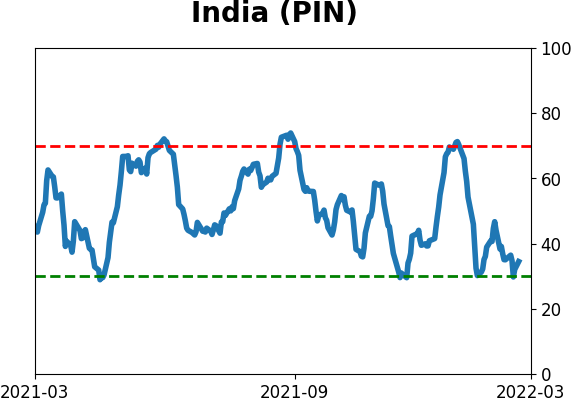
Country ETF's - 10-Day Moving Average
|
|
|
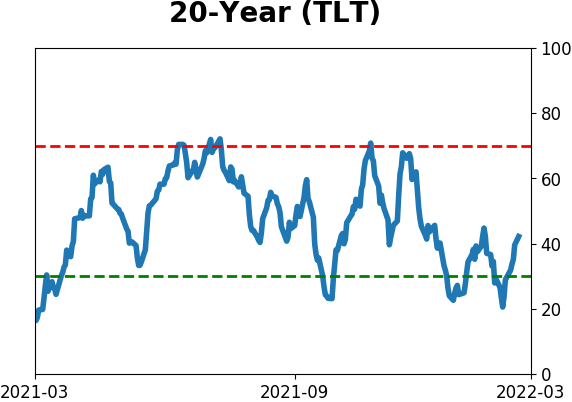
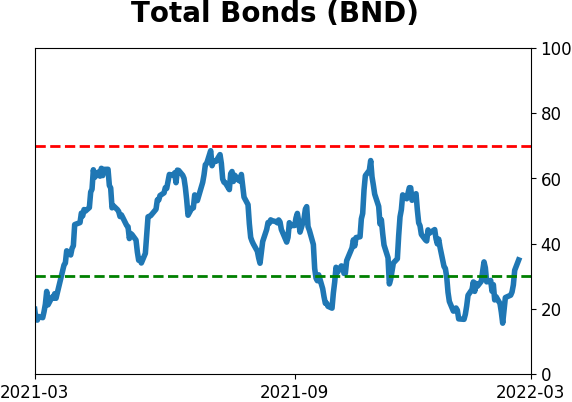
Bond ETF's - 10-Day Moving Average
|
|
|
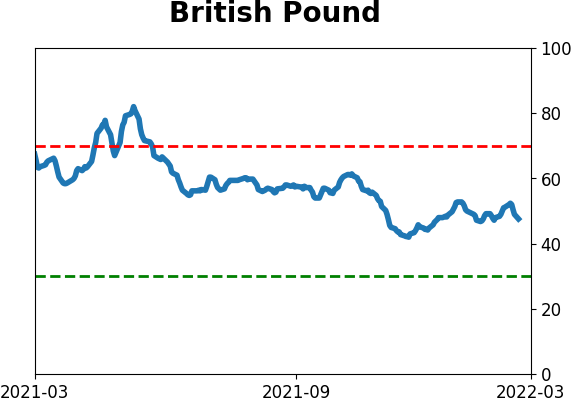
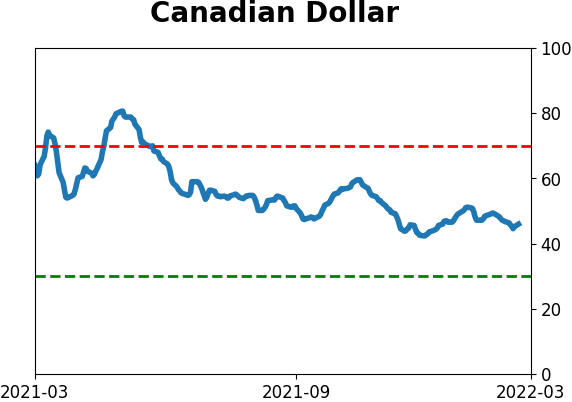
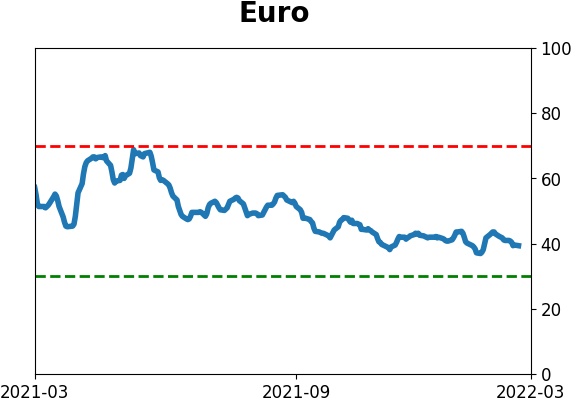
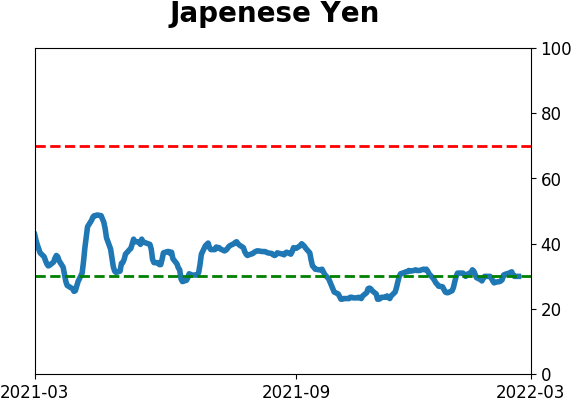
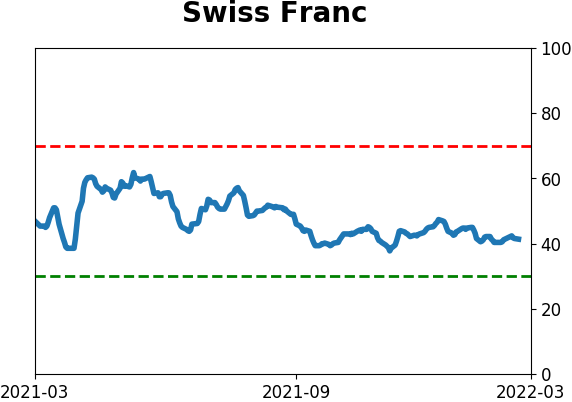
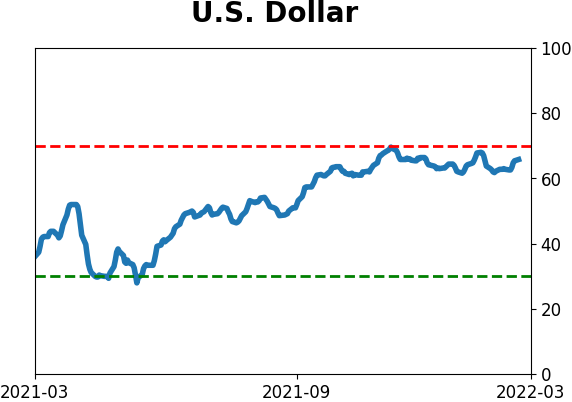
Currency ETF's - 5-Day Moving Average
|
|
|
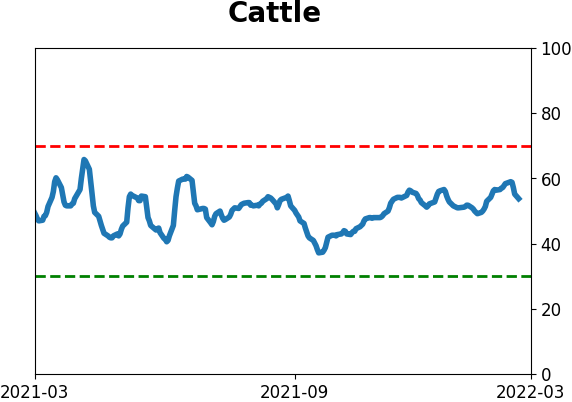
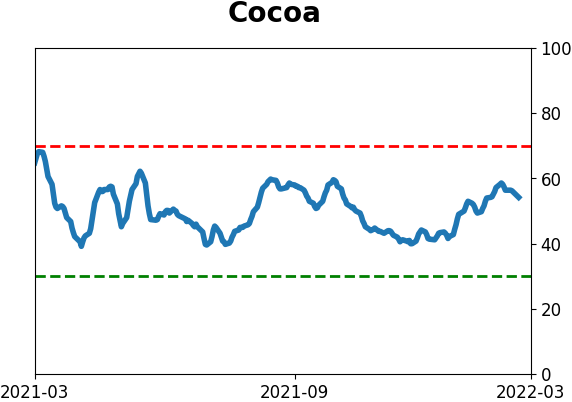
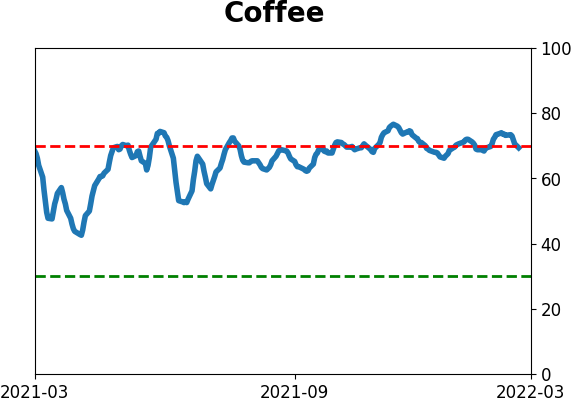
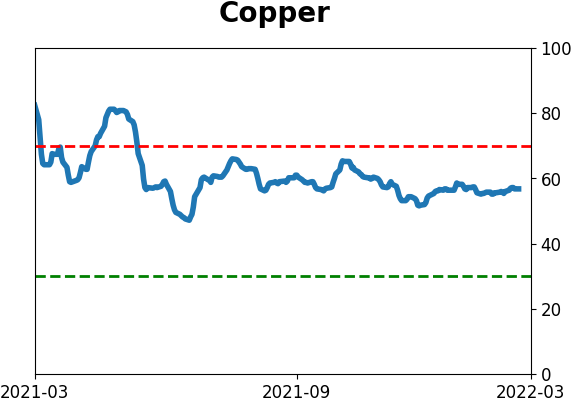
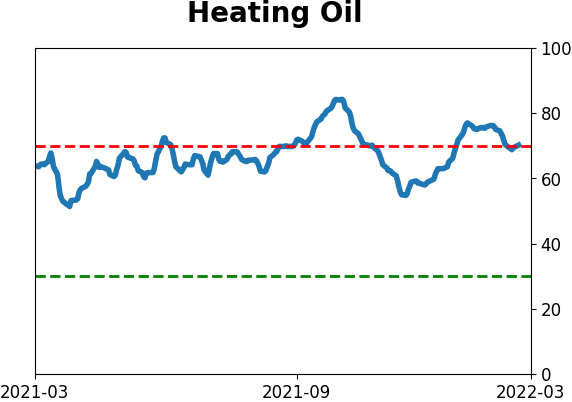
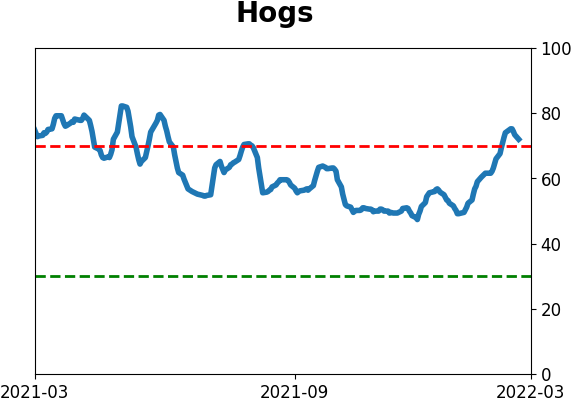
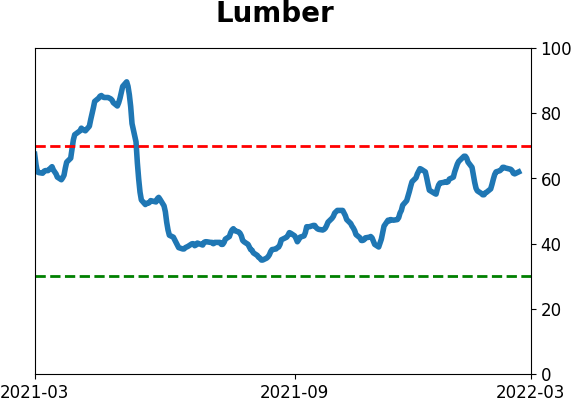
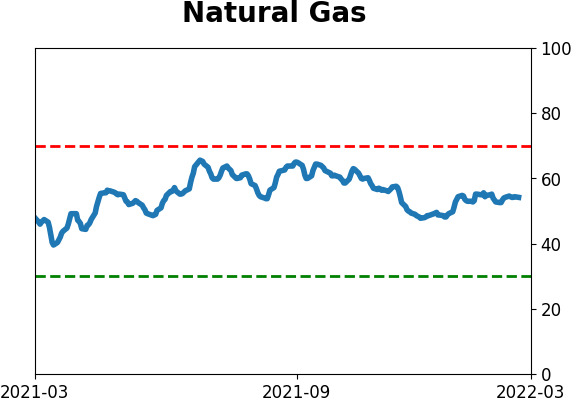
Commodity ETF's - 5-Day Moving Average
|
|