Headlines
|
|
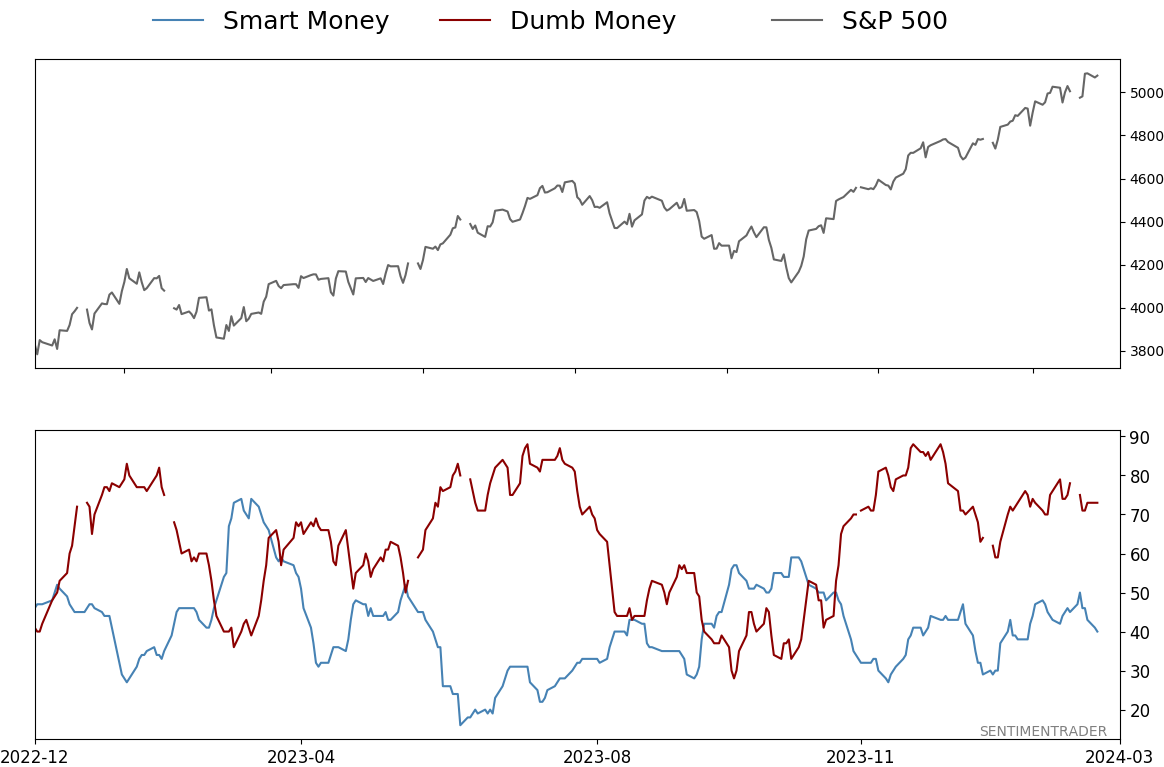
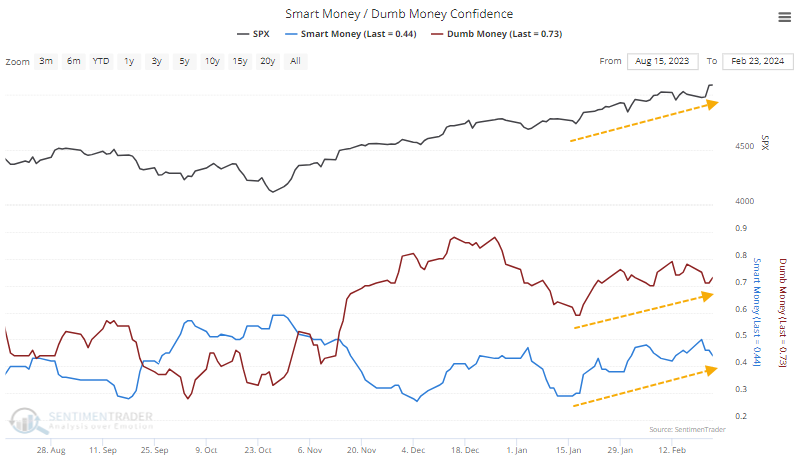
Confidence is rising among both Smart and Dumb Money:
As stocks rose over the past month, we've been watching a highly unusual development - both Smart Money and Dumb Money Confidence were rising strongly at the same time. That's never happened before. When they have risen by lesser amounts together, the S&P 500 showed below-average returns over the short- to medium-term.
|
Smart / Dumb Money Confidence
|
Smart Money Confidence: 40%
Dumb Money Confidence: 73%
|
|
Risk Levels
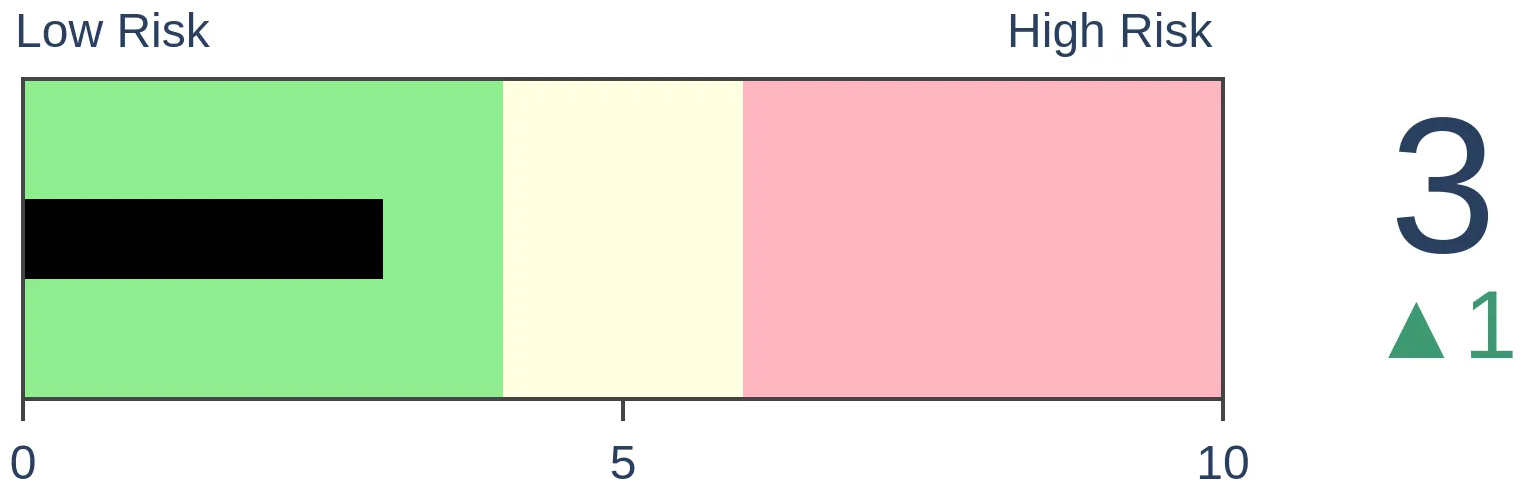
Stocks Short-Term
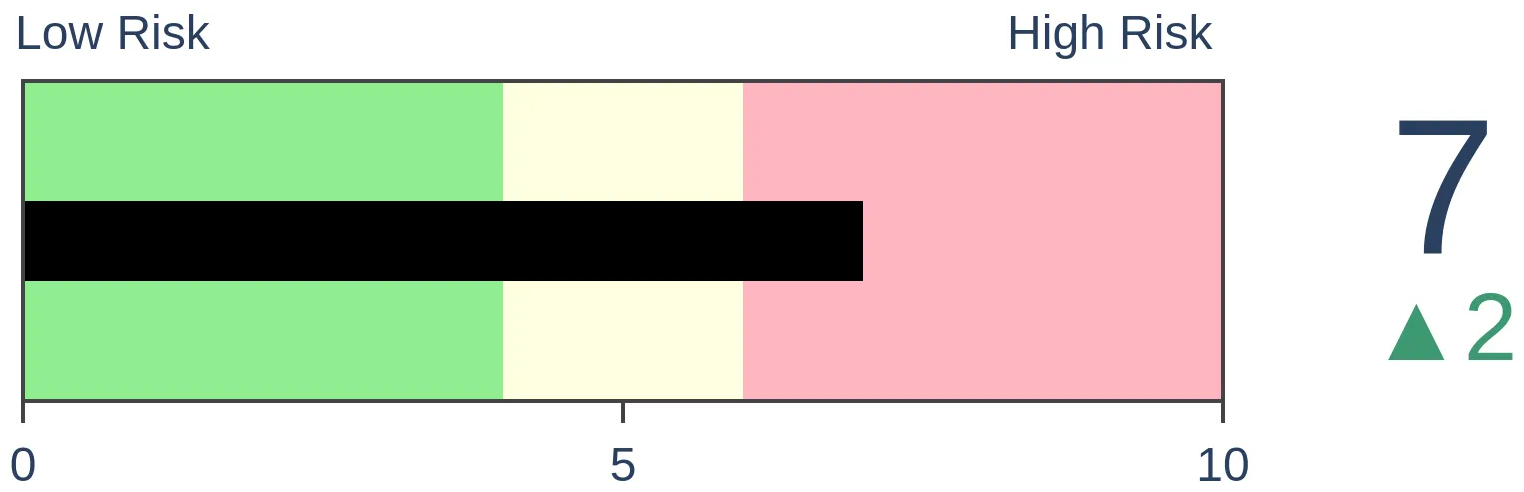
|
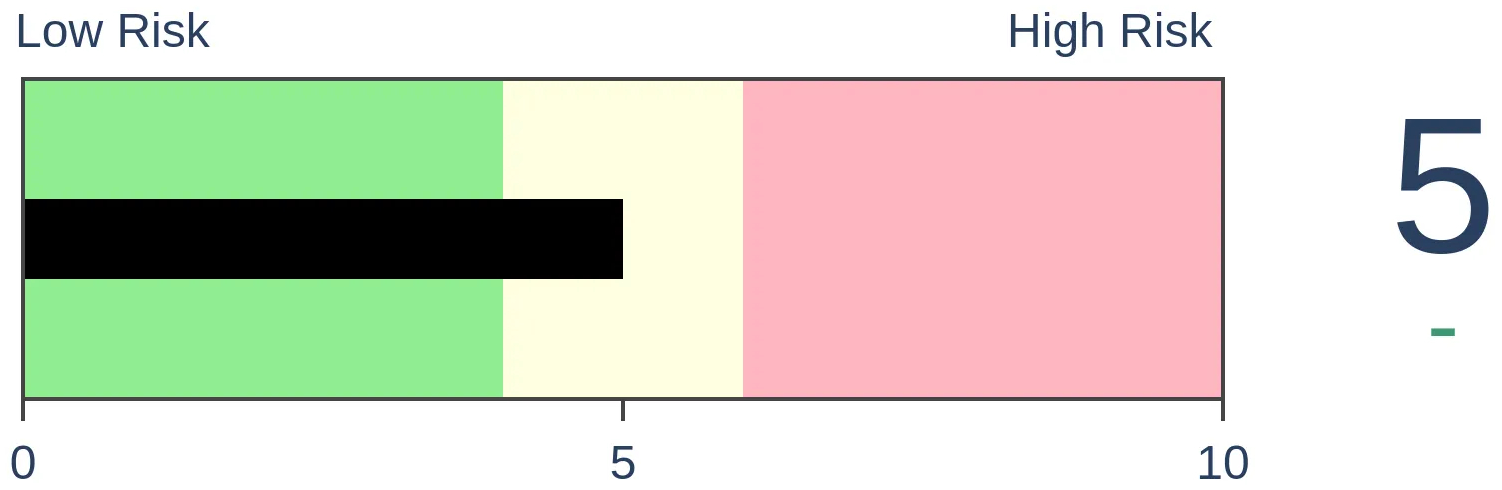
Stocks Medium-Term
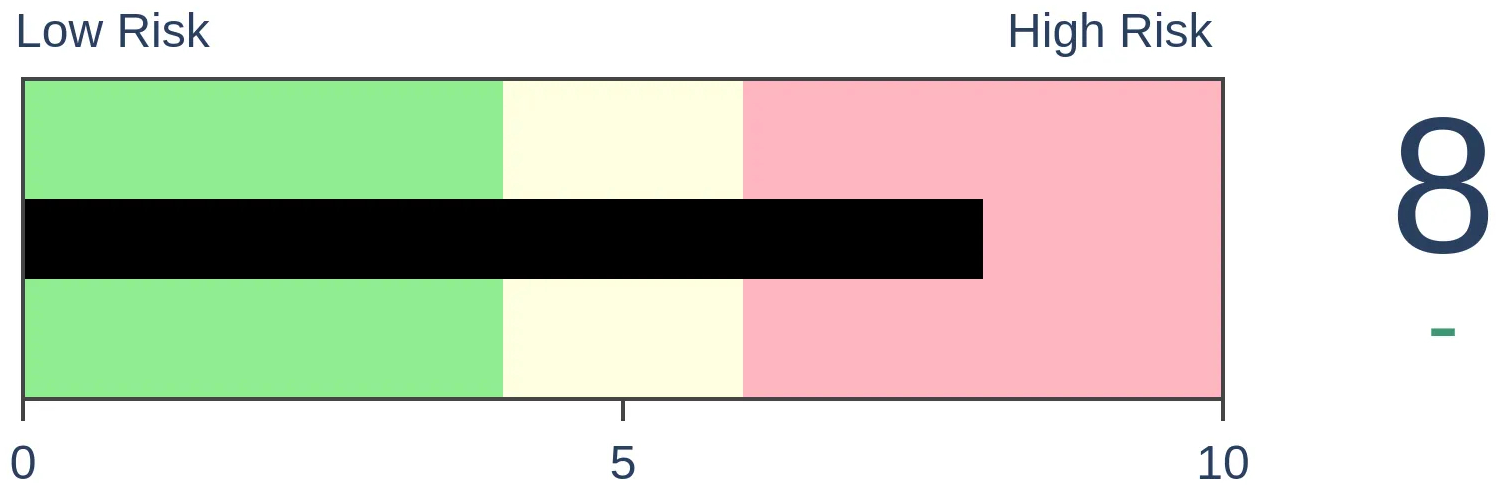
|
|
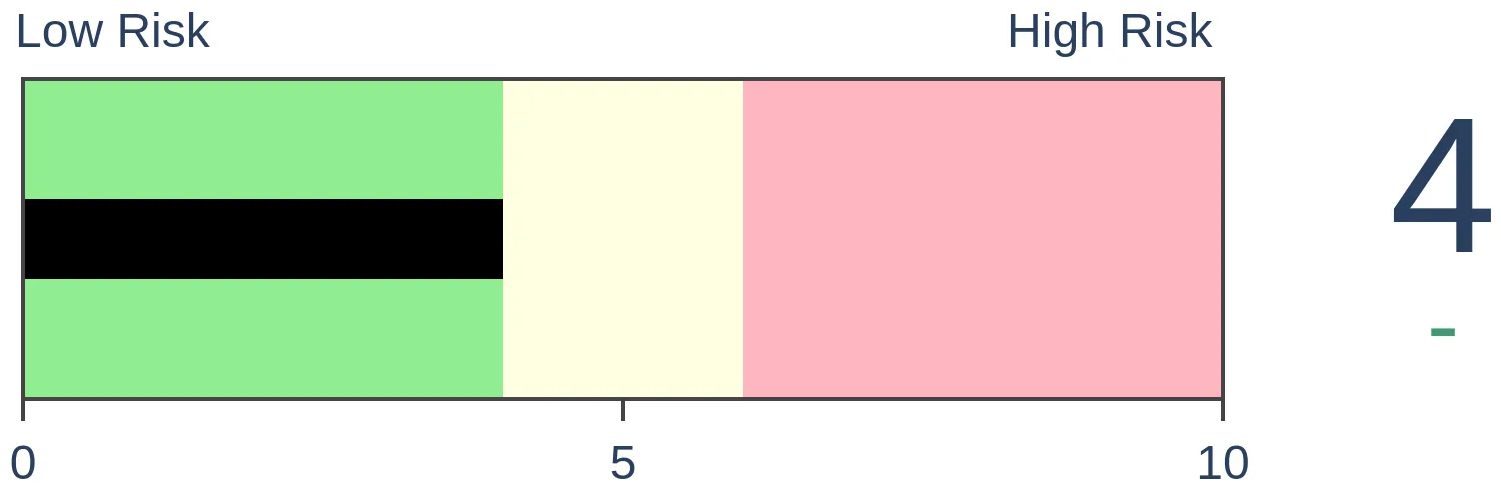
Bonds
|
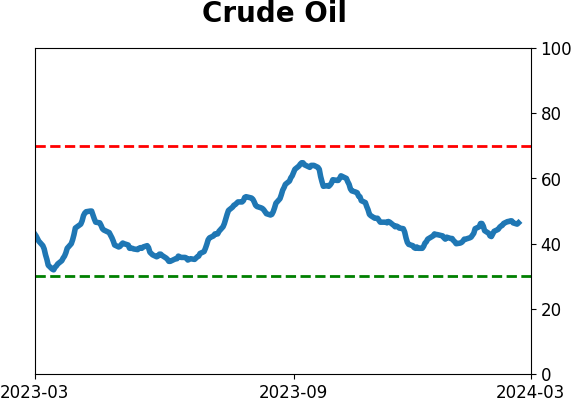
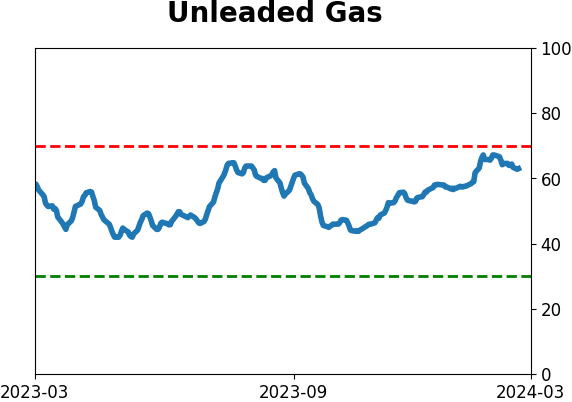
Crude Oil
|
|
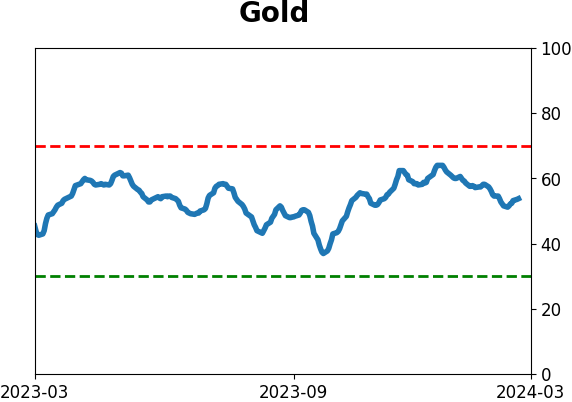
Gold
|
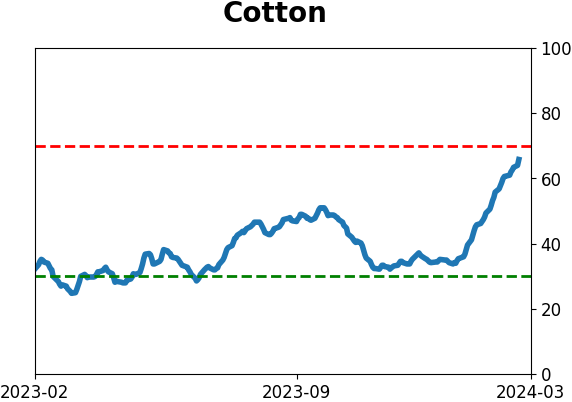
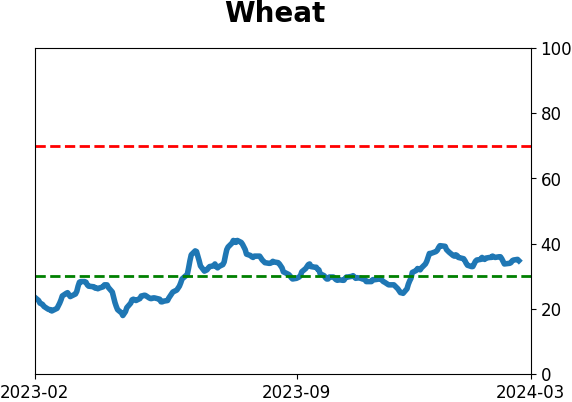
Agriculture

|
|
Research
By Jason Goepfert
BOTTOM LINE
As stocks rose over the past month, we've been watching a highly unusual development - both Smart Money and Dumb Money Confidence were rising strongly at the same time. That's never happened before. When they have risen by lesser amounts together, the S&P 500 showed below-average returns over the short- to medium-term.
FORECAST / TIMEFRAME
None
|
Key points:
- Over a month, both Dumb Money and Smart Money Confidence rose more than 15%
- This has never happened before, as the two models have a strong tendency to move counter to one another
- Other times when both groups showed increasing confidence led to weaker-than-average shorter-term returns
Both Dumb Money and Smart Money are becoming more confident
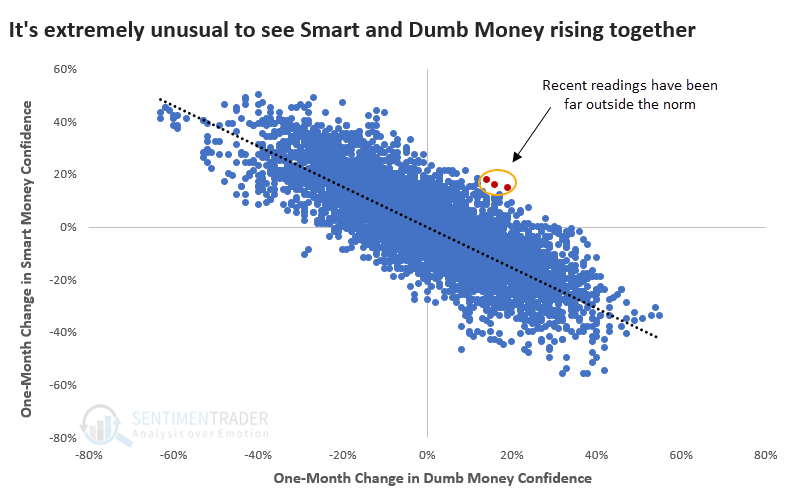
There has been an unusual situation in effect since mid-January. The major stock indexes have tacked on good gains, and Dumb Money Confidence has risen. That's totally normal. What's not normal is that Smart Money Confidence increased as well.
The term "dumb money" is an unfortunate pejorative that's simply shorthand for what are typically trend-following, hot money traders. They tend to be correct during the meat of a trend but also tend to hold their largest long positions near market peaks. The "smart money" tends to go against the trend (this is often just a reflection of hedging activity) and tends to hold their largest net long positions near market troughs.
The fact that both cohorts have been showing increased confidence in a further rally as stocks rise is highly unusual. In fact, we've never seen it to this degree since we began computing the models in 1998.
There has never been a time in 26 years when both Dumb Money and Smart Money increased more than 15% over a month. Whenever Dumb Money has increased by 15% or more, the average change in Smart Money is -18%.
Odd behavior in Confidence has preceded some weak returns
There are two major questions to ask after seeing something like this:
- Has anything changed in the models?
- Has similar behavior meant anything consistent?
The answer to #1 is no, not to the best of my knowledge. There isn't anything in the inputs that would make me question the validity of the readings.
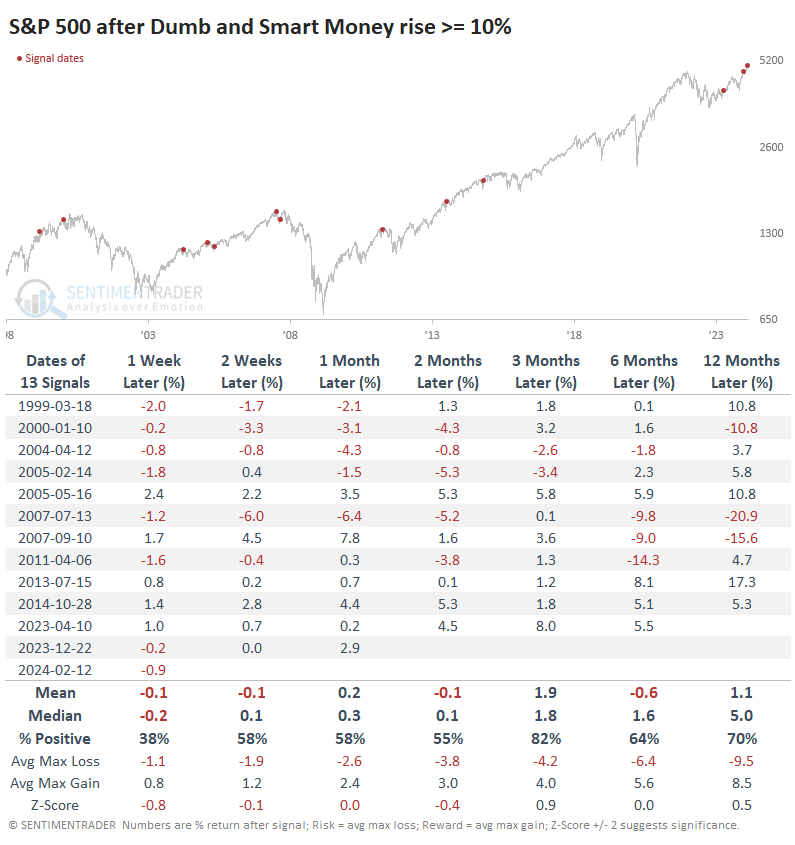
To help answer #2, the table below shows every time both Smart and Dumb Money rose 10% or more over at least several weeks. Shorter-term returns were relatively dour, though the S&P 500 did shrug off the oddity of both models rising several times with no ill effects. Over the next three months, 11 out of 13 signals sported a positive return.
Even more unusual is that both Smart and Dumb Money were above 50%. The small sample size shrinks even further if we look at similar model readings. Only a handful of times did they both rise this much while also being above 50%.
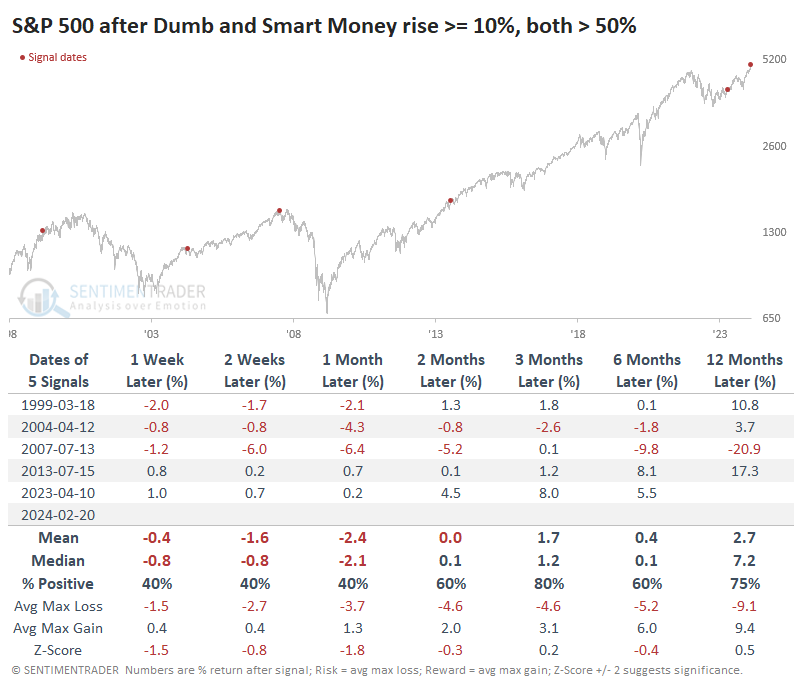
After these signals, the S&P struggled with either negative or just-barely-positive returns over the next couple of months. The sole exception was the one from April last year, which was also the only signal that triggered when the S&P was far off a 52-week high, which is not the case now.
What the research tells us...
We don't like odd. We like it when markets do what they're "supposed" to do, and most of the indicators we watch confirm the activity. That was the case for most of October 2022 - early 2024. It wasn't until recently that we started to see some modest warning signs, especially on the Nasdaq. Those have been alleviated to a large degree with the last push higher, so even that hasn't been too much of a worry.
Still, it's worth paying attention to various indicators and models and investigating when they diverge from their typical behavior. Often, it will give us an early heads-up that something is happening under the surface that isn't being captured in the price action or more widely followed indicators. The unusual activity in Smart and Dumb Money may be one of those, but we just don't have a big enough sample or consistent enough performance afterward to consider it too much of a warning just yet.
Indicators at Extremes
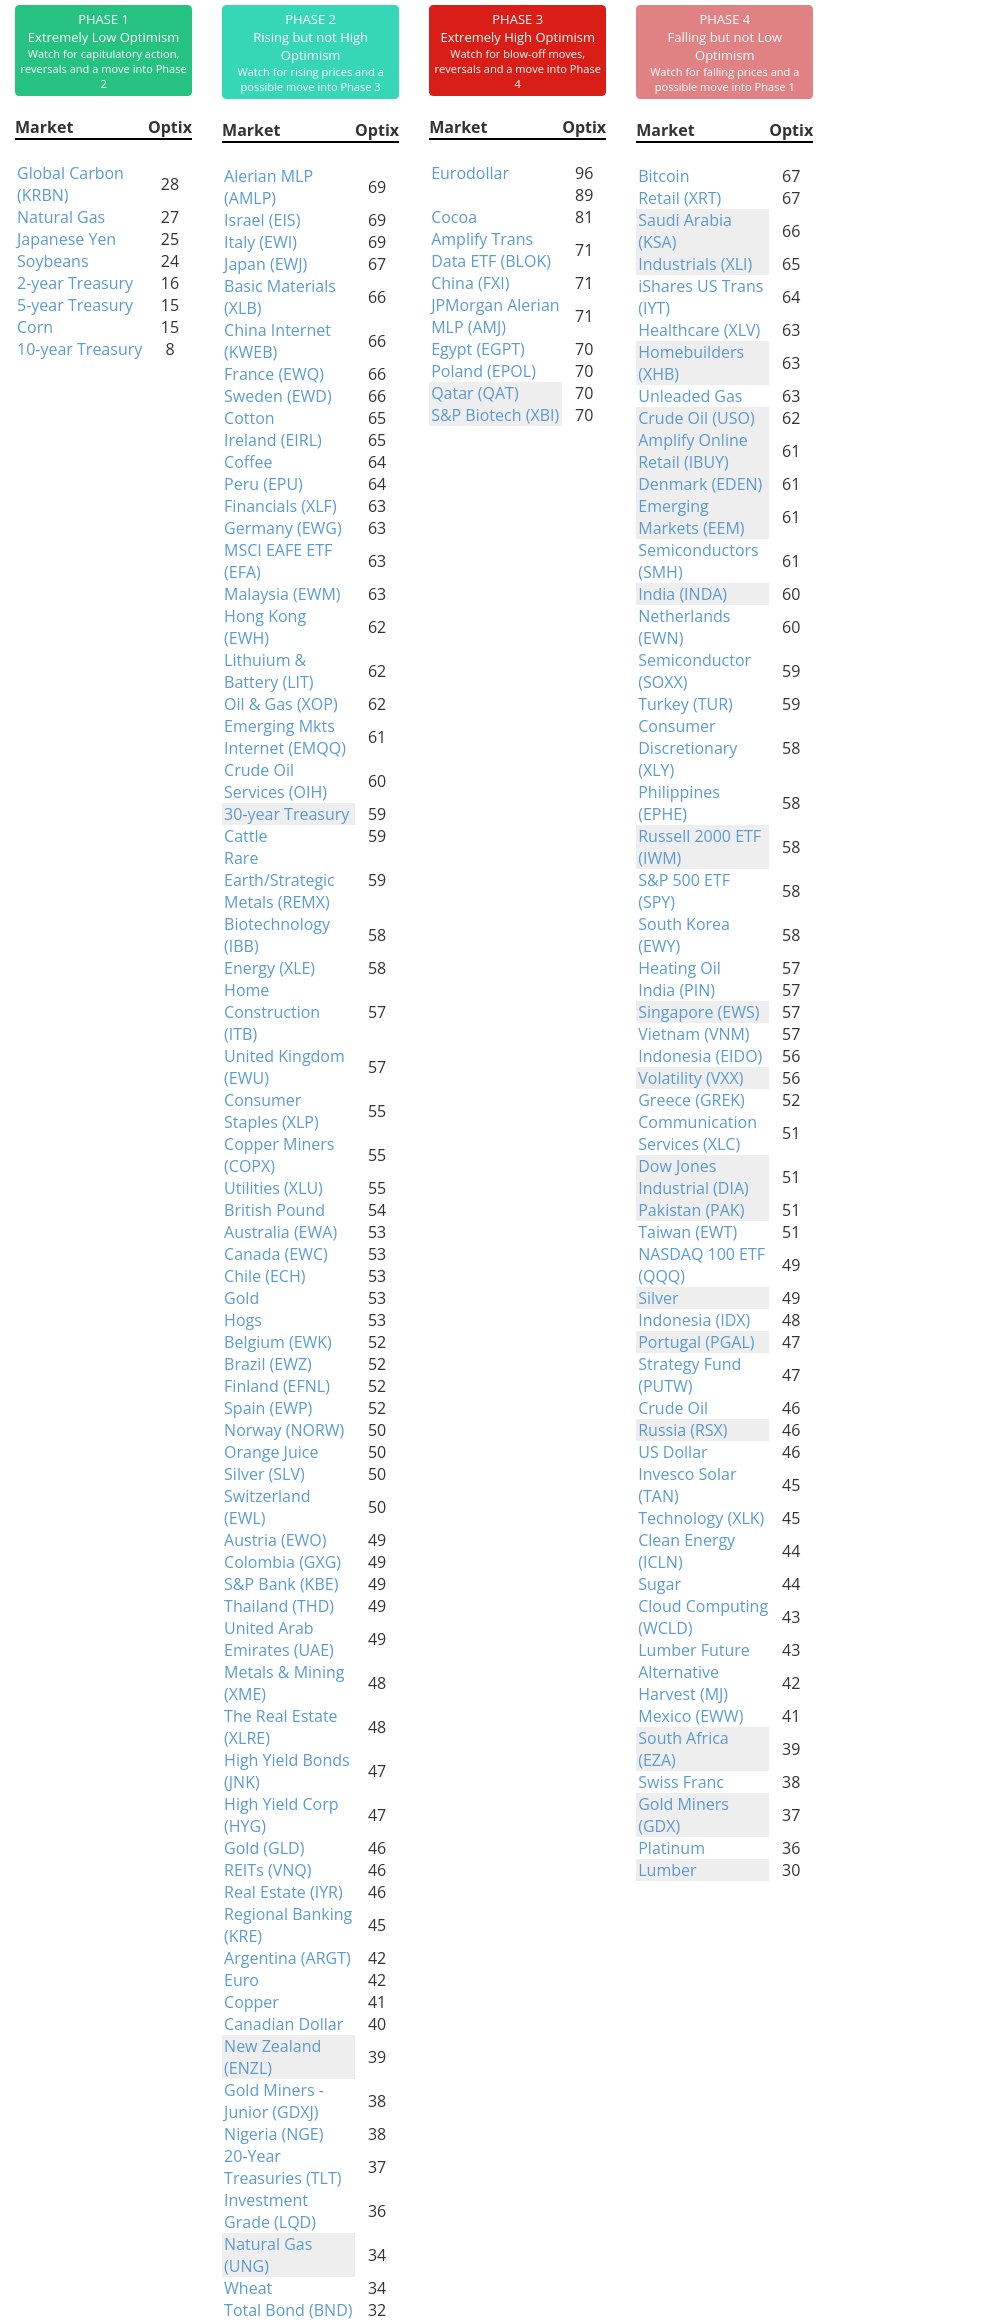
Phase Table
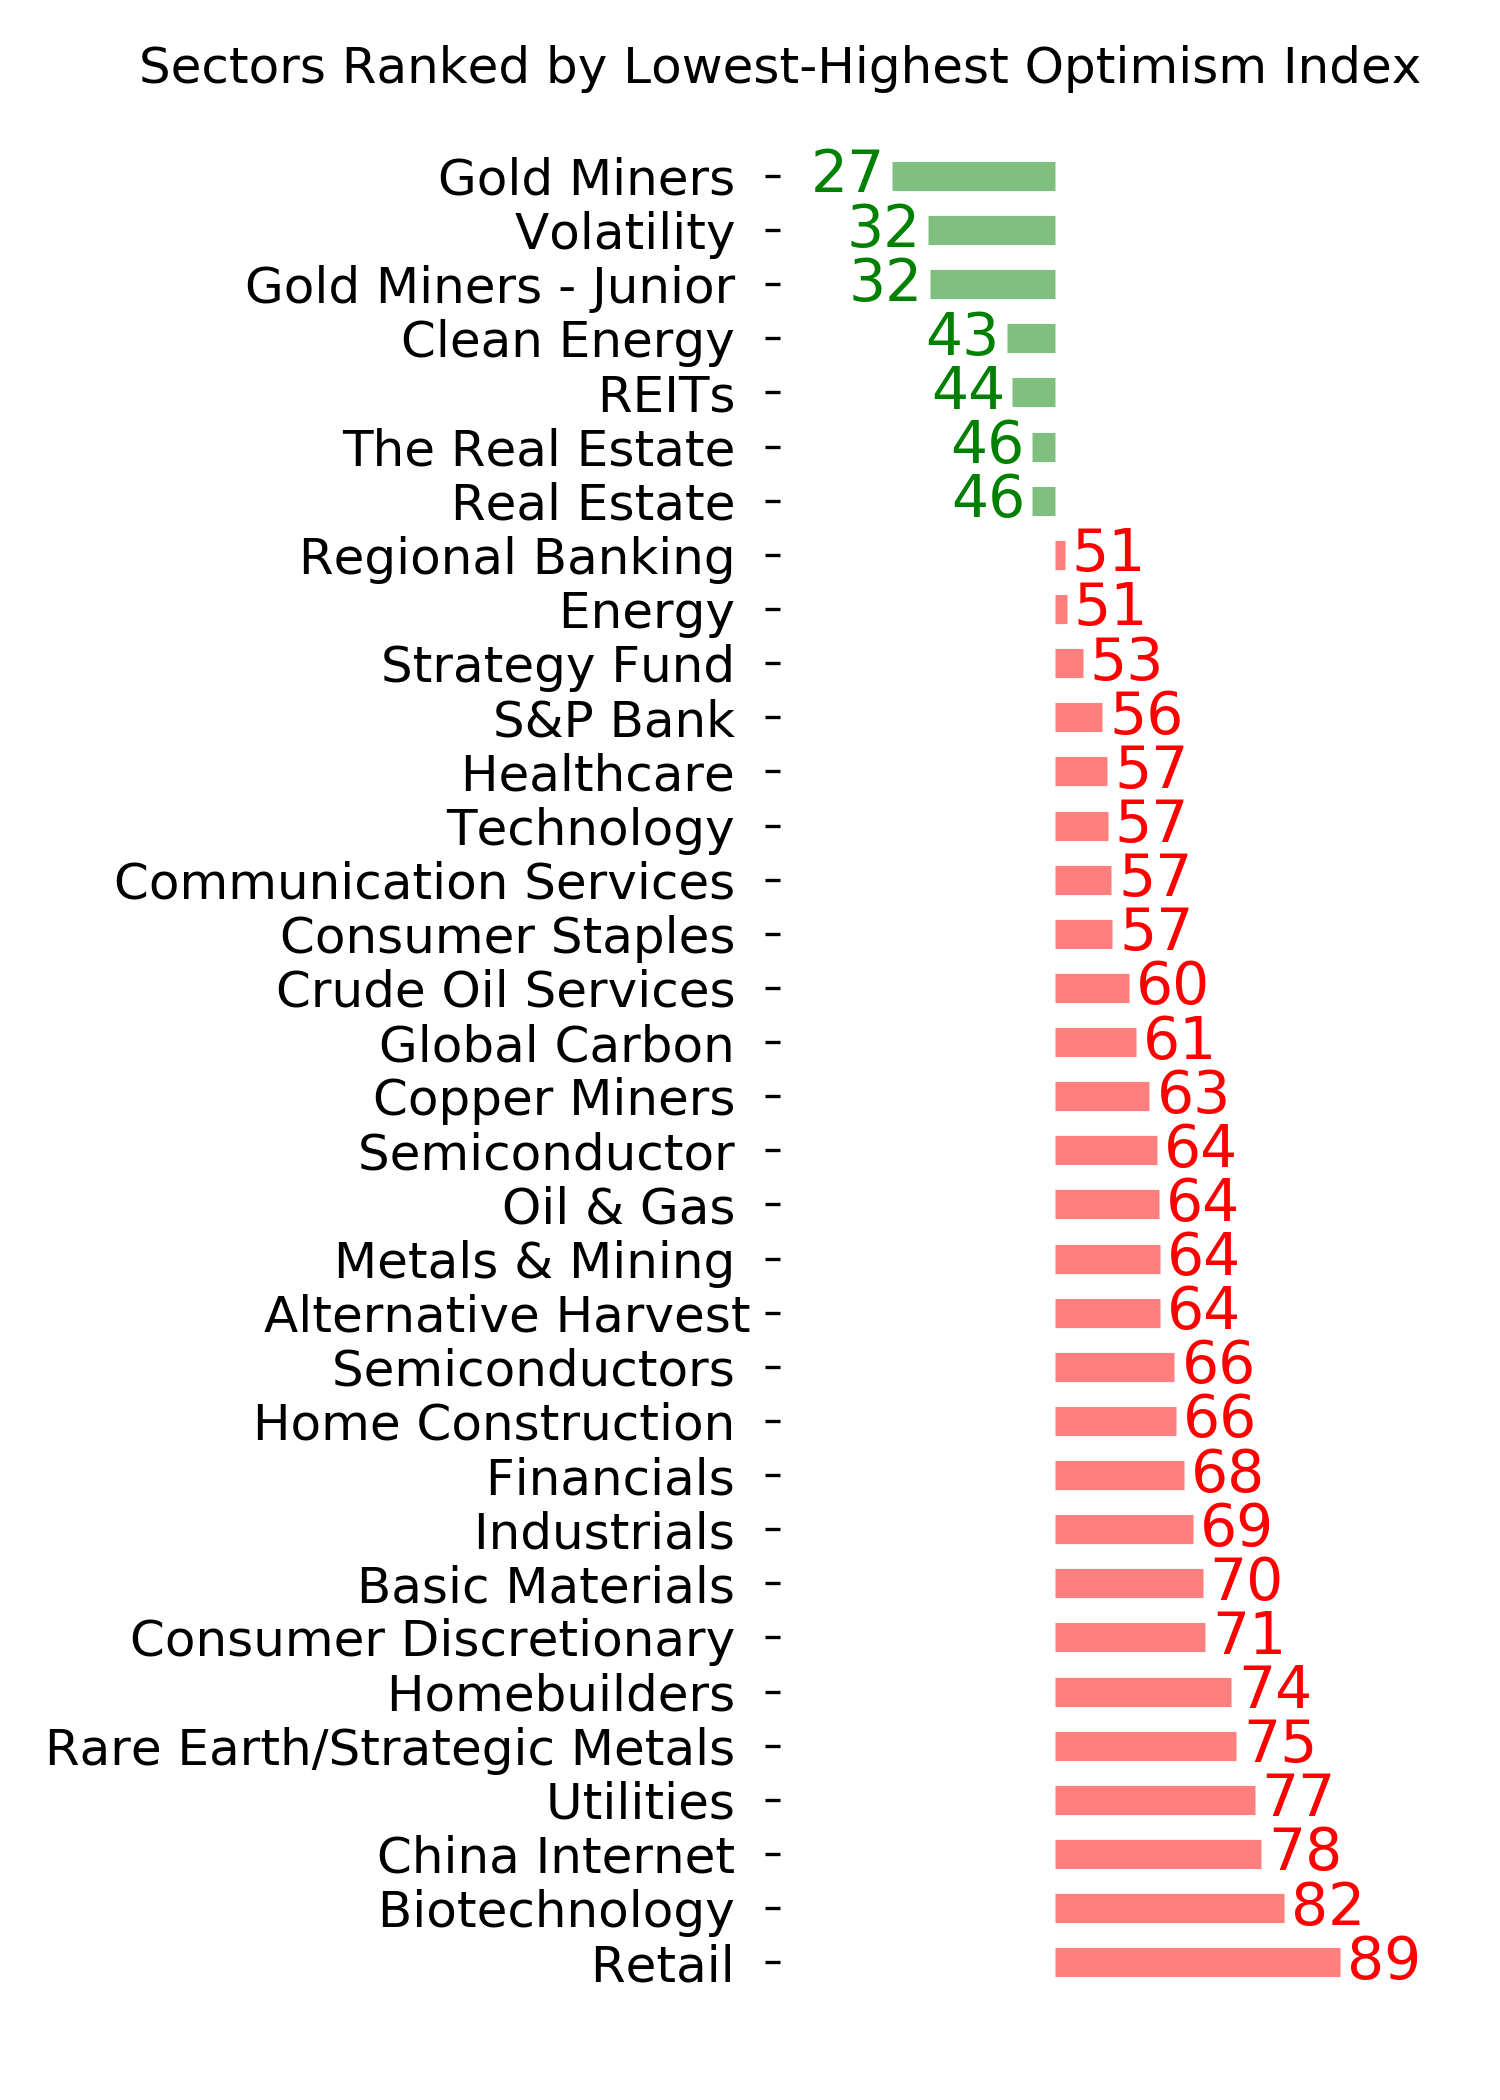
Ranks
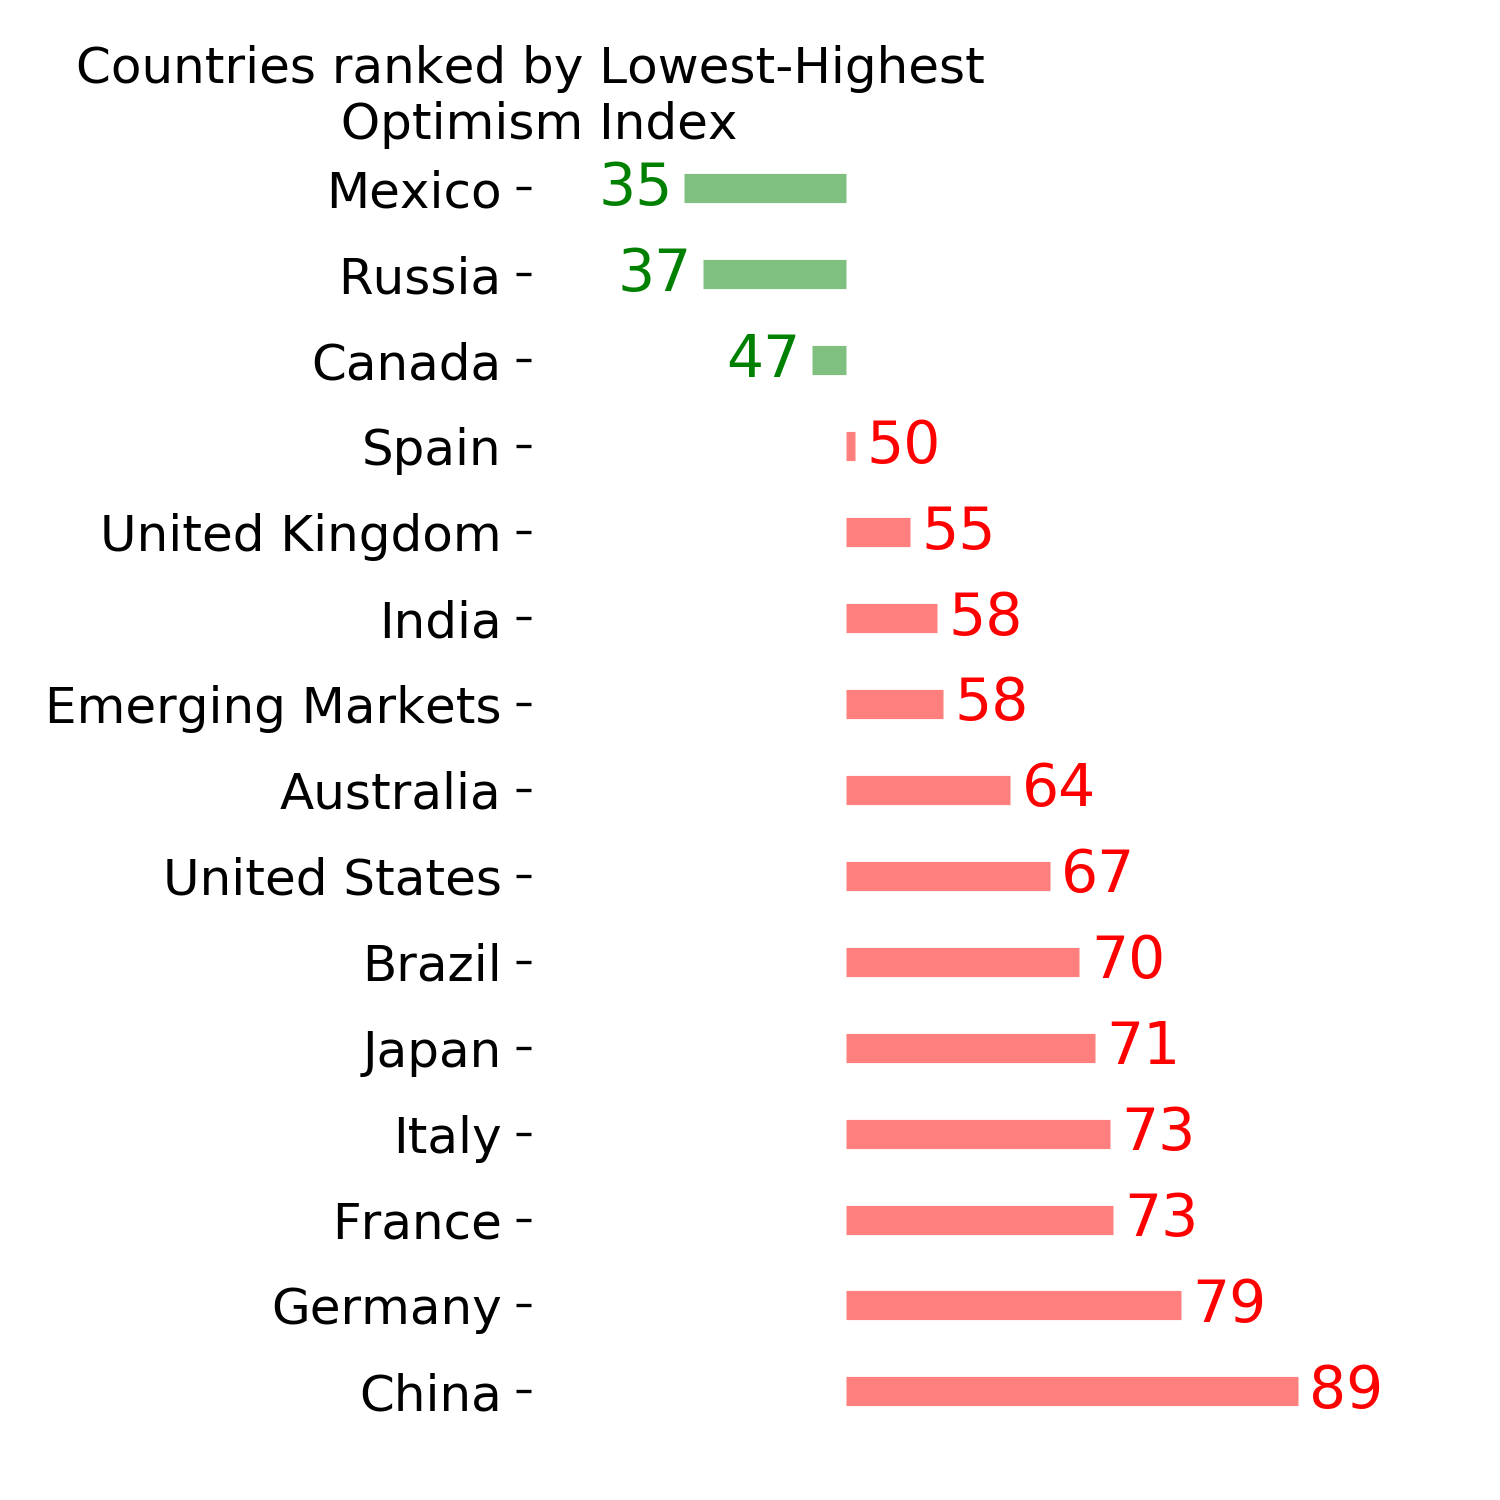
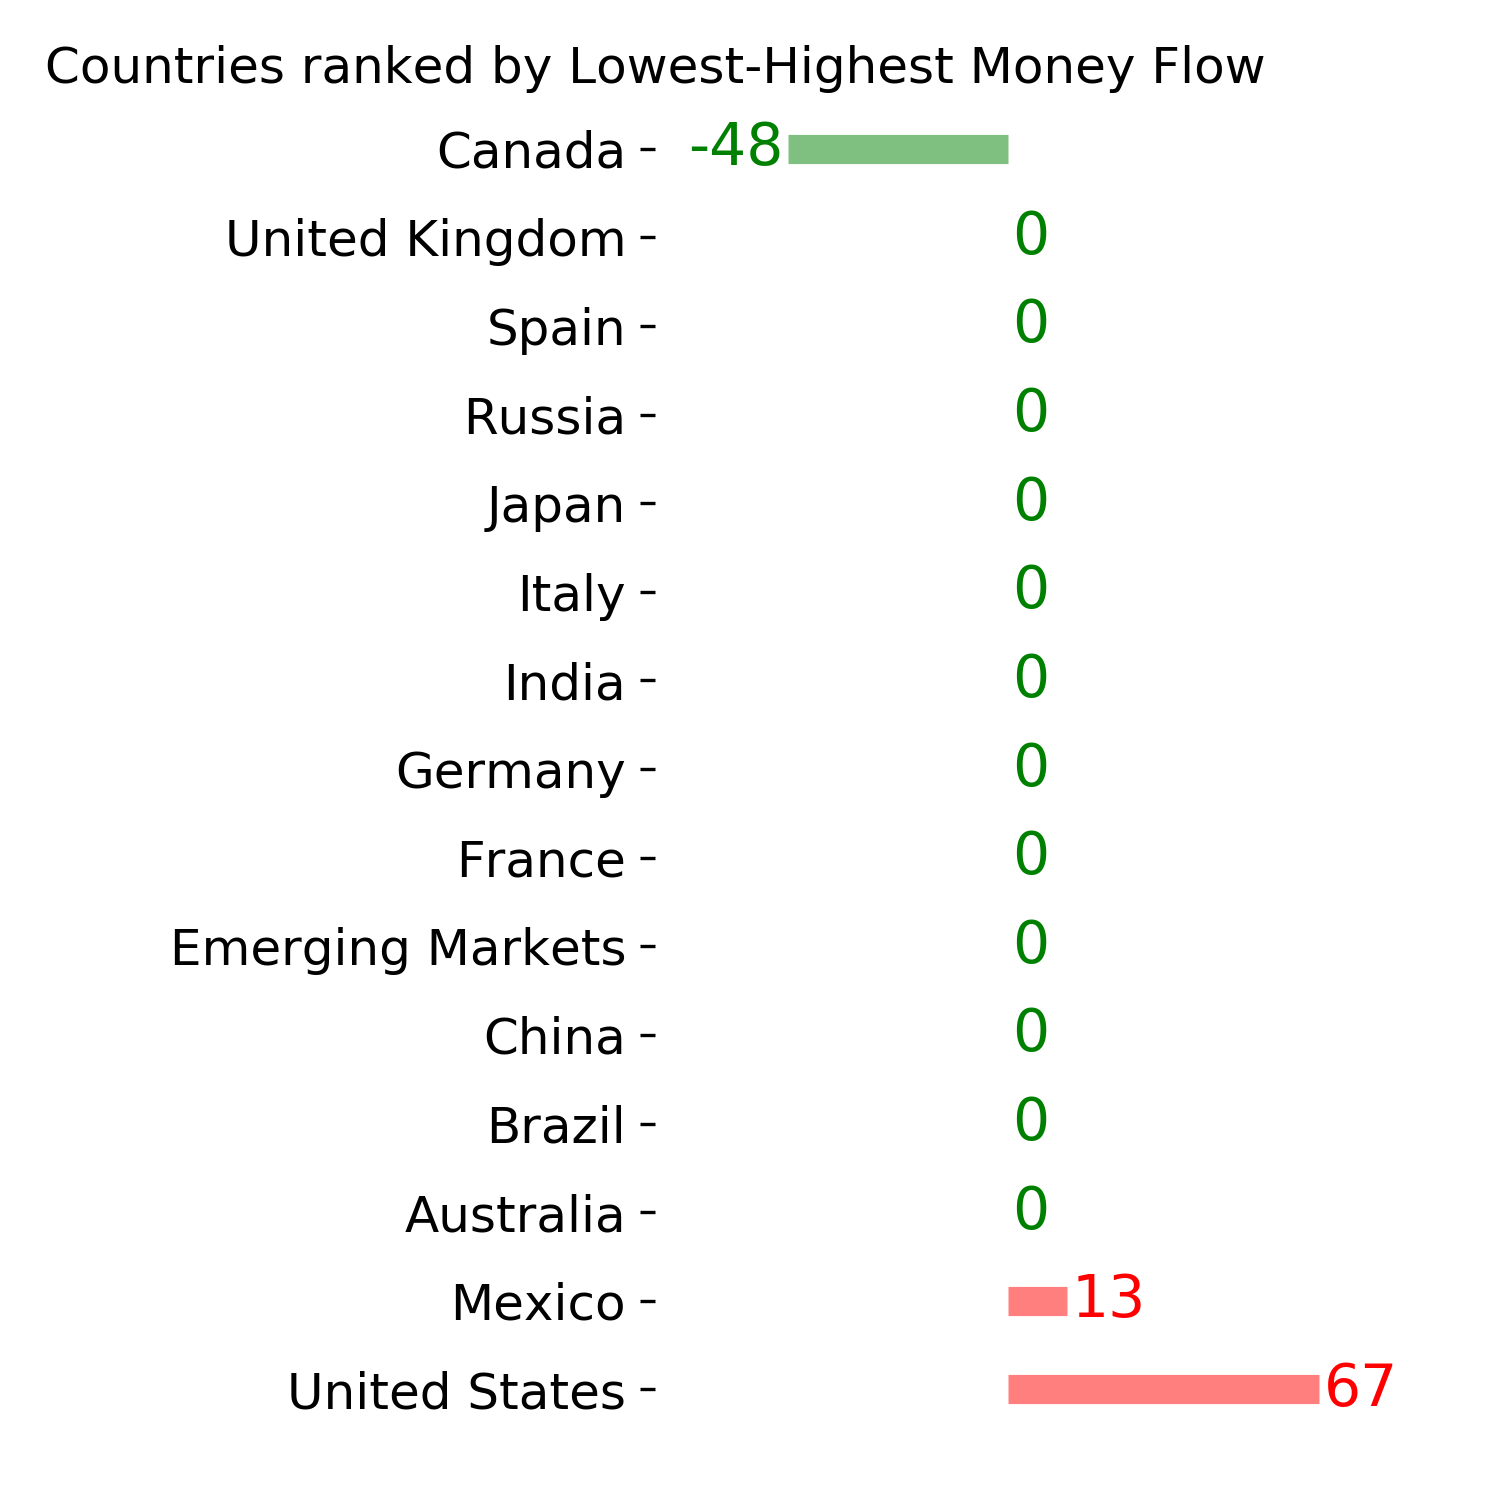
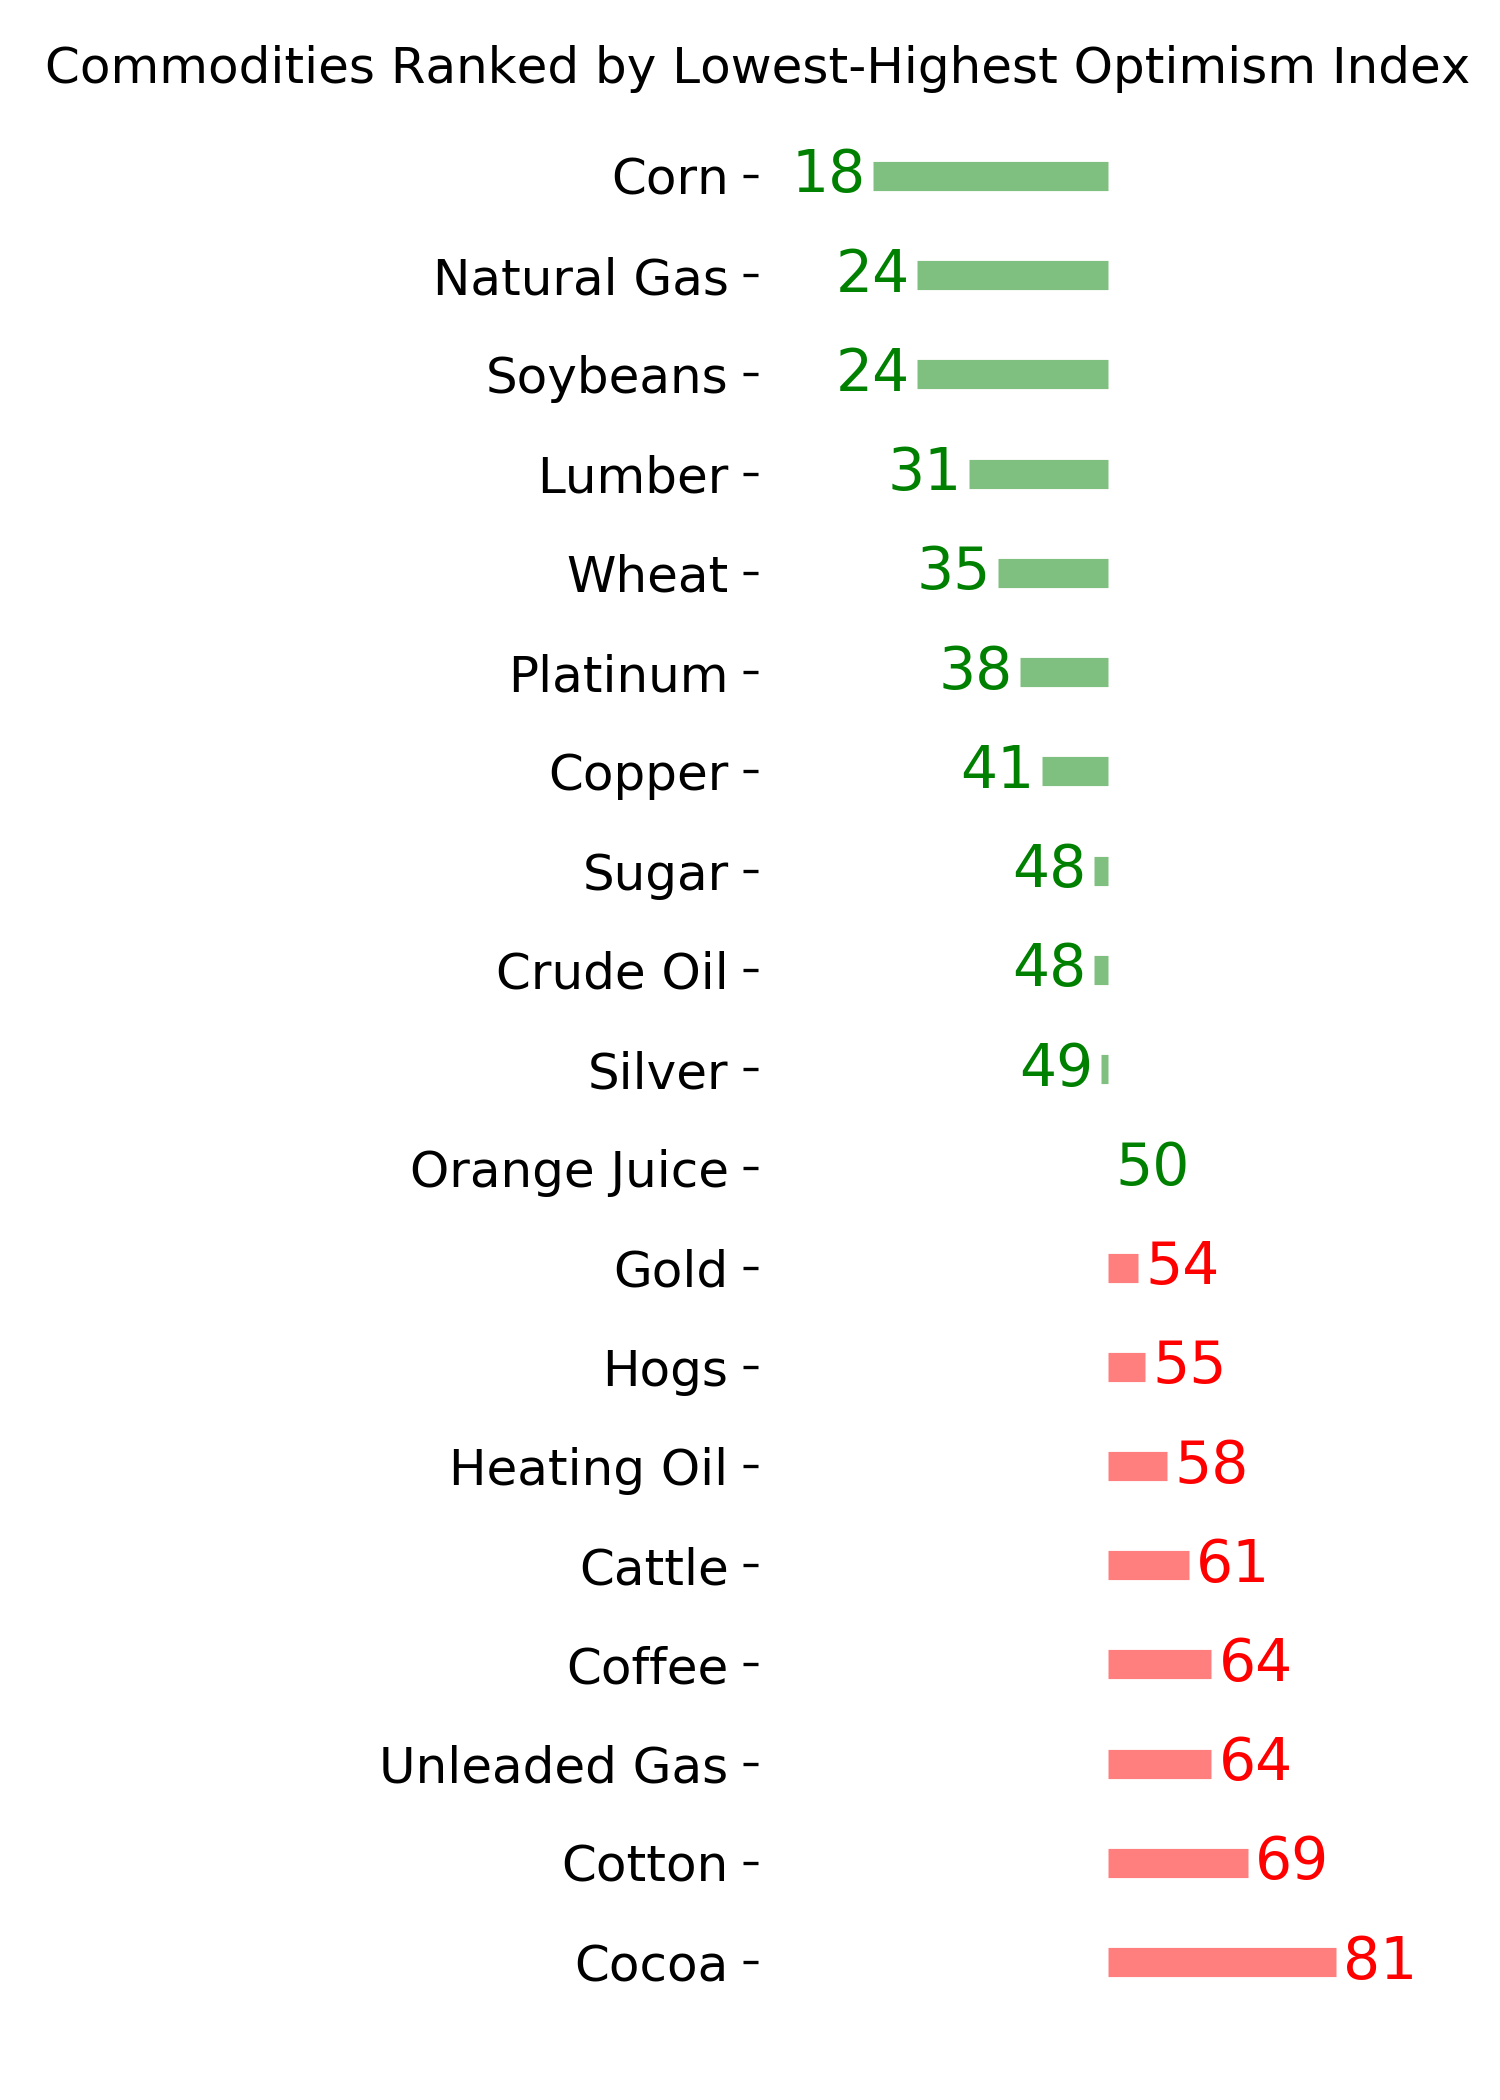
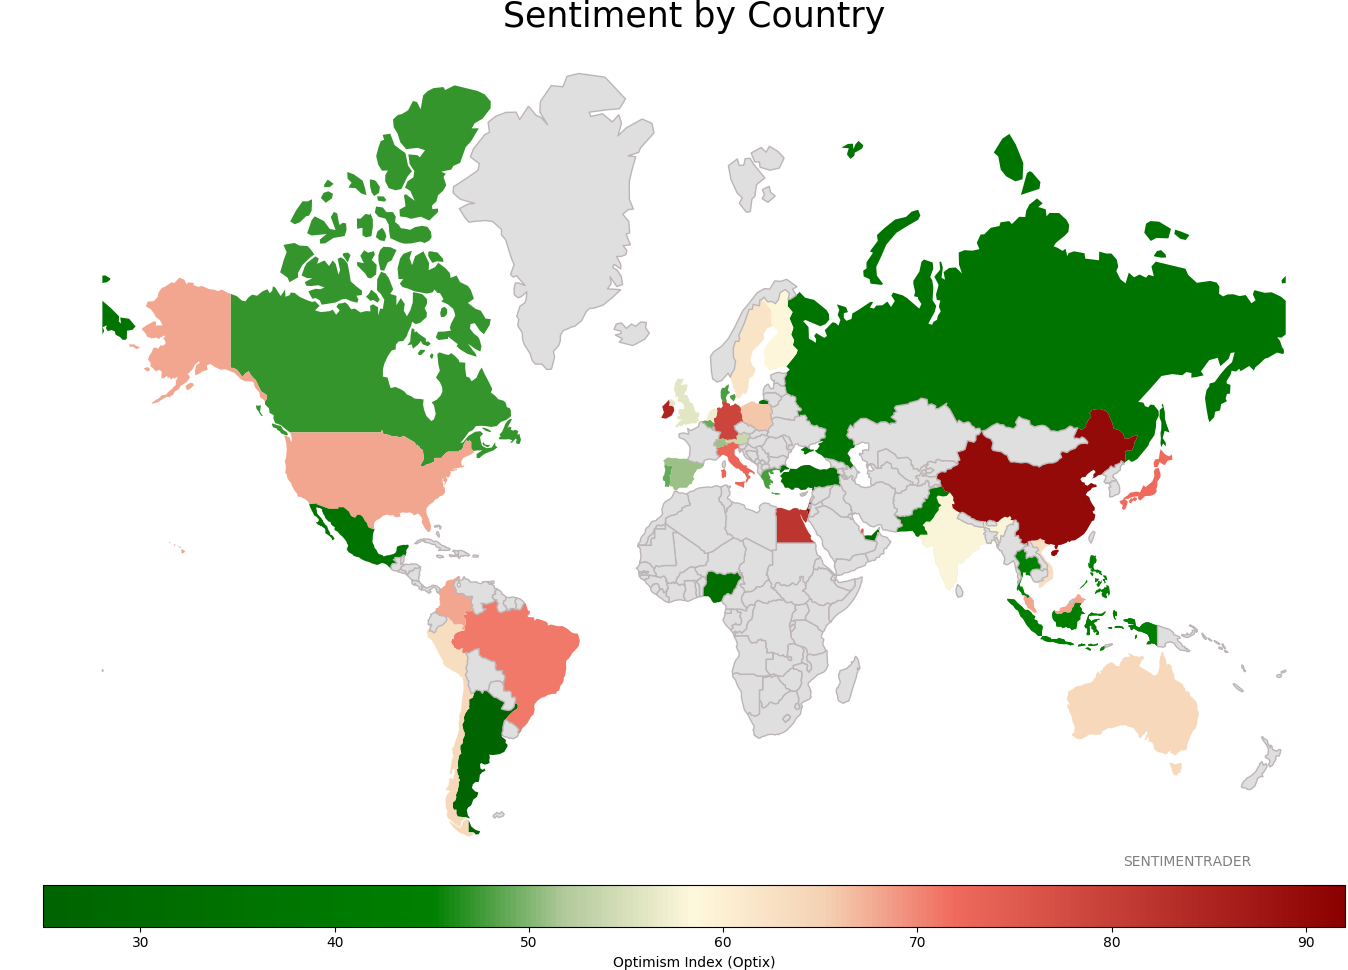
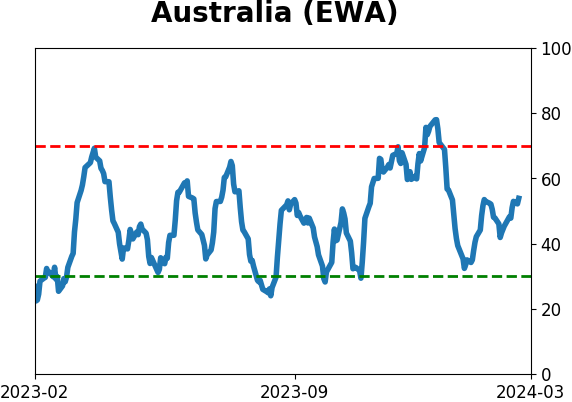
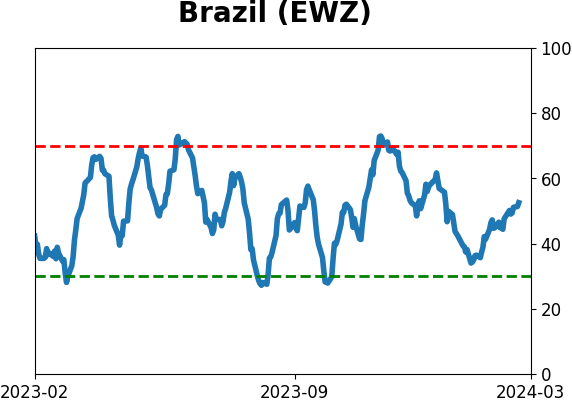
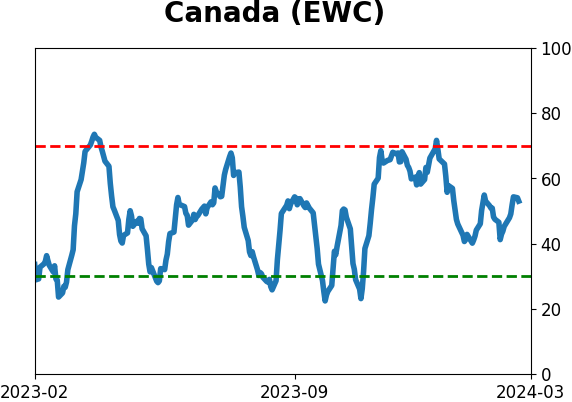
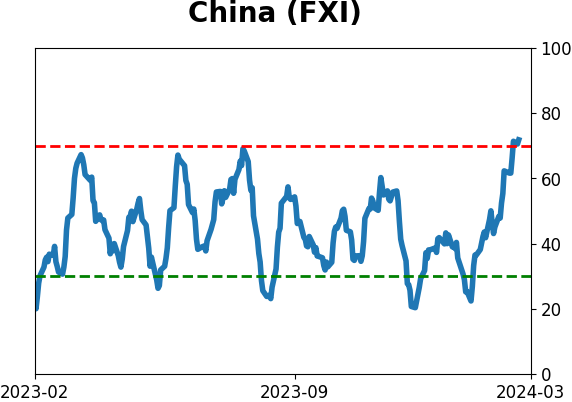
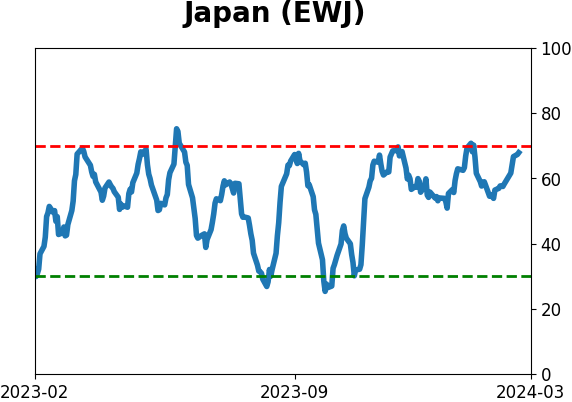
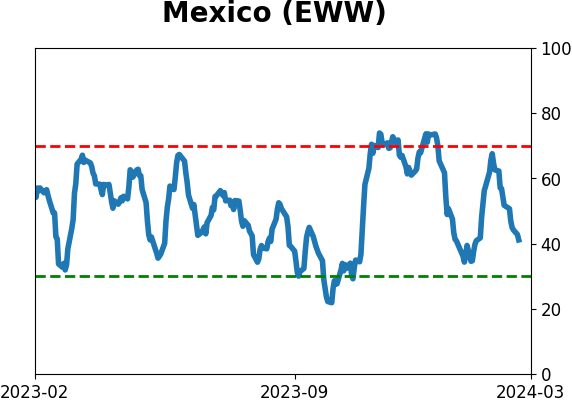
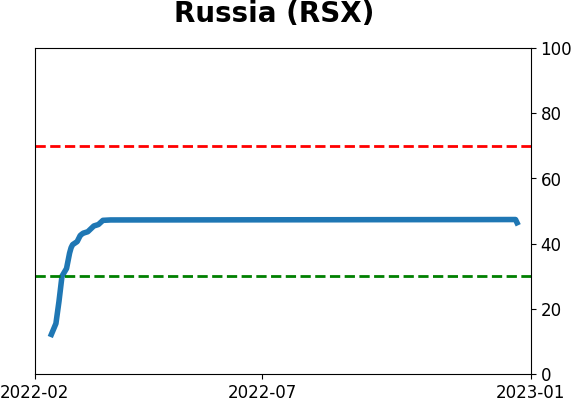
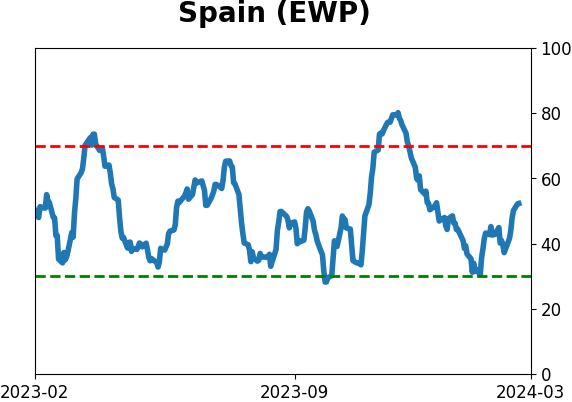
Sentiment Around The World
Optimism Index Thumbnails
|
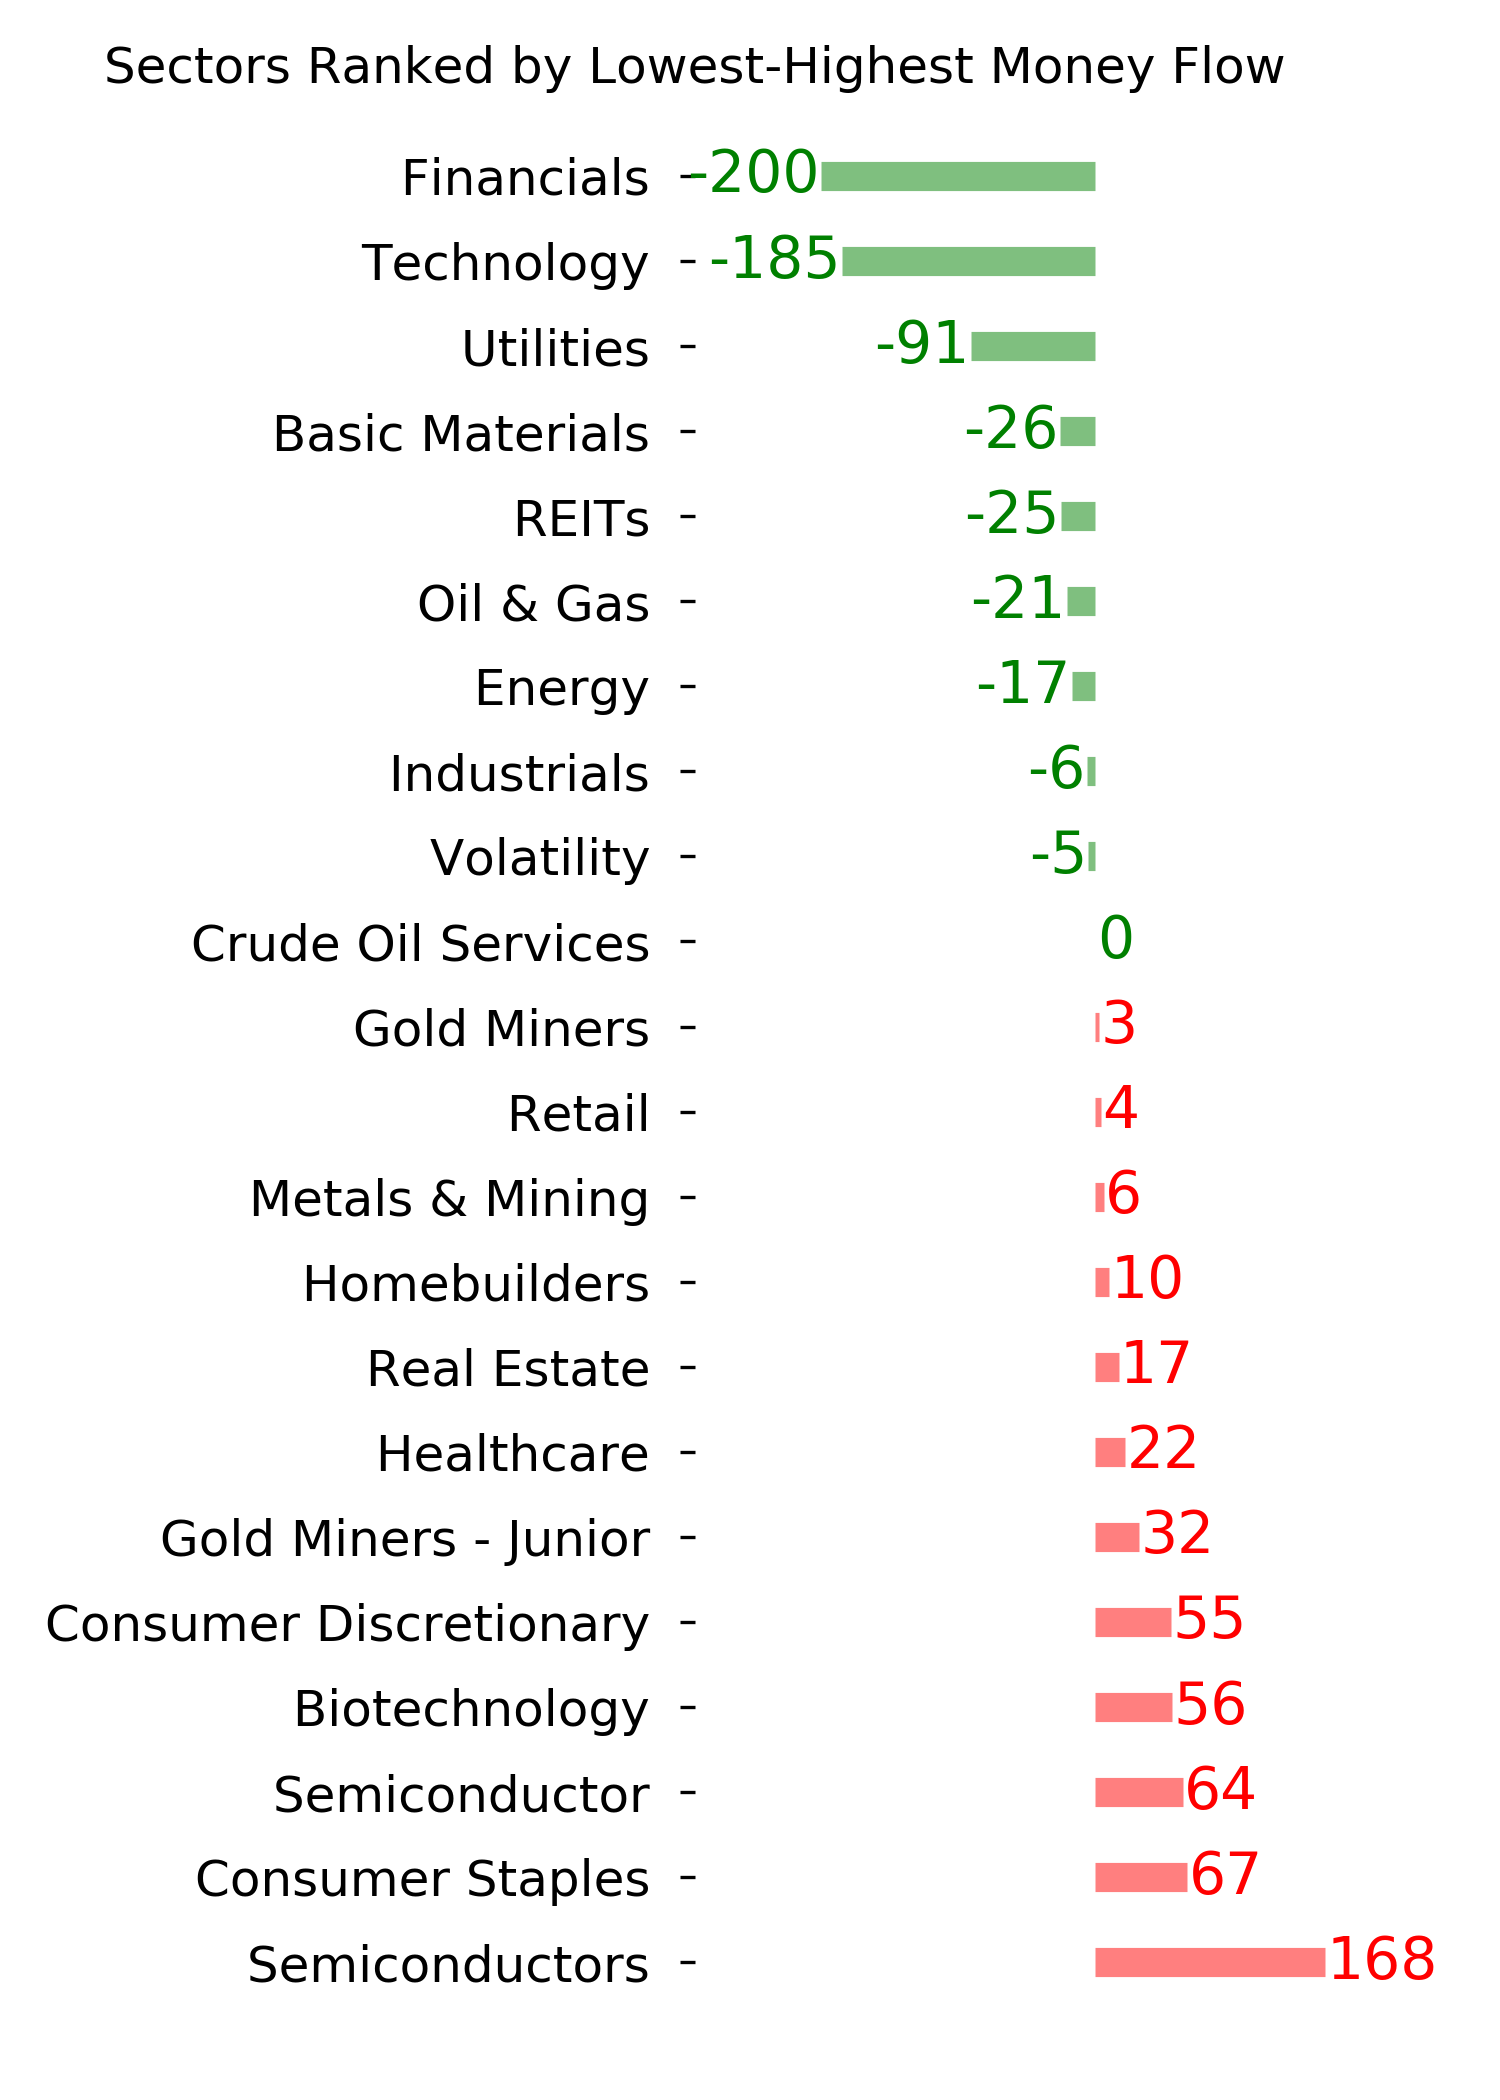
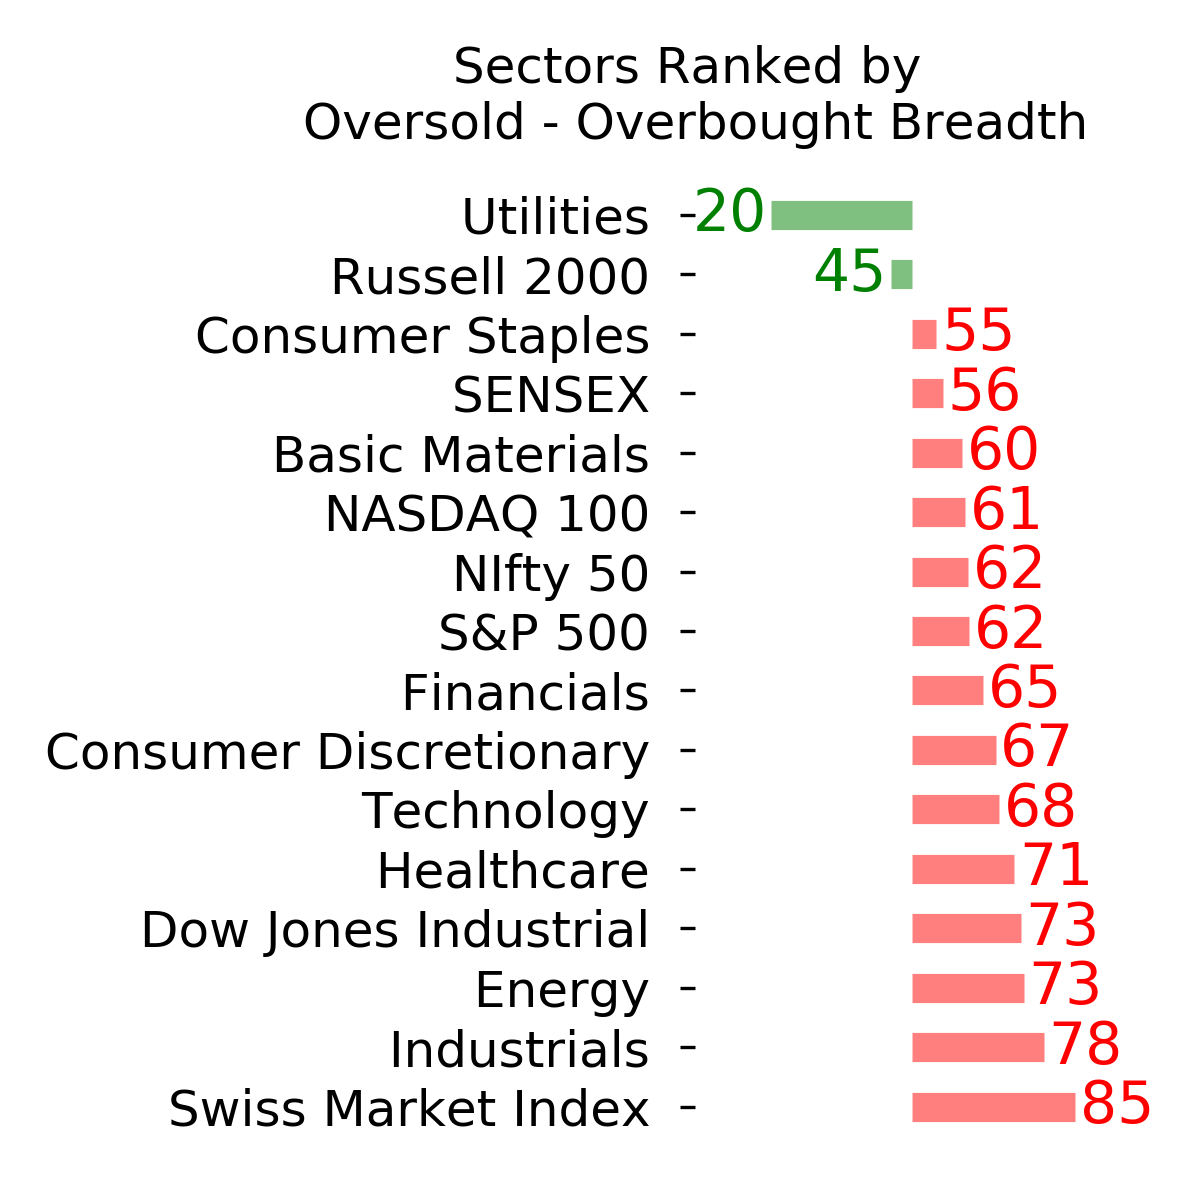
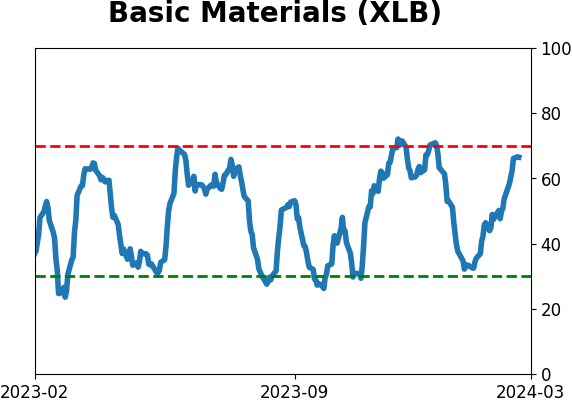
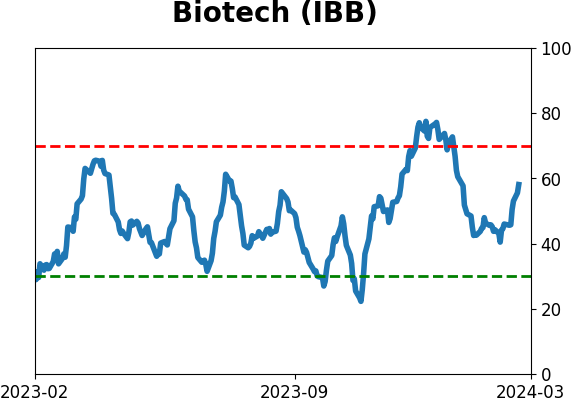
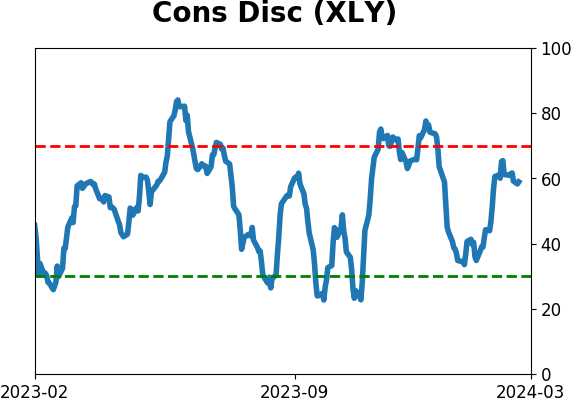
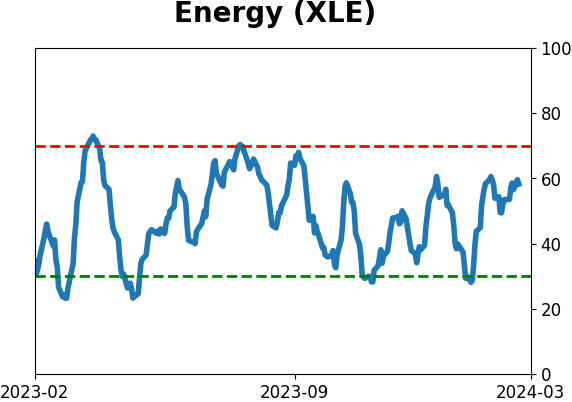
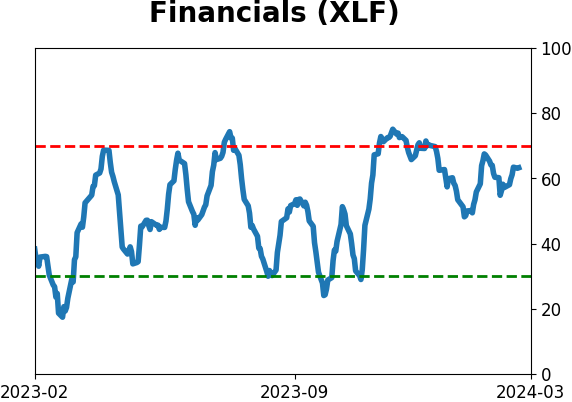
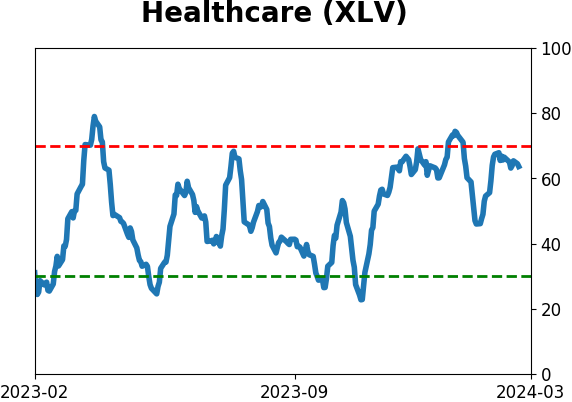
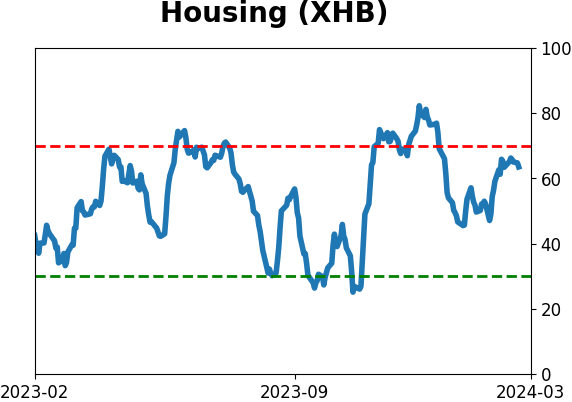
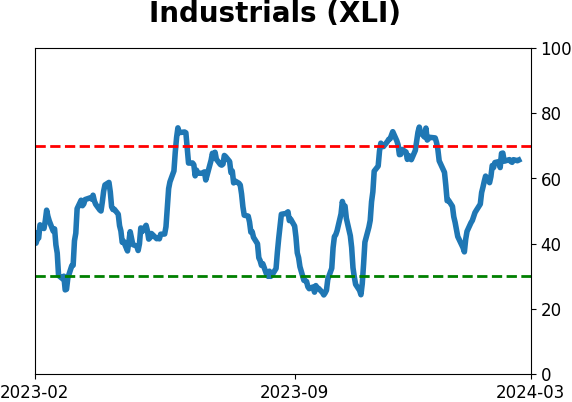
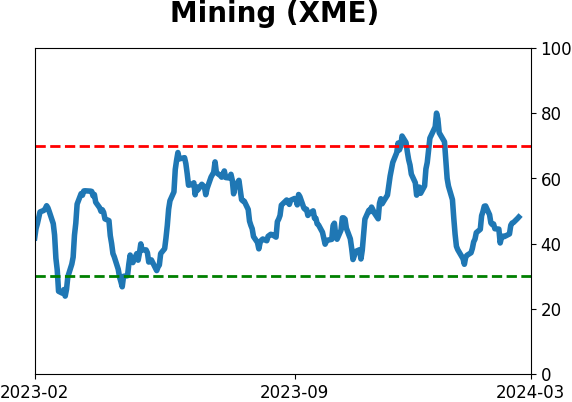
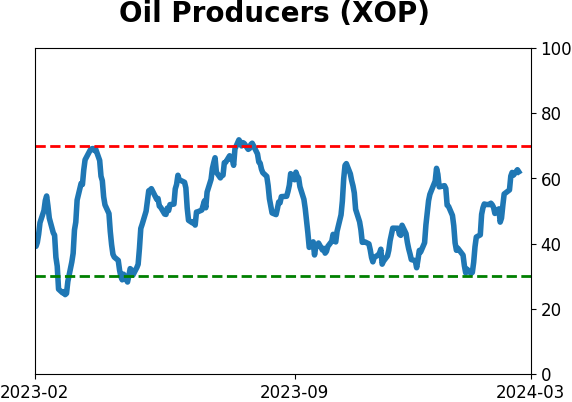
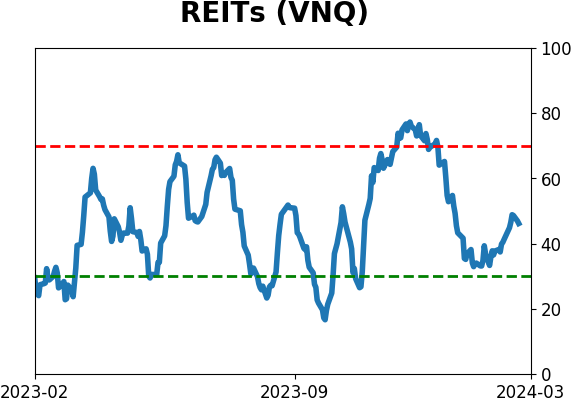
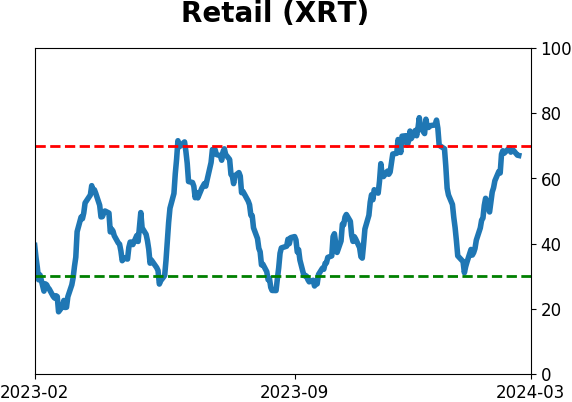
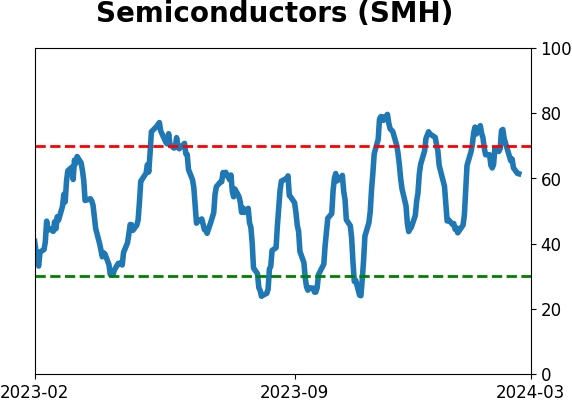
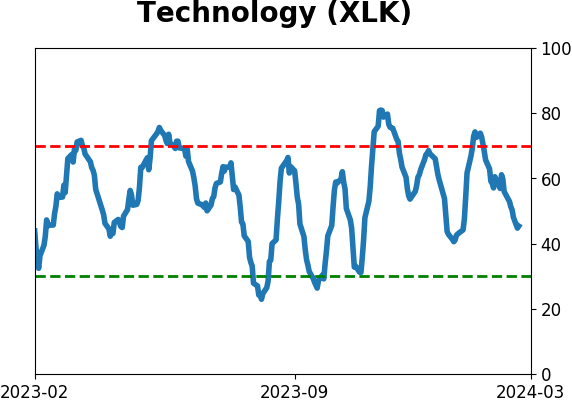
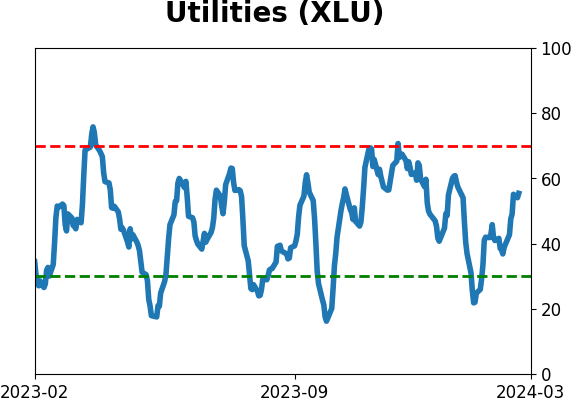
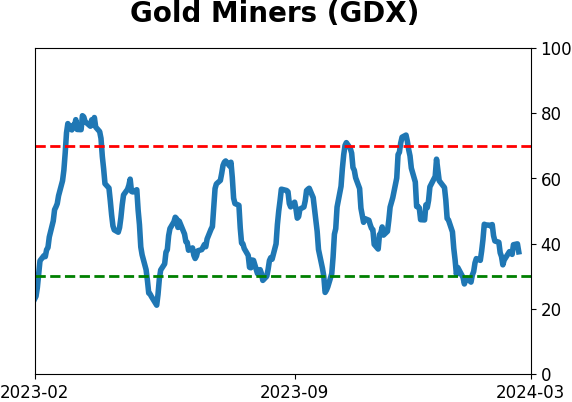
Sector ETF's - 10-Day Moving Average
|
|
|
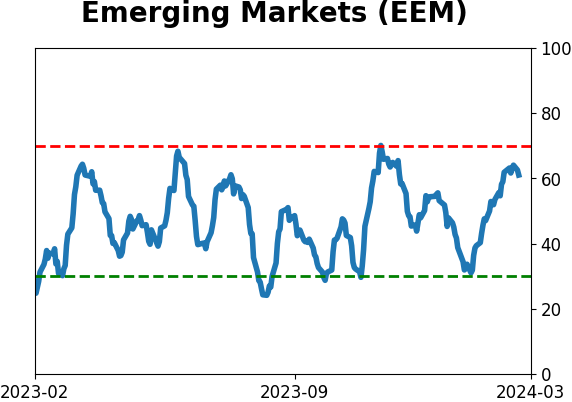
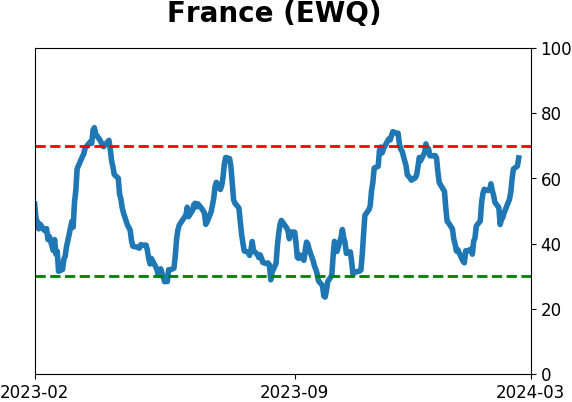
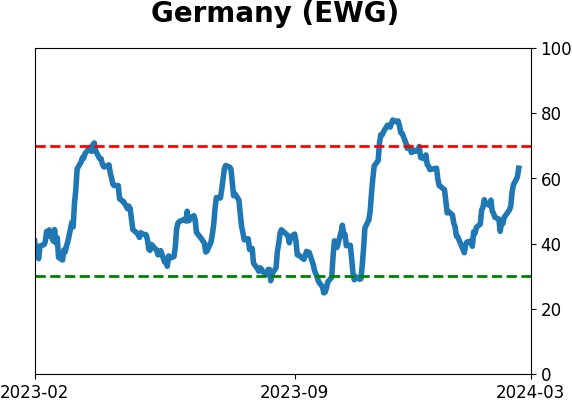
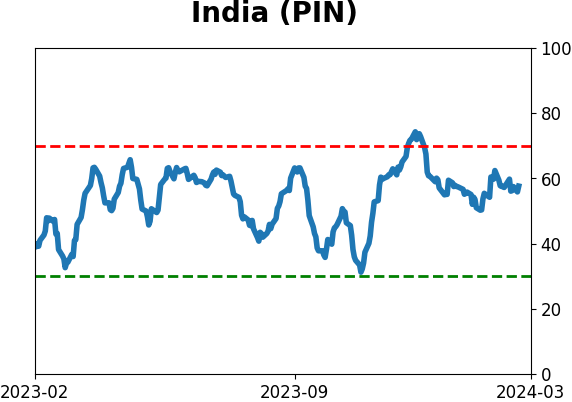
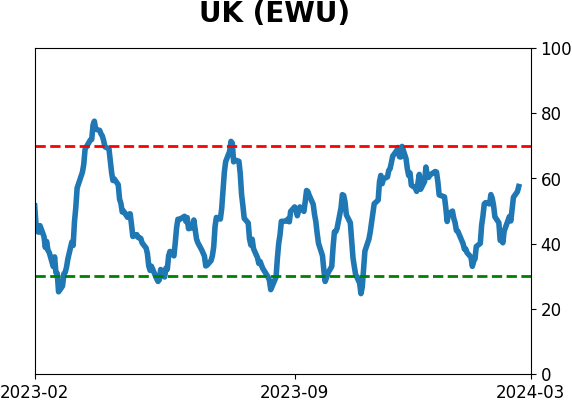
Country ETF's - 10-Day Moving Average
|
|
|
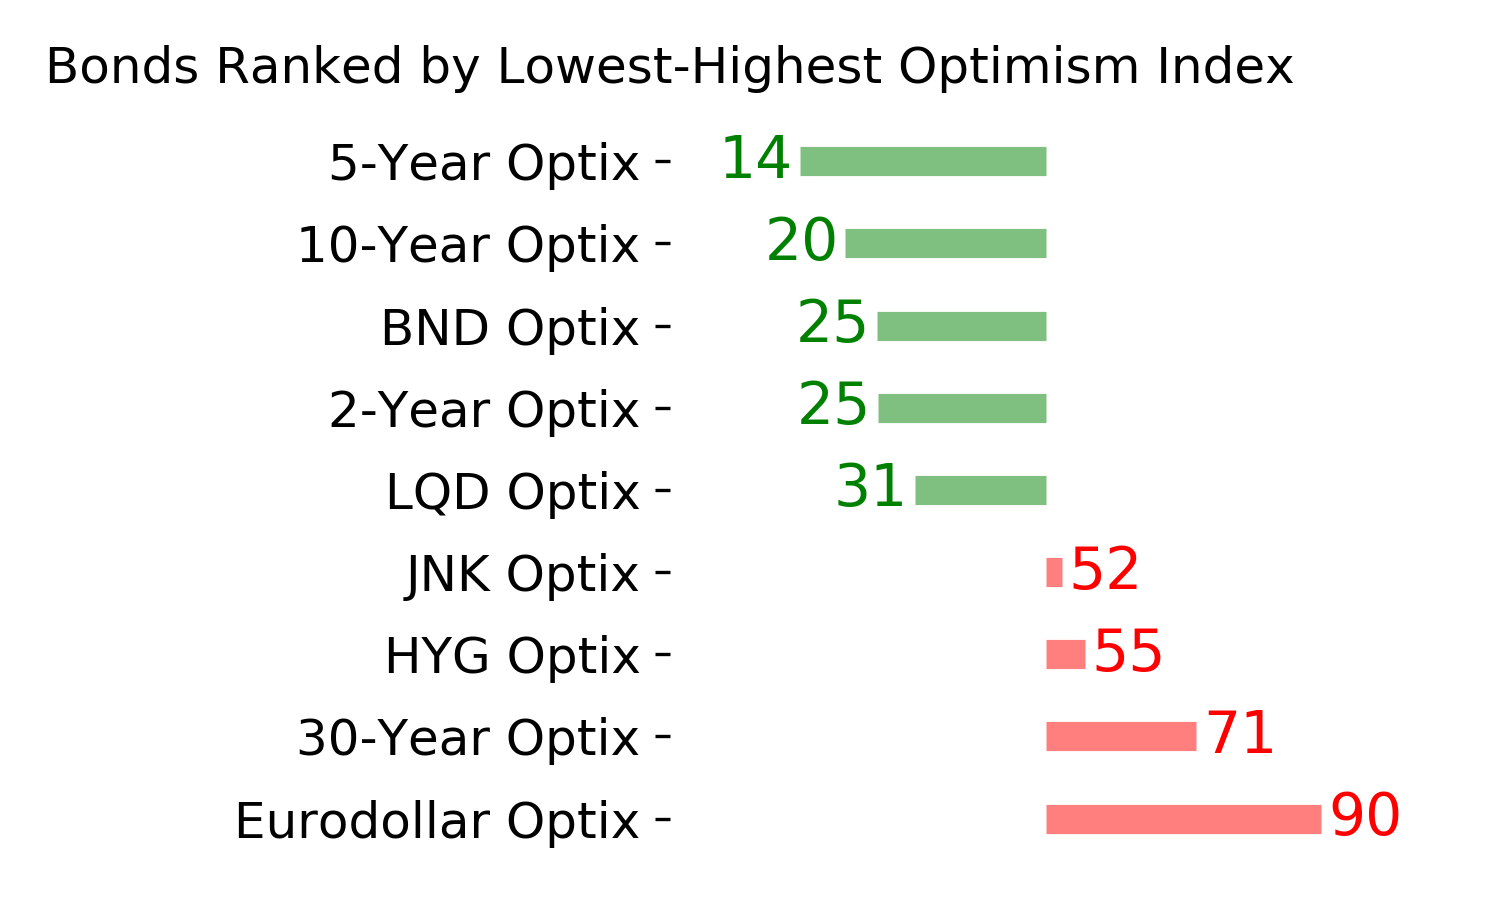
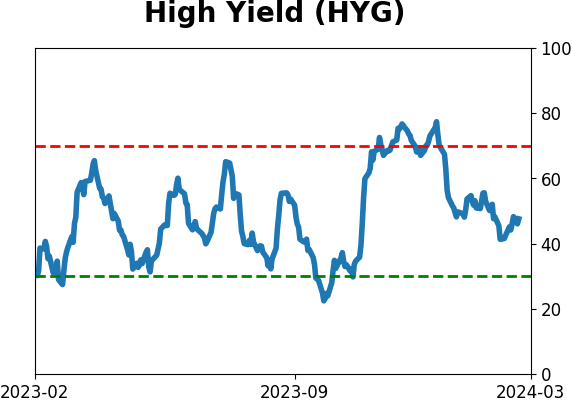
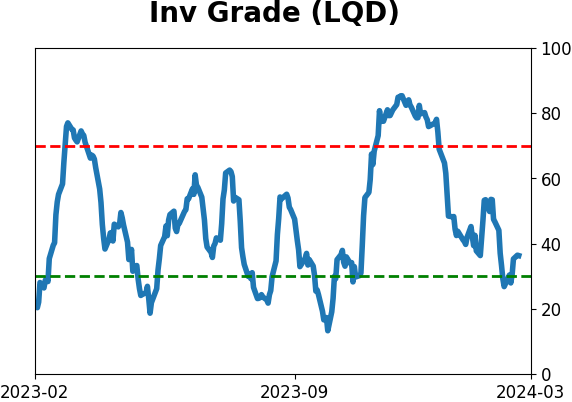
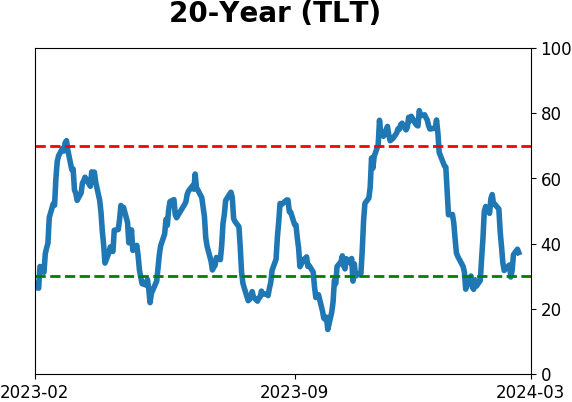
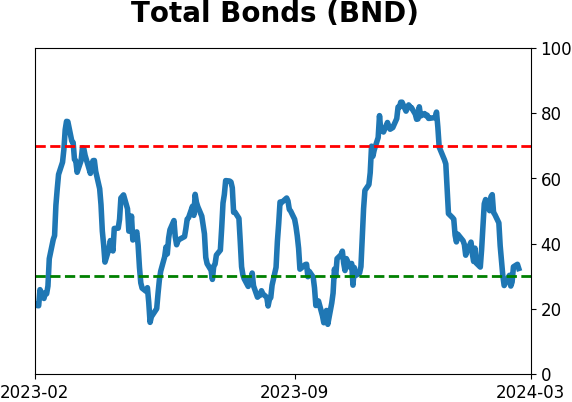
Bond ETF's - 10-Day Moving Average
|
|
|
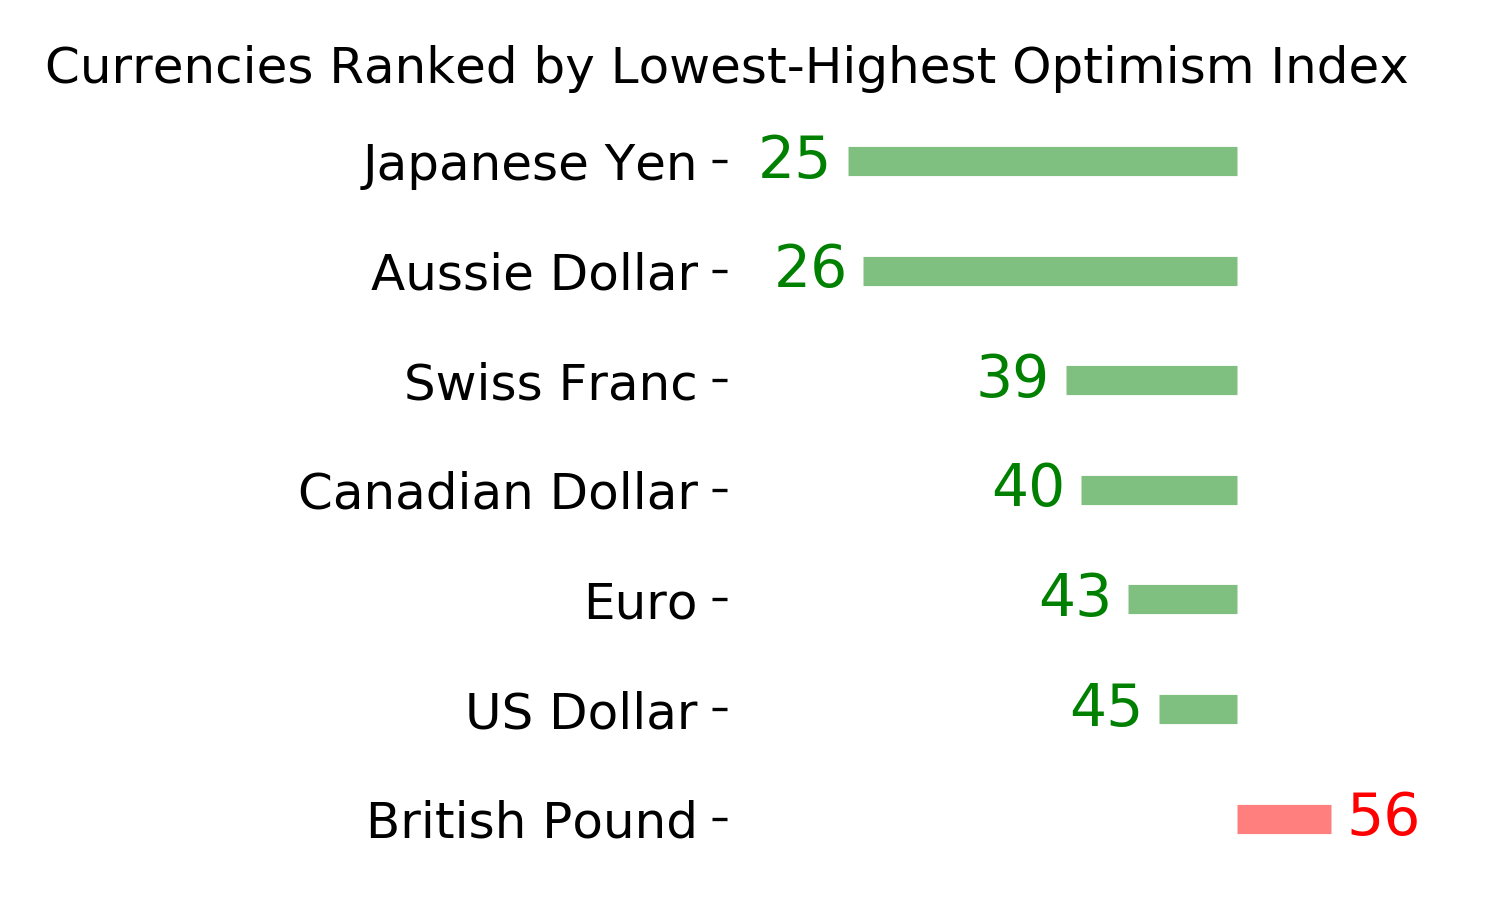
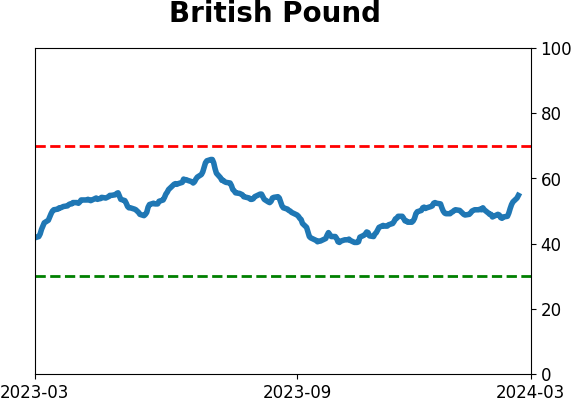
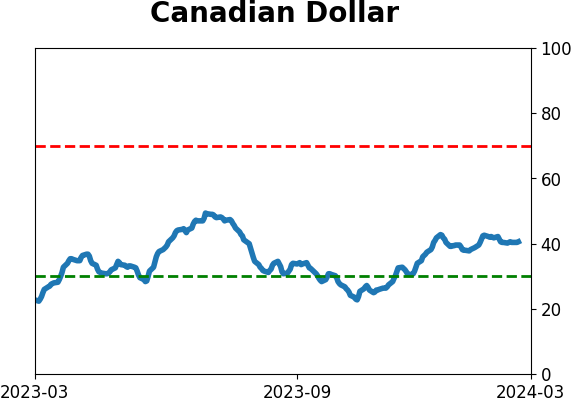
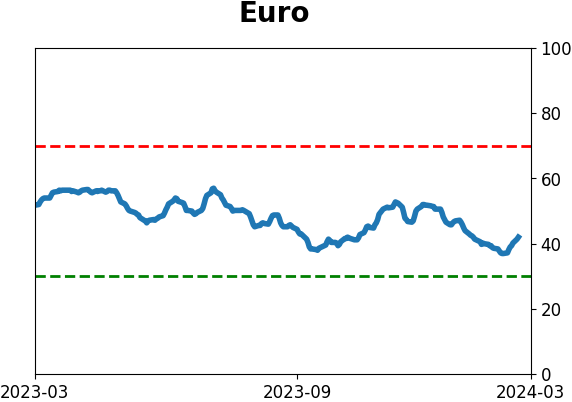
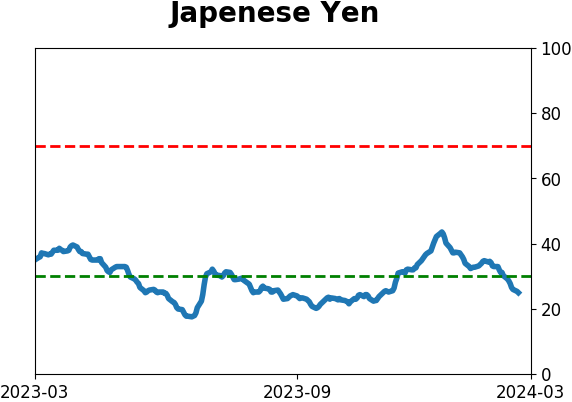
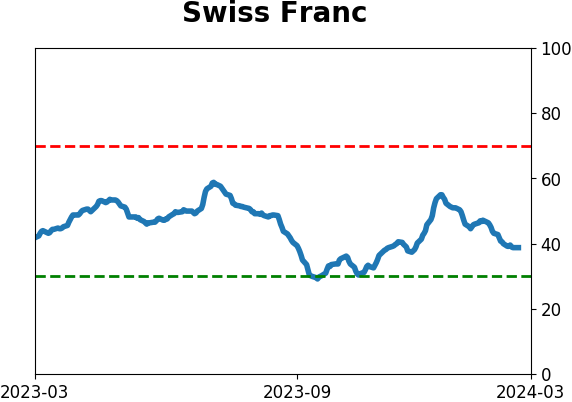
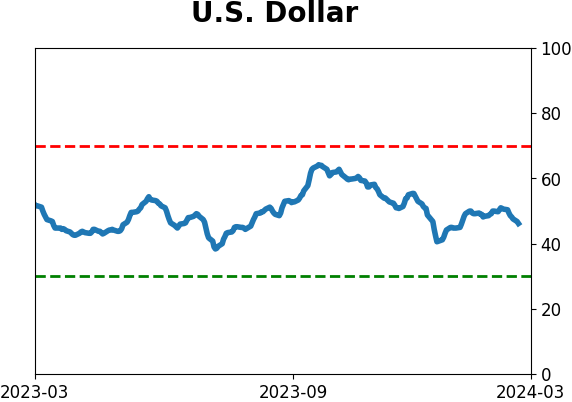
Currency ETF's - 5-Day Moving Average
|
|
|
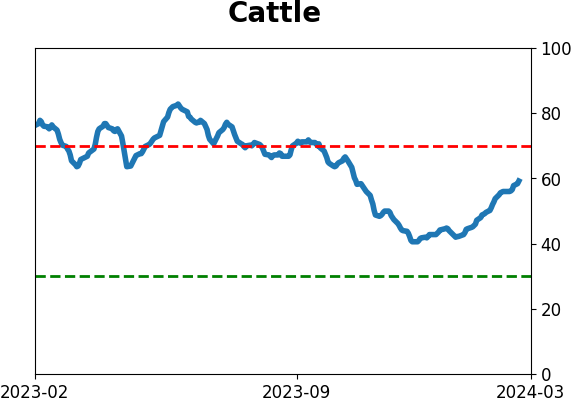
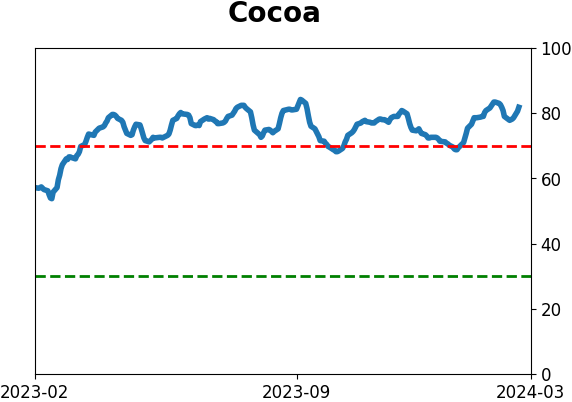
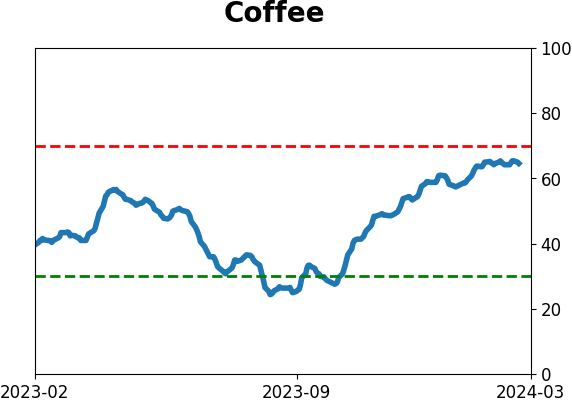
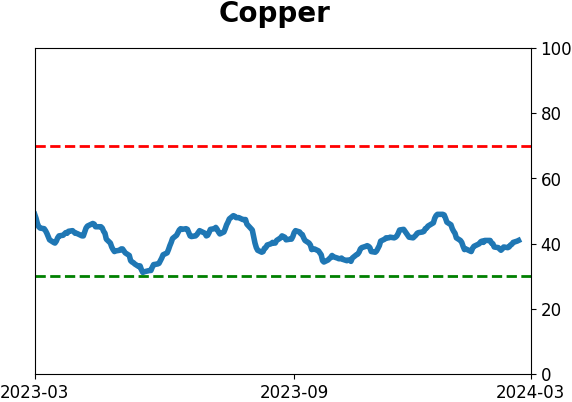
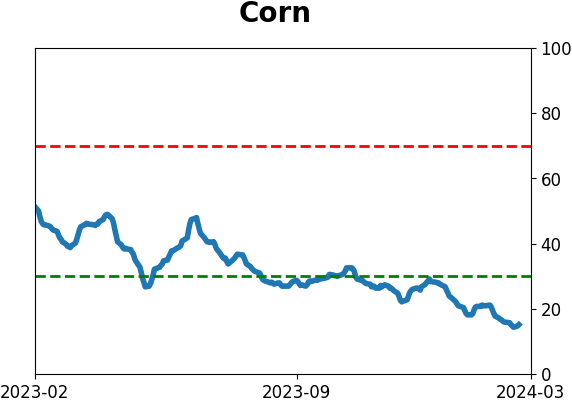
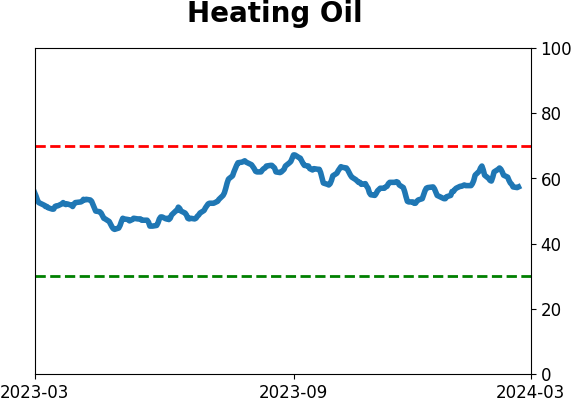
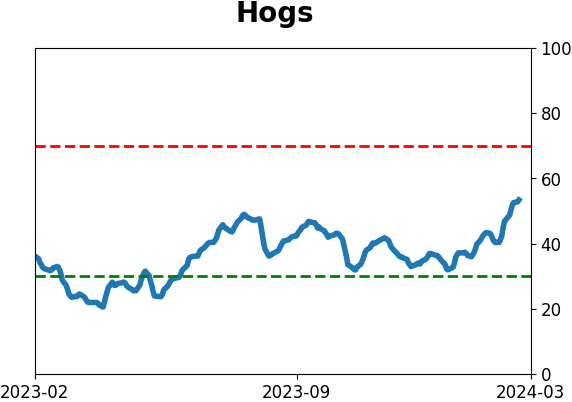
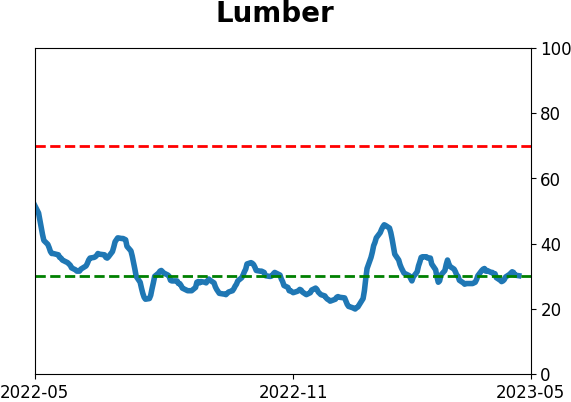
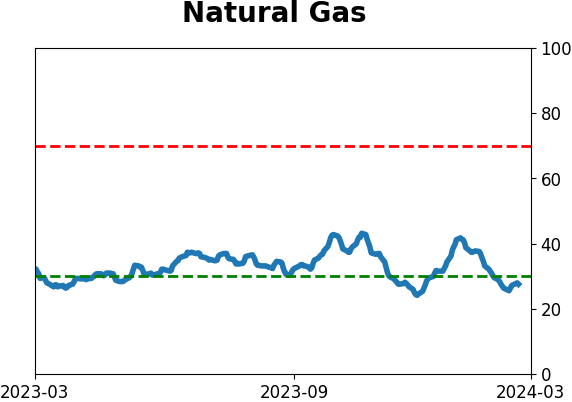
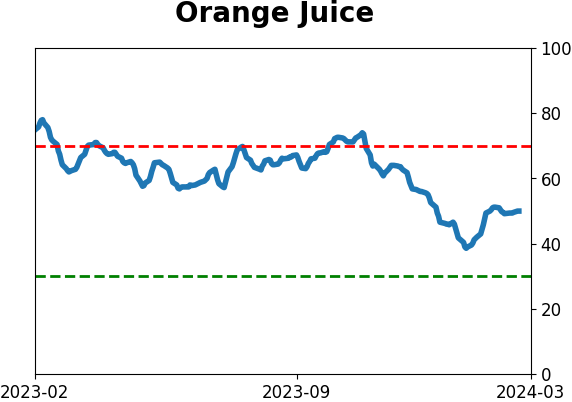
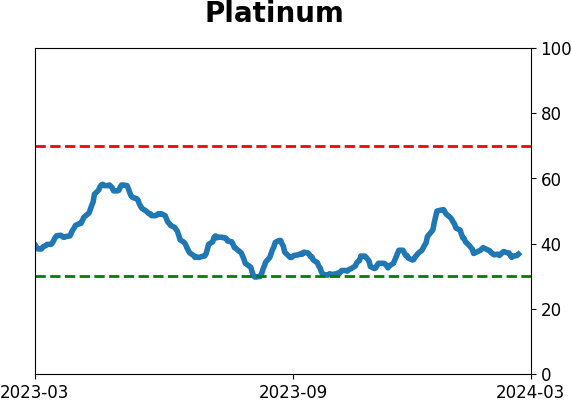
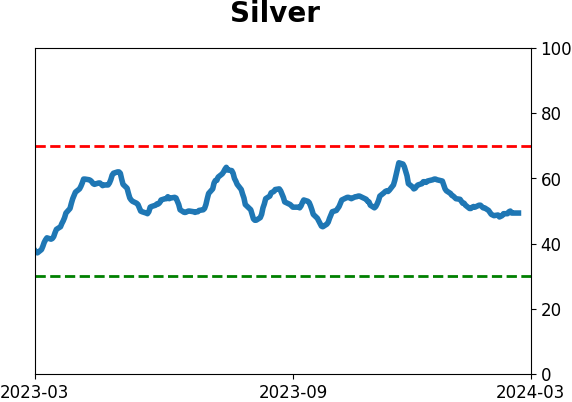
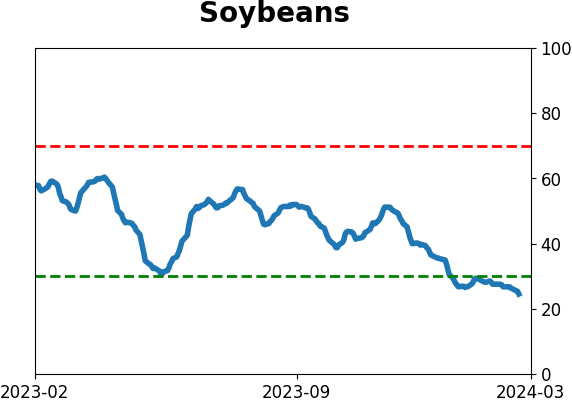
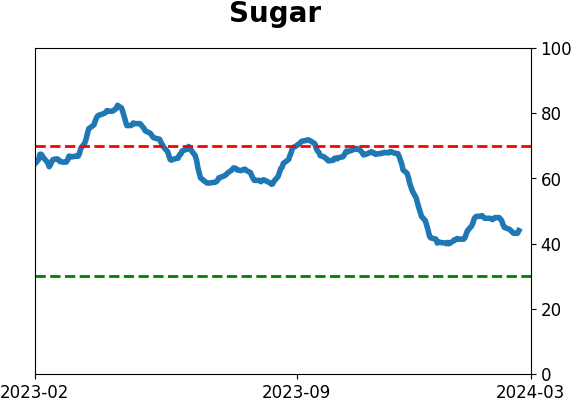
Commodity ETF's - 5-Day Moving Average
|
|