Headlines
|
|
An explosive end to a calm streak:
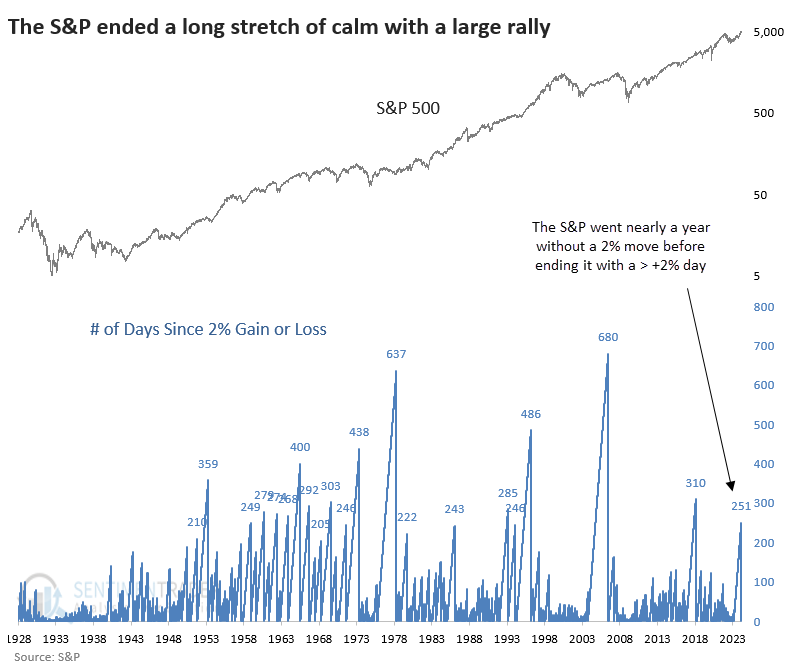
It had been nearly a year since the S&P 500 moved more than 2% in a day, but it did so last week by exploding higher. That kind of end to a long streak of calm has led to gains over the next year each time. The only worry is that the only instance when it occurred at a new high also corresponded with a medium-term peak in stocks.
|
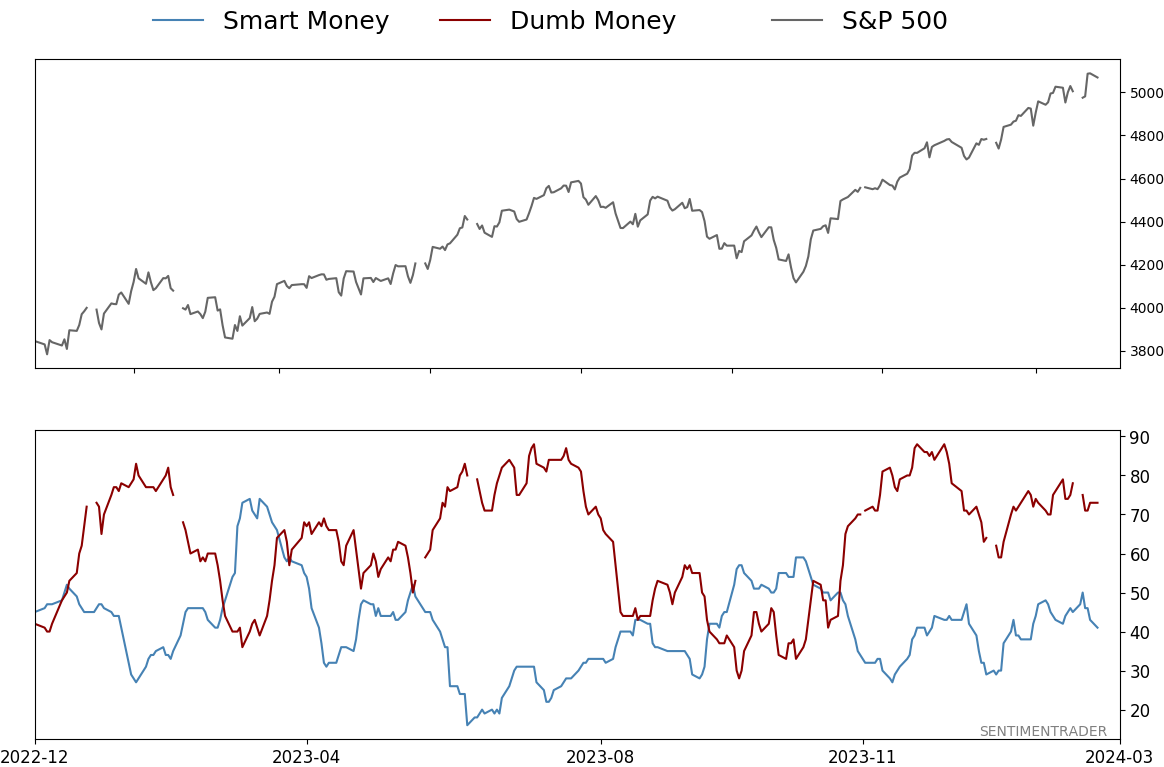
Smart / Dumb Money Confidence
|
Smart Money Confidence: 41%
Dumb Money Confidence: 73%
|
|
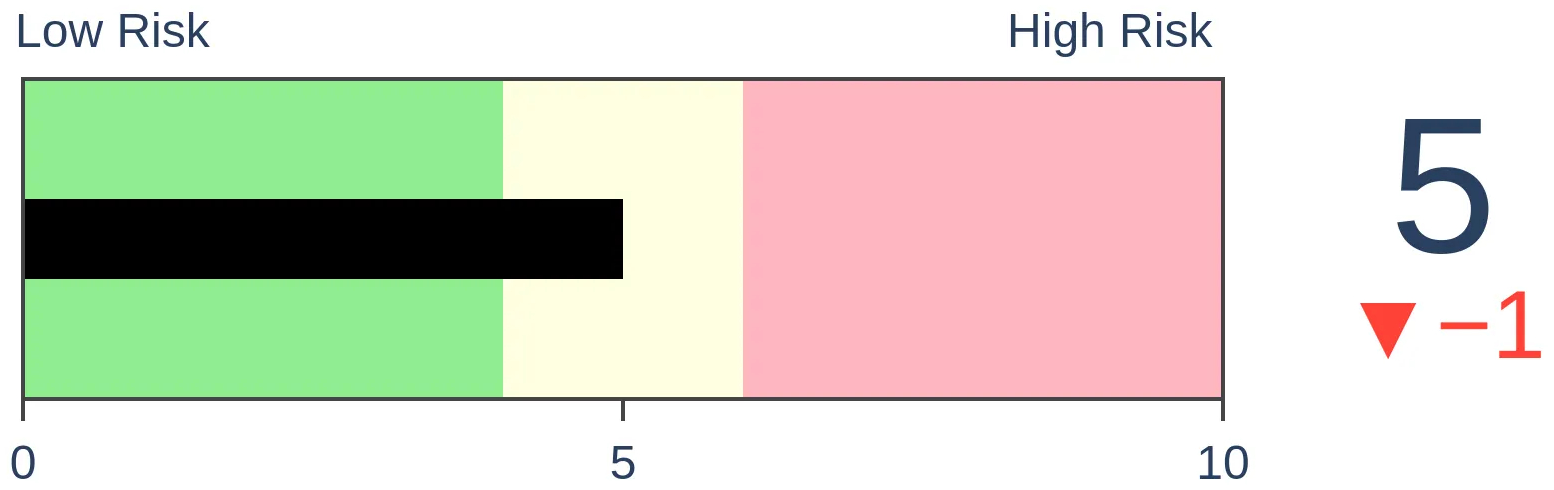
Risk Levels
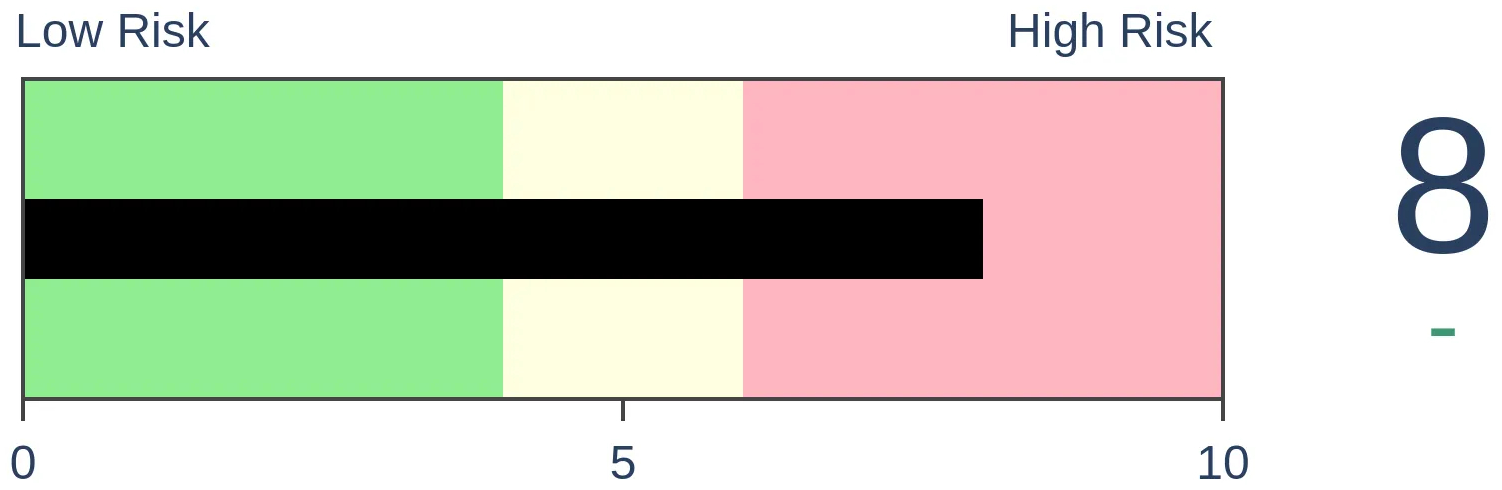
Stocks Short-Term
|
Stocks Medium-Term
|
|
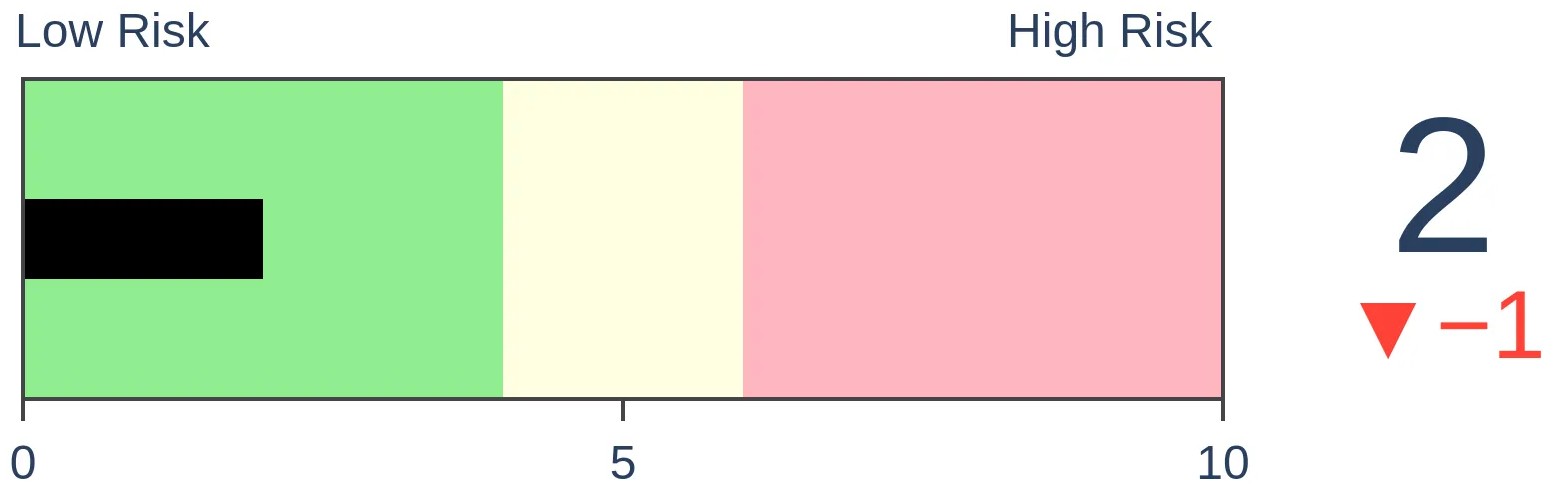
Bonds
|
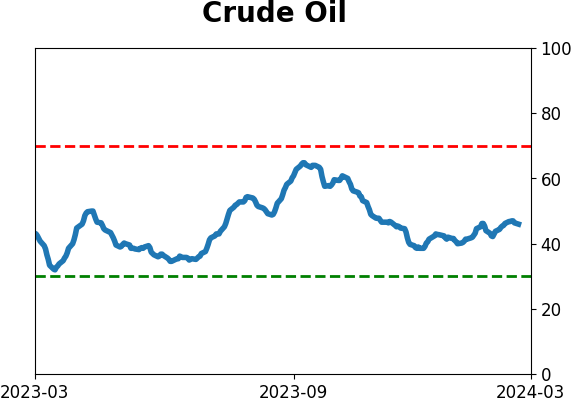
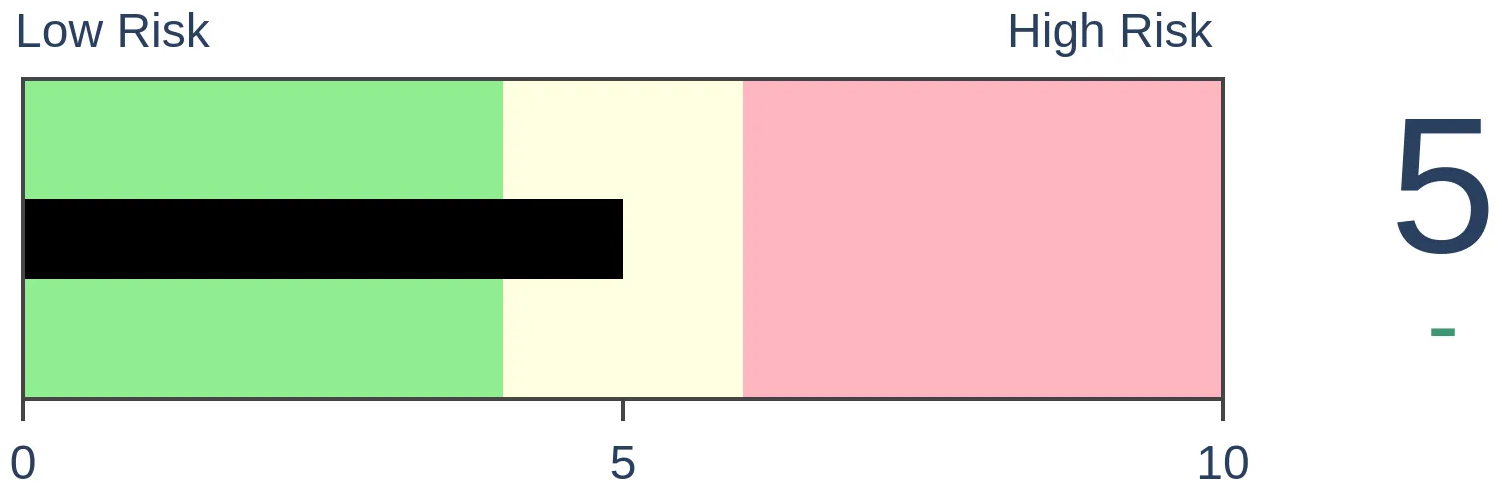
Crude Oil
|
|
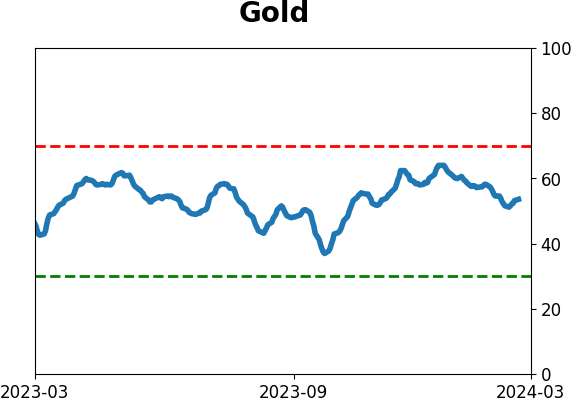
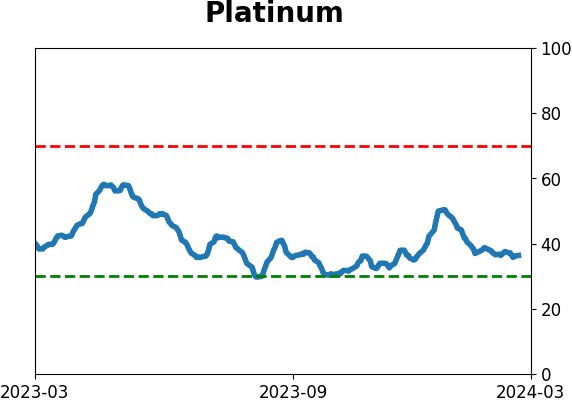
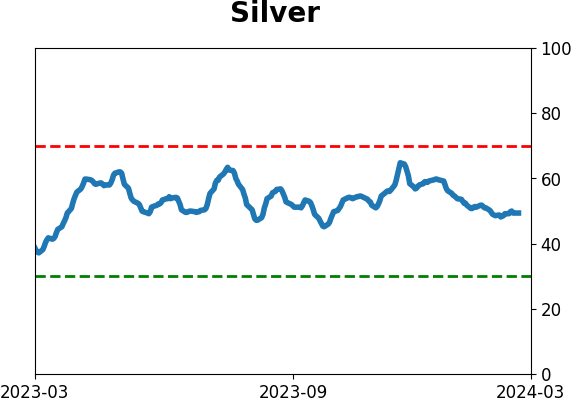
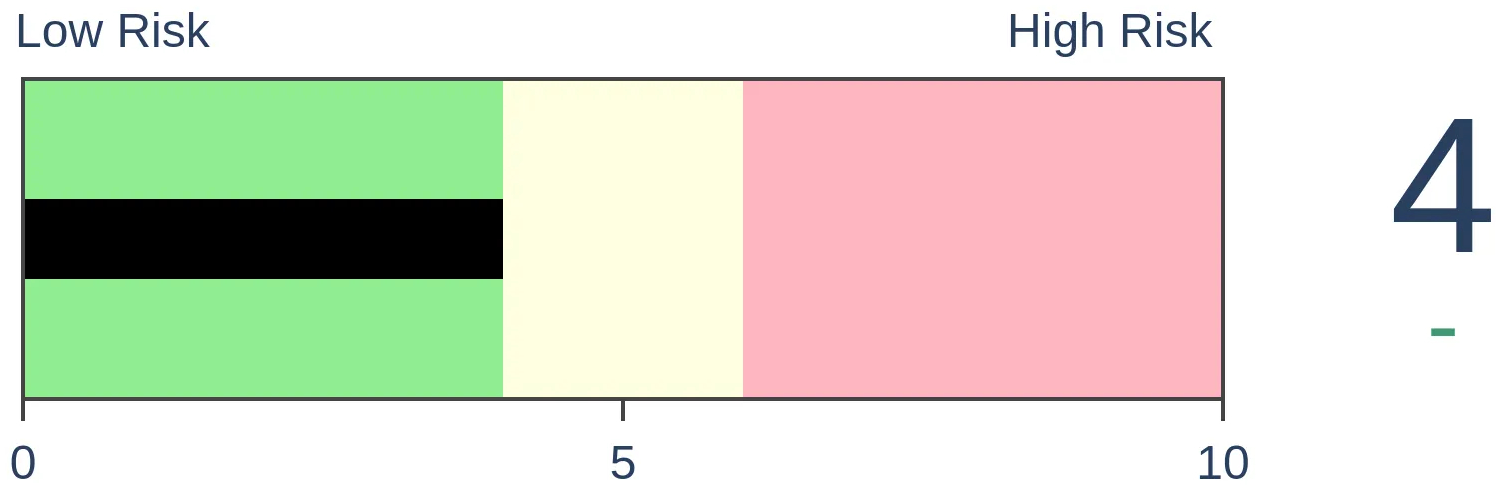
Gold
|
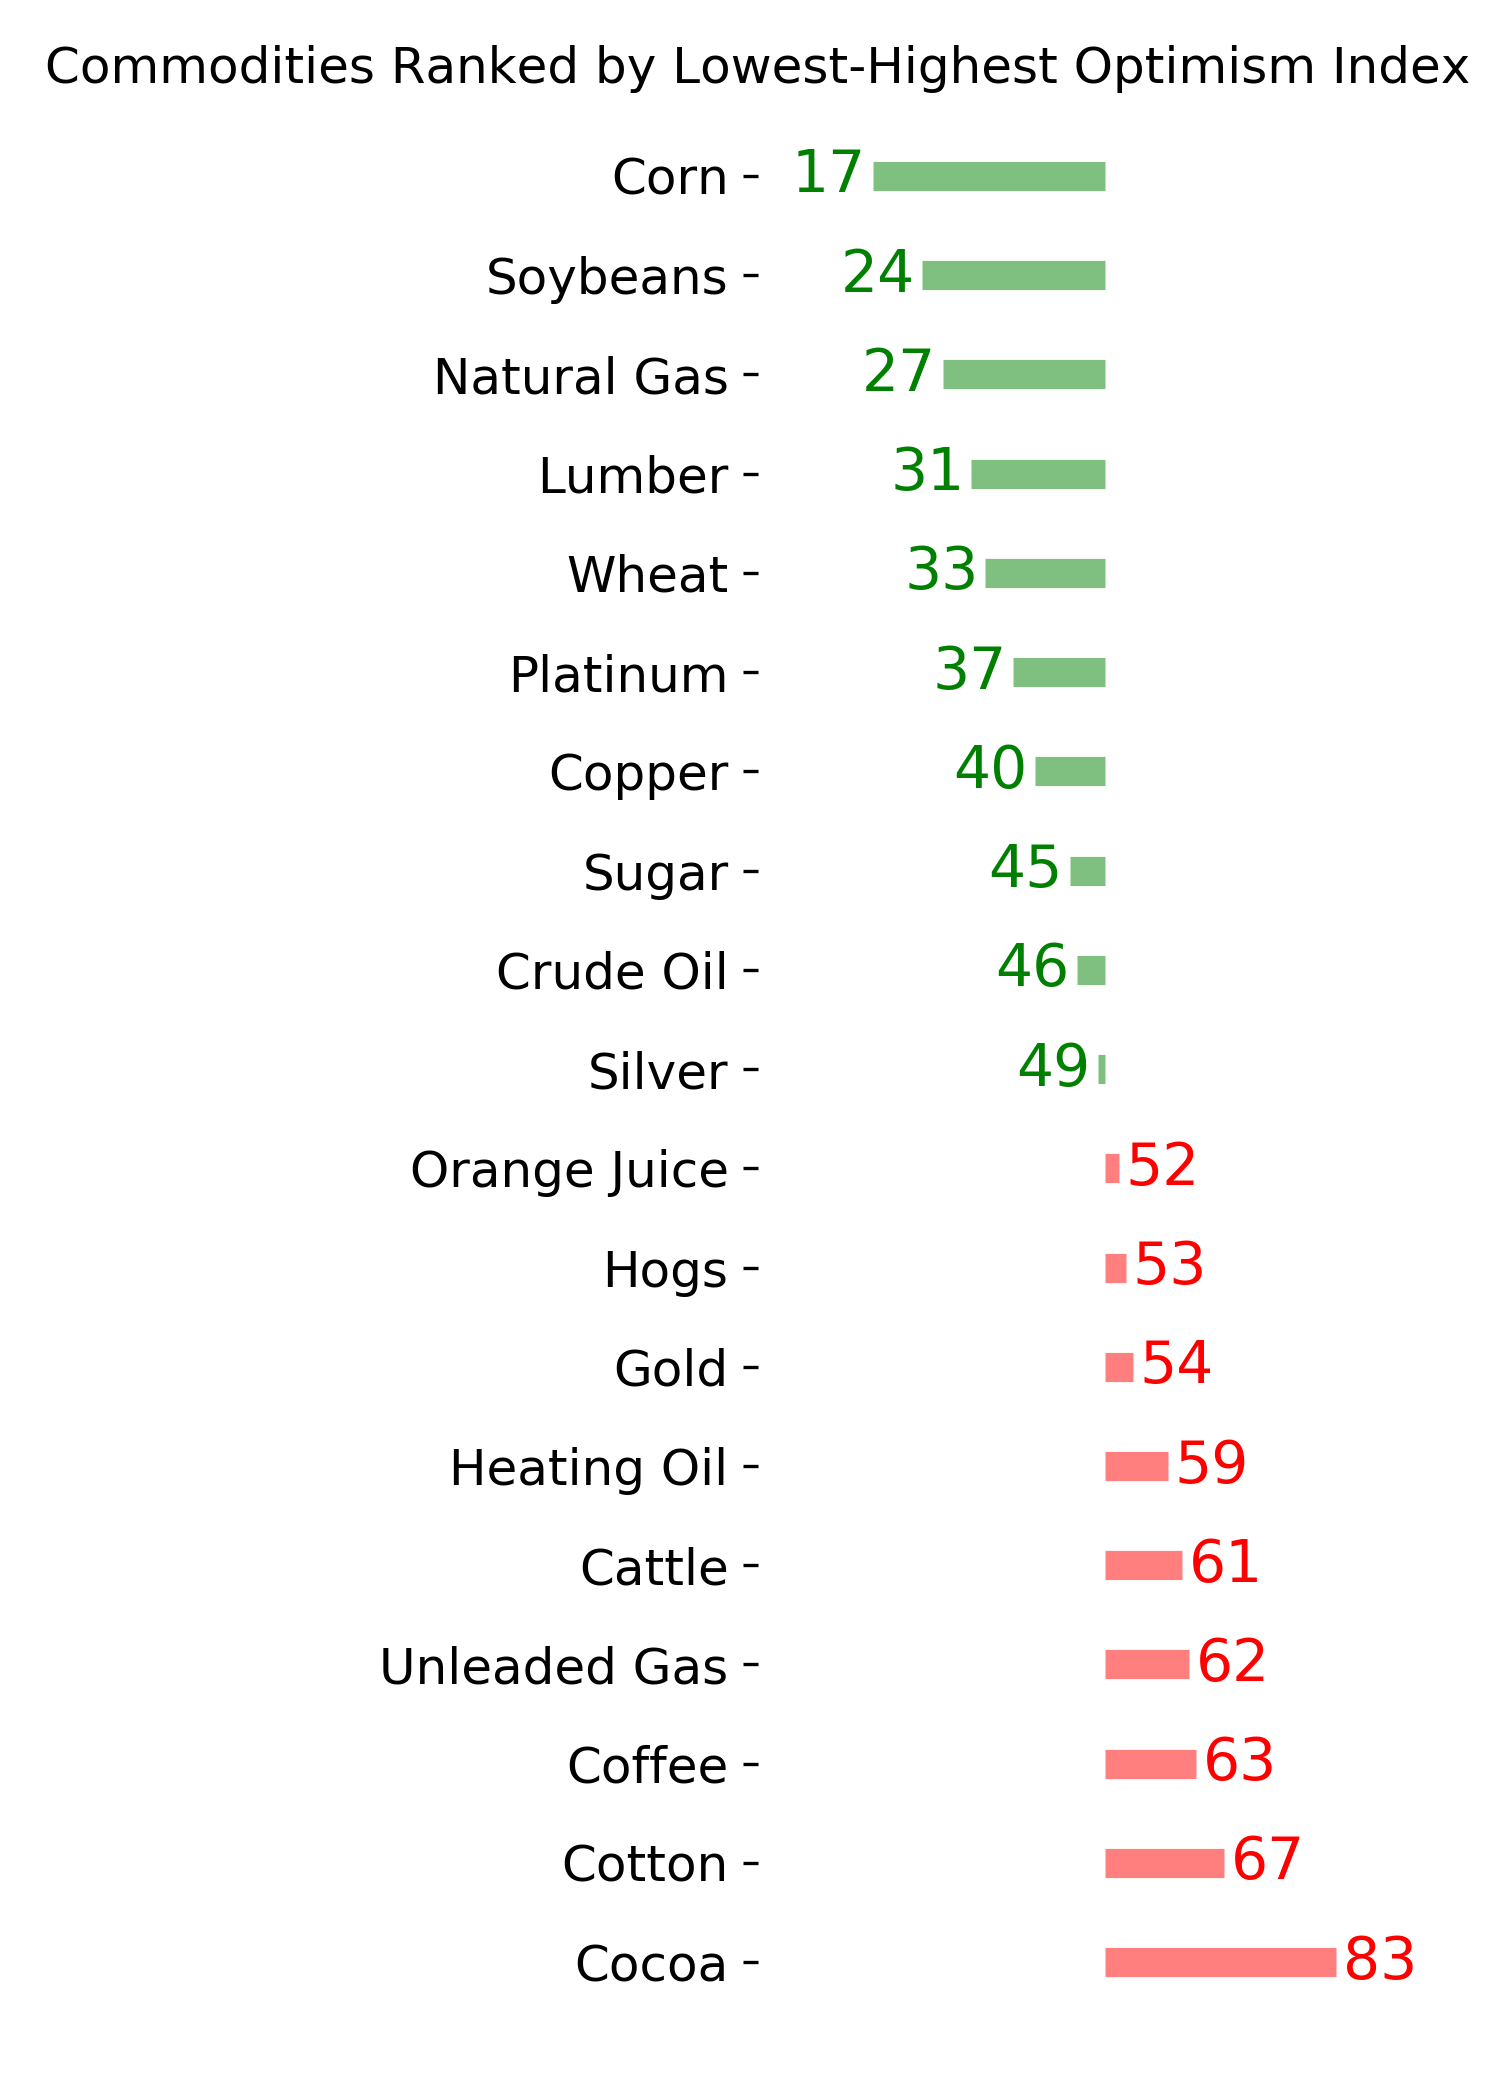
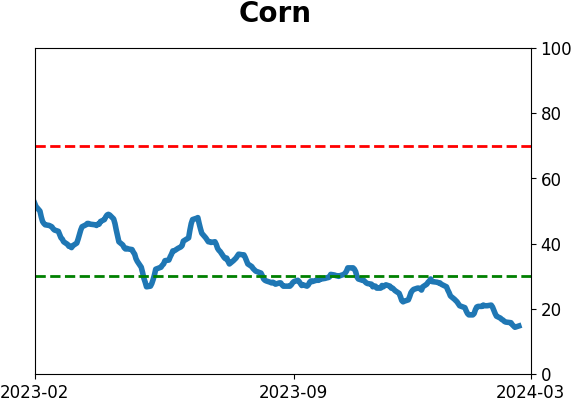
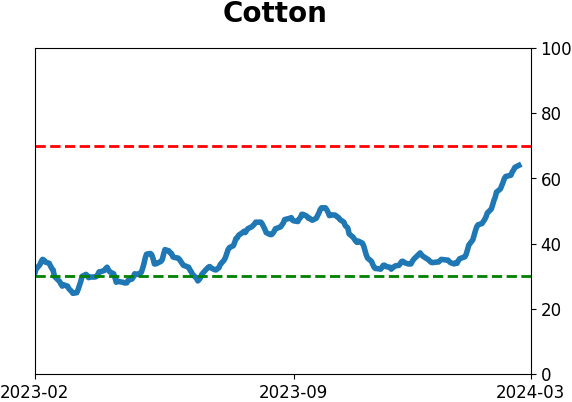
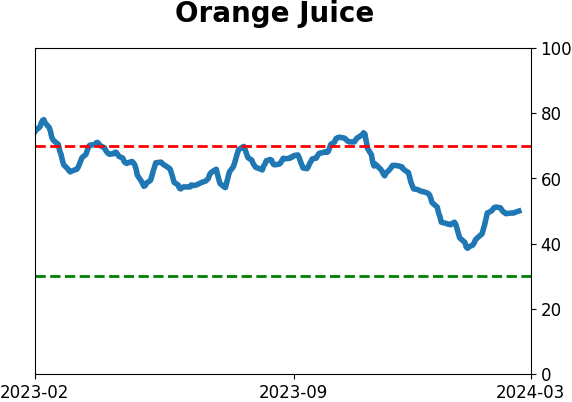
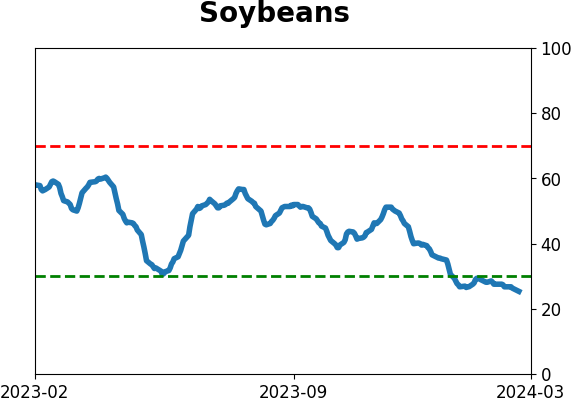
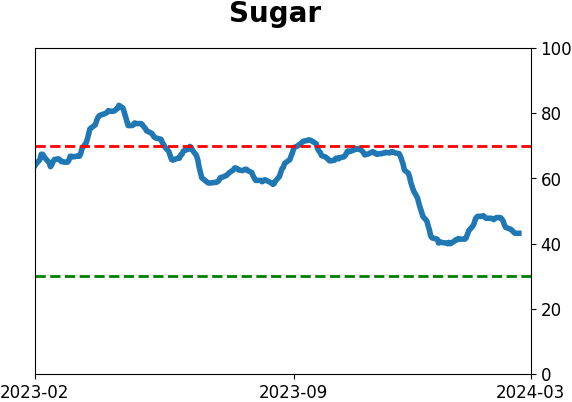
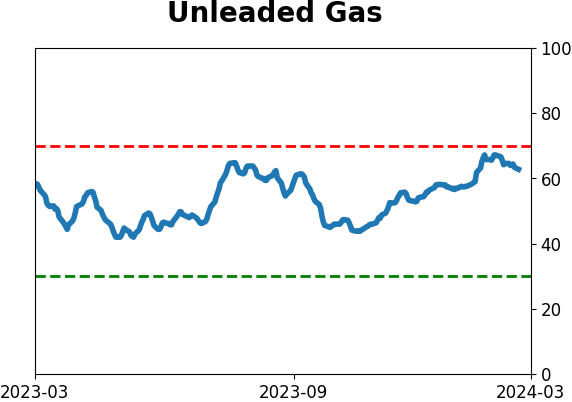
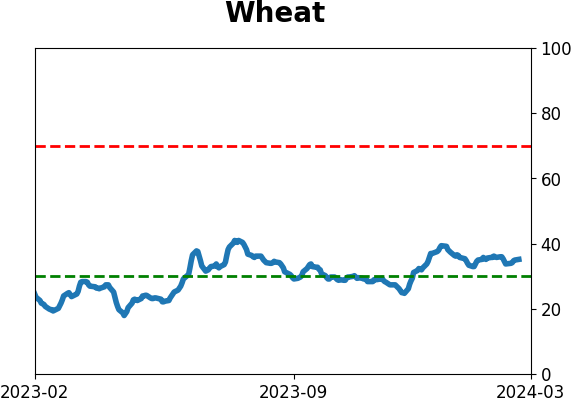
Agriculture

|
|
Research
By Jason Goepfert
BOTTOM LINE
It had been nearly a year since the S&P 500 moved more than 2% in a day, but it did so last week by exploding higher. That kind of end to a long streak of calm has led to gains over the next year each time. The only worry is that the only instance when it occurred at a new high also corresponded with a medium-term peak in stocks.
FORECAST / TIMEFRAME
None
|
Key points:
- The S&P 500 went nearly a full year without a +/- 2% daily change
- That ended last week with an explosive move higher
- Similar behavior led to gains over the next year every time, with one caveat
The S&P ended a long calm period by exploding higher
We've seen recently that the most benchmarked index in the world has enjoyed one of the longest-ever stretches of calm moves while tacking on significant gains.
It finally ended that period of calm, but not in the usual way. Instead of volatility rising by stocks dropping, it did the opposite. The S&P ended one of its longest-ever stretches without a +/- 2% daily change by rallying strongly on the back of NVDA's earnings report.
When the S&P ended a long streak of six months or more without a 2% move by exploding higher, it tended to do okay. Follow-though over the short-term was good, while relaxing somewhat over the medium term. A few preceded significant losses, but overall, risk tended to be contained. Over the next year, the index rose after every signal.
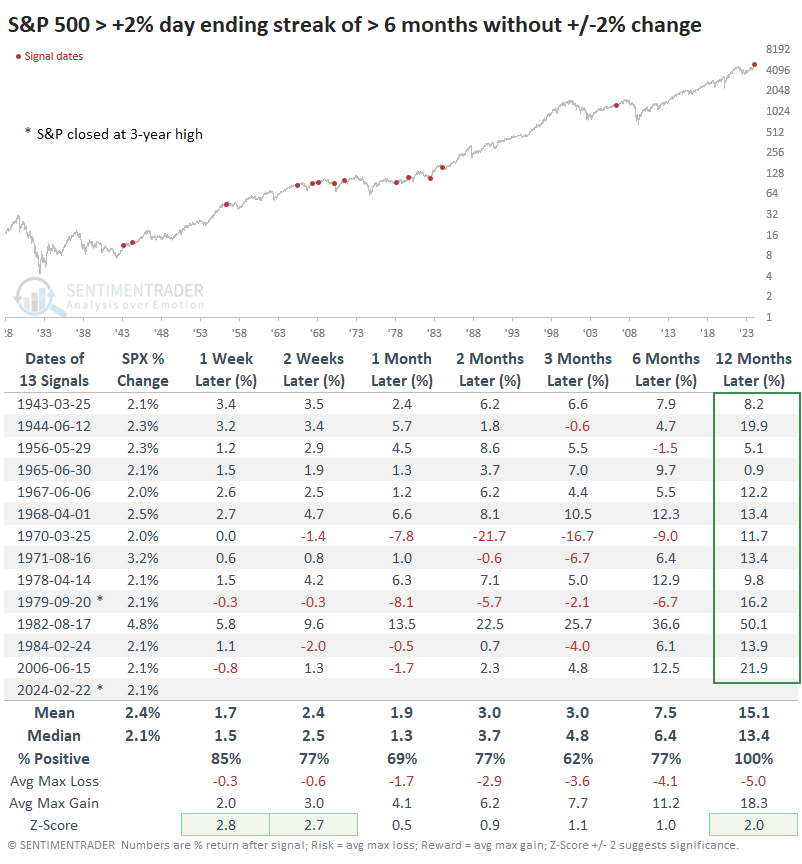
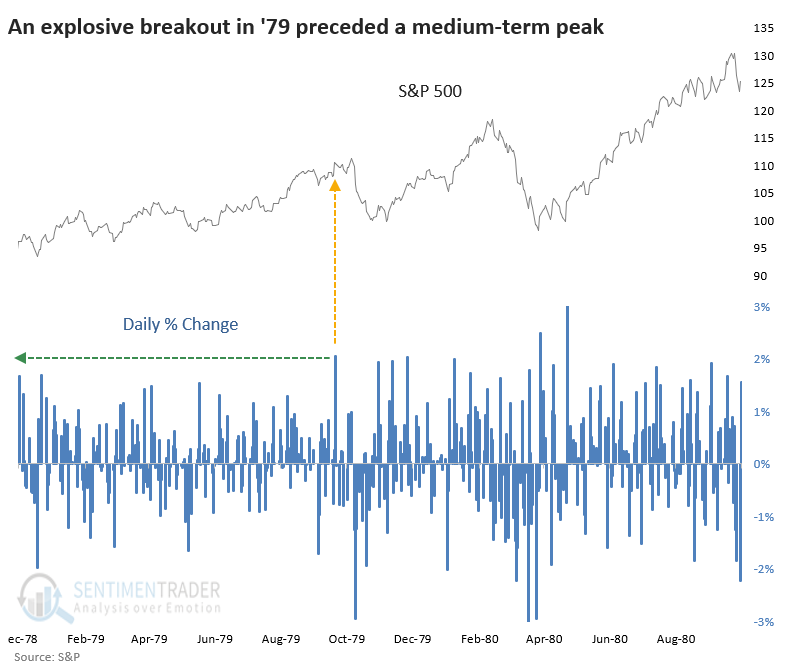
One thing to note is the asterisks. Those highlight the only times the S&P ended a streak like this by exploding higher and recording a multi-year high. Our current instance is the only one besides September 1979. That one happened to mark a multi-month exhaustion point.
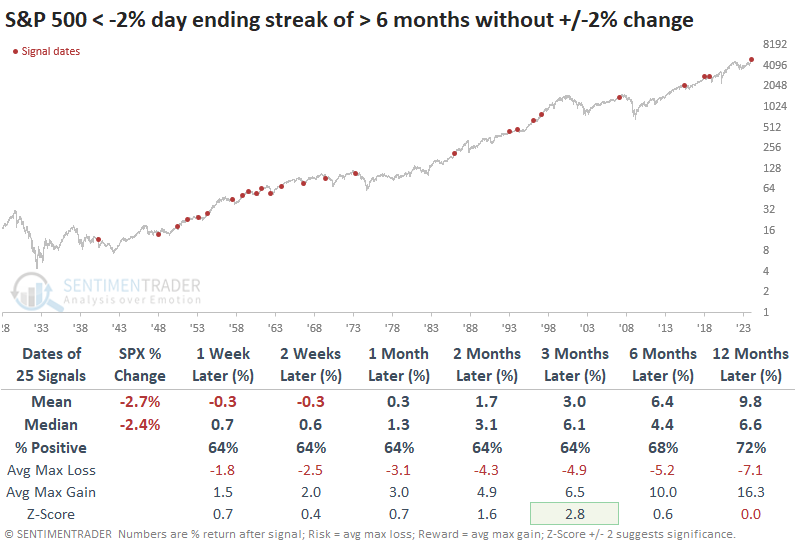
We like to look at counter-examples to see how abnormal the samples are. The table below summarizes returns after the S&P ended a long streak of calm by recording a -2% down day. Those returns tended to be worse across almost all time frames, with higher risk and lower reward.
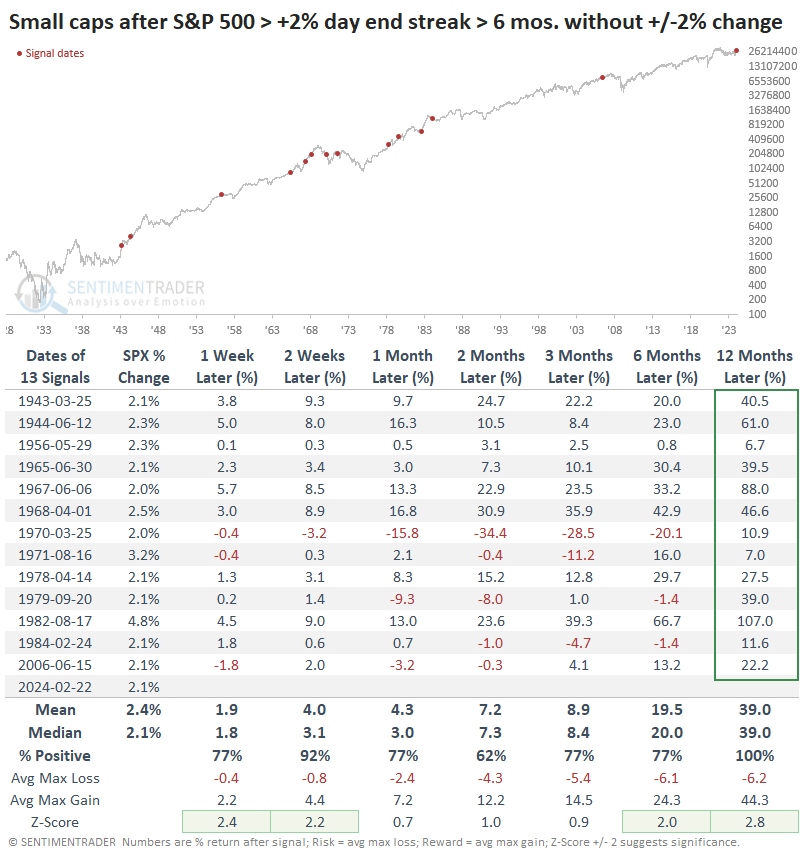
Ironically, small stocks tended to benefit the most from explosive moves in large ones
Among sectors and factors, technology stocks tended to do quite well after these explosive outbreaks in the S&P. Ironically, so did small cap stocks.
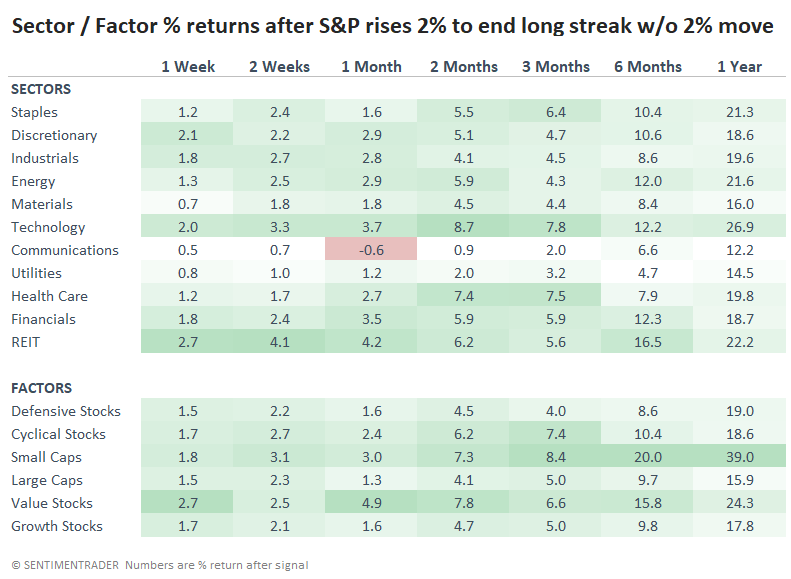
The table below shows the total return in small-cap stocks after these big breakouts in the S&P 500. Over the next year, the stocks sported a healthy median return of +39.0%, with a ridiculously skewed reward-to-risk ratio.
What the research tells us...
Several technical warning signs have been popping up over the past month or so, yet the indexes continue to recover quickly from even the slightest pullback. Many of those technical warnings were quickly alleviated by smaller stocks picking up some slack and propelling broader indexes to new highs. This is classic bull market behavior.
About the most negative aspect in stocks right now is that they've been doing so well that medium-term returns tend to be muted and the risk/reward about even or a little worse. That doesn't mean much for investors with a longer time horizon than a few months. And the fact that the most widely benchmarked index in the world broke out of a long stretch without a large daily change by exploding to the upside further confirms this behavior. Similar activity preceded gains over the next year every time, and that's hard evidence to argue against.
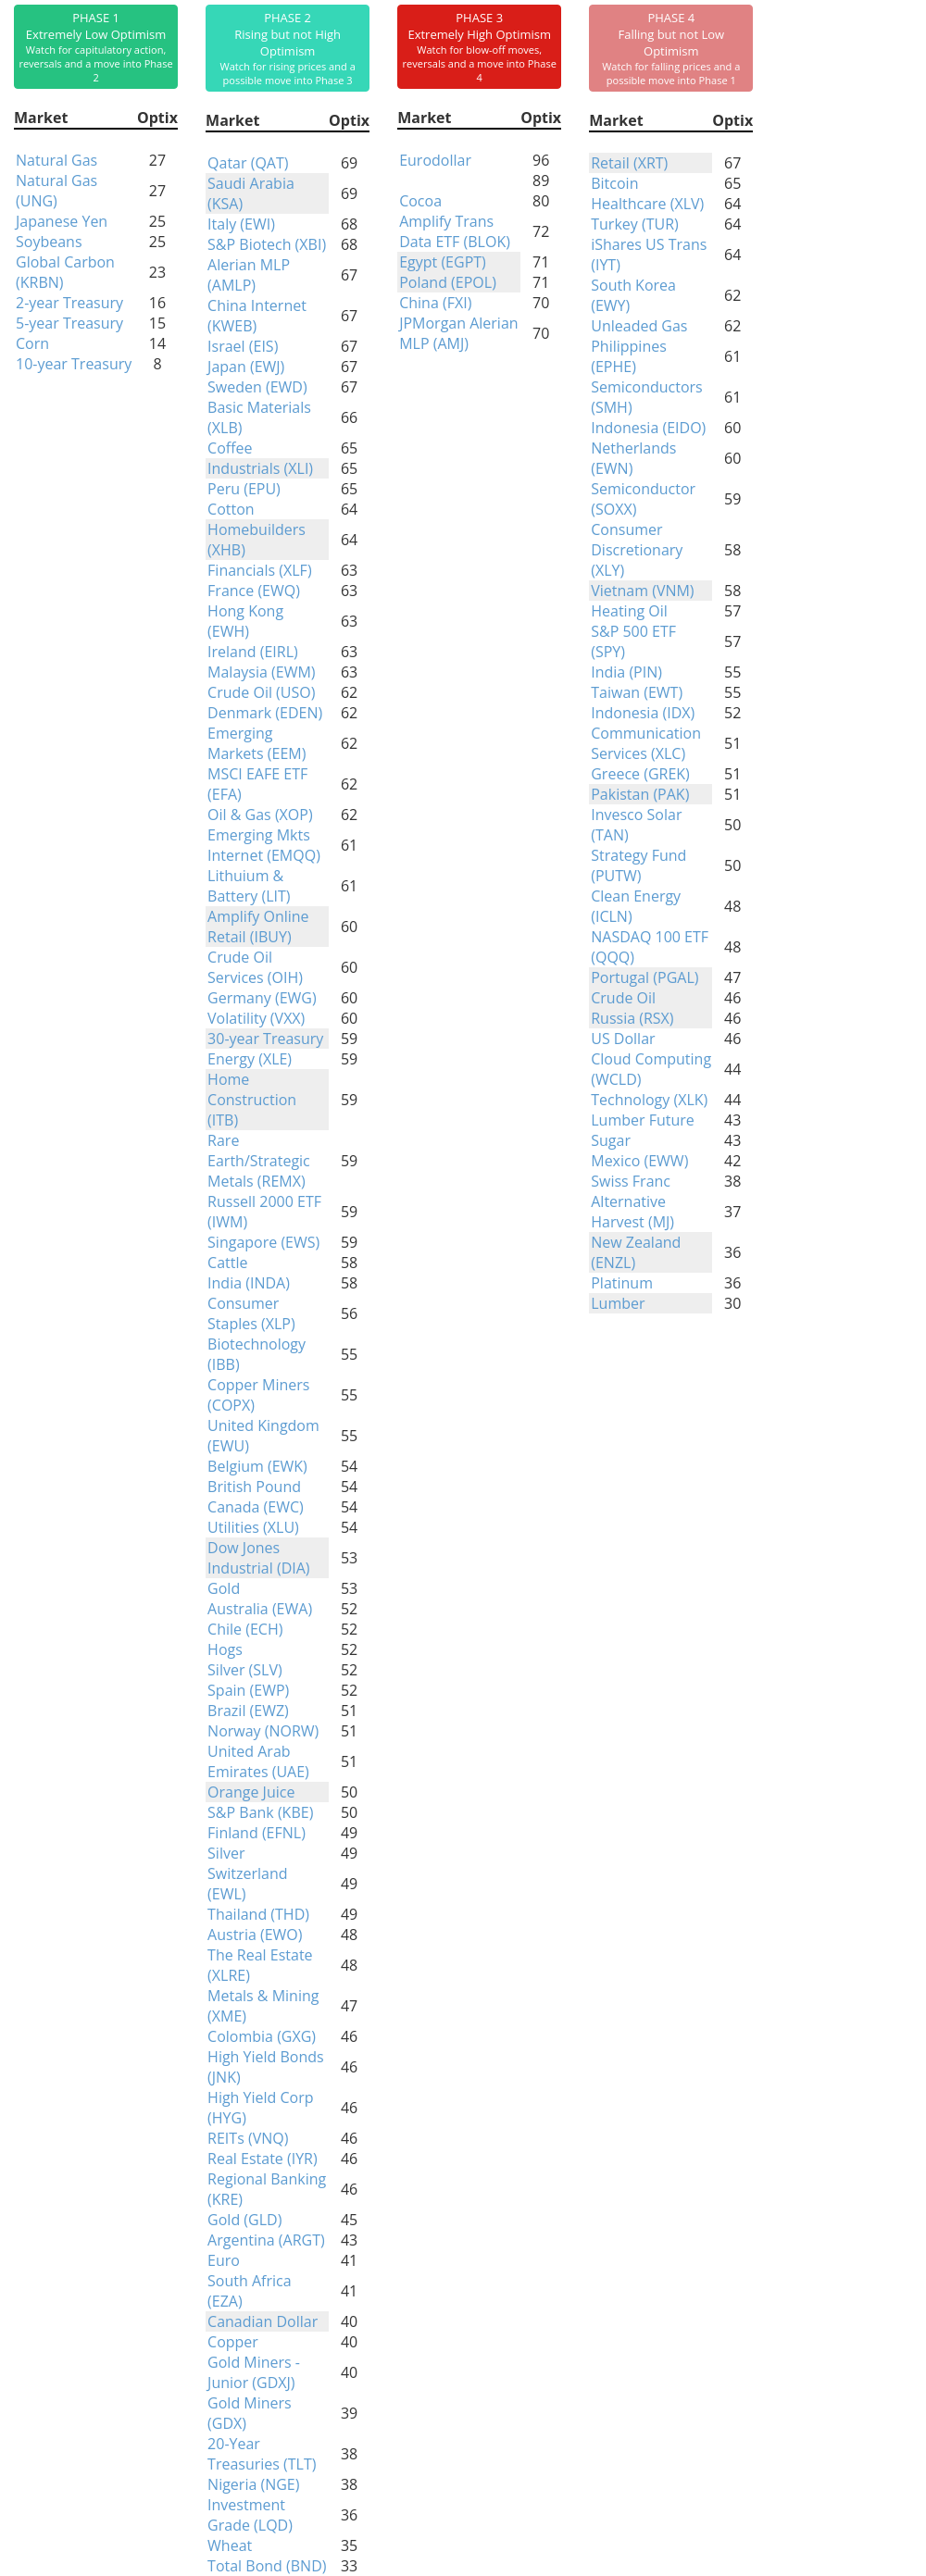
Indicators at Extremes
Phase Table
Ranks
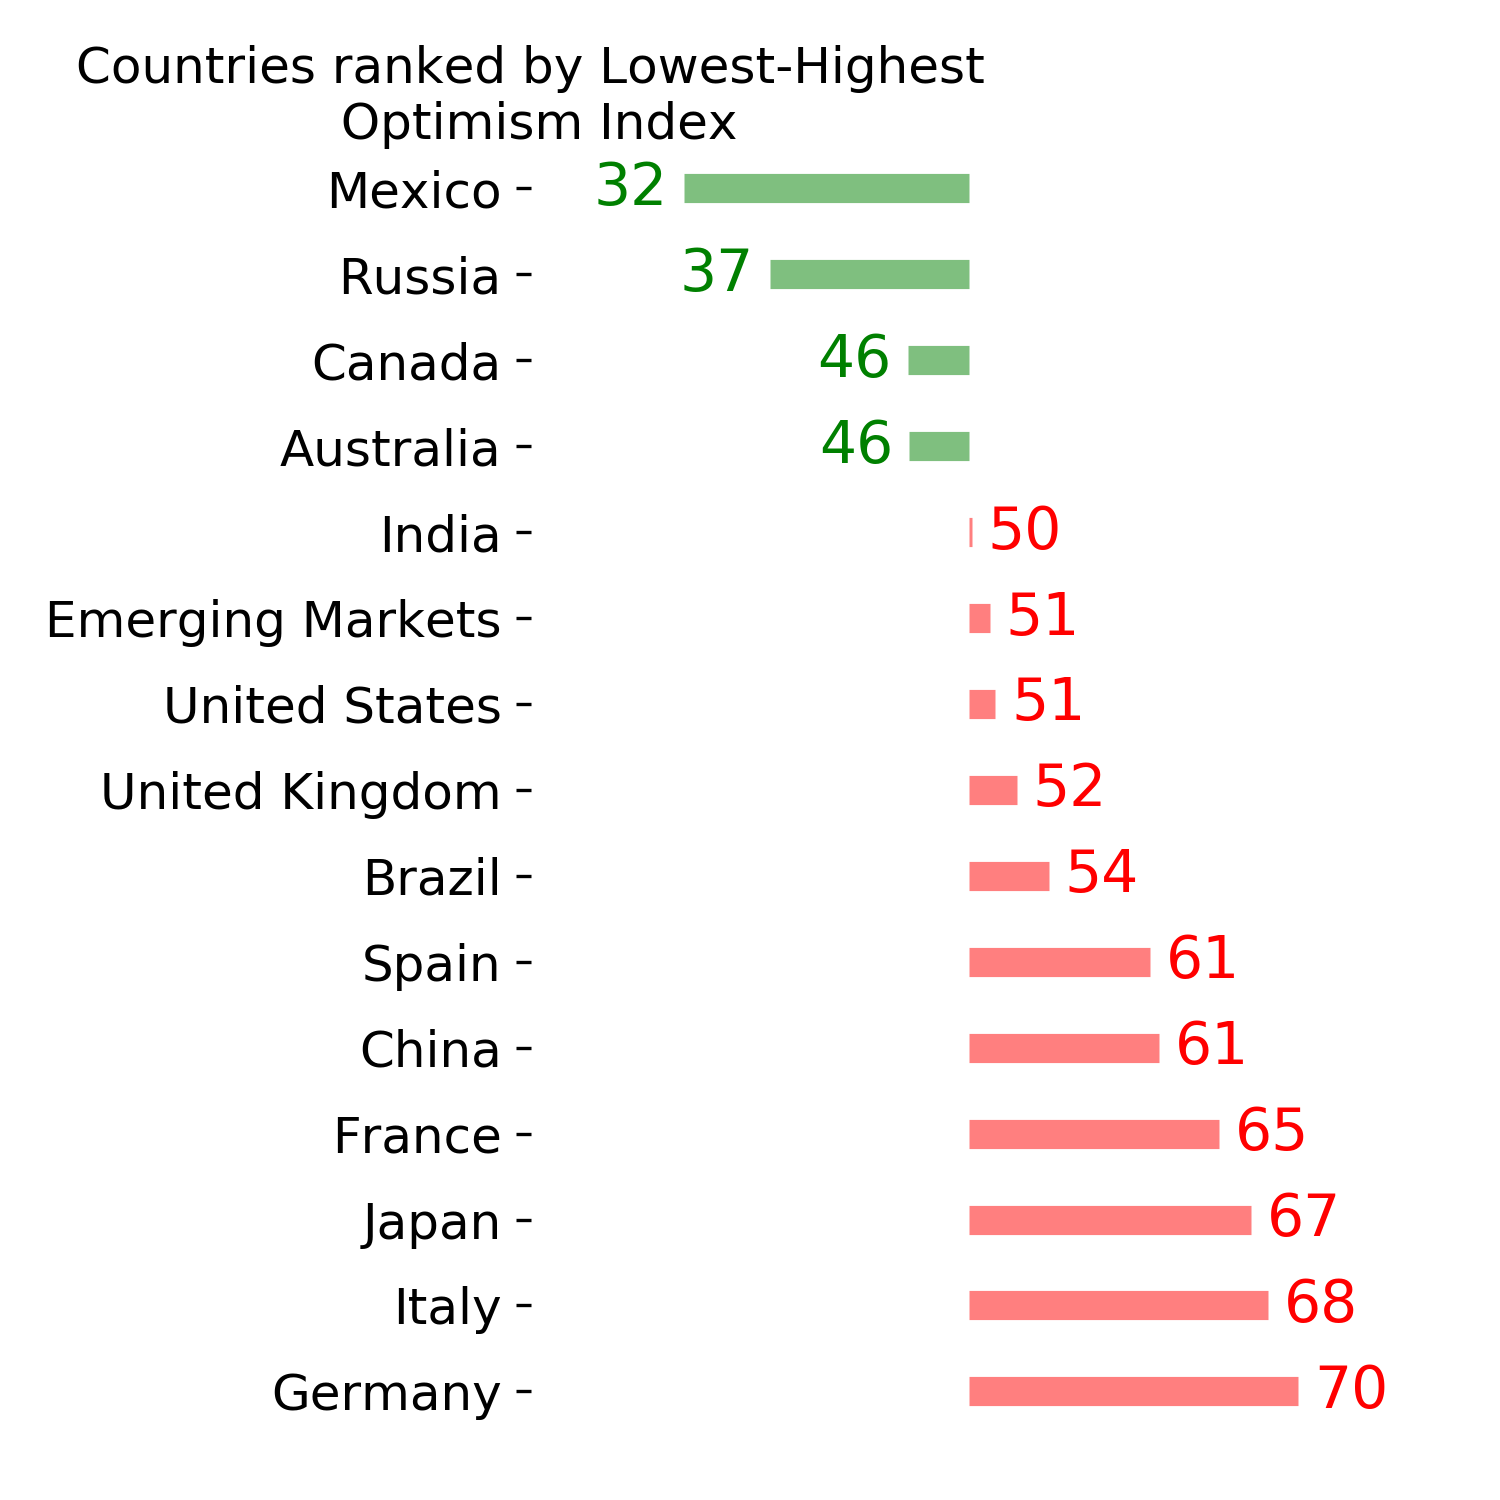
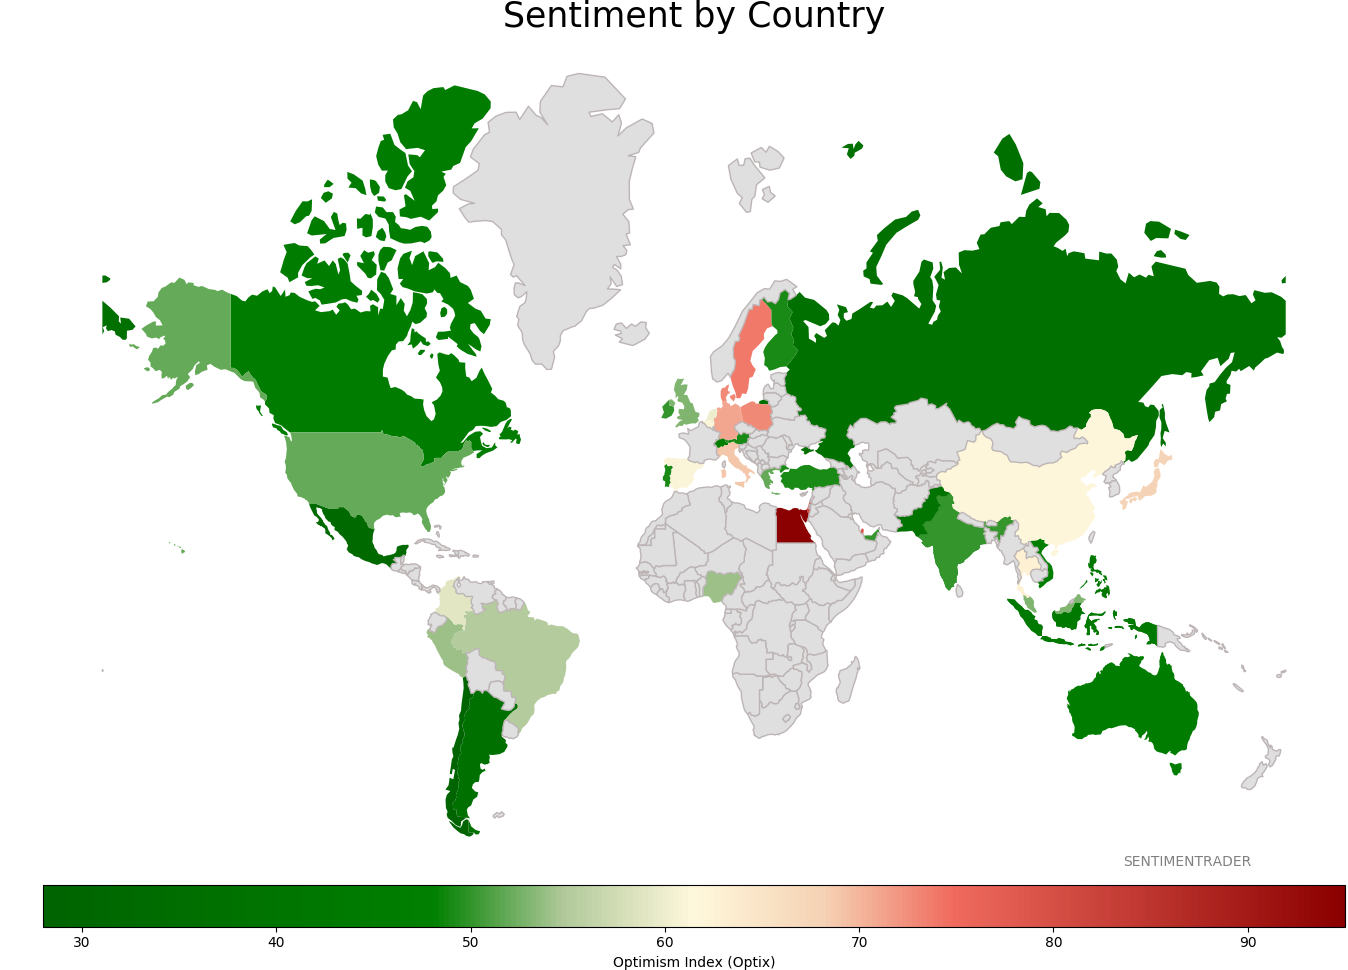
Sentiment Around The World
Optimism Index Thumbnails
|
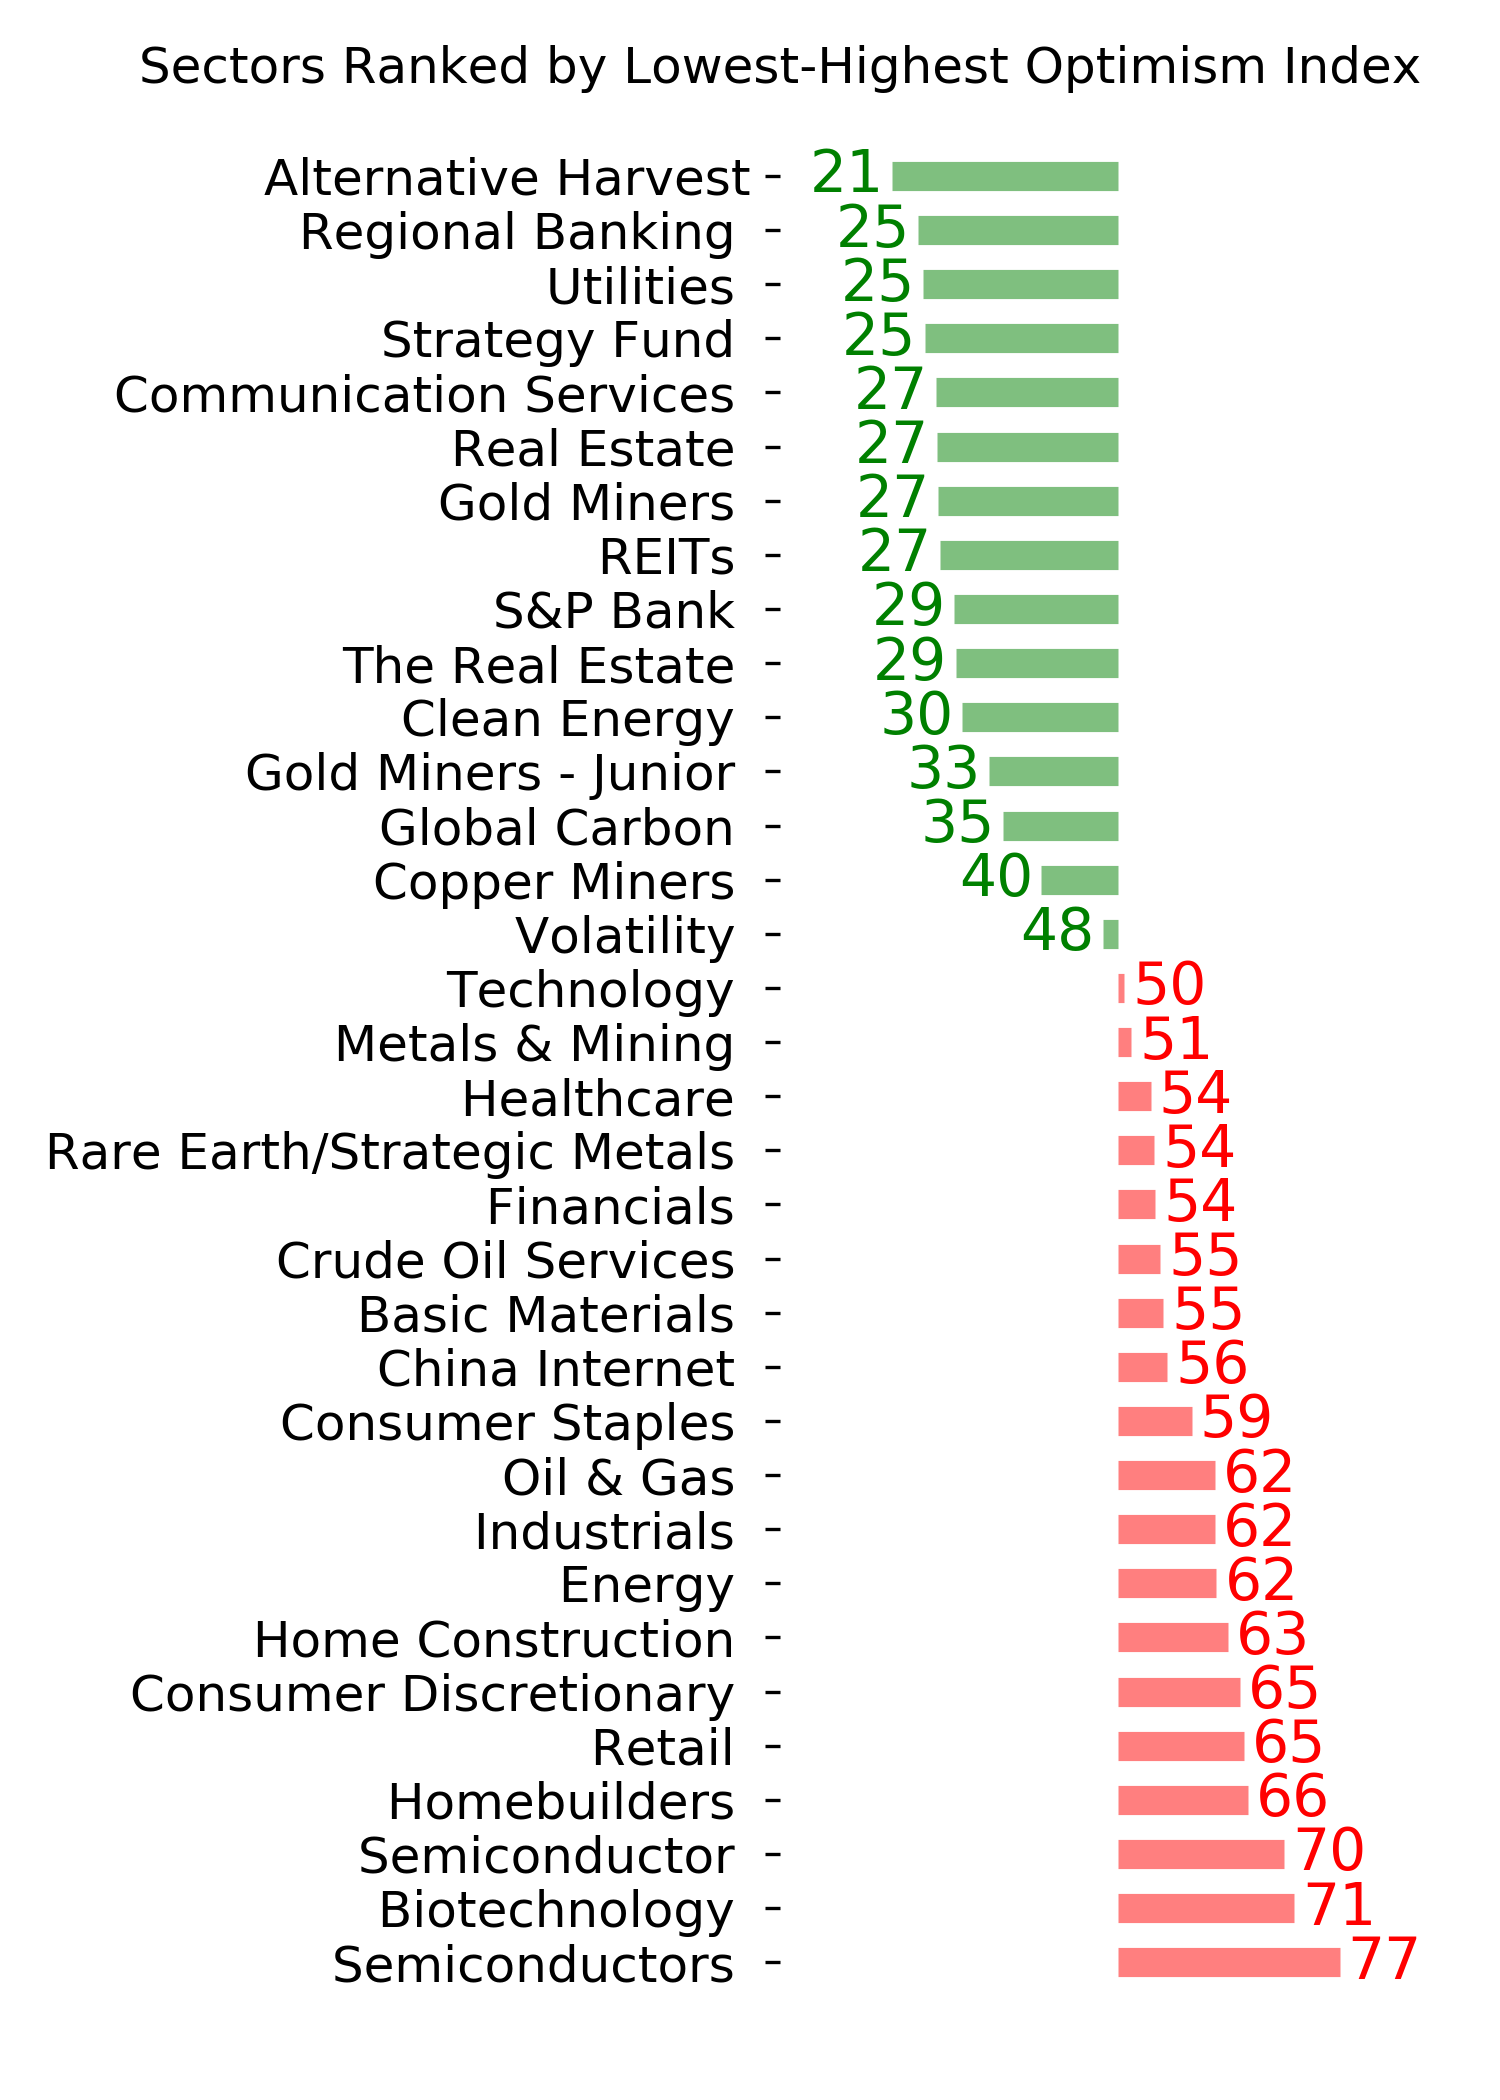
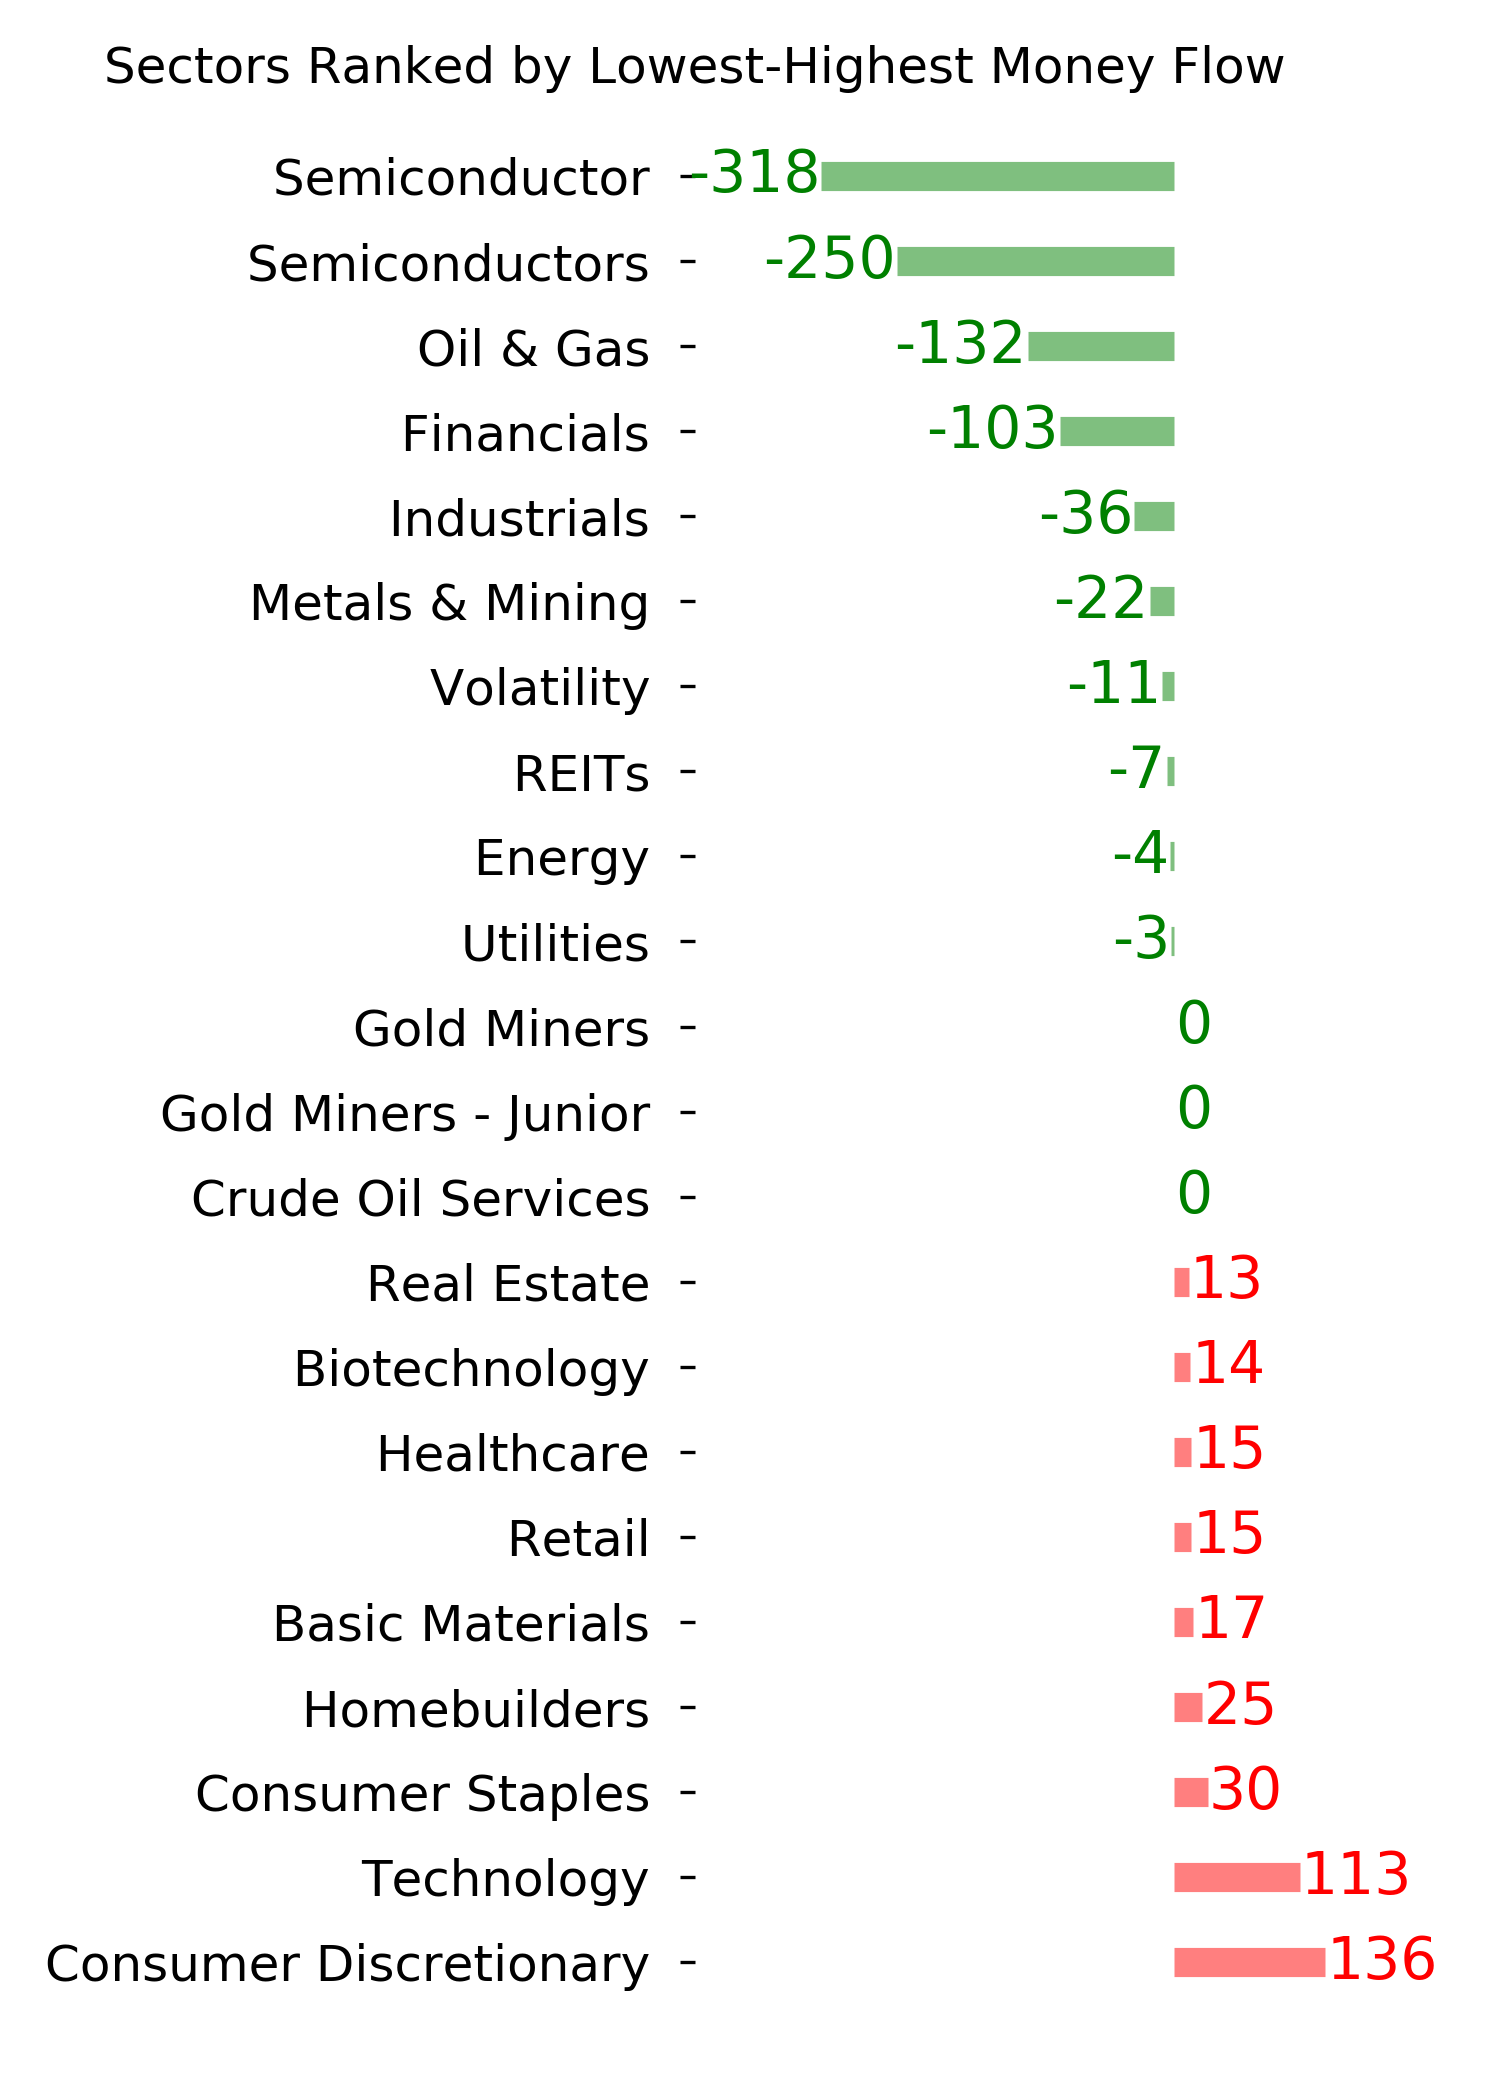
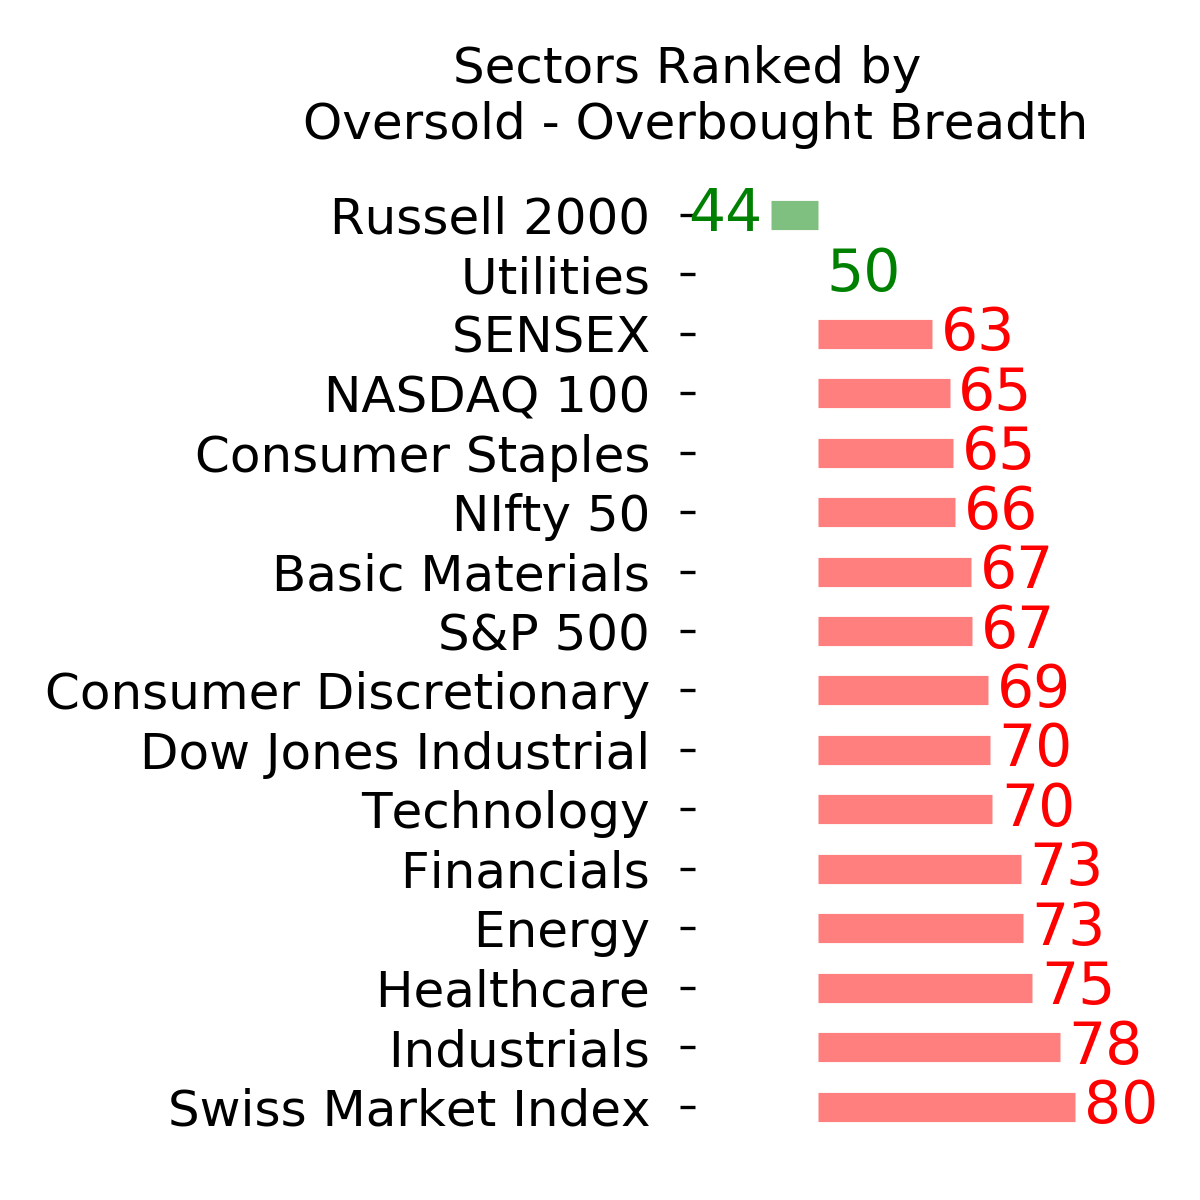
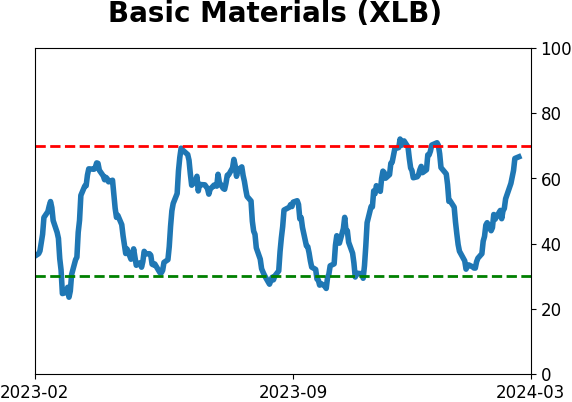
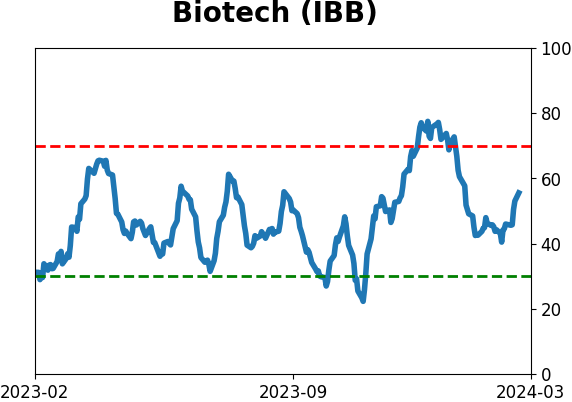
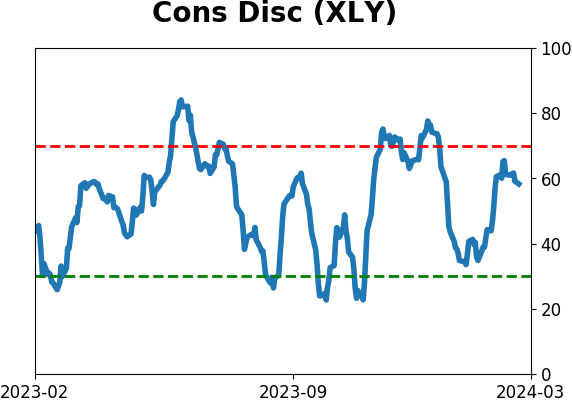
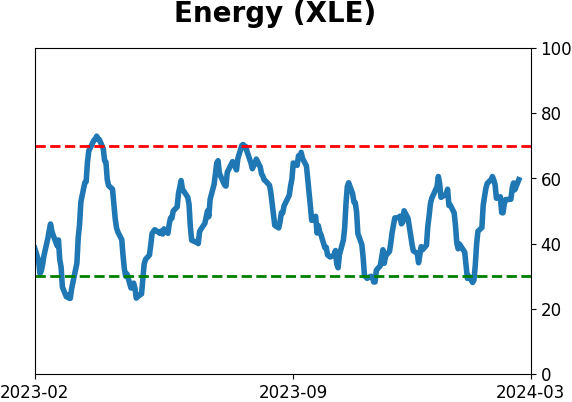
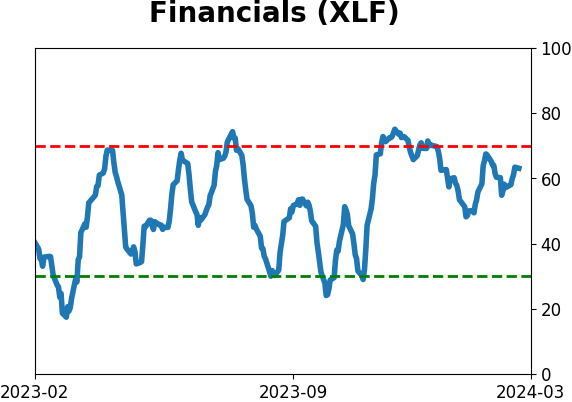
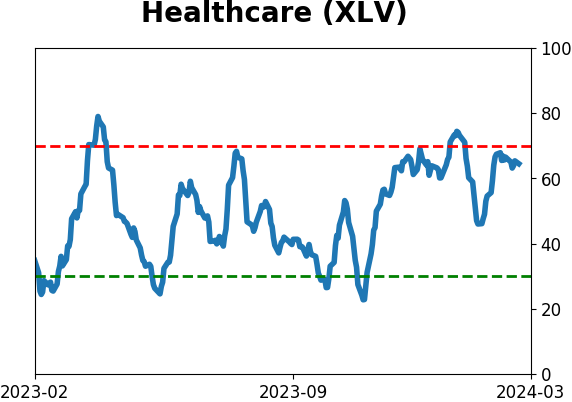
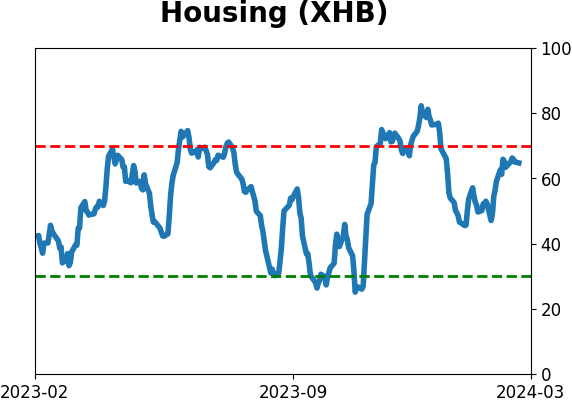
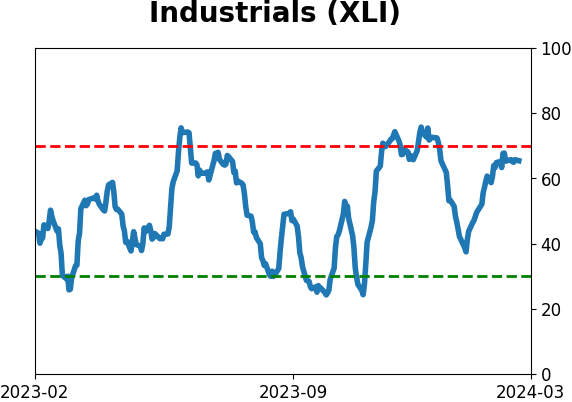
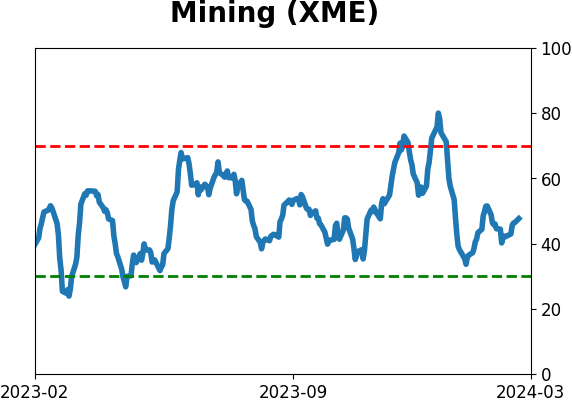
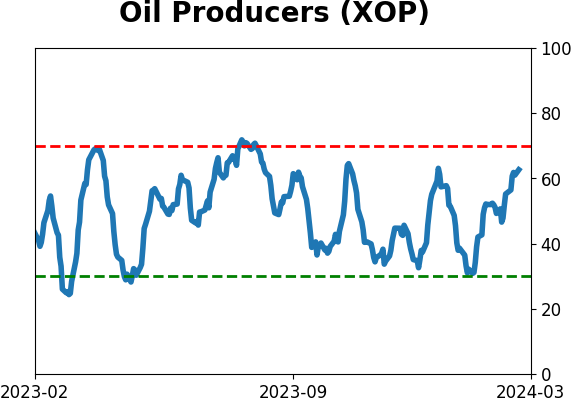
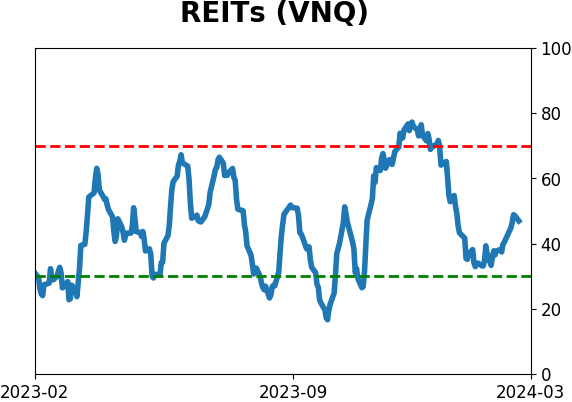
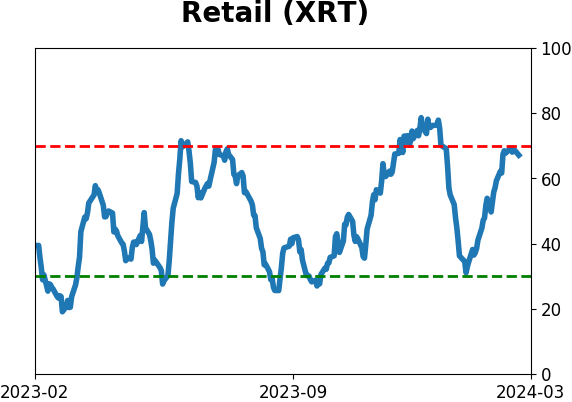
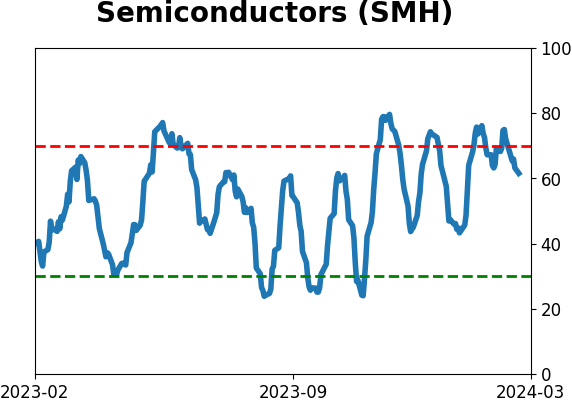
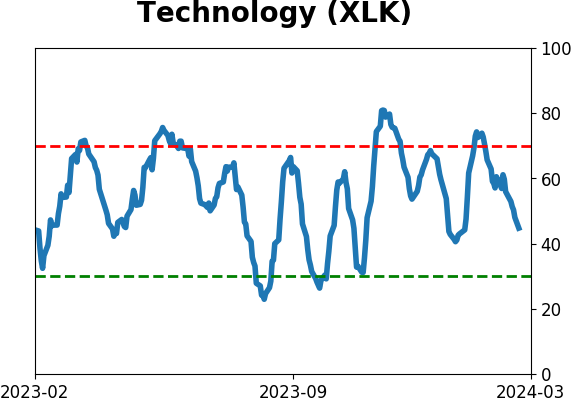
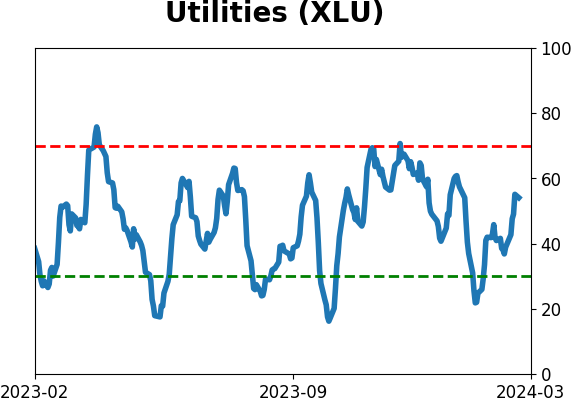
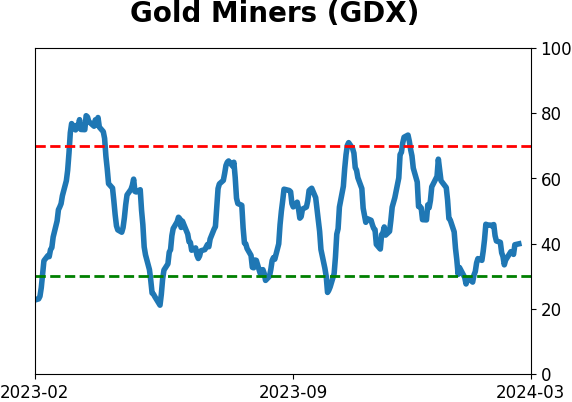
Sector ETF's - 10-Day Moving Average
|
|
|
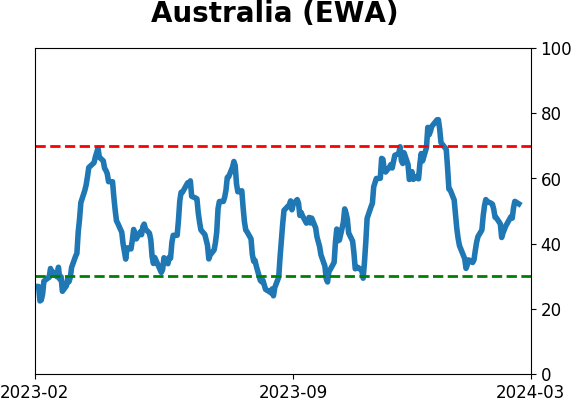
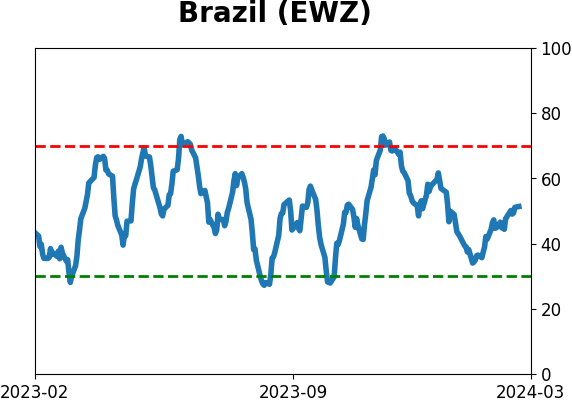
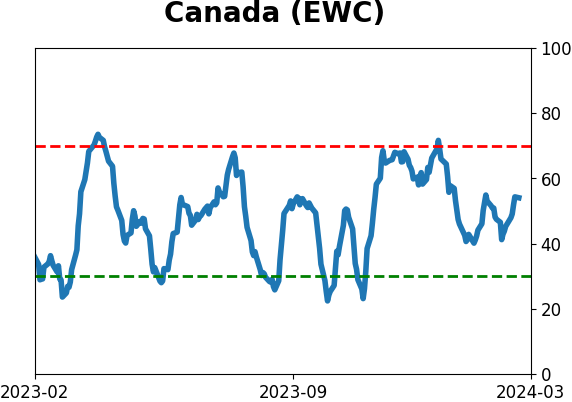
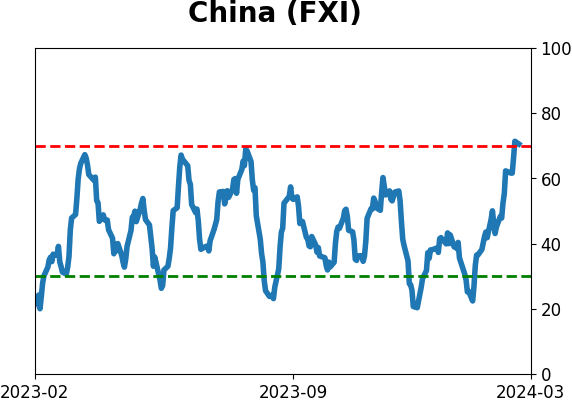
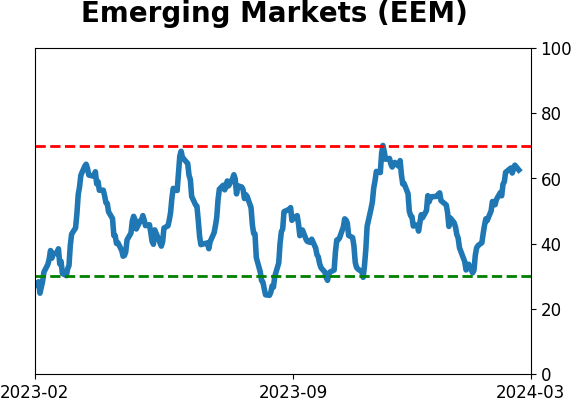
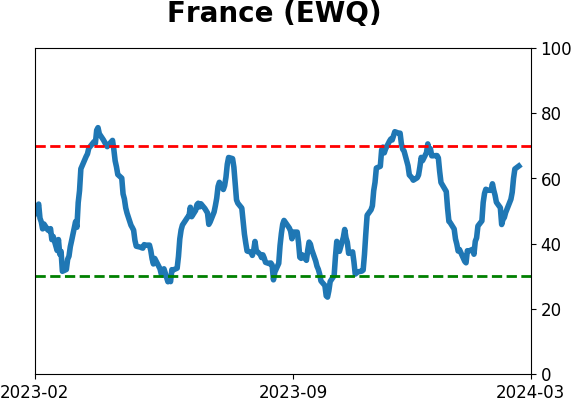
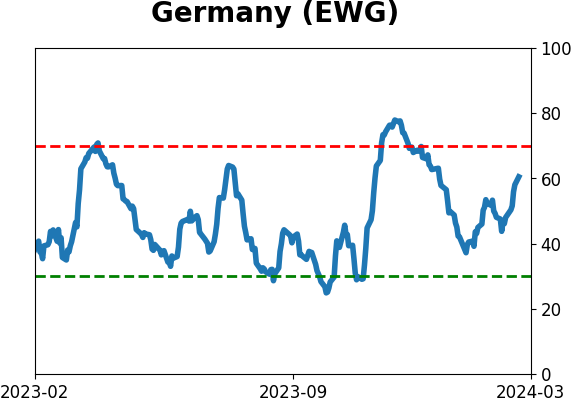
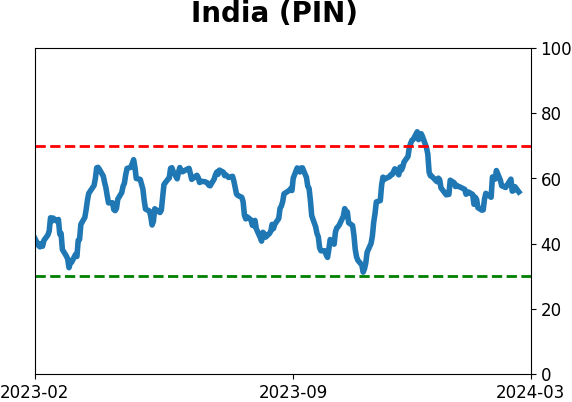
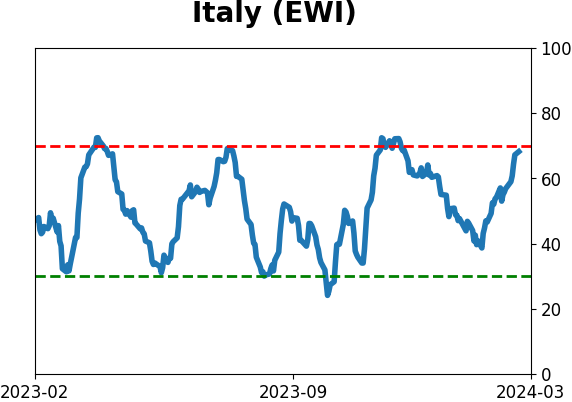
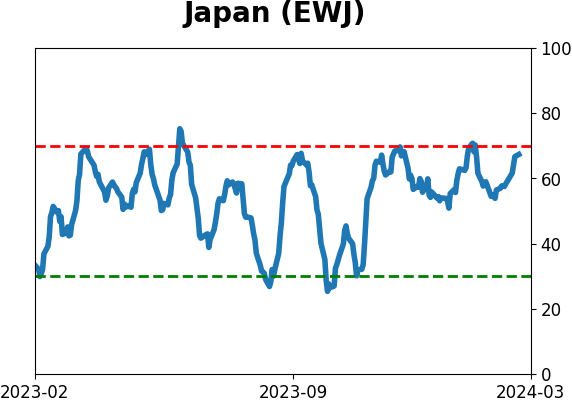
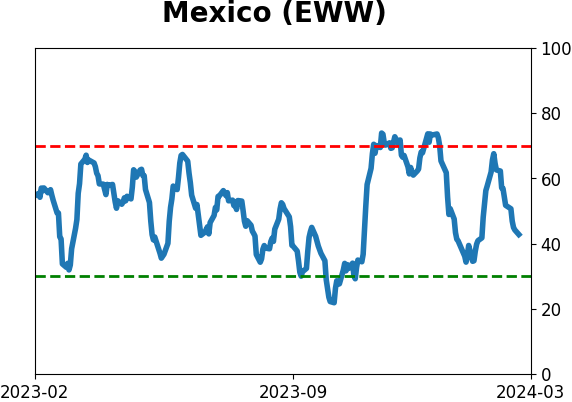
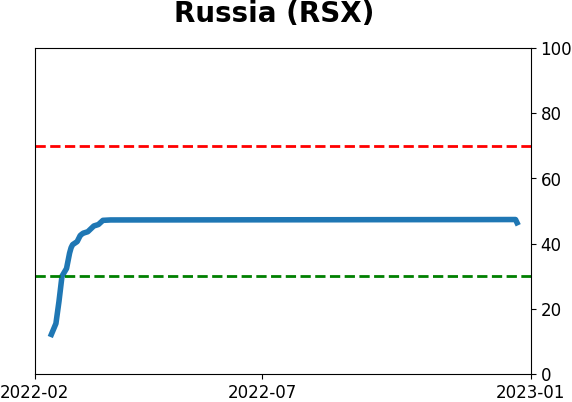
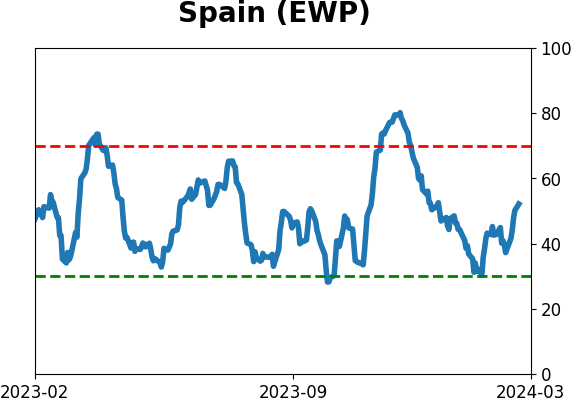
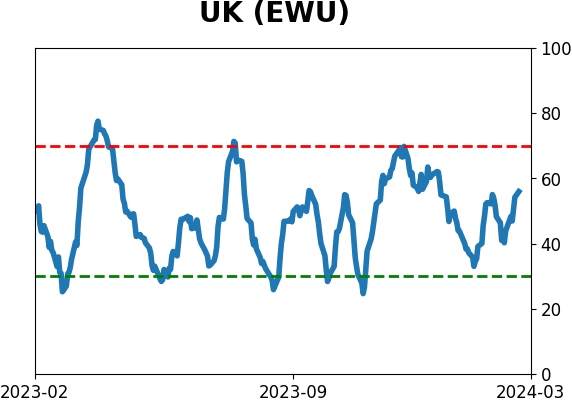
Country ETF's - 10-Day Moving Average
|
|
|
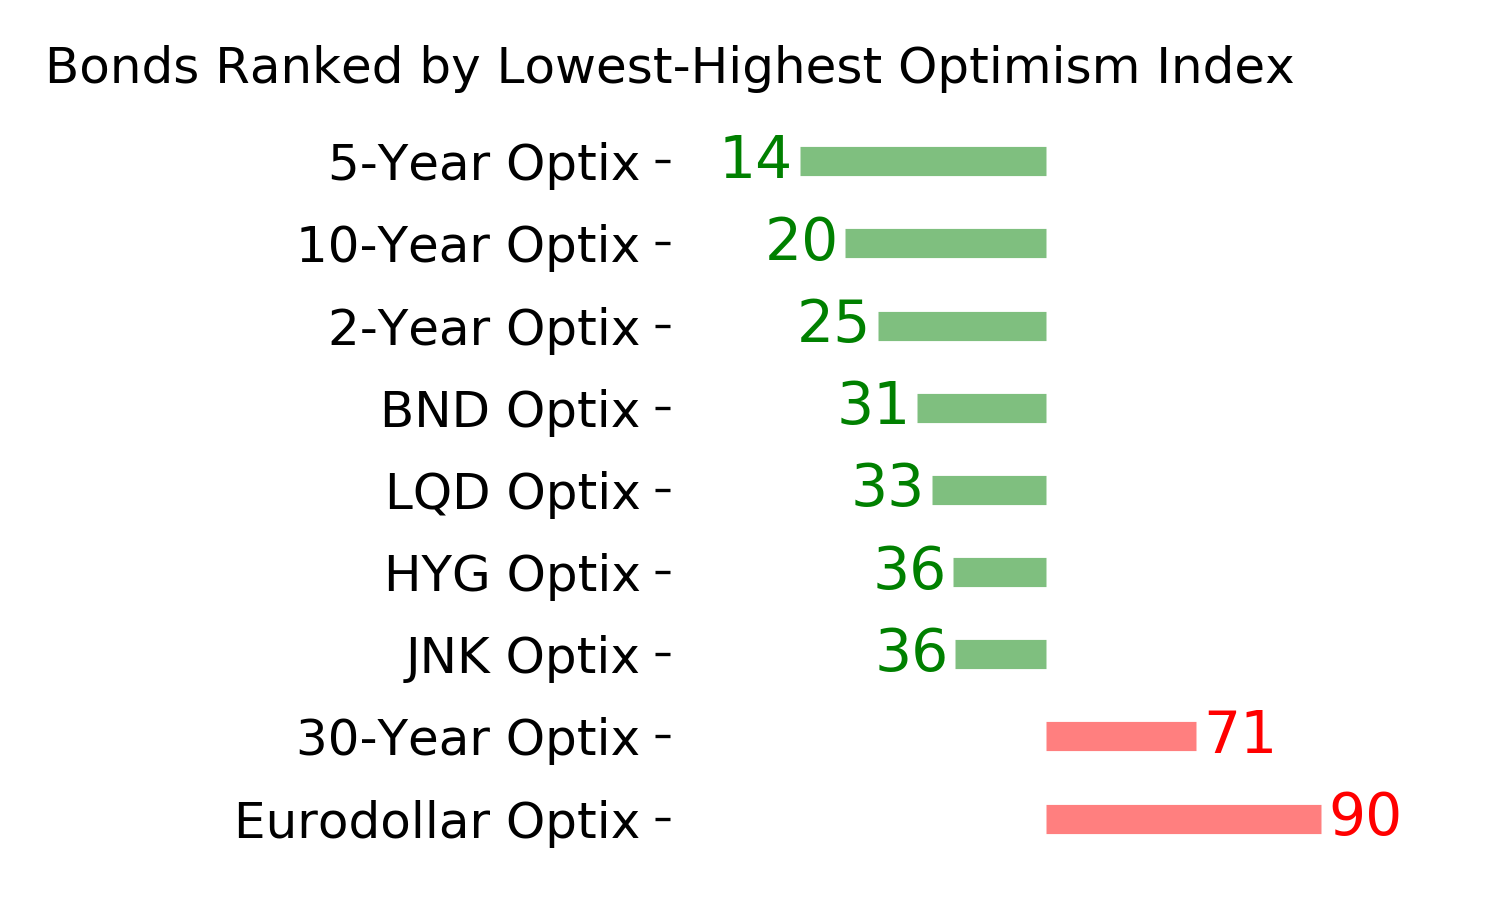
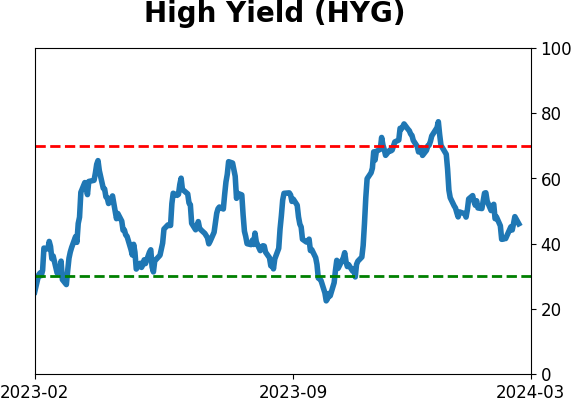
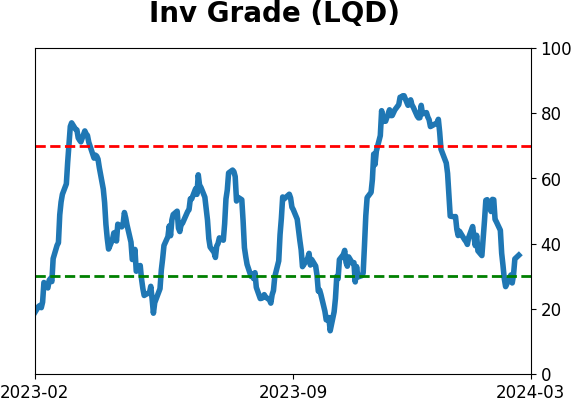
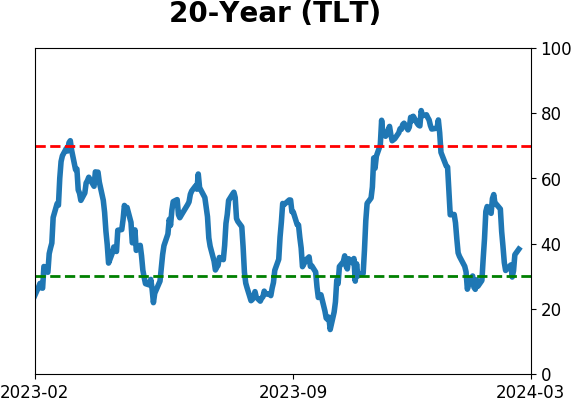
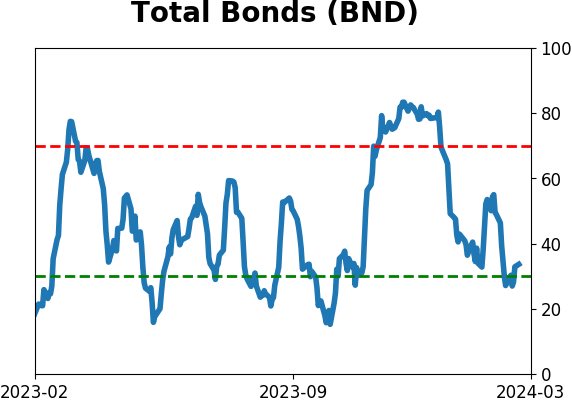
Bond ETF's - 10-Day Moving Average
|
|
|
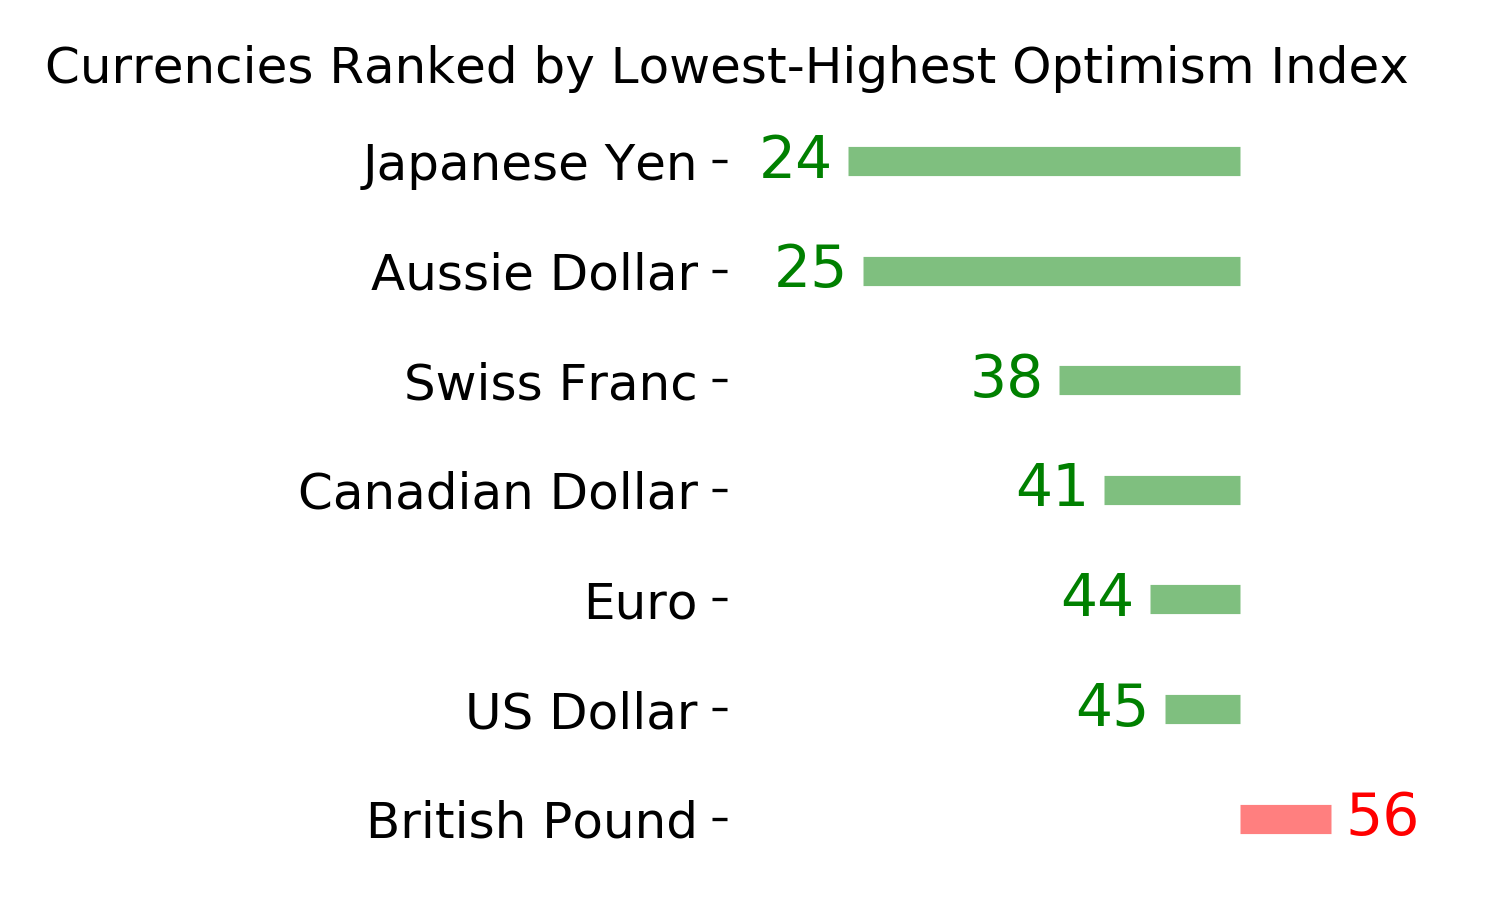
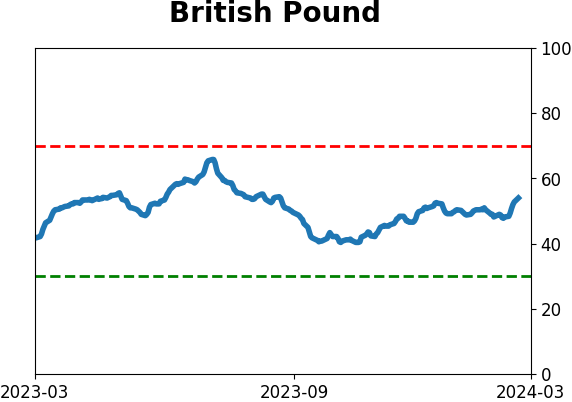
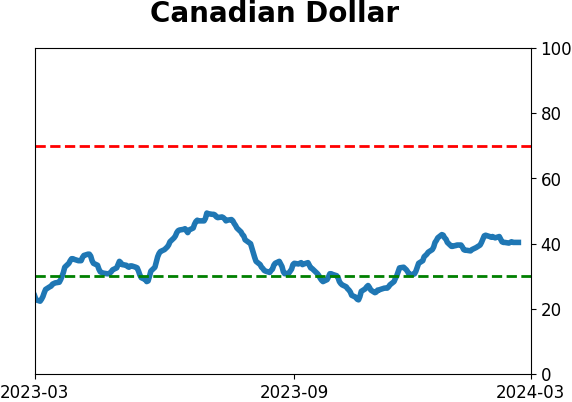
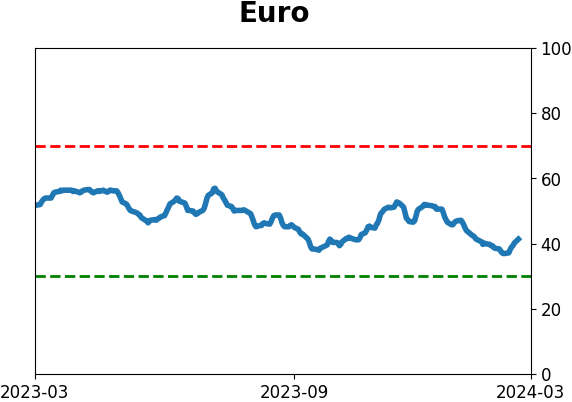
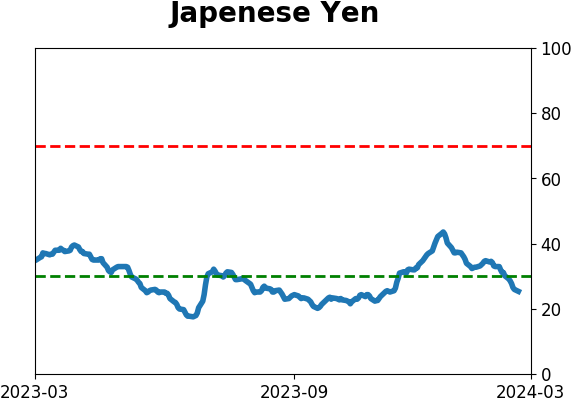
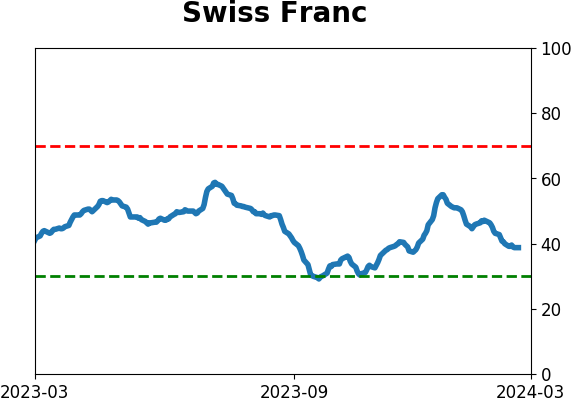
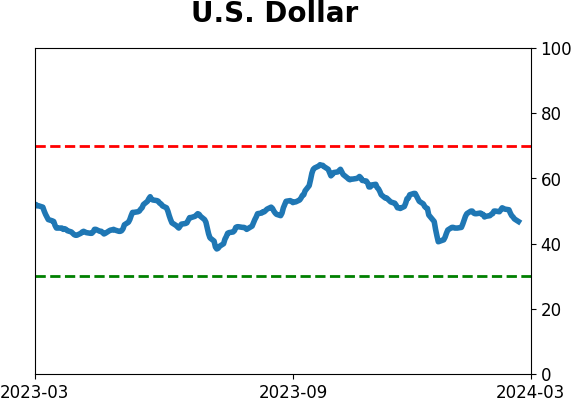
Currency ETF's - 5-Day Moving Average
|
|
|
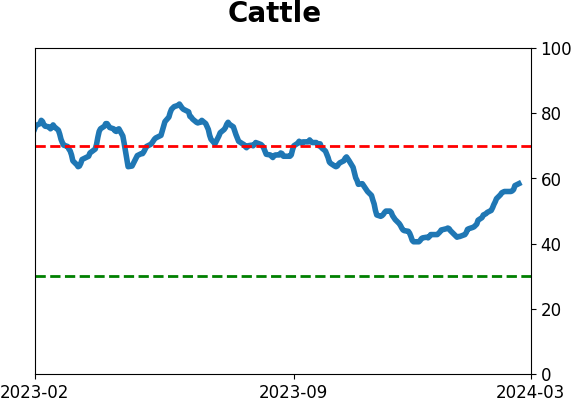
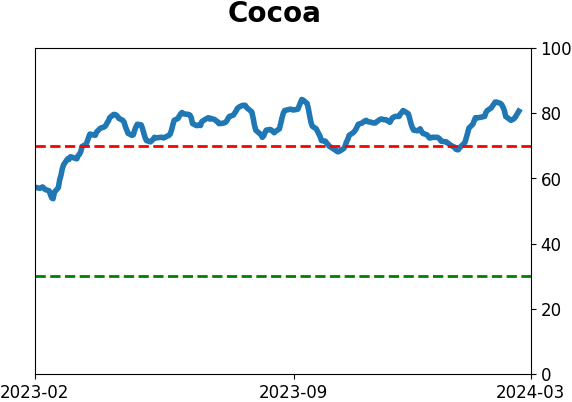
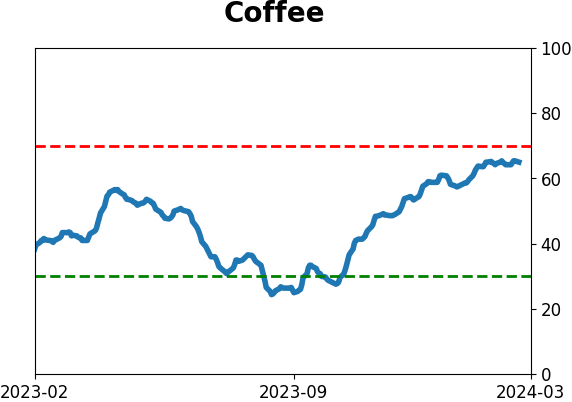
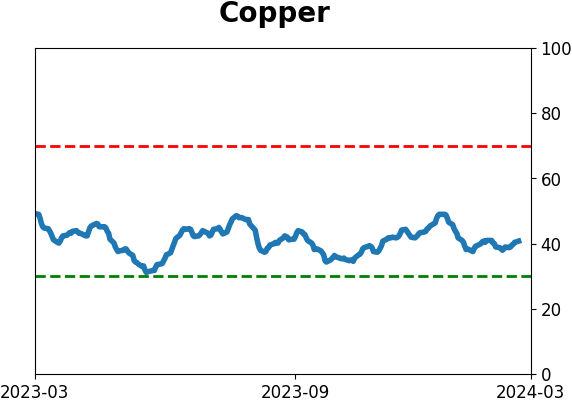
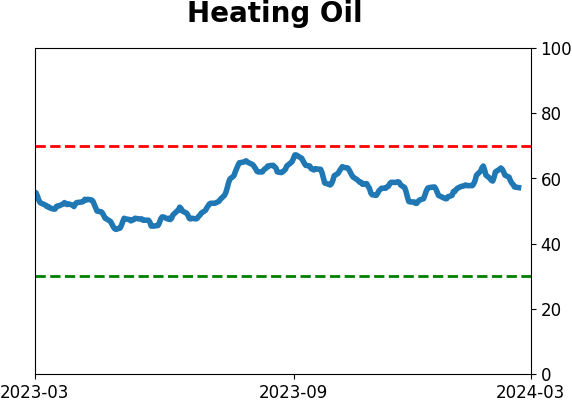
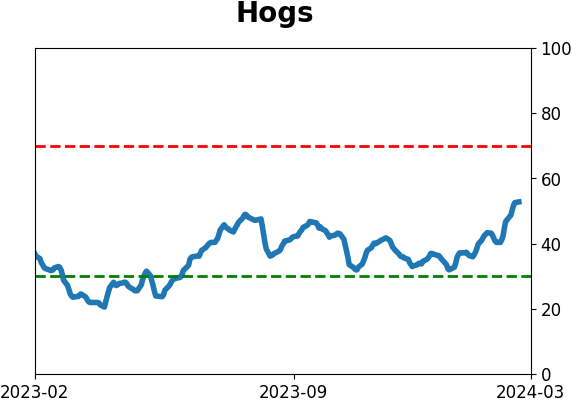
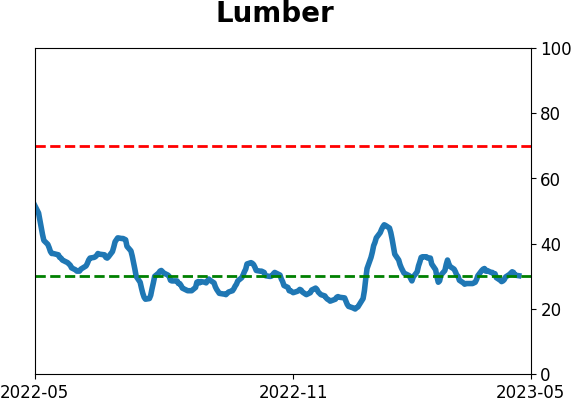
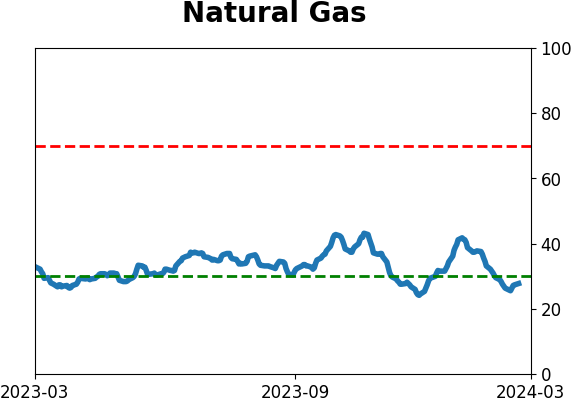
Commodity ETF's - 5-Day Moving Average
|
|