Headlines
|
|
Weekly Wrap for Feb 25 - Armed conflict, surge in uncertainty, corrections and washed-out stocks:
This week, we saw the world's most benchmarked equity index fall into a quick correction. Its price path in the weeks ahead will give us some clues as to whether it's a bear market correction or not. Armed conflict has been bad for stocks, but newspapers are already exhibiting near-record uncertainty. Nasdaq stocks have been washed out. Commodities continue to surge, but gold miners have more to prove.
The latest Commitments of Traders report was released, covering positions through Tuesday: The 3-Year Min/Max Screen shows that "smart money" commercial hedgers didn't make any major moves ahead of this week's extreme volatility. They added to their massive net short position in major equity index futures, once again holding more than $100 million in short exposure. They sold gold, moving to one of the largest short positions of the past year, but well off past extremes. At the same time, they bought 10-year Treasuries, moving back to one of their largest net long positions ever.
|
Smart / Dumb Money Confidence
|
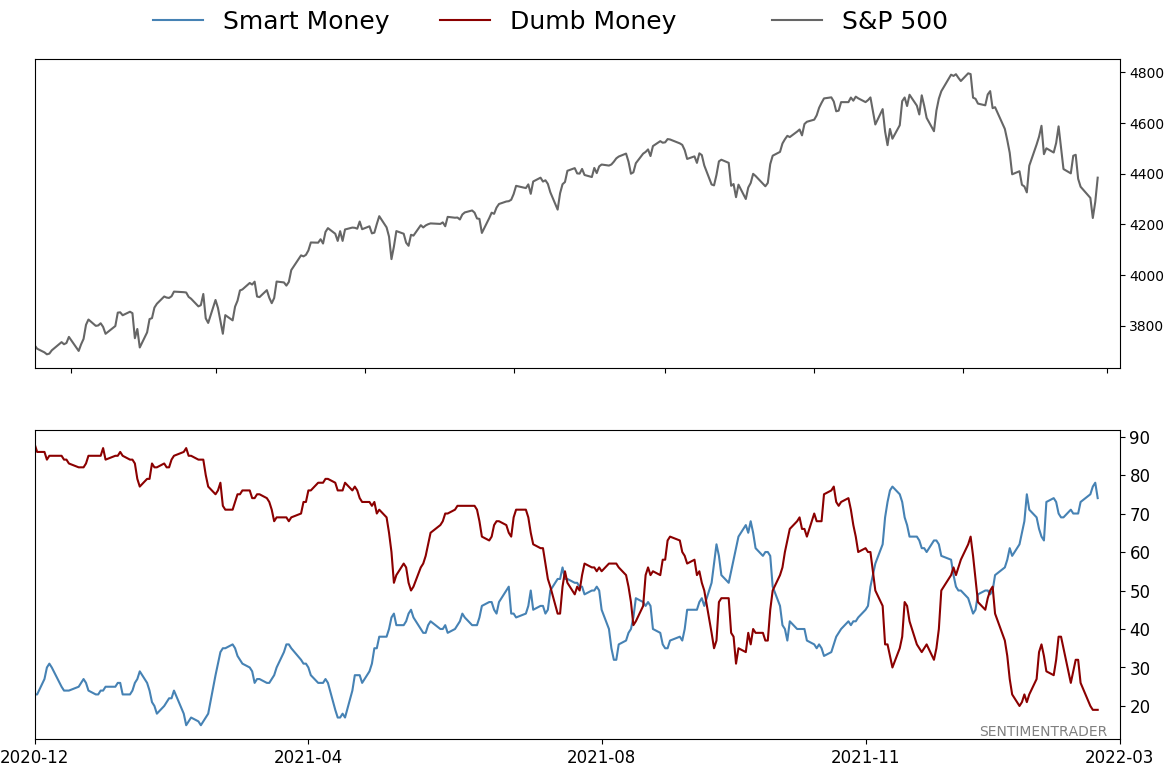
Smart Money Confidence: 74%
Dumb Money Confidence: 19%
|
|
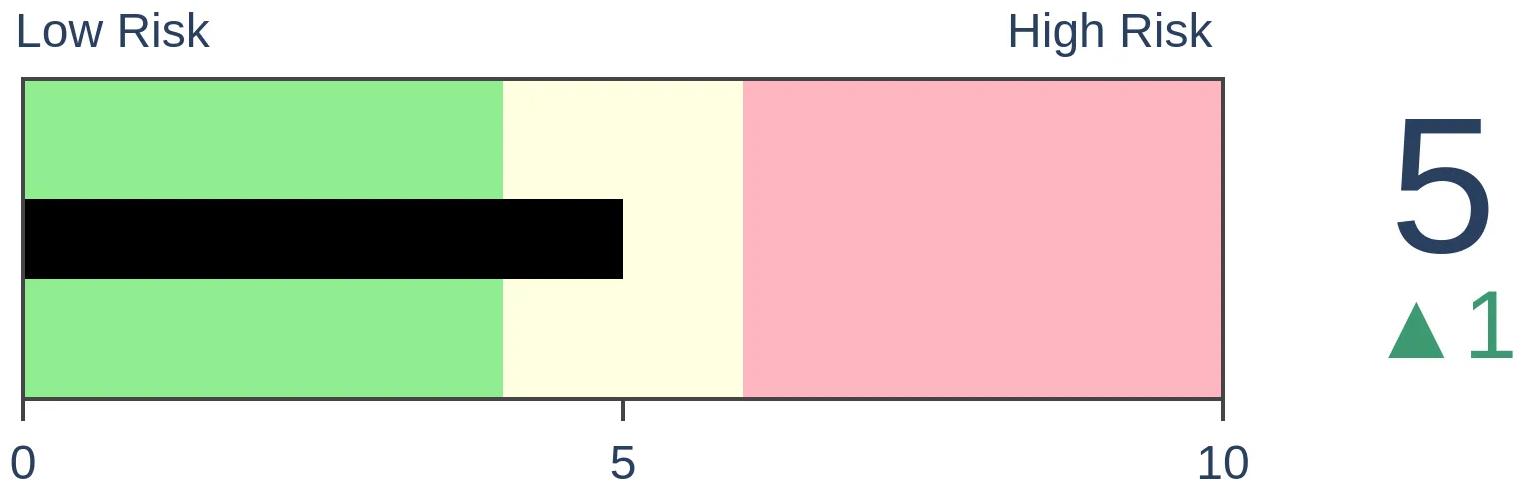
Risk Levels
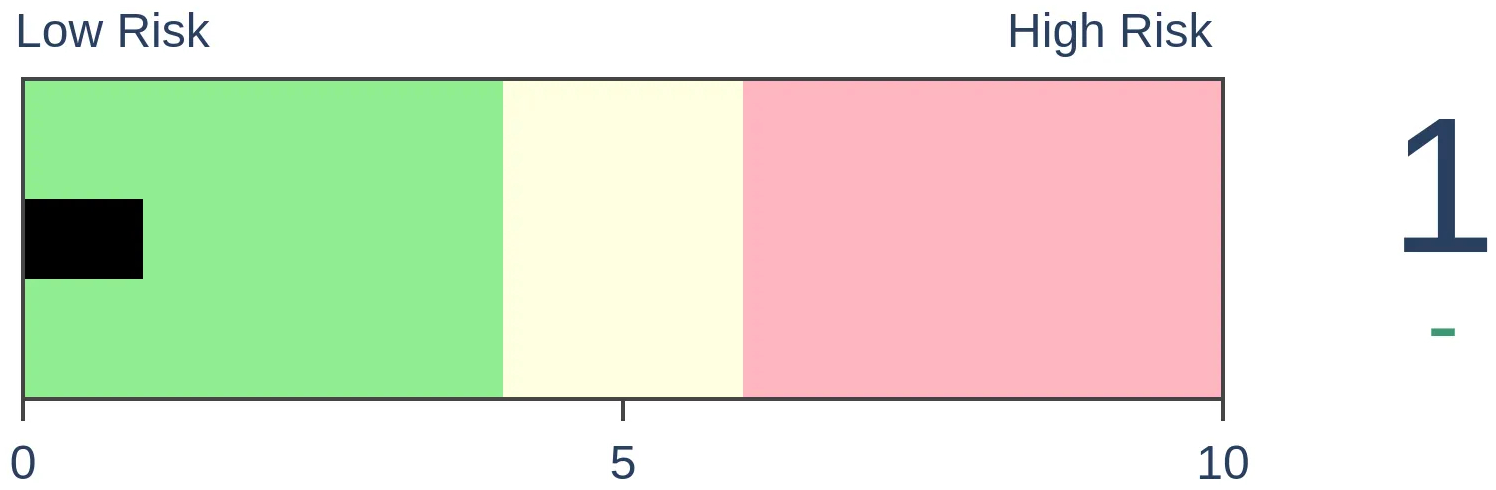
Stocks Short-Term
|
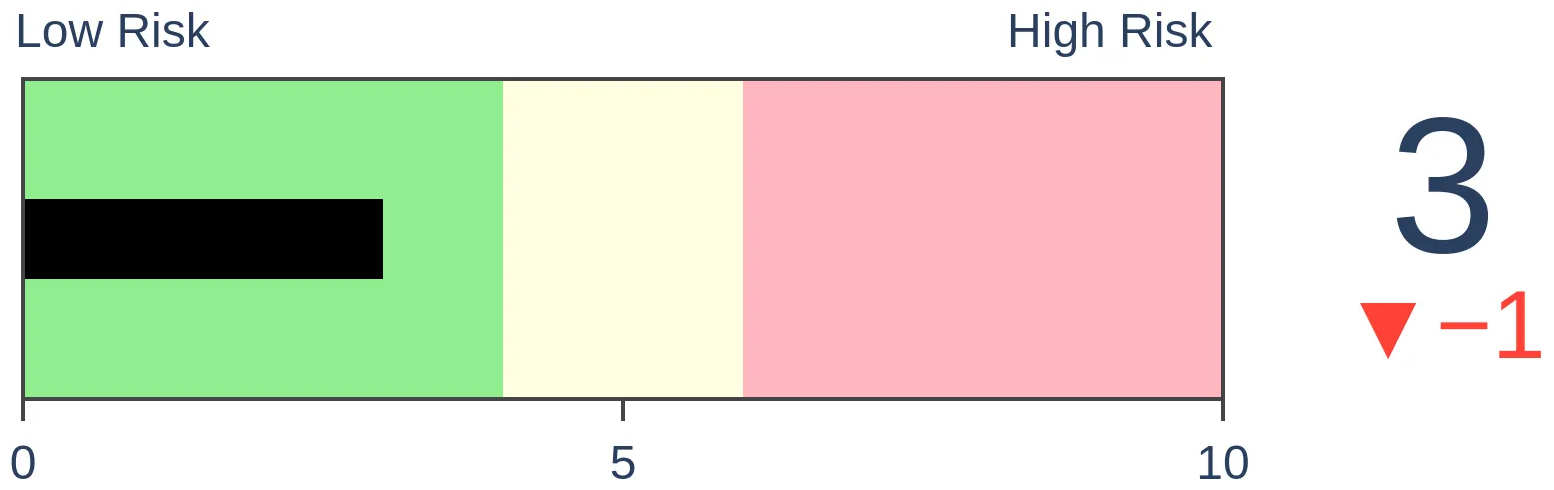
Stocks Medium-Term
|
|
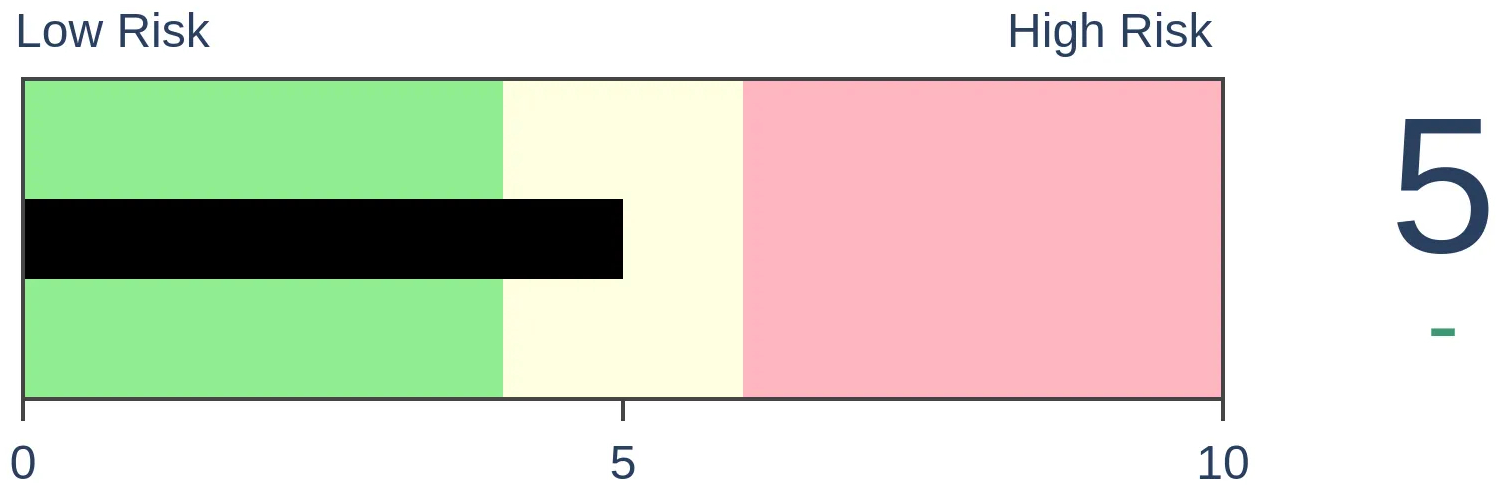
Bonds
|
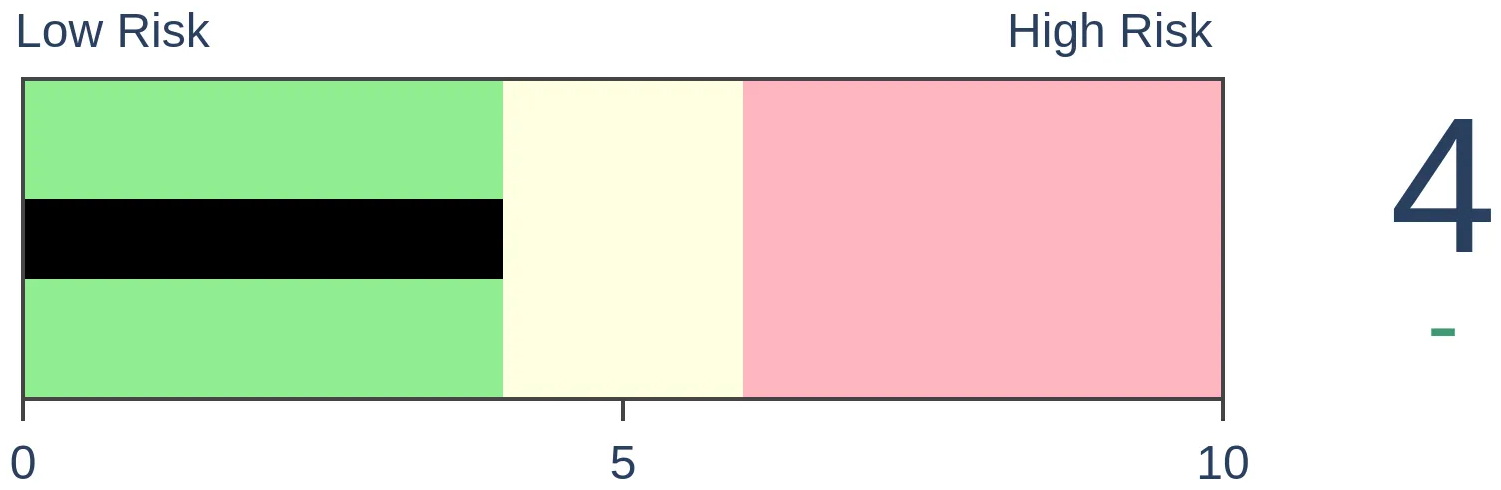
Crude Oil

|
|
Gold
|
Agriculture
|
|
Research
By Jason Goepfert
BOTTOM LINE
This week, we saw the world's most benchmarked equity index fall into a quick correction. Its price path in the weeks ahead will give us some clues as to whether it's a bear market correction or not. Armed conflict has been bad for stocks, but newspapers are already exhibiting near-record uncertainty. Nasdaq stocks have been washed out. Commodities continue to surge, but gold miners have more to prove.
FORECAST / TIMEFRAME
None
|
Key points:
- The most-benchmarked index in the world fell into a correction
- A typical price path for bear market corrections would suggest lower lows (bulls hope that won't happen)
- Armed conflict has been bad for stocks, but newspapers have already been exhaustively covering stocks' volatility
- Nasdaq stocks had already been washed out, then fell further, in line with past behavior
- Gold mining stocks still have a lot to prove
- A broad basket of commodities continues to surge, suggesting a secular trend
- Four commodities, in particular, are entering a seasonal weak spot
- Discretionary stocks, however, are entering a positive seasonal window
The world's most important index falls into a correction
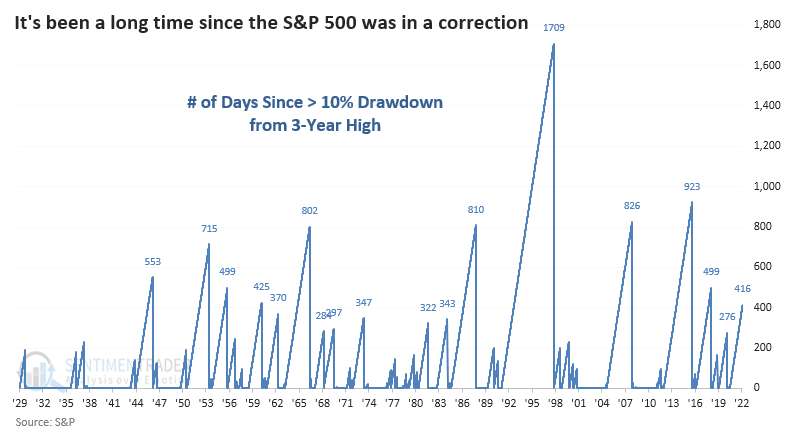
The S&P 500 has finally endured a drawdown of more than 10% from its most recent multi-year high. For brevity's sake, we use the commonly accepted definition of calling this a correction.
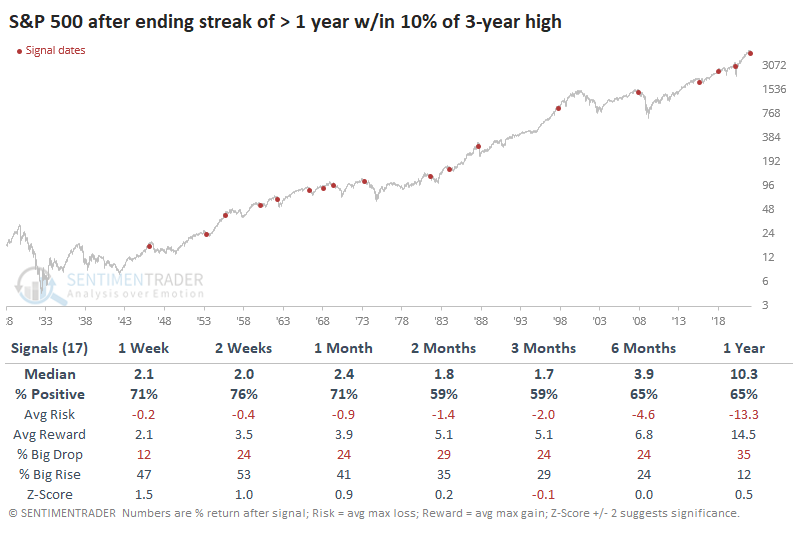
This ended the S&P's 11th-longest streak of hanging within 10% of its high.
After the S&P fell into a correction following a long absence, it tended to bounce back, especially over the next 1-4 weeks. There were 3 major exceptions (1962, 1987, and 2020) when sellers refused to give up and pushed the index to double-digit losses in the weeks ahead.
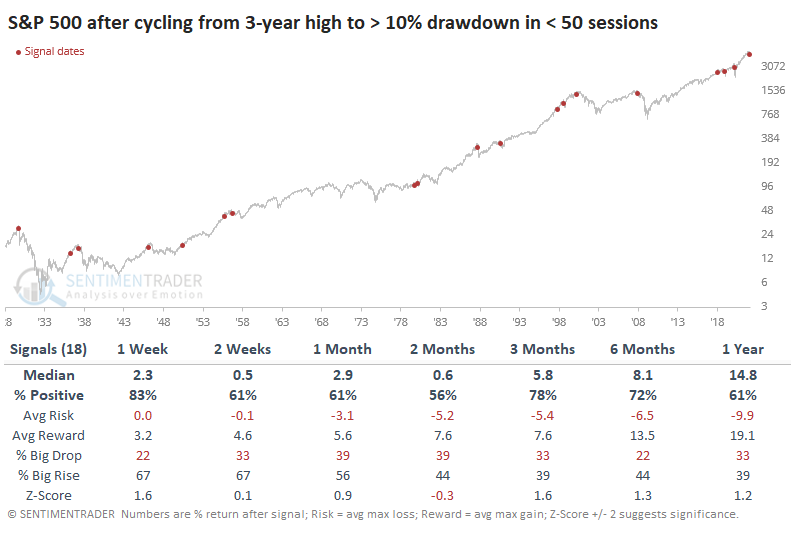
At only 33 days removed from its most recent multi-year high, it seems like this has been a quick about-face among investors. But it's not far below the median number of days it took for the S&P to cycle into a correction.
Again, the S&P tended to bounce after quick corrections as dip-buyers finally found their chance to jump on what had been an excellent trend.
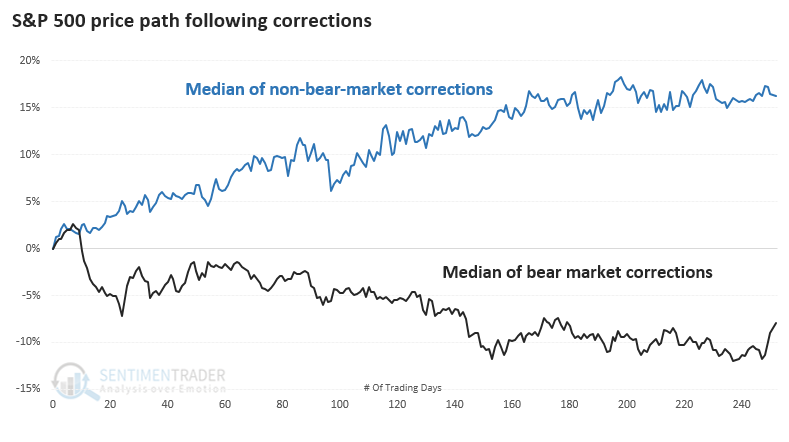
The chart below shows the S&P 500's median price path once it fell into a correction, separated by those that turned into bear markets (black line) and those that did not (blue line).
Both groups tended to see a short-term bounce lasting 1-2 weeks. After that, the bear market corrections fell apart and quickly plumbed lower lows. The non-bear-market corrections only saw some choppiness then went on to recover further in the weeks ahead.
Now that the most benchmarked index in the world has fallen into correction territory, trumpeted by media headlines, we'll get a chance to see if risk appetite will return. We're in an unhealthy market environment with clear risk-off behavior but only moderate sentiment extremes, so it's not a given that investors will be willing to step up. We'll just have to see how they react in the week(s) ahead, and the chart of bear market corrections makes it clear that if investors' risk appetite remains missing and the S&P 500 continues to reach lower lows, it will usher in unpleasant precedents and raise the risk of a full-blown bear market.
Armed conflict is terrible, but newspapers have already been all over stocks' volatility
We've all been told that investors hate uncertainty. Right now, there's a lot of uncertainty, and investors certainly seem to hate it.
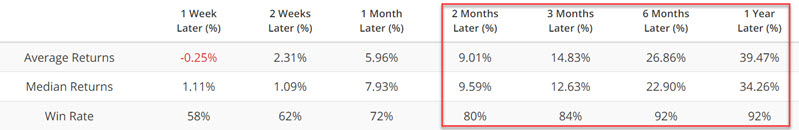
This isn't unusual when there is an armed conflict. If we filter a list of 70+ major geopolitical events over the past 100 years to those that primarily involved armed conflict not initially involving the United States, domestic stocks were not immune to the concerns.
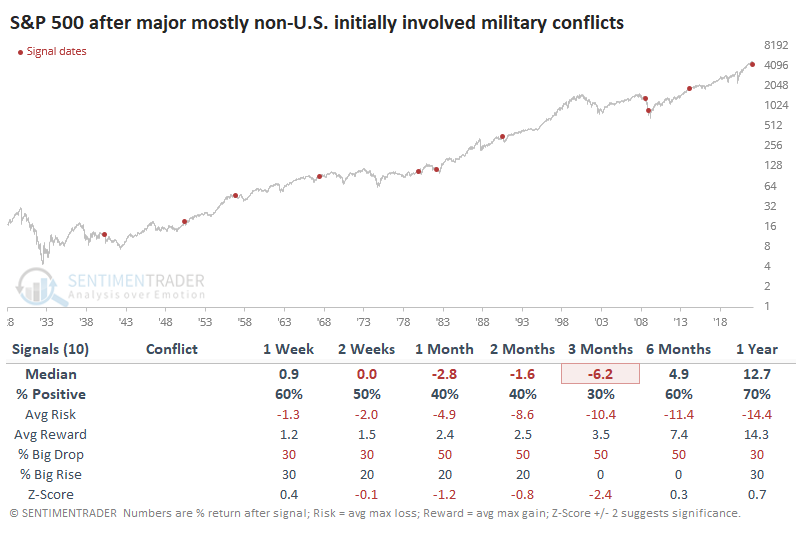
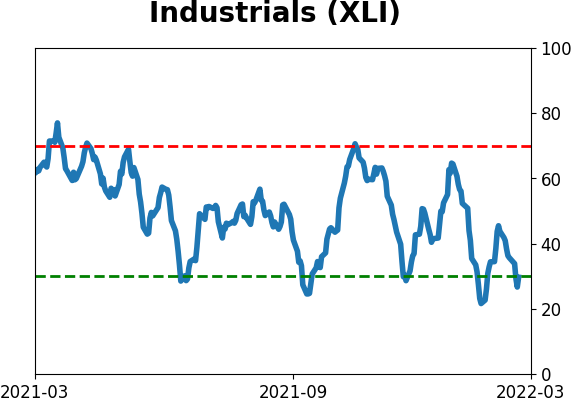
There weren't many places to hide when it comes to sectors and factors. It's probably not a surprise that the two sectors with the least-bad returns over the next 3 months were Consumer Staples and Energy. Financials, Industrials, and Consumer Discretionary were among the worst.
There's one big difference between most of those conflicts and our current market, and that's that investors are already showing an extremely high level of anxiety and uncertainty.
The most common way to measure uncertainty is the VIX, which works well enough. Another one is the Equity Market-Related Economic Uncertainty Index (EMREUI) available from the St. Louis Fed. The index is calculated the same way as their more commonly-referenced Economic Uncertainty Index, searching for articles published in 10 major newspapers, but it's focused more specifically on the stock market.
The EMREUI had been quiet as stocks rose. But recent developments have triggered a spike, and it rivals the most extreme levels since the index's inception in 1985.
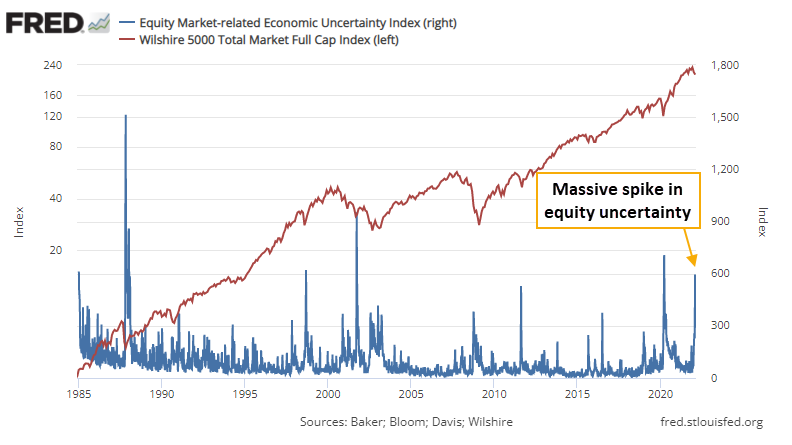
The index was volatile right after inception. Starting shortly thereafter, though, there have only been a half-dozen readings of 500 or more. That triggered in late January and has stayed elevated.
This is notable because it's already so much higher than any of the other conflicts that occurred since the inception of index. In the 4 weeks before and after the others, the maximum EMREUI barely got above 250. This time, it's already more than double that.
The table below shows every week when the index spiked above 500 for the first time in months.
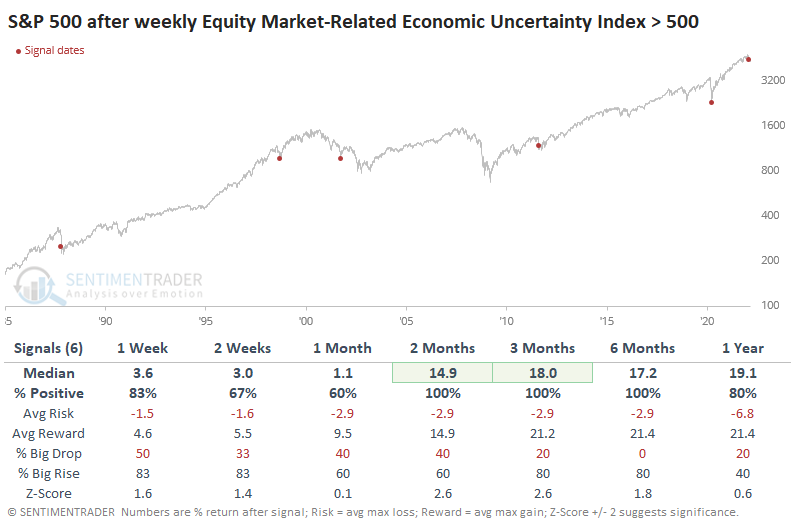
The chart clearly shows that the index seemed to be a useful indication of uncertainty. When mainstream newspapers find it necessary to publish articles related to the stock market, it's almost always because of declines and scary headlines.
Standard measures of volatility and sentiment are showing only modest extremes, even after the latest leg down. And it's not a great sign that investors continue to show risk-off behavior even after the S&P 500 went "on sale" by entering a correction. There is always some indicator somewhere that shows an extreme, and perhaps the EMREUI is one of those. Most of those we regularly use are not showing the level of fear that would indicate a lower-risk opportunity for buyers, given we're in an unhealthy market environment and now facing a major armed conflict overseas. But it's a heads-up that we may soon see some of those extremes.
Nasdaq-listed stocks were washed out, then suffered more losses (like usual)
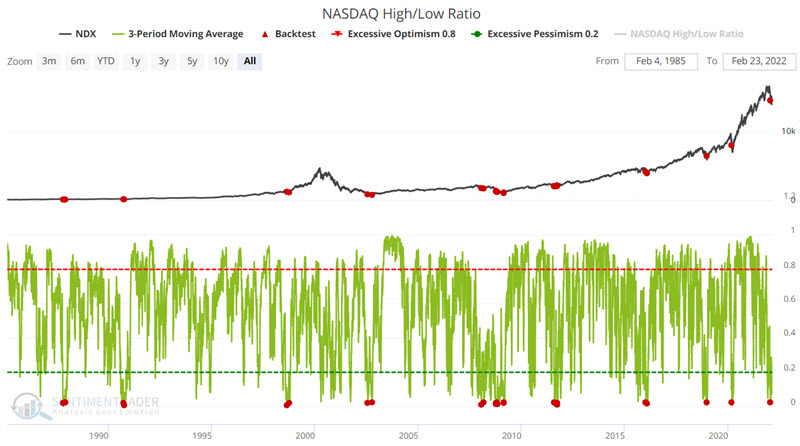
Jay looked at the Nasdaq New High/New Low Ratio, a breadth ratio expressed as the number of issues that closed at a 52-week high as a percentage of the total number of stocks making new highs or new lows.
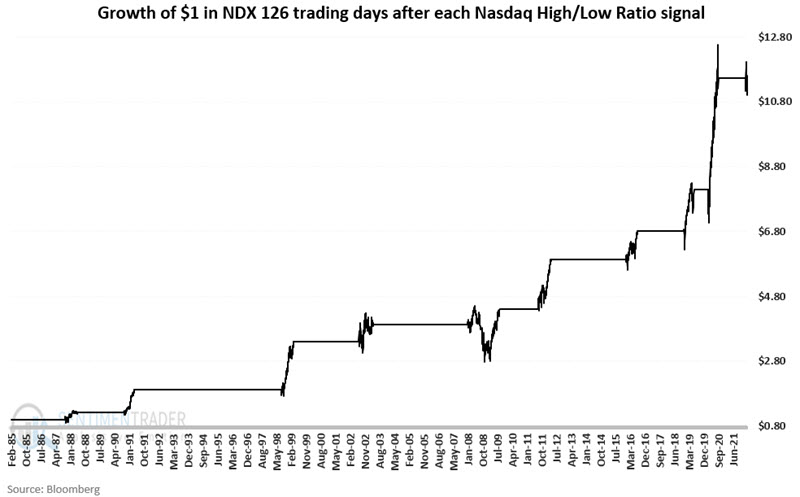
The chart below displays those days when the 3-day average of daily Nasdaq High/Low Ratio readings dropped below 0.02. In other words, over the three previous trading days, less than 2% of Nasdaq stocks making new highs or lows were making new highs. This tends to occur when the overall market is reaching a washed out level.
Let's consider the following approach to using these signals:
- Each time the 3-day average drops below 0.02, we will hold the Nasdaq 100 Index for 126 trading days (6 months x roughly 21 trading days per month)
- If a new signal occurs while an existing signal is active, the holding period is extended for another 126 trading days
So if only one signal occurs, the holding period will be 126 trading days (i.e., roughly six months). If there are overlapping signals, the holding period will be longer. The chart below displays the hypothetical growth of $1 invested in the Nasdaq 100 Index only as described above.
The table below displays the start and end dates for each favorable period using the rules above, along with the percentage +(-) for the Nasdaq 100 Index during the favorable period. It also shows the maximum drawdown for NDX between the entry signal and the actual bottom and the number of trading days it took to get there.
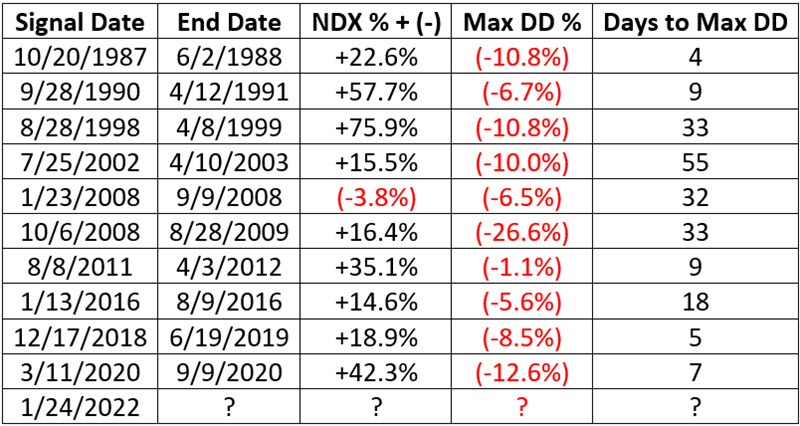
Like most of the signals before it, the signal from the Nasdaq new high/new low ratio on 1/24/2022 tuned out to be early as the Nasdaq 100 Index has plunged another -15% in just 21 trading days.
If history is a guide, this indicator suggests that a meaningful bottom is in the process of forming. Unfortunately, a) there are no guarantees, and b) things could still get much worse before they get better.
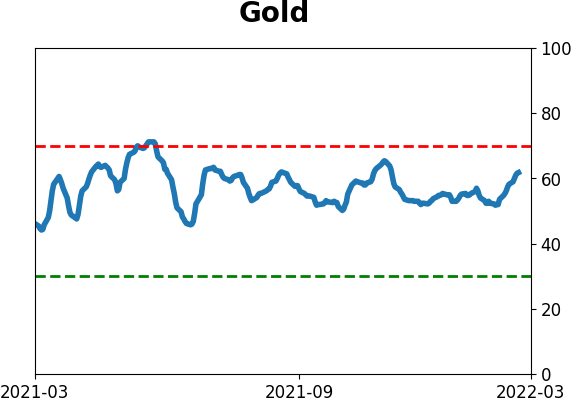
Why gold miners still have a lot to prove
It always seems like gold mining stocks have something to prove. With recent geopolitical and inflationary scares, gold and the companies that mine it are having a moment. They still have to get over the hump.
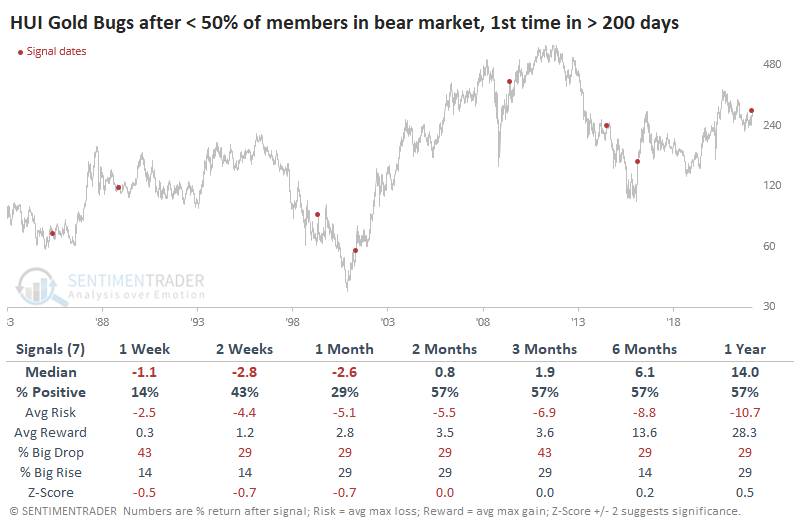
Gold bugs are getting excited because, for the first time in over a year, fewer than half of mining stocks are mired in a bear market. That's a pretty good dividing line between secular bull and bear markets in gold mining indexes. When more than half of the stocks are down 20% or more, stay out.
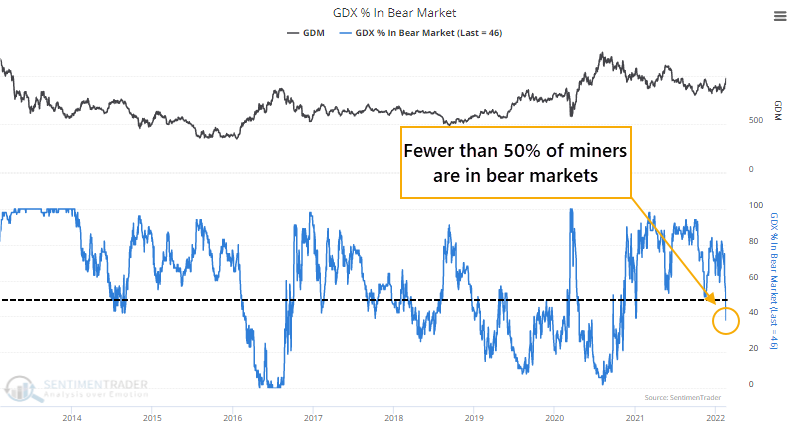
We'd gone more than a year with more than half of miners in a bear market. This ends one of the longest streaks in 40 years. Again, this should be a good sign, but historically it was not. Miners struggled mightily over the next 1-4 weeks to hold onto those gains.
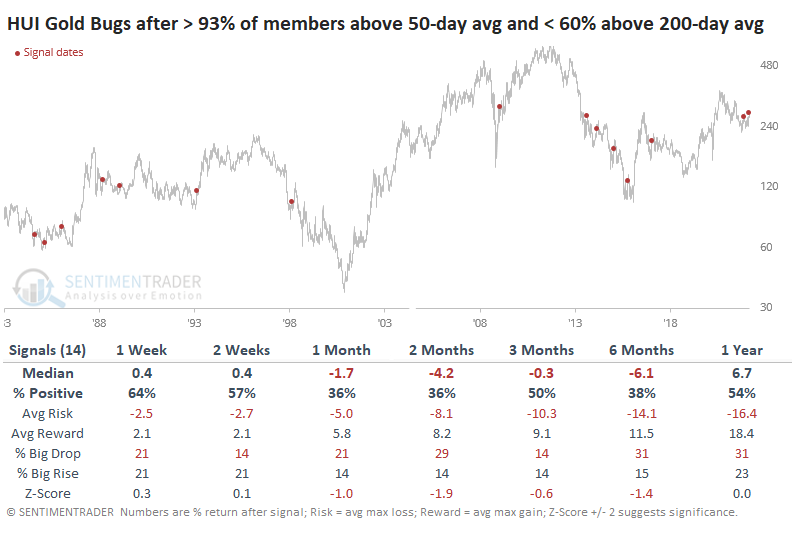
As miners surged in recent weeks, more than 93% of them closed above their 50-day moving averages. Over the past year, this high of a figure coincided with overbought readings and a stall in the rallies. Just as concerning, fewer than 60% of miners have recovered above their 200-day moving averages. As we see in almost all sectors and broad indexes, in unhealthy environments, we tend to see fewer than 40% of members above their 200-day averages, with rallies above 60% quickly bringing in sellers. That's what we've seen for the past year.
When more than 93% of miners rallied above their 50-day averages while fewer than 60% closed above their 200-day averages, miners struggled to add to their gains. Over the next 1-2 months, only 36% of signals showed a gain, and average returns were well below random. Out of 14 signals, 13 showed a loss either 1 or 2 months later.
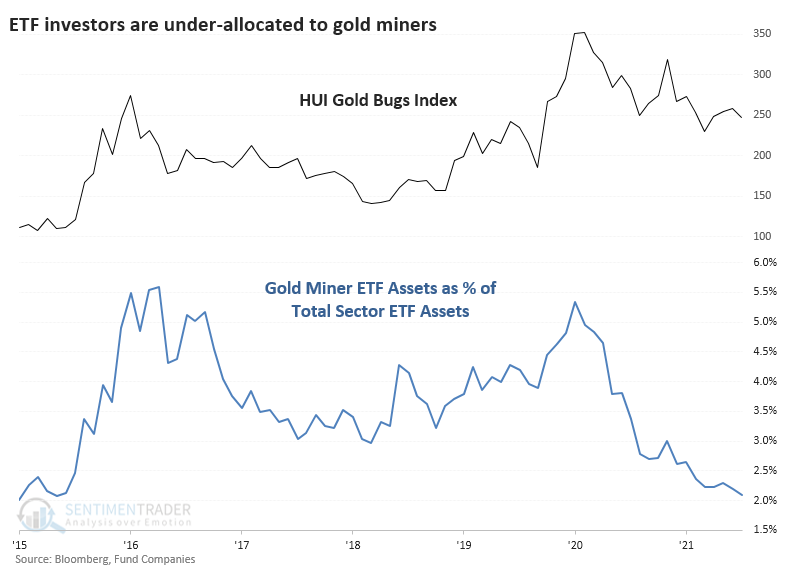
One of the most compelling arguments suggesting that this time might be different for gold mining stocks is simply how long they've been left out in the cold. For example, ETF investors have seemingly left the group for dead. Total fund assets in the 7 largest gold mining ETFs are barely 2% of total sector ETF assets. That's the lowest allocation since 2015 and is well off the peaks from 2016 and 2020 when gold miners accounted for more than 5% of sector assets.
Gold and the companies that mine it are heavily influenced by outside events that can overwhelm any other factor. We're likely seeing that play out at the moment. Historically, it's been an okay hedge as a small part of a portfolio, with occasional bouts of being attractive for a more significant allocation. That has usually come during extreme pessimism and washed-out conditions in mining stocks. Periods of newly positive momentum, like we're seeing right now, have been much more of a challenge. Miners still have a lot to prove before we'd consider them to be in a healthy environment.
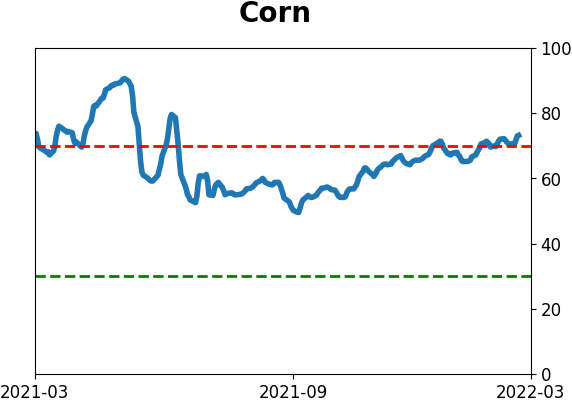
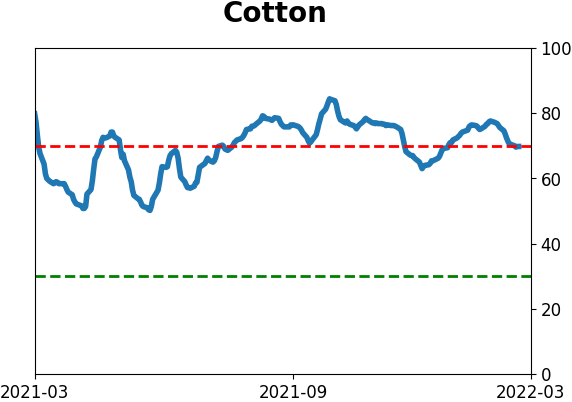
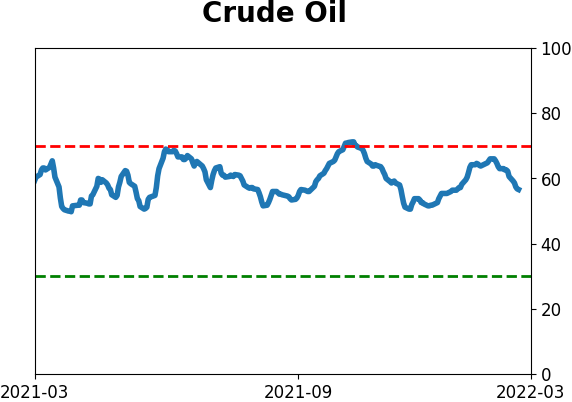
Commodities, in general, continue to surge
Dean looked at the continued surge in commodities.
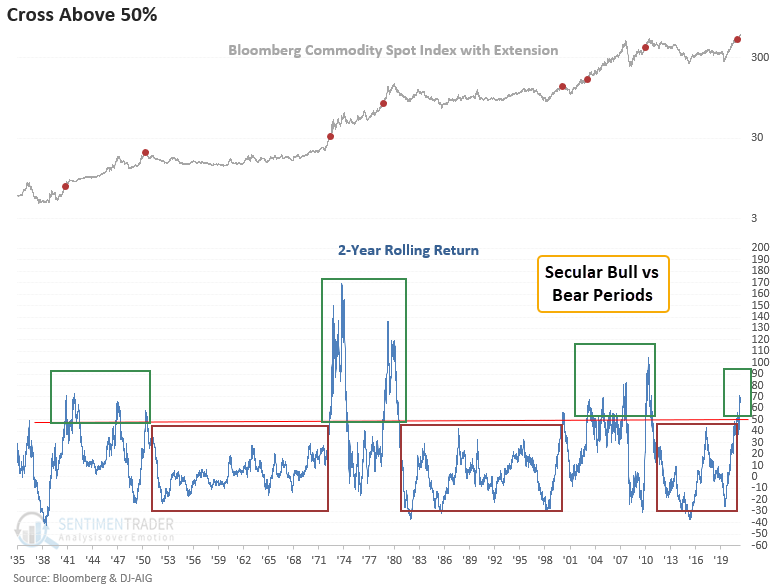
In a note published last October, he assessed the outlook for commodities when the 2-year rolling return for the Bloomberg Commodity Spot Index exceeds 50% for the first time. The 2-year rolling return continues to climb, which suggests the secular case for commodities remains constructive.
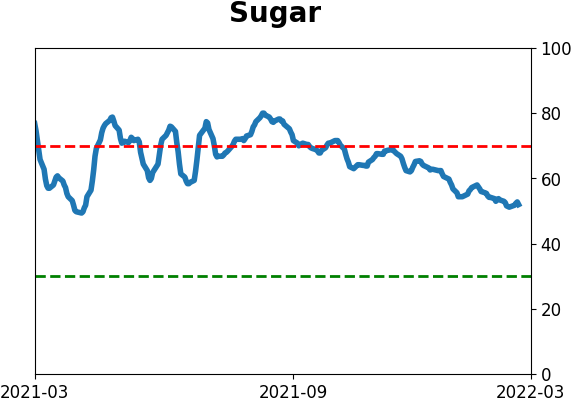
In a note published on in January, he looked at the outlook for the Bloomberg commodity spot price index when a basket of spot commodities trading above their respective 50-day average reverses from less than 40% to greater than 83%. The number of commodities trading above their respective 50-day continues to remain firm, with a reading of 95%. Sugar is the only commodity below its 50-day average.
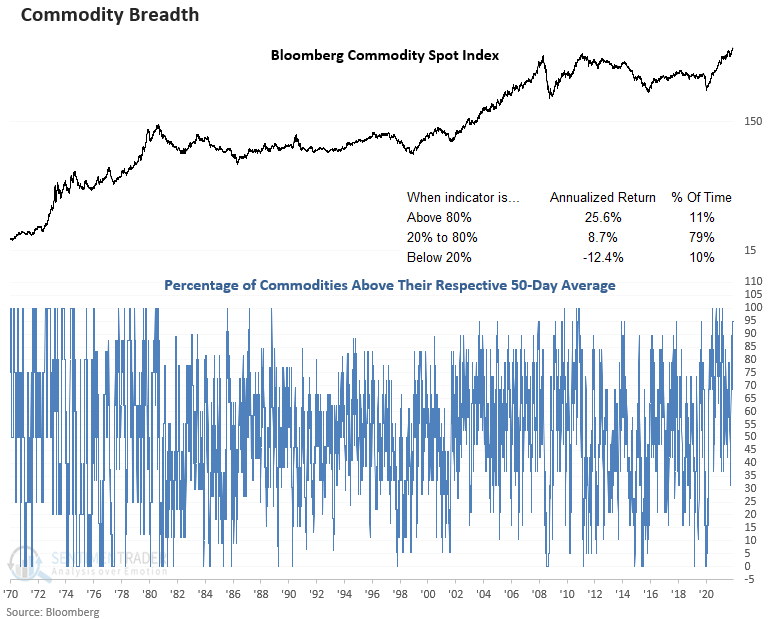
The 6.5% gain in the first month is the best performance in that time frame since a signal in February 2008.
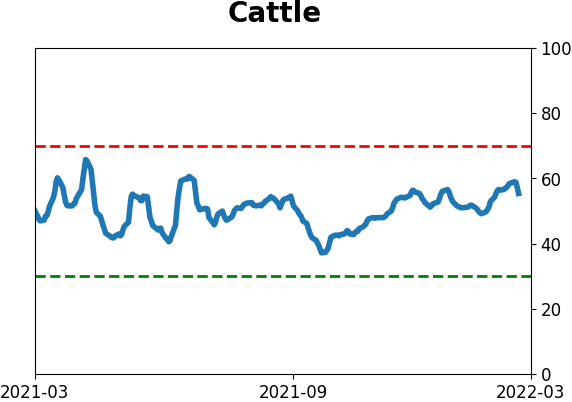
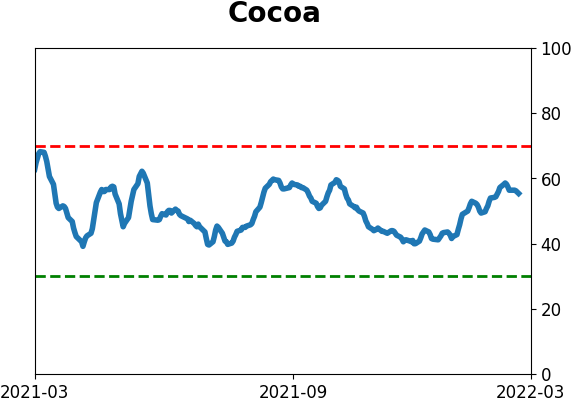
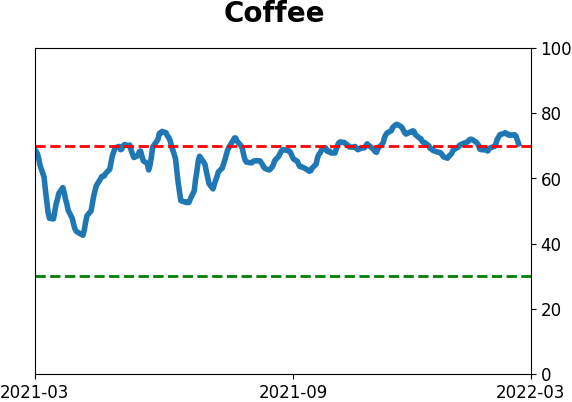
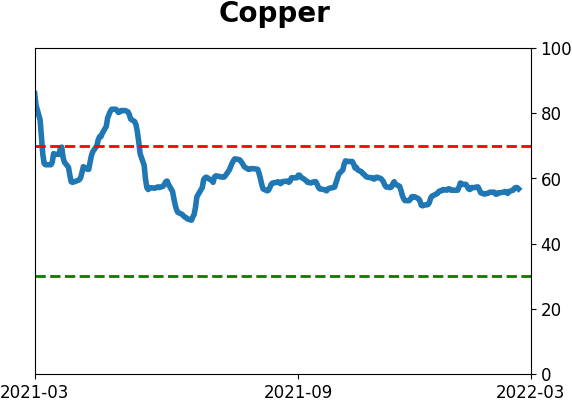
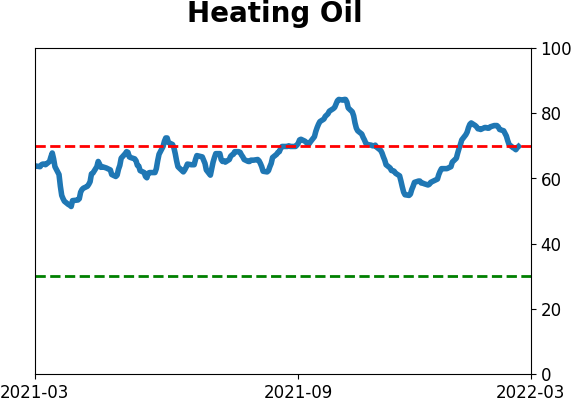
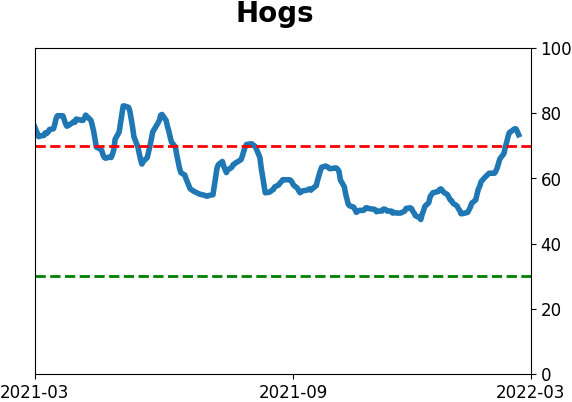
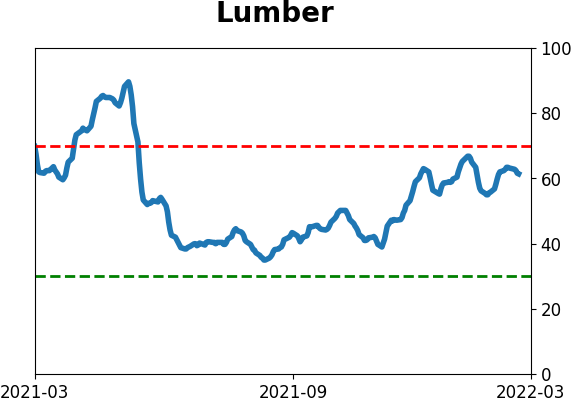
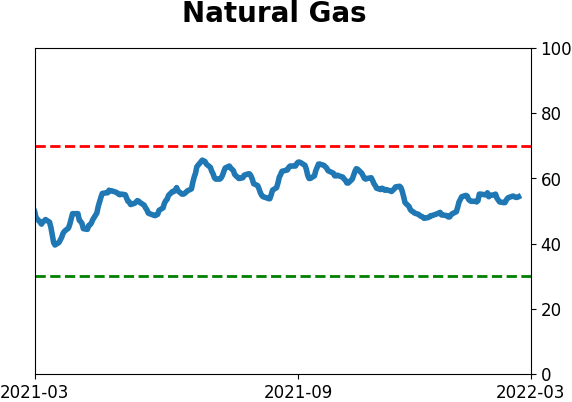
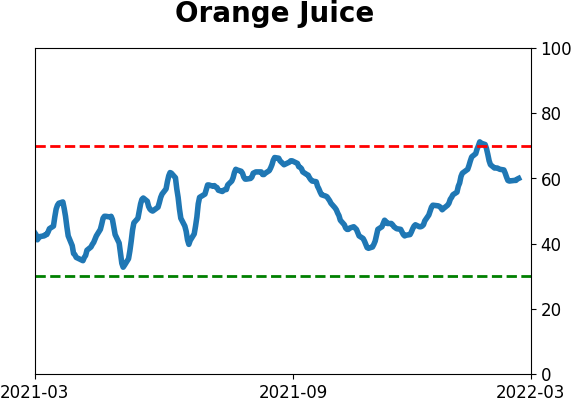
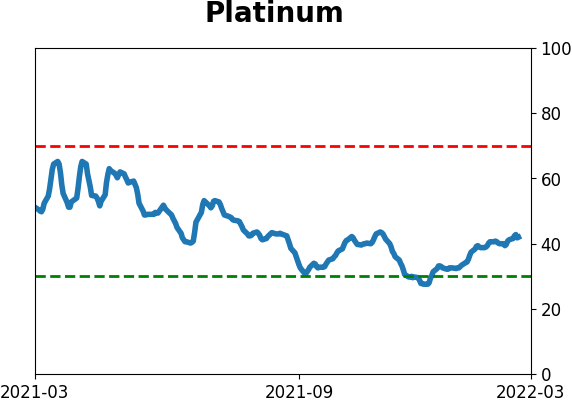
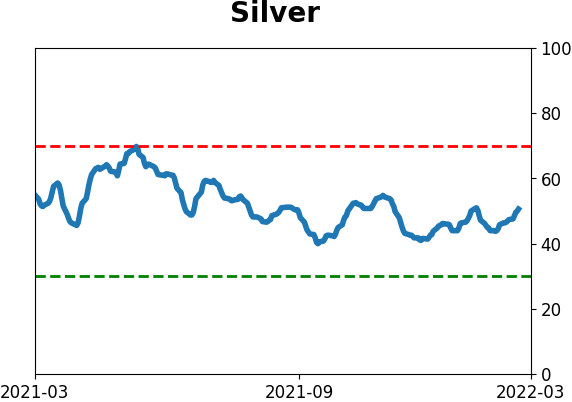
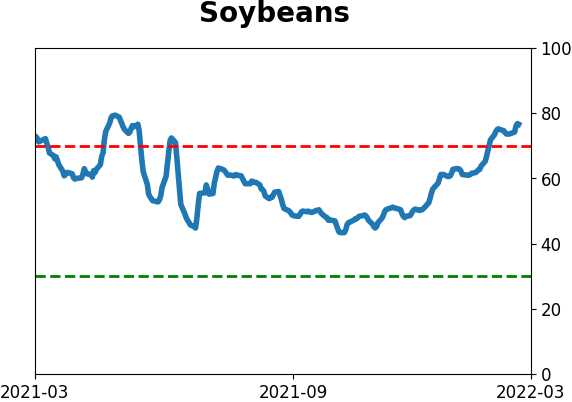
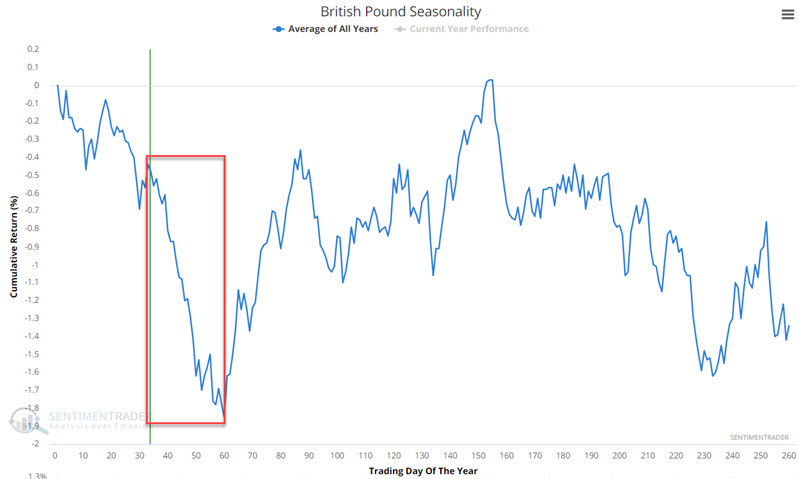
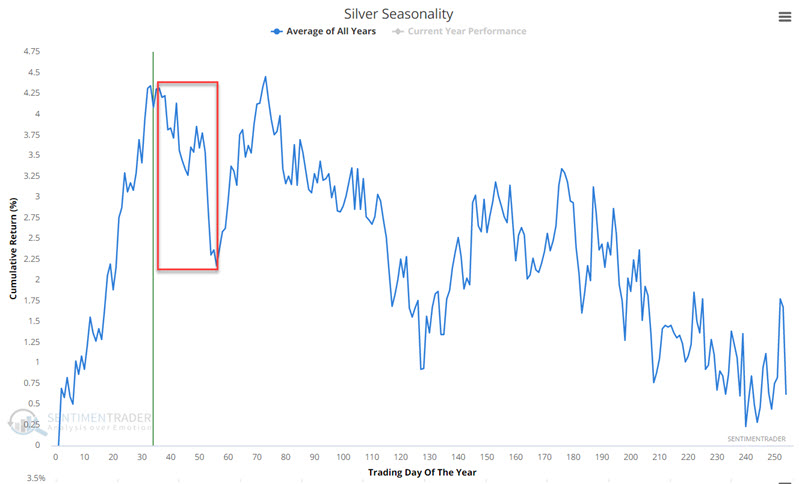
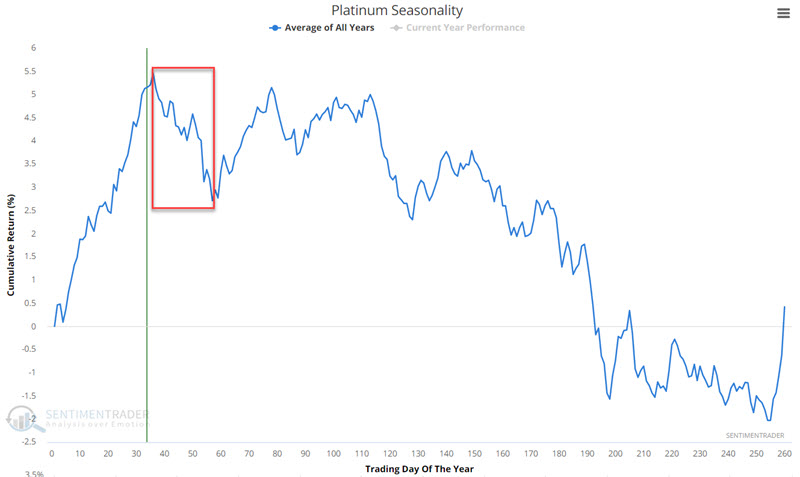
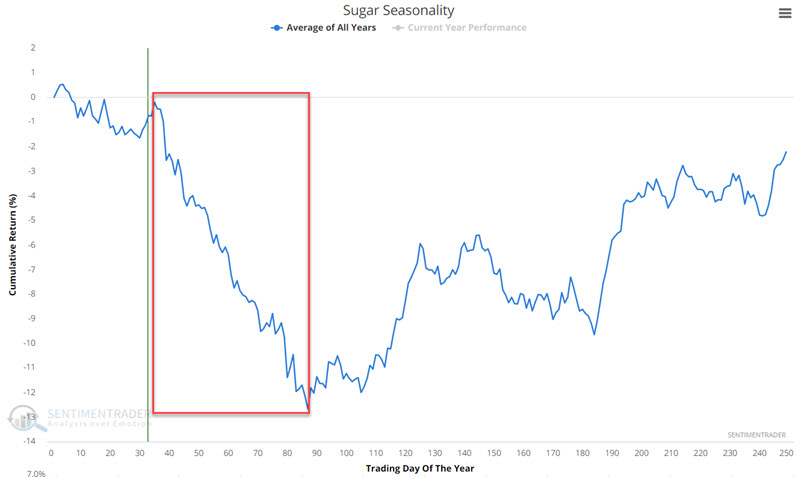
A seasonal weak spot for several of them
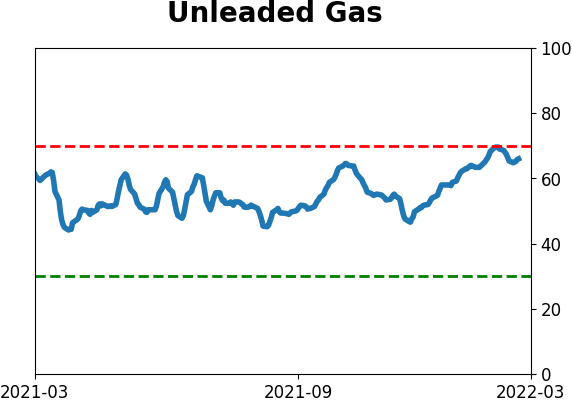
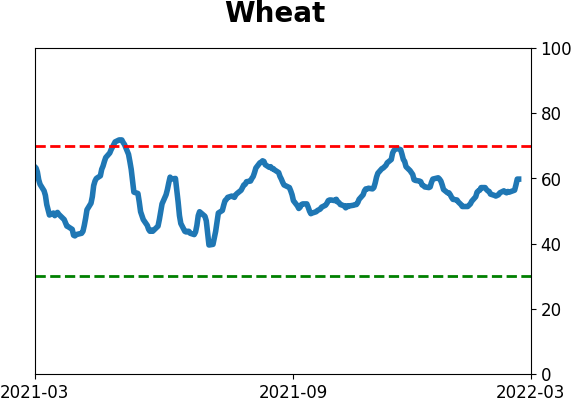
Many commodities exhibit strong seasonal tendencies. Jay showed that four that tend to experience late winter weakness are silver, platinum, sugar, and the British pound. No seasonal trend is perfect, but being aware of tendencies can offer a trader a critical "edge" in deciding how to play certain situations.
The charts below show their seasonal tendencies with the late-winter period highlighted in red.
Discretionary stocks, however, are entering their best period
While many commodities are entering a seasonally weak window, one equity sector, in particular, is doing the opposite.
Jay looked at the monthly total return performance for the S&P 500 Consumer Discretionary sector during March, April, May, July, November, and December each year (the favorable months) versus all other months since 1977.
The chart below displays the cumulative total return ONLY during the six favorable months.
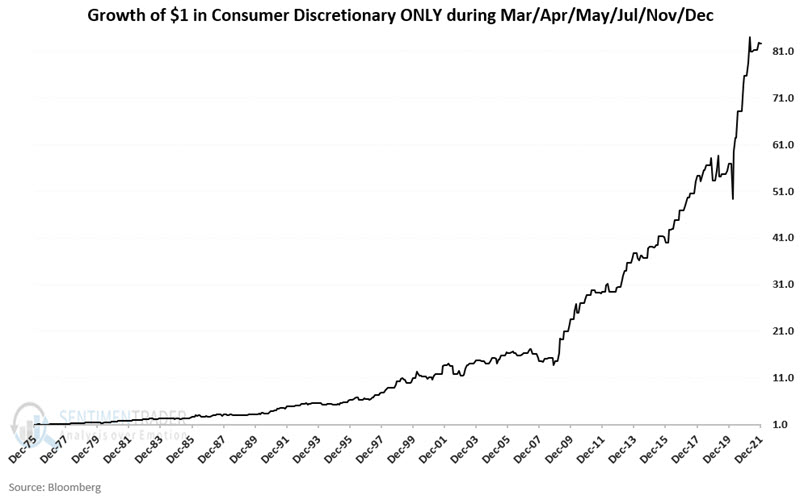
The sector can and does decline from time to time during these seasonally favorable months, but the lower left to upper right nature of the equity curve is fairly steady over time. All told, the sector index grew +8,172% during these months.
The chart below displays the cumulative total return ONLY during all the other months.
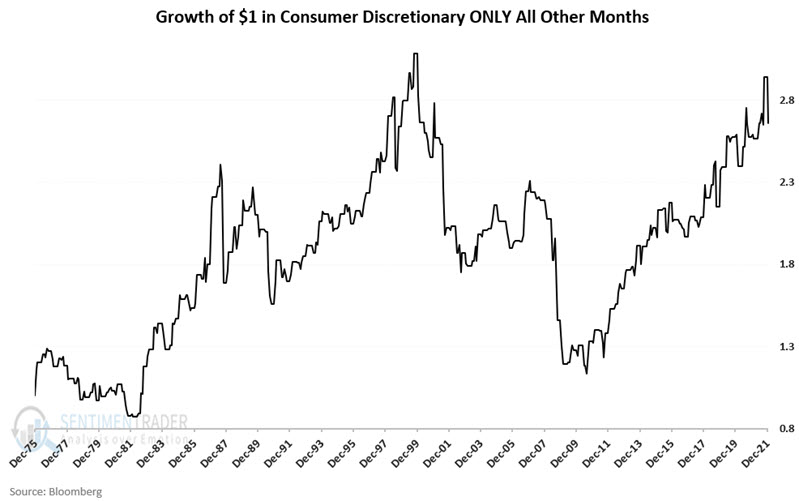
The results during these months have been significantly less consistent. All told, the sector index grew +166% during these months.
About the Weekly Wrap...
The goal of the Weekly Wrap is to summarize our recent research. Some of it includes premium content (underlined links), but we're highlighting the key focus of the research for all. Sometimes there is a lot to digest, with this summary meant to highlight the highest conviction ideas we discussed. Tags will show any symbols and time frames related to the research.
Active Studies
| Time Frame | Bullish | Bearish | | Short-Term | 3 | 0 | | Medium-Term | 18 | 2 | | Long-Term | 15 | 5 |
|
Indicators at Extremes
Portfolio
| Position | Description | Weight % | Added / Reduced | Date | | Stocks | RSP | 21.4 | Added 10.2% | 2022-01-28 | | Bonds | 32.7% BND, 7.1% SCHP | 40.1 | Added 8.3% | 2021-10-26 | | Commodities | GCC | 2.4 | Reduced 2.1%
| 2020-09-04 | | Precious Metals | GDX | 4.6 | Reduced 4.2% | 2021-05-19 | | Special Situations | 7.6% KWEB, 4.9% XBI, 3.7% XLE, 1.8% PSCE | 18.0 | Added 4.6% | 2022-02-24 | | Cash | | 13.2 | | |
|
Updates (Changes made today are underlined)
With a typical time frame of several months in this account, I normally don't make changes so quickly. I've added back part of the stock exposure I took off earlier in January due to the washed-out conditions and extreme pessimism we're seeing across a wide array of metrics. The biggest issue is that the environment is unhealthy and we could be in the throes of a protracted bear market. Even so, the readings we've seen recently have a good record at preceding relief rallies, so we'll have to see how that pans out. Bond sentiment is trying to recover from a recent bout of pessimism, and gold stocks are doing their thing which is not much at all. They've been flat for six months. Chinese tech stocks were doing exactly what they're supposed to do, then did *not* by plunging to new lows. This is troubling on a shorter-term time frame, but this was never meant for a trade, rather a multi-year investment. Recent behavior is troubling and I will not be adding any exposure as long as that's the case. RETURN YTD: -0.3% 2021: +8.7%, 2020: +8.1%, 2019: +12.6%, 2018: +0.6%, 2017: +3.8%, 2016: +17.1%, 2015: +9.2%, 2014: +14.5%, 2013: +2.2%, 2012: +10.8%, 2011: +16.5%, 2010: +15.3%, 2009: +23.9%, 2008: +16.2%, 2007: +7.8%
|
|
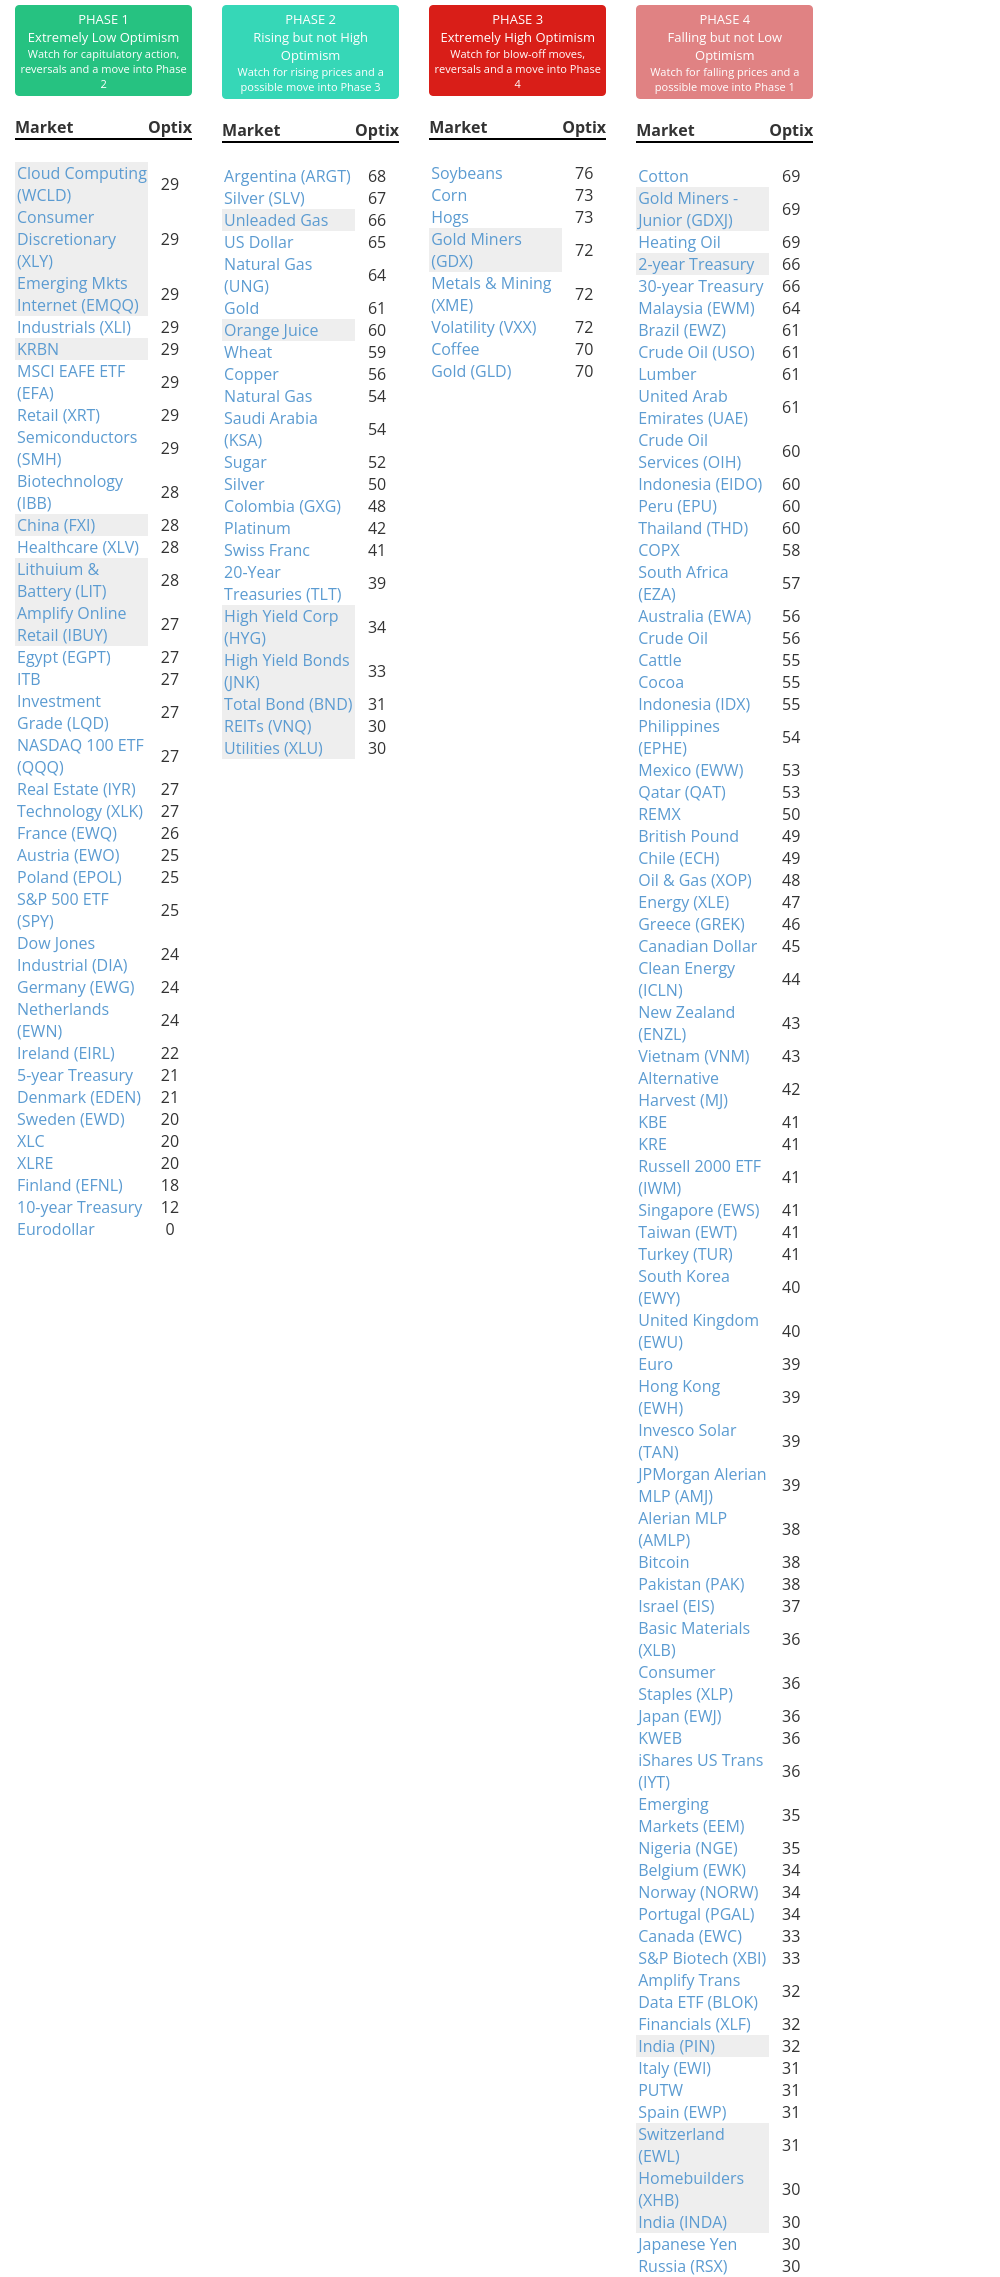
Phase Table
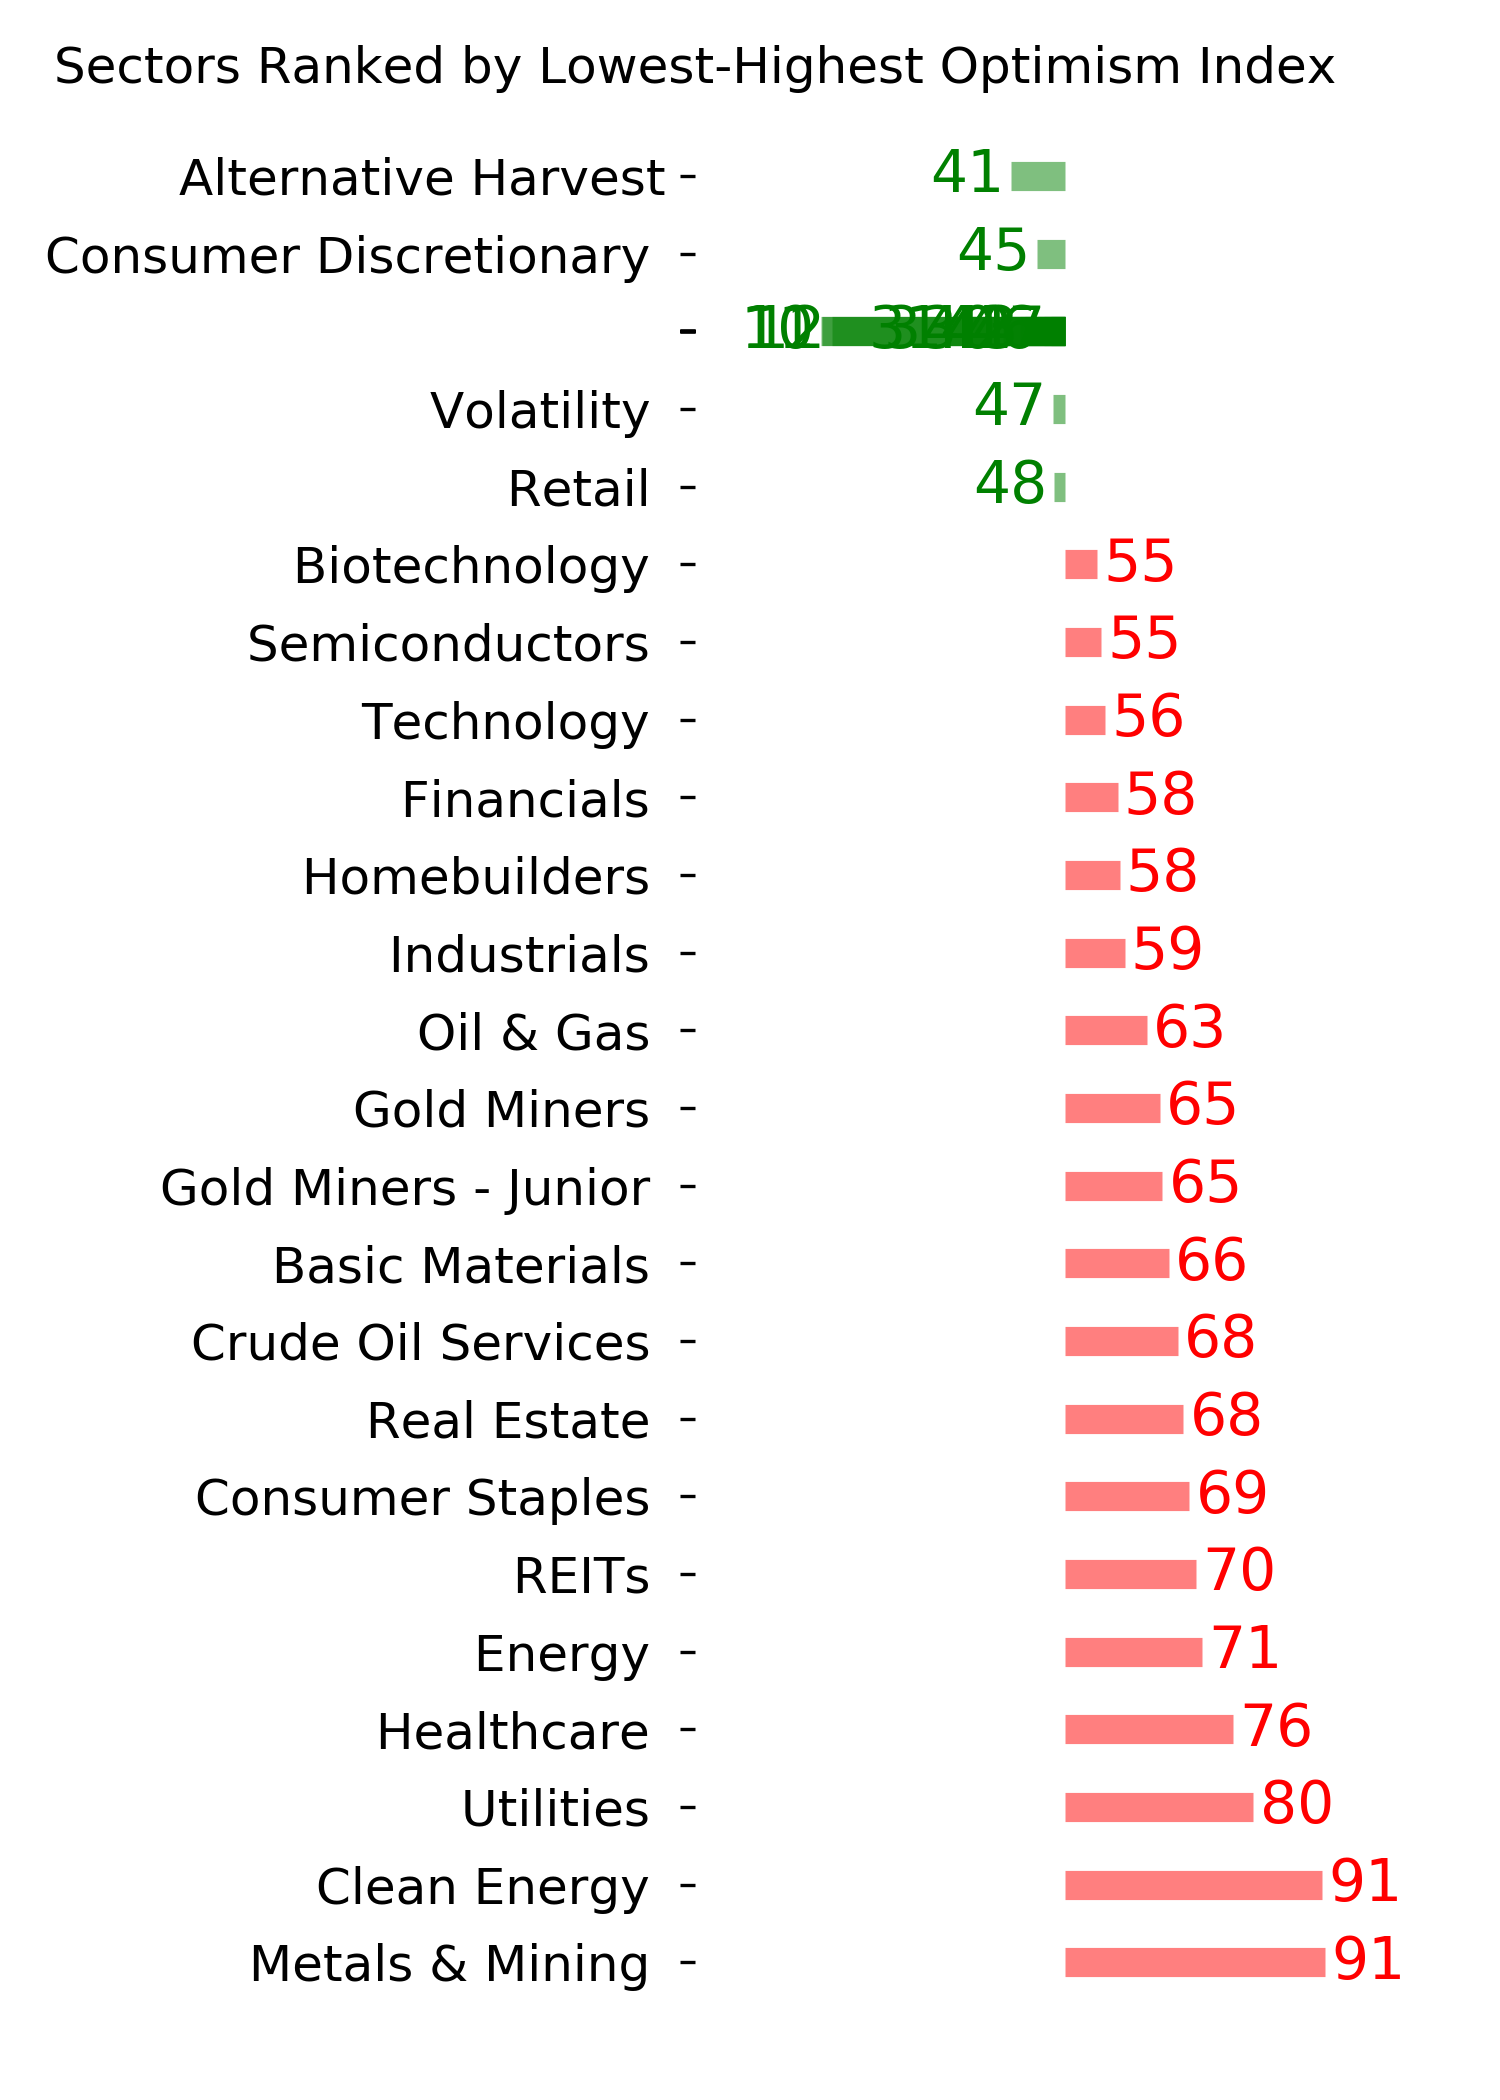
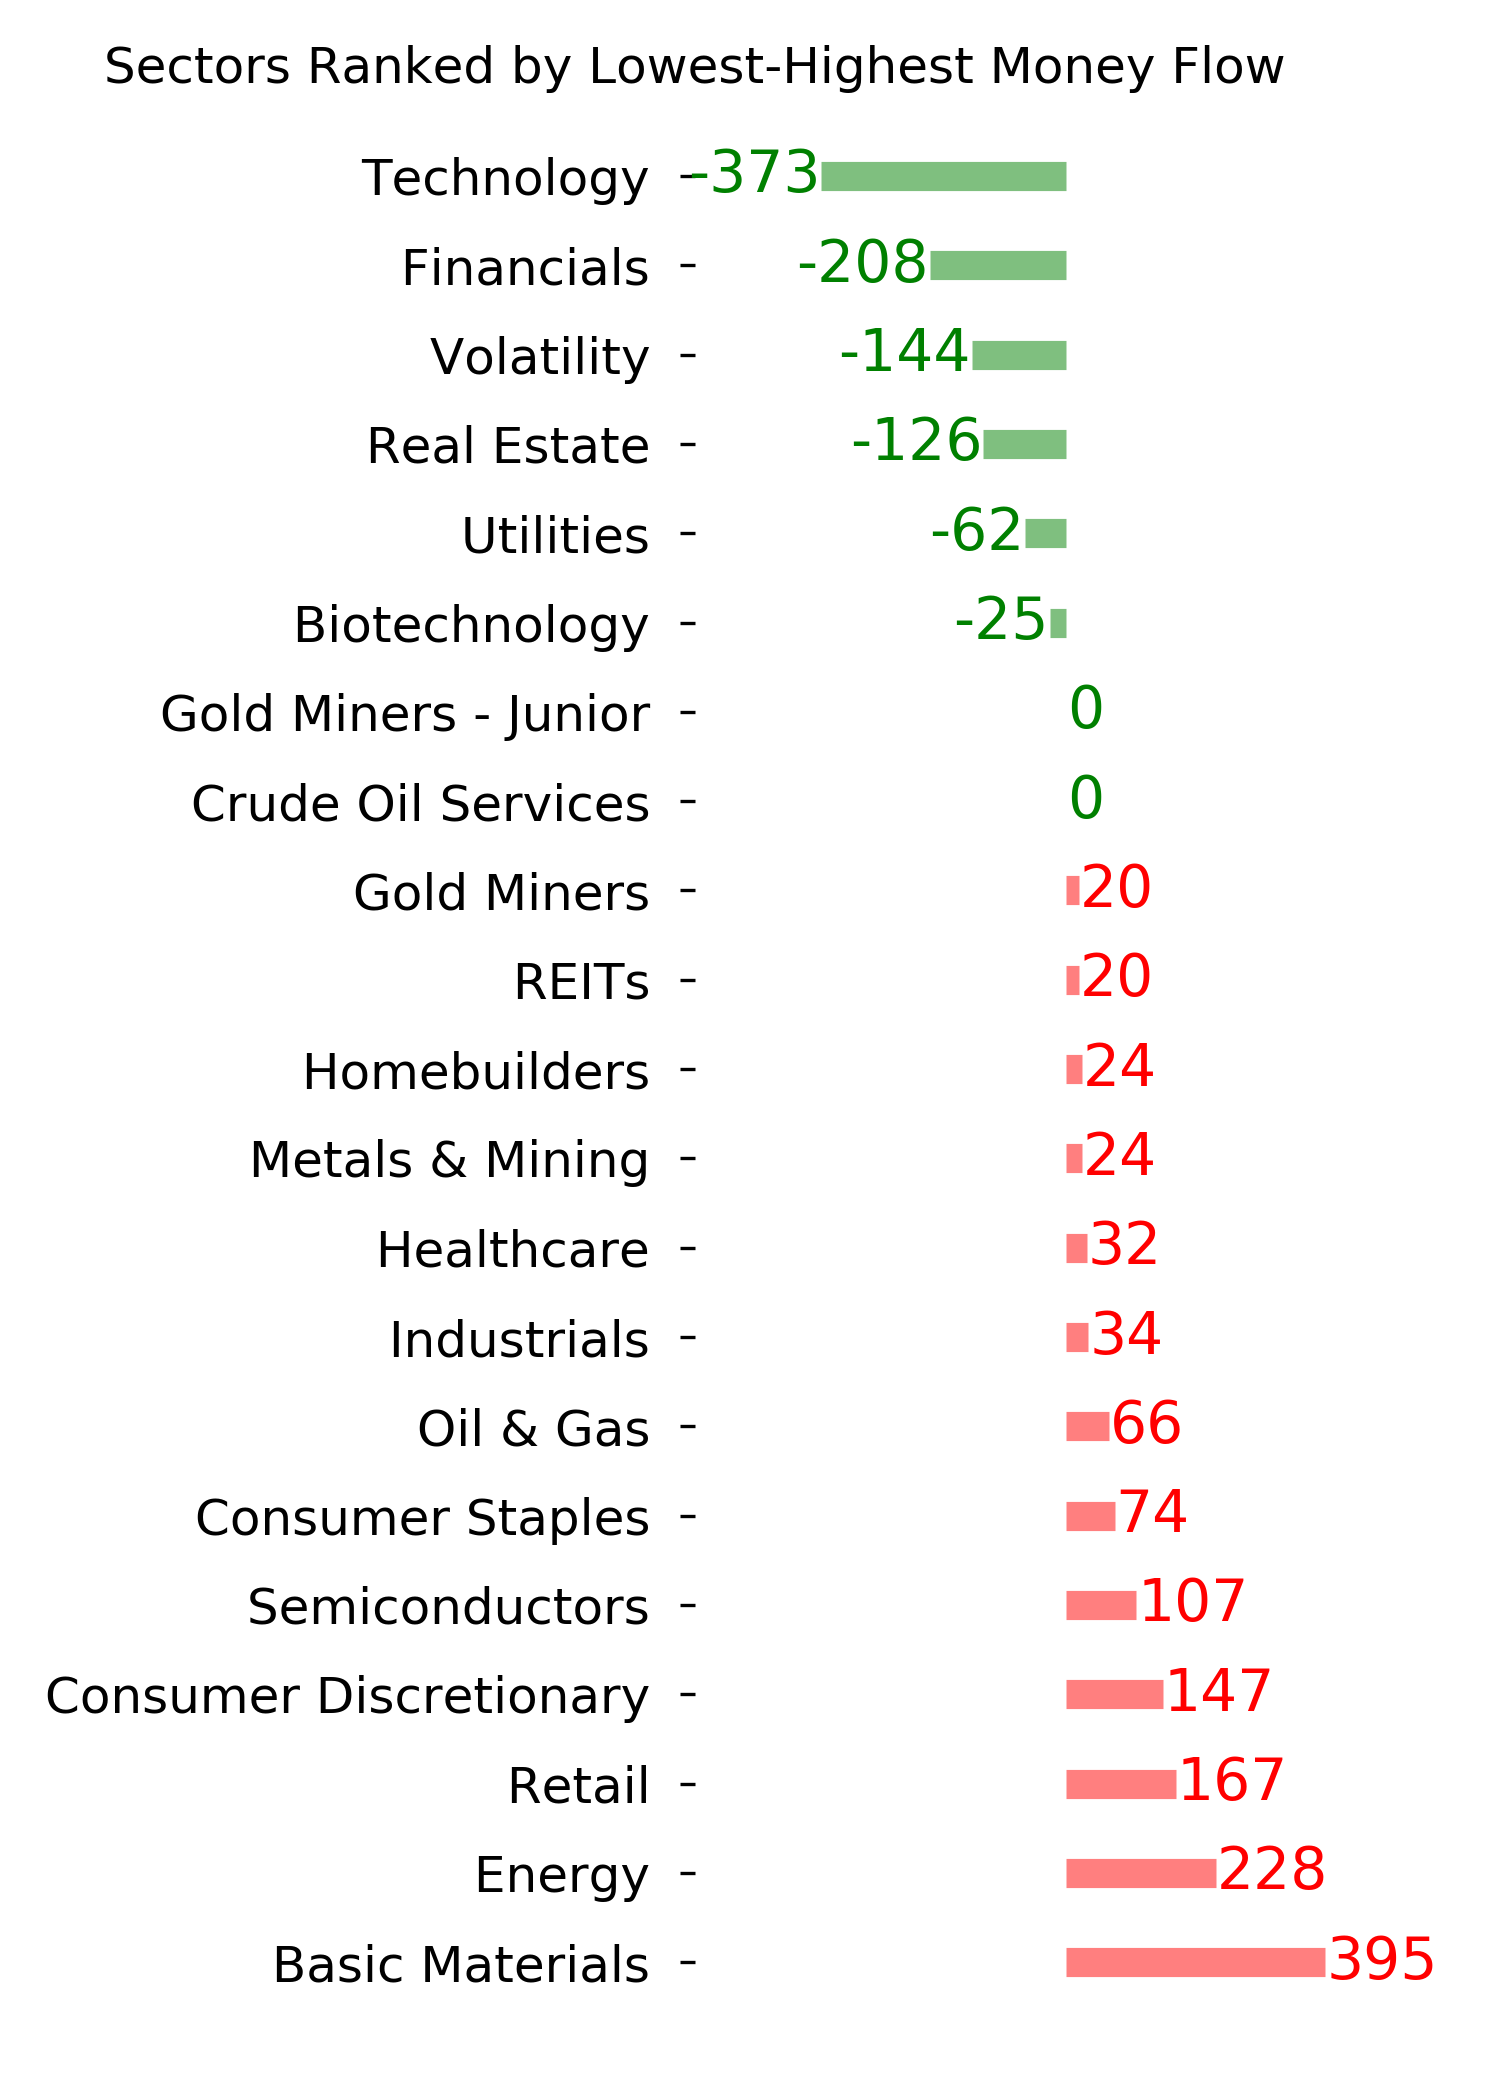
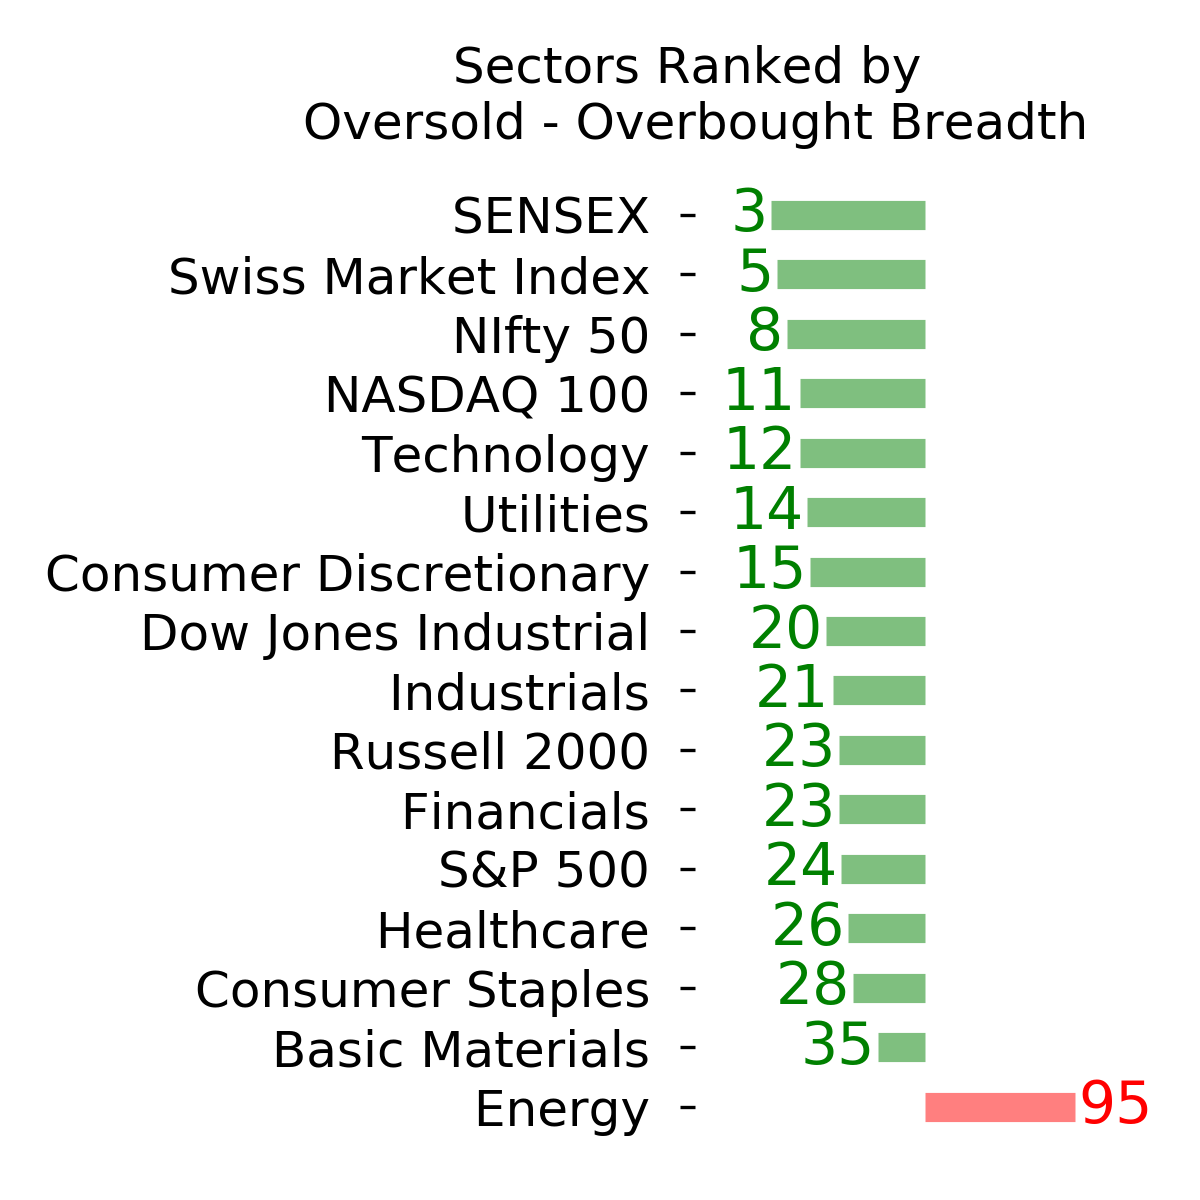
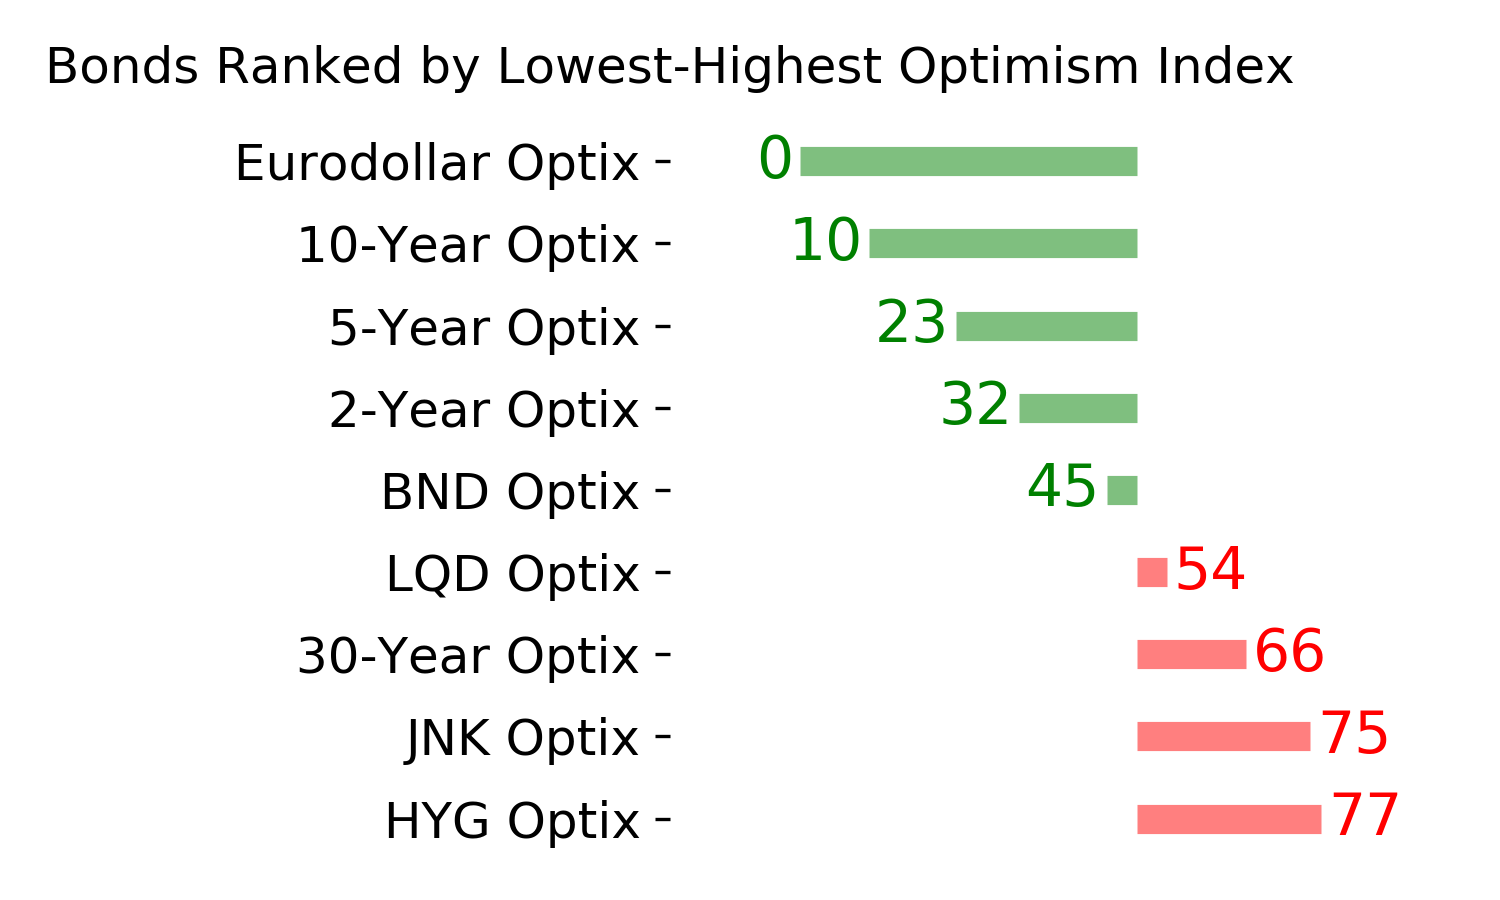
Ranks
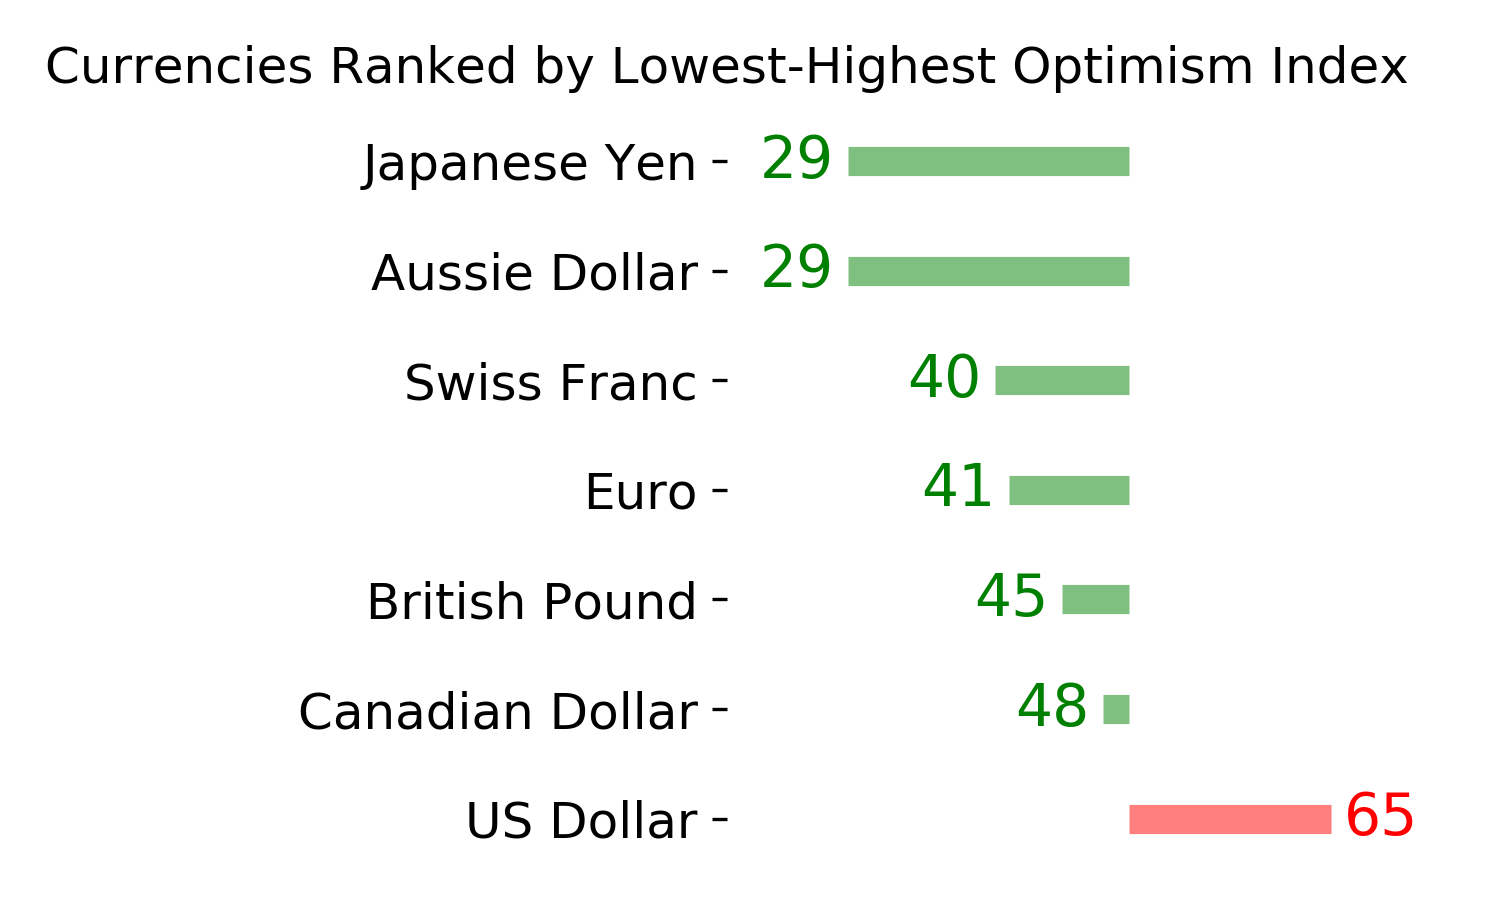
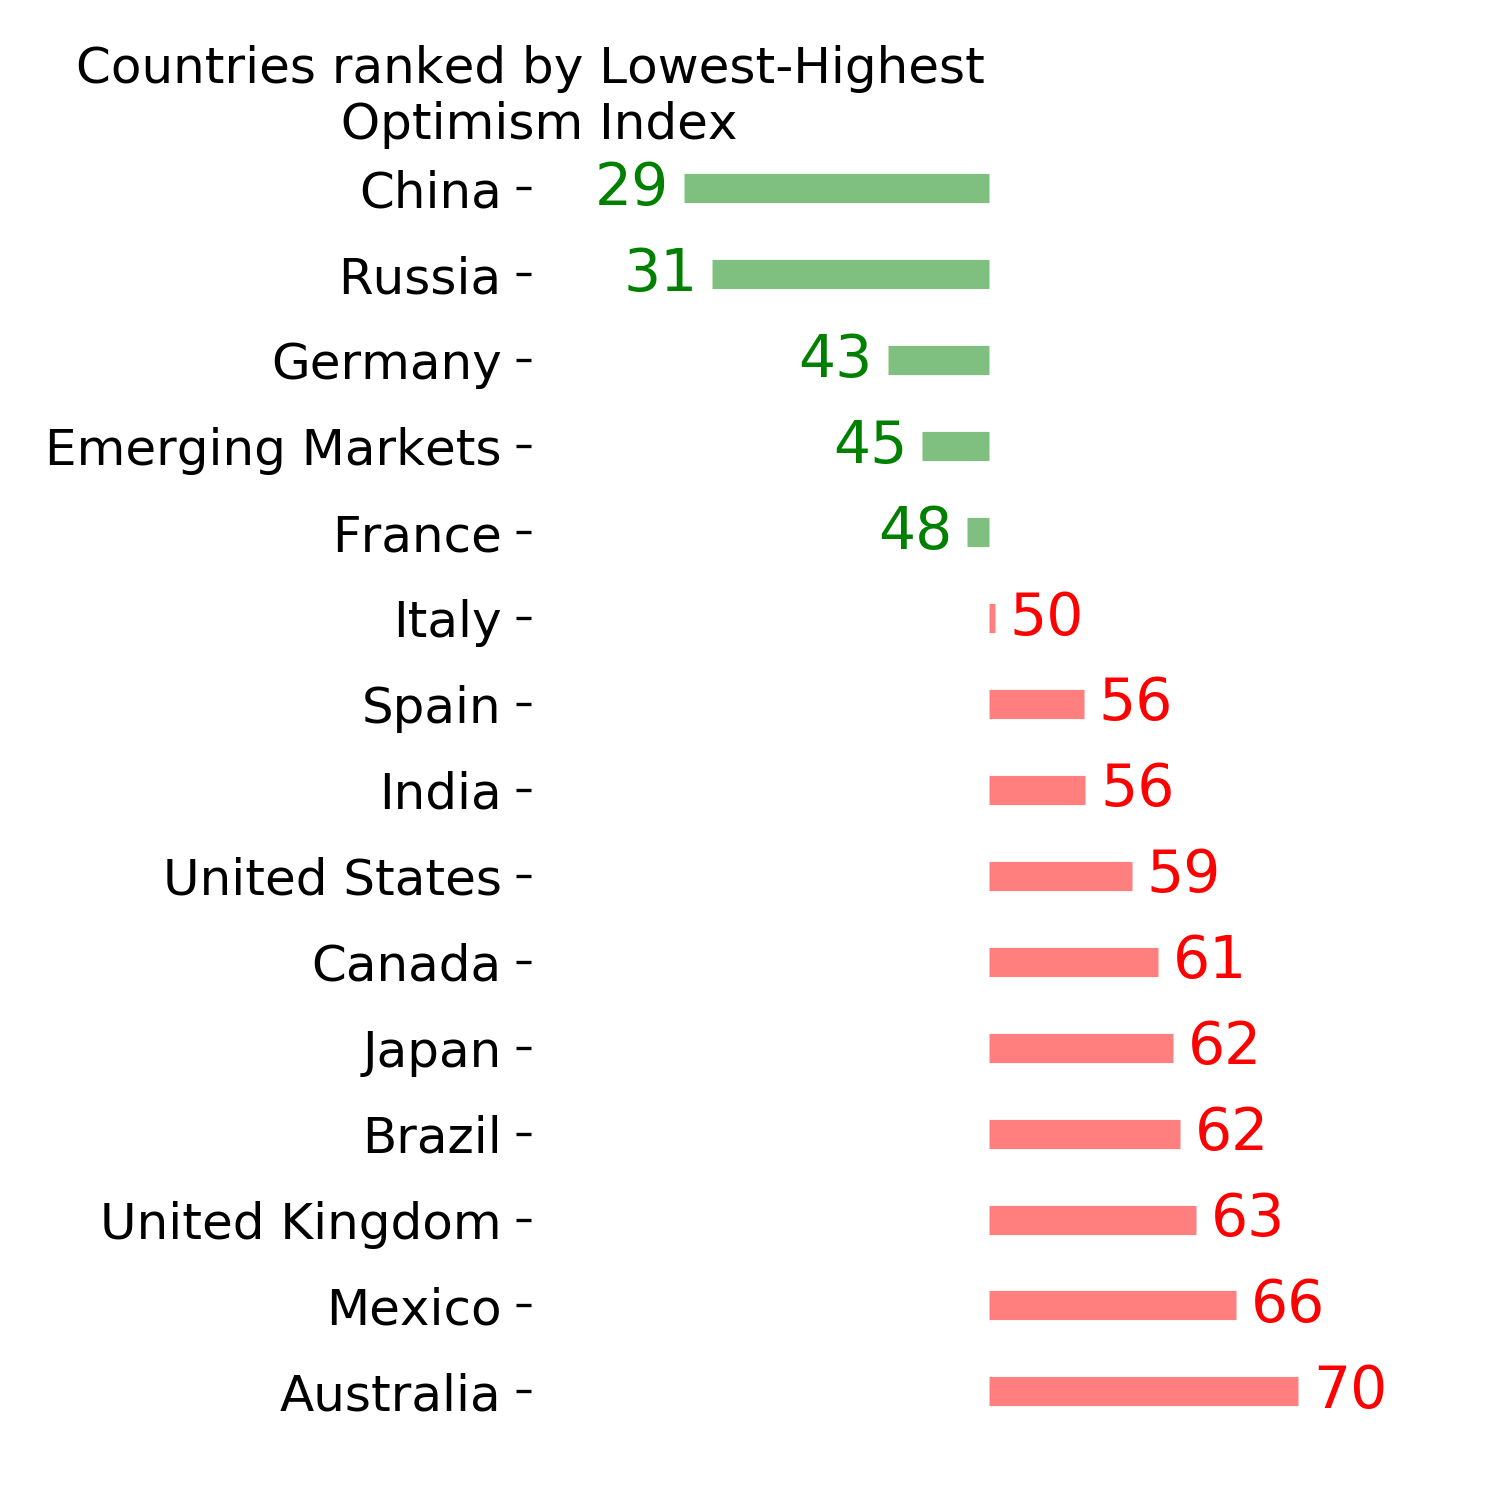
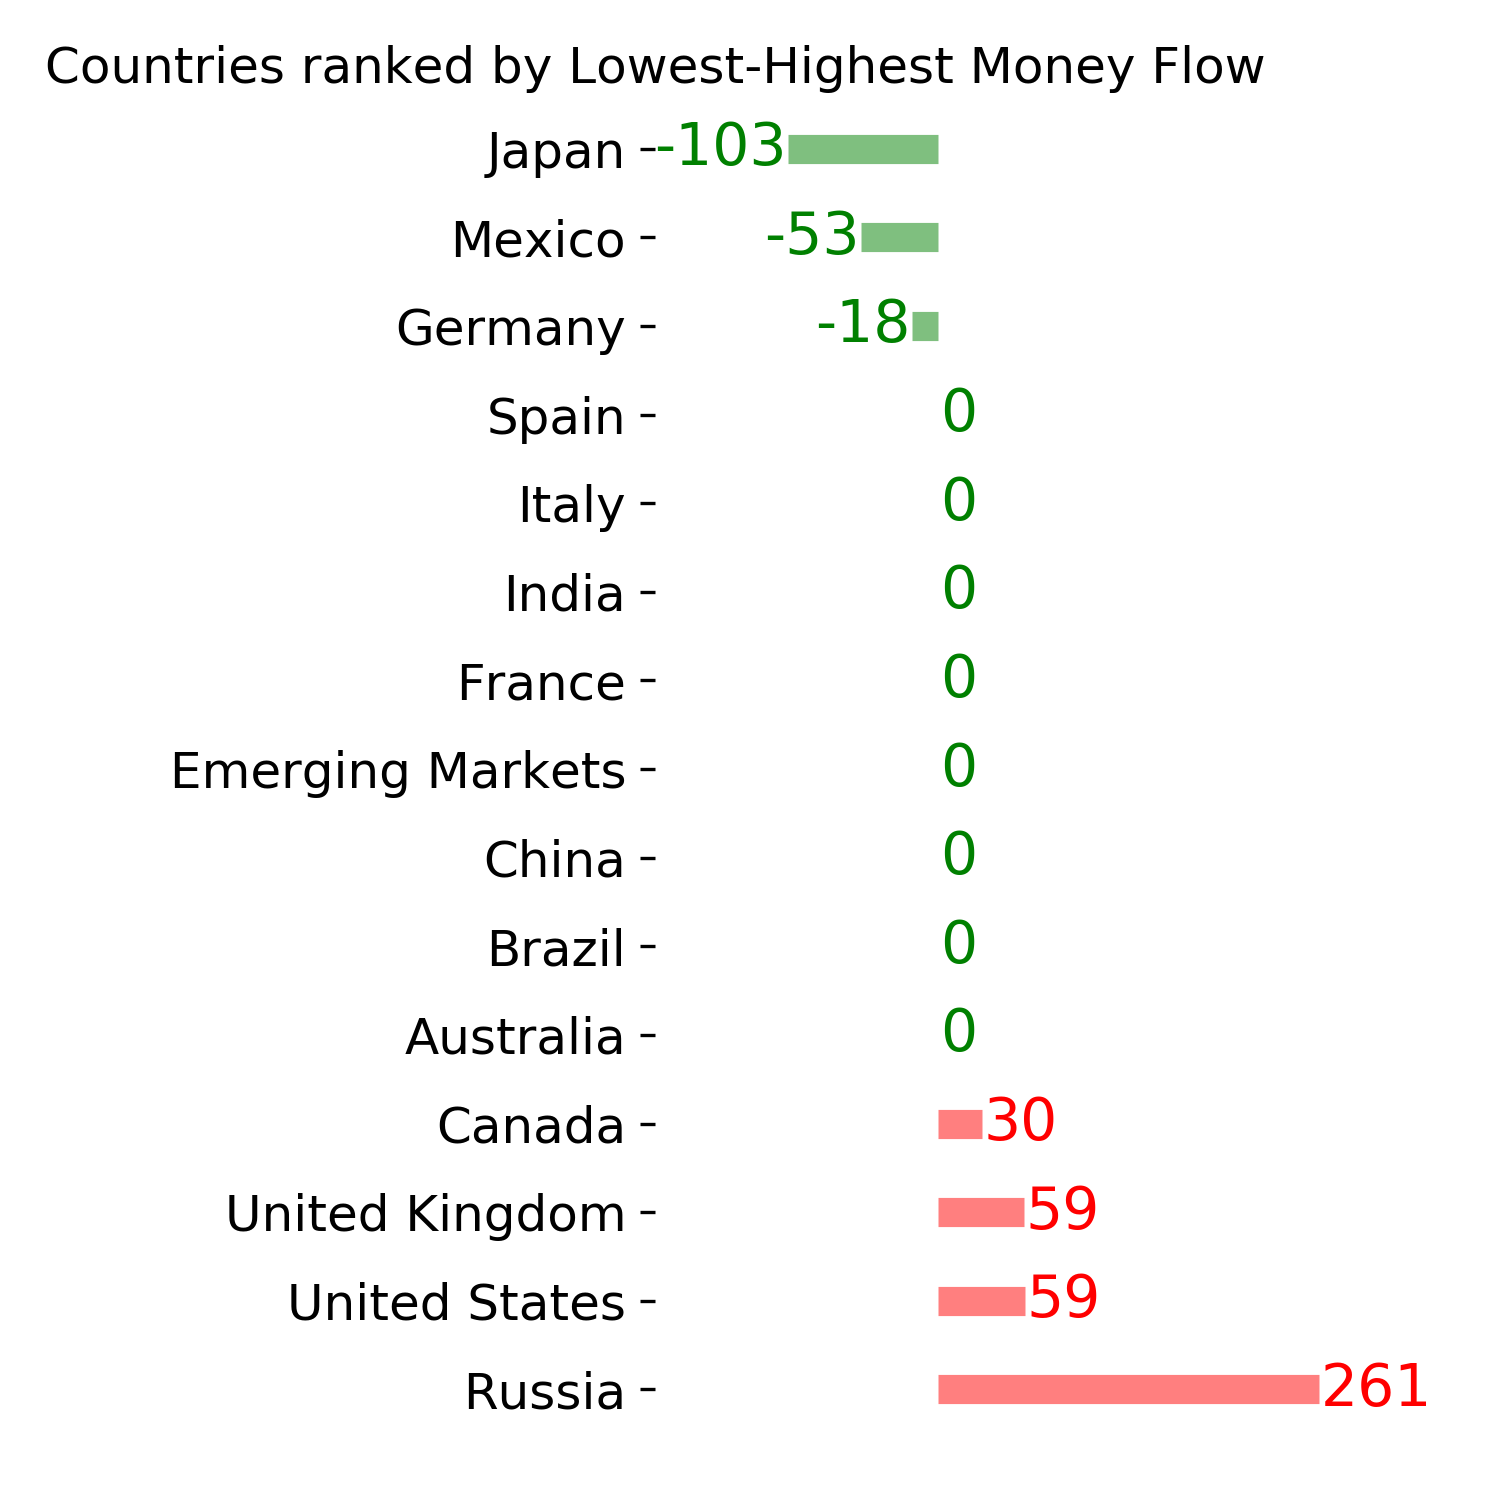
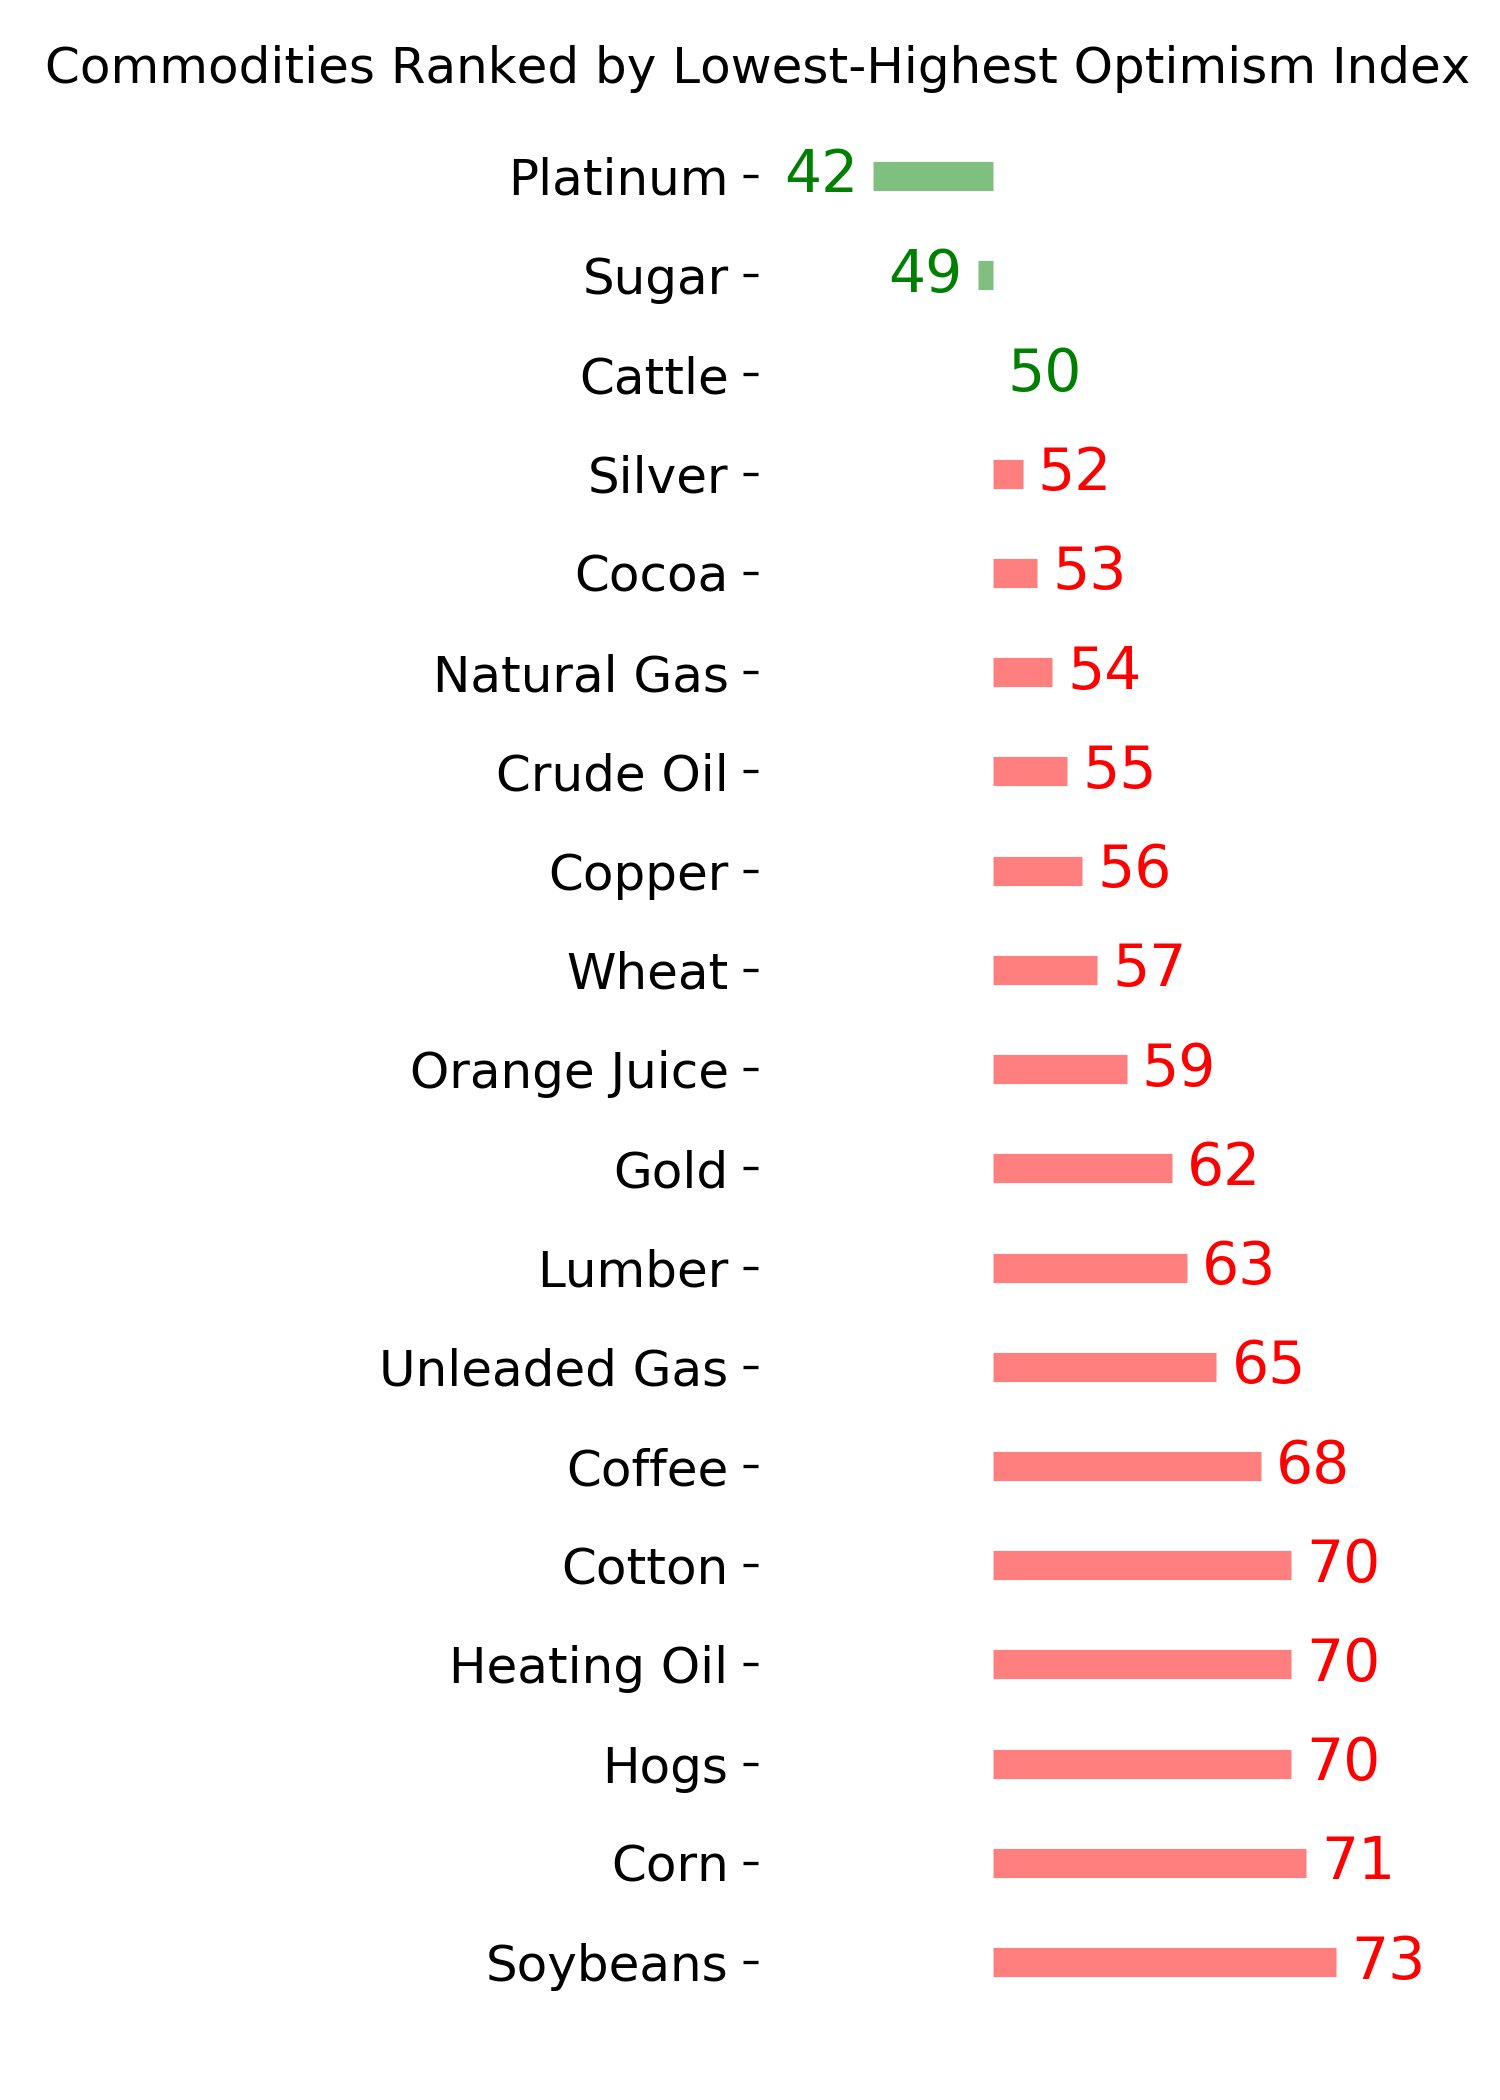
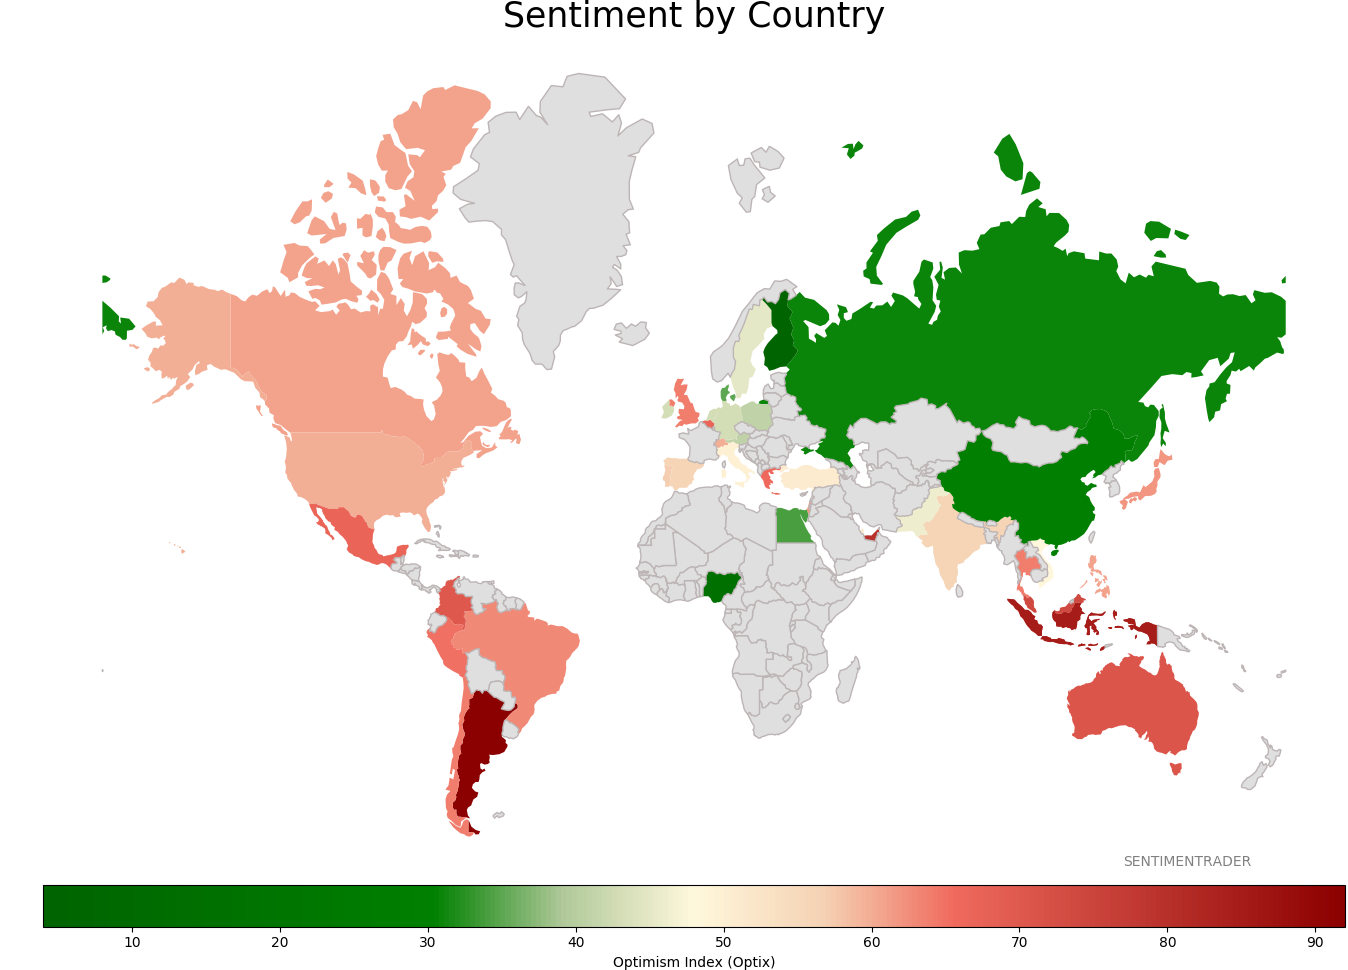
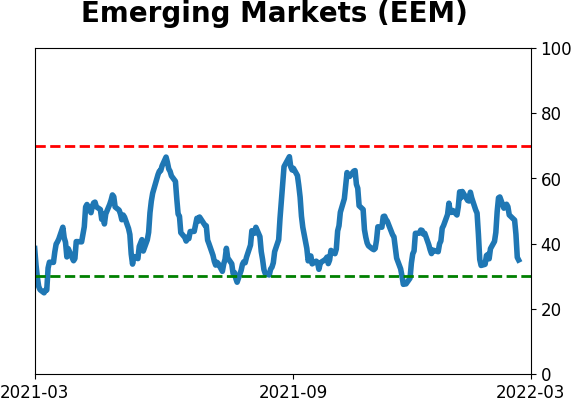
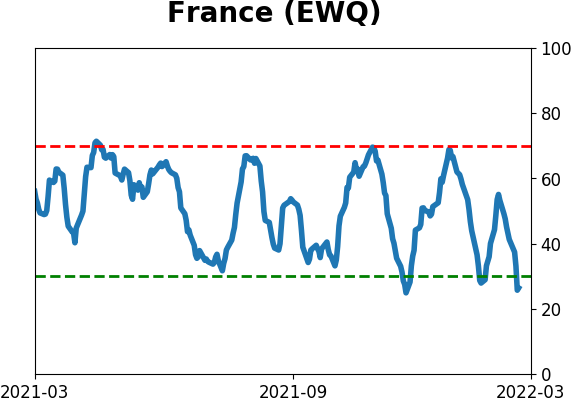
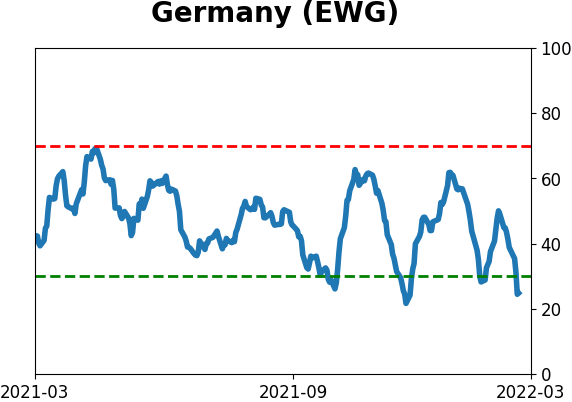
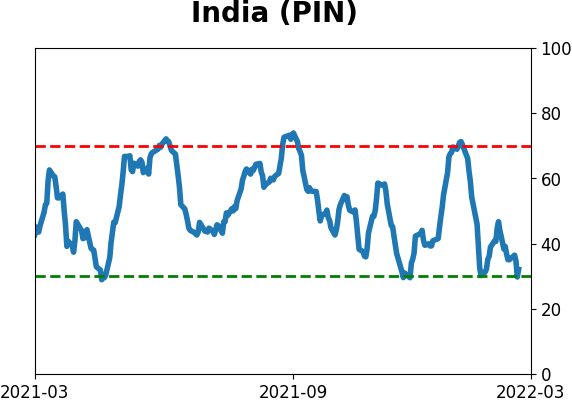
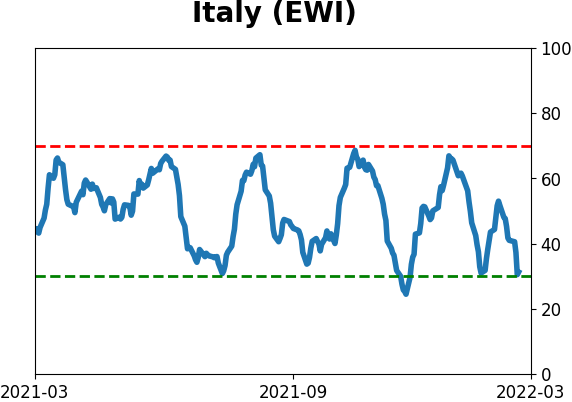
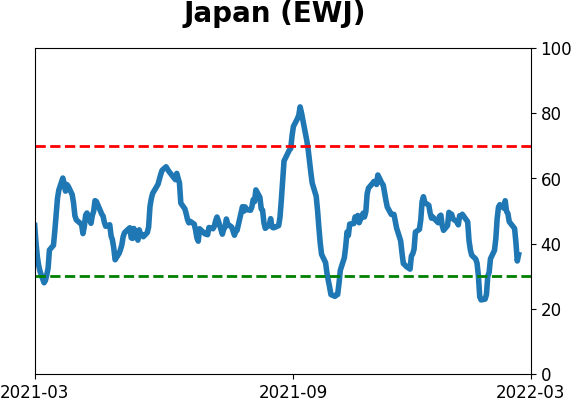
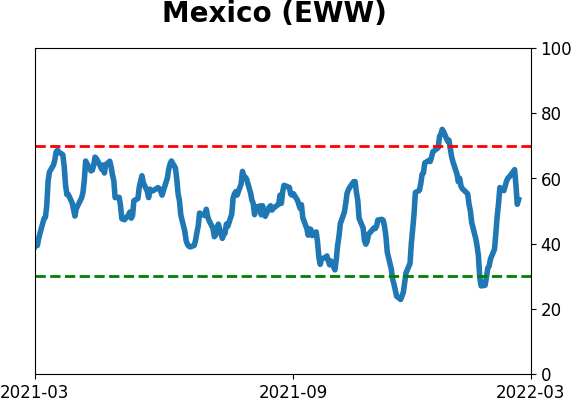
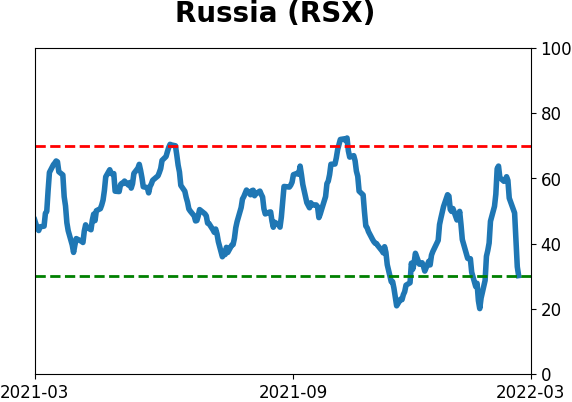
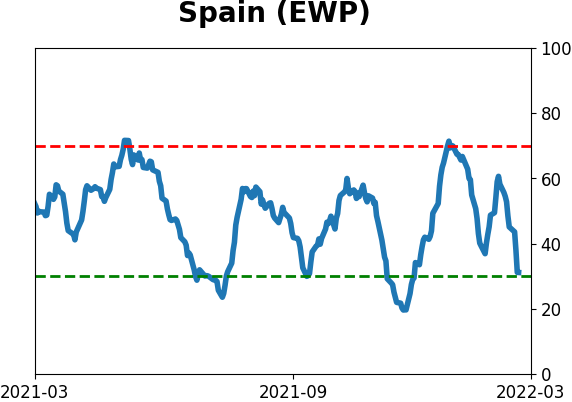
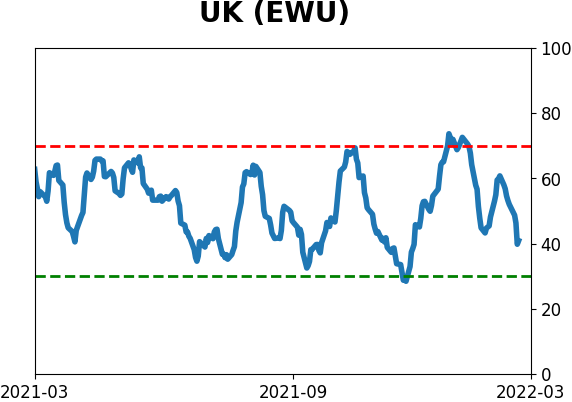
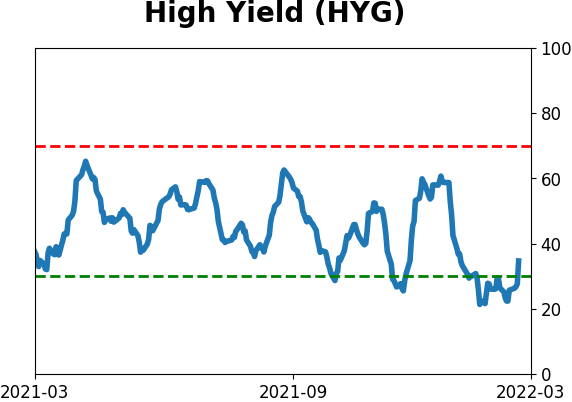
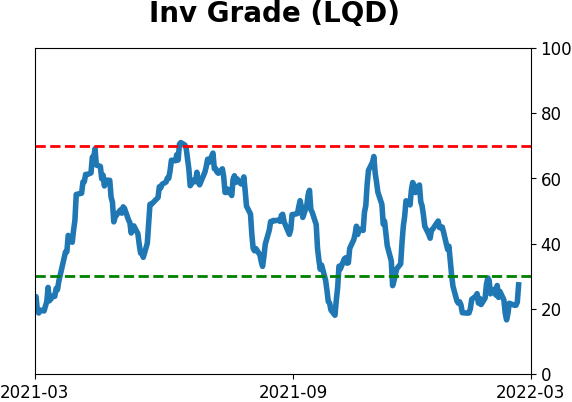
Sentiment Around The World
Optimism Index Thumbnails
|
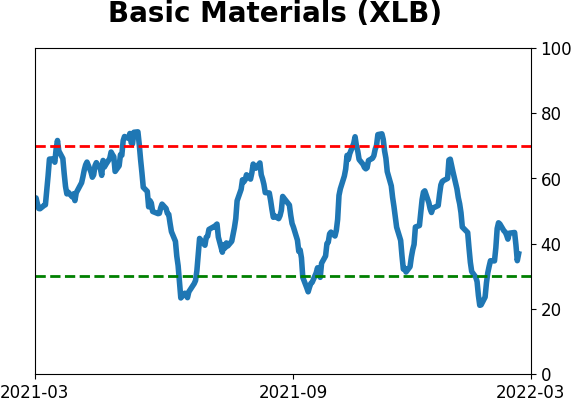
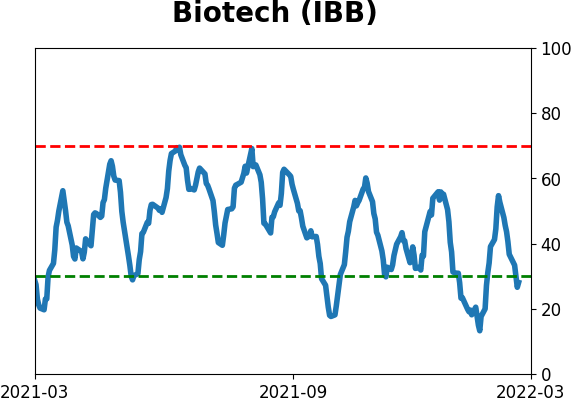
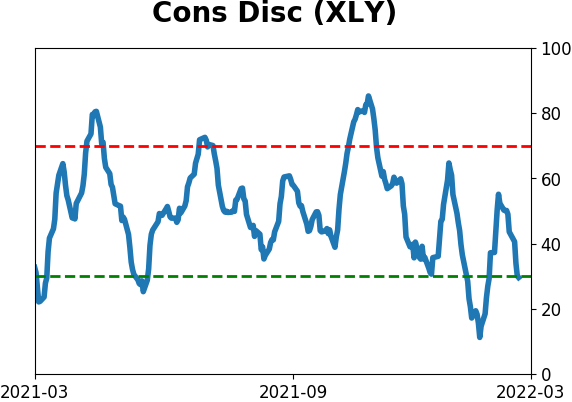
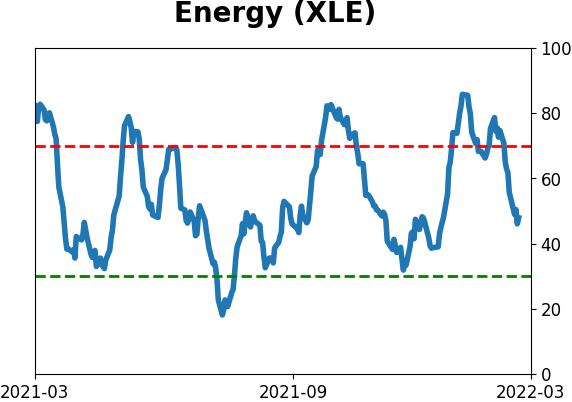
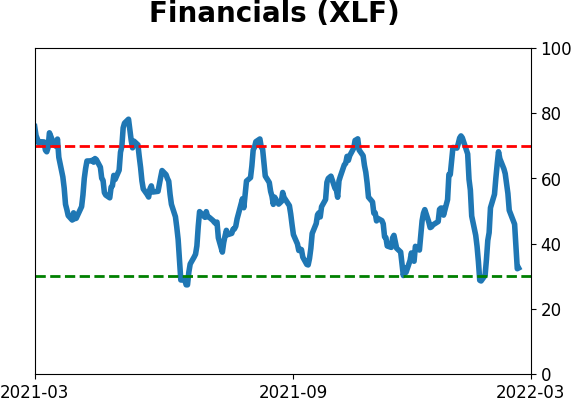
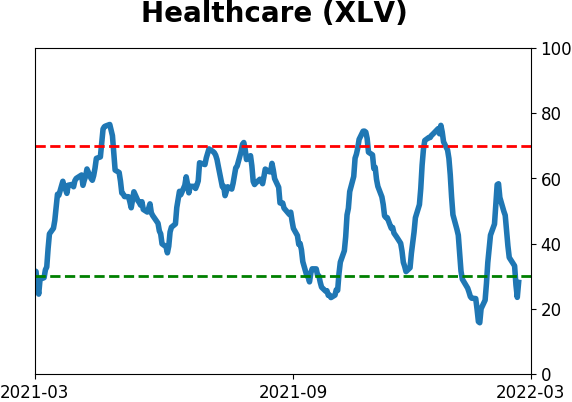
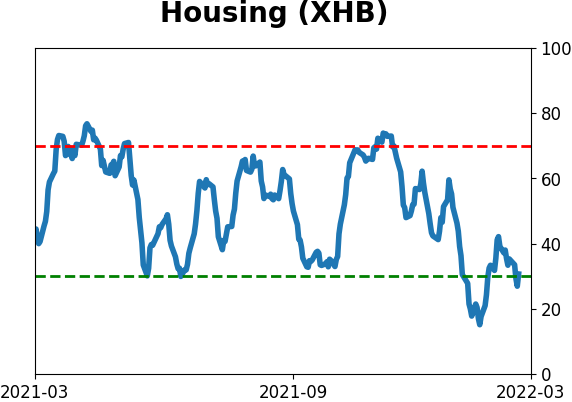
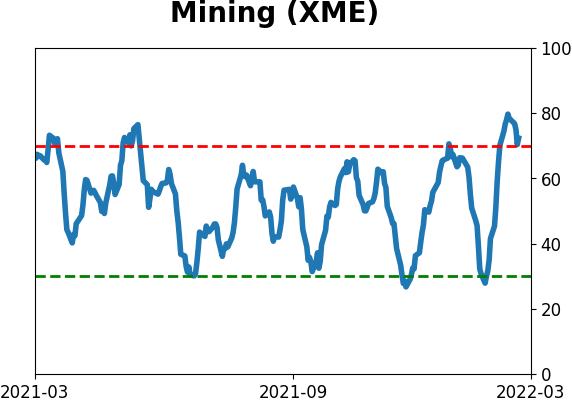
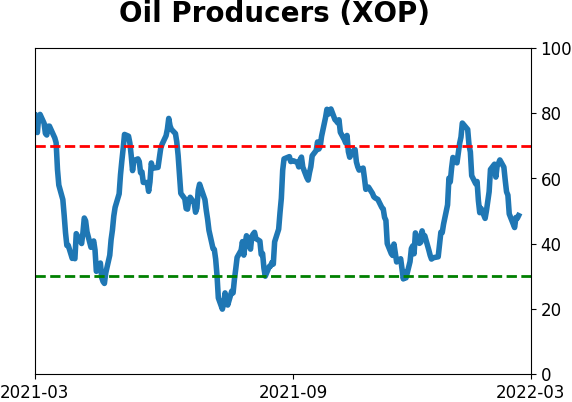
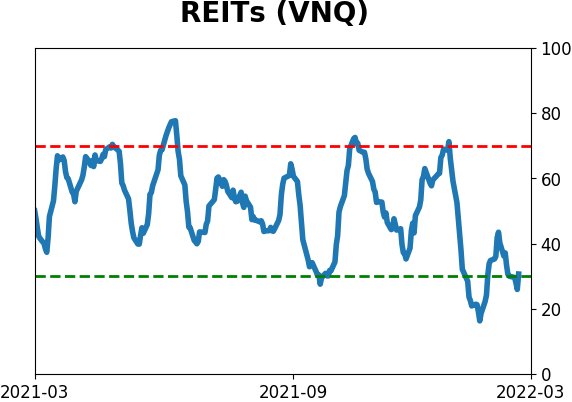
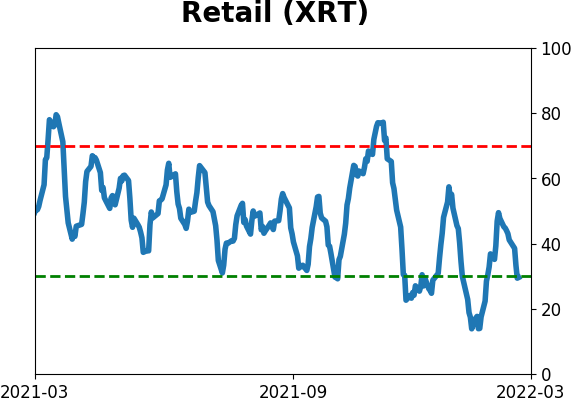
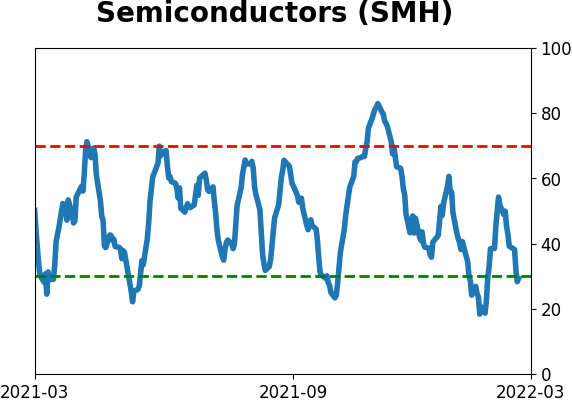
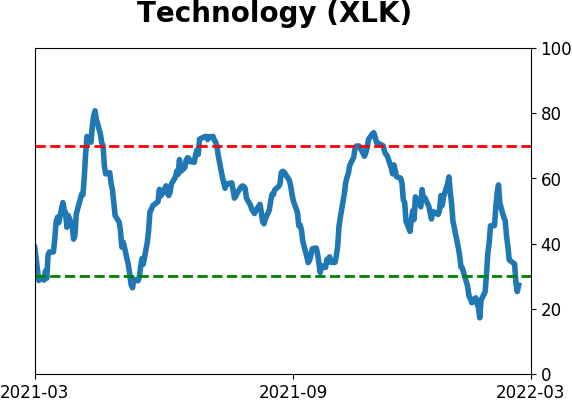
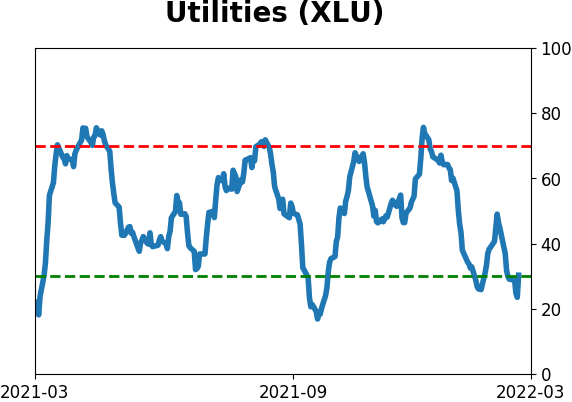
Sector ETF's - 10-Day Moving Average
|
|
|
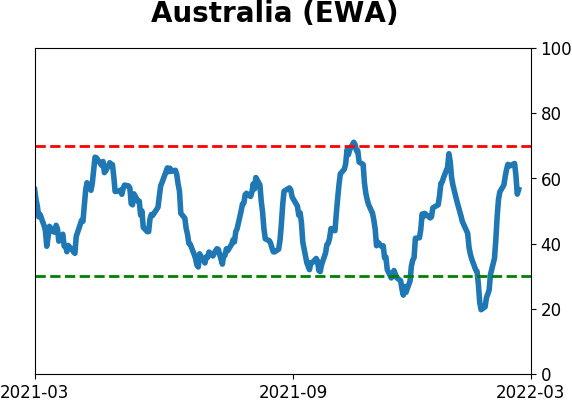
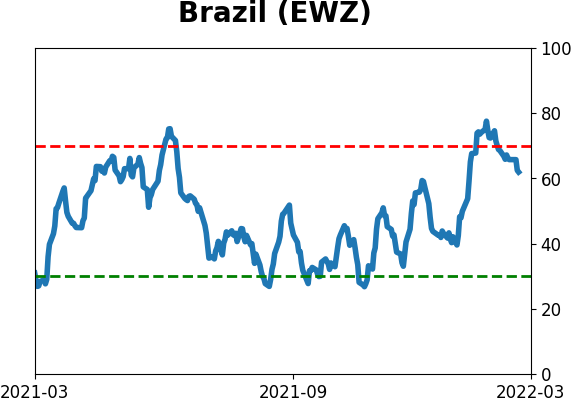
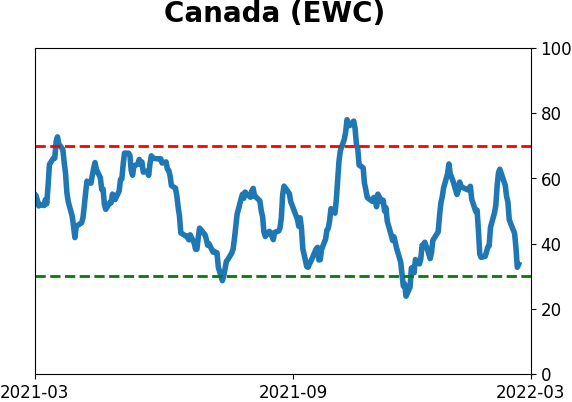
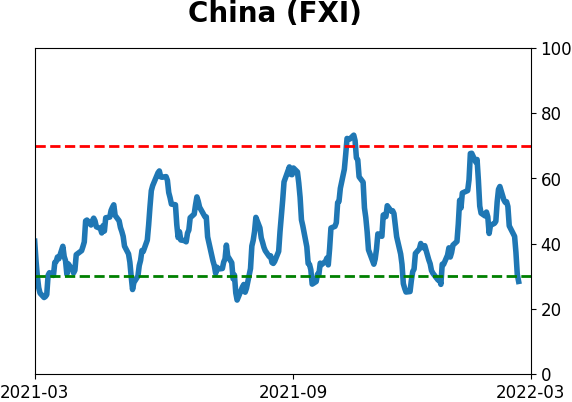
Country ETF's - 10-Day Moving Average
|
|
|
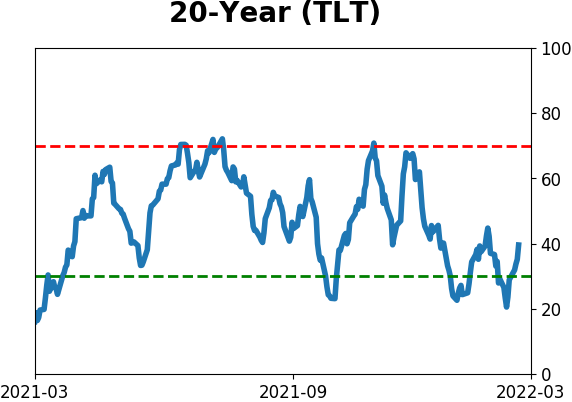
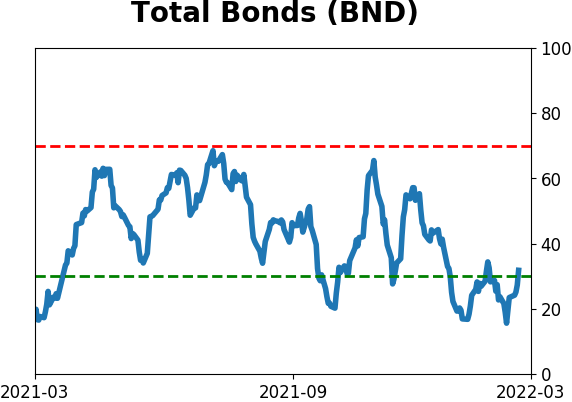
Bond ETF's - 10-Day Moving Average
|
|
|
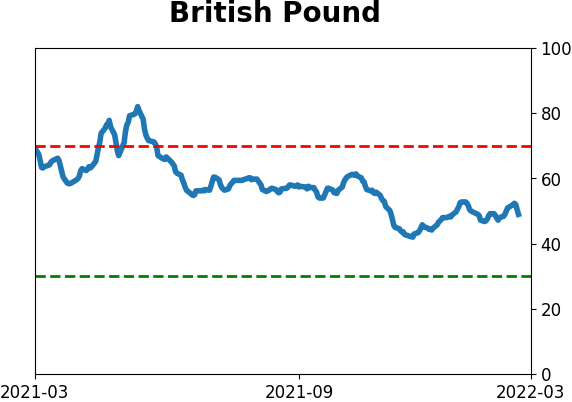
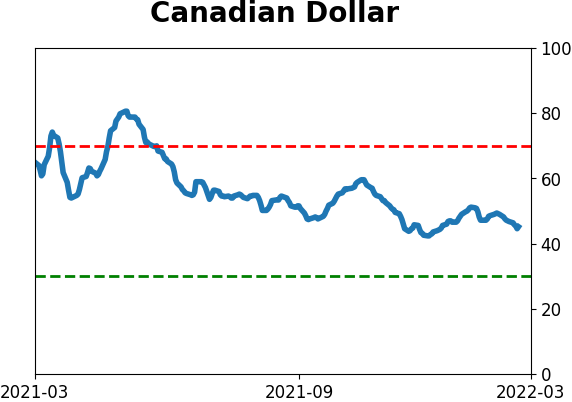
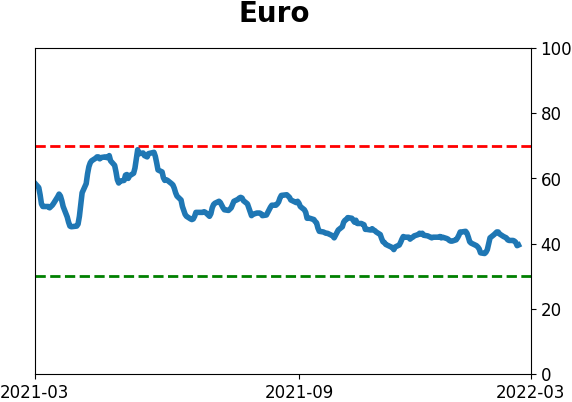
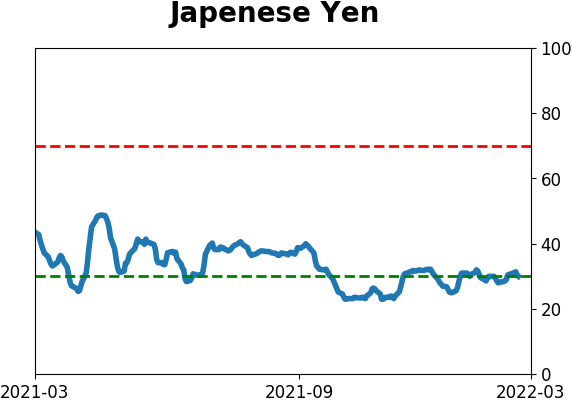
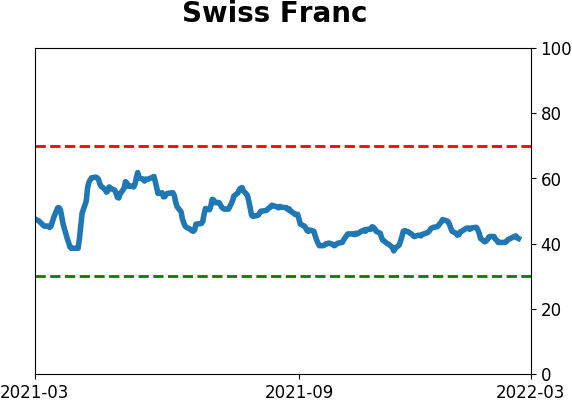
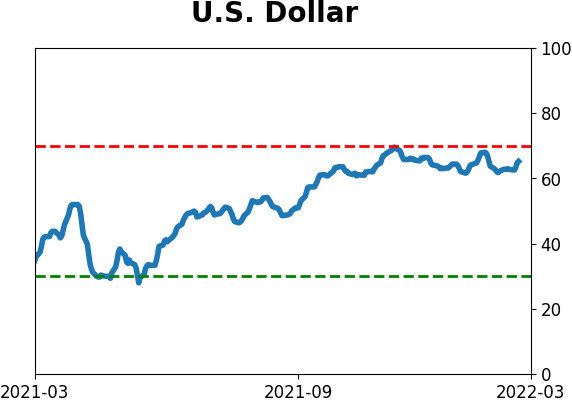
Currency ETF's - 5-Day Moving Average
|
|
|
Commodity ETF's - 5-Day Moving Average
|
|