Headlines
|
|
Armed conflict triggers historic surge in uncertainty:
Armed overseas conflicts have not been kind to domestic stocks. But more and more newspapers are publishing articles related to the stock market. That typically only happens when investors are anxious and uncertainty is high. The handful of times since 1985 when papers published as many articles about the stock market that they are now, stocks rallied.
|
Smart / Dumb Money Confidence
|
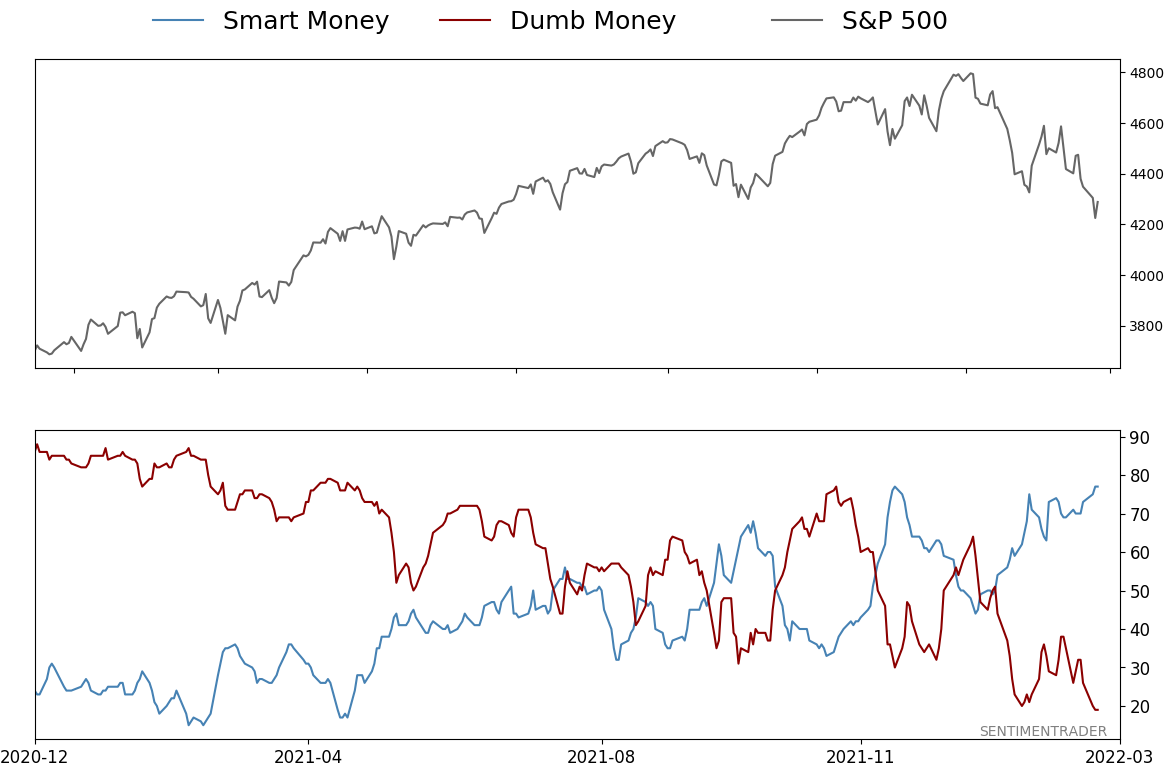
Smart Money Confidence: 77%
Dumb Money Confidence: 19%
|
|
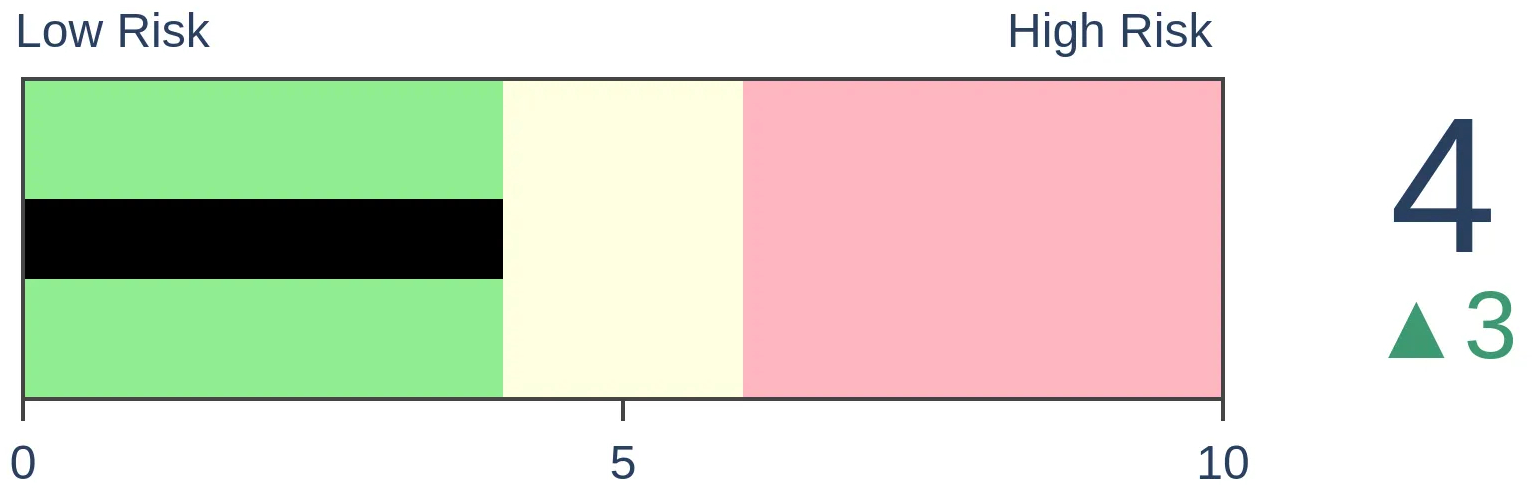
Risk Levels
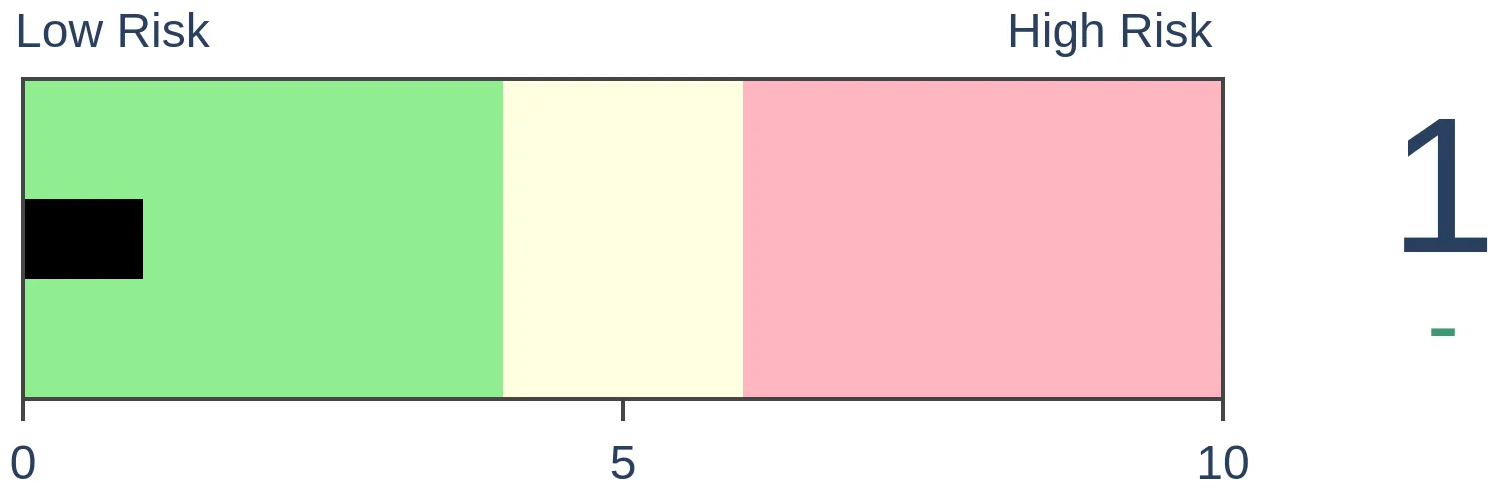
Stocks Short-Term
|
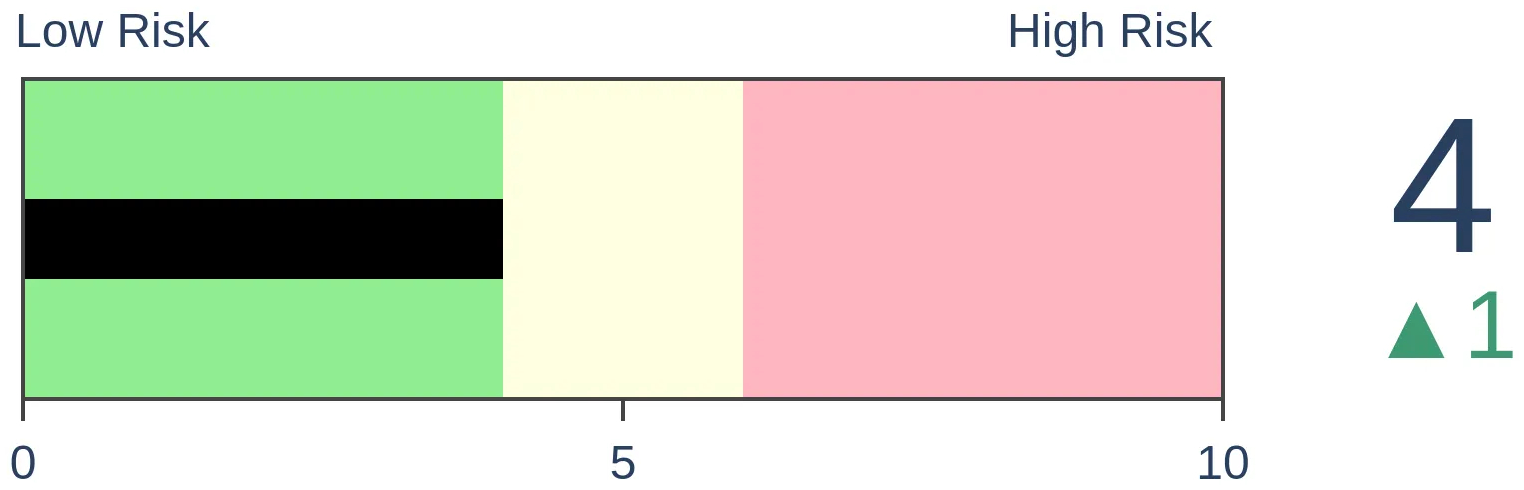
Stocks Medium-Term
|
|
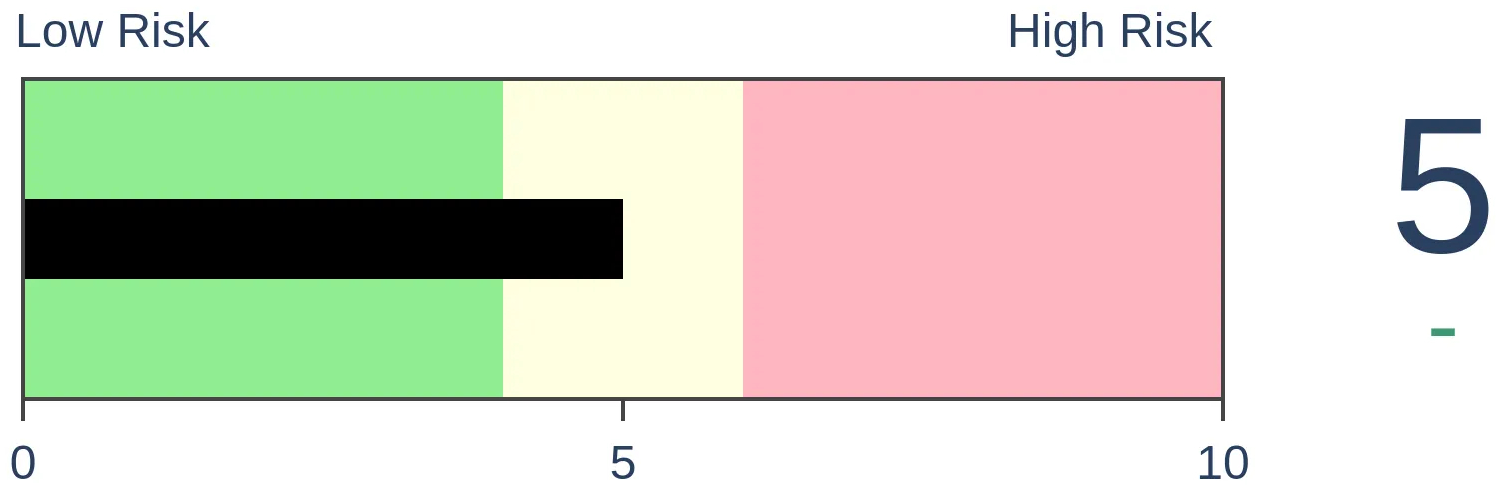
Bonds
|
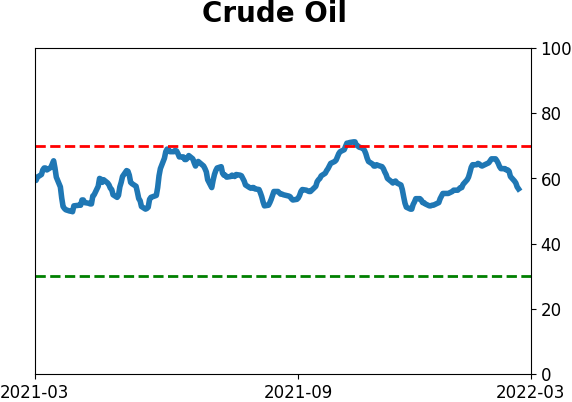
Crude Oil

|
|
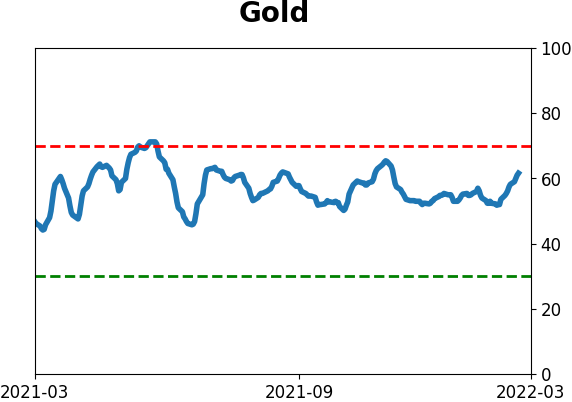
Gold
|
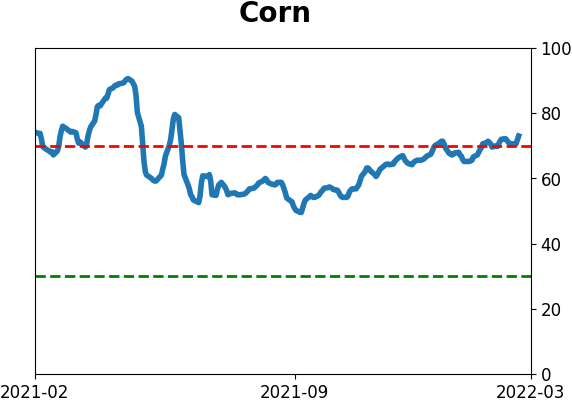
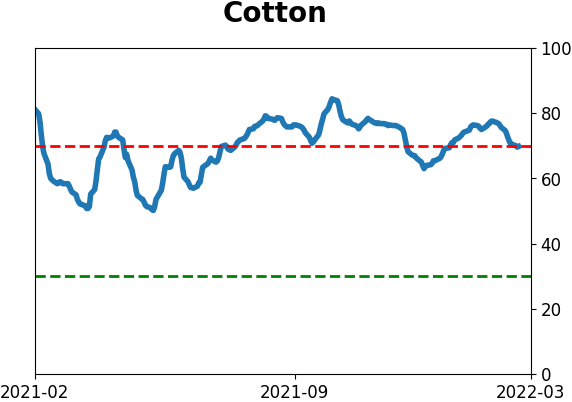
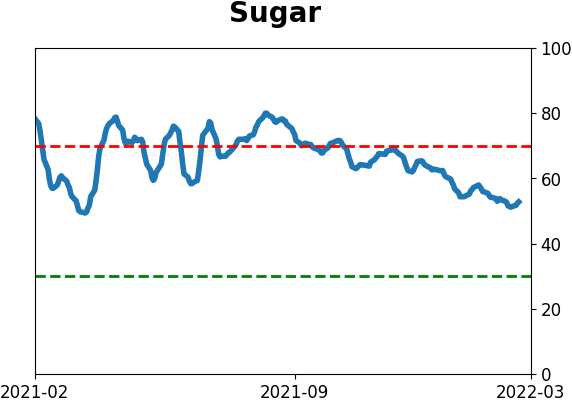
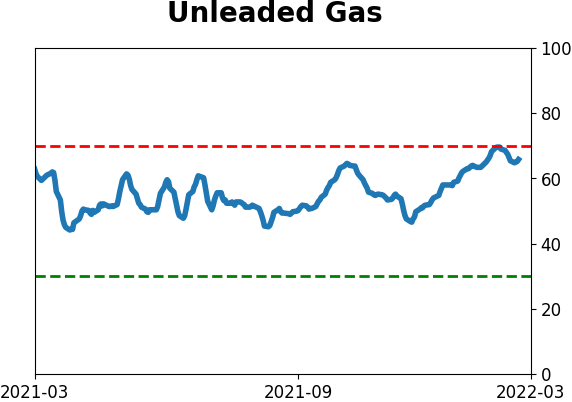
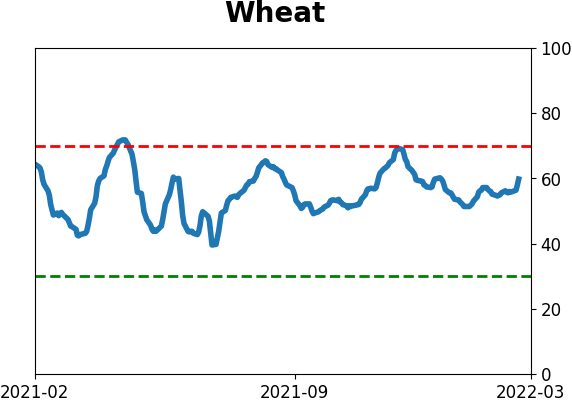
Agriculture

|
|
Research
By Jason Goepfert
BOTTOM LINE
Armed overseas conflicts have not been kind to domestic stocks. But more and more newspapers are publishing articles related to the stock market. That typically only happens when investors are anxious and uncertainty is high. The handful of times since 1985 when papers published as many articles about the stock market that they are now, stocks rallied.
FORECAST / TIMEFRAME
None
|
Key points:
- Major overseas armed conflicts have not been kind to domestic markets
- Newspapers are pumping out more stock market-related content as uncertainty rises
- An index published by the St. Louis Fed has spiked to one of the highest levels since 1985
- S&P 500 returns after other high readings were exceptional over the next 2-6 months
Armed conflicts have not been kind to stocks
We've all been told that investors hate uncertainty, and it's one of the few market clichés that seems to hold up over time. Right now, there's a lot of uncertainty, and investors certainly seem to hate it.
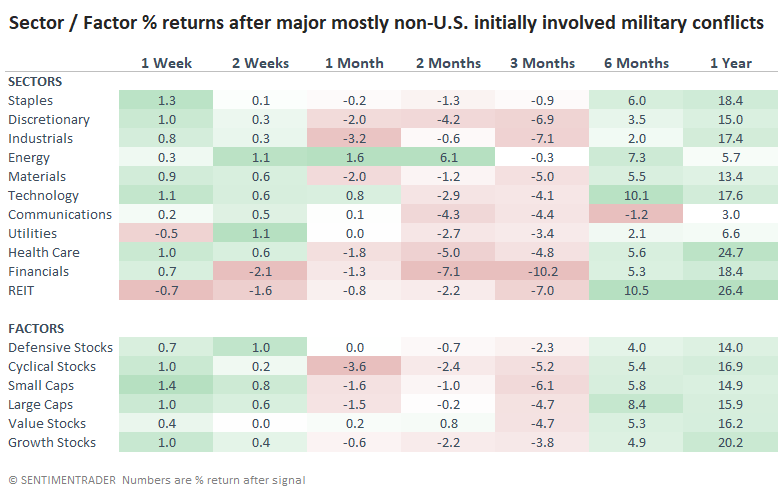
This isn't unusual when there is an armed conflict. If we filter a list of 70+ major geopolitical events over the past 100 years to those that primarily involved armed conflict not initially involving the United States, domestic stocks were not immune to the concerns. When it comes to conflicts like this, assigning a precise date can be fuzzy, but while the S&P 500 didn't necessarily show an immediate reaction, the next few months were sketchy. Perhaps ironically given the recent market, one of the conflicts with the least impact was the last Russia-Ukraine offensive.
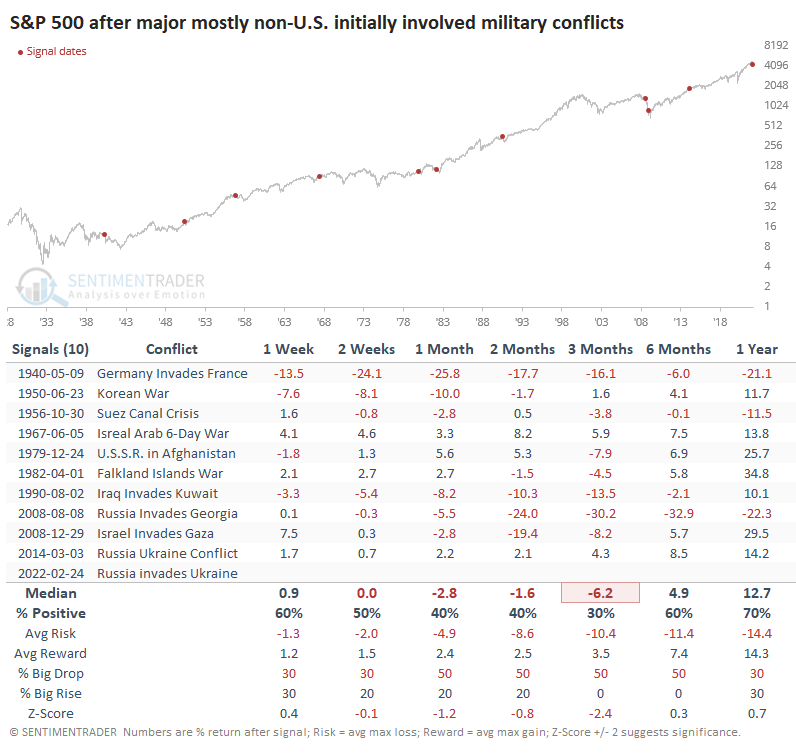
There weren't many places to hide when it comes to sectors and factors. It's probably not a surprise that the two sectors with the least-bad returns over the next 3 months were Consumer Staples and Energy. Financials, Industrials, and Consumer Discretionary were among the worst.
Newspapers are playing up equity market concerns
There's one big difference between most of those conflicts and our current market, and that's that investors are already showing an extremely high level of anxiety and uncertainty.
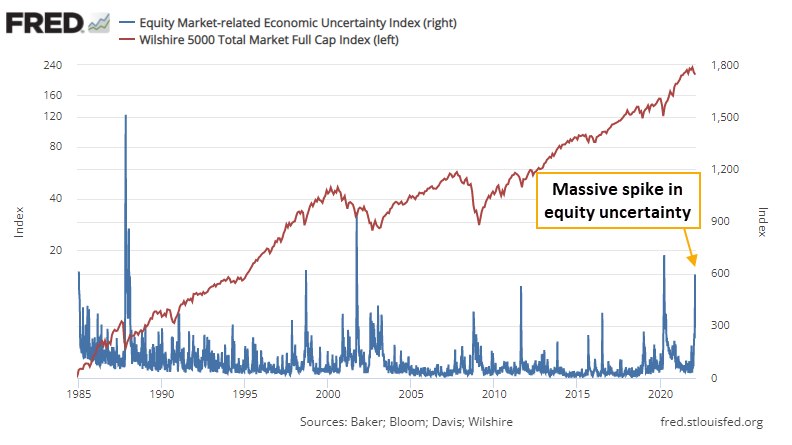
The most common way to measure uncertainty is the VIX, which works well enough. Another one is the Equity Market-Related Economic Uncertainty Index (EMREUI) available from the St. Louis Fed. The index is calculated the same way as their more commonly-referenced Economic Uncertainty Index, searching for articles published in 10 major newspapers, but it's focused more specifically on the stock market.
Per the whitepaper:
"We create a newspaper-based index of equity market uncertainty. Specifically, we...replace the P term set with "stock price", "equity price" or "stock market". The resulting index...correlates with the VIX at 0.73."
The EMREUI had been quiet as stocks rose. But recent developments have triggered a spike, and it rivals the most extreme levels since the index's inception in 1985.
The index was volatile right after inception. Starting shortly thereafter, though, there have only been a half-dozen readings of 500 or more. That triggered in late January and has stayed elevated. The weekly reading of 595 at the end of January was the 13th-highest out of 1,937 weeks in the index's history.
This is notable because it's already so much higher than any of the other conflicts that occurred since the inception of index. In the 4 weeks before and after the others, the maximum EMREUI barely got above 250. This time, it's already more than double that.
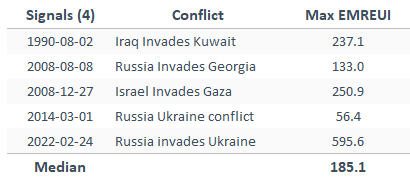
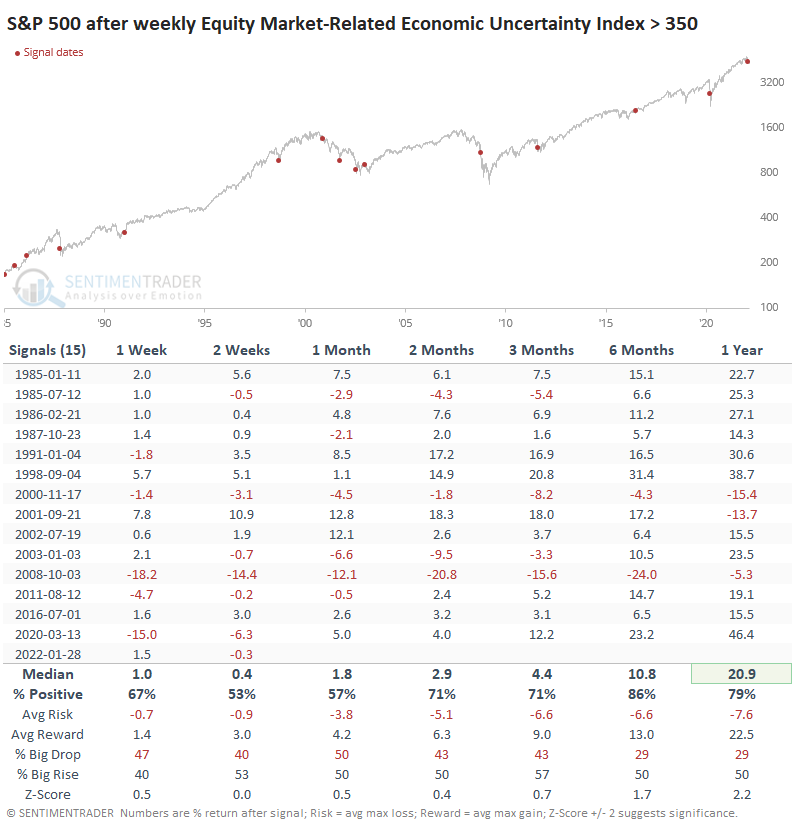
The table below shows every week when the index spiked above 500 for the first time in months.
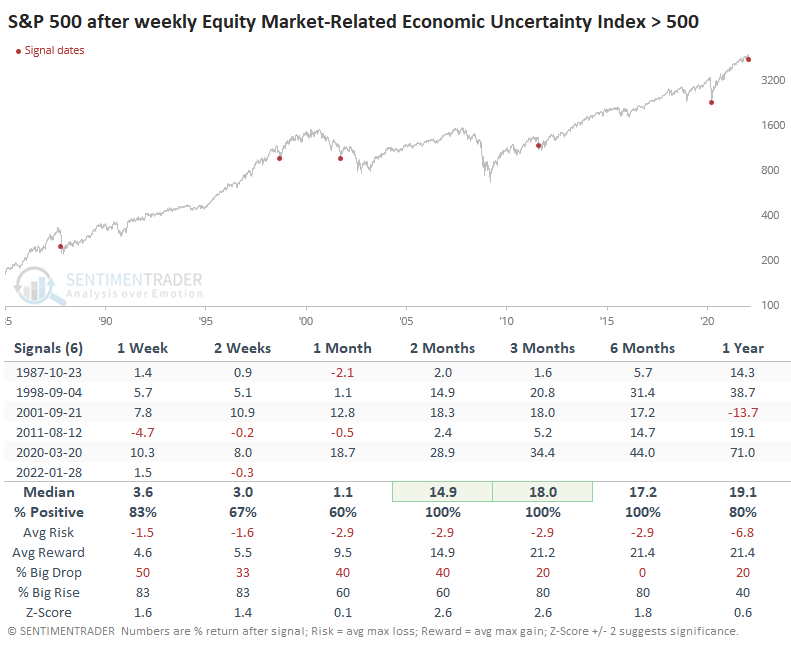
The chart clearly shows that the index seemed to be a useful indication of uncertainty. When mainstream newspapers find it necessary to publish articles related to the stock market, it's almost always because of declines and scary headlines. The other signals coincided with larger price declines in the S&P 500, and the sample size is tiny. But it's at least worth noting that each of them preceded substantial rallies over the next 2-6 months.
If we reduce the threshold for the index to 350 to generate more instances, returns were understandably less impressive, but still above random. The S&P showed a gain over the next year after 12 out of 15 signals, averaging nearly 21%.
What the research tells us...
Standard measures of volatility and sentiment are showing only modest extremes, even after the latest leg down. And it's not a great sign that investors continue to show risk-off behavior even after the S&P 500 went "on sale" by entering a correction. There is always some indicator somewhere that shows an extreme, and perhaps the EMREUI is one of those. Most of those we regularly use are not showing the level of fear that would indicate a lower-risk opportunity for buyers, given we're in an unhealthy market environment and now facing a major armed conflict overseas. But it's a heads-up that we may soon see some of those extremes.
Active Studies
| Time Frame | Bullish | Bearish | | Short-Term | 3 | 0 | | Medium-Term | 18 | 2 | | Long-Term | 15 | 5 |
|
Indicators at Extremes
Portfolio
| Position | Description | Weight % | Added / Reduced | Date | | Stocks | RSP | 21.4 | Added 10.2% | 2022-01-28 | | Bonds | 32.7% BND, 7.1% SCHP | 40.1 | Added 8.3% | 2021-10-26 | | Commodities | GCC | 2.4 | Reduced 2.1%
| 2020-09-04 | | Precious Metals | GDX | 4.6 | Reduced 4.2% | 2021-05-19 | | Special Situations | 7.6% KWEB, 4.9% XBI, 3.7% XLE, 1.8% PSCE | 18.0 | Added 4.6% | 2022-02-24 | | Cash | | 13.2 | | |
|
Updates (Changes made today are underlined)
With a typical time frame of several months in this account, I normally don't make changes so quickly. I've added back part of the stock exposure I took off earlier in January due to the washed-out conditions and extreme pessimism we're seeing across a wide array of metrics. The biggest issue is that the environment is unhealthy and we could be in the throes of a protracted bear market. Even so, the readings we've seen recently have a good record at preceding relief rallies, so we'll have to see how that pans out. Bond sentiment is trying to recover from a recent bout of pessimism, and gold stocks are doing their thing which is not much at all. They've been flat for six months. Chinese tech stocks were doing exactly what they're supposed to do, then did *not* by plunging to new lows. This is troubling on a shorter-term time frame, but this was never meant for a trade, rather a multi-year investment. Recent behavior is troubling and I will not be adding any exposure as long as that's the case. RETURN YTD: -0.9% 2021: +8.7%, 2020: +8.1%, 2019: +12.6%, 2018: +0.6%, 2017: +3.8%, 2016: +17.1%, 2015: +9.2%, 2014: +14.5%, 2013: +2.2%, 2012: +10.8%, 2011: +16.5%, 2010: +15.3%, 2009: +23.9%, 2008: +16.2%, 2007: +7.8%
|
|
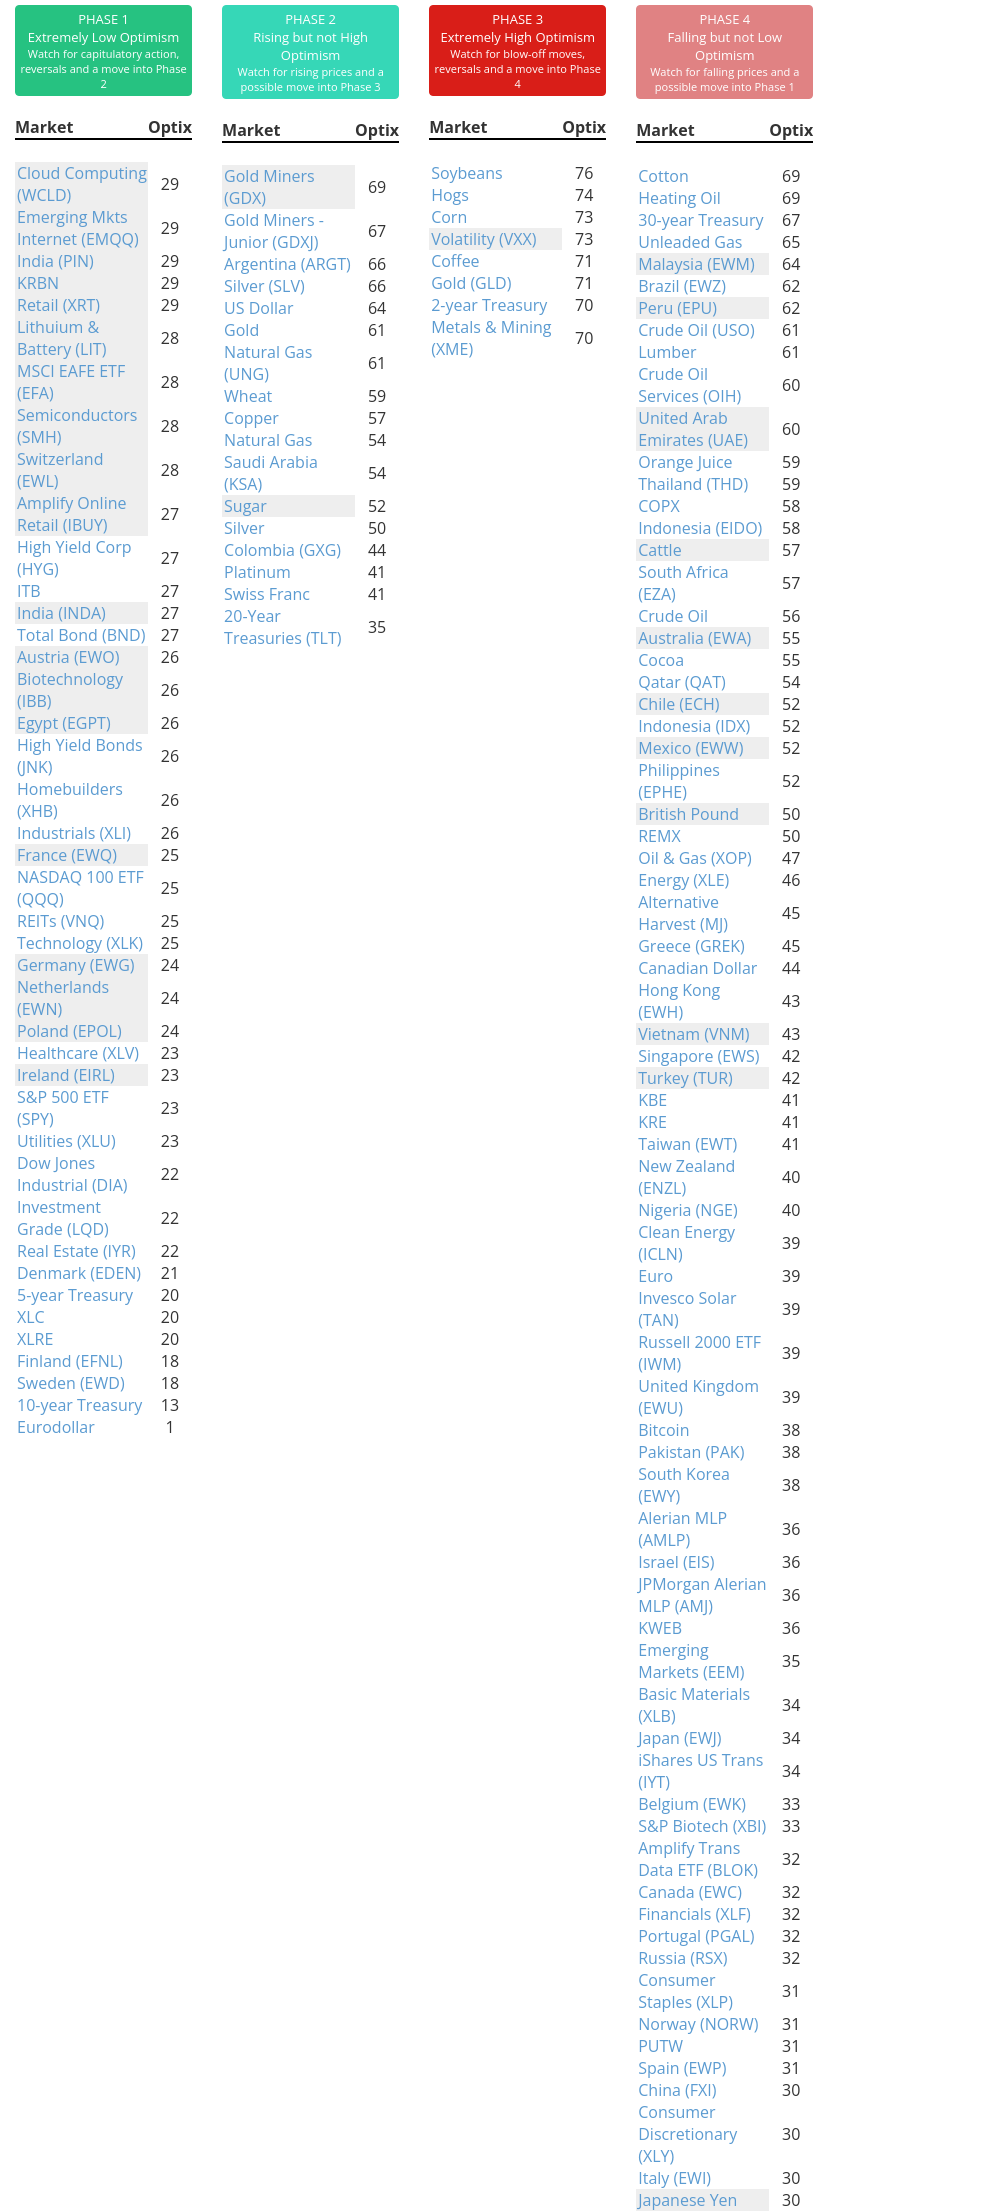
Phase Table
Ranks
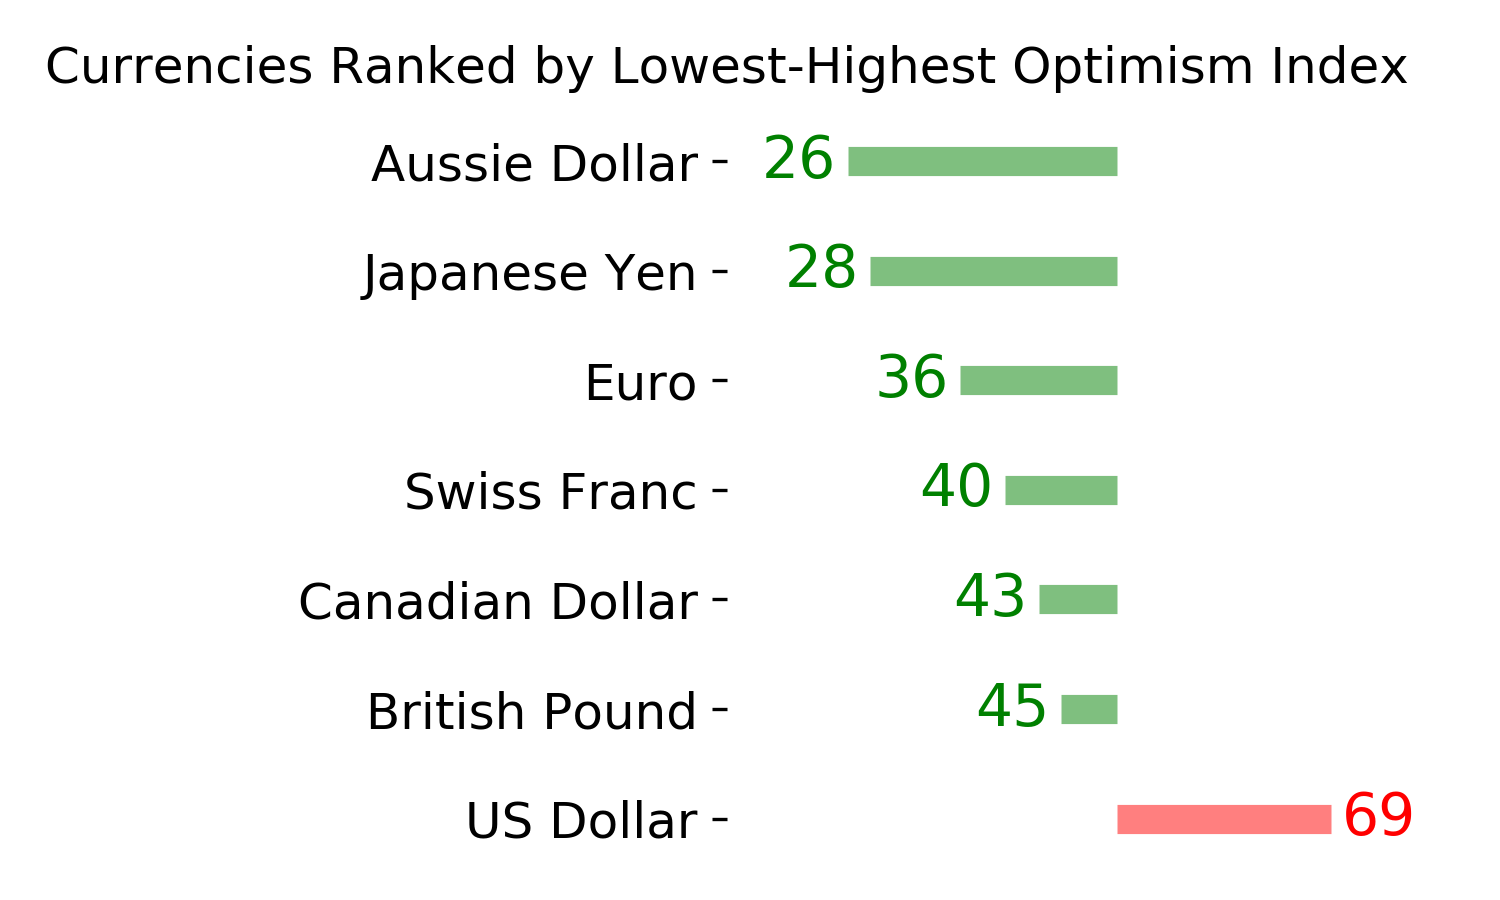
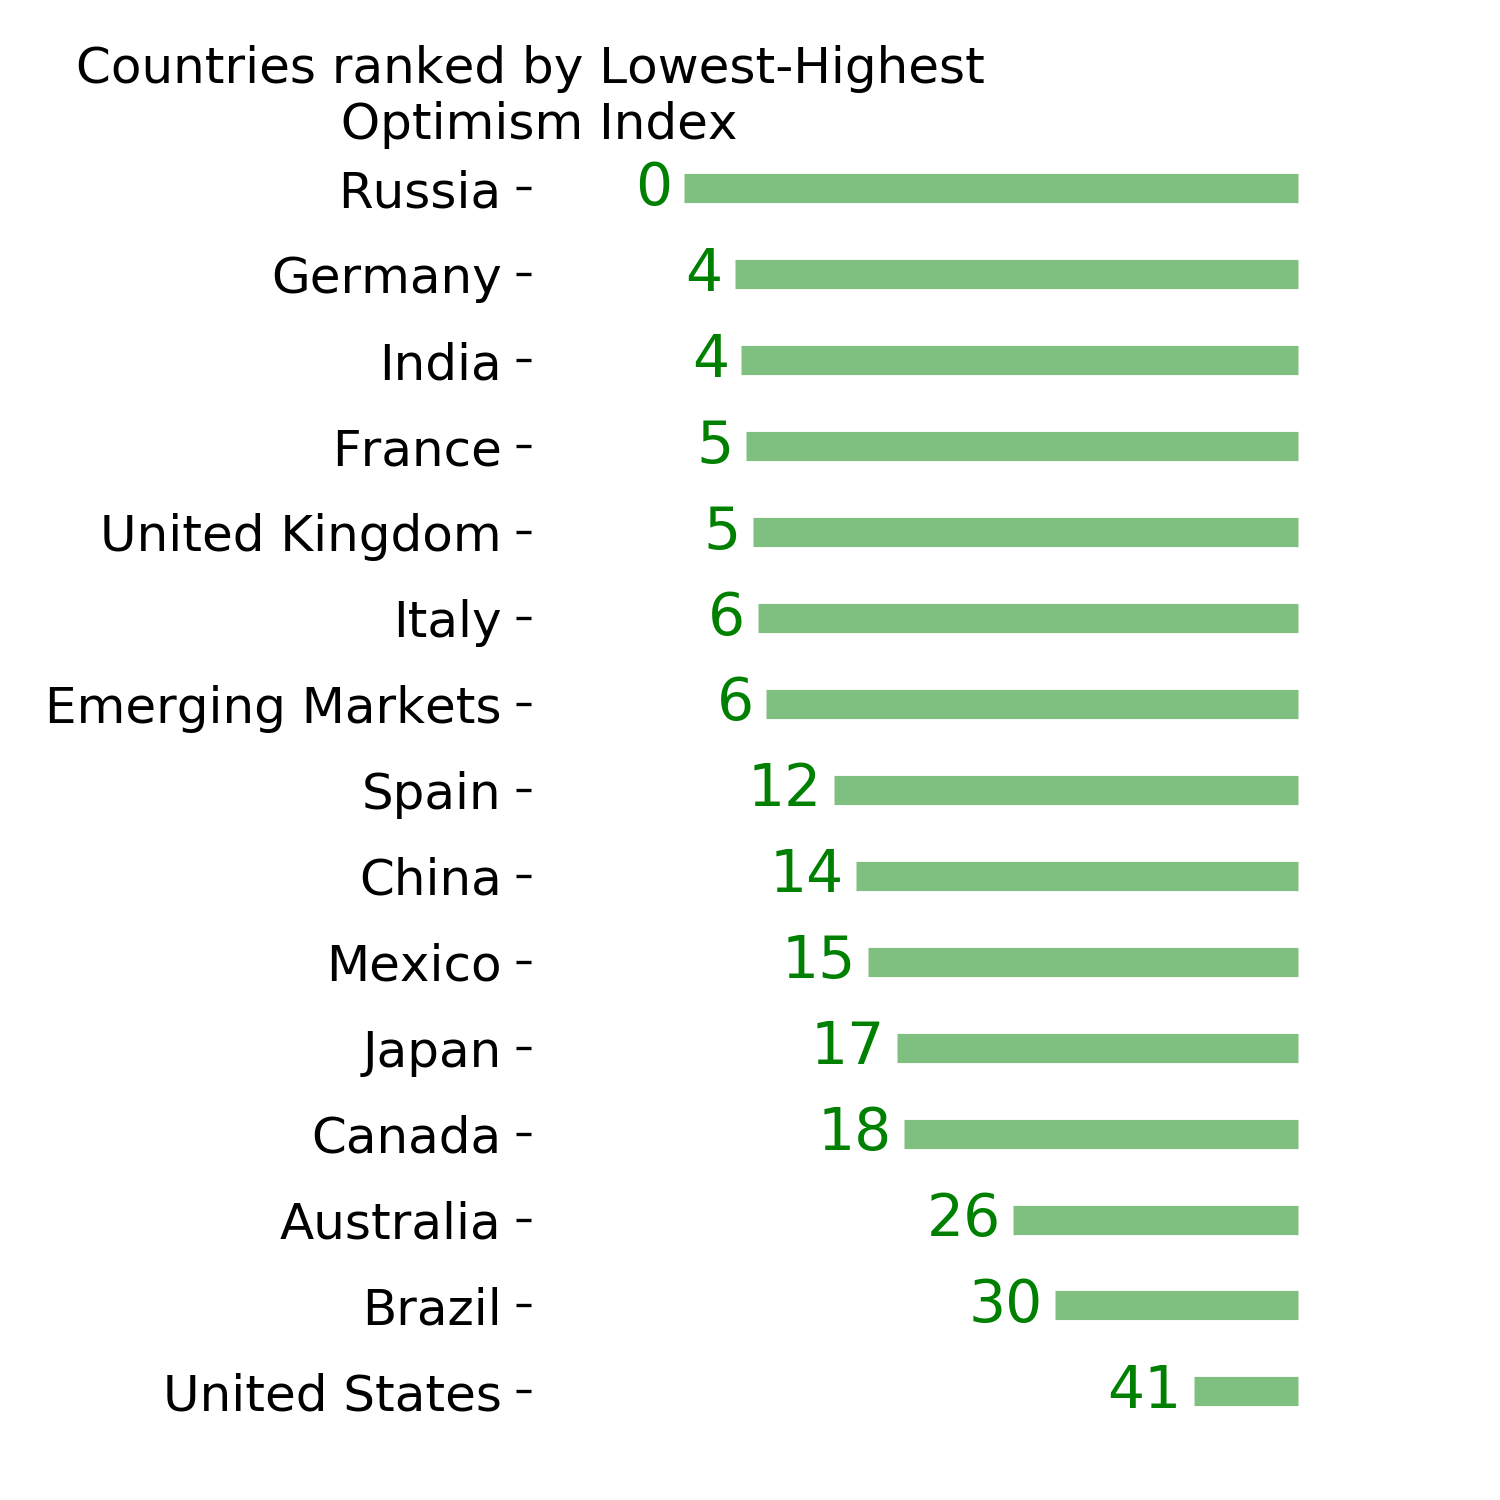
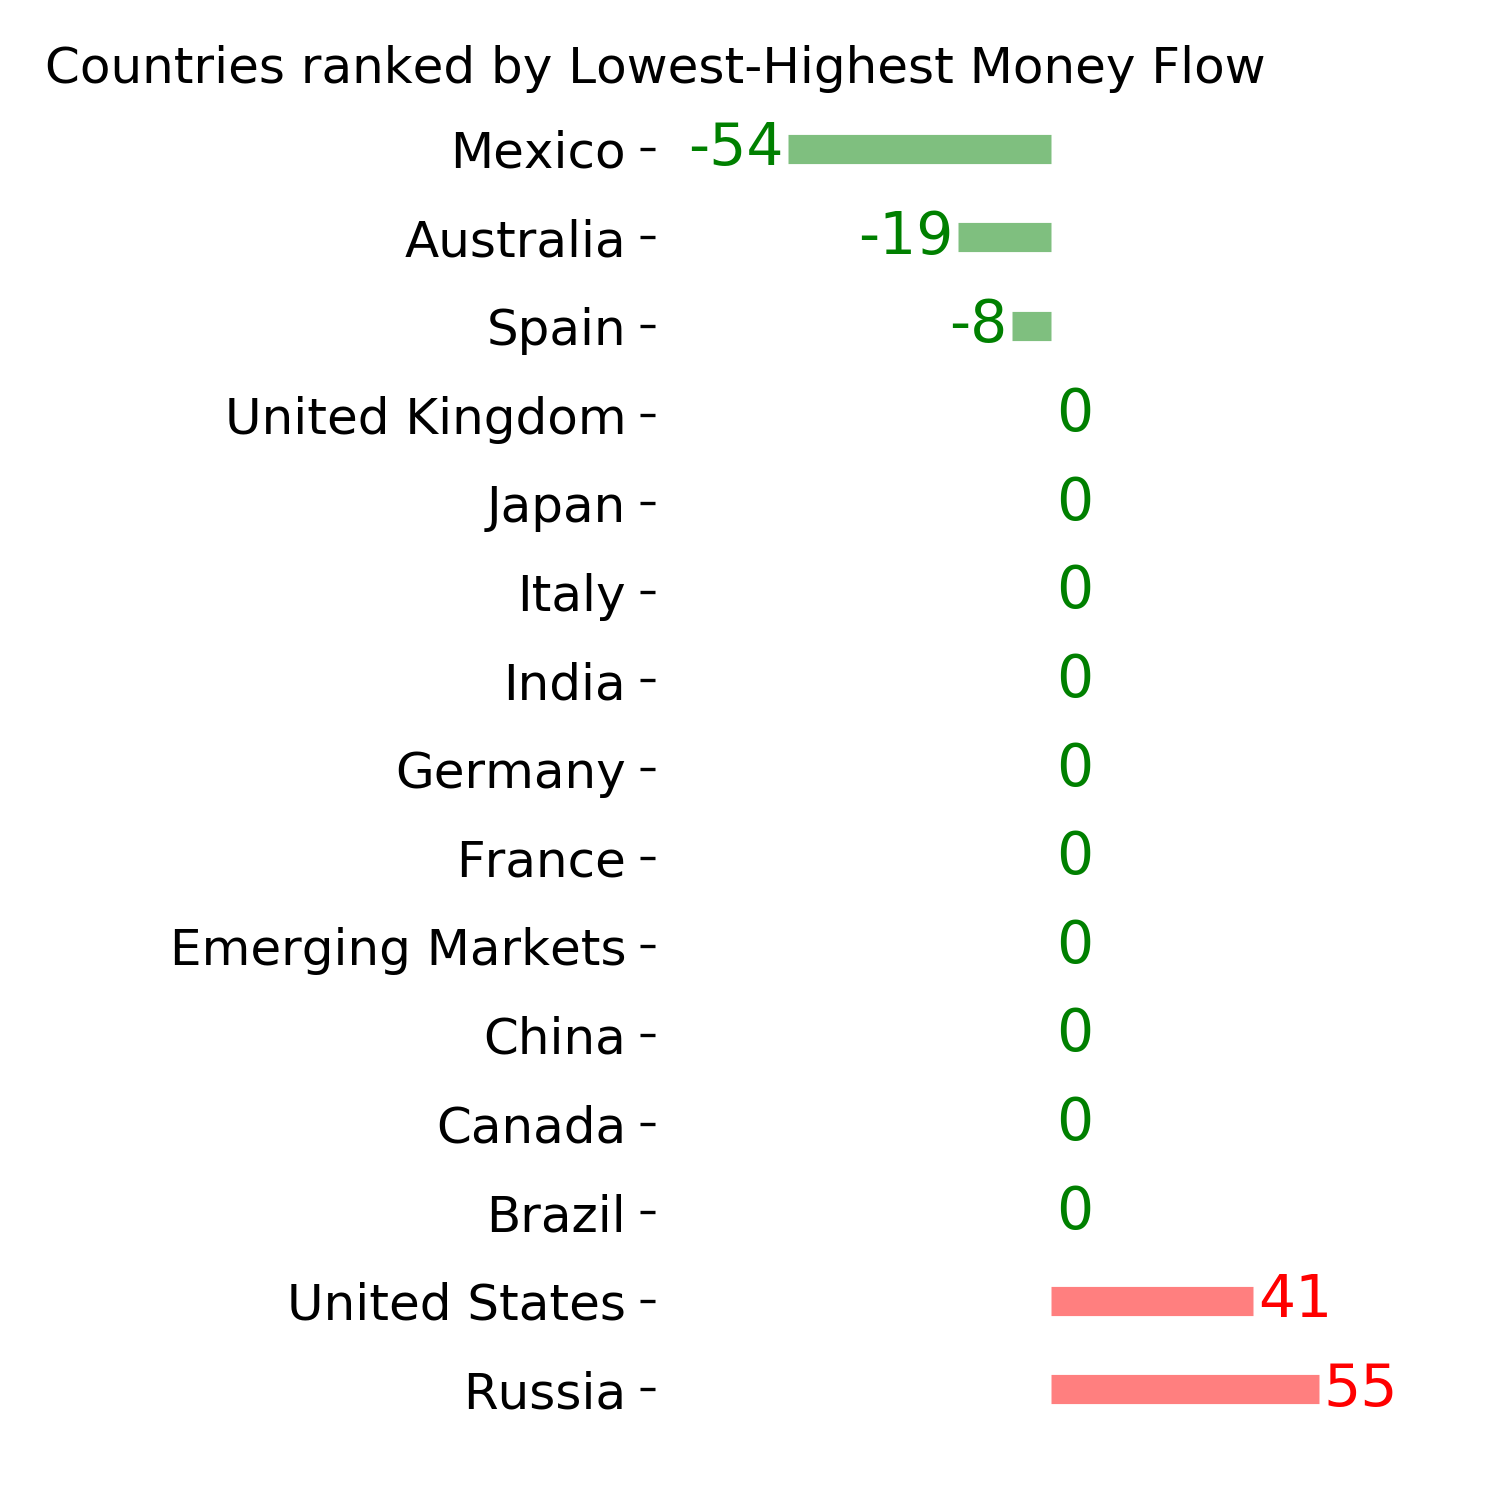
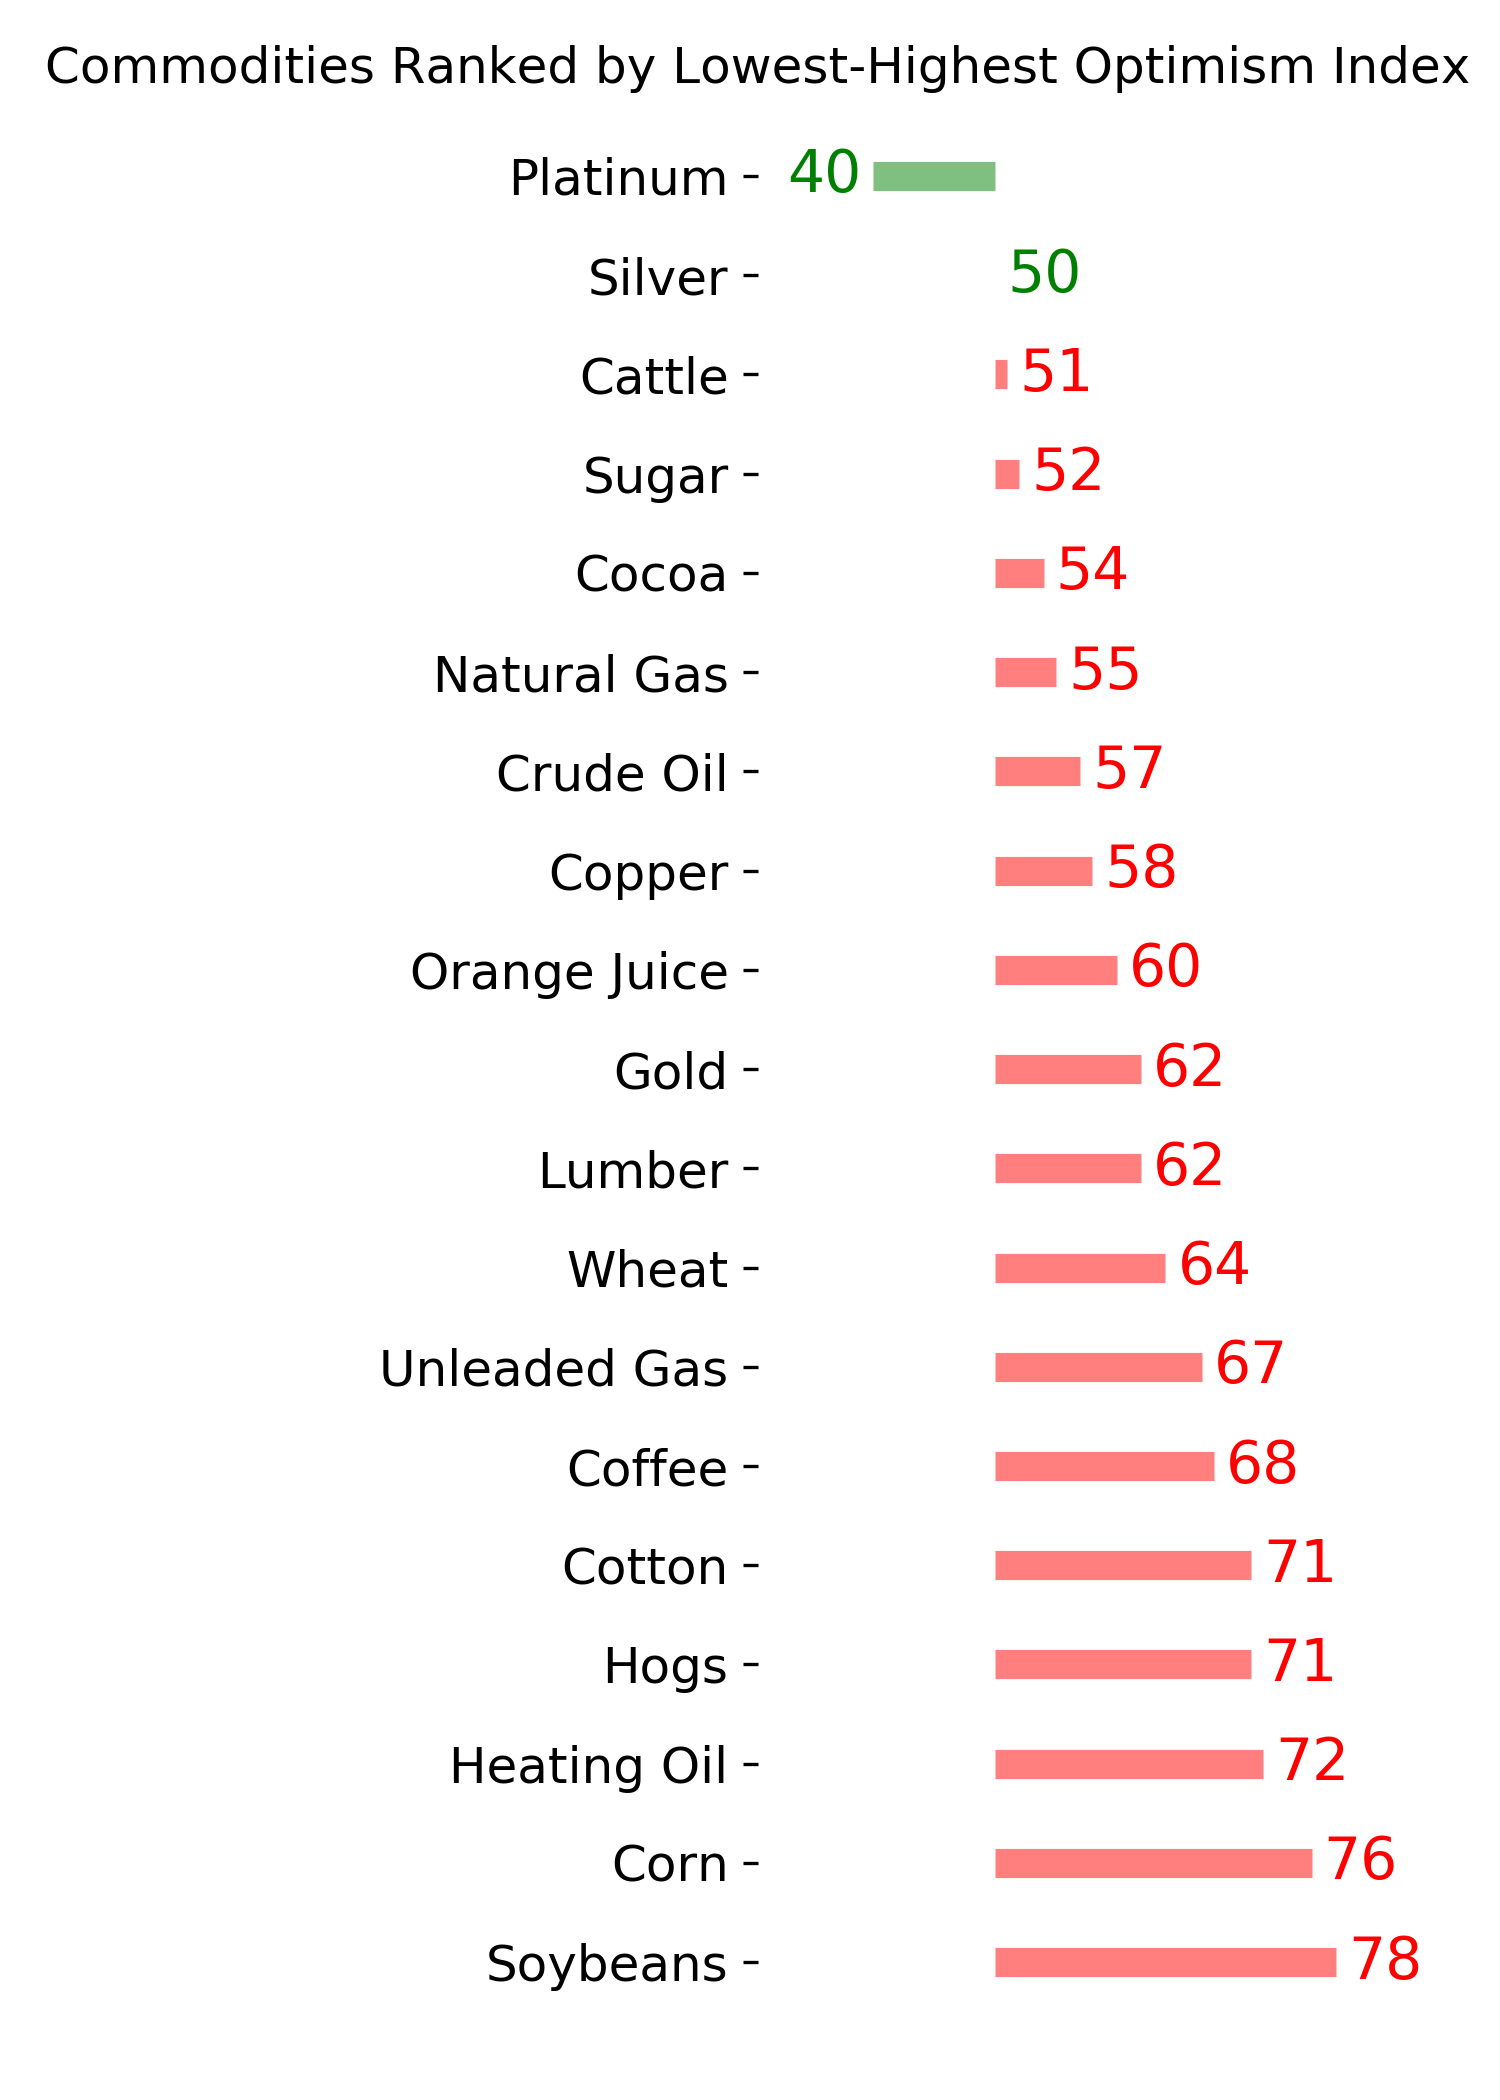
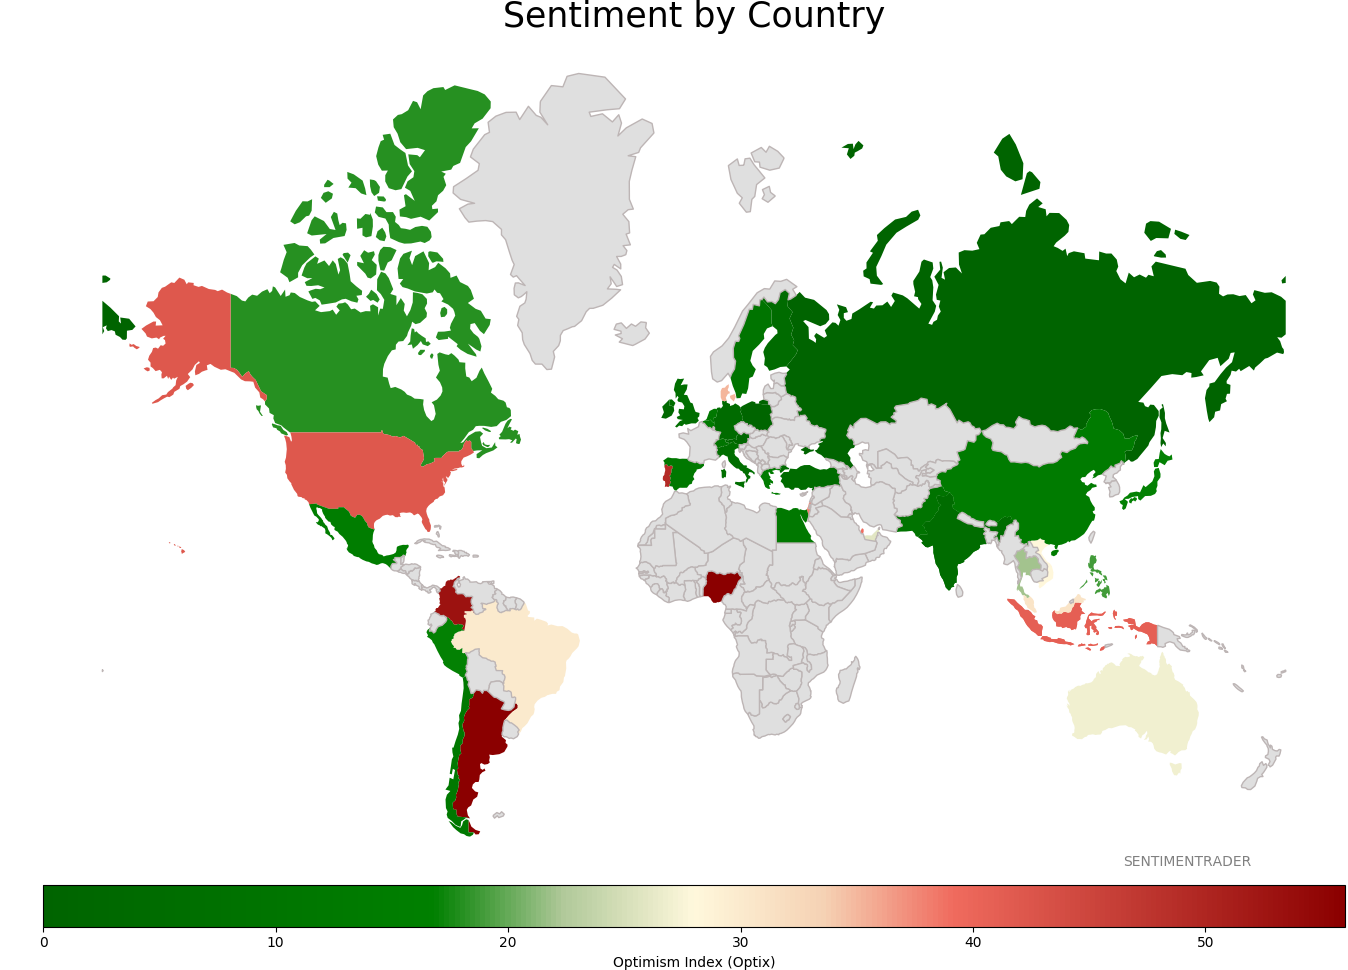
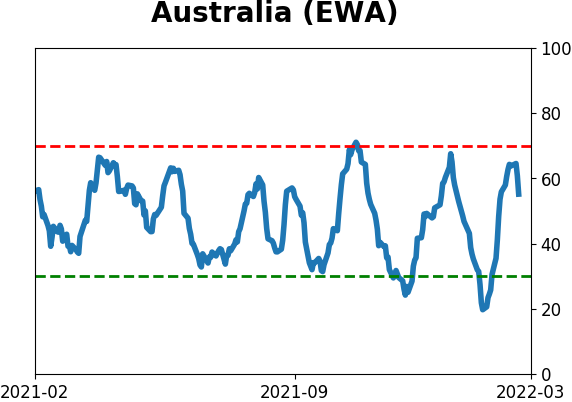
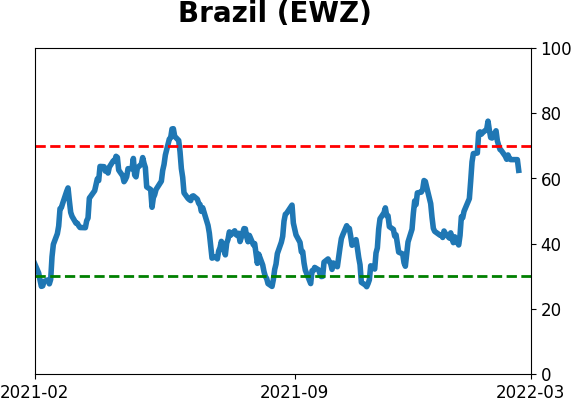
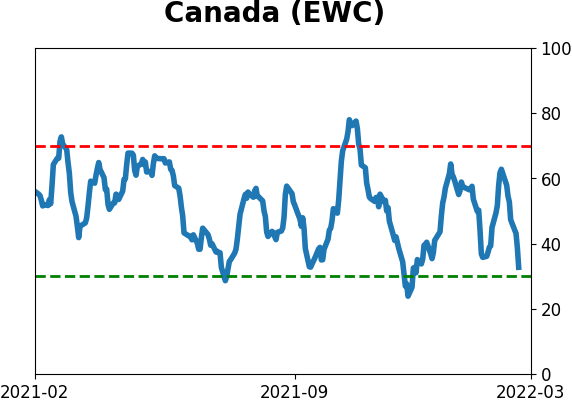
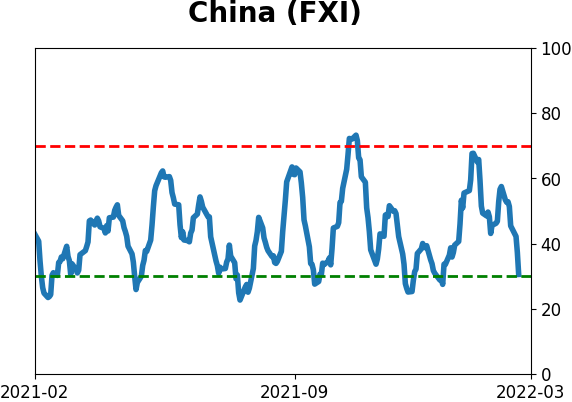
Sentiment Around The World
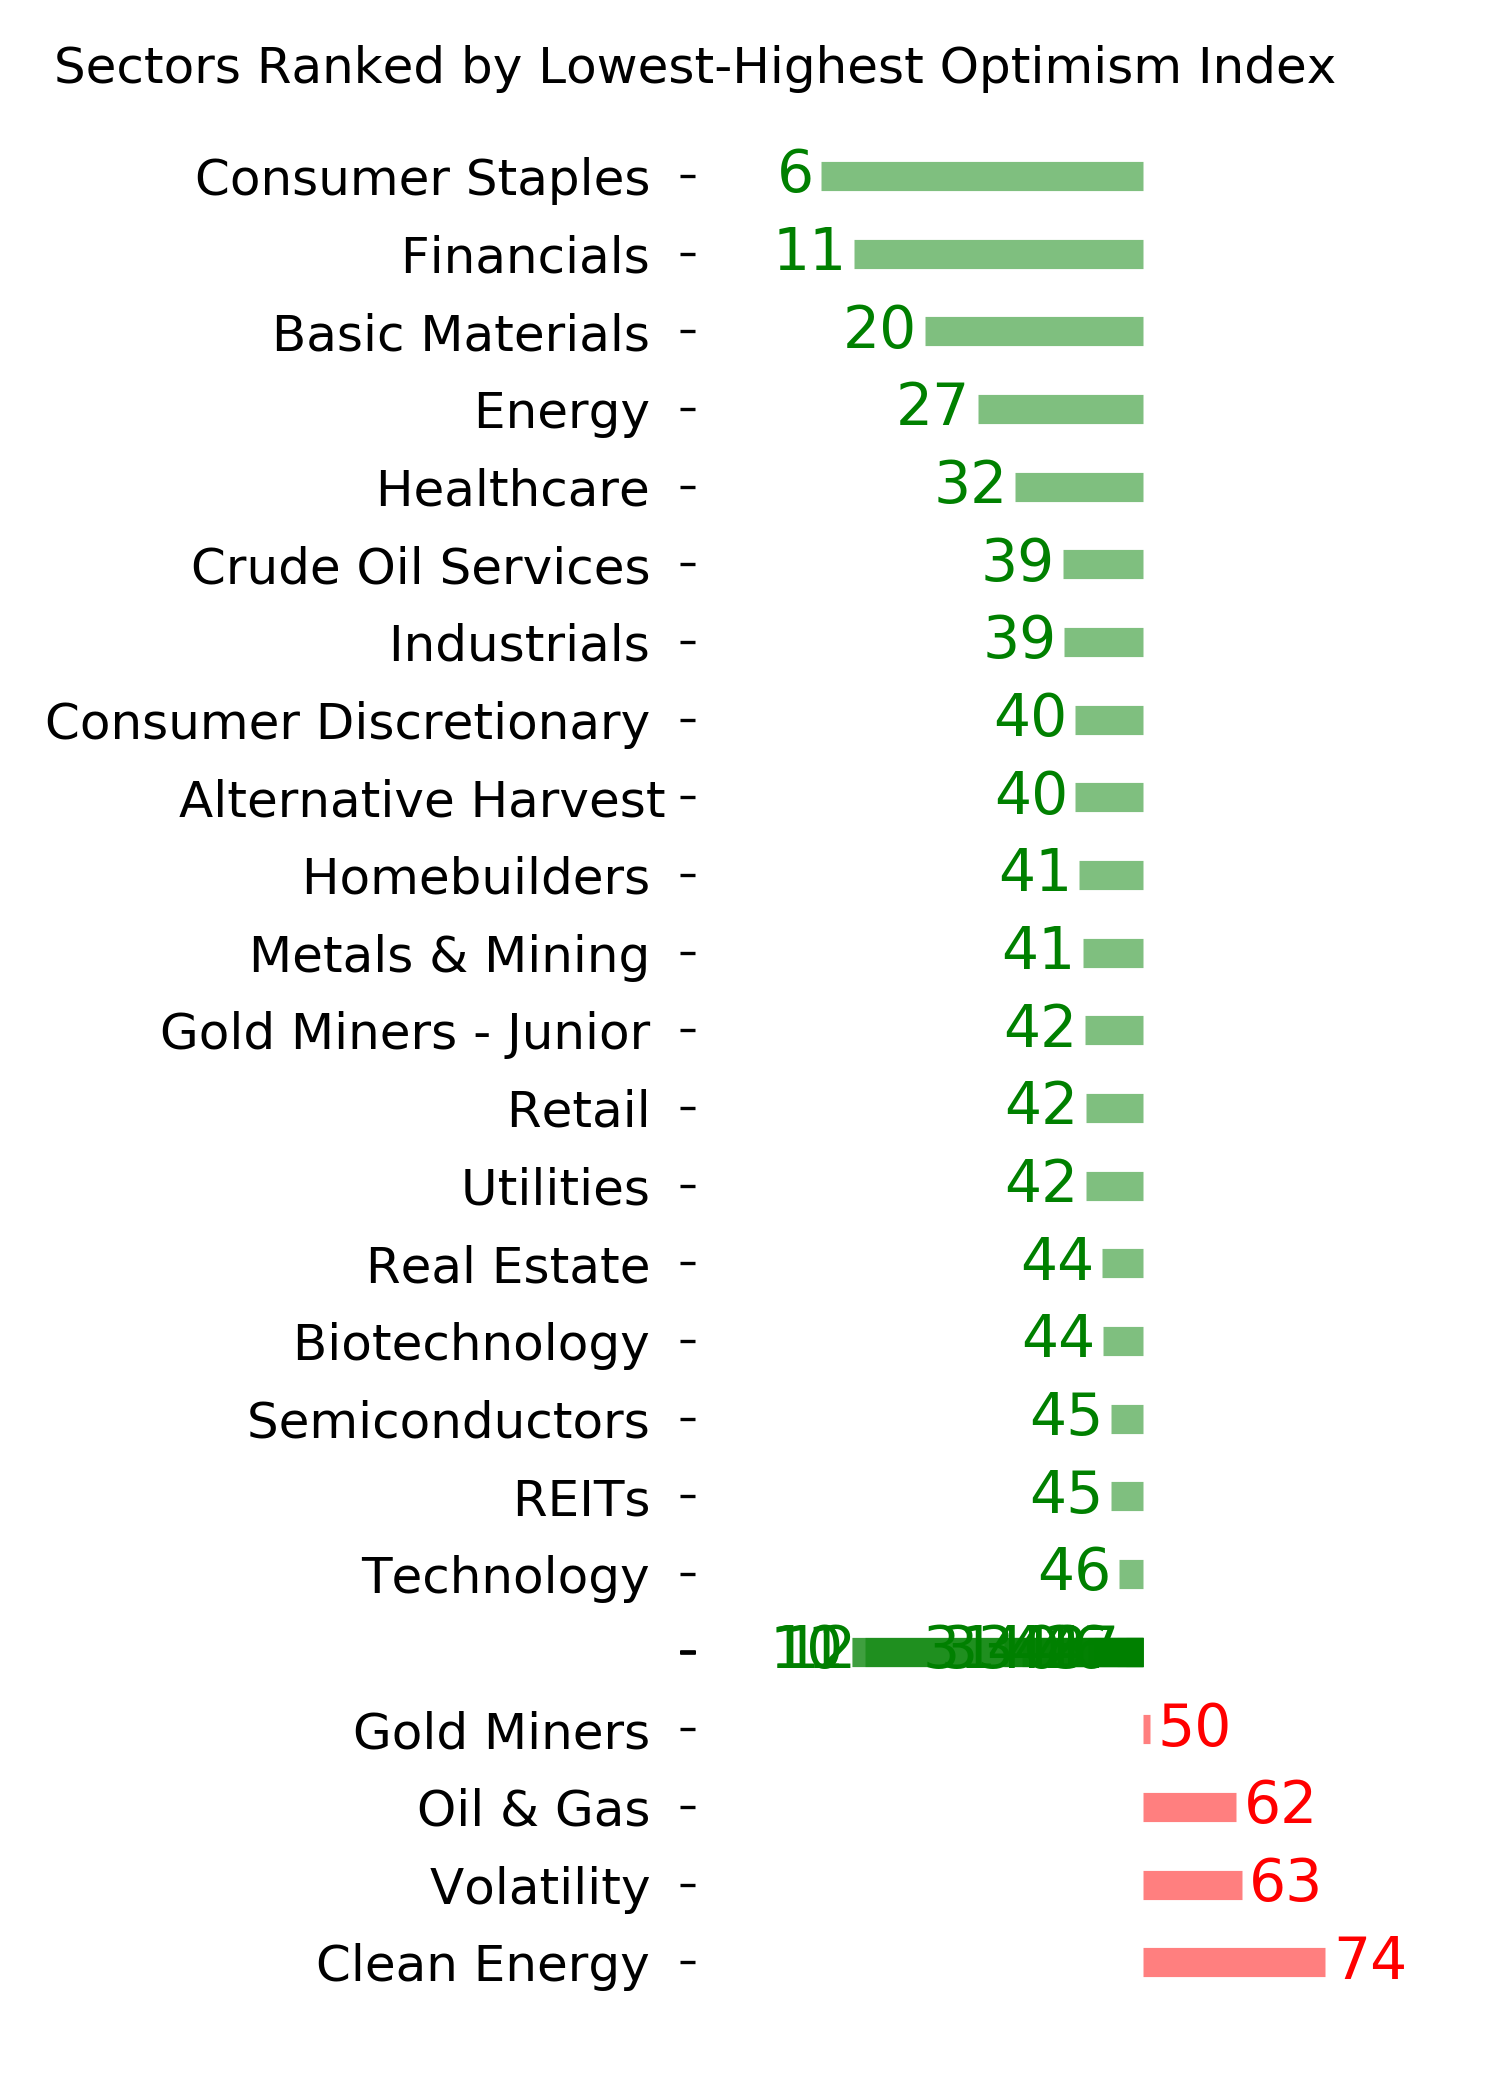
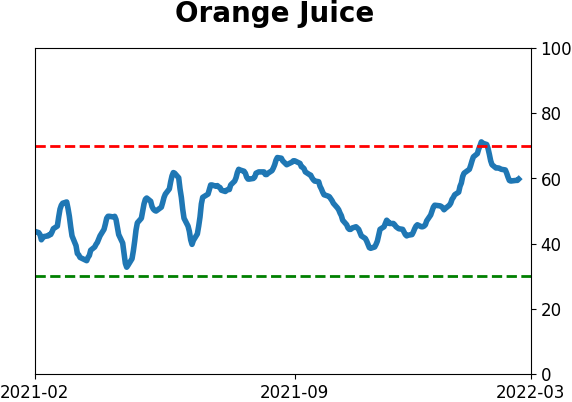
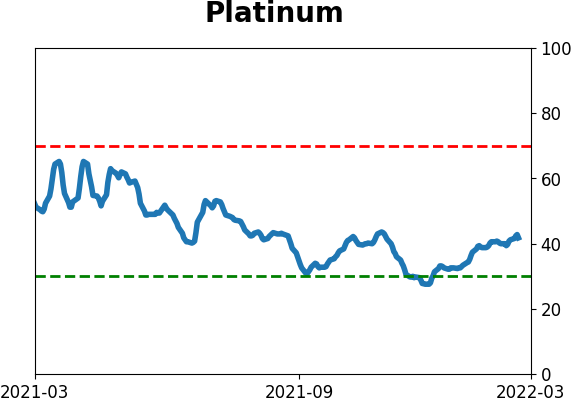
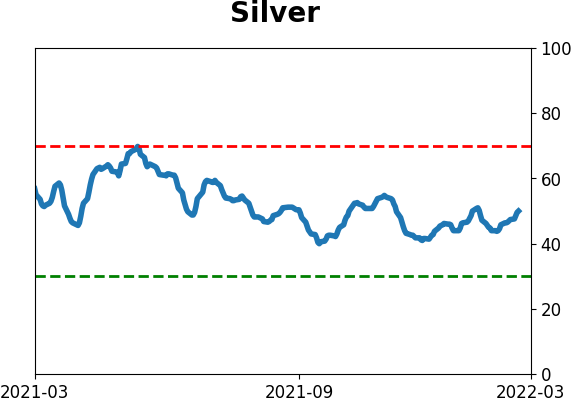
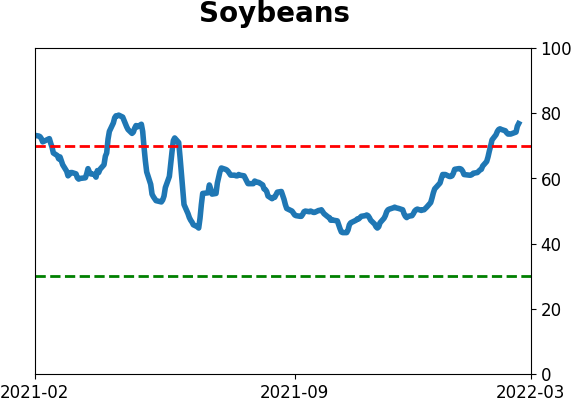
Optimism Index Thumbnails
|
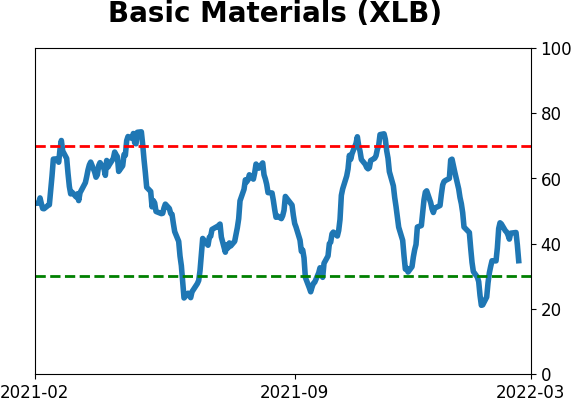
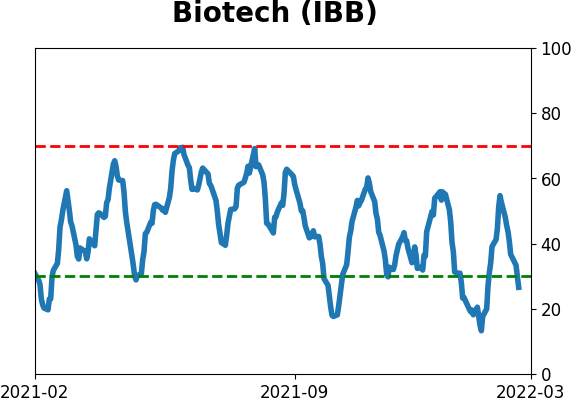
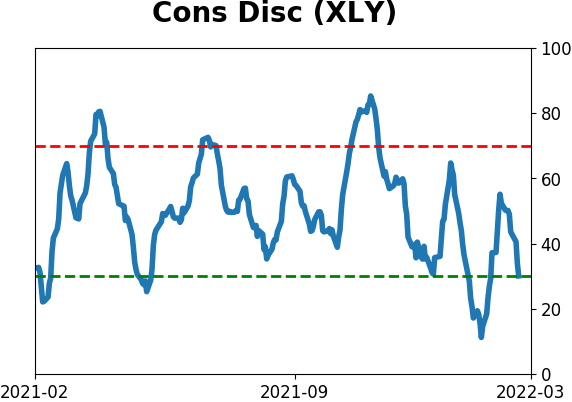
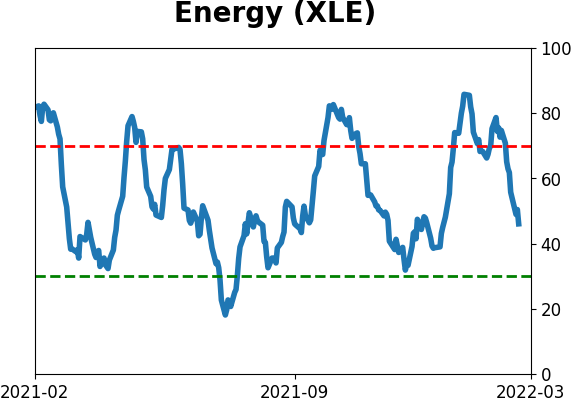
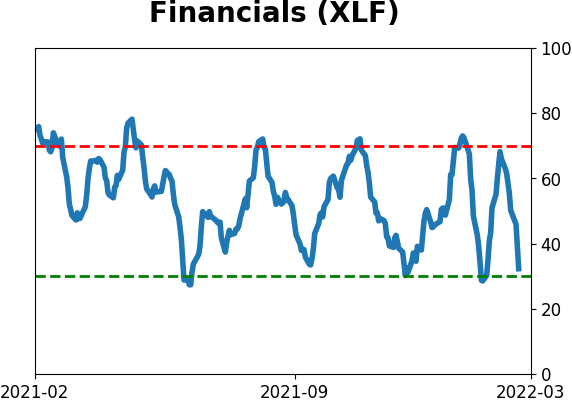
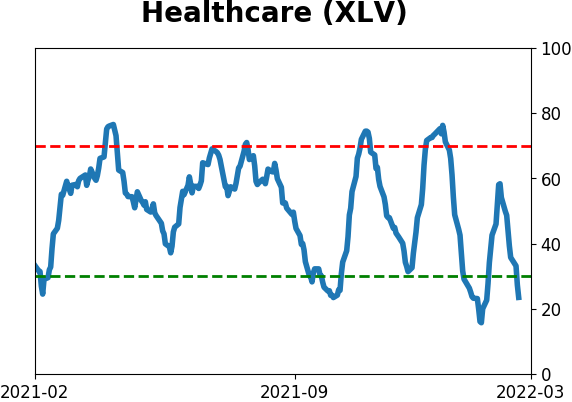
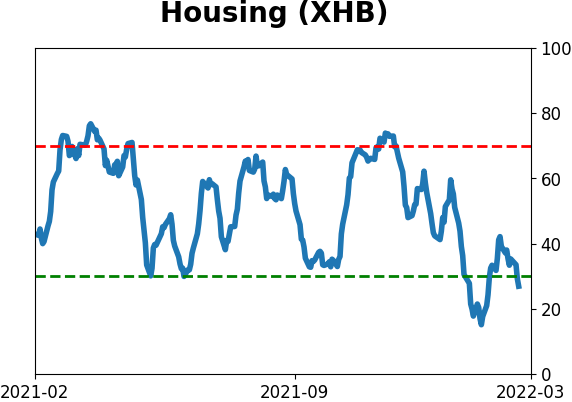
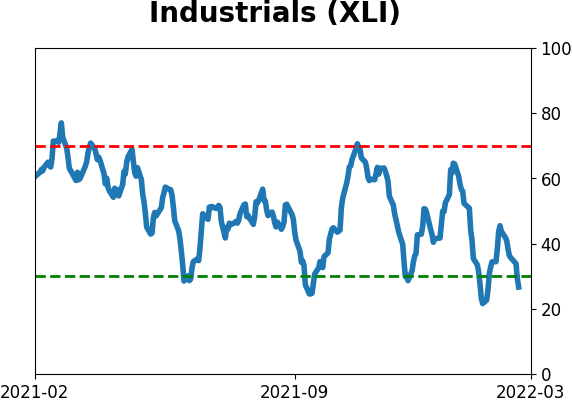
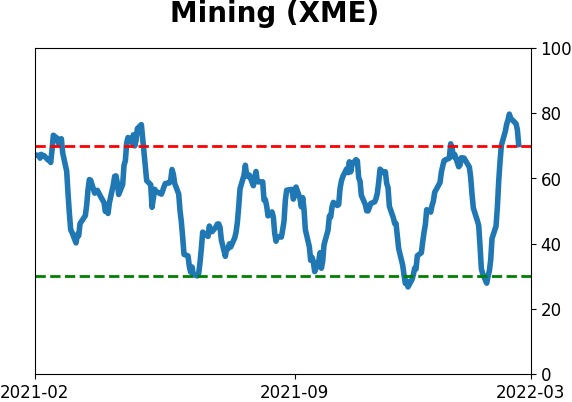
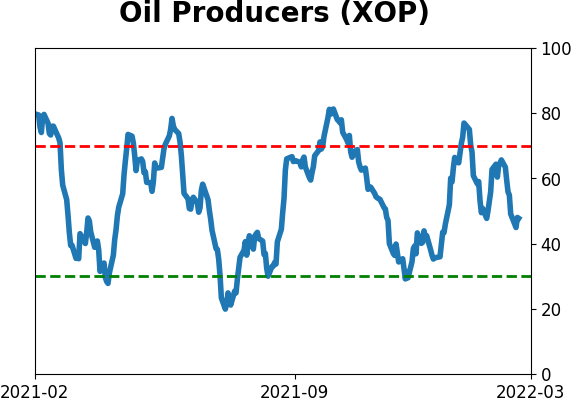
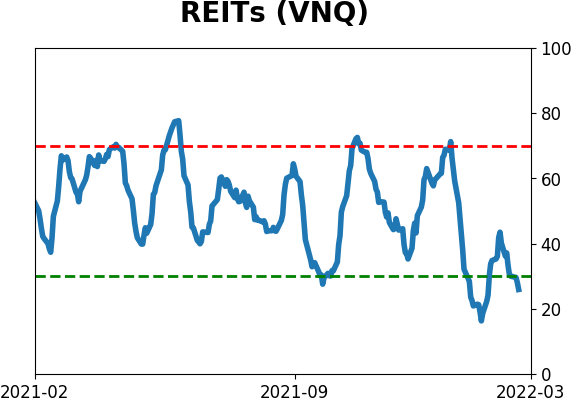
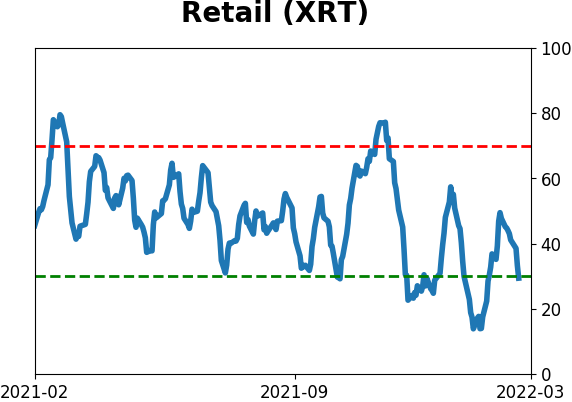
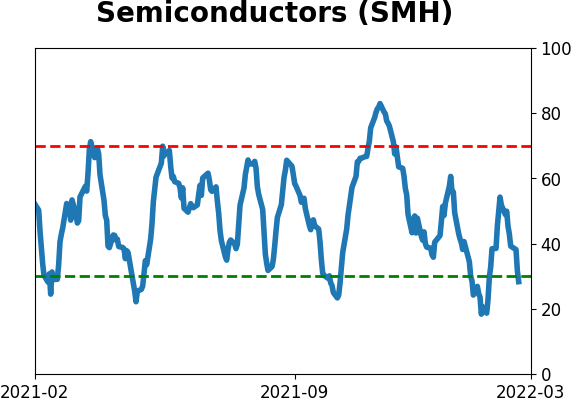
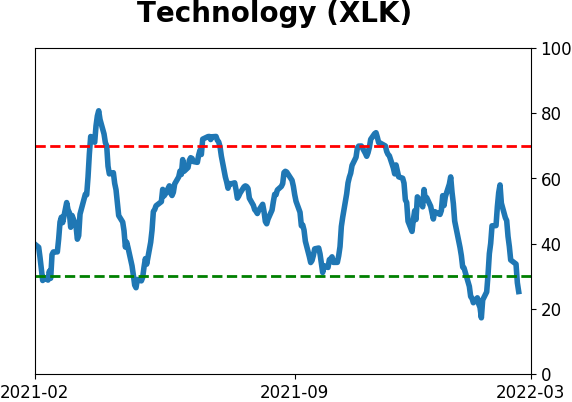
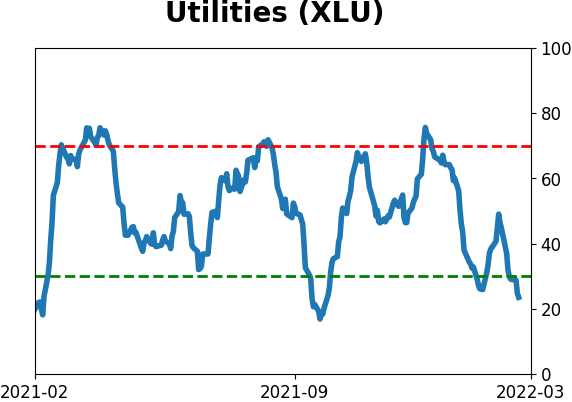
Sector ETF's - 10-Day Moving Average
|
|
|
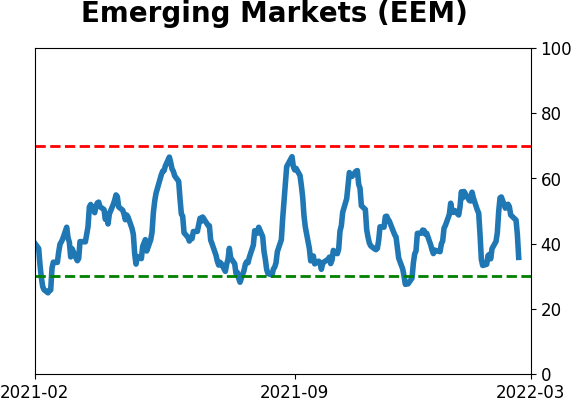
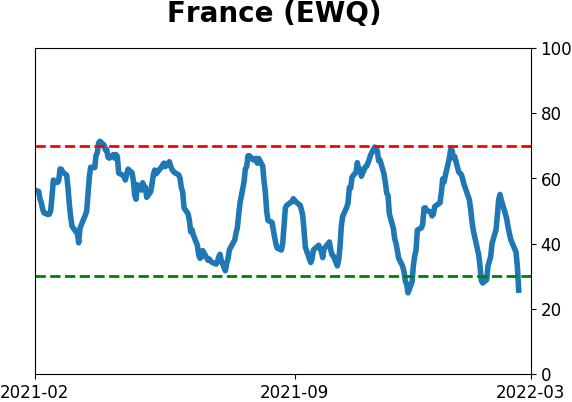
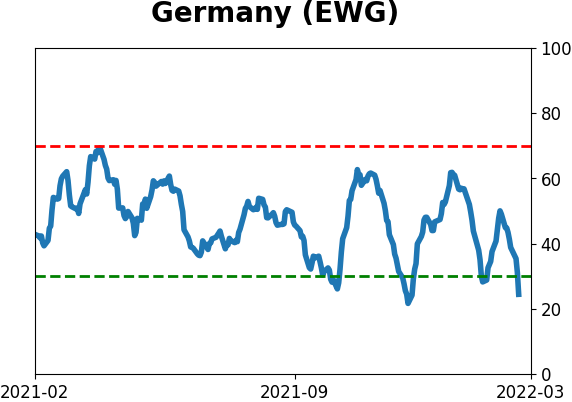
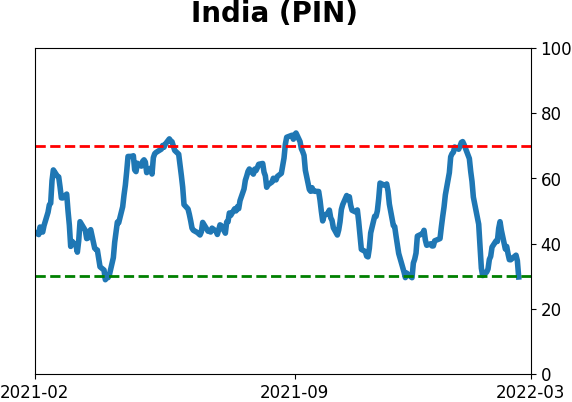
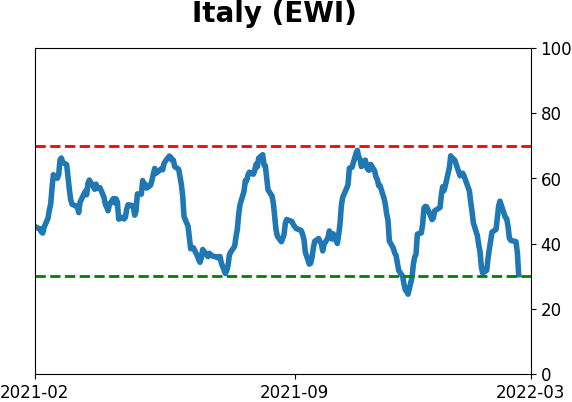
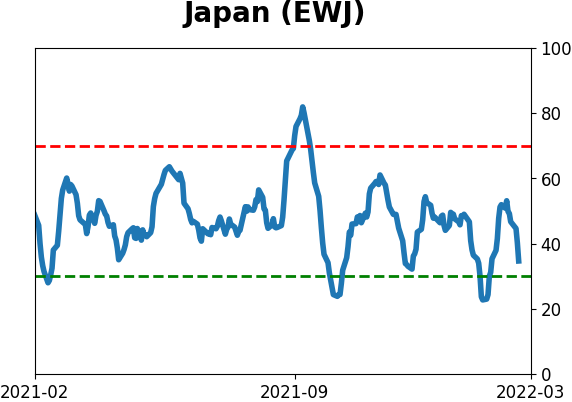
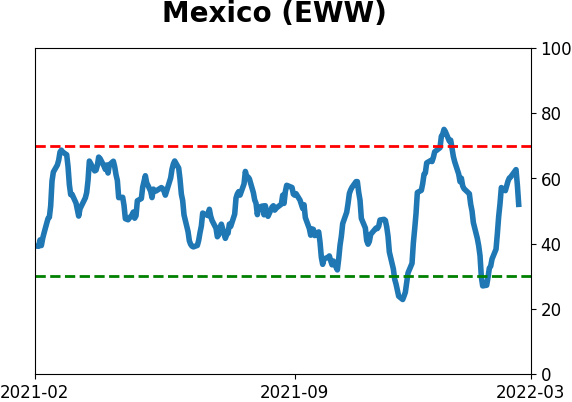
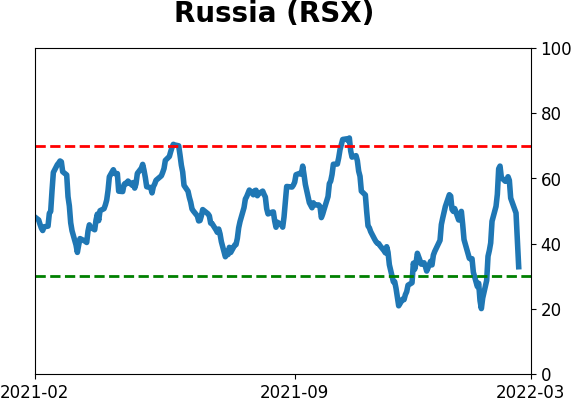
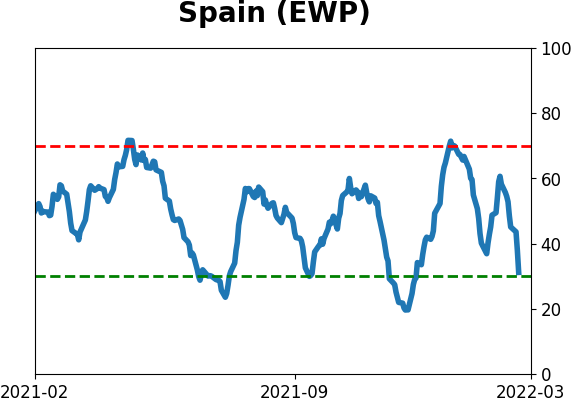
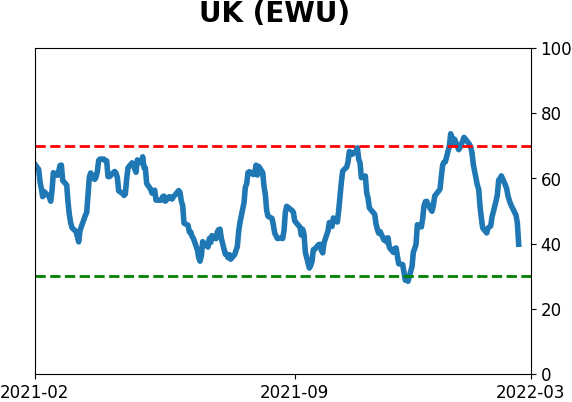
Country ETF's - 10-Day Moving Average
|
|
|
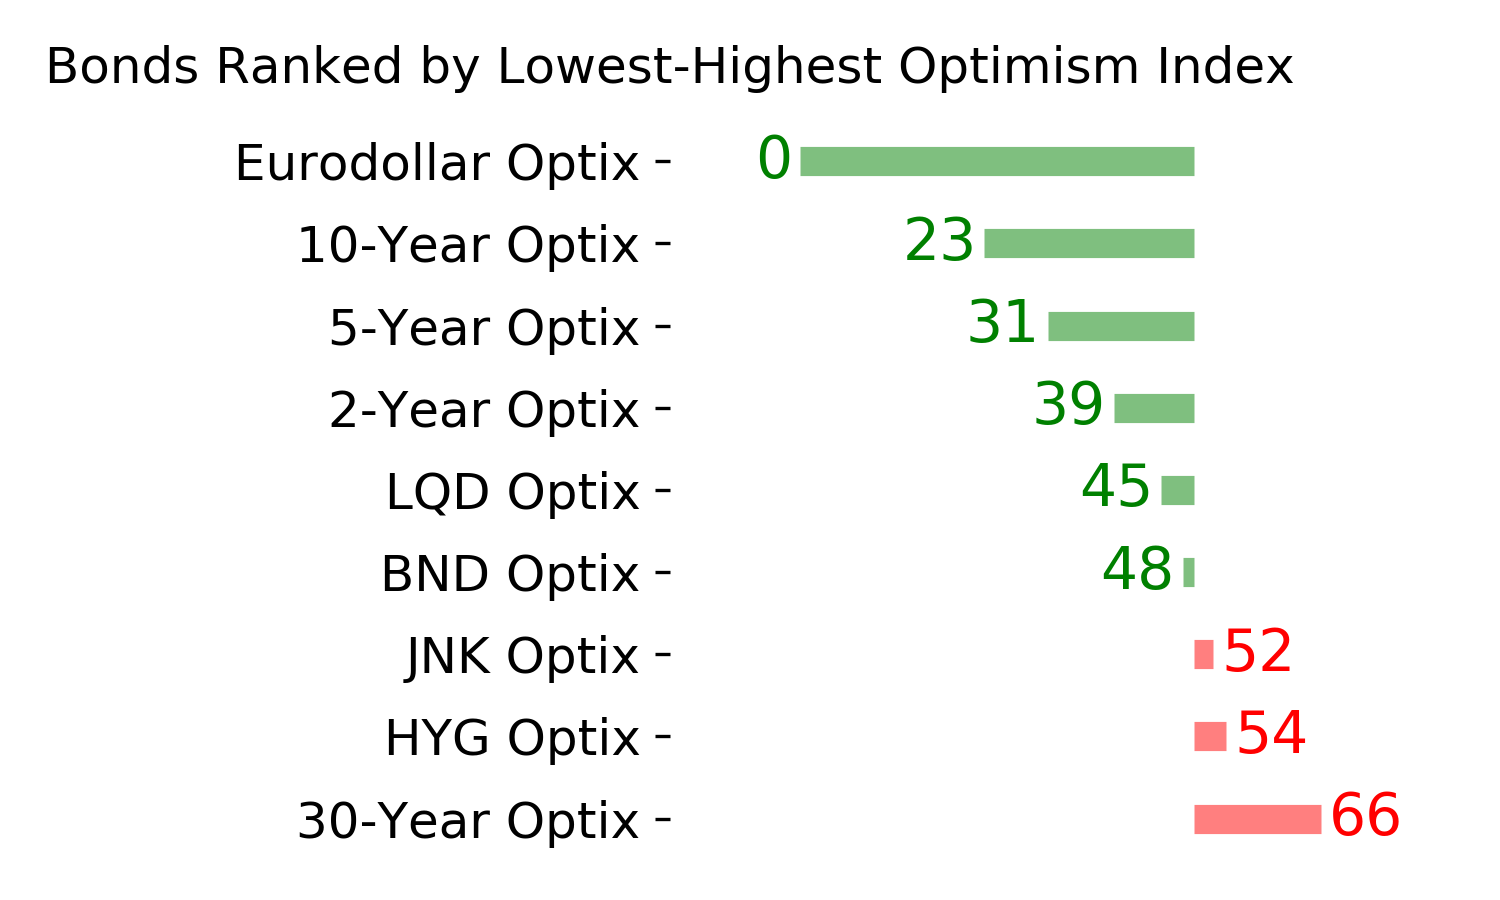
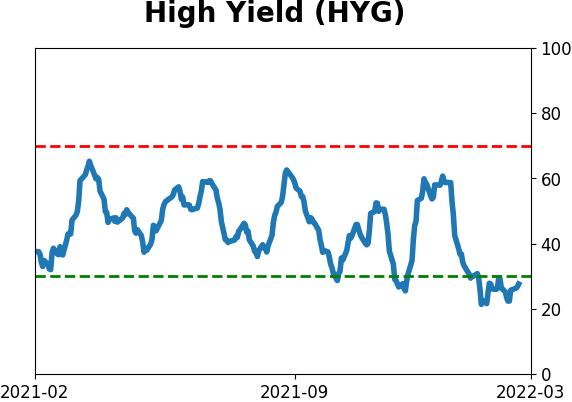
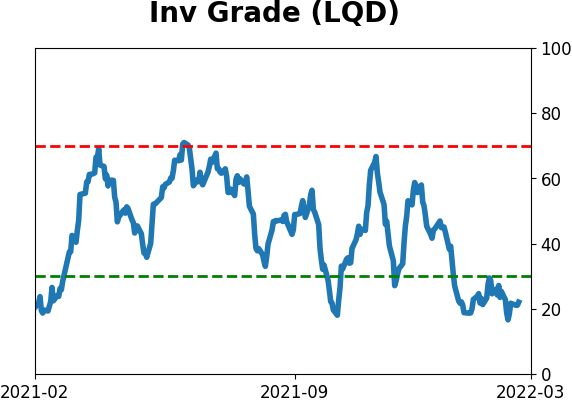
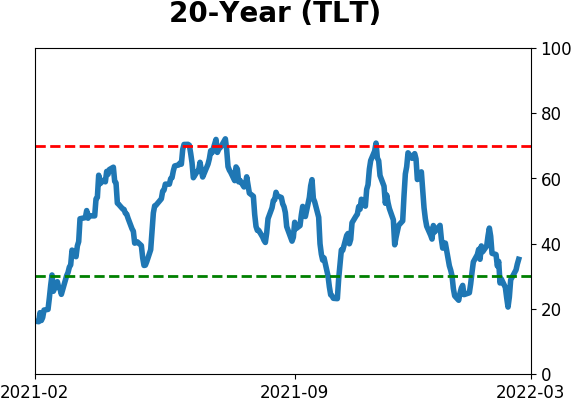
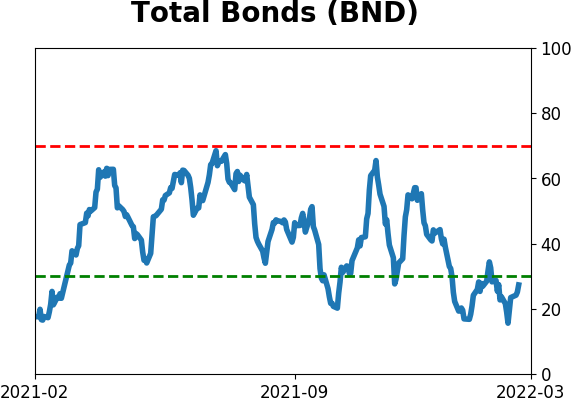
Bond ETF's - 10-Day Moving Average
|
|
|
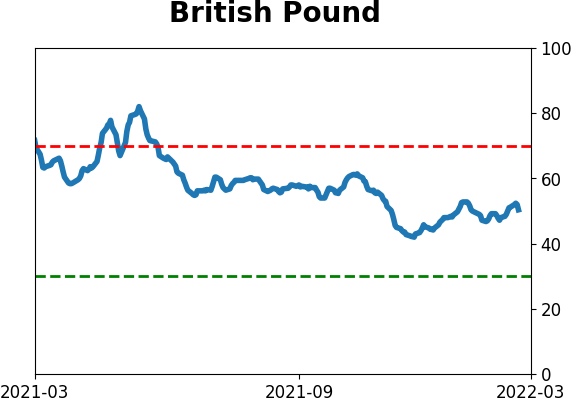
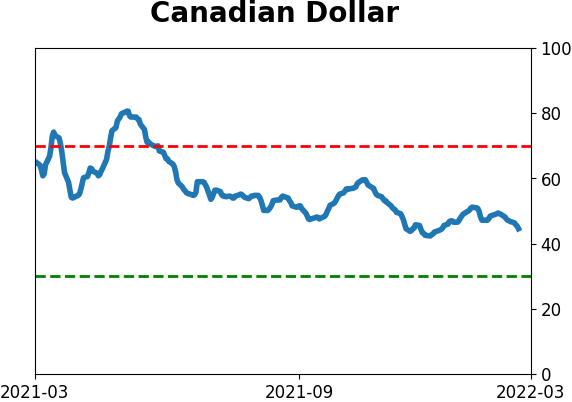
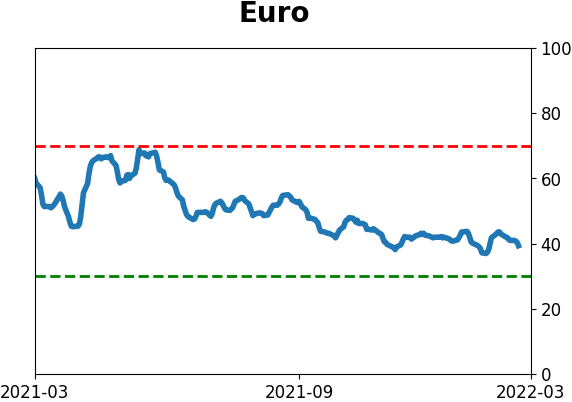
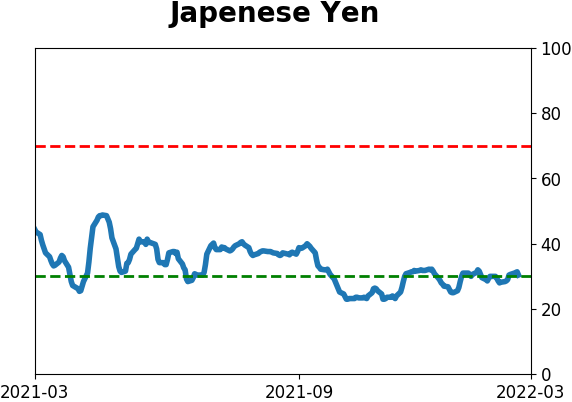
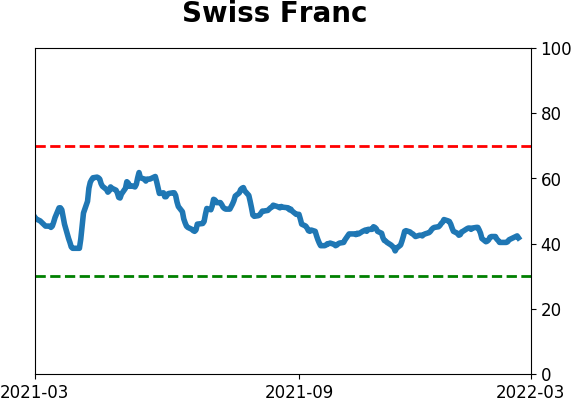
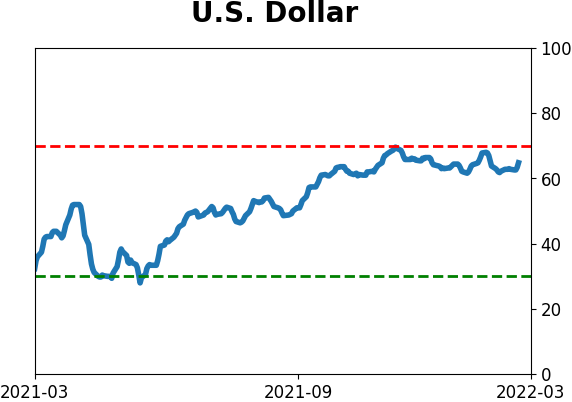
Currency ETF's - 5-Day Moving Average
|
|
|
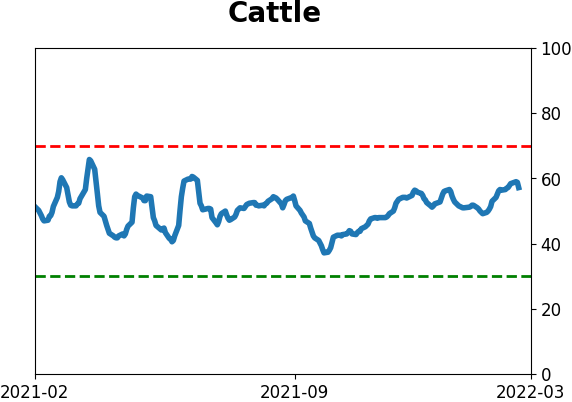
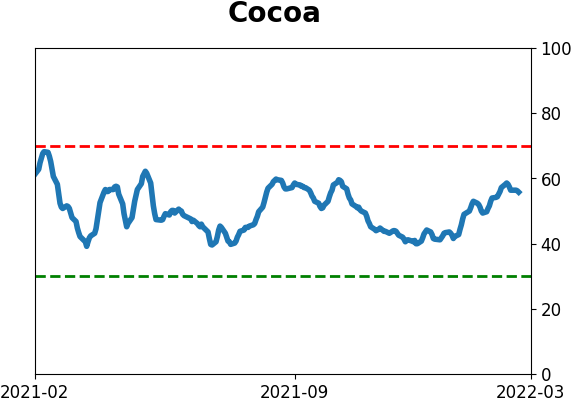
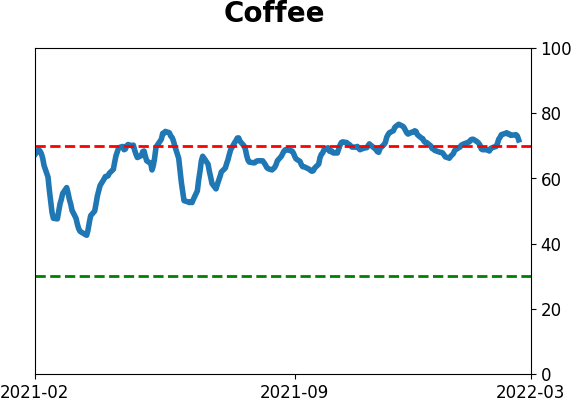
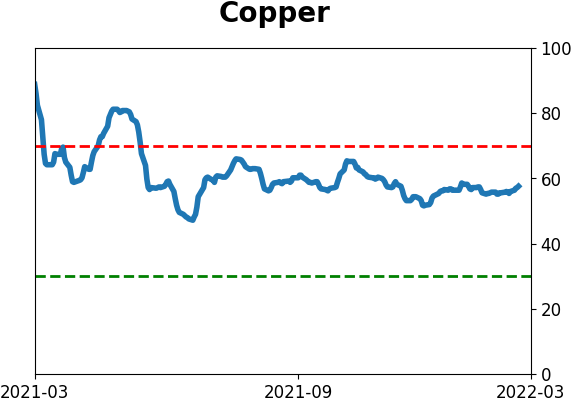
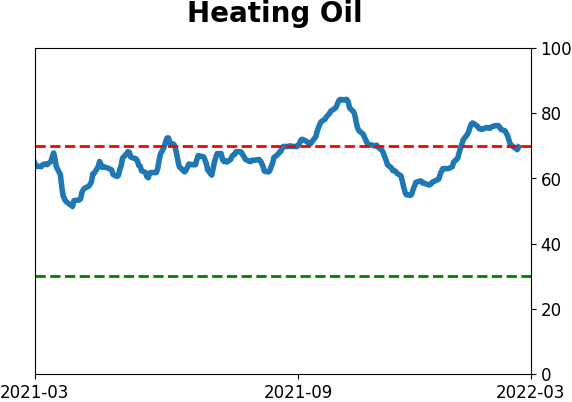
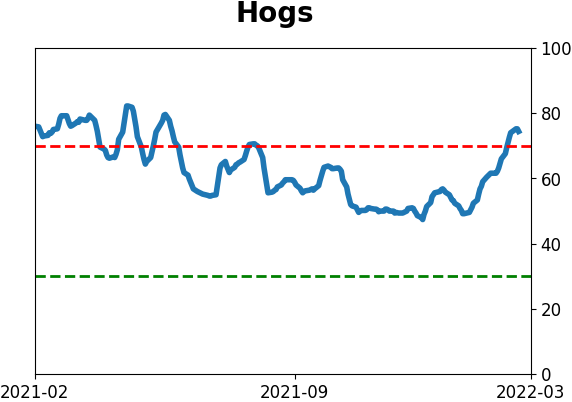
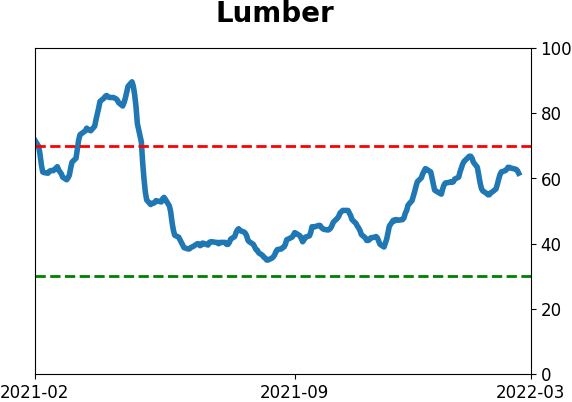
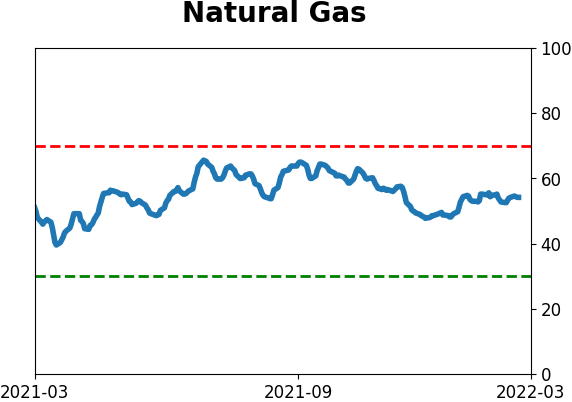
Commodity ETF's - 5-Day Moving Average
|
|