Headlines
|
|
Some thoughts on buying the dip in gold stocks:
Following a sharp rise from early fall into January and a reasonable pullback, many believe that gold stocks are poised for another significant leg up. And given the volatile nature of this sector and its current oversold status, it is possible. Still, several objective indicators suggest this admittedly intriguing sector may struggle in the months ahead. In this piece, we detail the relevant factors.
|
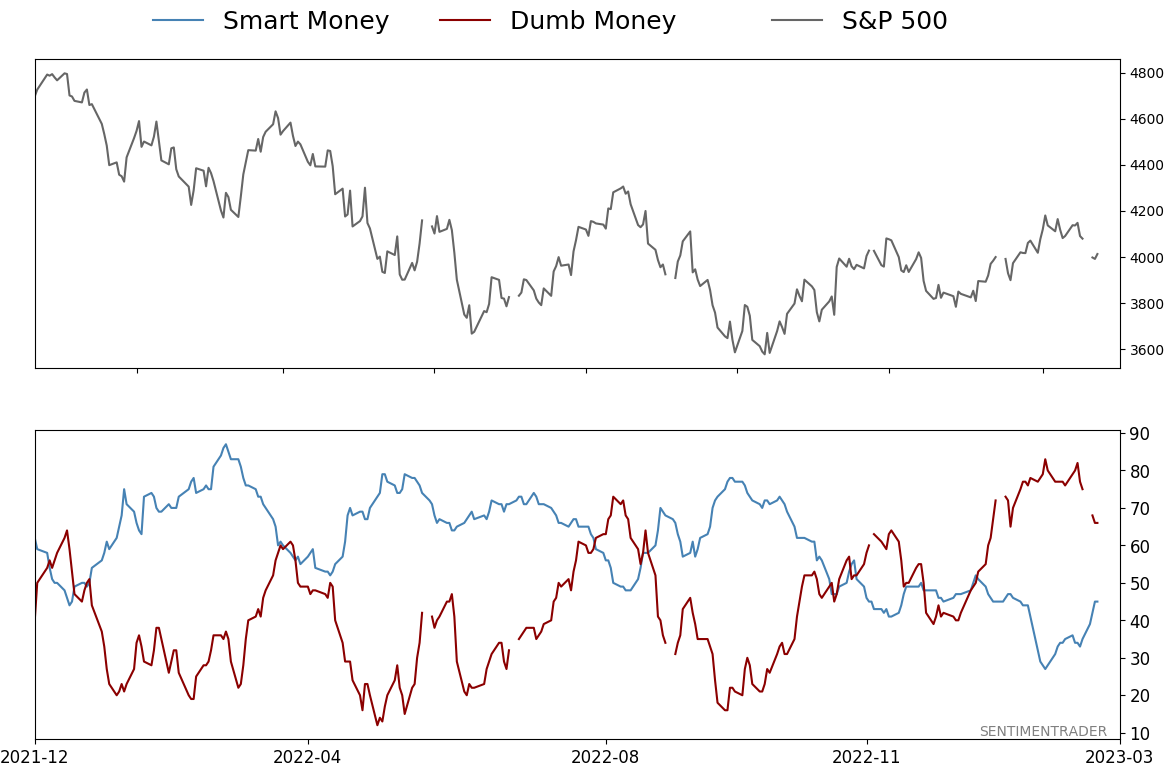
Smart / Dumb Money Confidence
|
Smart Money Confidence: 45%
Dumb Money Confidence: 66%
|
|
Risk Levels
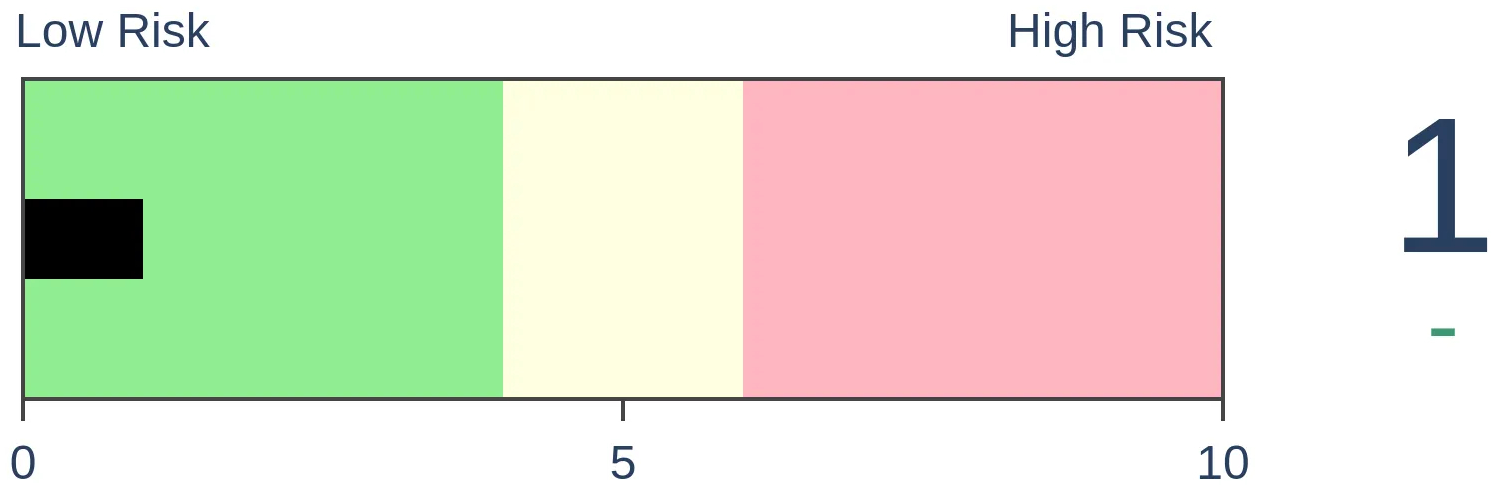
Stocks Short-Term
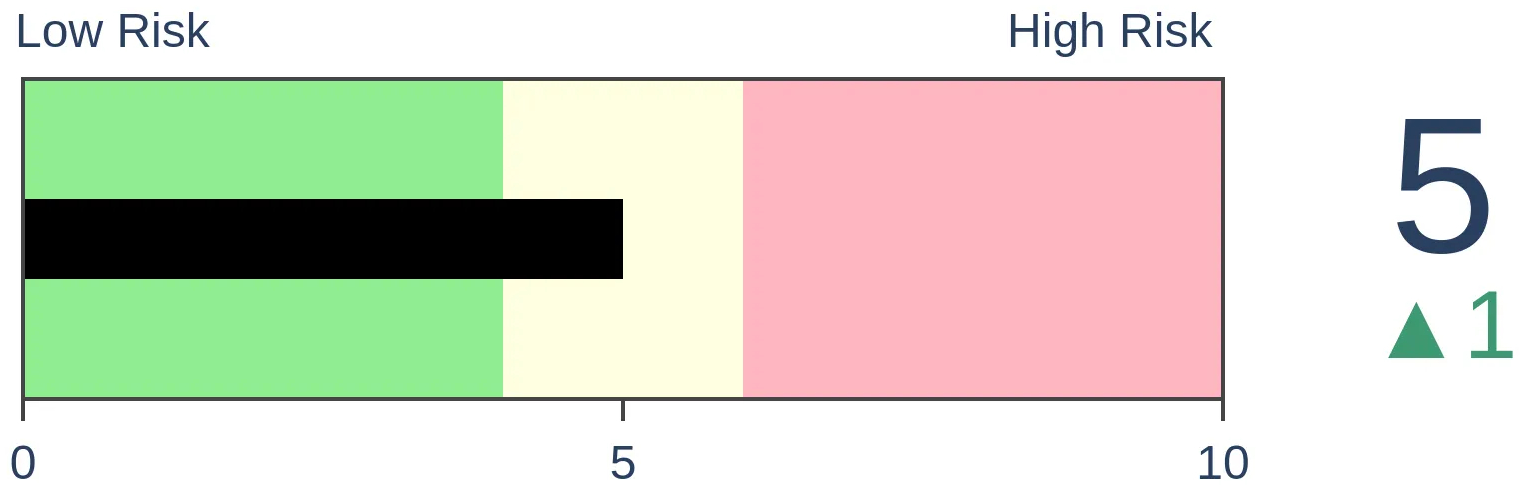
|
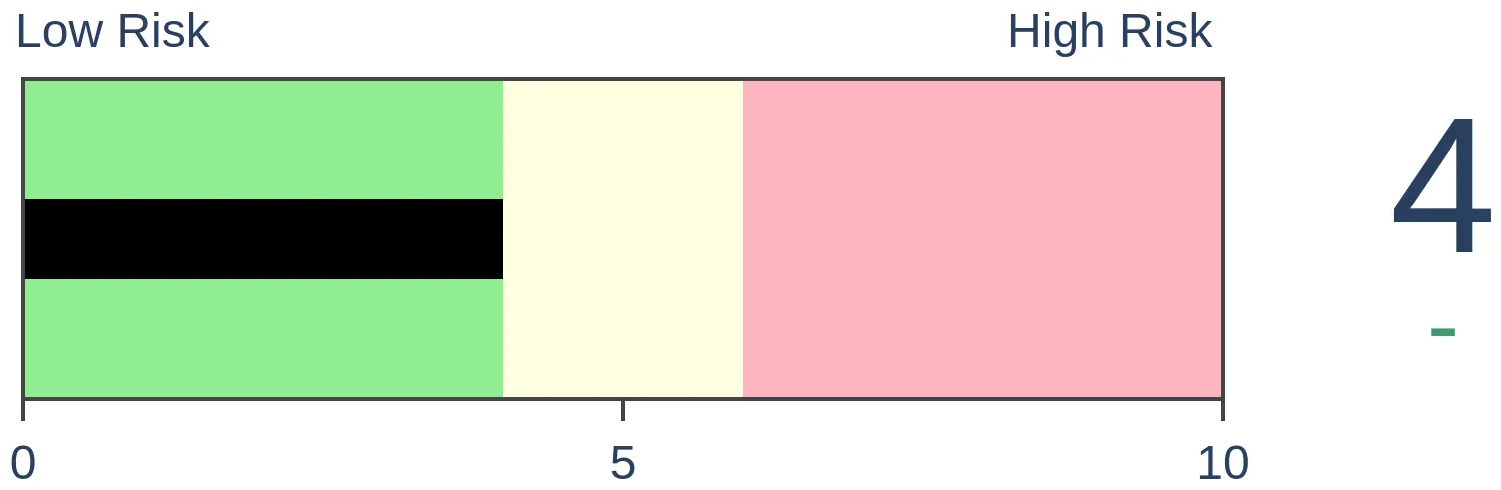
Stocks Medium-Term
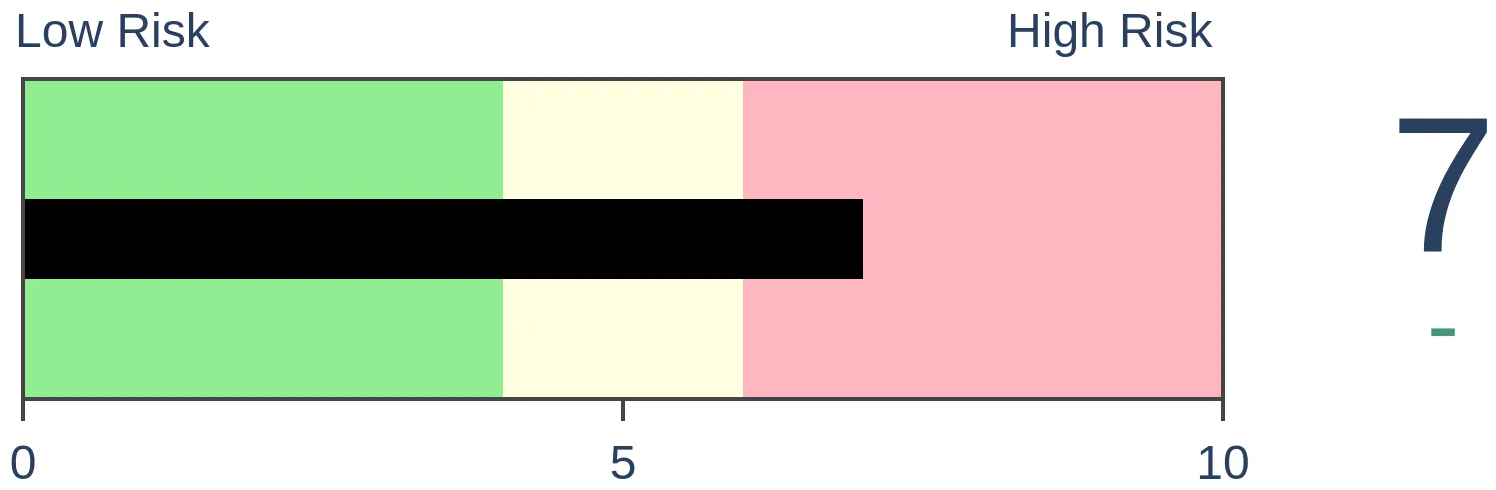
|
|
Bonds
|
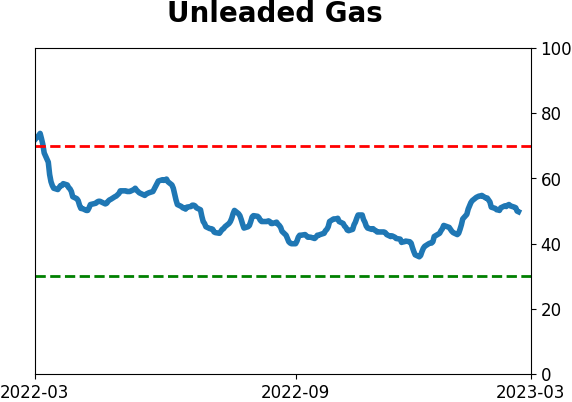
Crude Oil
|
|
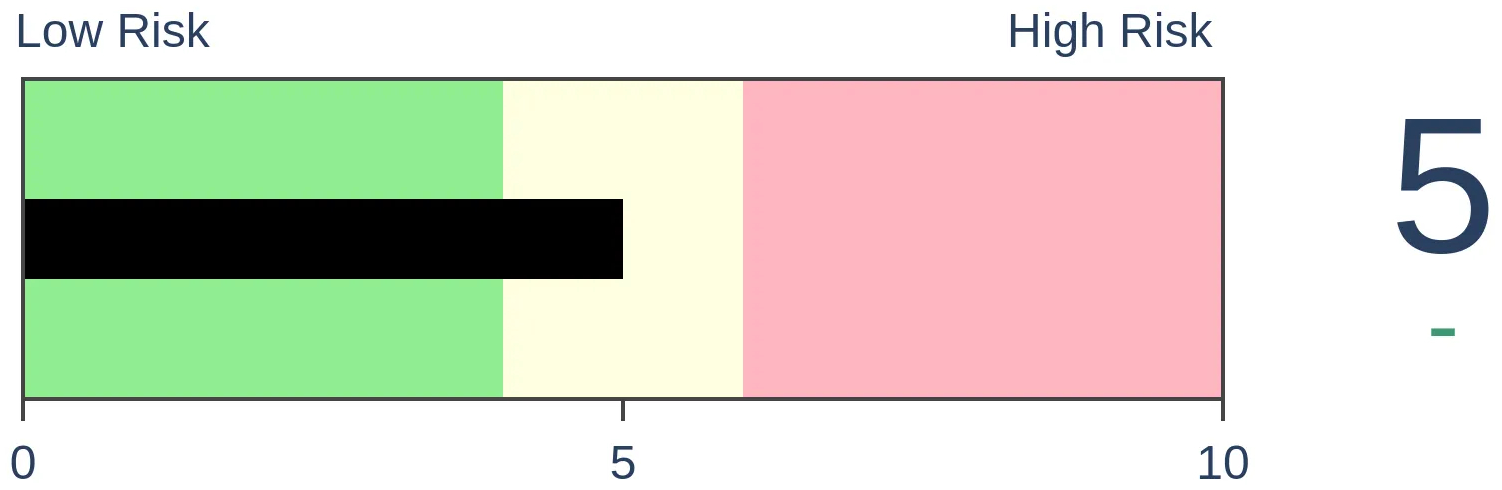
Gold
|
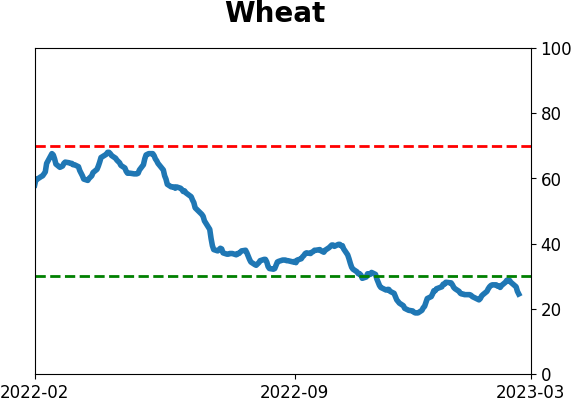
Agriculture

|
|
Research
By Jay Kaeppel
BOTTOM LINE
Following a sharp rise from early fall into January and a reasonable pullback, many believe that gold stocks are poised for another significant leg up. And given the volatile nature of this sector and its current oversold status, it is possible. Still, several objective indicators suggest this admittedly intriguing sector may struggle in the months ahead. In this piece, we detail the relevant factors.
FORECAST / TIMEFRAME
None
|
Key points
- Gold stocks rallied over +50% following the September 2022 low
- Since topping in late January 2023, they have fallen over -18% and triggered a useful oversold indicator in the process
- While some view this as a buying opportunity, several key indicators suggest caution
First, the good news
The chart below highlights those days when the 50-day average for our GDX Optix indicator crossed above 37. While overall results vary quite a bit from signal to signal, the 6-month time frame has shown some spectacular results. Since the most recent signal on 2022-09-02, GDX is up +15% even after the recent decline.
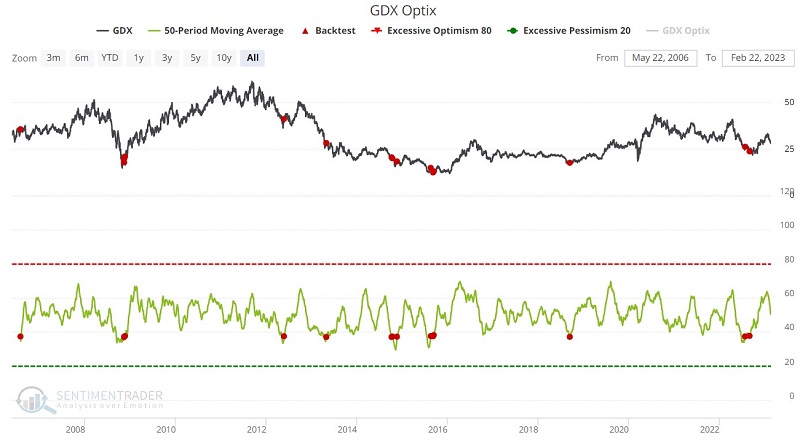
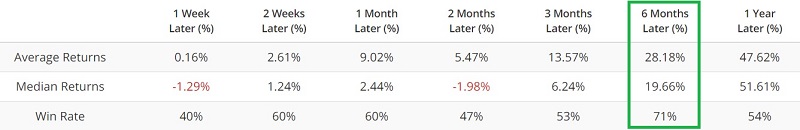
Unfortunately, the favorable 6-month period following the abovementioned signal ends on 2023-03-02.
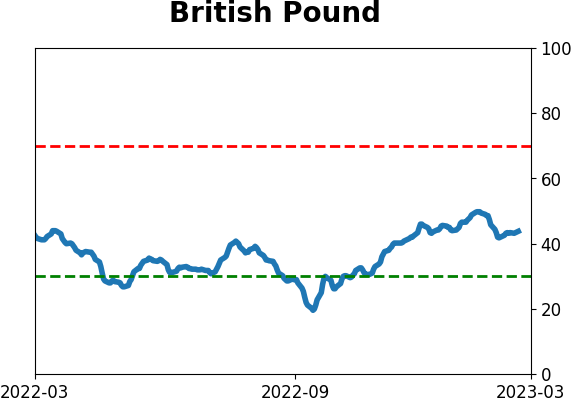
Another little-known favorable sign for gold stocks occurred on 2022-09-23 when our British Pound Risk Reversal indicator crossed below -3.2. The chart and table below highlight the performance of GDX following previous rare signals.
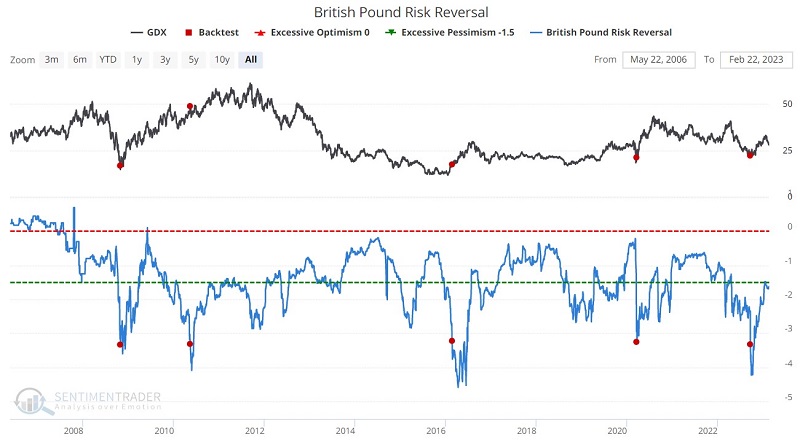
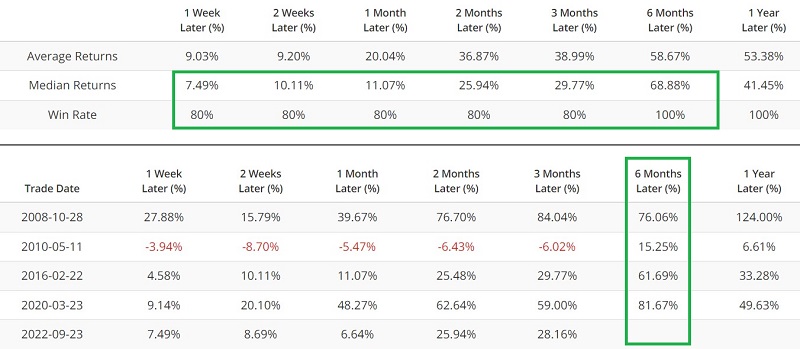
Once again, the "sweet spot" is the 6-month time frame following a signal. This period has roughly a month left to run. So far, GDX is approximately +21% above its level on 2022-09-23.
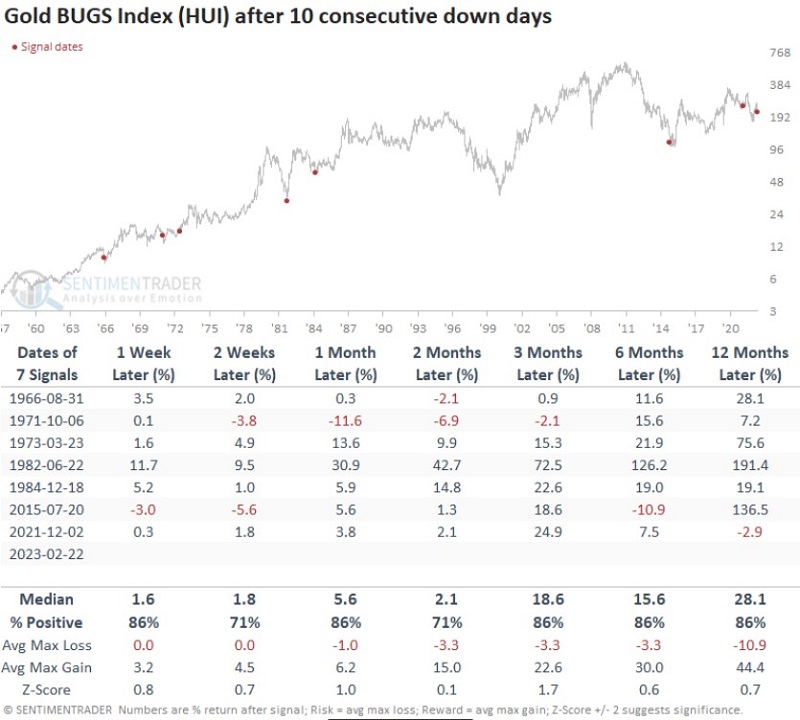
Gold Bugs Index down ten days in row
The Gold Bugs Index (ticker HUI) is a gold stock index with a history back to 1957. Dean Christians alerted me to the fact that as of the close on 2023-02-22, HUI registered its tenth consecutive lower close. Dean also provided the chart below. Ten consecutive down closes are infrequent and historically have marked some terrific buying opportunities.
Now for the bad news
The good news for gold stock bulls is that the favorable periods following the above signals still have time to run. Likewise, based on Dean's note regarding the oversold status of ticker HUI, it can be argued that gold stocks are "oversold and due for a bounce." For now, let's look at some unfavorable objective indicators for gold stocks.
Seasonality becomes a headwind
The chart below displays the annual seasonal trend for VanEck Gold Miners ETF (ticker GDX).
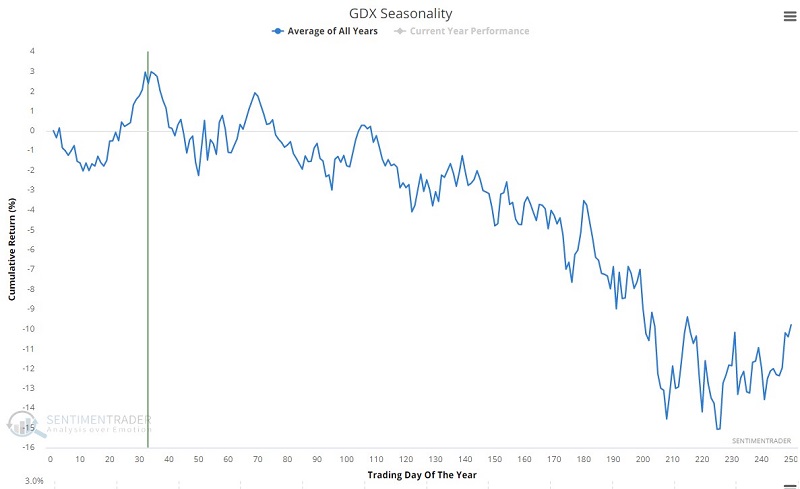
As always, seasonality is "climate, not weather," Indeed, gold stocks will not top out in February every year and then embark on a ten-month decline. Nevertheless, history is what it is, and seasonality will soon fall on the negative side of the ledger. To highlight the significance of seasonality in the gold stock sector, we tested the Gold Bugs Index (HUI) back to 1957.
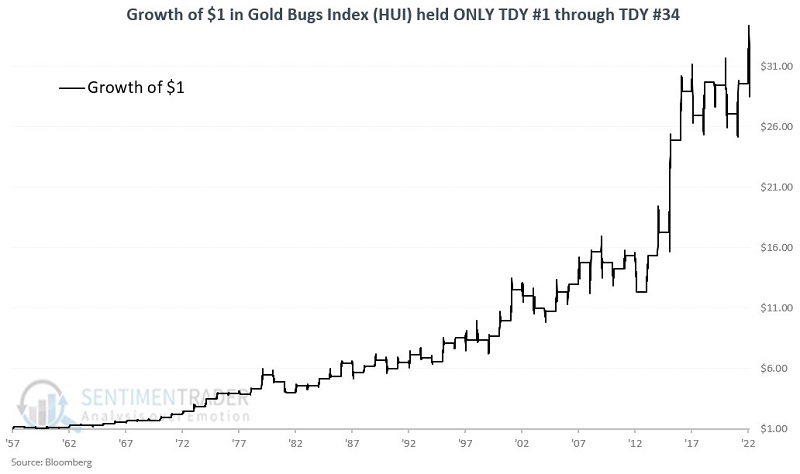
The chart below displays the growth of $1 in the Gold Bugs Index only during the first 34 trading days of every year starting in 1958. While some years experience a loss during the first 34 trading days, the long-term upward trend is unmistakable.
Now let's look at the performance of gold stocks during the rest of the calendar year (i.e., Trading Day of the Year #35 through the end of the year). The chart below shows the growth of $1 in the Gold Bugs Index held starting on TDY #35 through year-end. Whatever favorable bias may have existed during the first 34 days of the year is not apparent here - the chart is more like the "Wild West" of investing.
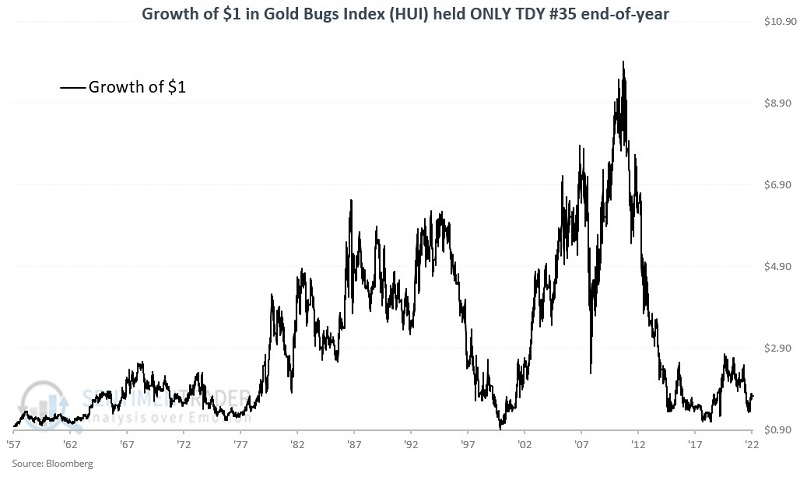
Bottom line: Whatever favorable seasonal headwinds may have existed for gold stocks in early 2023 are now over.
GDX Optix reversed from an extreme
Gold stock trader optimism understandably rose sharply as GDX rallied from September into January. Unfortunately, it may have gotten a bit overdone. The chart and table below highlight those times when:
- The 50-day average for GDX Optix dropped below 60
- While GDX was above its 150-day moving average
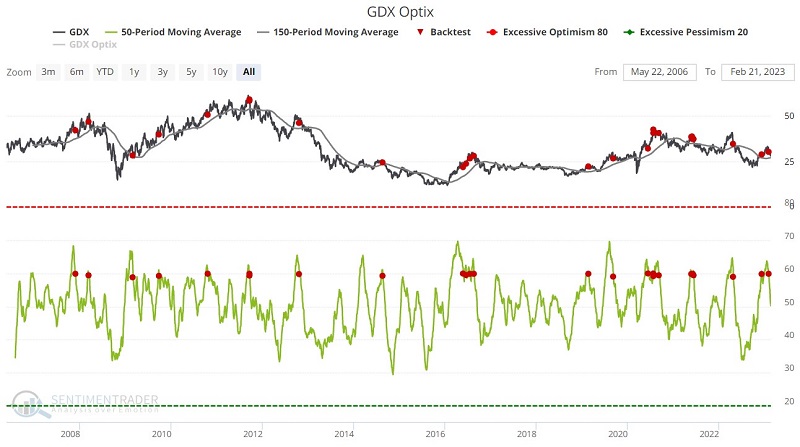
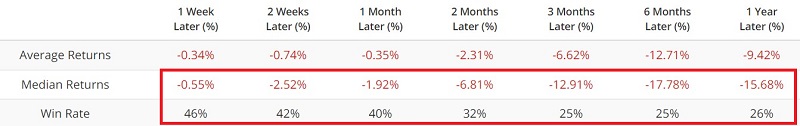
Historical results have been subpar across all time frames. The most recent unfavorable signal occurred on 2023-02-03, suggesting potential gold stock weakness as 2023 unfolds.
GDX Breadth signaled an overbought condition
The chart and table below highlight when the GDX Breadth (% > 200 Day Avg) indicator was above 94%.
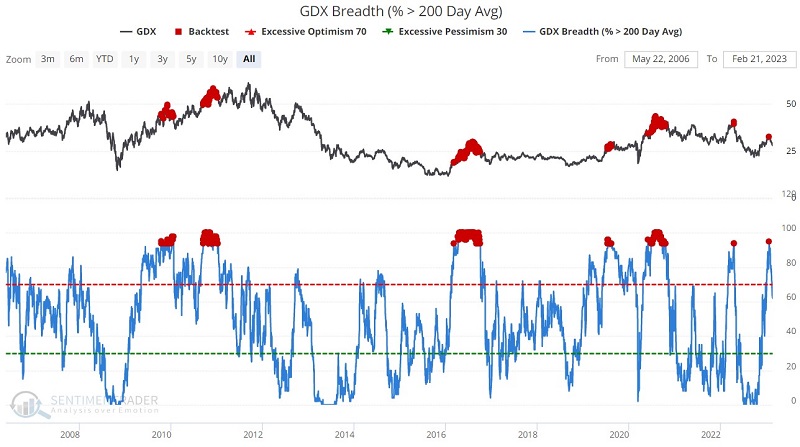
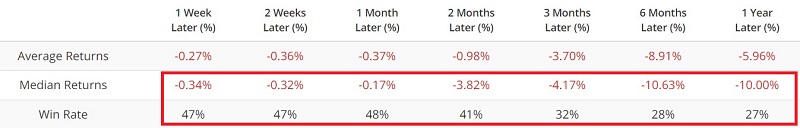
The most recent unfavorable signal occurred on 2023-01-26, and the results above also suggest the potential for poor GDX performance as 2023 progresses.
Another wild card: Elliott Wave
Elliot Wave theory is founded in the notion that things in nature (including prices) move in 5 waves up - three up, two down alternatingly, and then five waves down. Belief in Elliott Wave among traders ranges from "religious" to "ridiculous." I am not a huge proponent of Elliott Wave Theory (the primary problem for me is the typically subjective nature in which the waves are interpreted from one trader to the next). But I have known enough people who are that I occasionally pay attention to under a particular circumstance.
The two charts below (courtesy of ProfitSource by HUBB) display a daily and weekly chart for GDX with the daily and weekly Elliott Wave count.
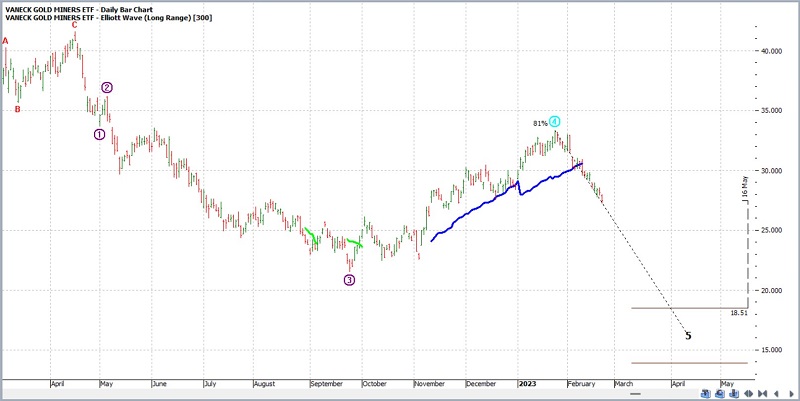
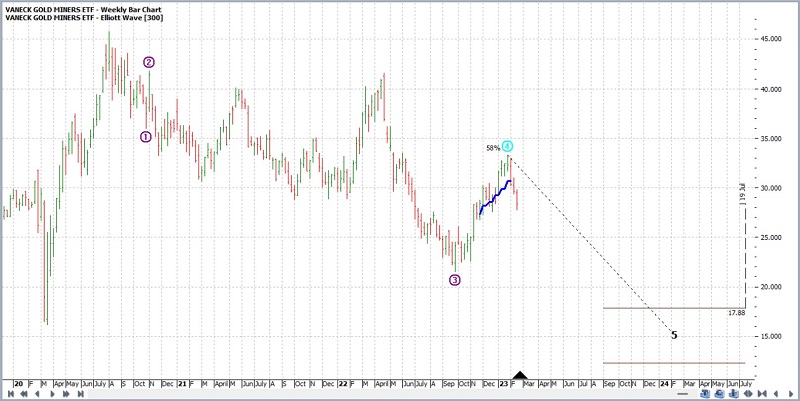
While I do not rely on these charts specifically to trigger trades, a) the wave counts - for better or worse - are generated using an objective algorithm (rather than someone's subjective interpretation), and b) it gets my attention when both daily and weekly charts are pointing to a Wave 5 higher (or lower). This does not mean the price will act as projected; it simply suggests a reasonable - and unfavorable - possibility.
What the research tells us…
If nothing else, gold stocks inarguably offer the potential for fast gains. If gold bullion runs to the upside in 2023, history suggests that gold stocks will also - and could even outperform the metal itself. The current oversold status of gold stocks suggests the possibility of a strong bounce. Nevertheless, several other objective breadth and sentiment indicators suggest weakness in the year ahead for gold stocks. These objective indicators are bolstered by a weakening in seasonality and - for those who put any faith in it - Elliott Wave projections pointing lower.
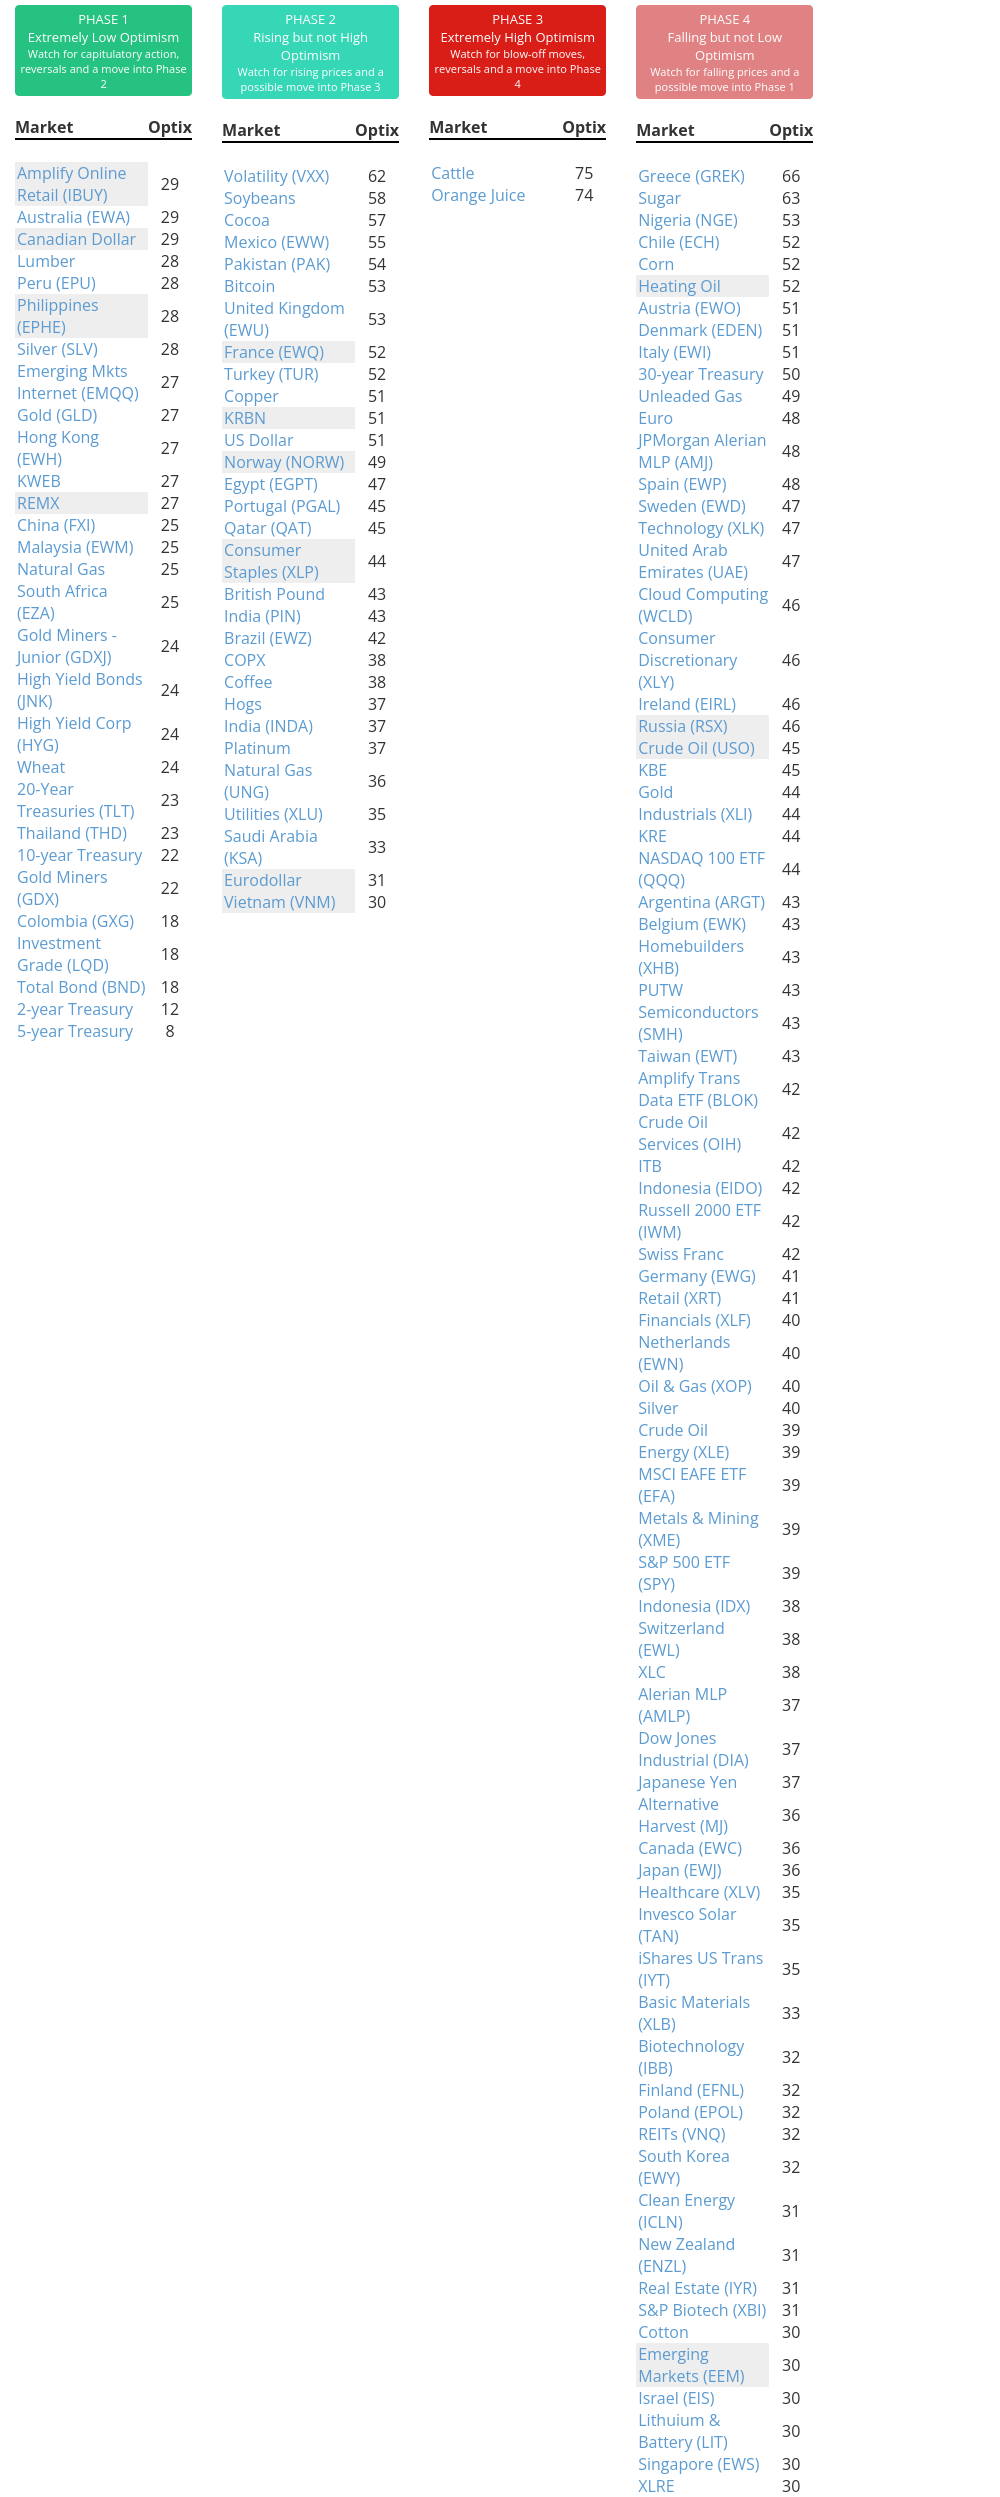
Indicators at Extremes
Phase Table
Ranks
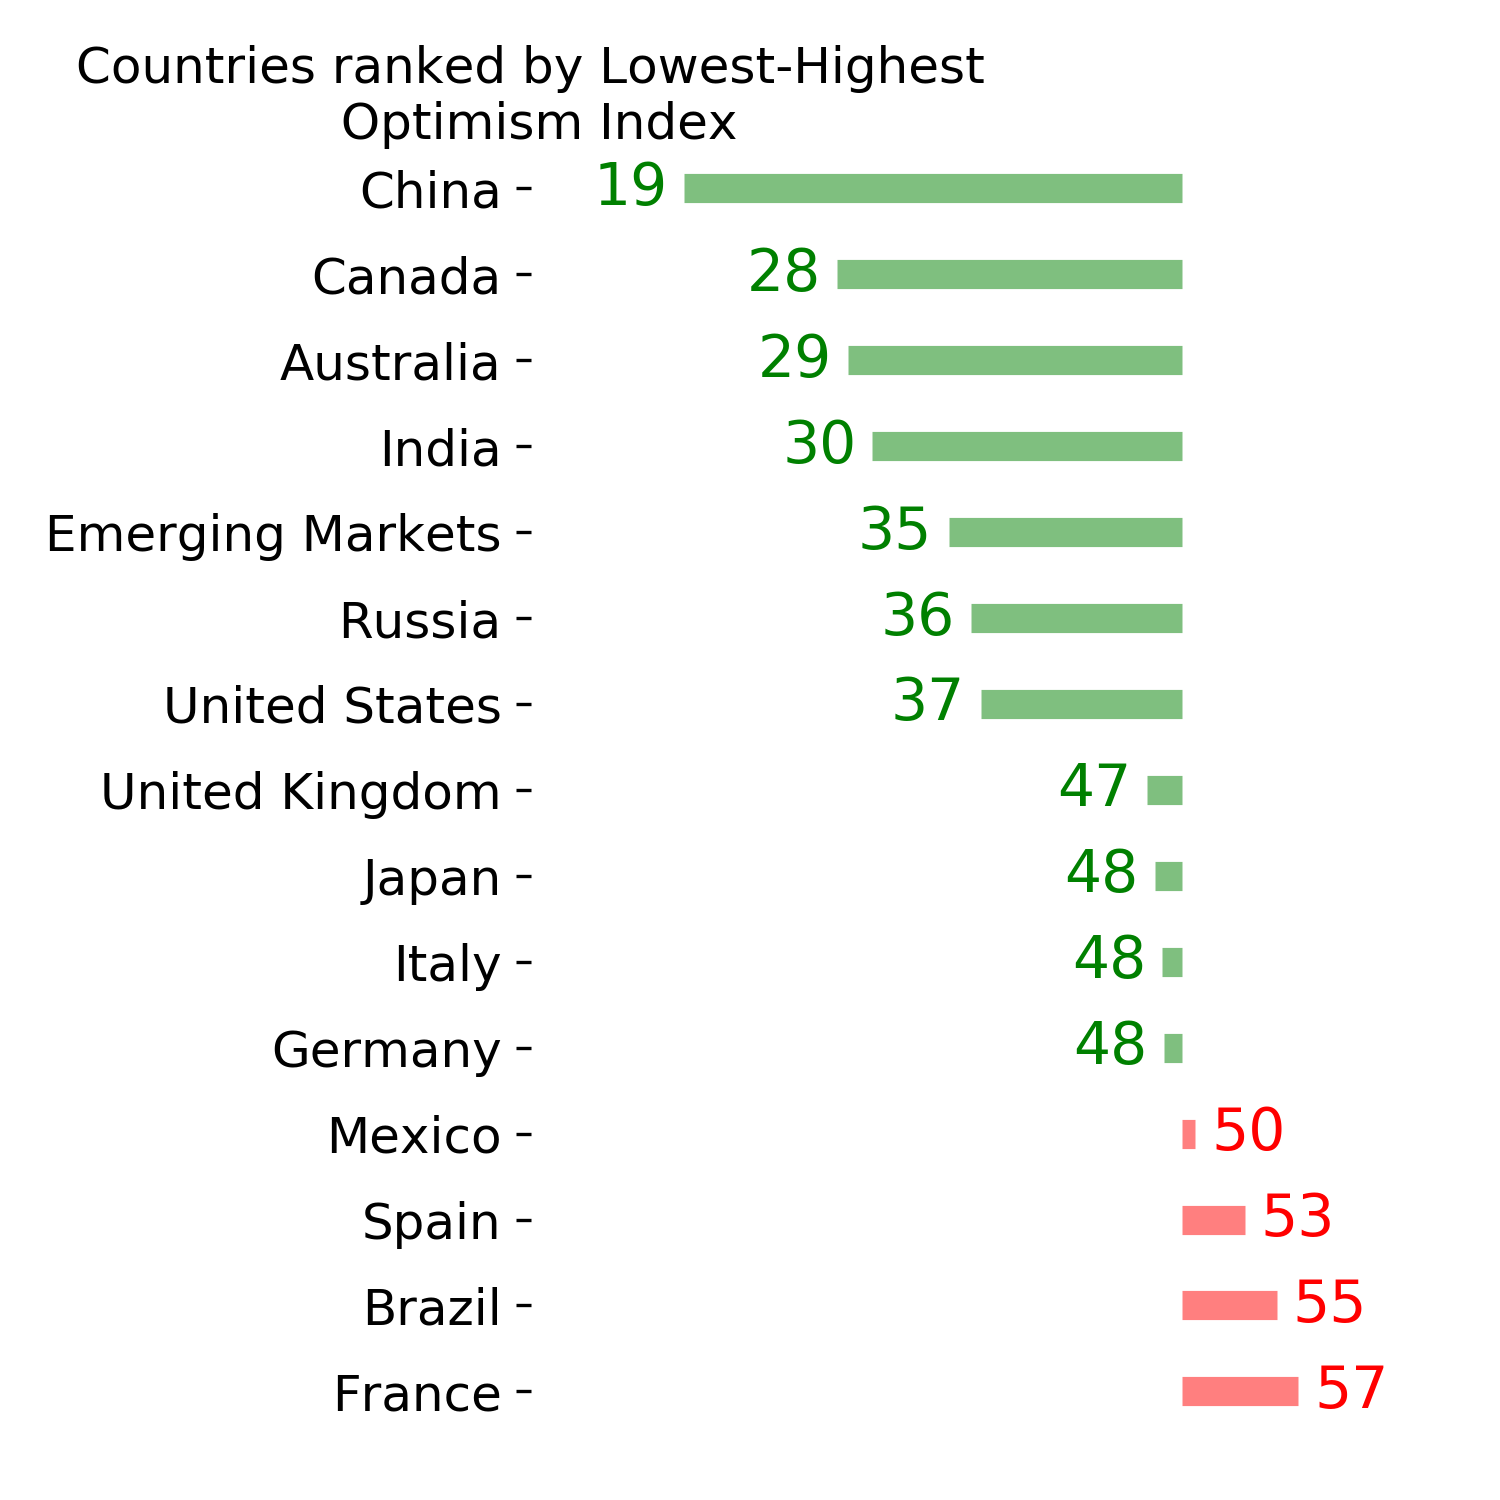
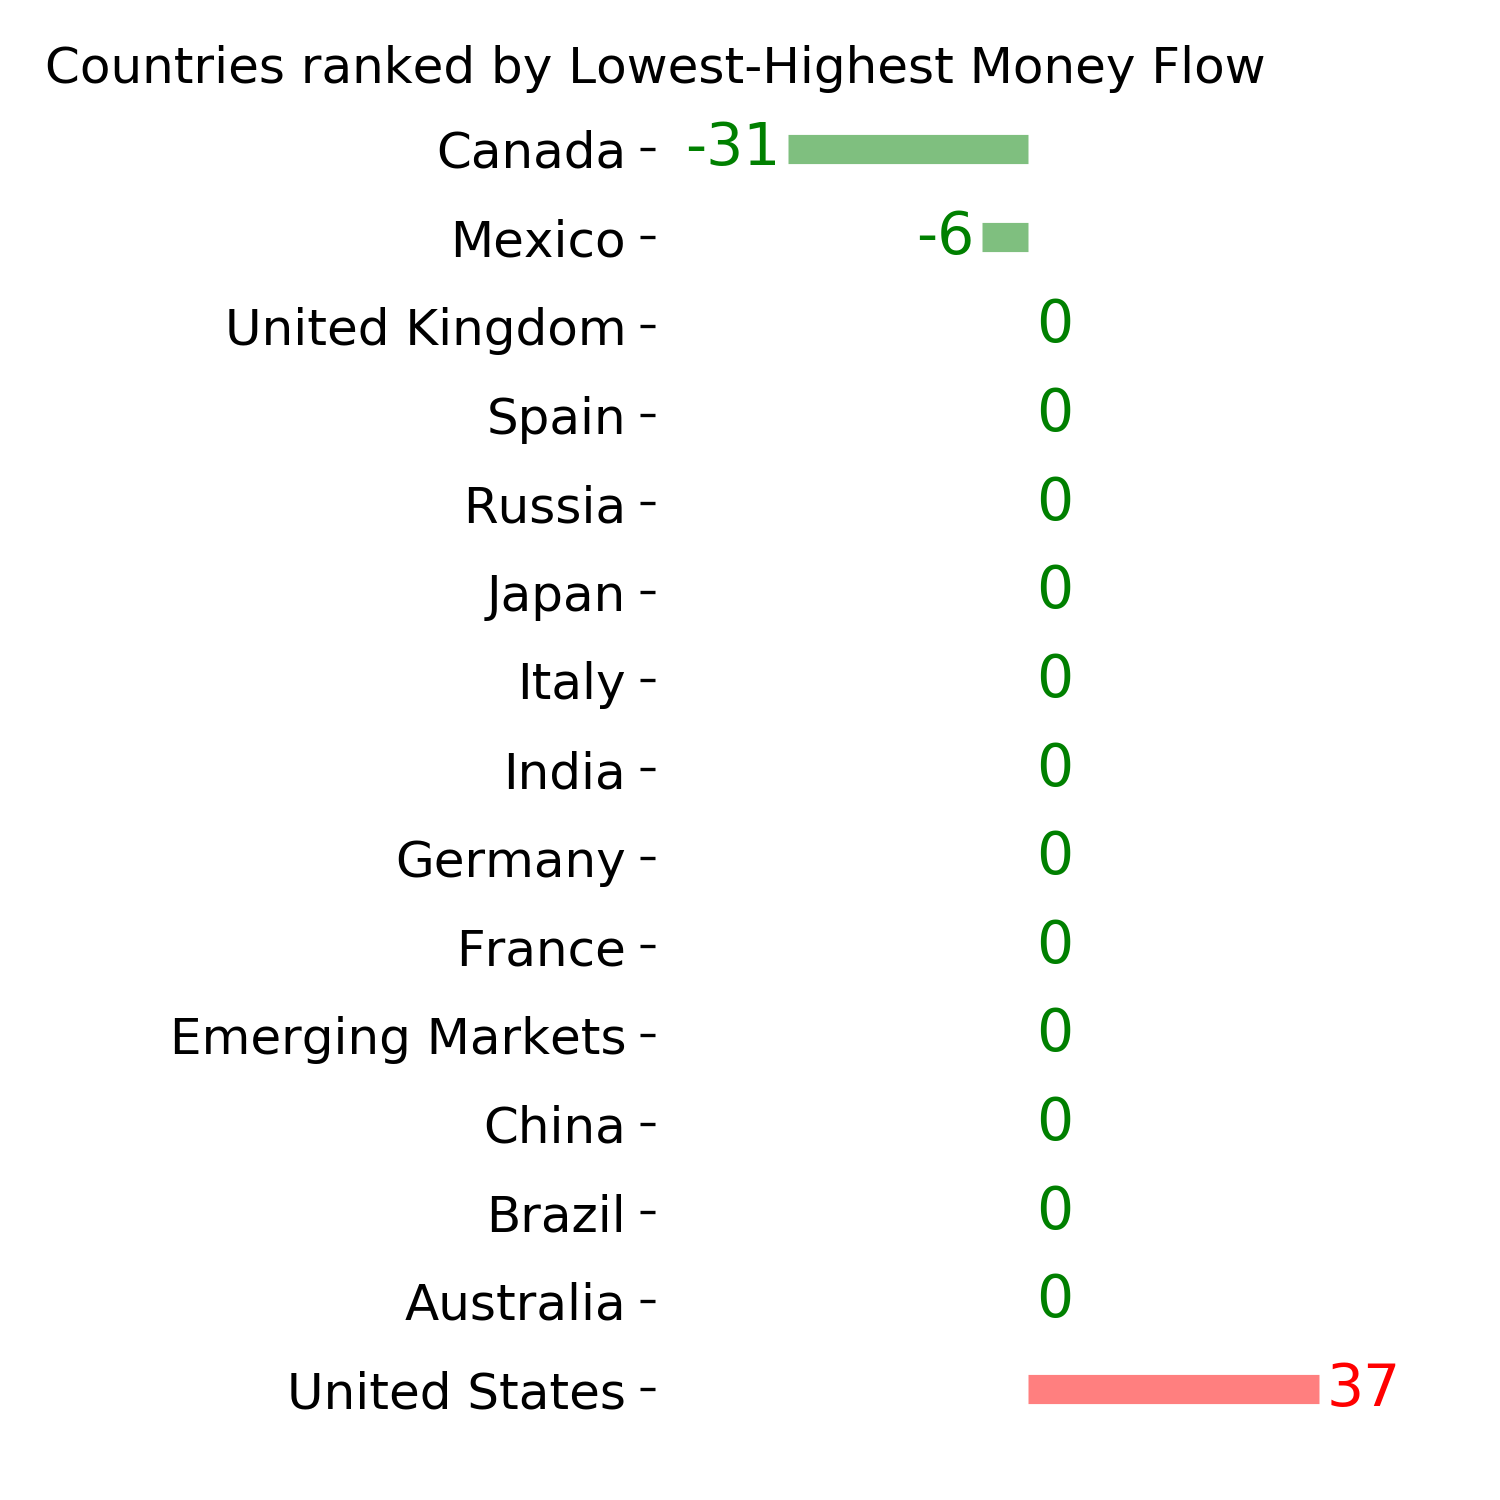
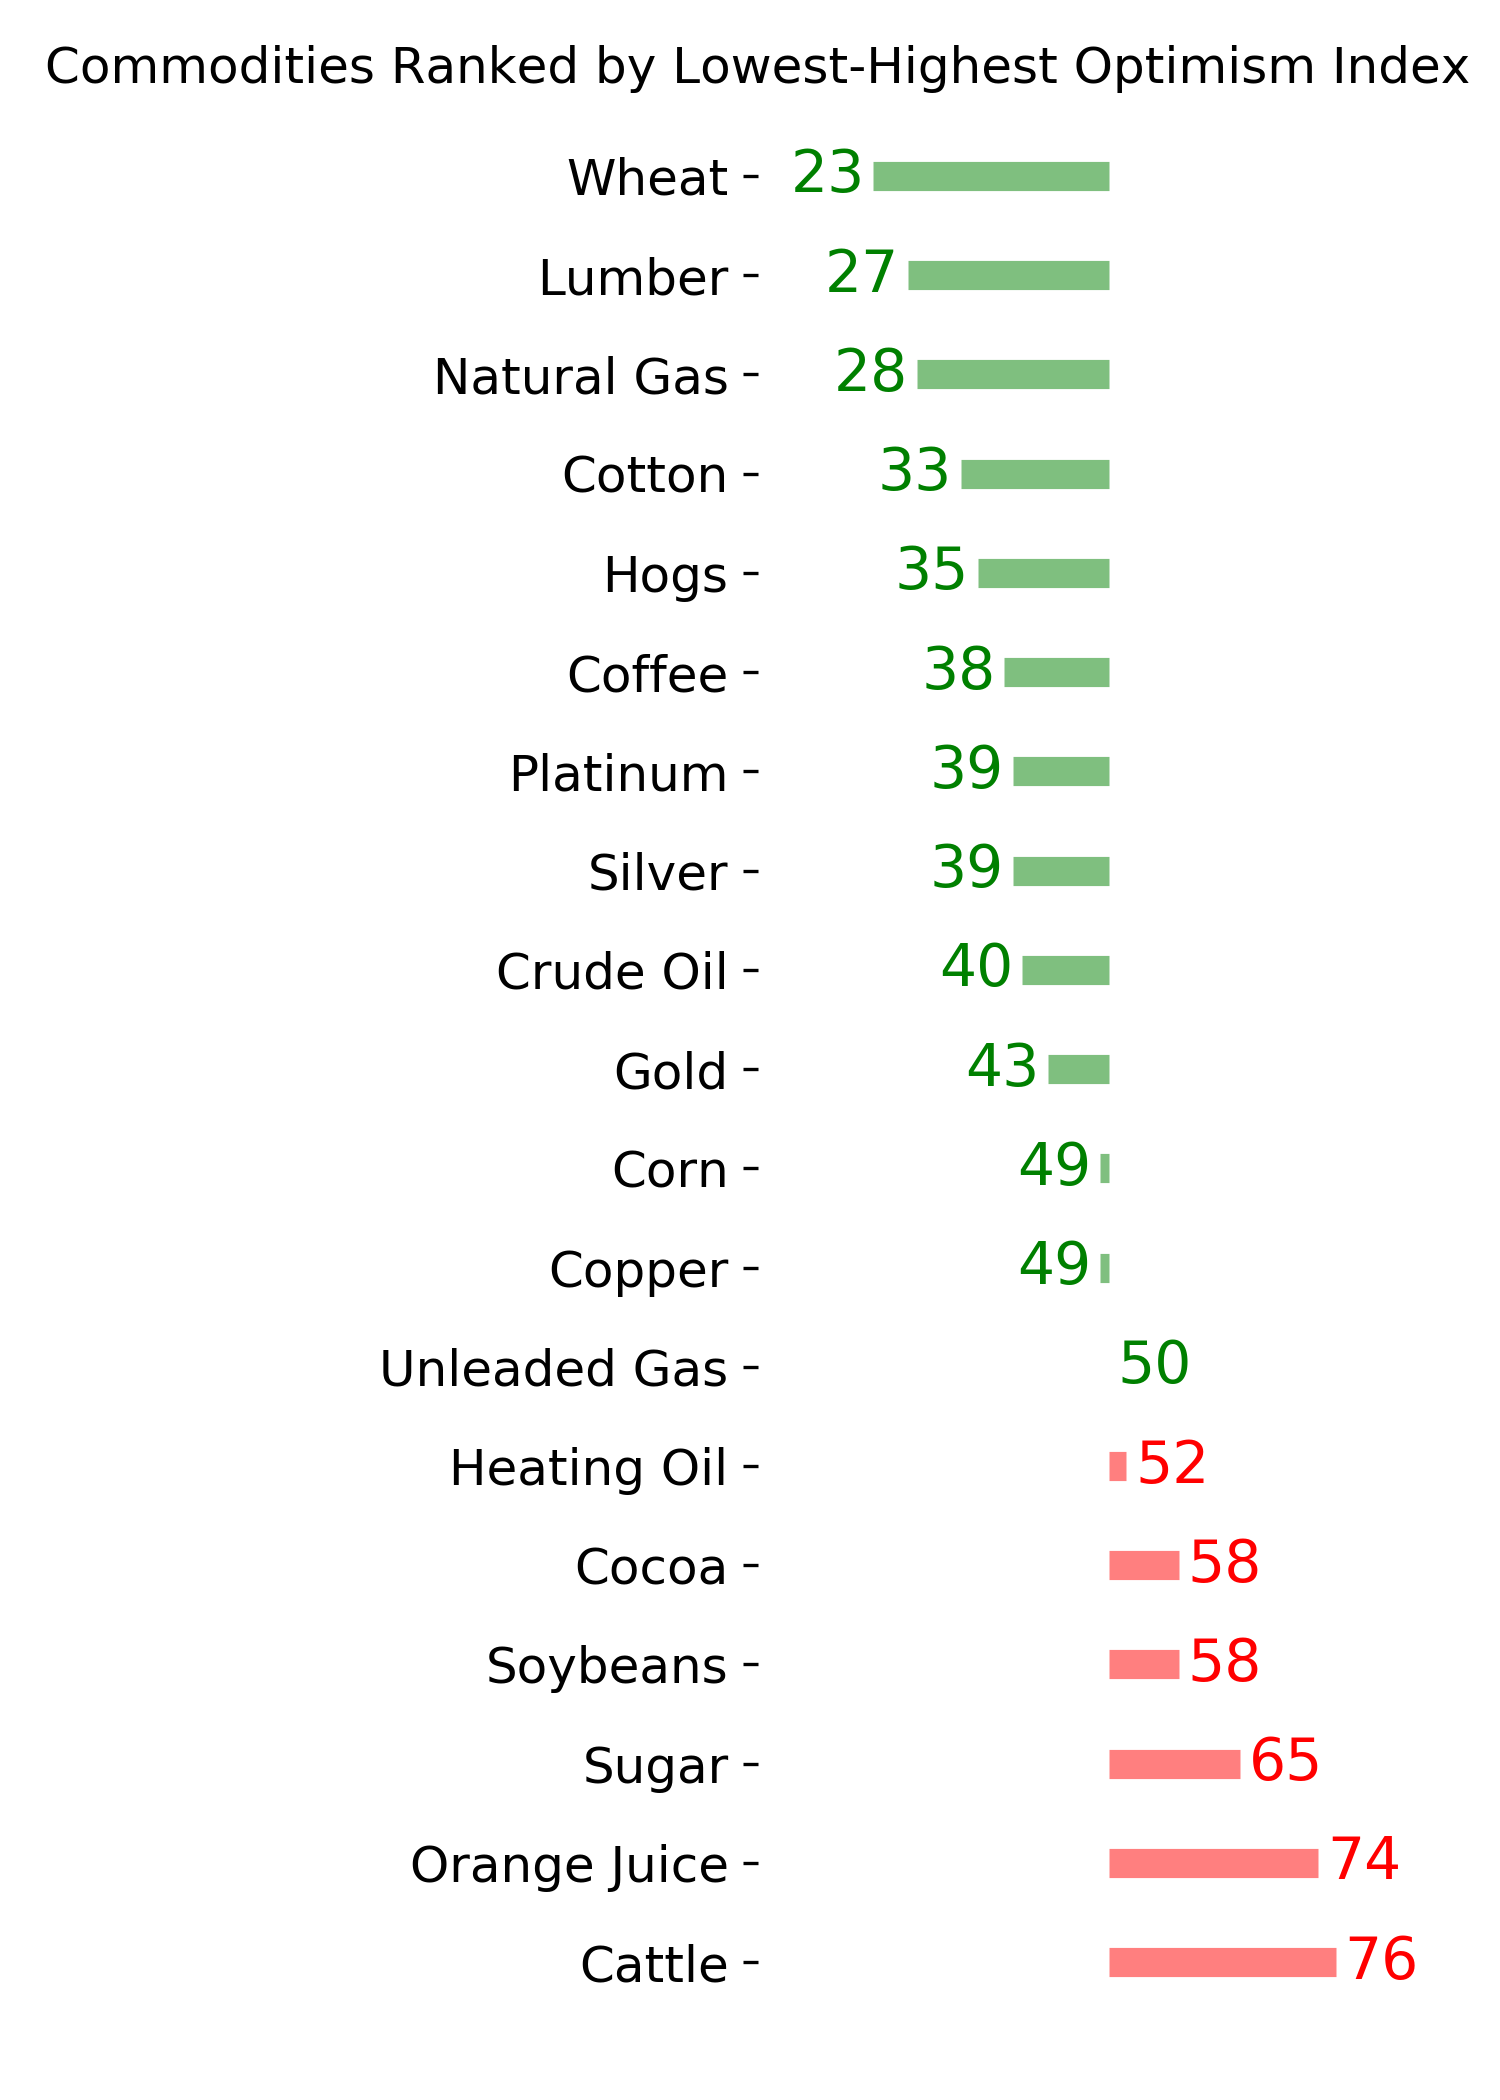
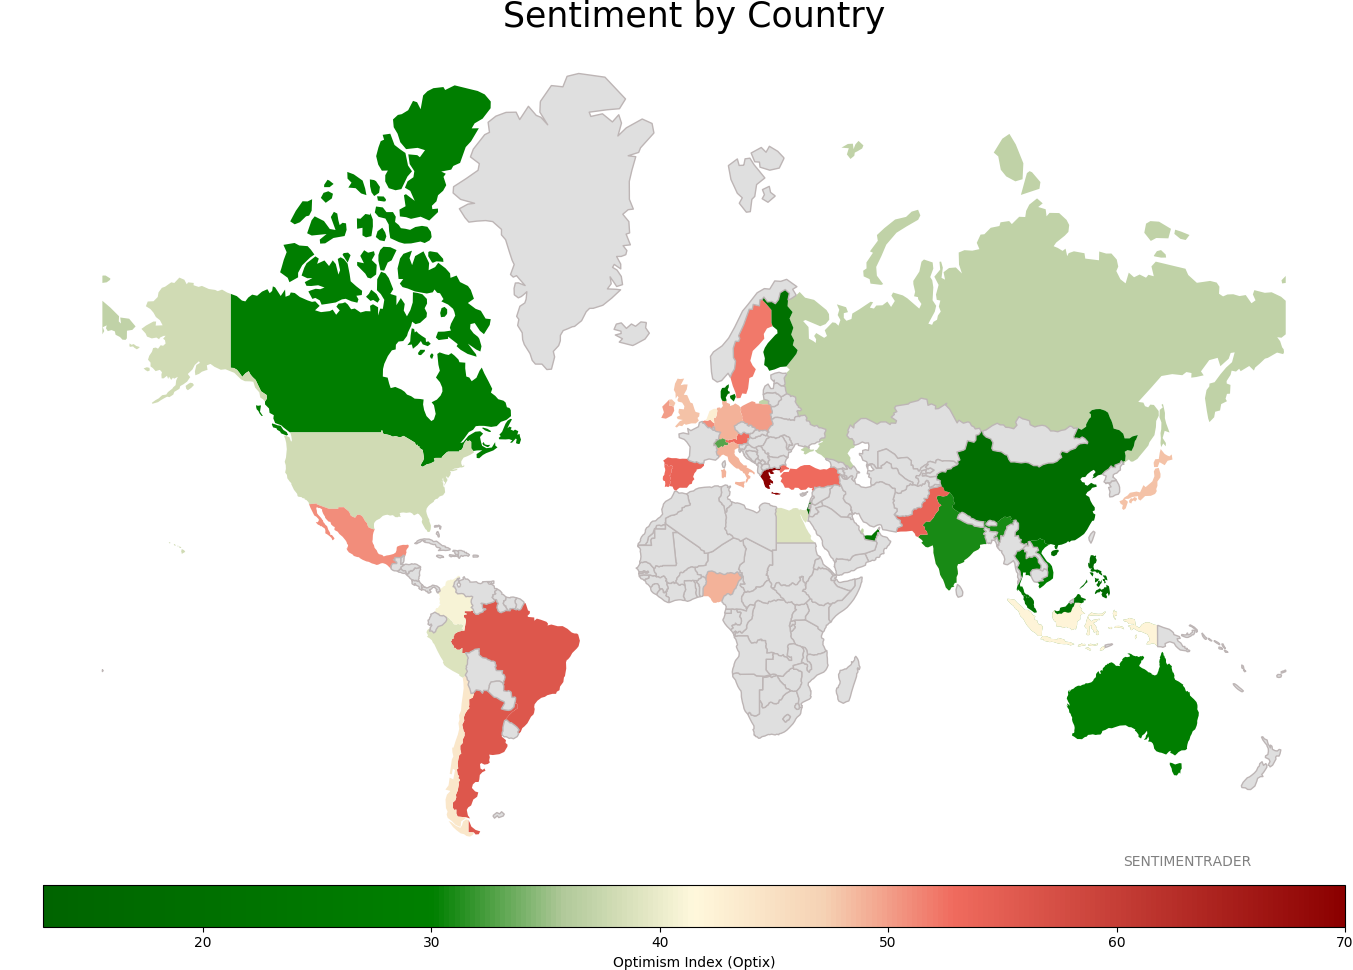
Sentiment Around The World
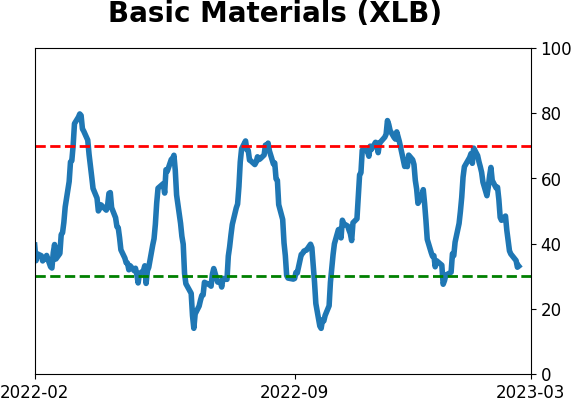
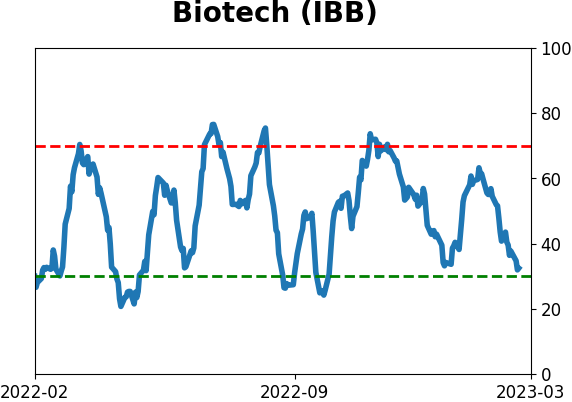
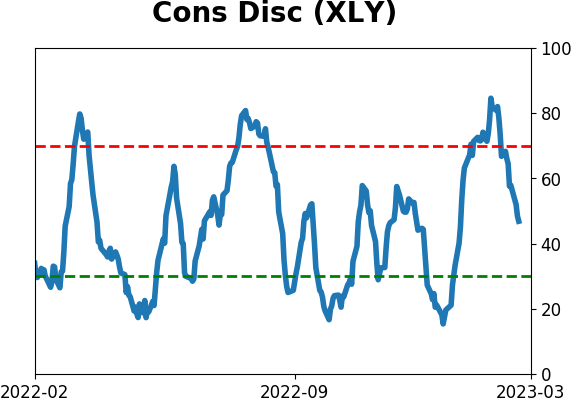
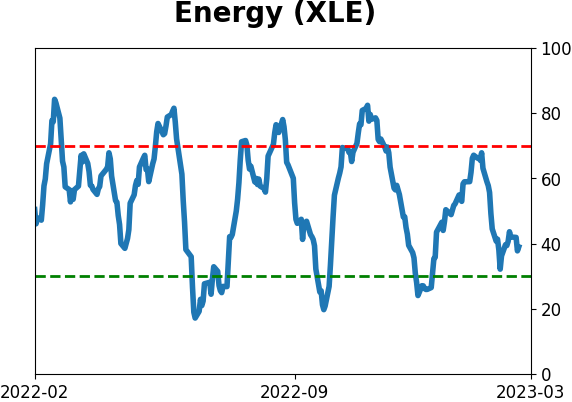
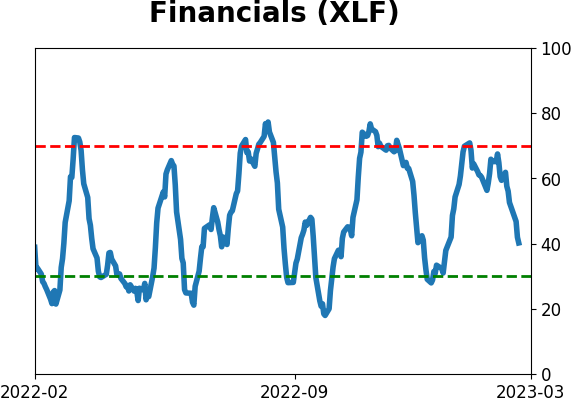
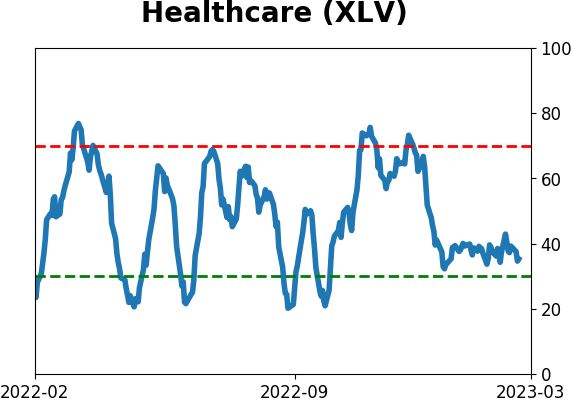
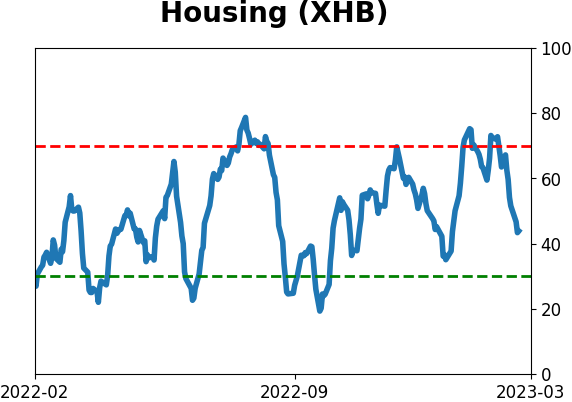
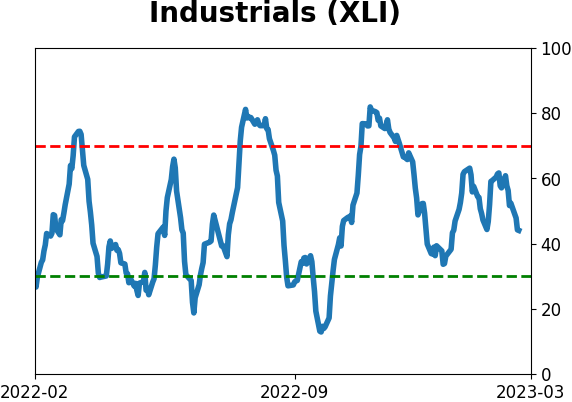
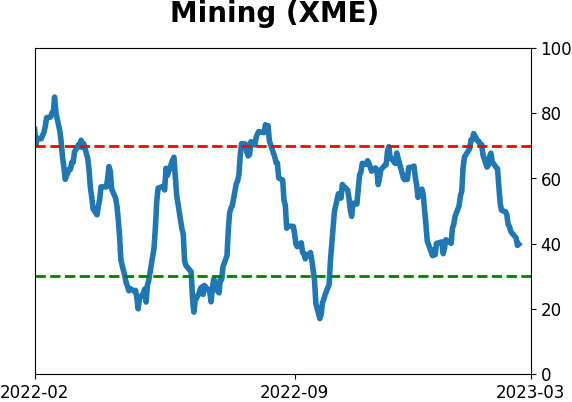
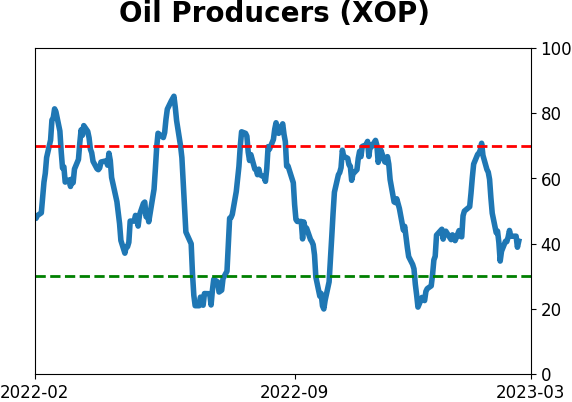
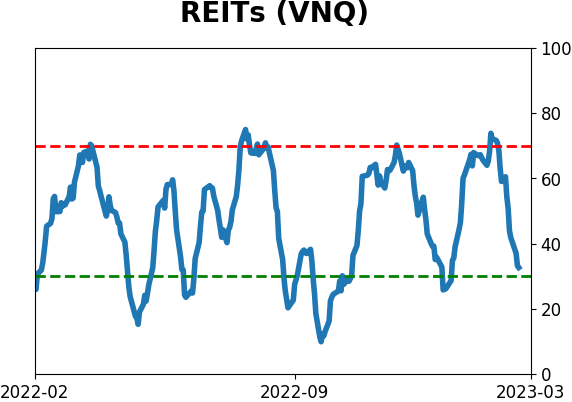
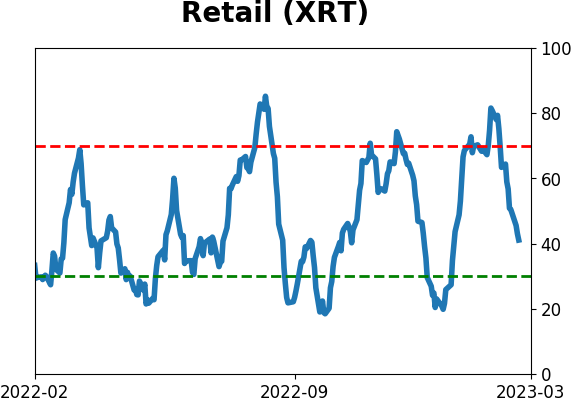
Optimism Index Thumbnails
|
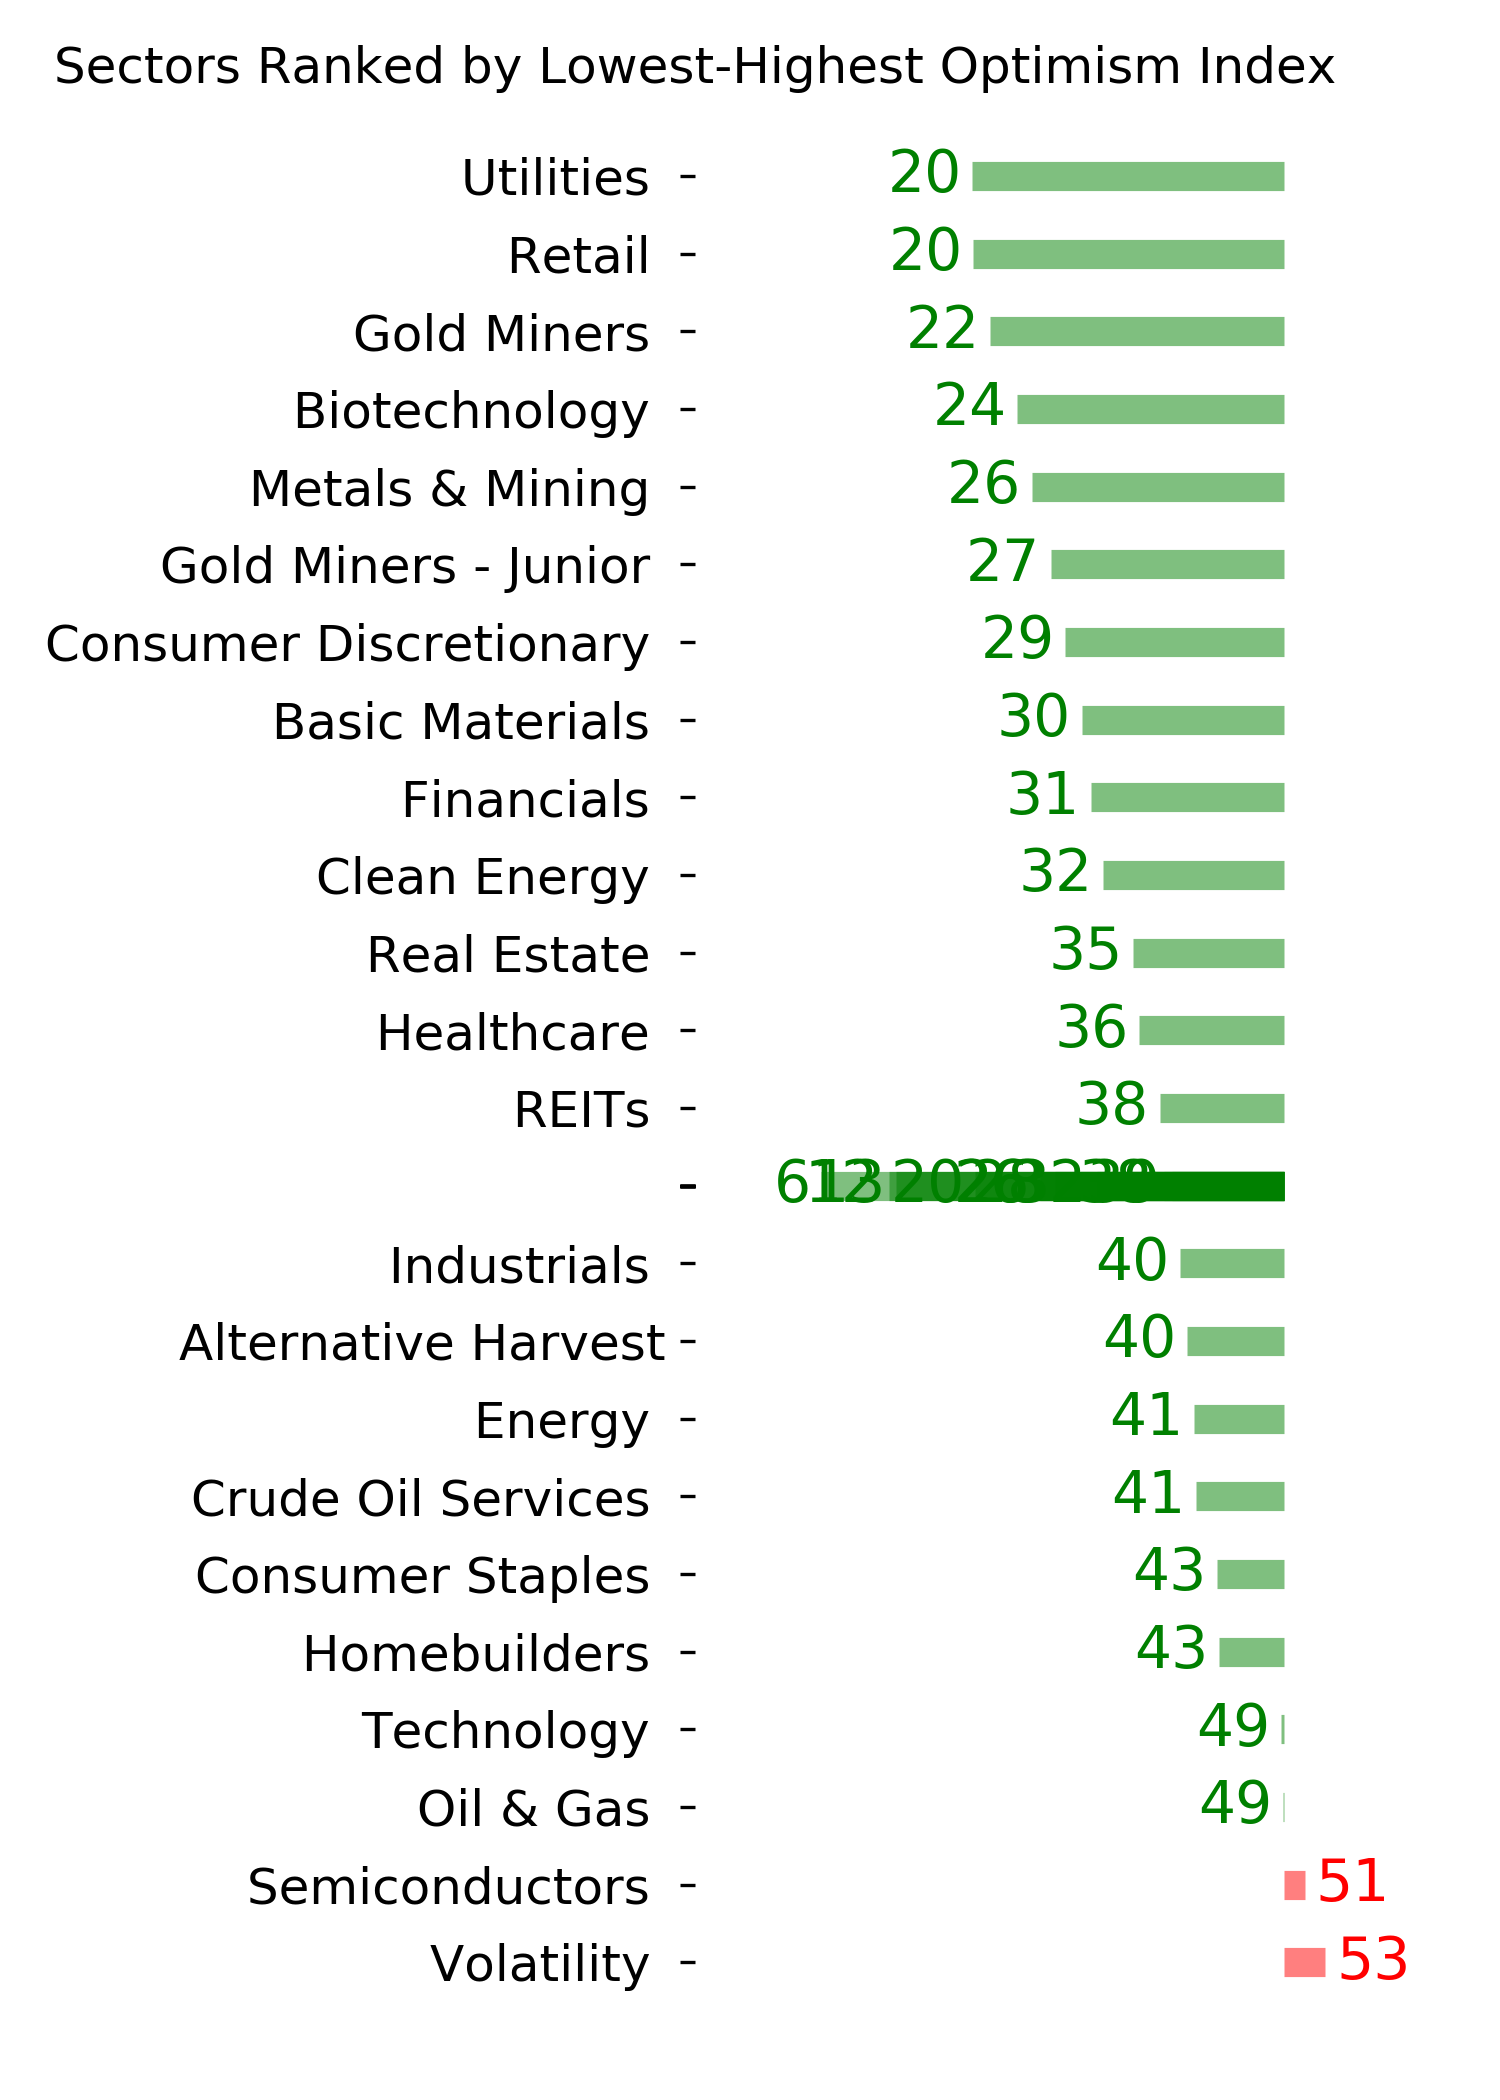
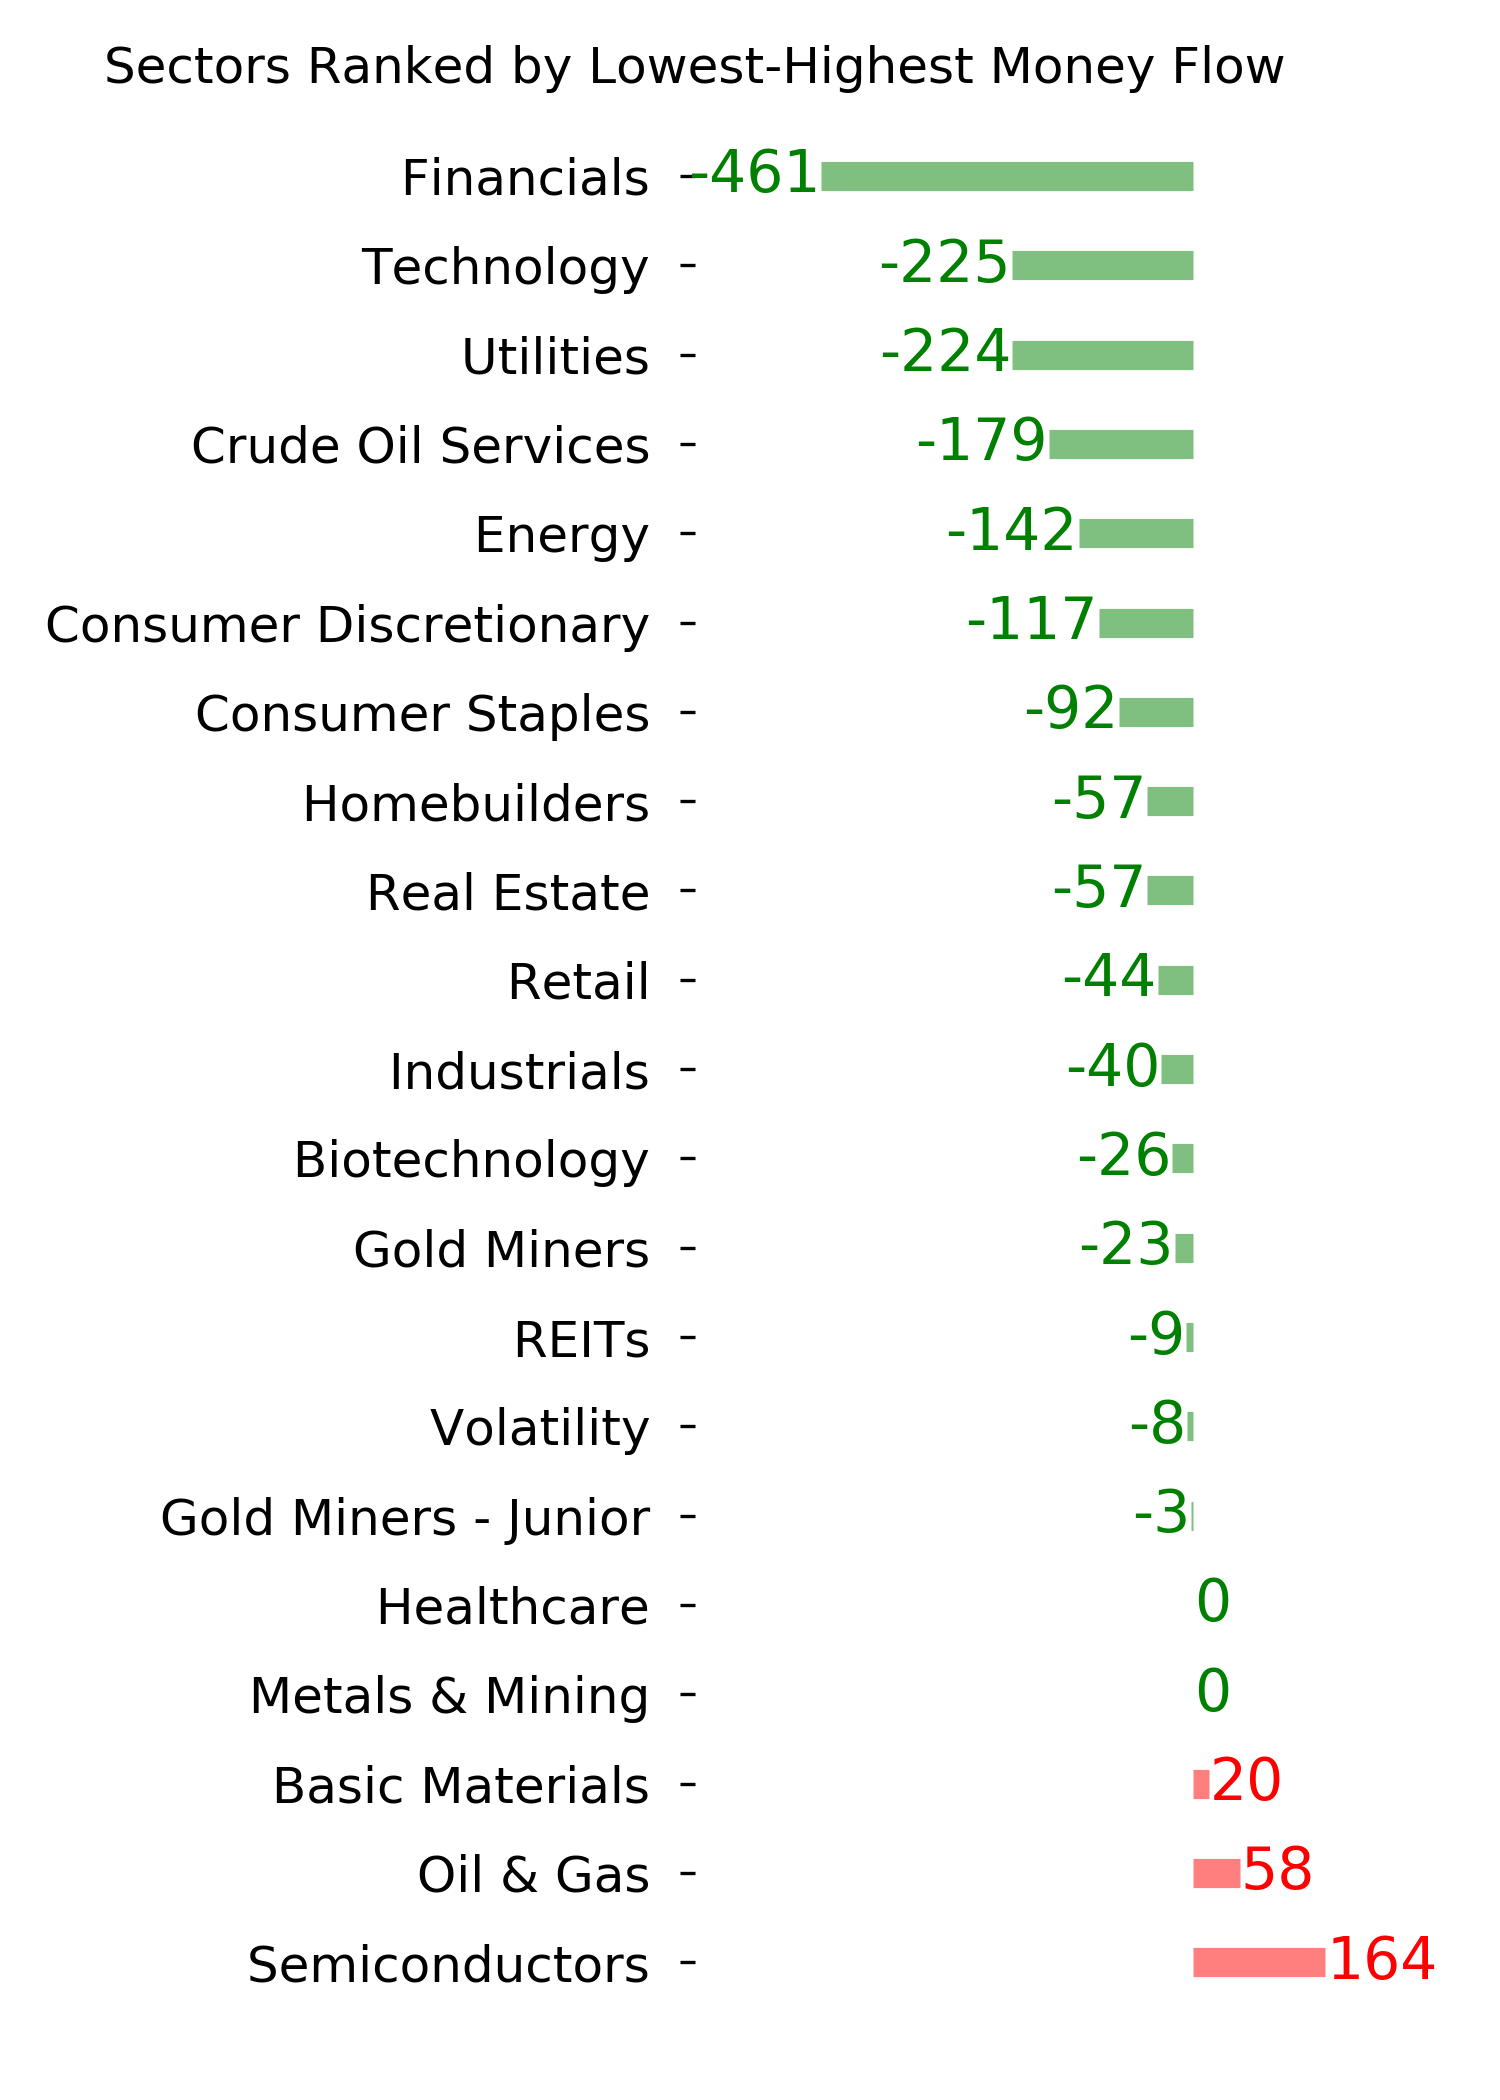
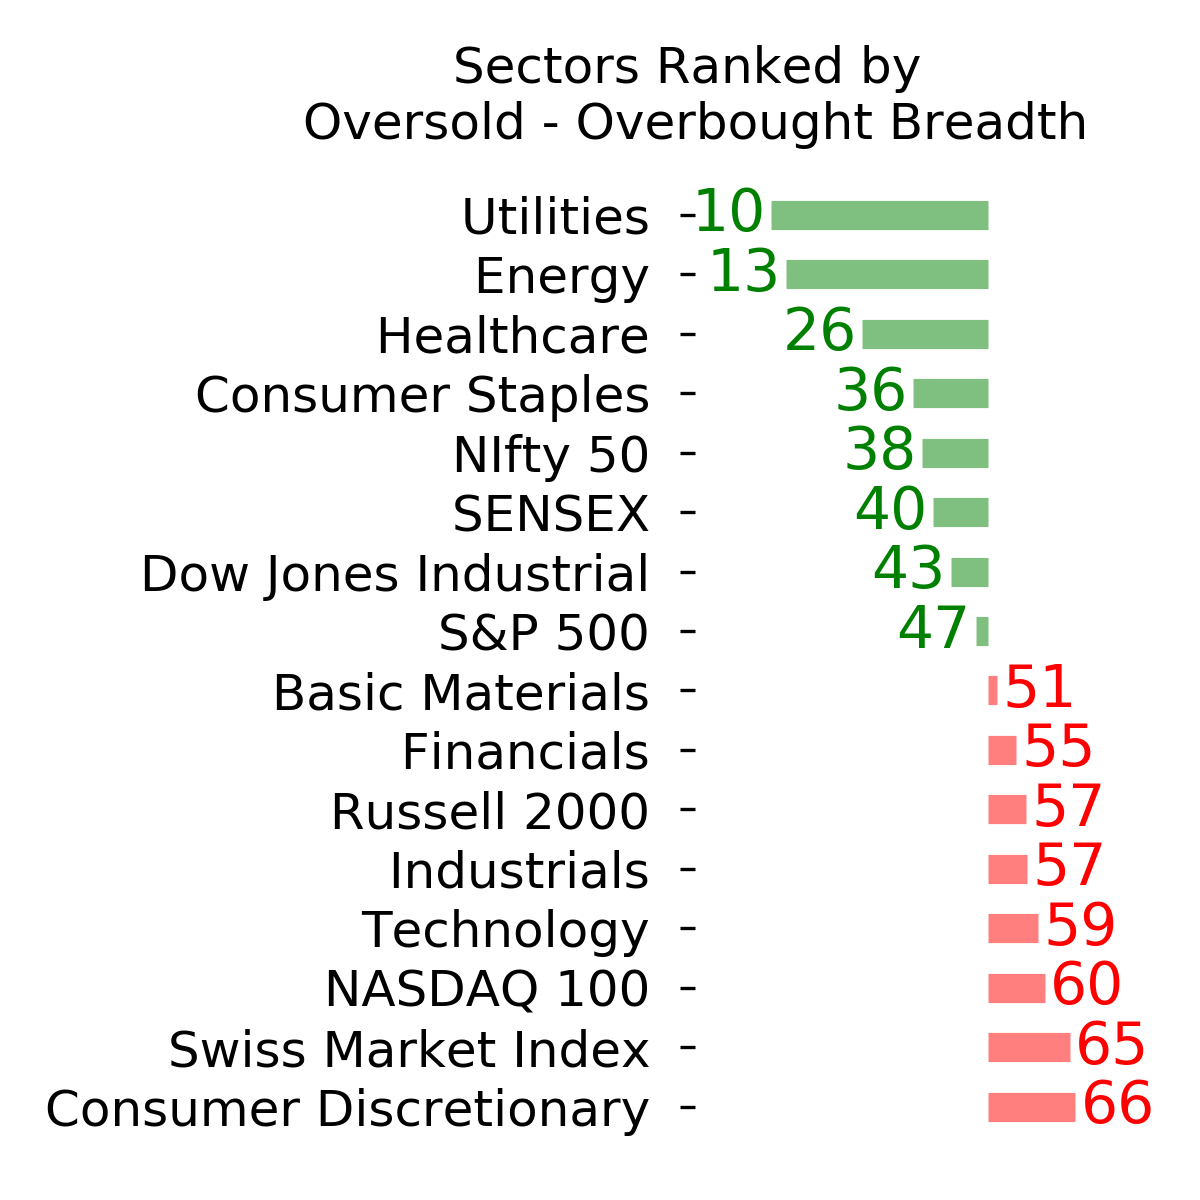
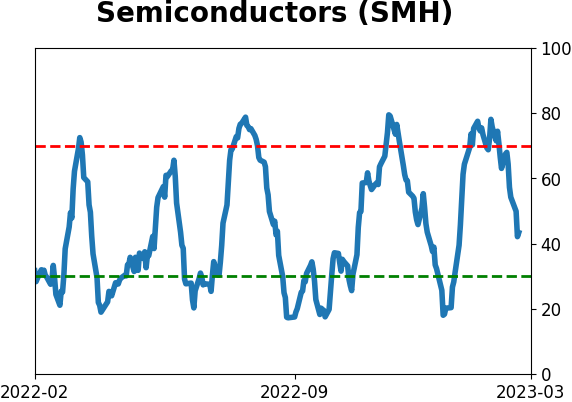
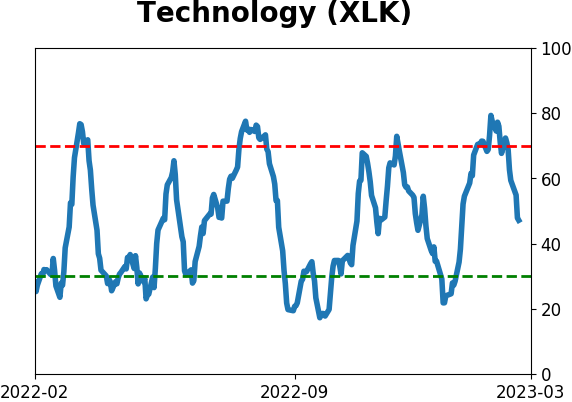
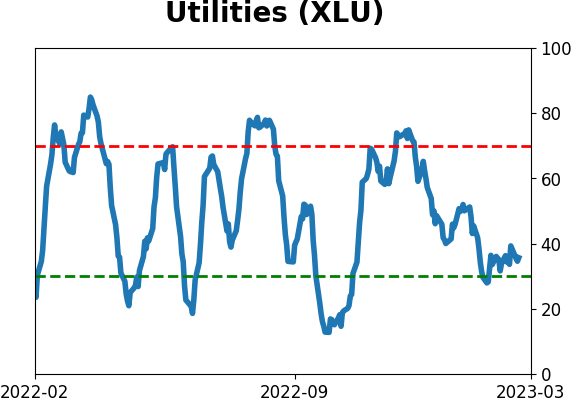
Sector ETF's - 10-Day Moving Average
|
|
|
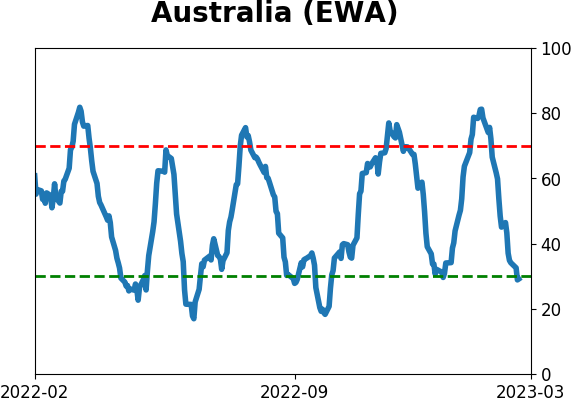
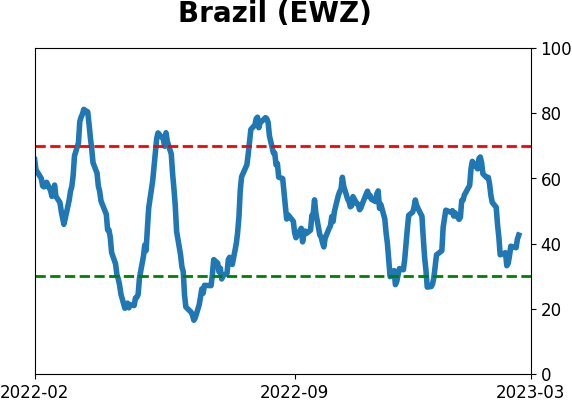
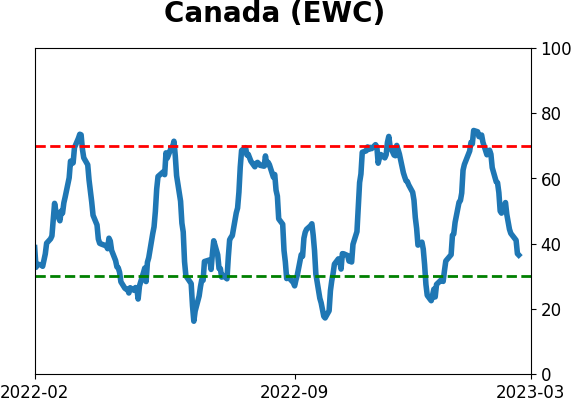
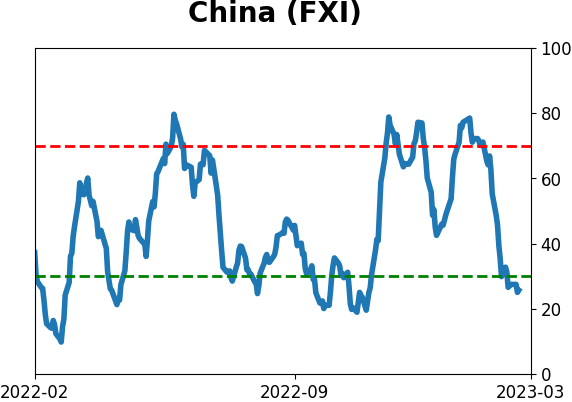
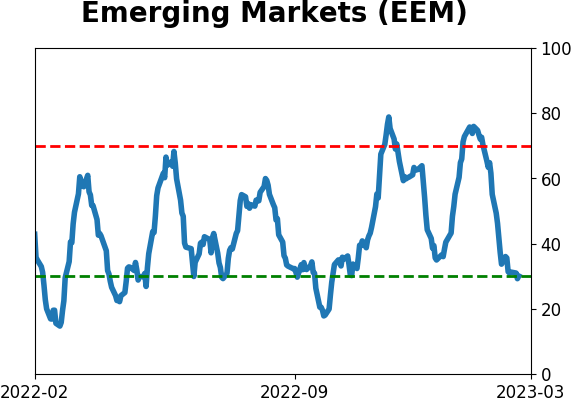
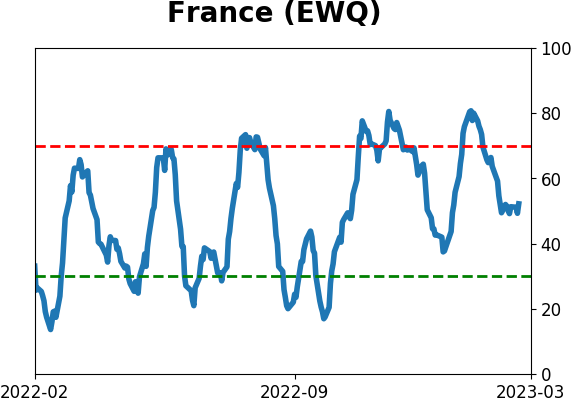
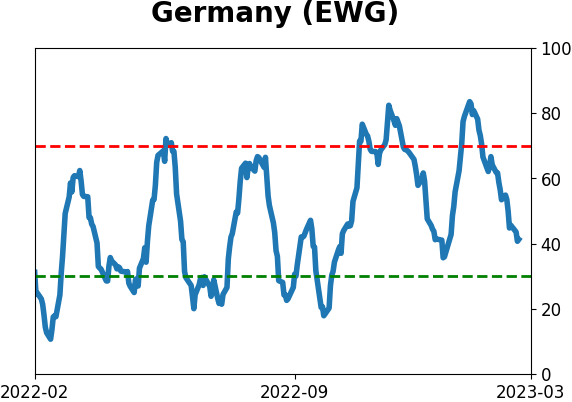
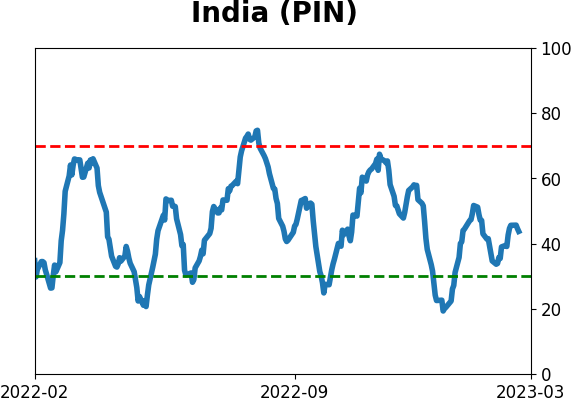
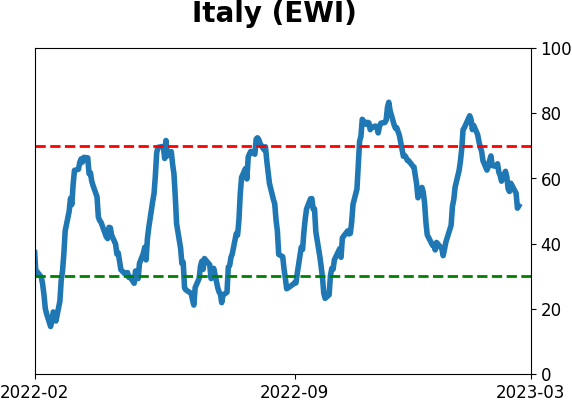
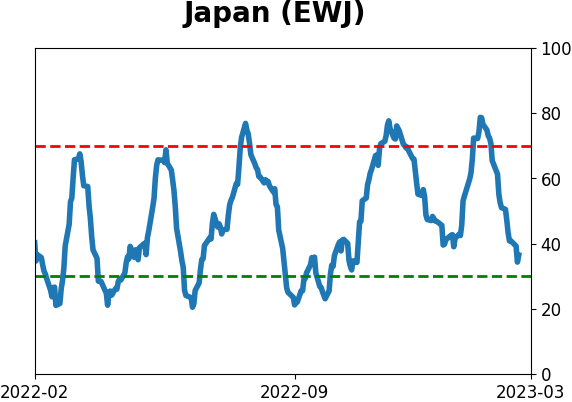
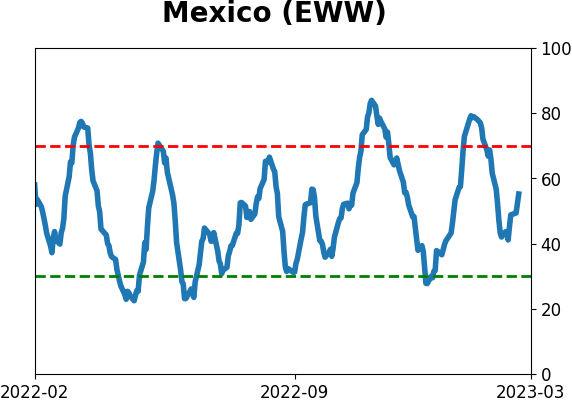
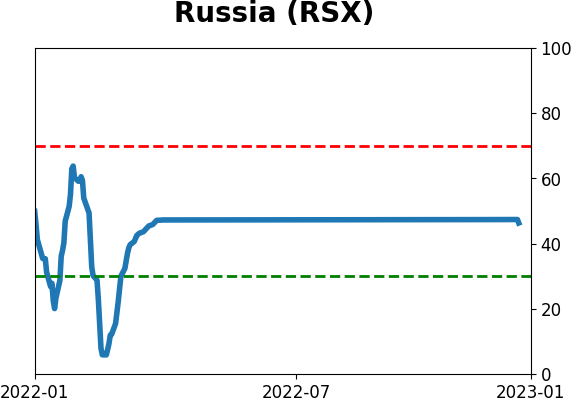
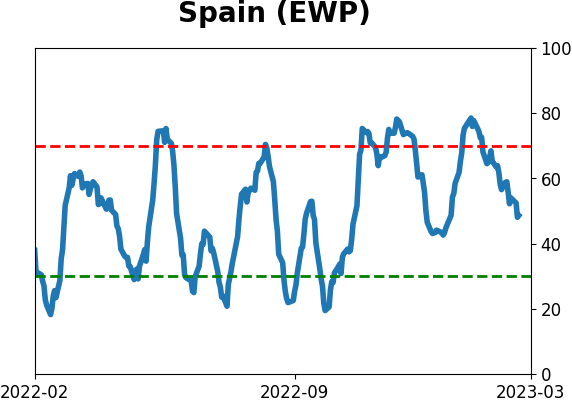
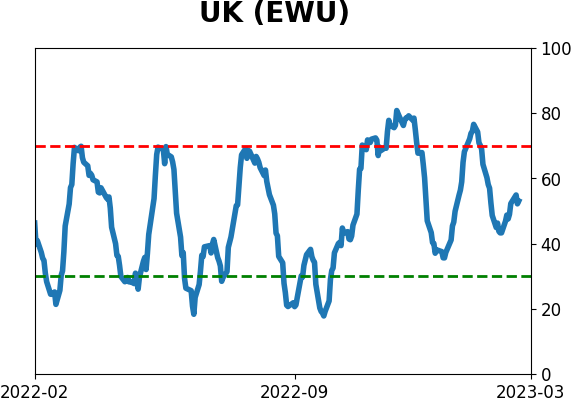
Country ETF's - 10-Day Moving Average
|
|
|
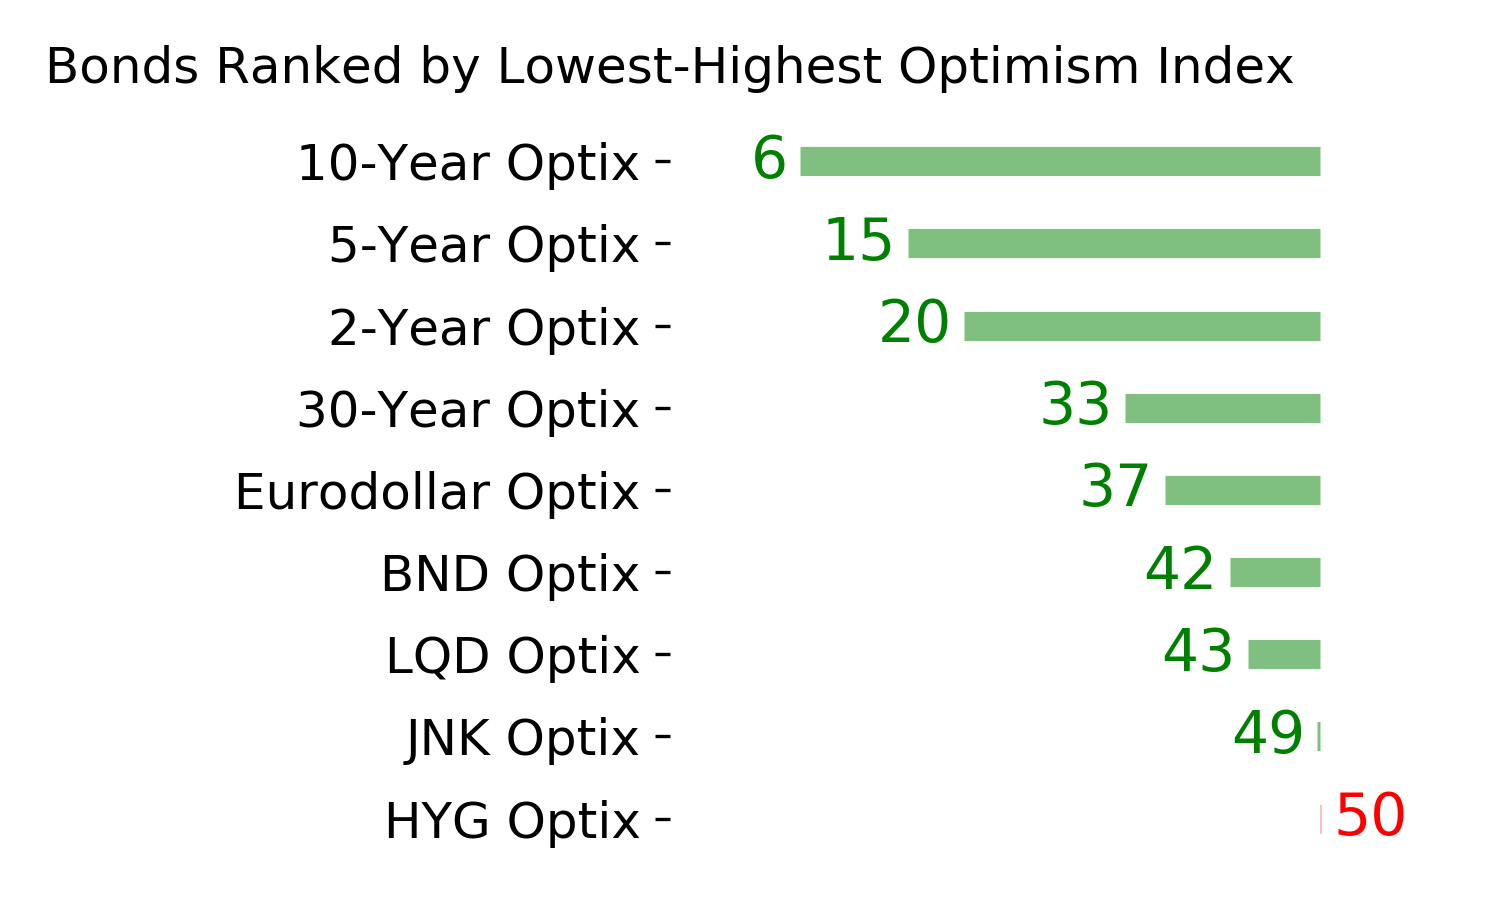
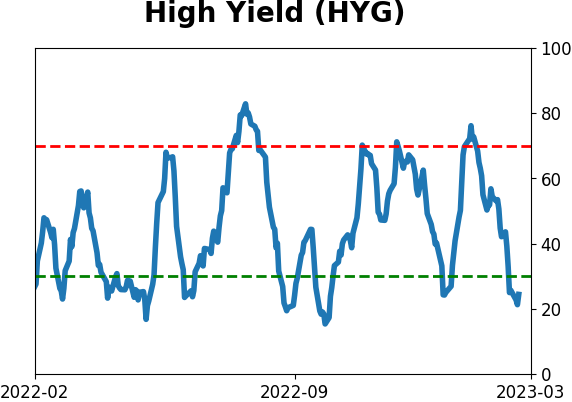
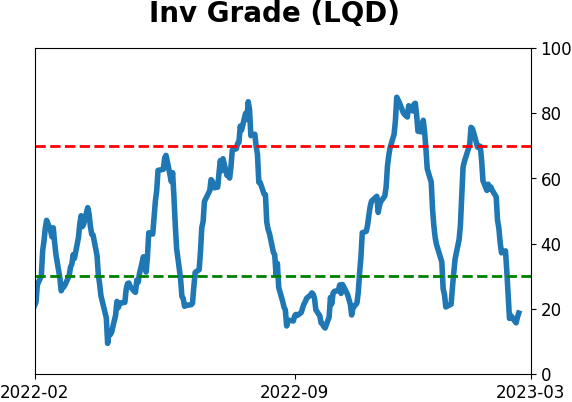
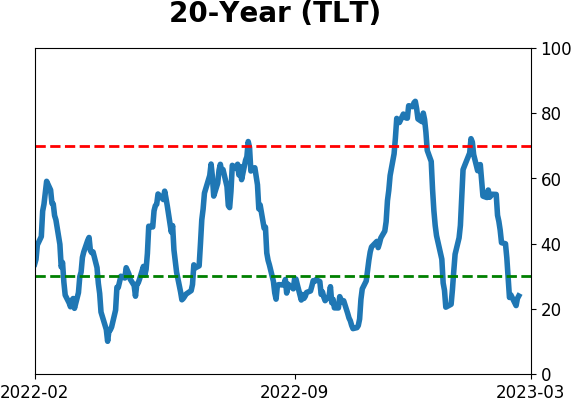
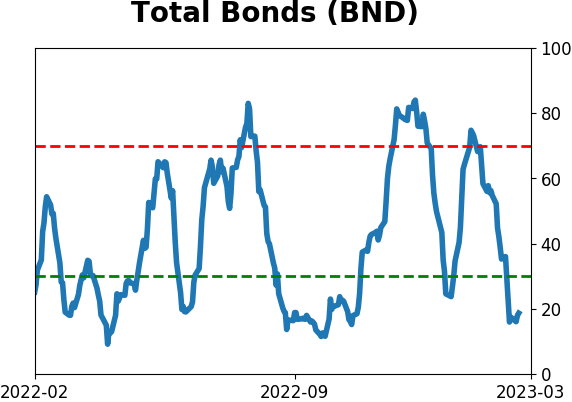
Bond ETF's - 10-Day Moving Average
|
|
|
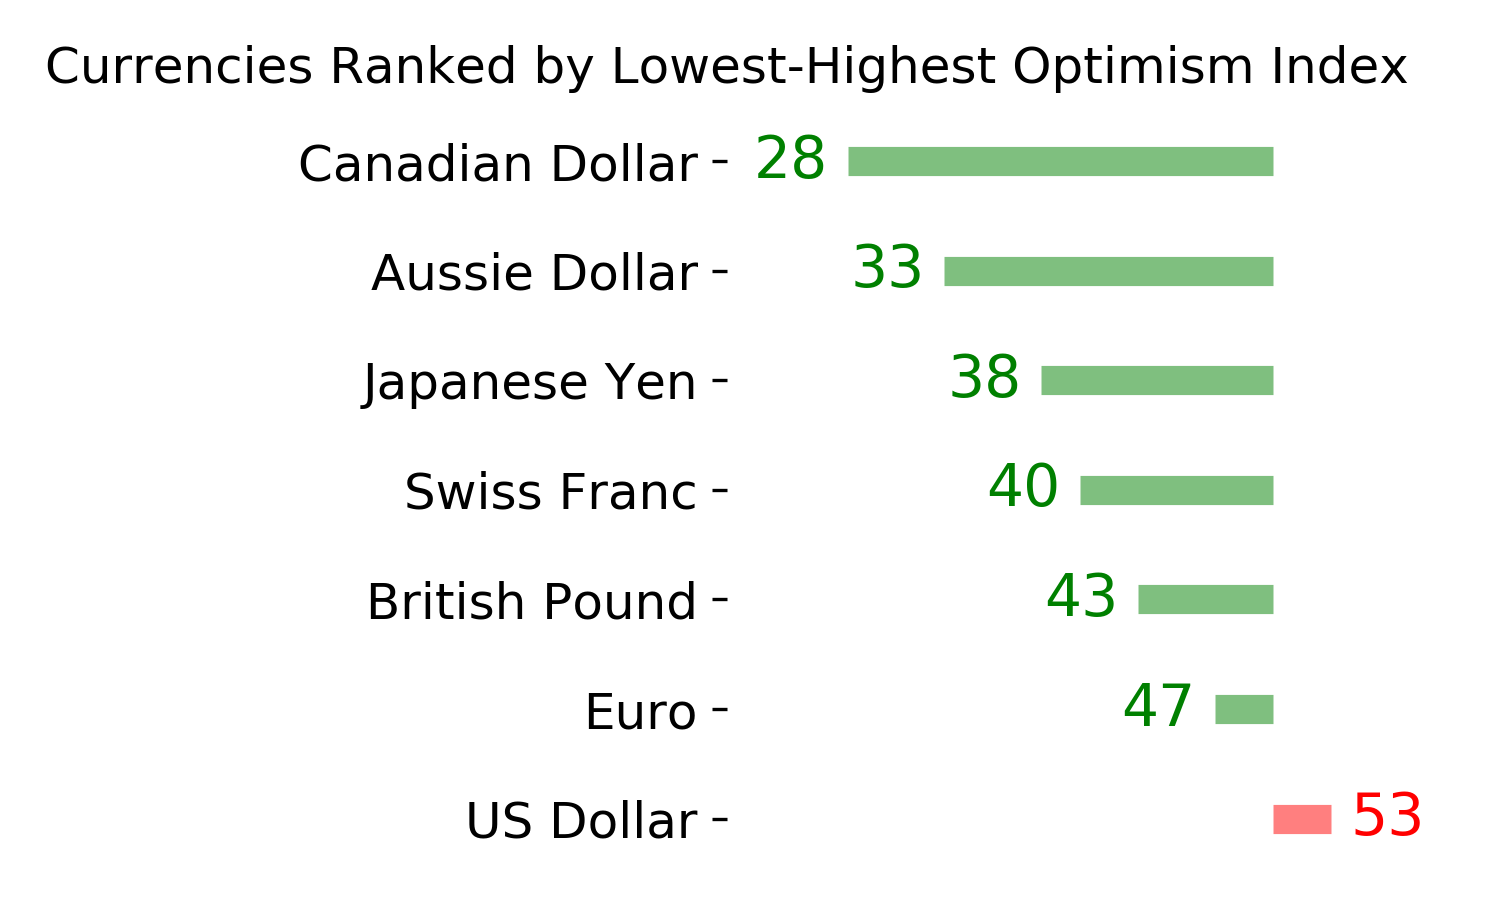
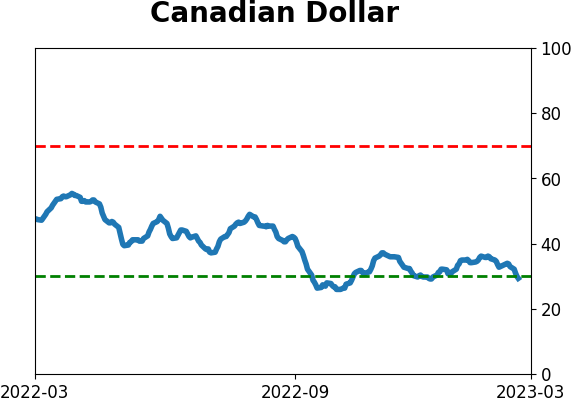
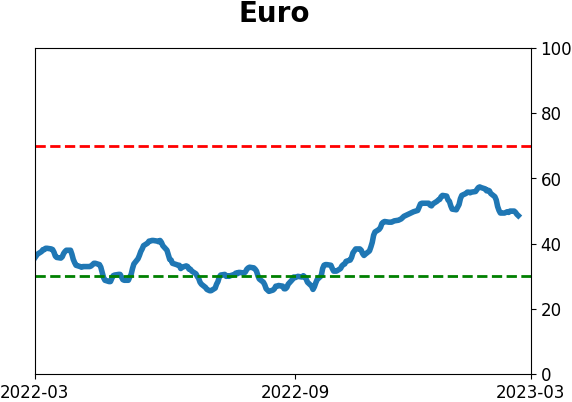
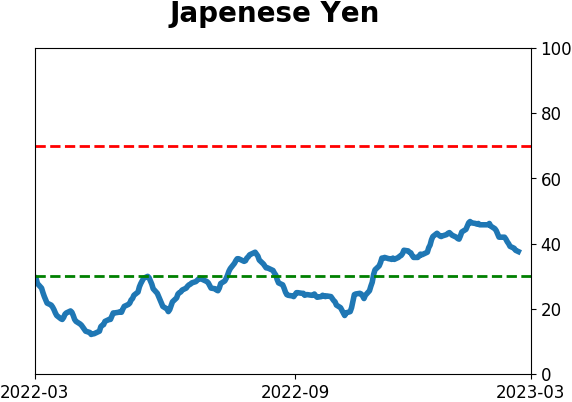
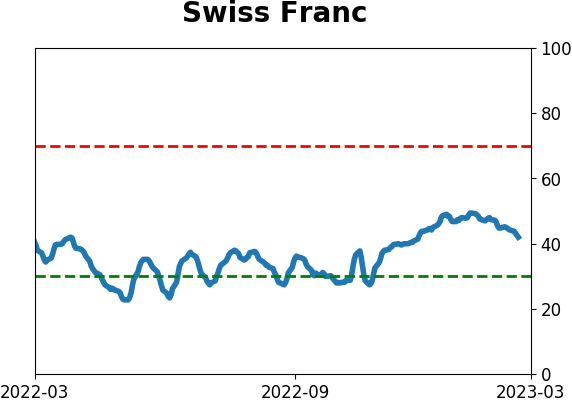
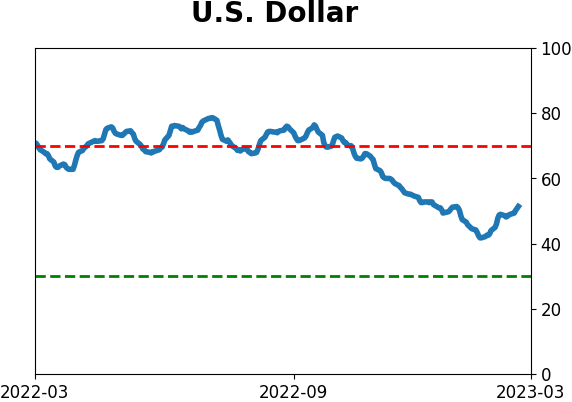
Currency ETF's - 5-Day Moving Average
|
|
|
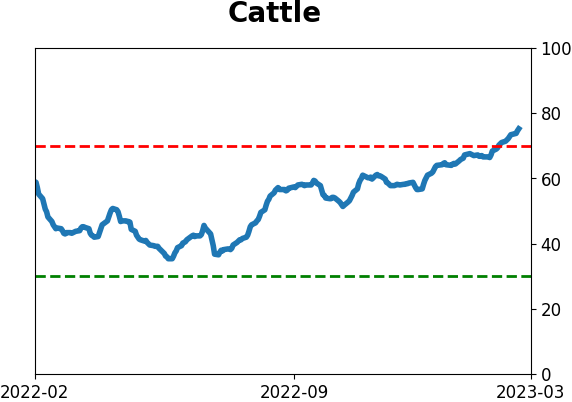
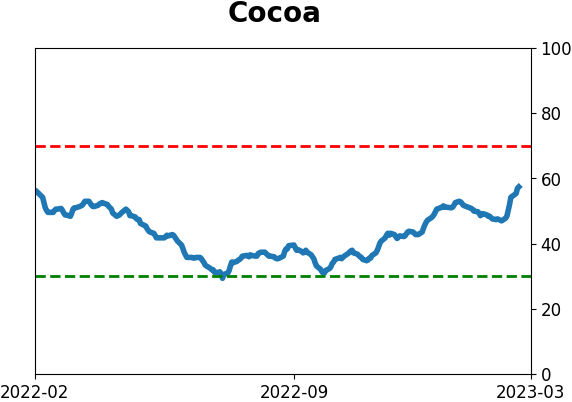
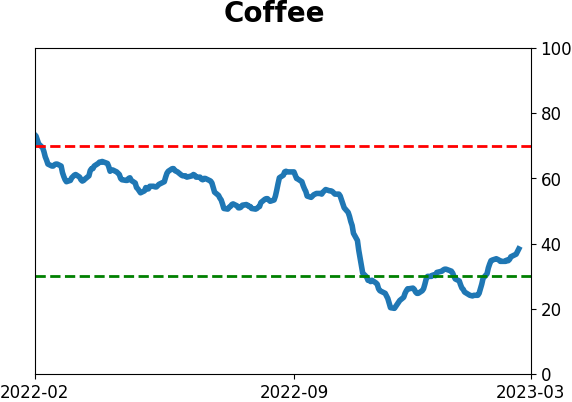
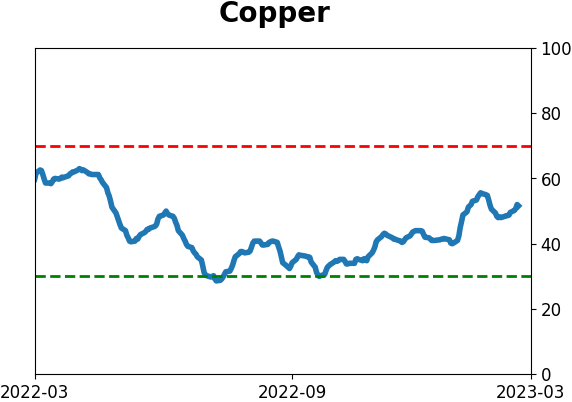
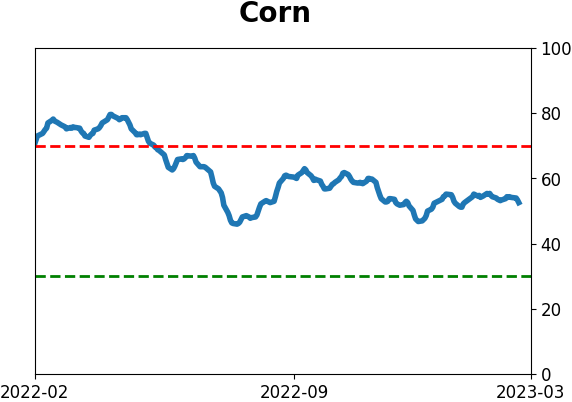
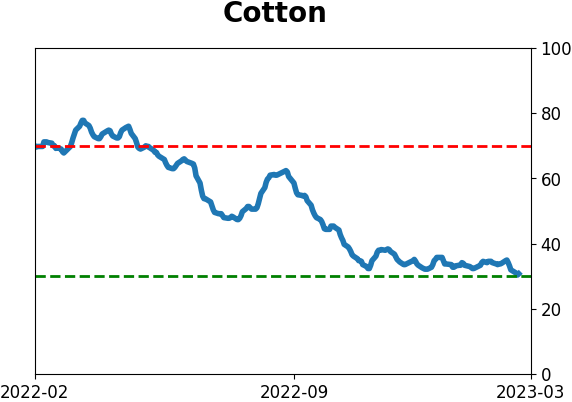
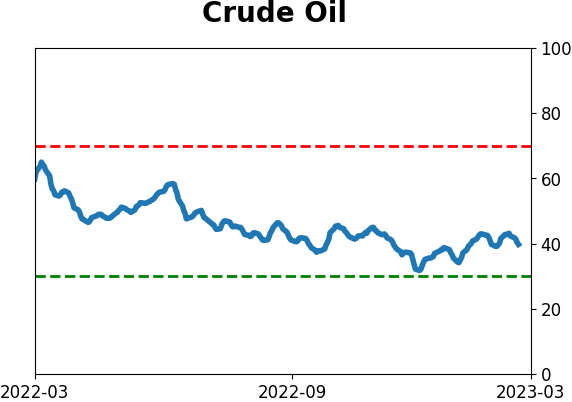
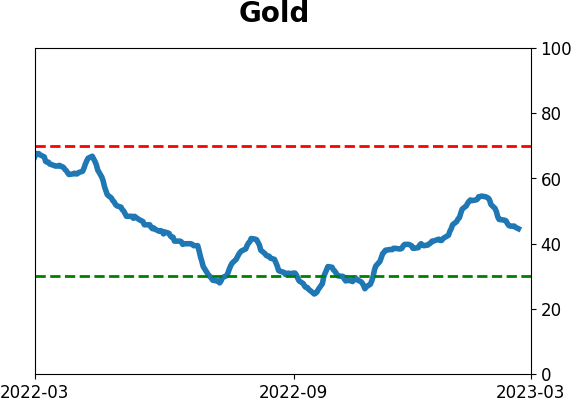
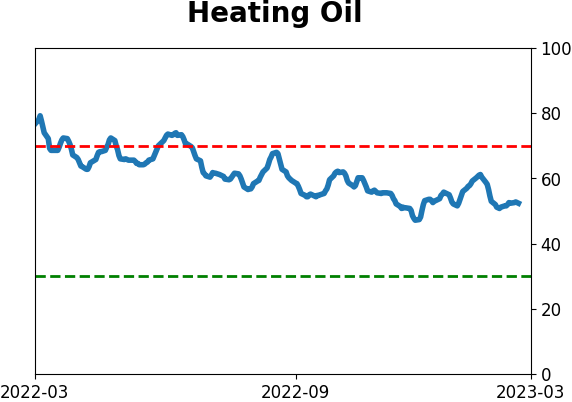
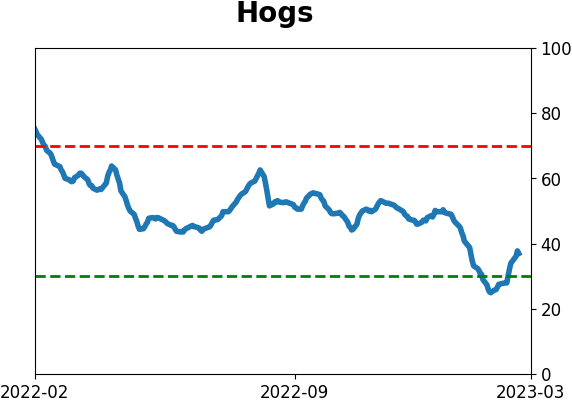
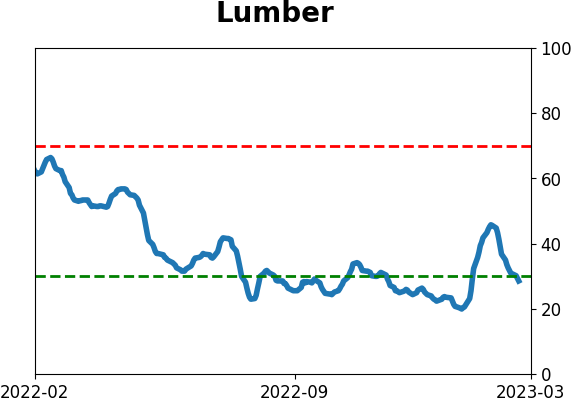
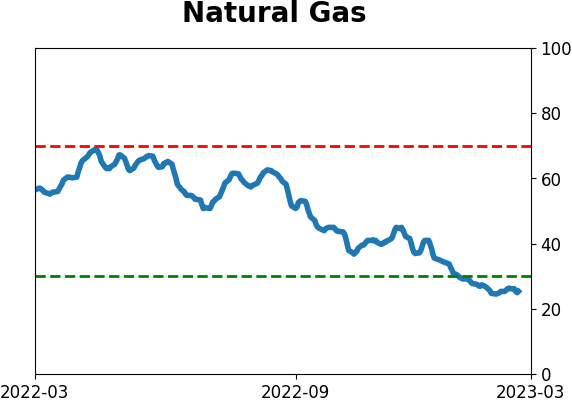
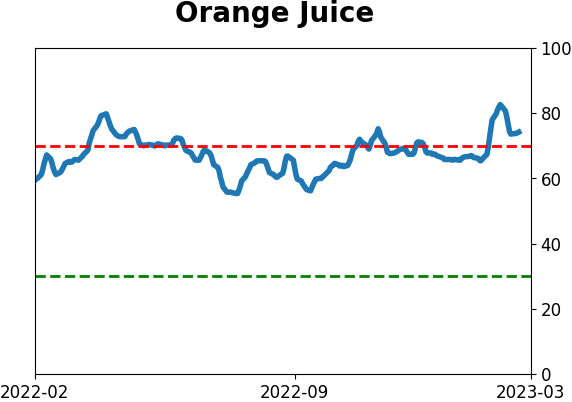
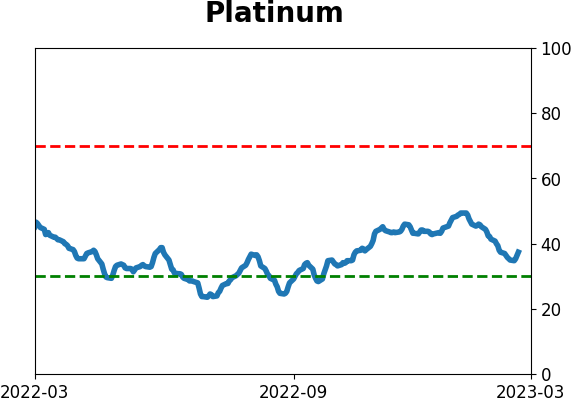
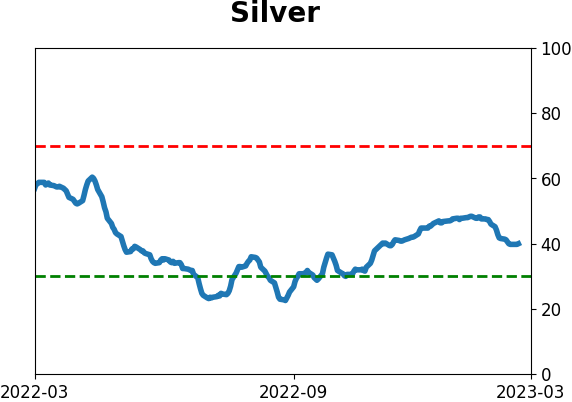
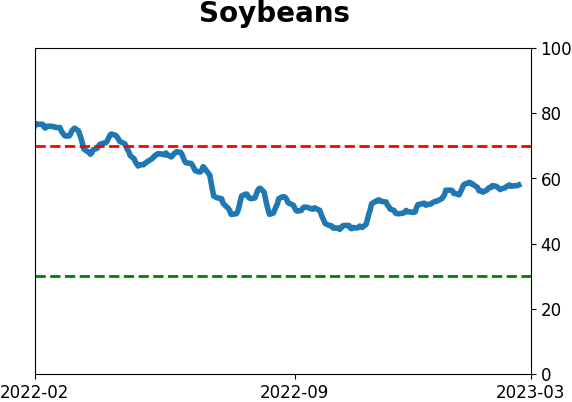
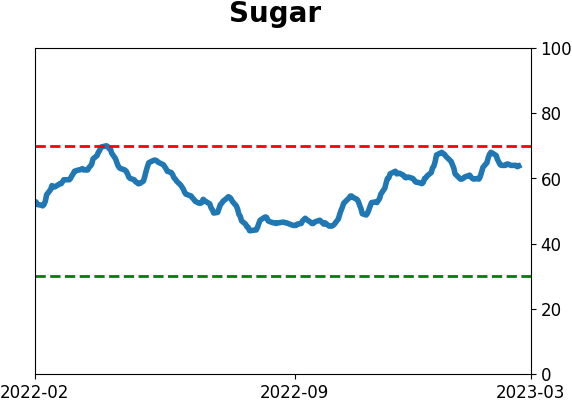
Commodity ETF's - 5-Day Moving Average
|
|