Headlines
|
|
Assessing the risk of a correction turning into a bear market:
The S&P 500 is on the cusp of its first correction in over a year and a half. It's also one of its quickest corrections. Both tend to see the S&P snap back in the months ahead, but we look at bear market and non-bear-market analogs as guides for the index's future price path.
|
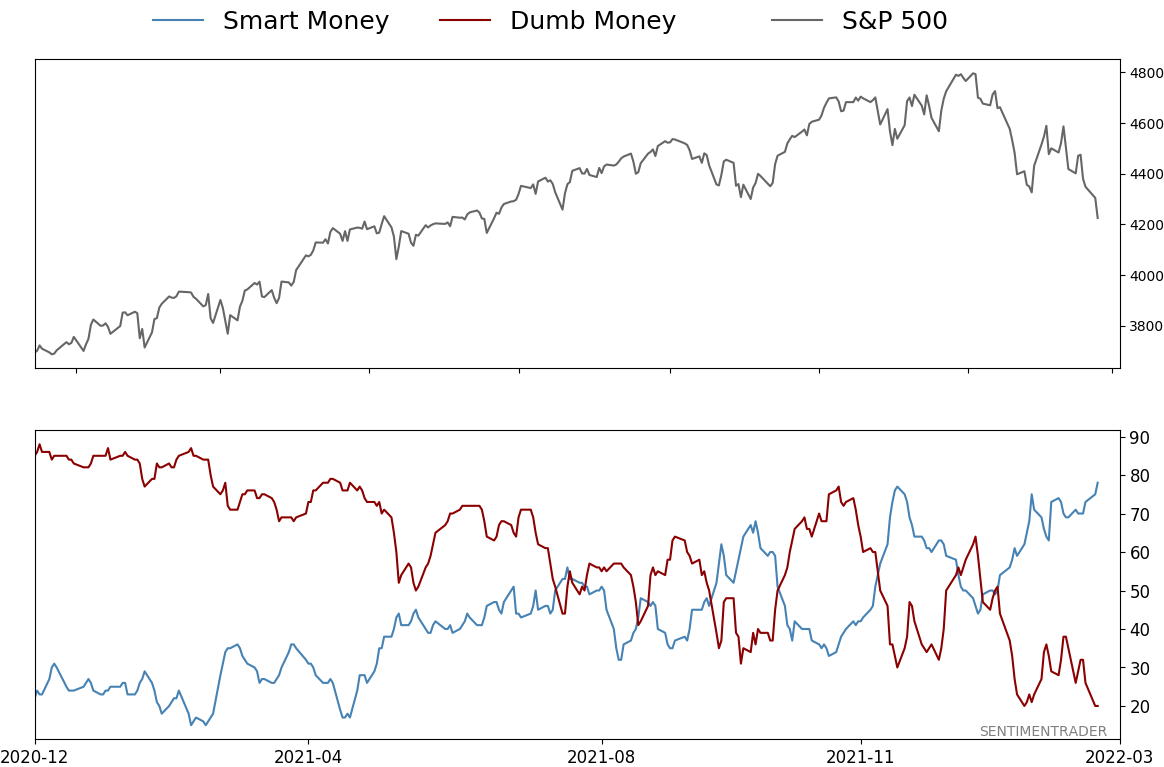
Smart / Dumb Money Confidence
|
Smart Money Confidence: 78%
Dumb Money Confidence: 20%
|
|
Risk Levels
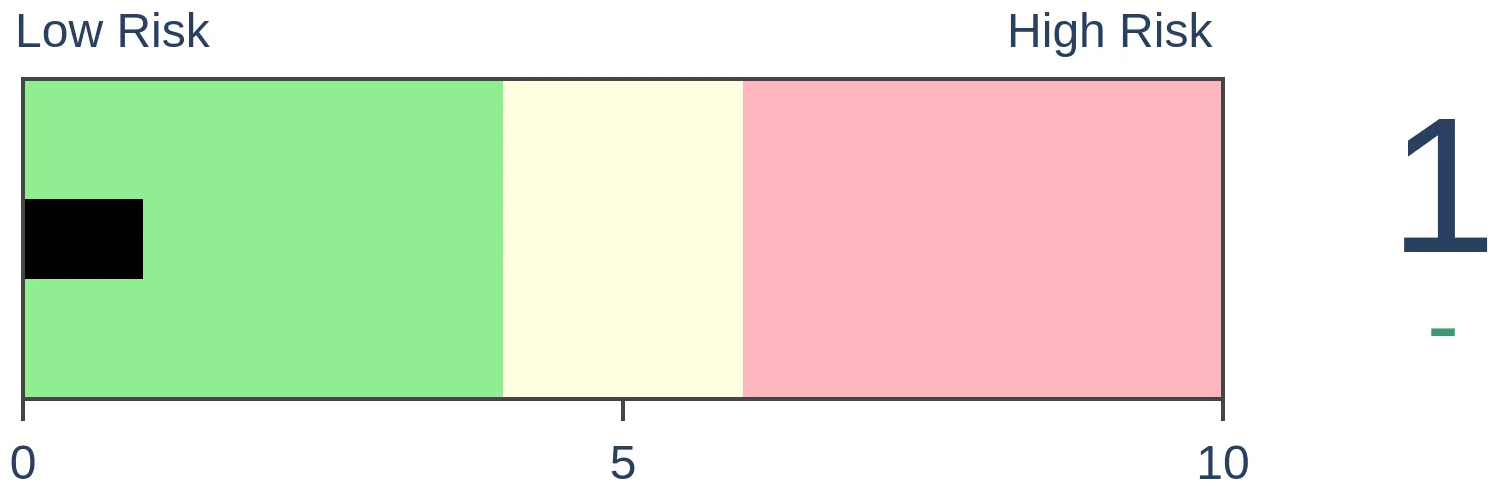
Stocks Short-Term
|
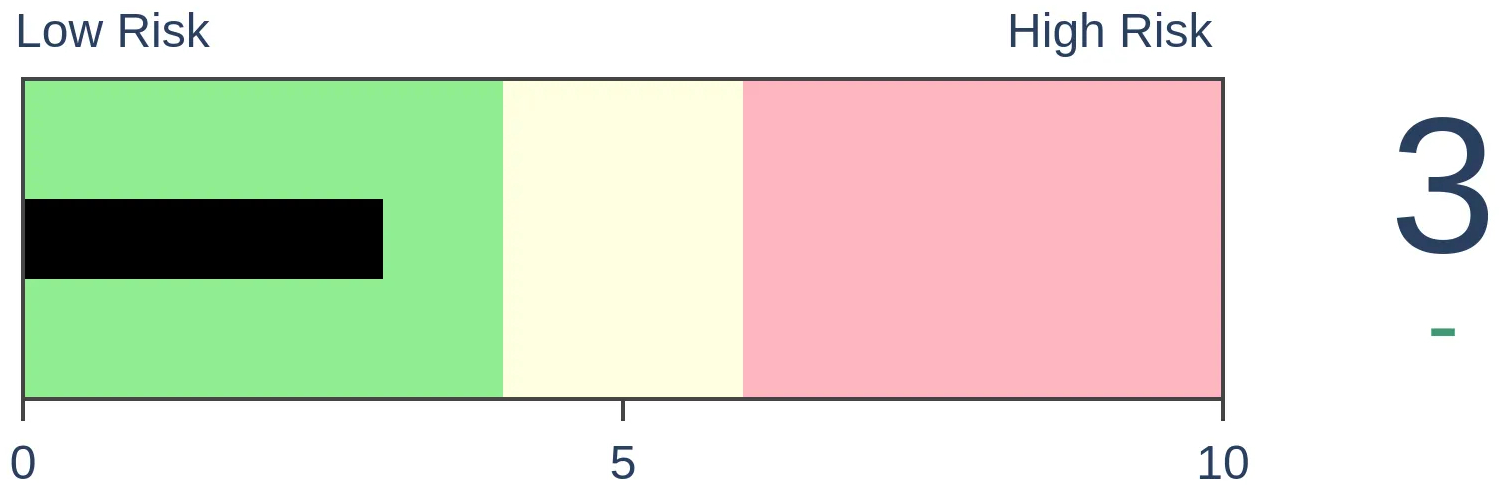
Stocks Medium-Term
|
|
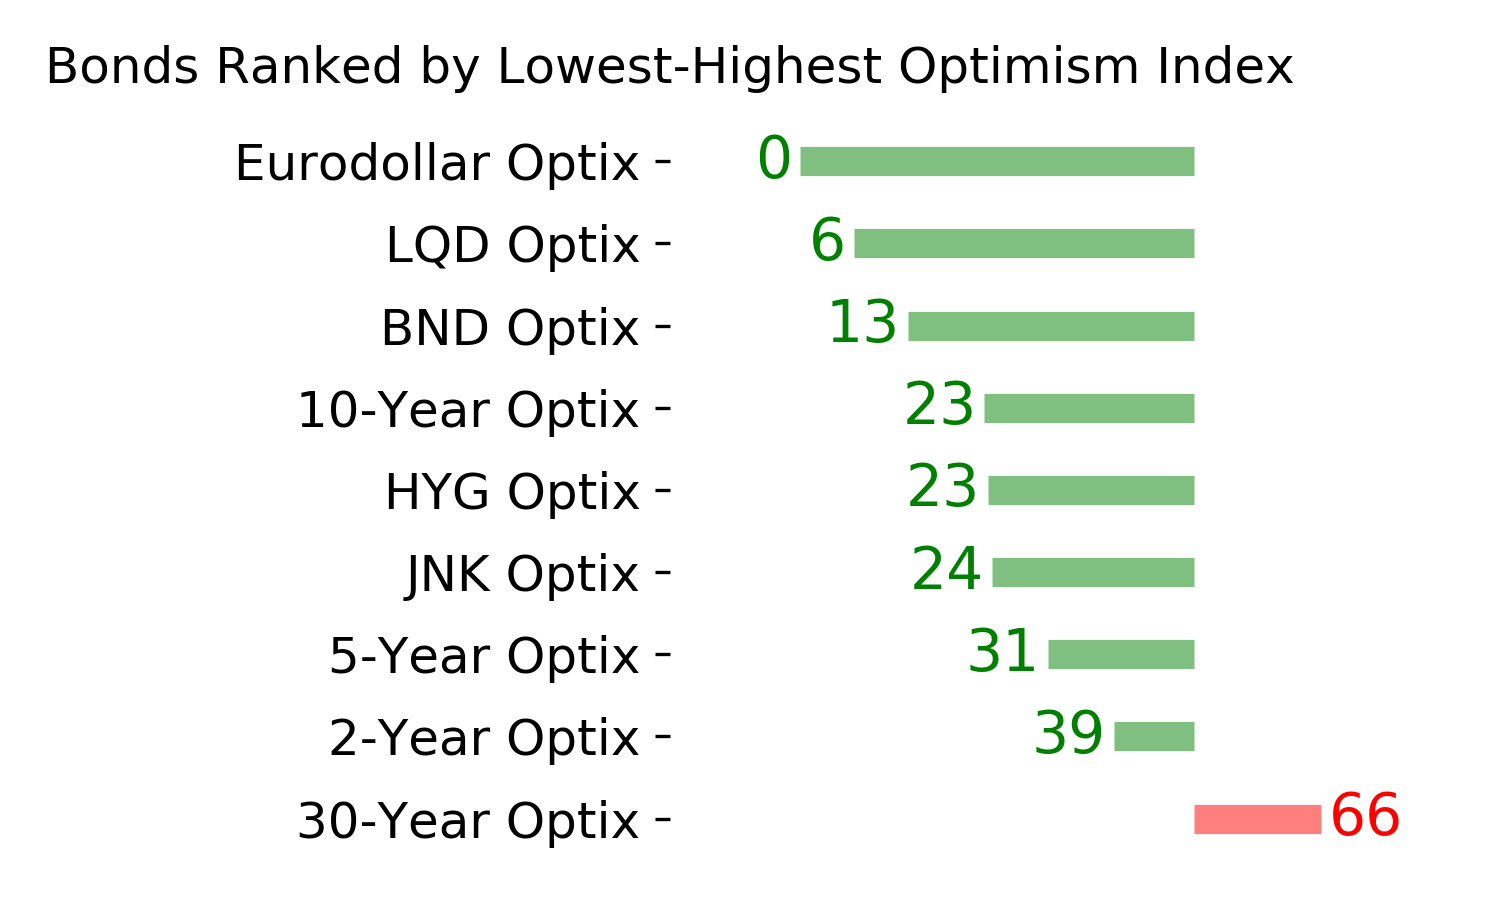
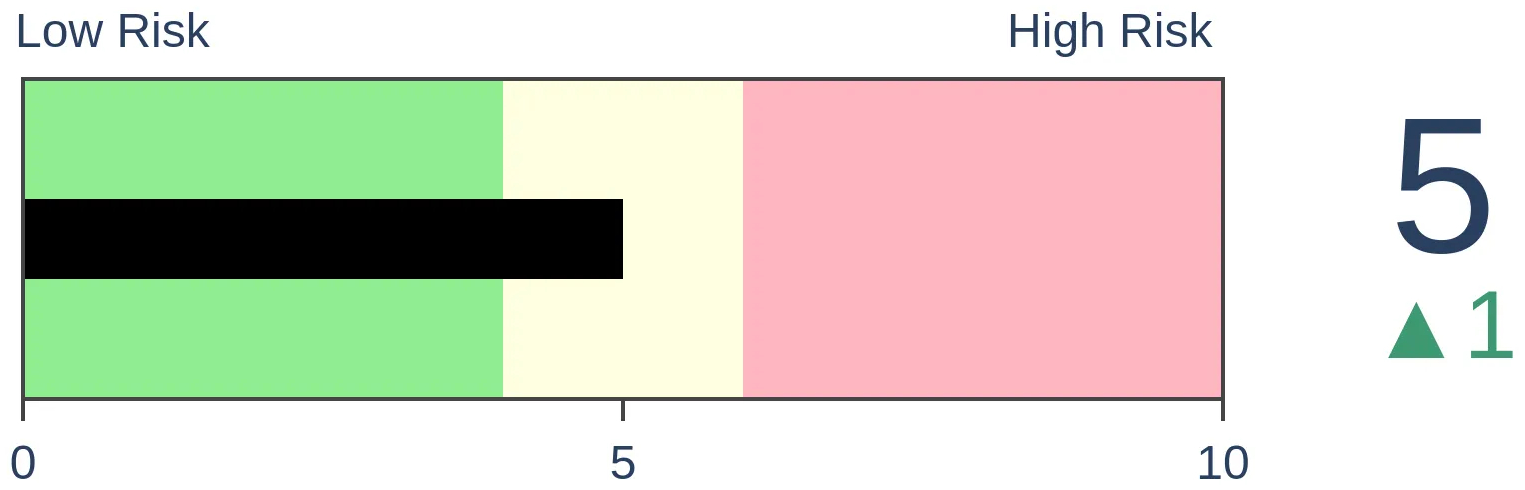
Bonds
|
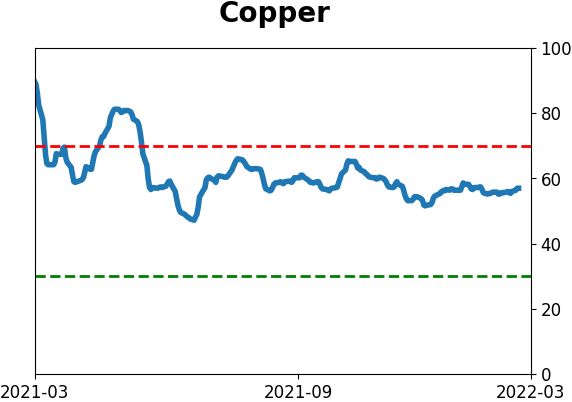
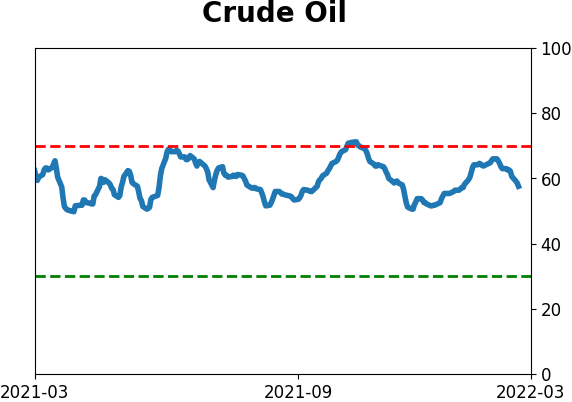
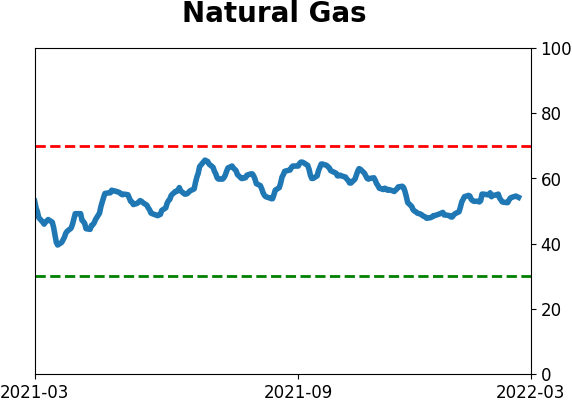
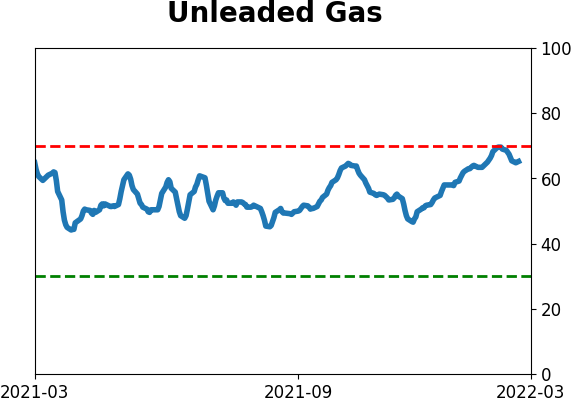
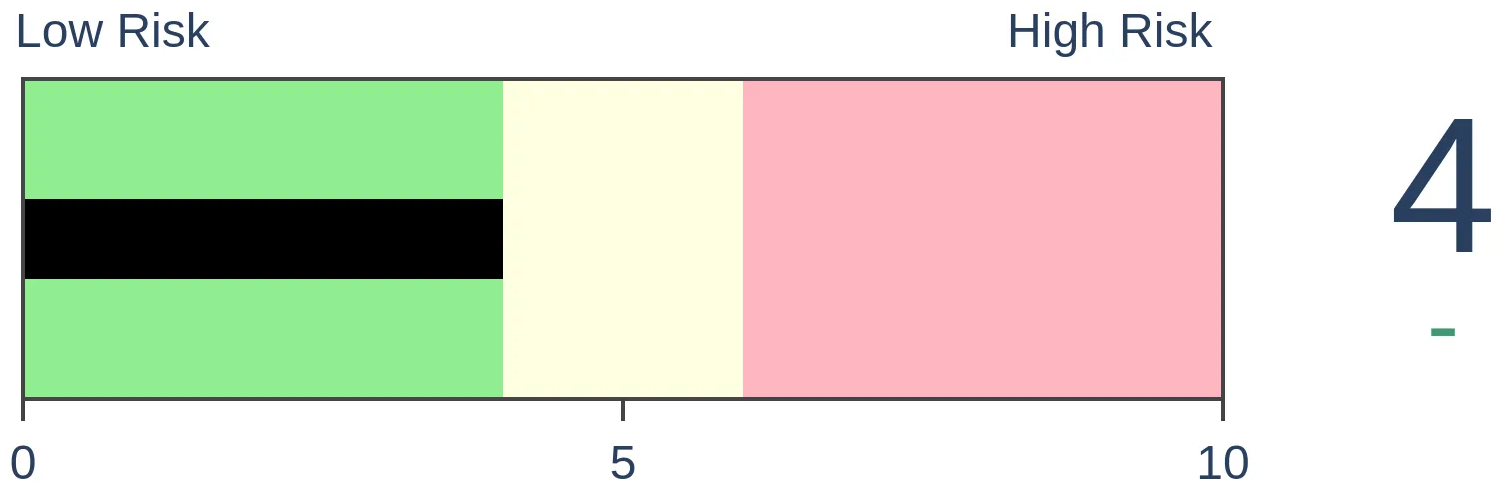
Crude Oil

|
|
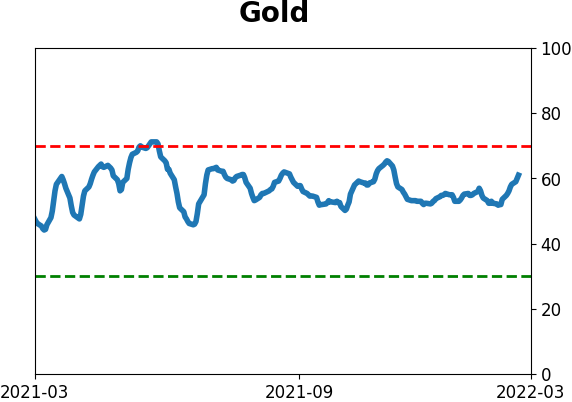
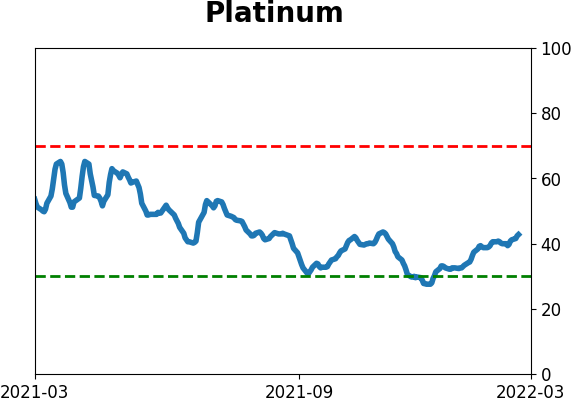
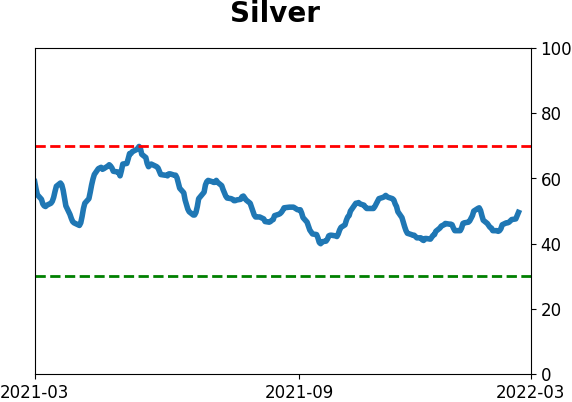
Gold
|
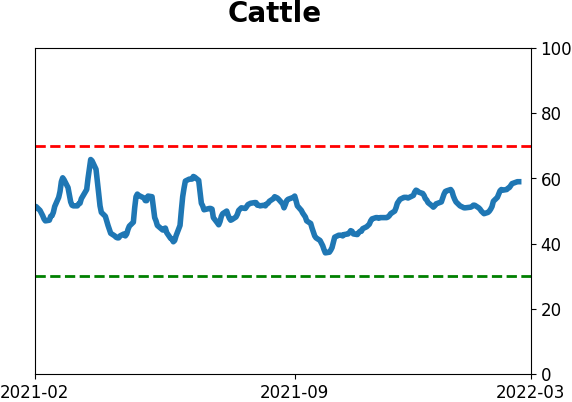
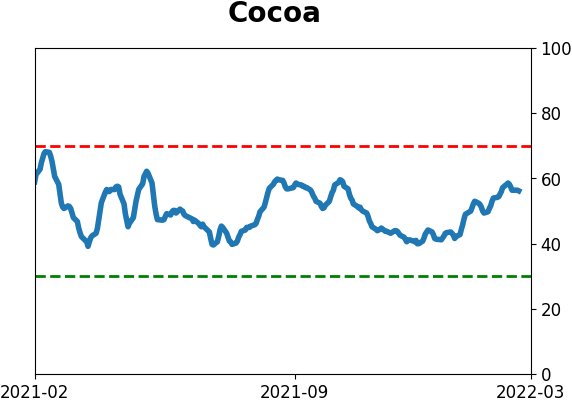
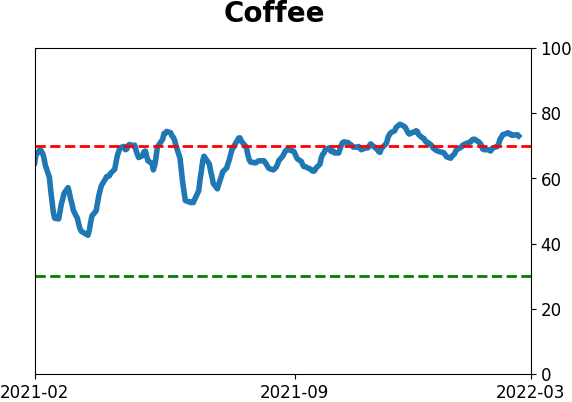
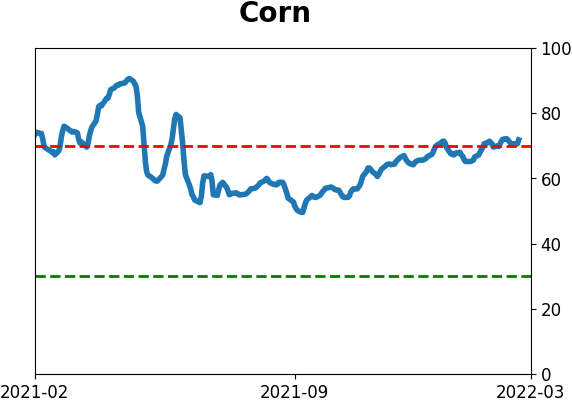
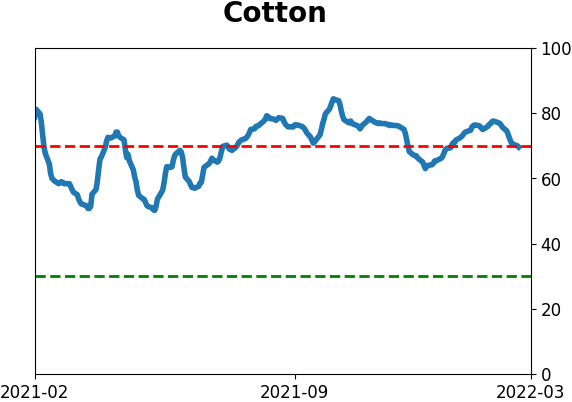
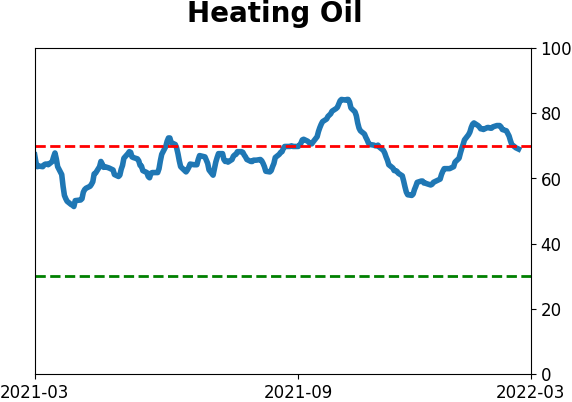
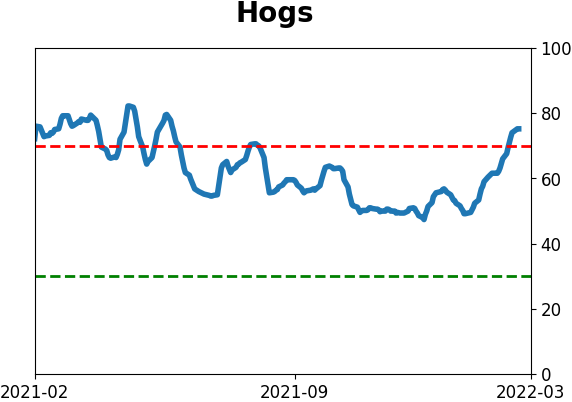
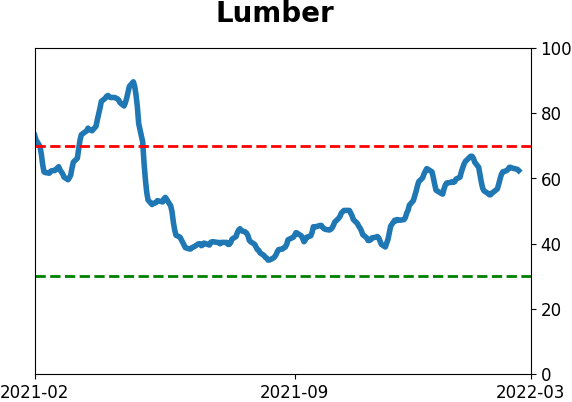
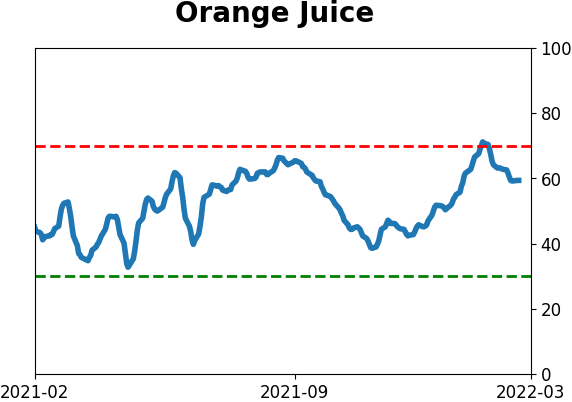
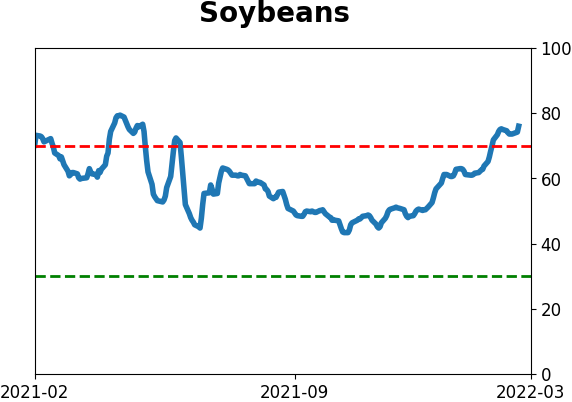
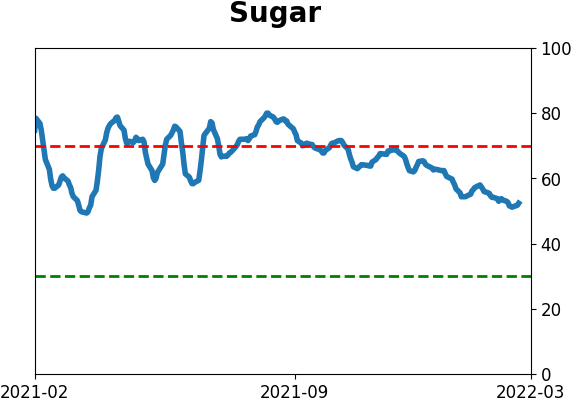
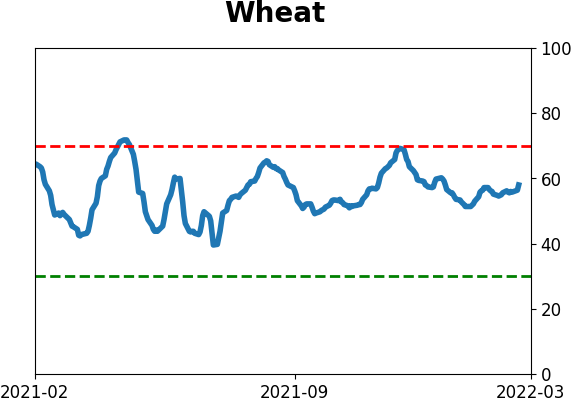
Agriculture
|
|
Research
By Jason Goepfert
BOTTOM LINE
The S&P 500 is on the cusp of its first correction in over a year and a half. It's also one of its quickest corrections. Both tend to see the S&P snap back in the months ahead, but we look at bear market and non-bear-market analogs as guides for the index's future price path.
FORECAST / TIMEFRAME
None
|
Key points:
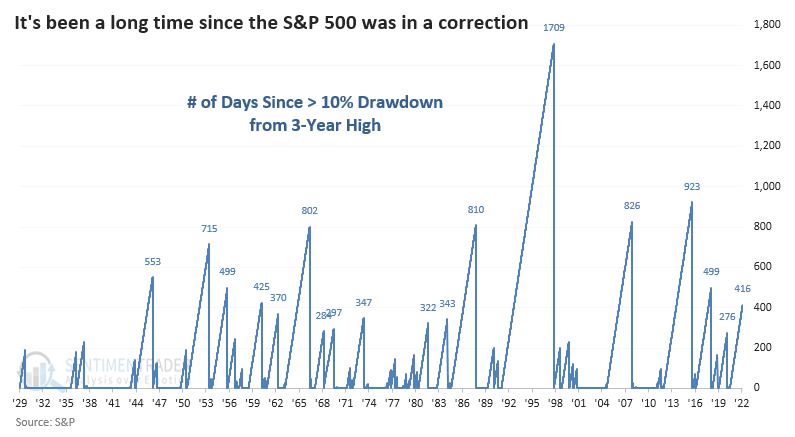
- The S&P 500 has ended a long streak of closes within 10% of its high
- Quick corrections after a long period of calm tend to lead to modest dip-buying behavior
- Non-bear-market corrections tend to see much more eager short-term dip-buying than bear market corrections
A quick correction after a long period of calm
The S&P 500 has finally endured a drawdown of more than 10% from its most recent multi-year high. For brevity's sake, we use the commonly accepted definition of calling this a correction.
This ended the S&P's 11th-longest streak of hanging within 10% of its high.
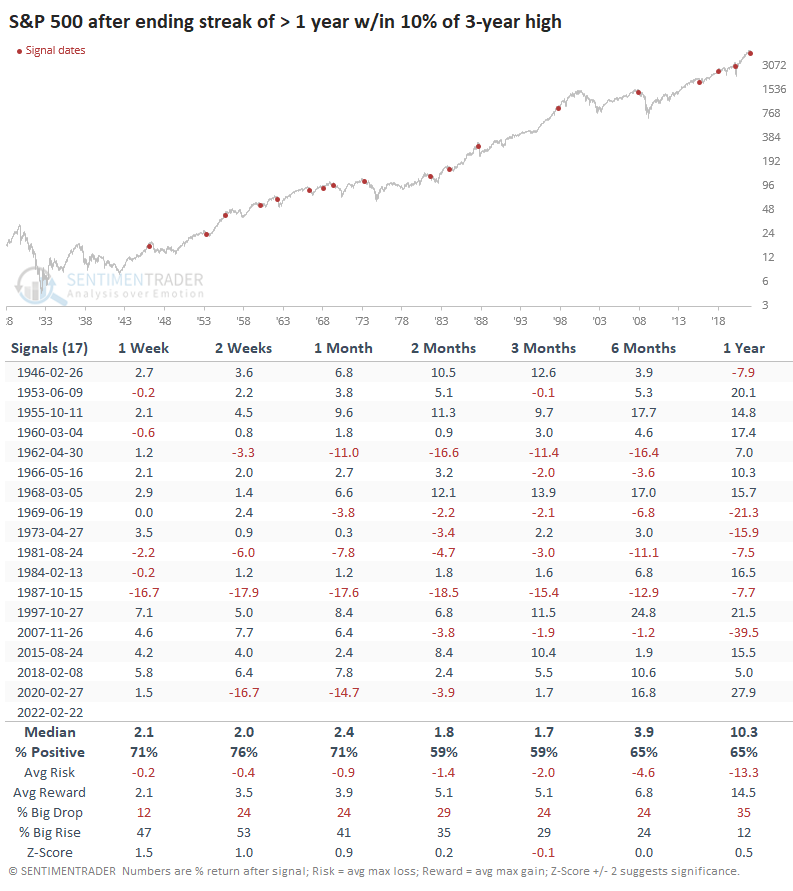
After the S&P fell into a correction following a long absence, it tended to bounce back, especially over the next 1-4 weeks. There were 3 major exceptions (1962, 1987, and 2020) when sellers refused to give up and pushed the index to double-digit losses in the weeks ahead. Over the medium- to long-term, the S&P's returns were about in line with random.
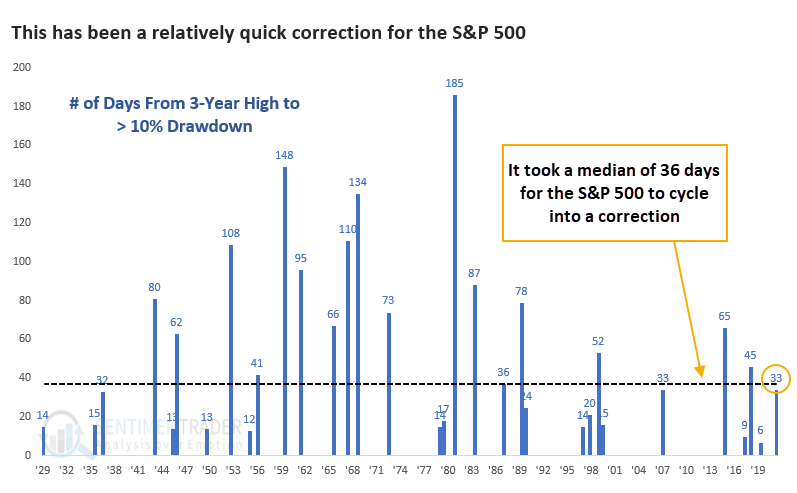
At only 33 days removed from its most recent multi-year high, it seems like this has been a quick about-face among investors. But it's not far below the median number of days it took for the S&P to cycle into a correction.
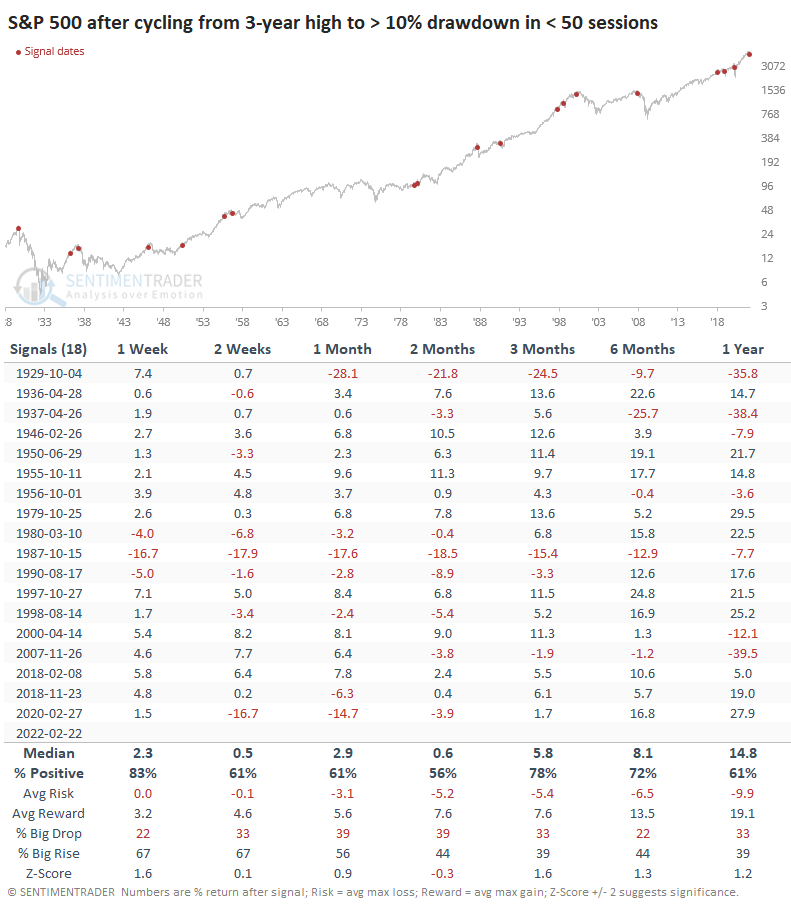
Again, the S&P tended to bounce after quick corrections as dip-buyers finally found their chance to jump on what had been an excellent trend. Returns after these corrections were better over the medium- to long-term, and well above random.
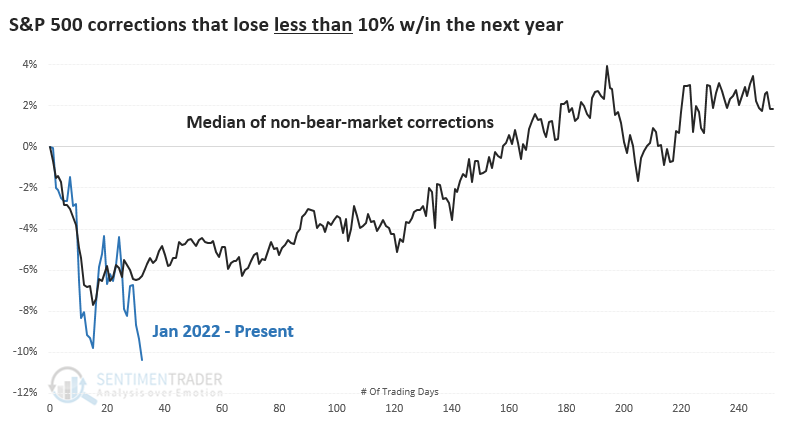
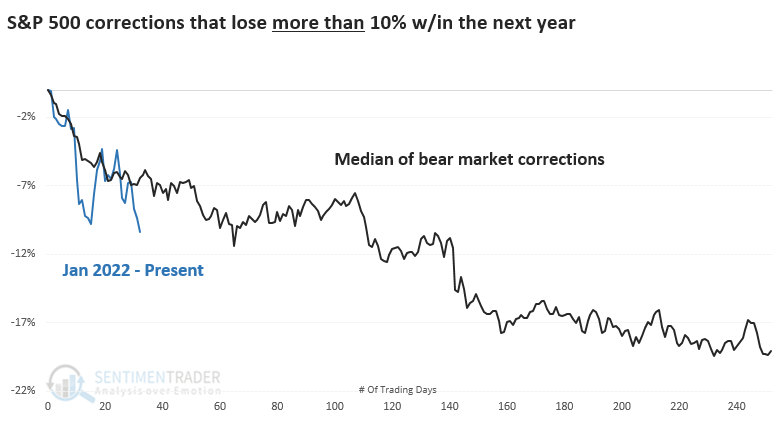
Bear market vs. non-bear-market corrections
One of the biggest concerns is whether this will turn into a bear market. The chart below shows all corrections that DID NOT lead to more than a further 10% decline at any point within the next year. There have been 18 of these since 1928. While it seems odd that the median line doesn't exceed -10%, that's because the corrections unfolded at different paces.
Pattern-wise, the current correction shows a similar shape, and on average, the S&P didn't see much more in terms of losses.
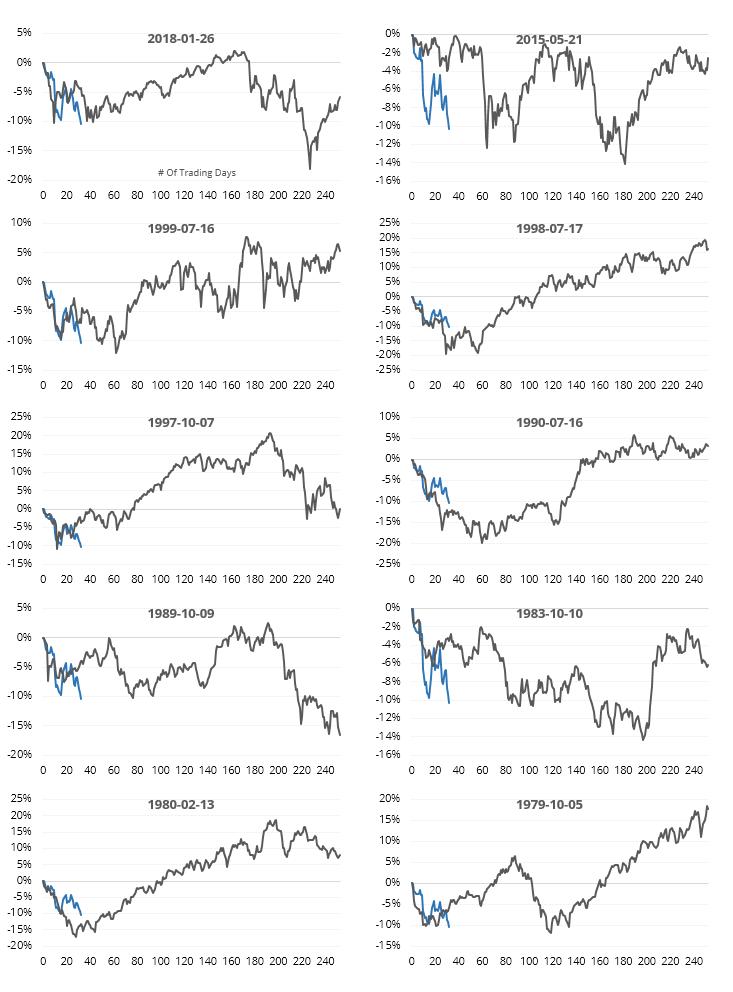
The 10 most recent instances are shown below. There is wide variability among them, which makes it harder to draw conclusions. Very roughly, the ones that showed lesser declines than we've seen now, in shorter time periods, tended to see lesser losses going forward.
Compare that to corrections that DID lose more than an additional 10% at some point in the next year. These corrections saw very little in terms of bounces once we reached the correction stage.
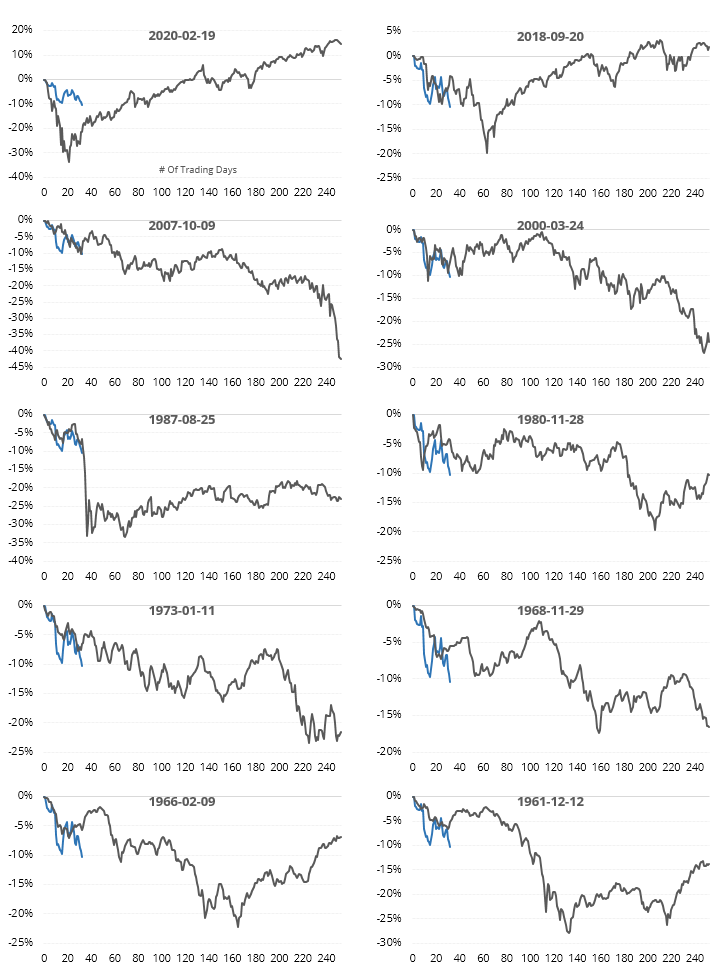
The 10 most recent, shown below, clearly show the limited appetite for dip-buying among investors. Sentiment soured once stocks fell into a correction, and only got more sour as short-term rallies fizzled.
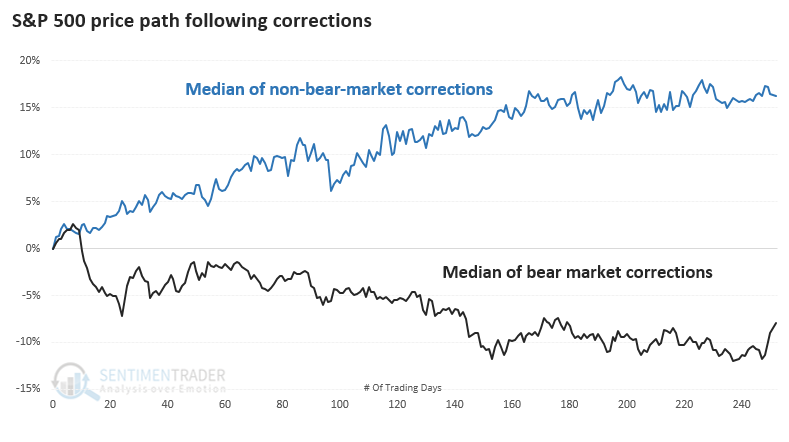
The chart below shows the S&P 500's median price path once it fell into a correction, separated by those that turned into bear markets (black line) and those that did not (blue line).
Both groups tended to see a short-term bounce lasting 1-2 weeks. After that, the bear market corrections fell apart and quickly plumbed lower lows. The non-bear-market corrections only saw some choppiness then went on to recover further in the weeks ahead.
What the research tells us...
Now that the most benchmarked index in the world has fallen into correction territory, trumpeted by media headlines, we'll get a chance to see if risk appetite will return. We're in an unhealthy market environment with clear risk-off behavior but only moderate sentiment extremes, so it's not a given that investors will be willing to step up. We'll just have to see how they react in the week(s) ahead, and the chart of bear market corrections makes it clear that if investors' risk appetite remains missing and the S&P 500 continues to reach lower lows, it will usher in unpleasant precedents and raise the risk of a full-blown bear market.
Active Studies
| Time Frame | Bullish | Bearish | | Short-Term | 3 | 0 | | Medium-Term | 18 | 2 | | Long-Term | 15 | 5 |
|
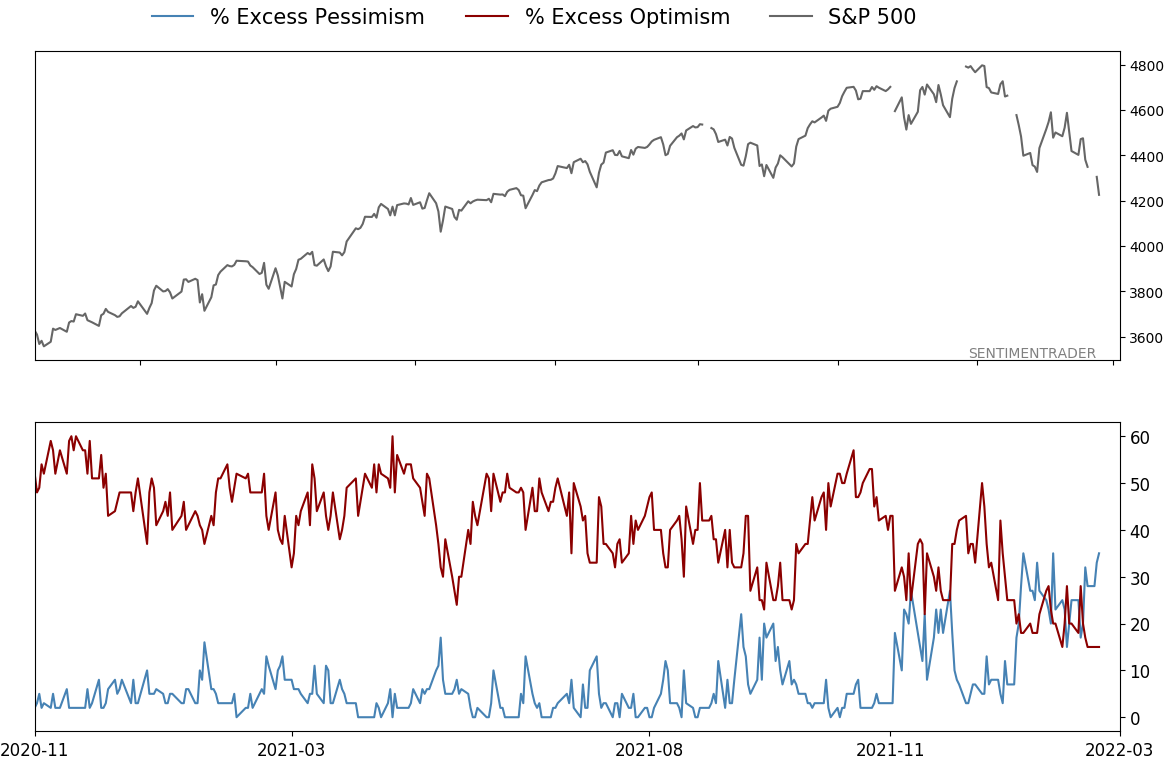
Indicators at Extremes
Portfolio
| Position | Description | Weight % | Added / Reduced | Date | | Stocks | RSP | 21.4 | Added 10.2% | 2022-01-28 | | Bonds | 32.7% BND, 7.1% SCHP | 40.1 | Added 8.3% | 2021-10-26 | | Commodities | GCC | 2.4 | Reduced 2.1%
| 2020-09-04 | | Precious Metals | GDX | 4.6 | Reduced 4.2% | 2021-05-19 | | Special Situations | 8.1% KWEB, 3.6% XLE, 1.7% PSCE | 13.4 | Reduced 3.9% | 2022-01-18 | | Cash | | 17.9 | | |
|
Updates (Changes made today are underlined)
With a typical time frame of several months in this account, I normally don't make changes so quickly. I've added back part of the stock exposure I took off earlier in January due to the washed-out conditions and extreme pessimism we're seeing across a wide array of metrics. The biggest issue is that the environment is unhealthy and we could be in the throes of a protracted bear market. Even so, the readings we've seen recently have a good record at preceding relief rallies, so we'll have to see how that pans out. Bond sentiment is trying to recover from a recent bout of pessimism, and gold stocks are doing their thing which is not much at all. They've been flat for six months. Chinese tech stocks were doing exactly what they're supposed to do, then did *not* by plunging to new lows. This is troubling on a shorter-term time frame, but this was never meant for a trade, rather a multi-year investment. Recent behavior is troubling and I will not be adding any exposure as long as that's the case. RETURN YTD: -1.5% 2021: +8.7%, 2020: +8.1%, 2019: +12.6%, 2018: +0.6%, 2017: +3.8%, 2016: +17.1%, 2015: +9.2%, 2014: +14.5%, 2013: +2.2%, 2012: +10.8%, 2011: +16.5%, 2010: +15.3%, 2009: +23.9%, 2008: +16.2%, 2007: +7.8%
|
|
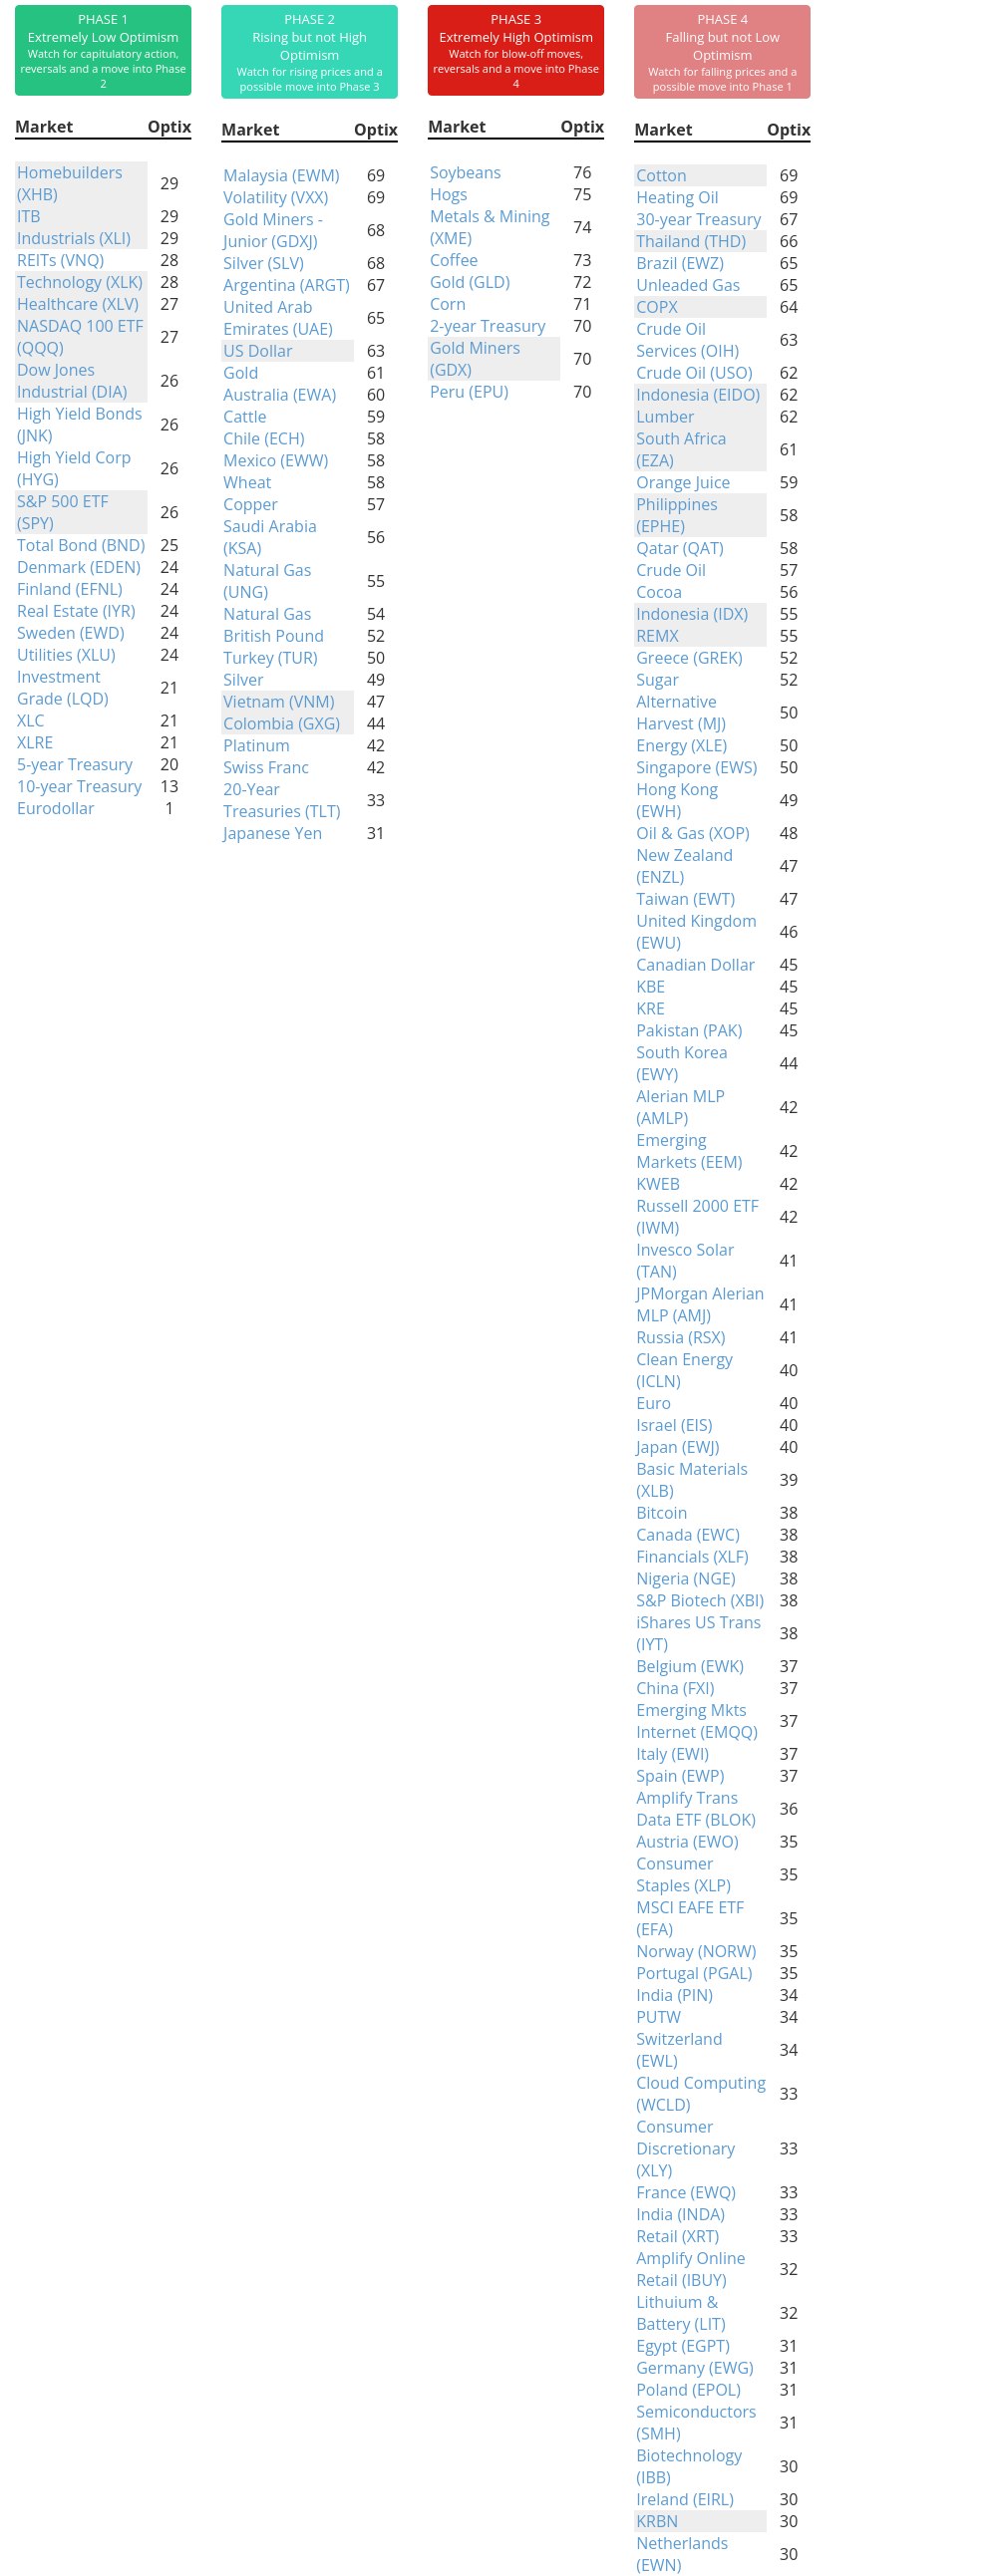
Phase Table
Ranks
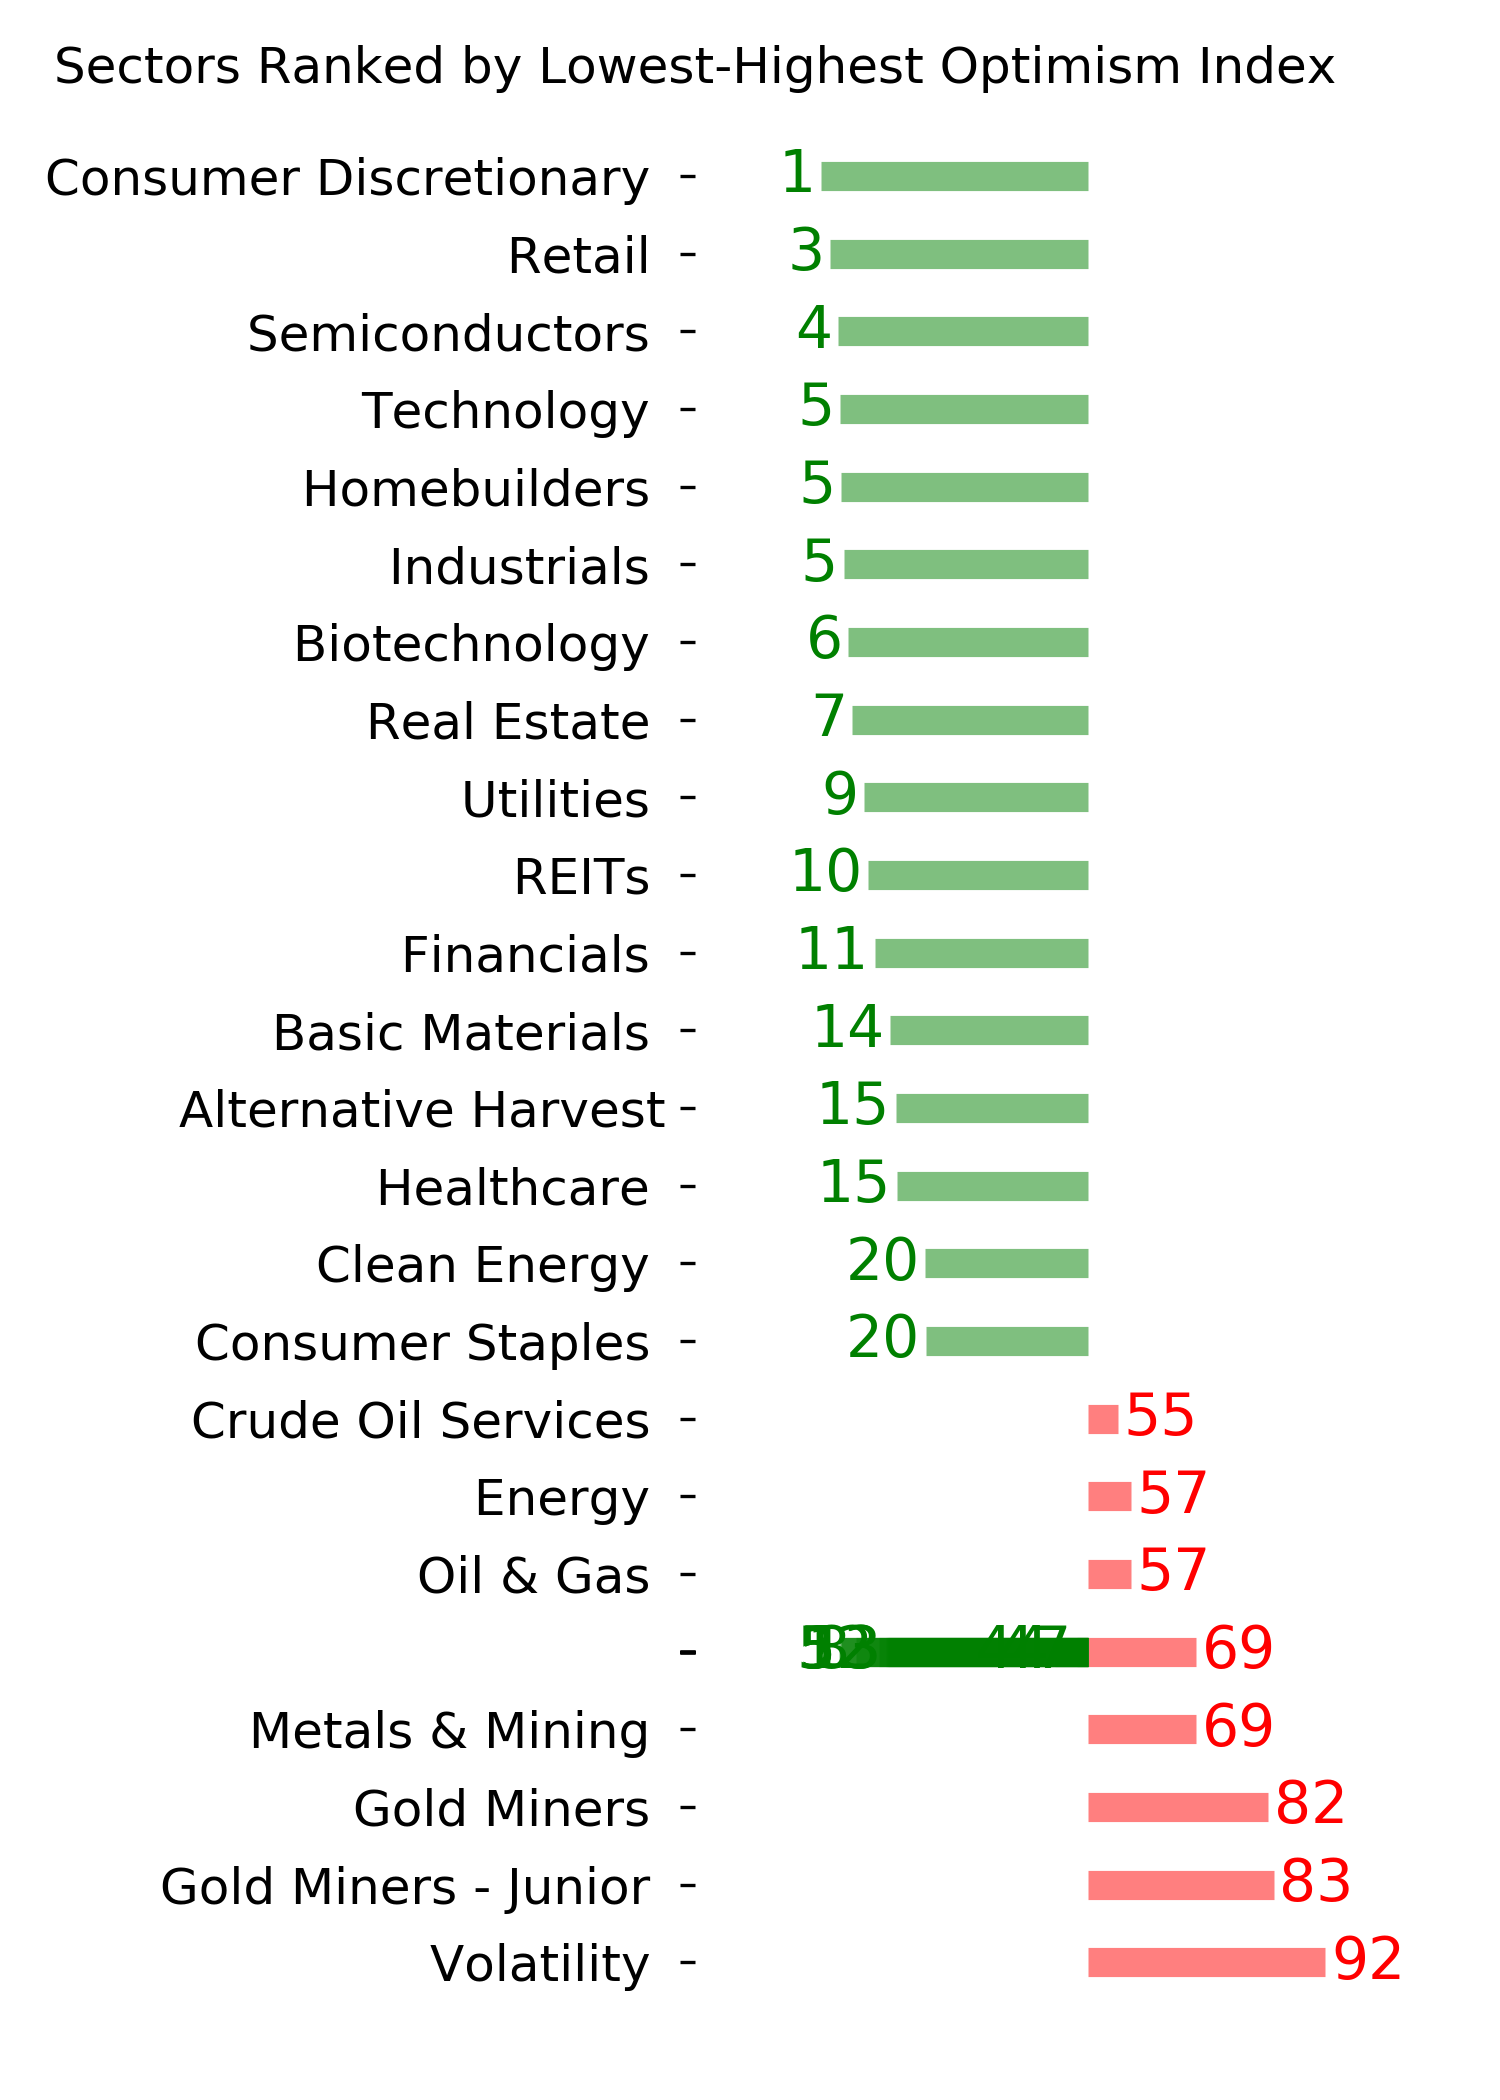
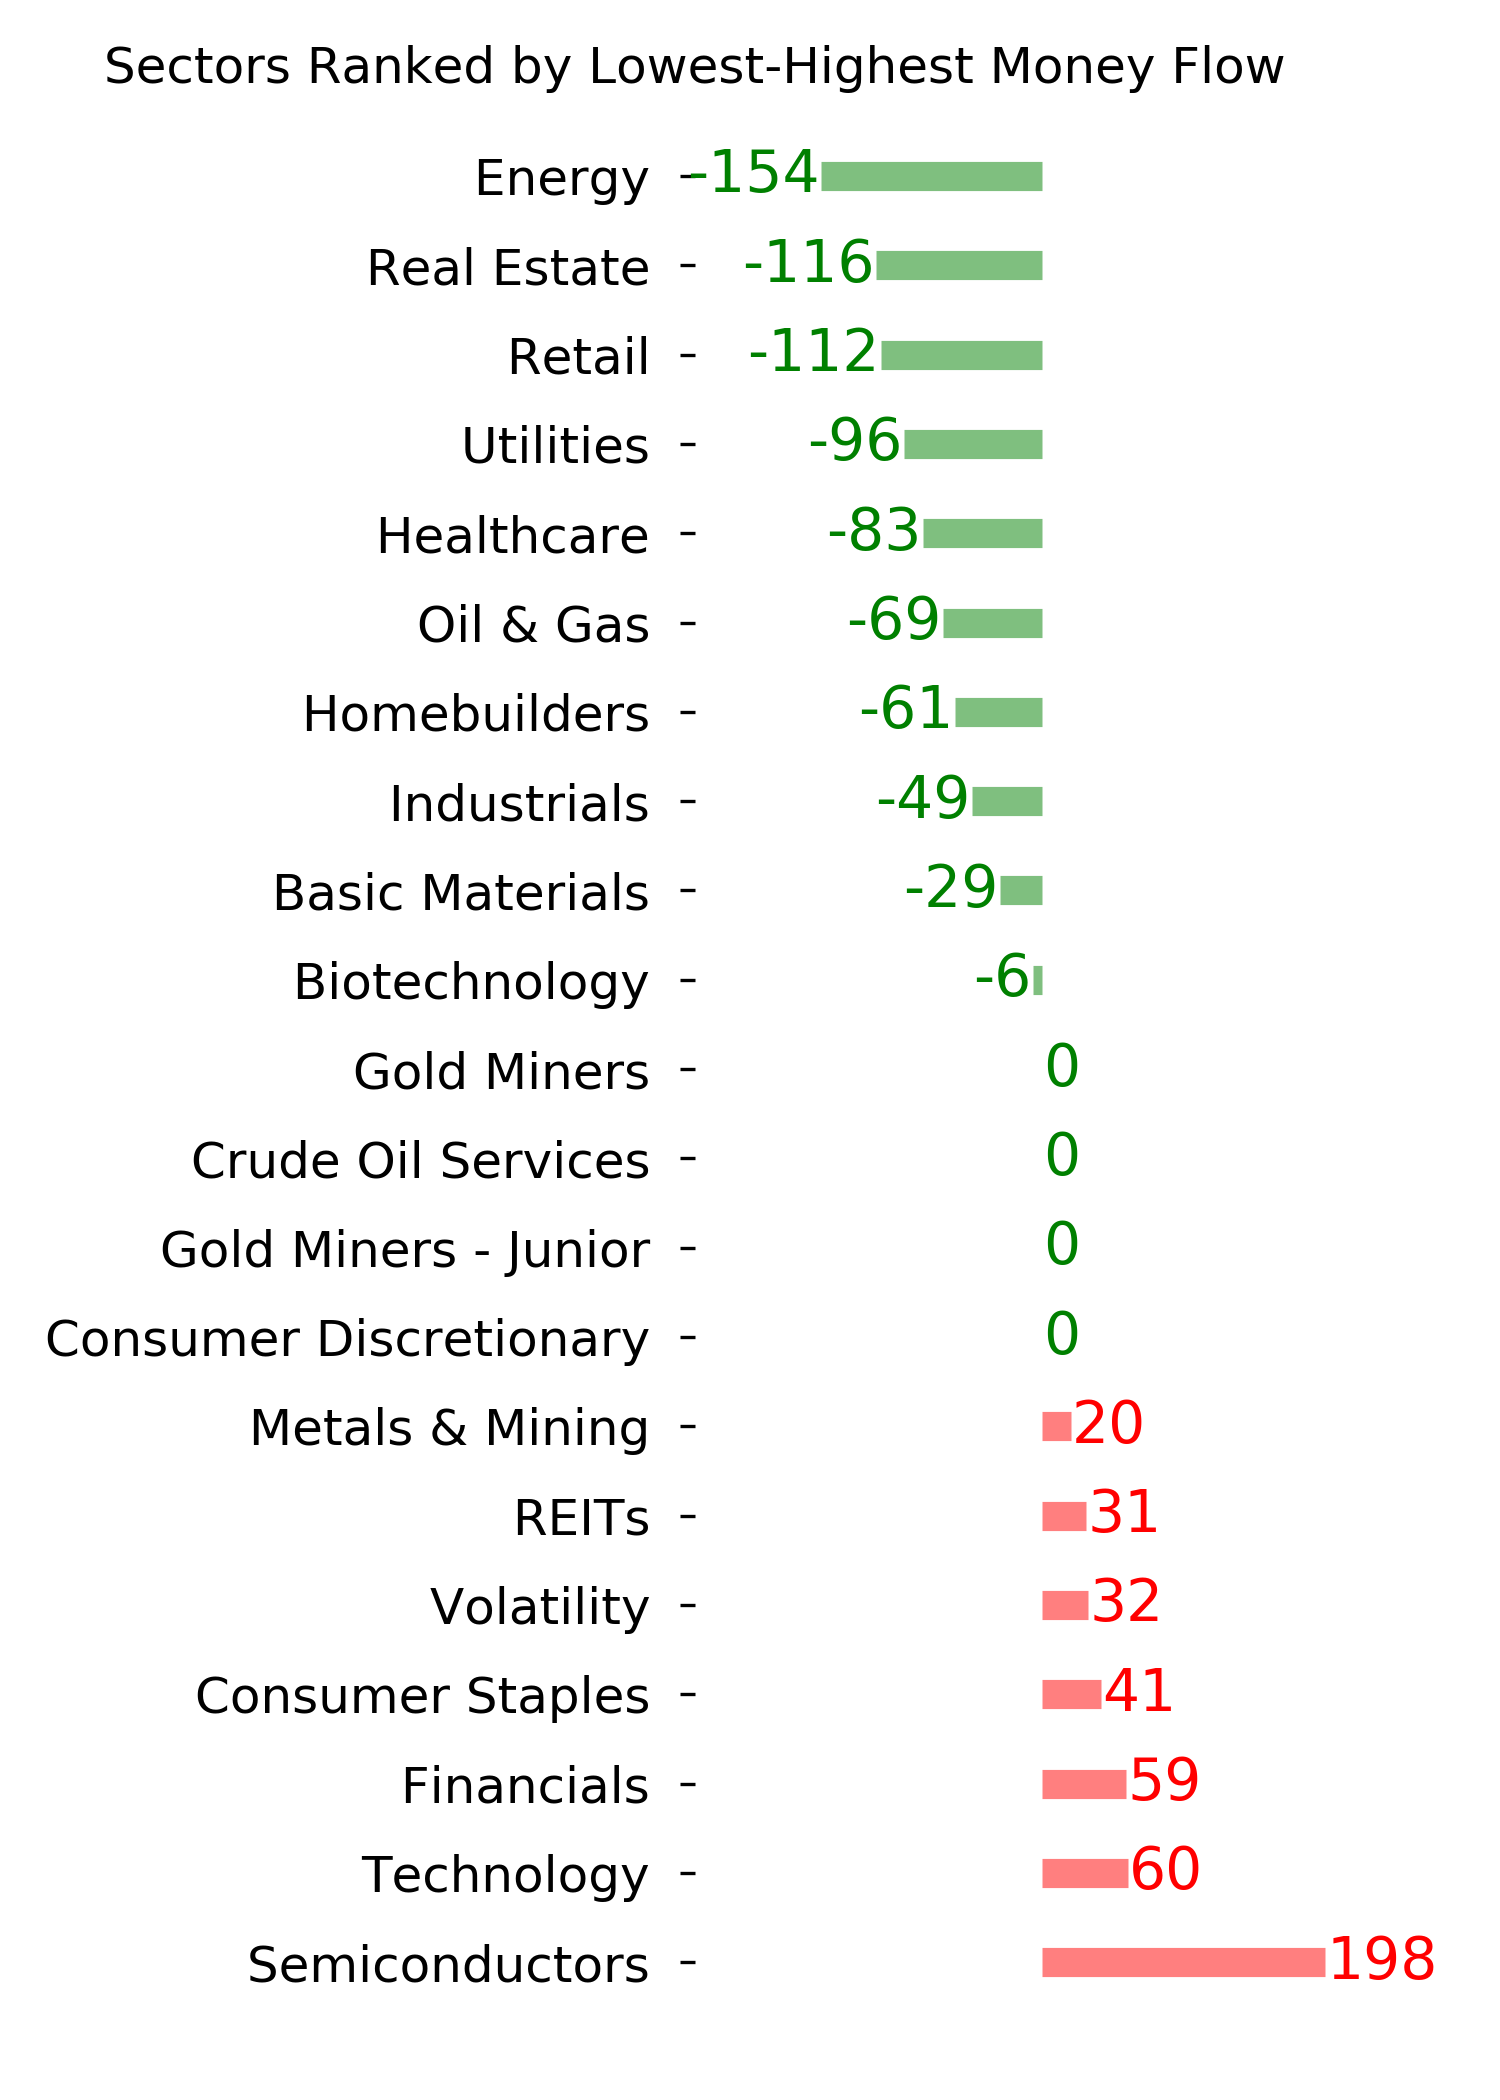
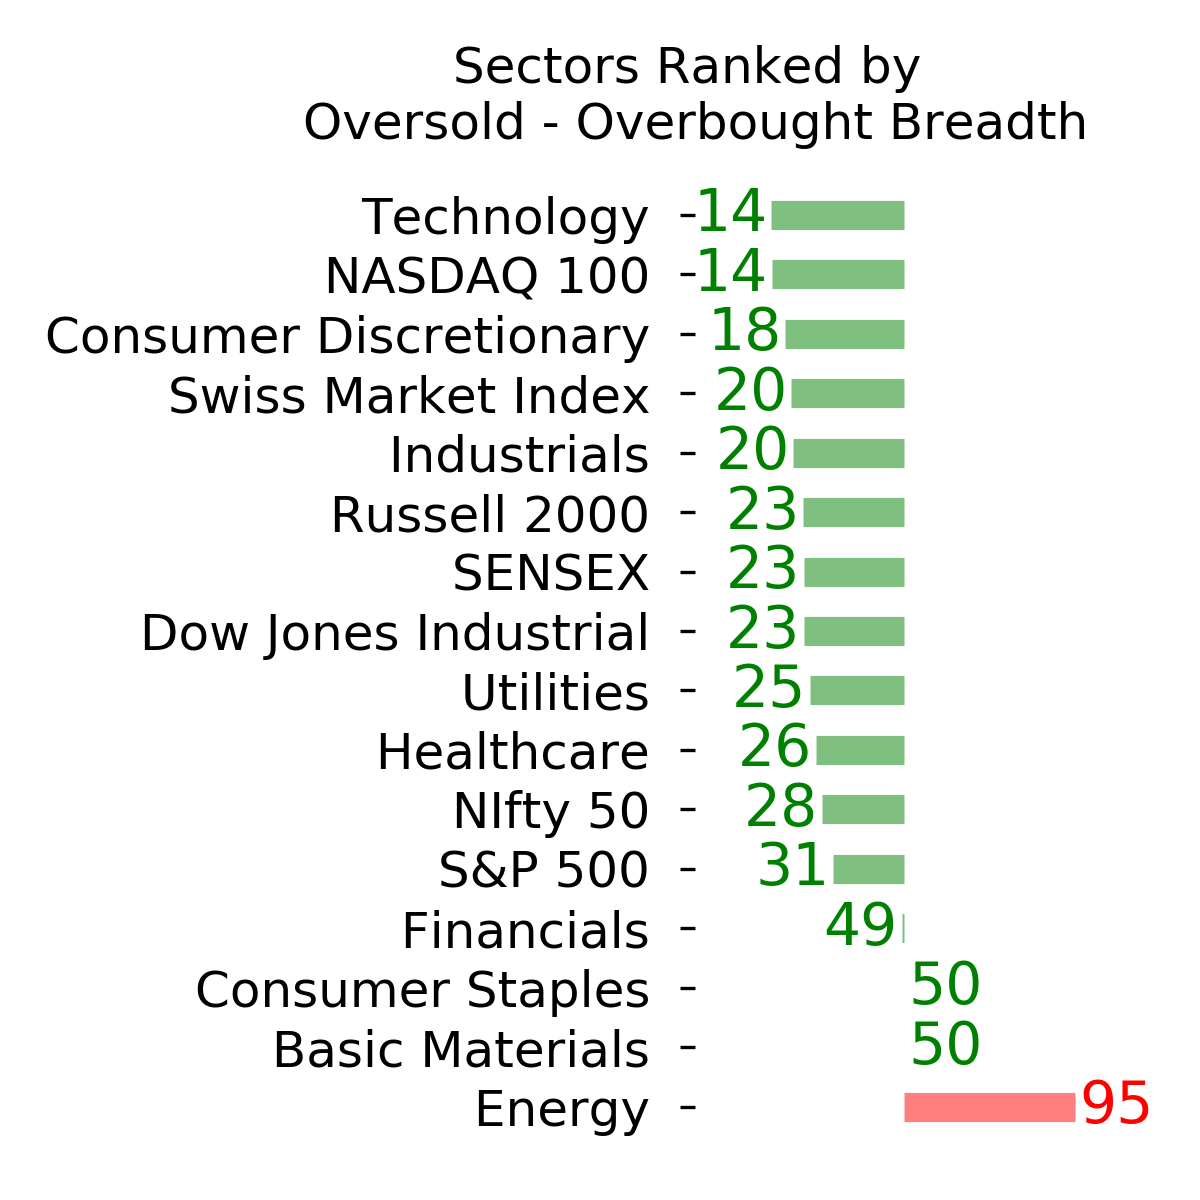
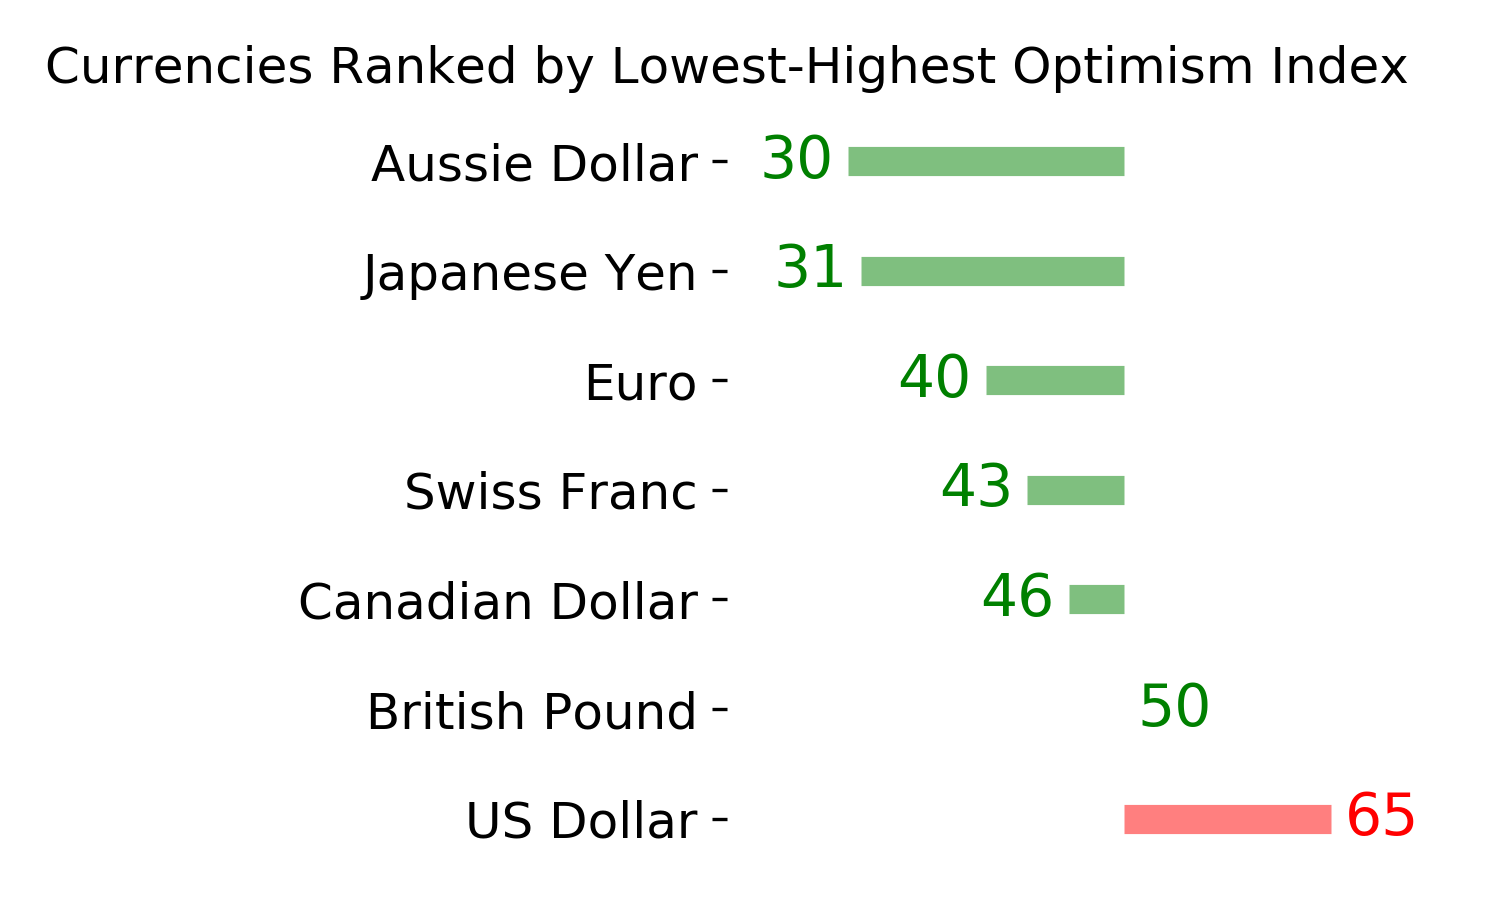
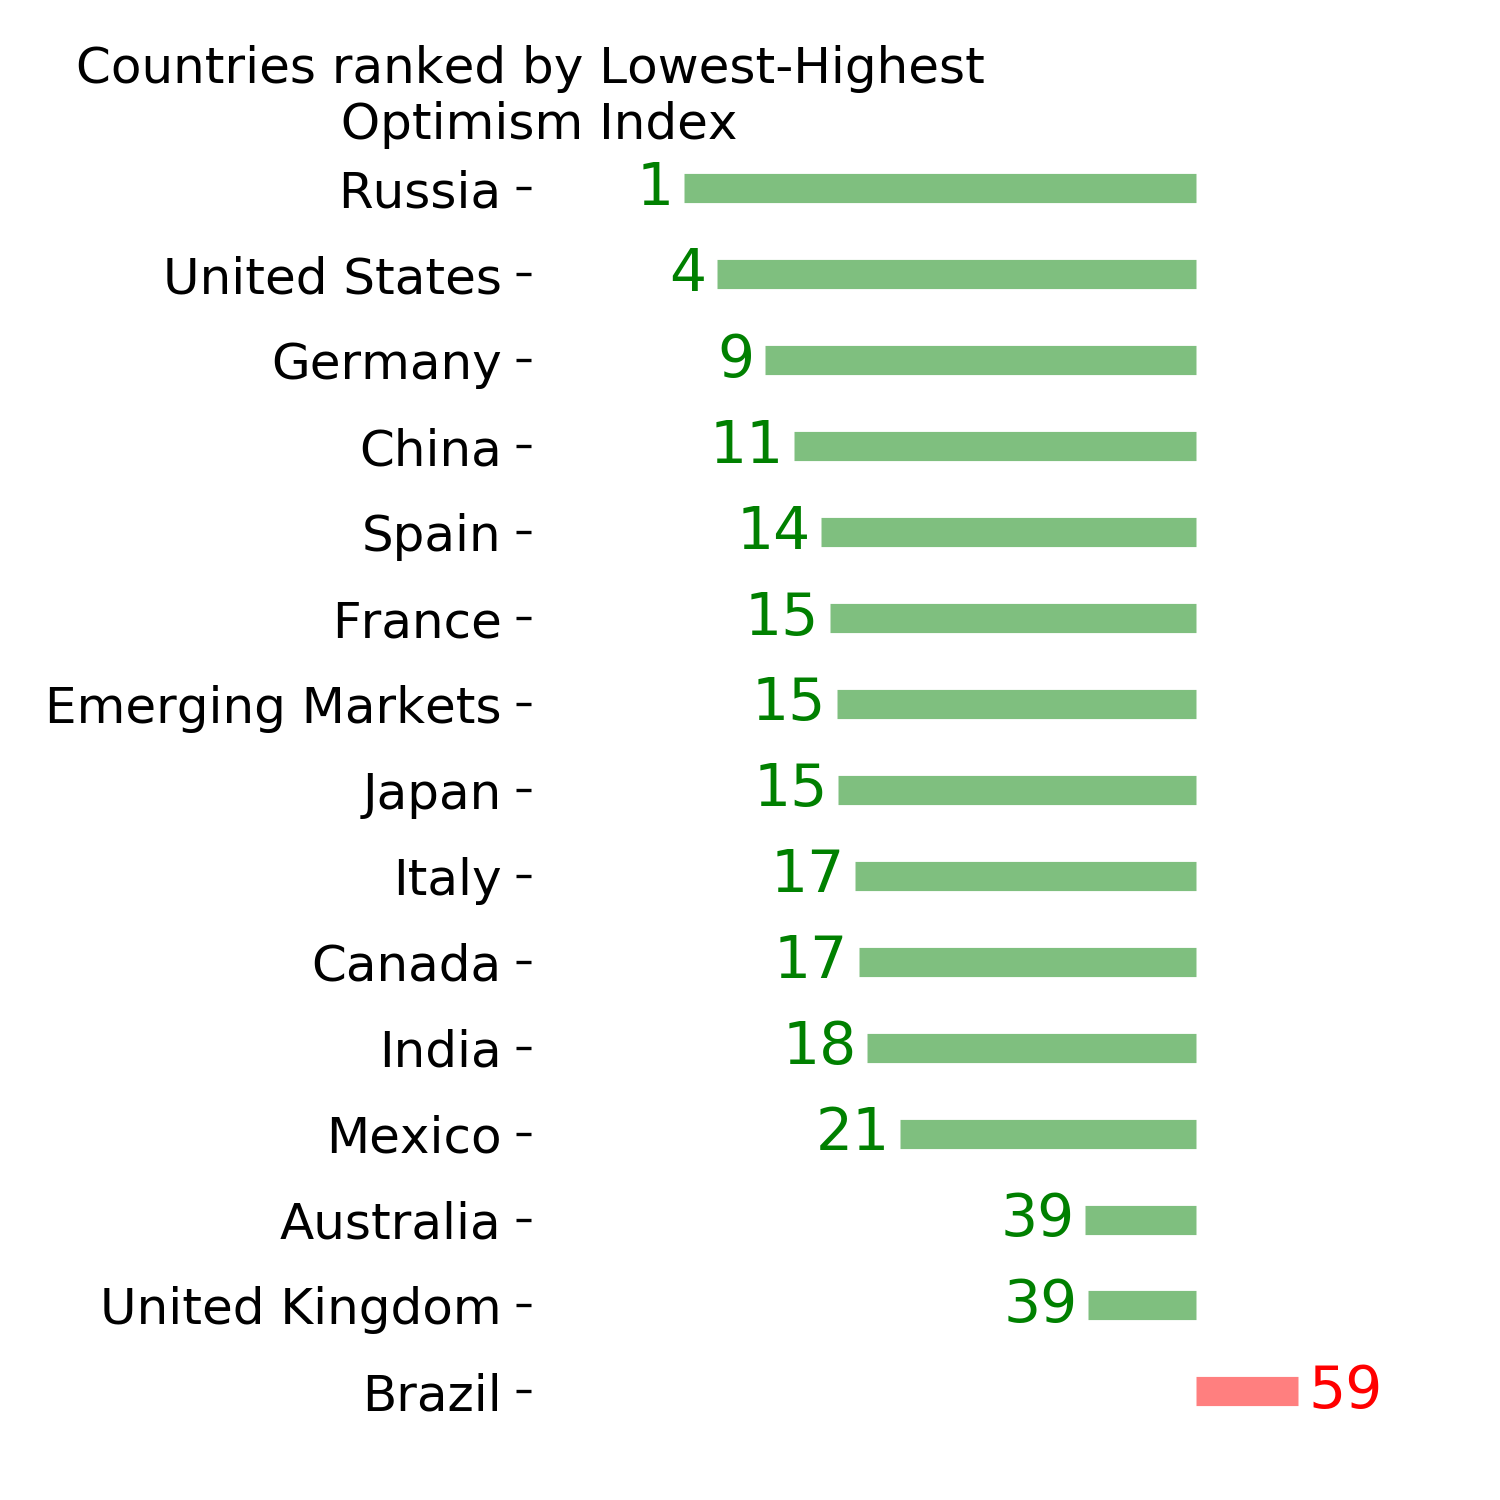
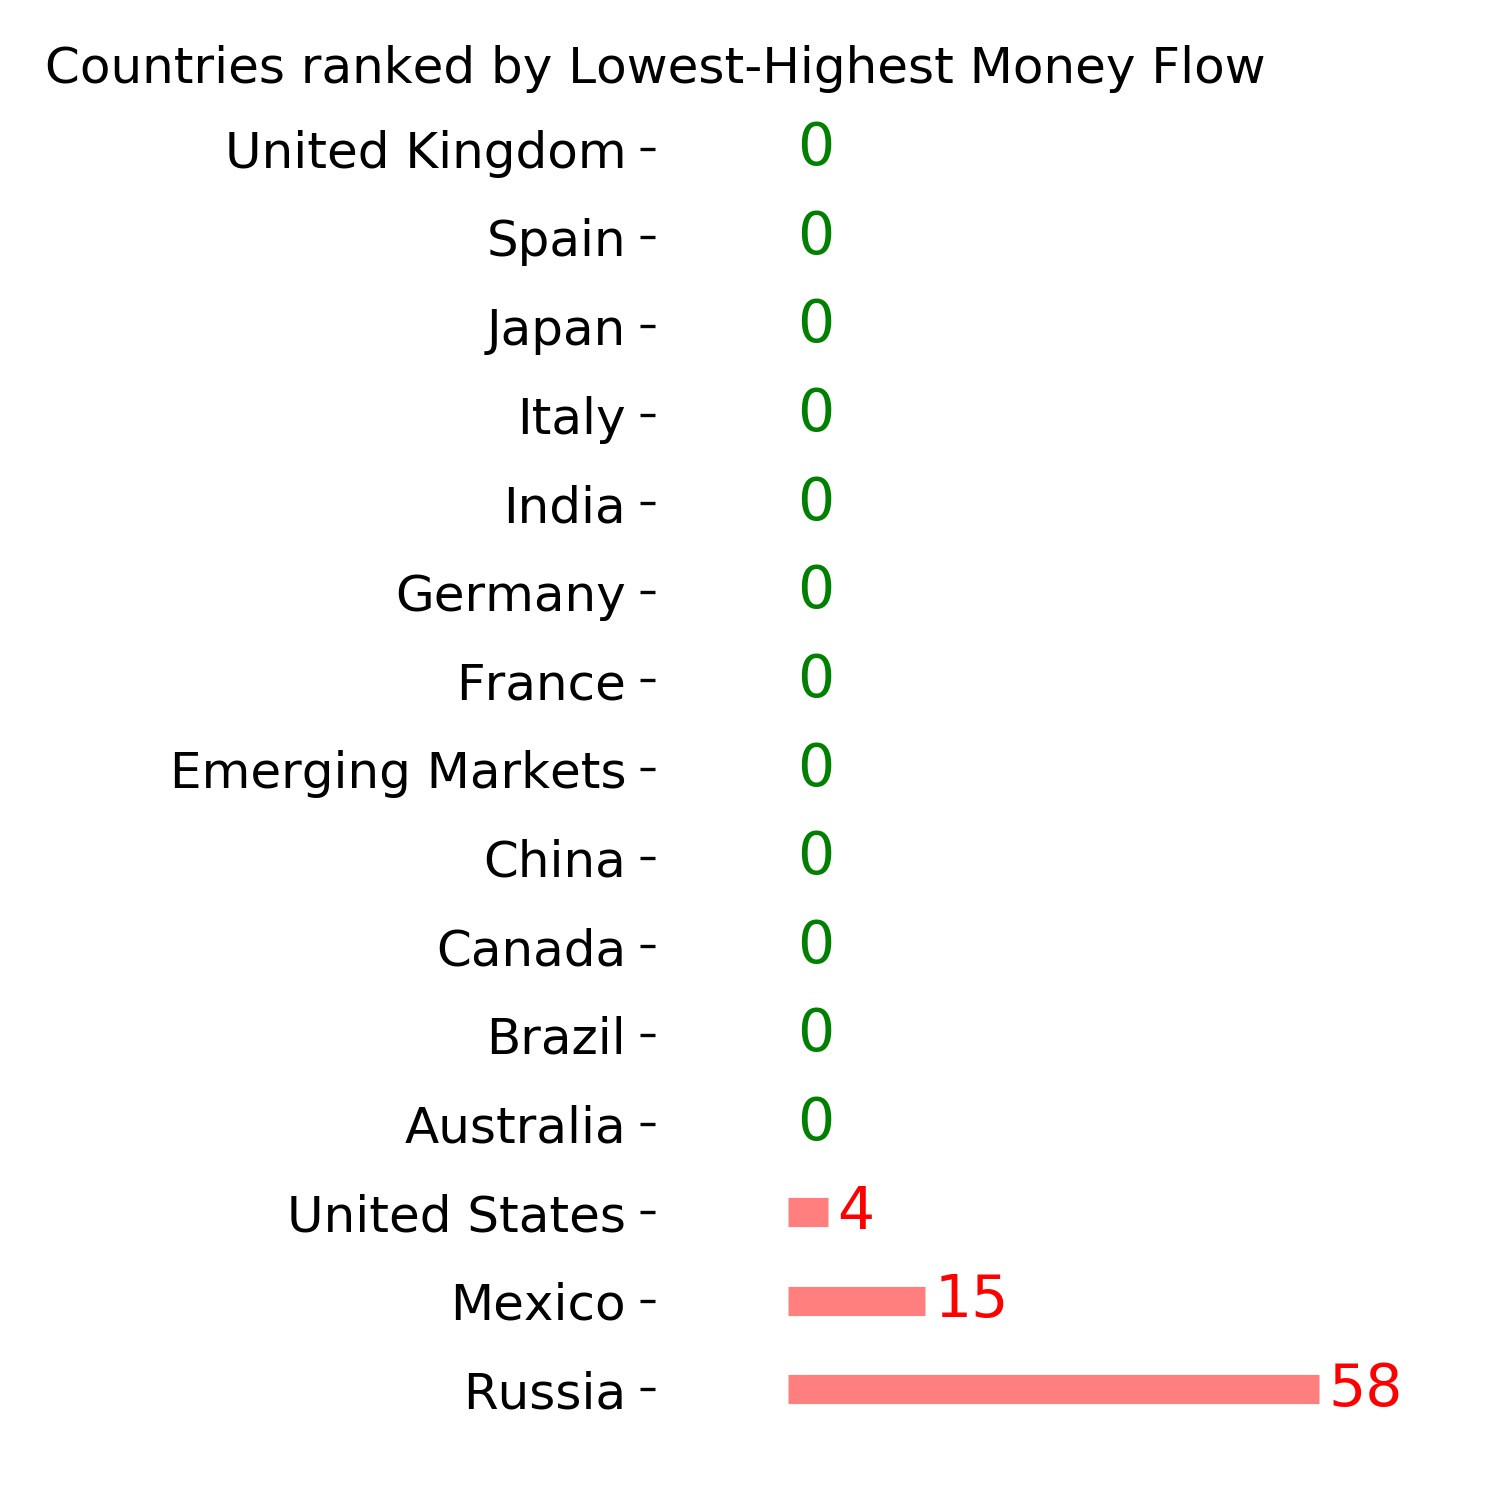
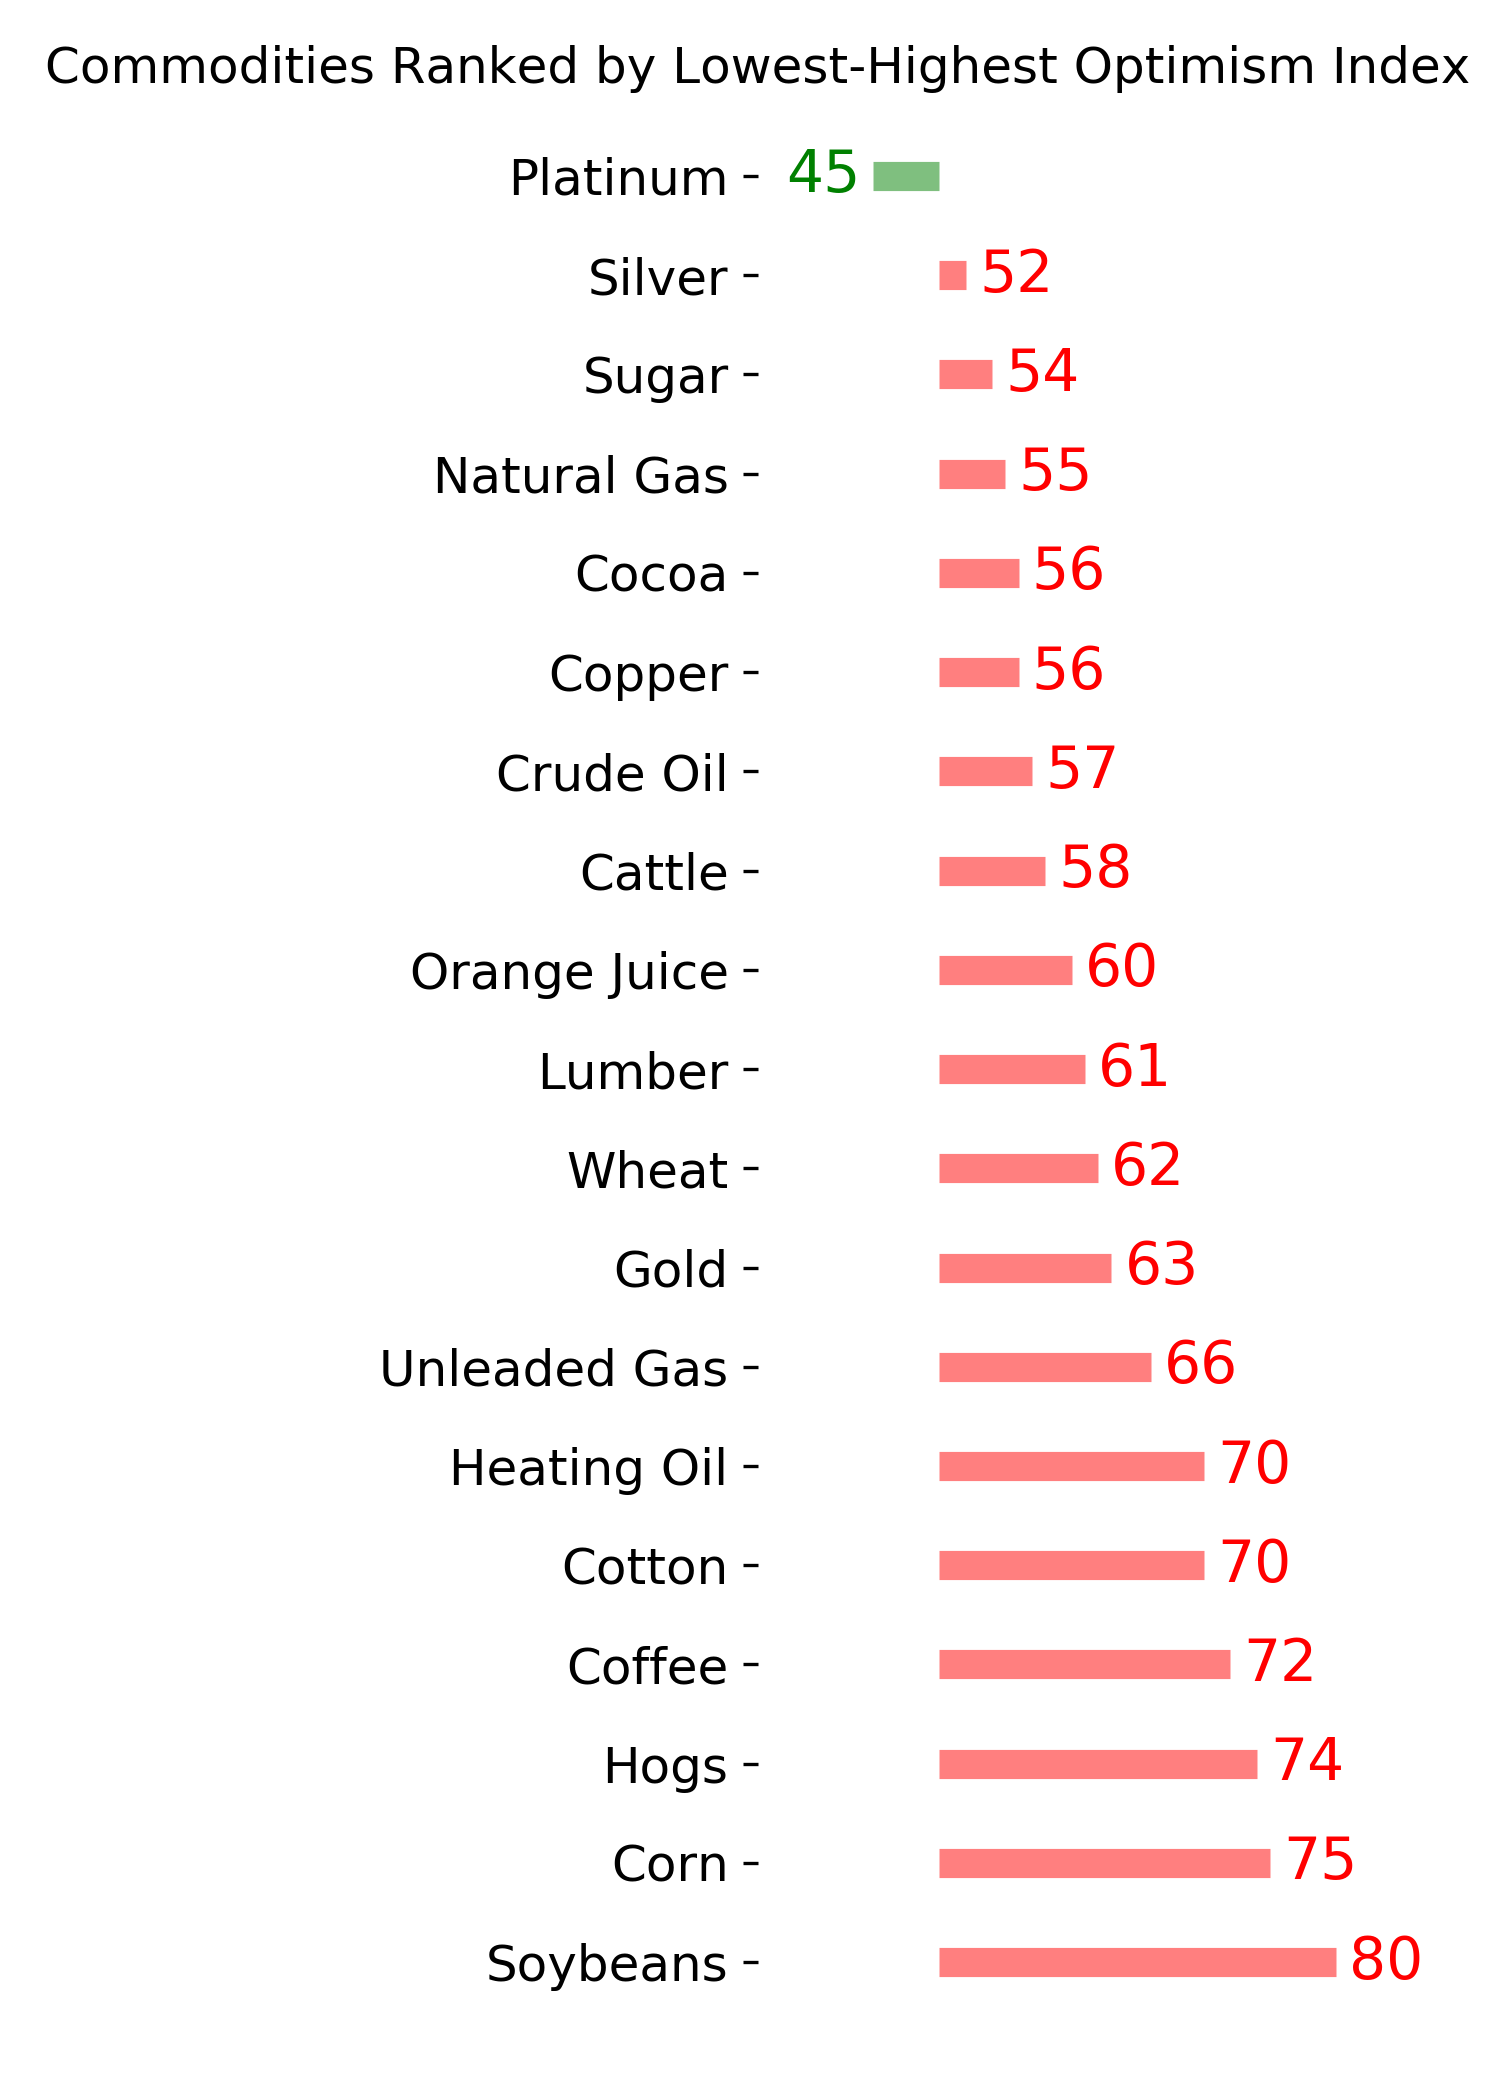
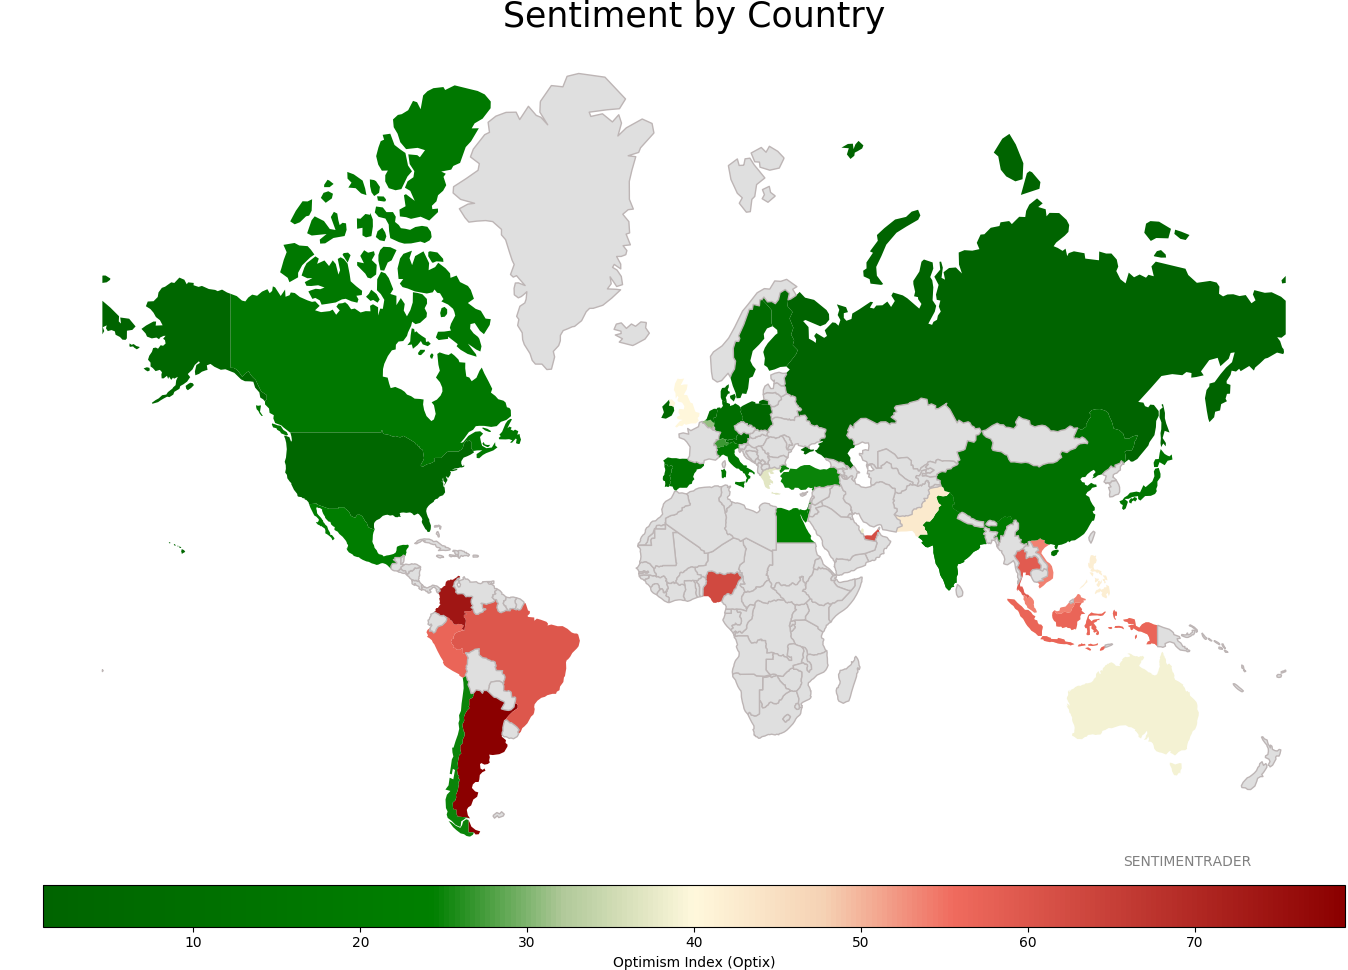
Sentiment Around The World
Optimism Index Thumbnails
|
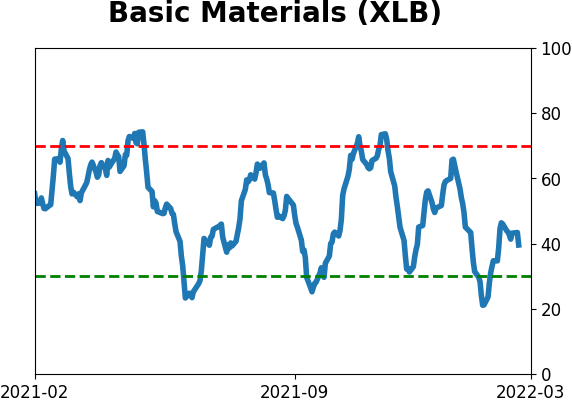
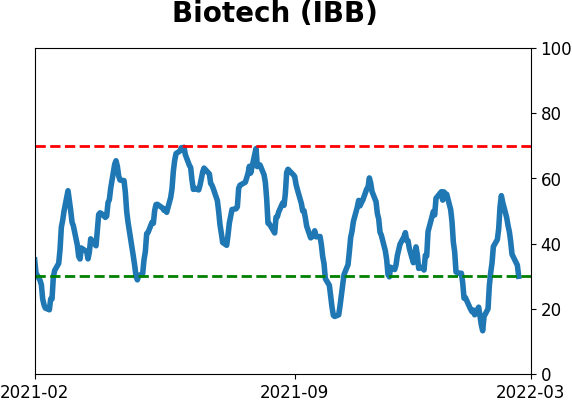
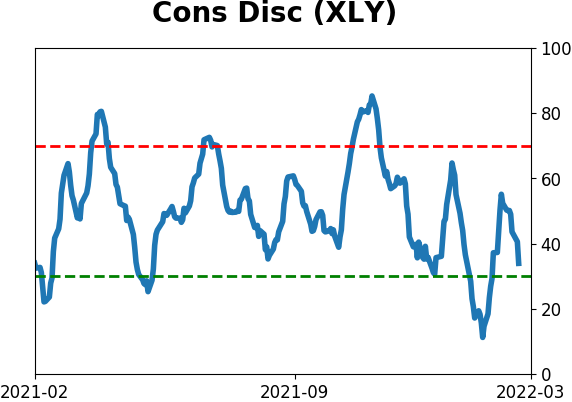
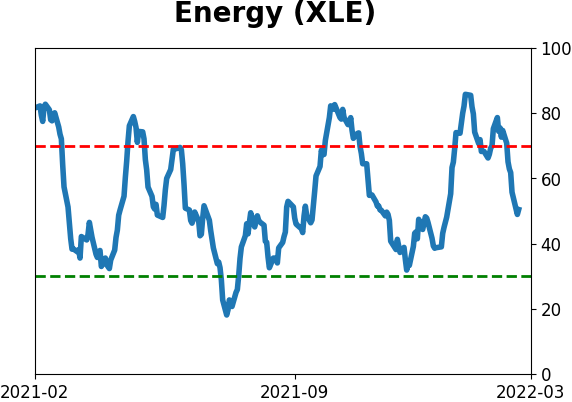
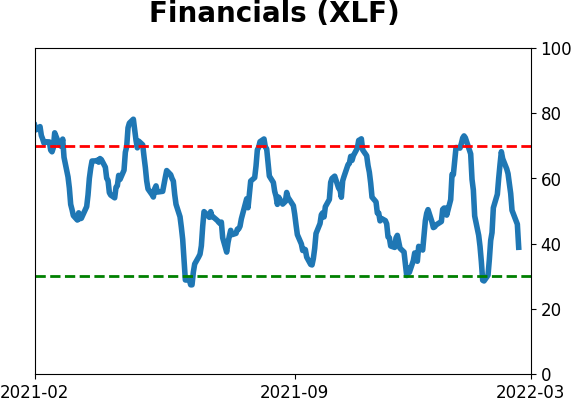
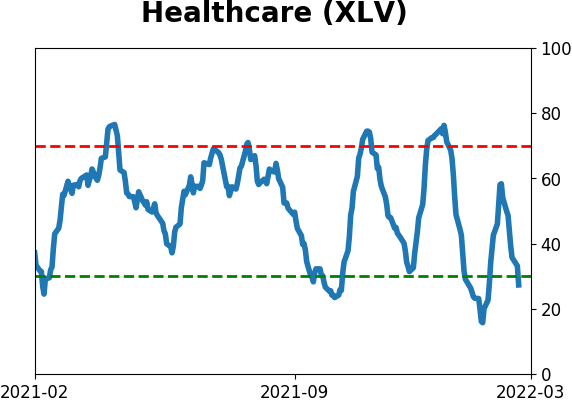
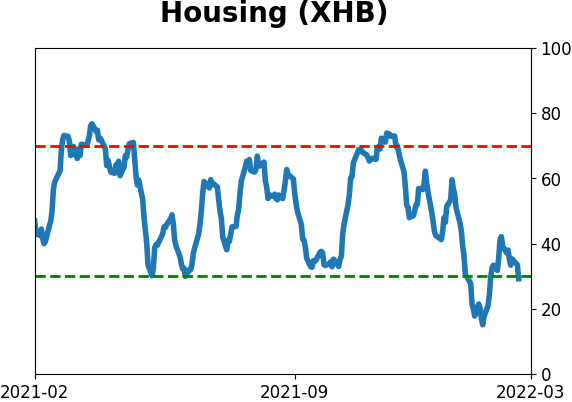
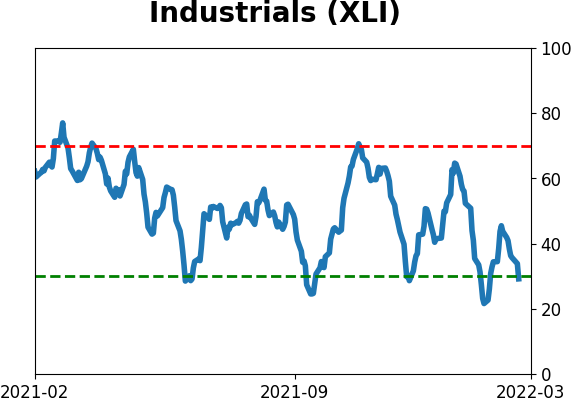
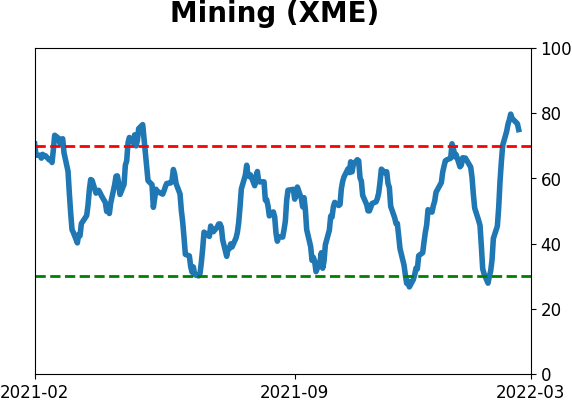
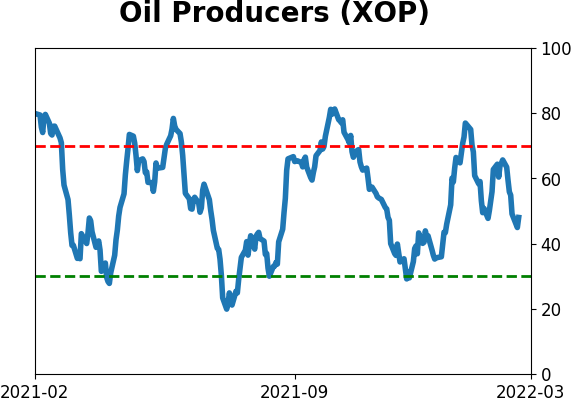
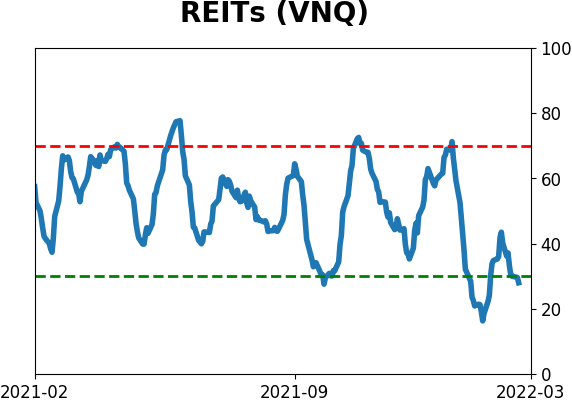
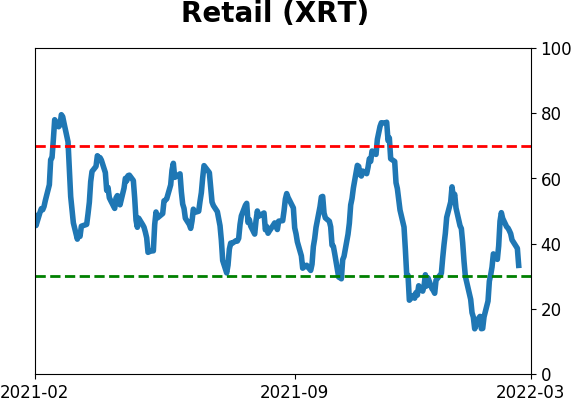
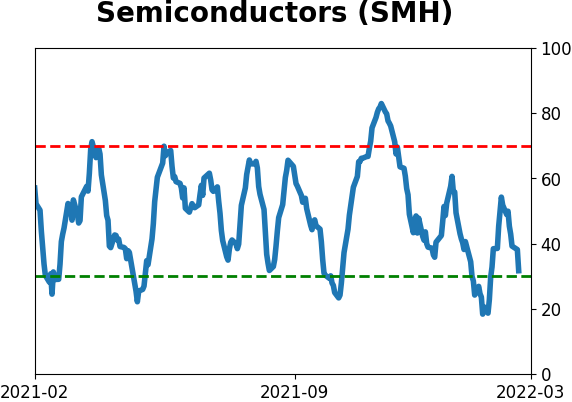
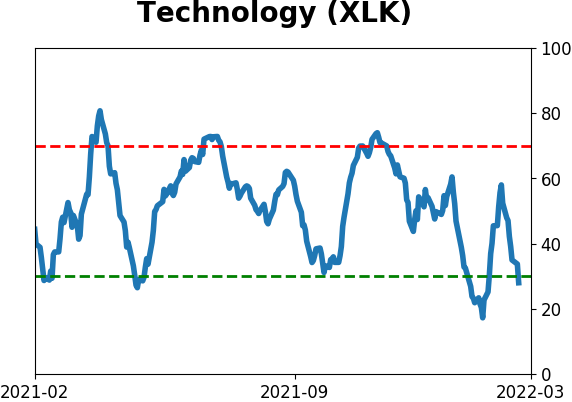
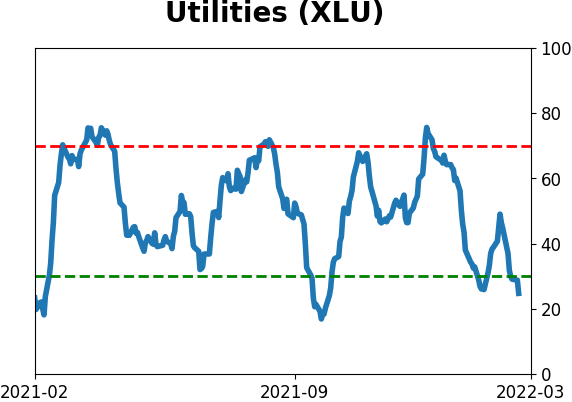
Sector ETF's - 10-Day Moving Average
|
|
|
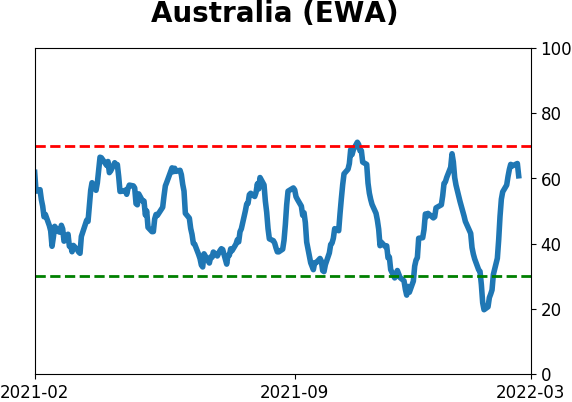
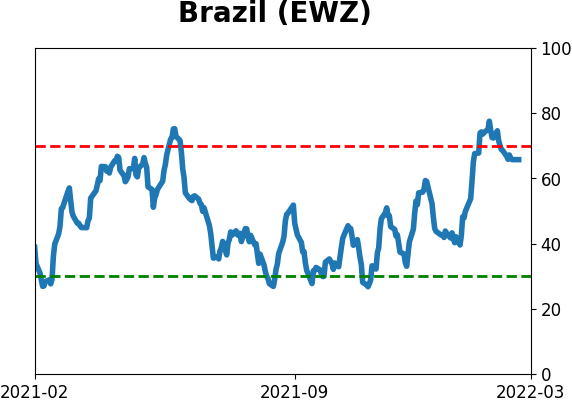
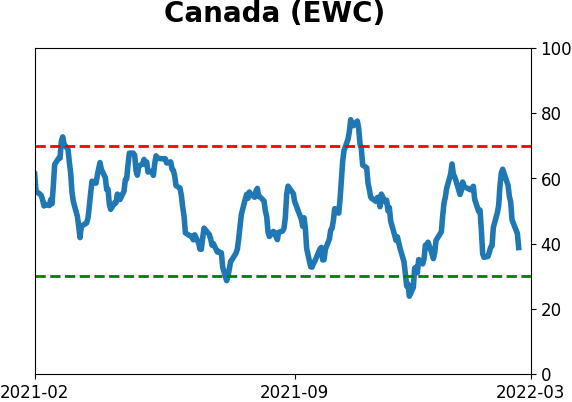
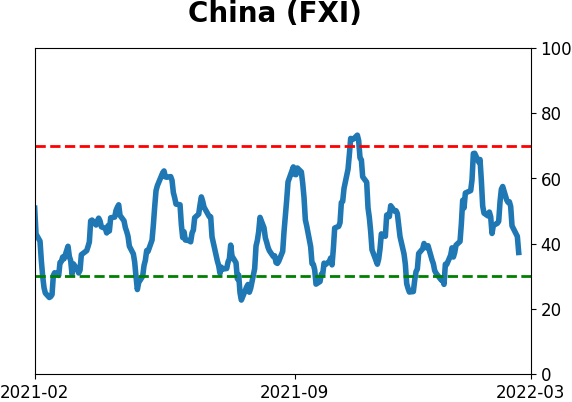
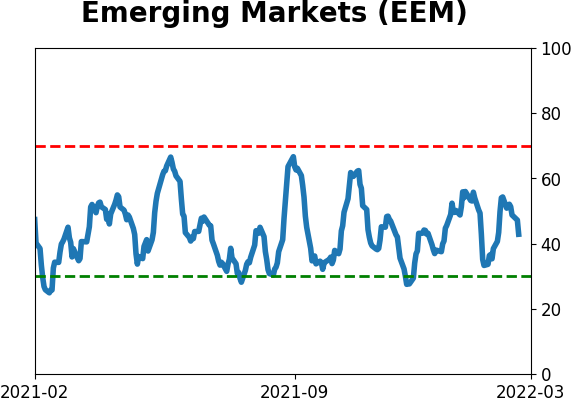
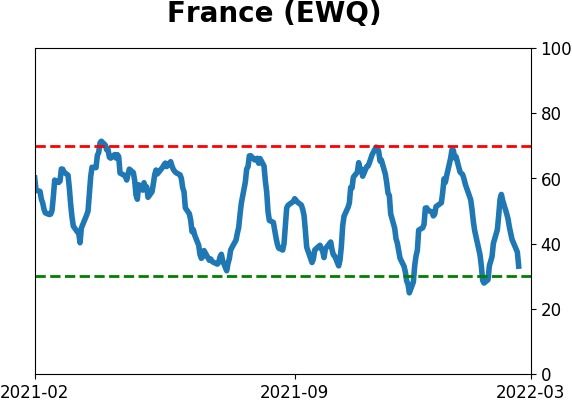
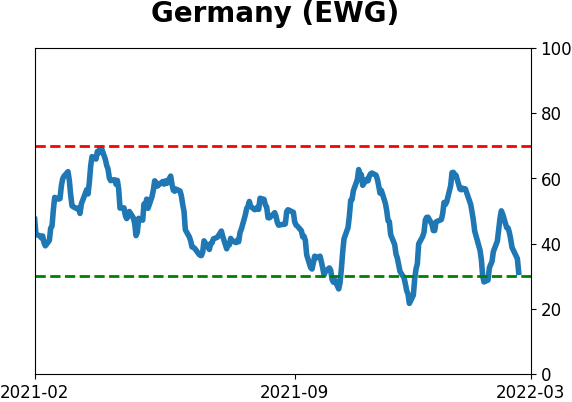
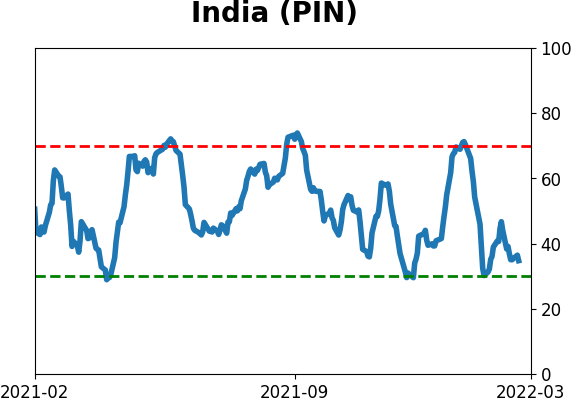
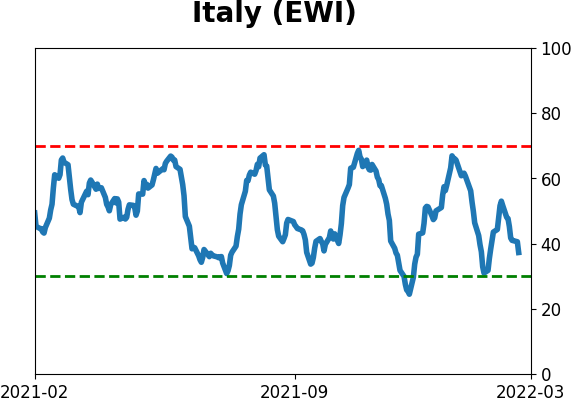
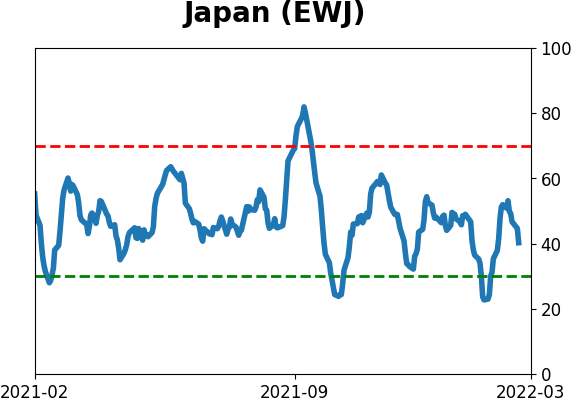
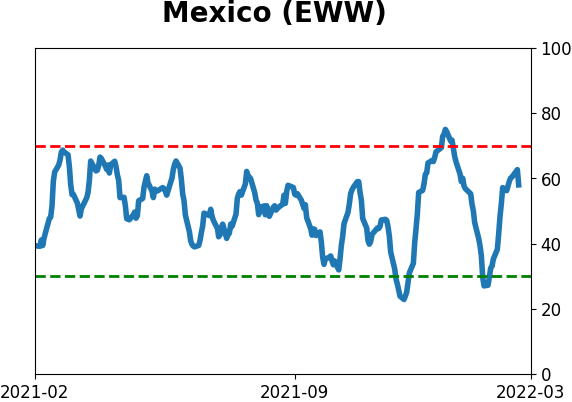
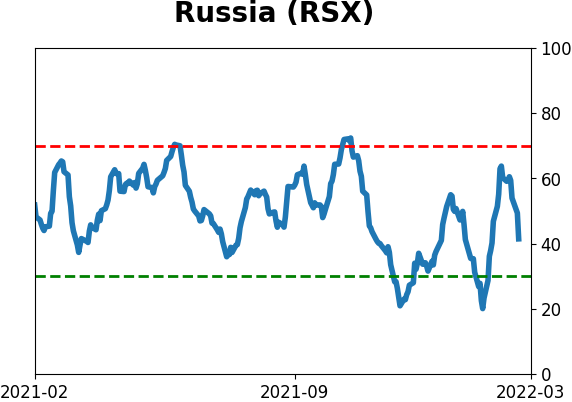
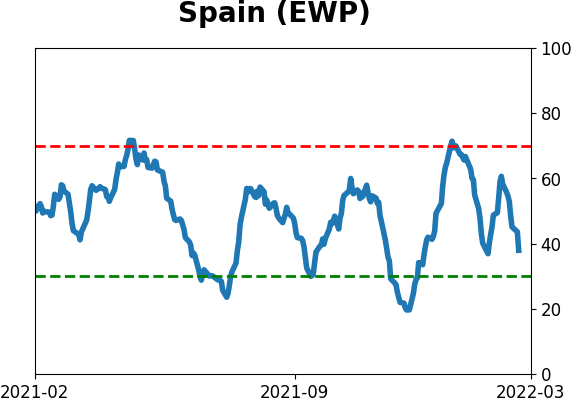
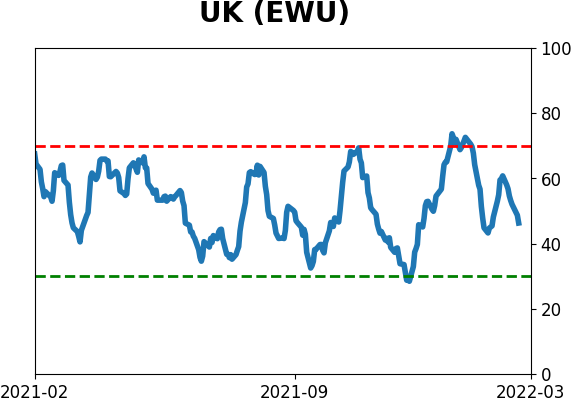
Country ETF's - 10-Day Moving Average
|
|
|
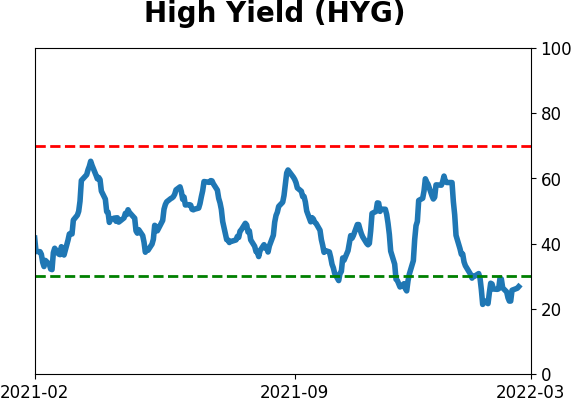
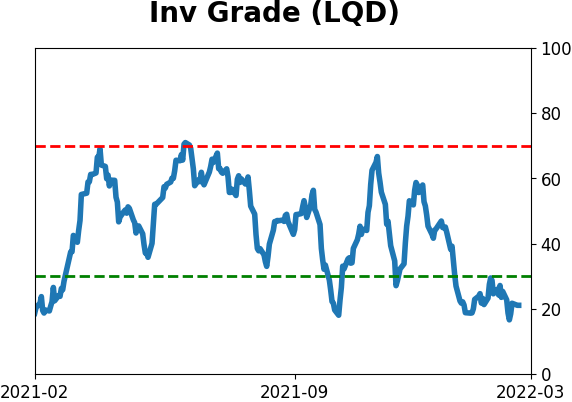
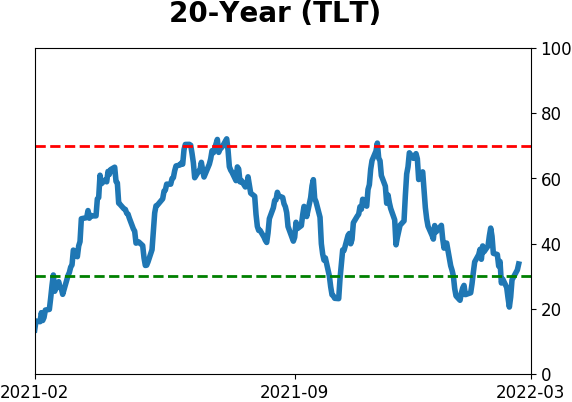
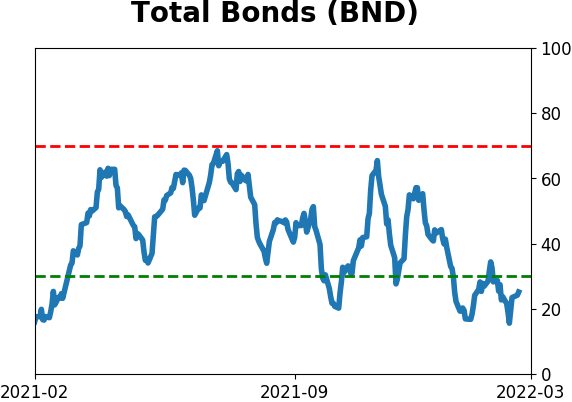
Bond ETF's - 10-Day Moving Average
|
|
|
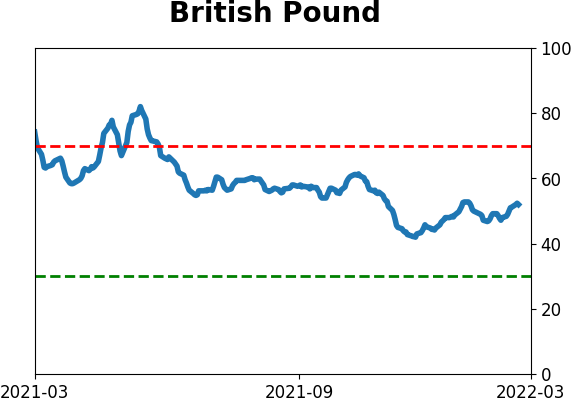
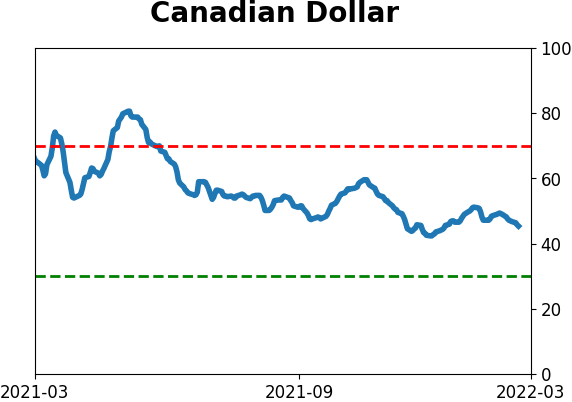
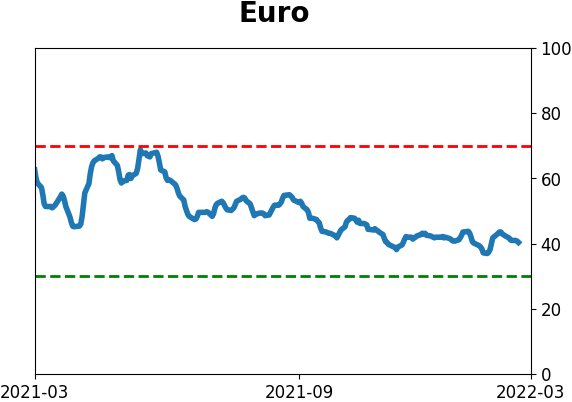
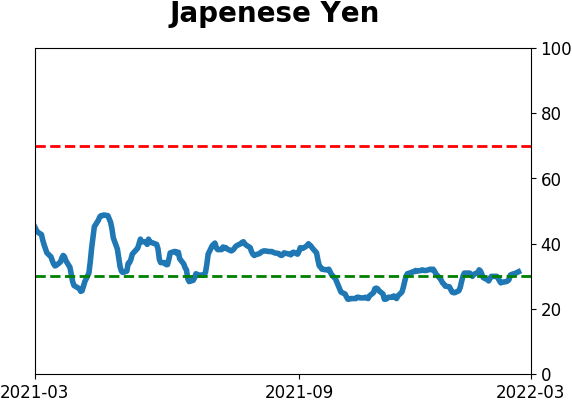
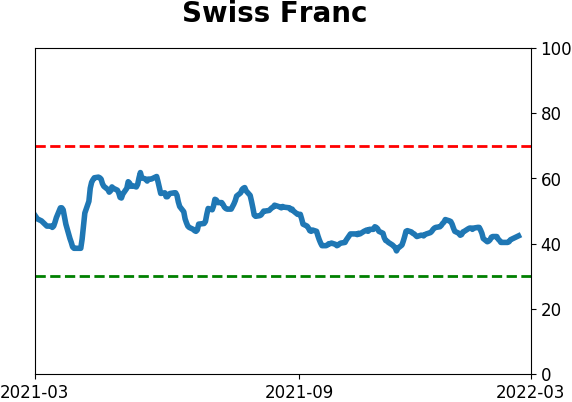
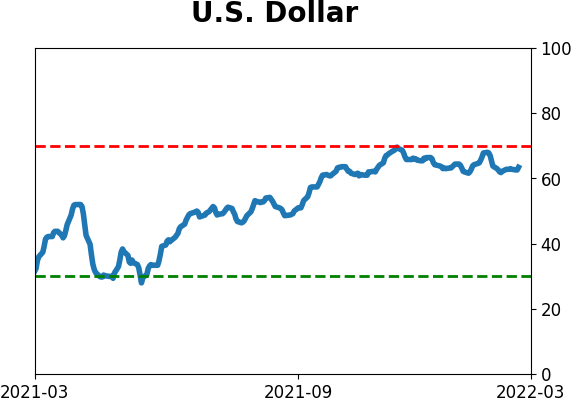
Currency ETF's - 5-Day Moving Average
|
|
|
Commodity ETF's - 5-Day Moving Average
|
|