Headlines
|
|
Real Gross Domestic Income - another misinterpreted economic indicator:
Pundits love to spread fear on social media. Post a data series, imply that "this occurred near The Great Depression" or "The Great Financial Crisis, etc." and leave it at that. But when things get quantified, the picture often looks quite different. Take Real Gross Domestic Income, for example.
|
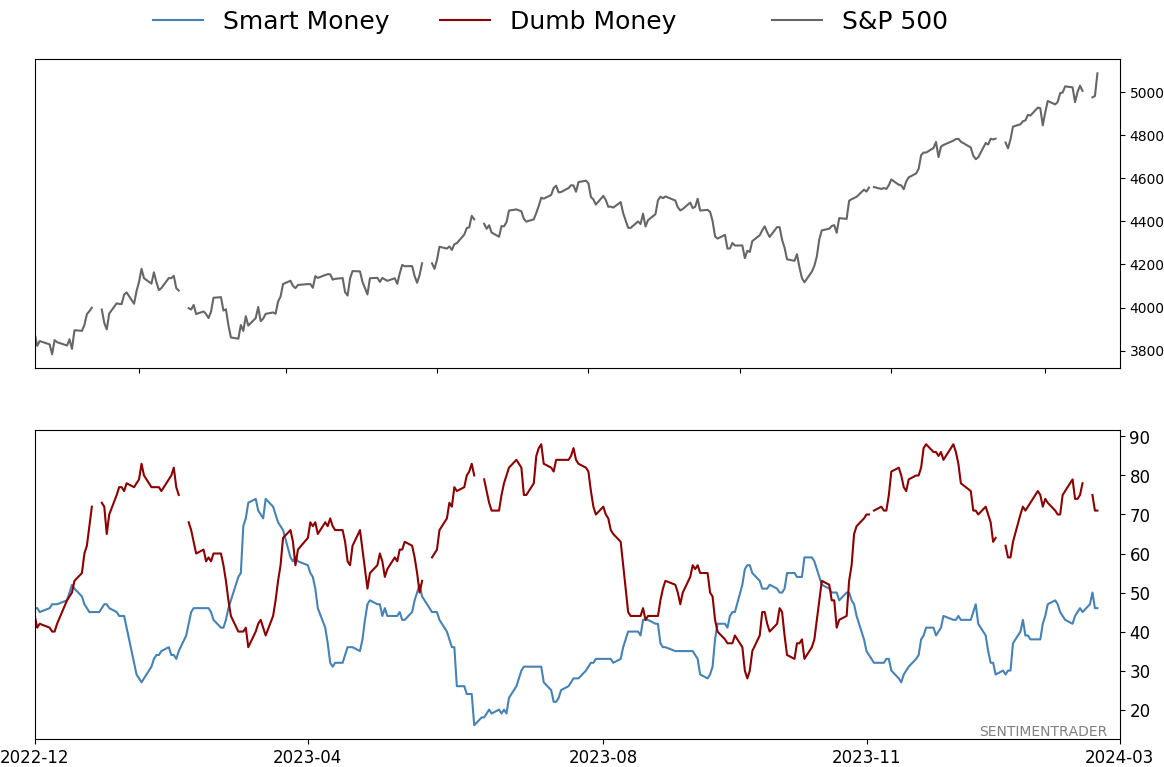
Smart / Dumb Money Confidence
|
Smart Money Confidence: 46%
Dumb Money Confidence: 71%
|
|
Risk Levels
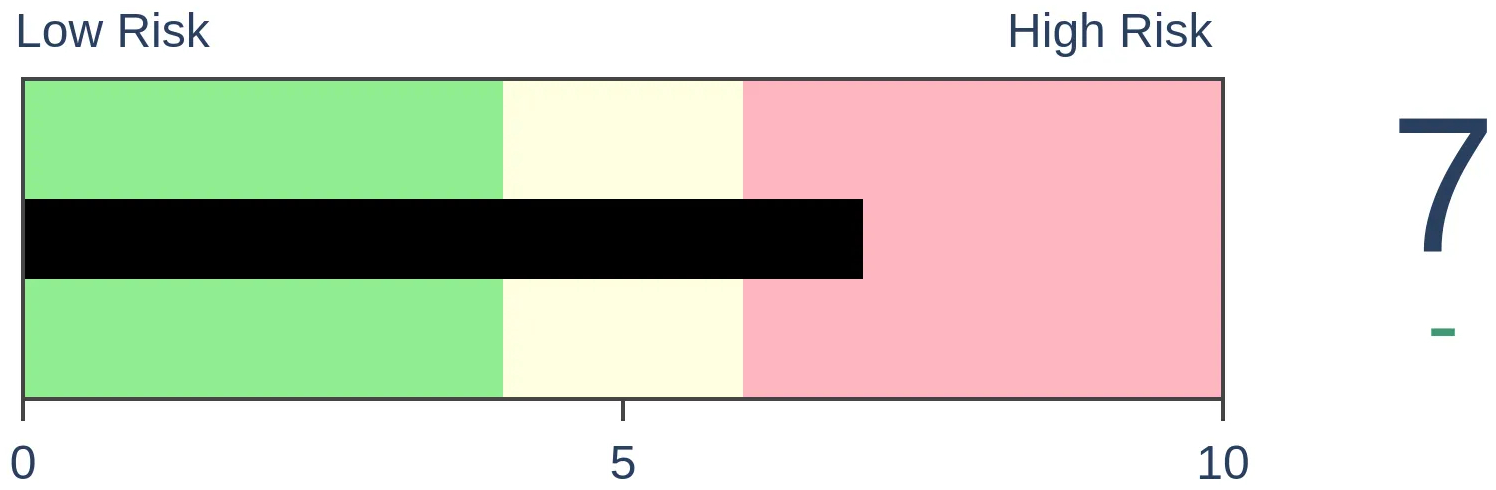
Stocks Short-Term
|
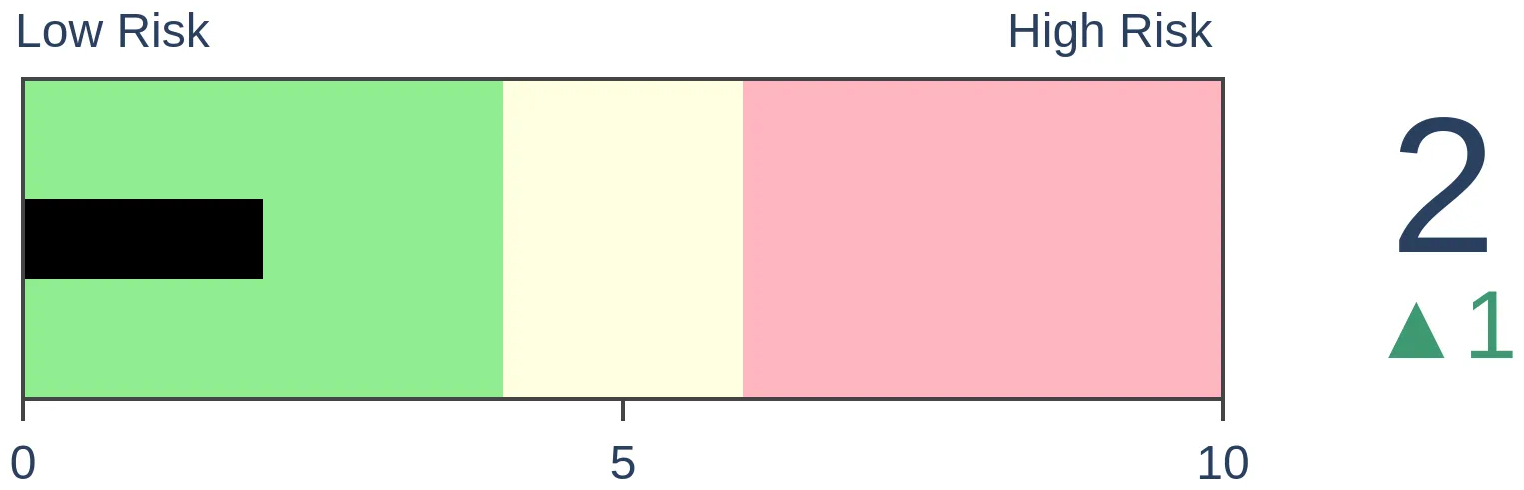
Stocks Medium-Term
|
|
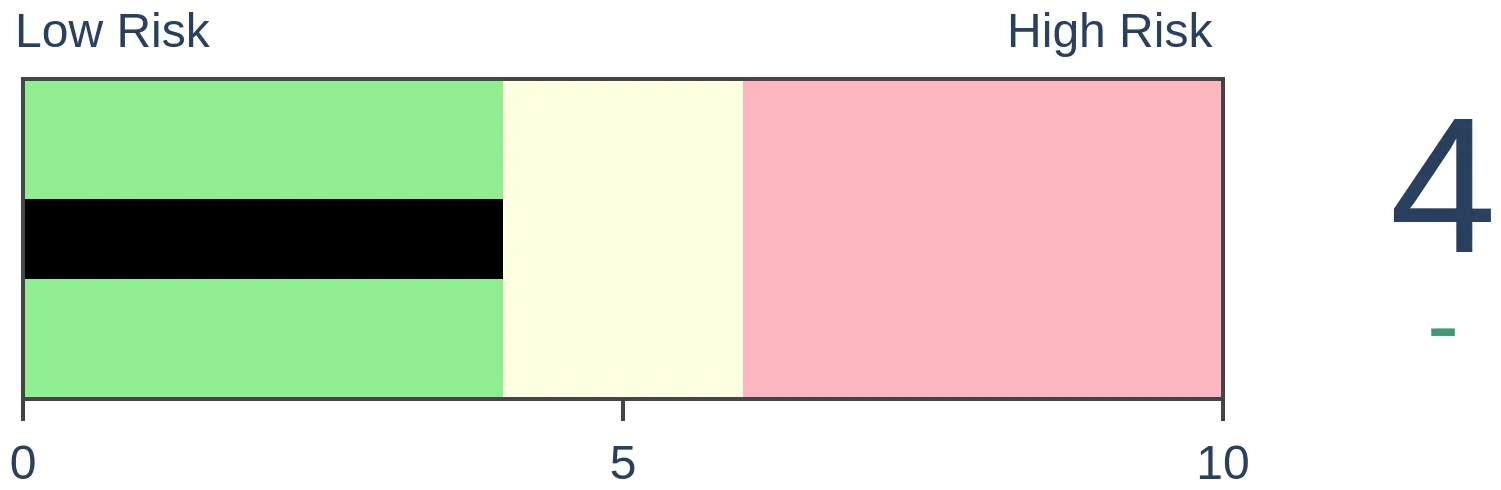
Bonds
|
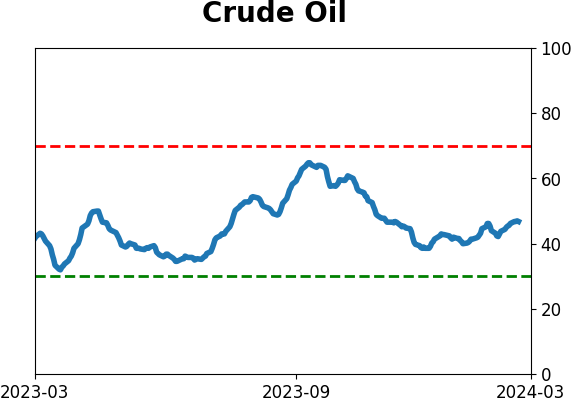
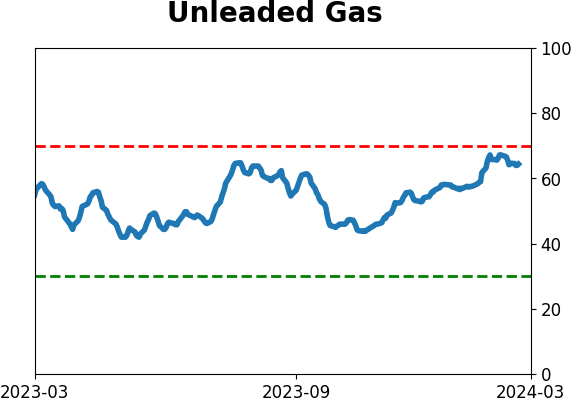
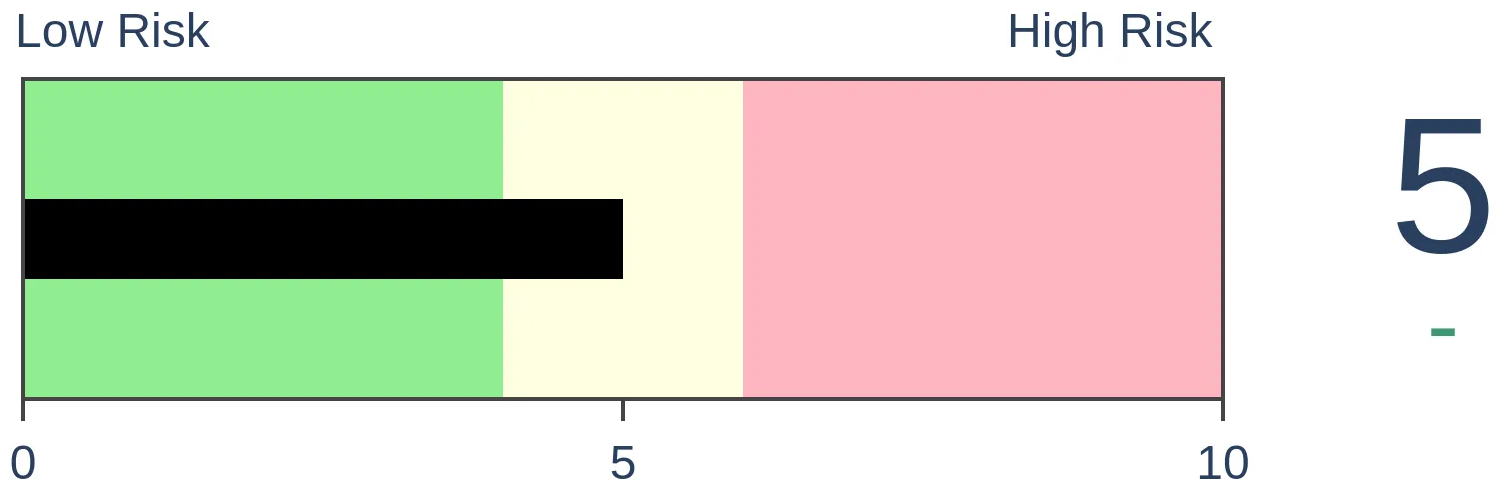
Crude Oil

|
|
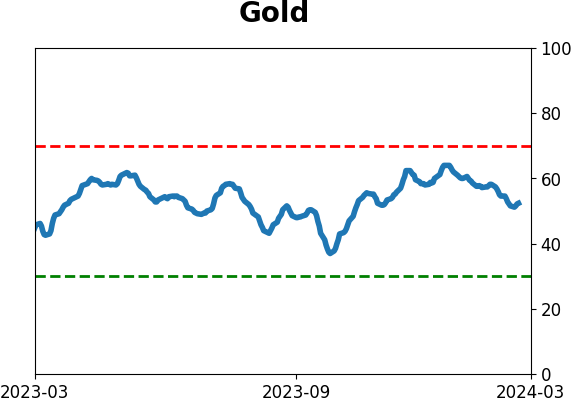
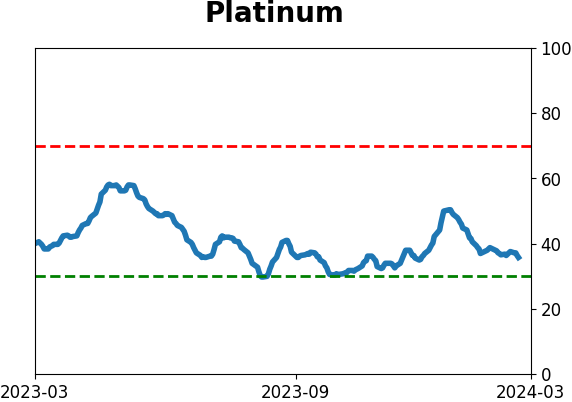
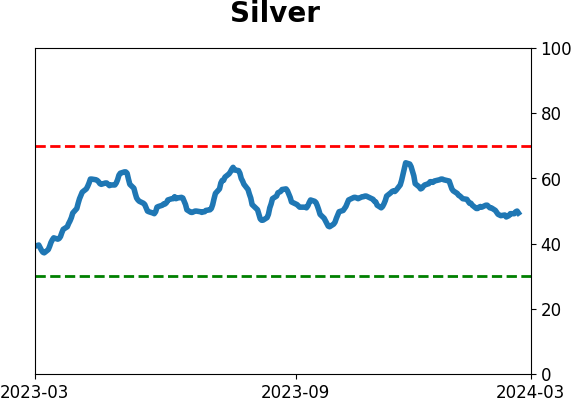
Gold
|
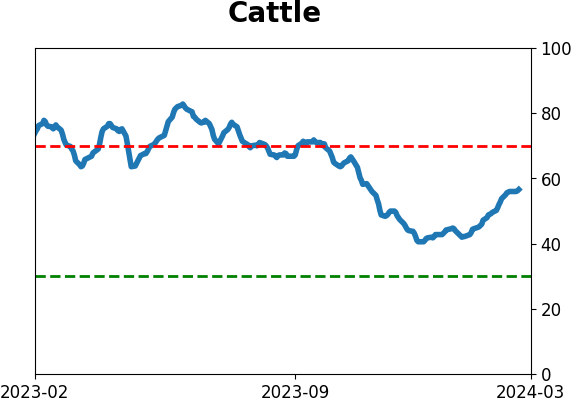
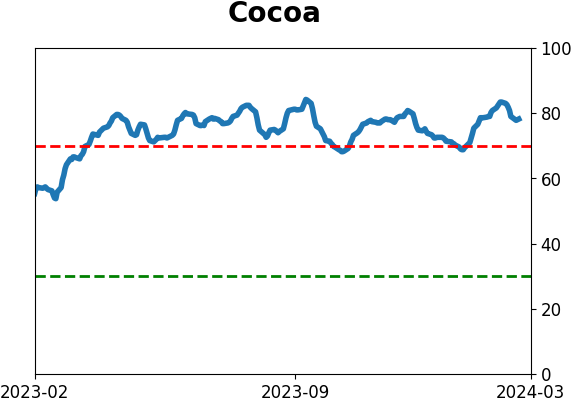
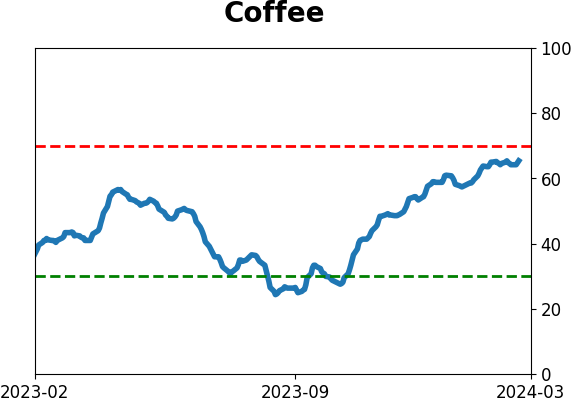
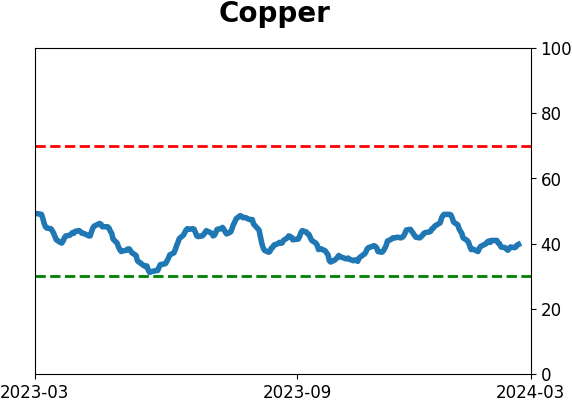
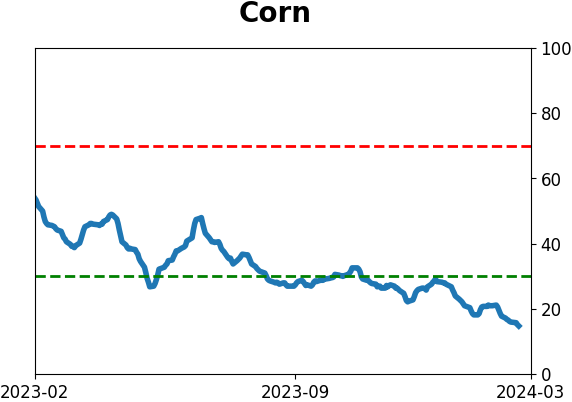
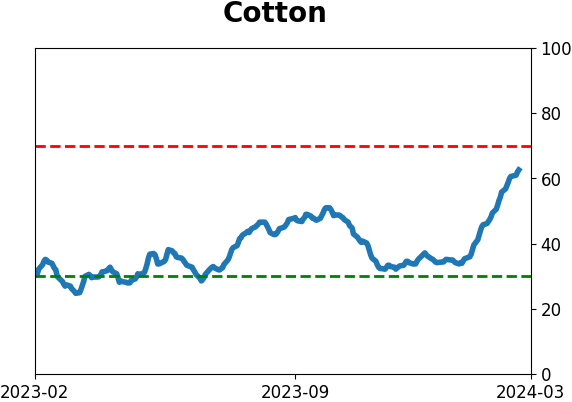
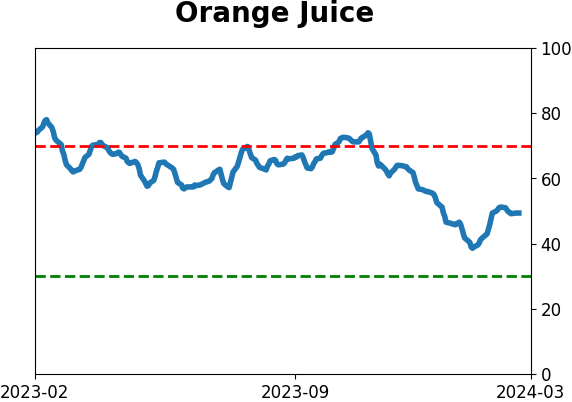
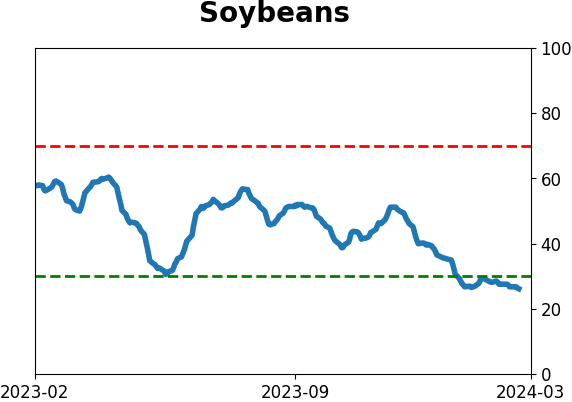
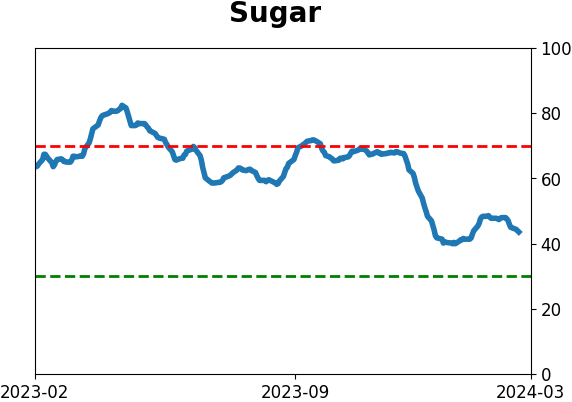
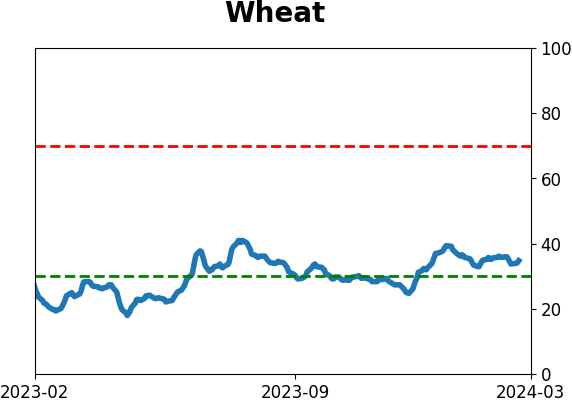
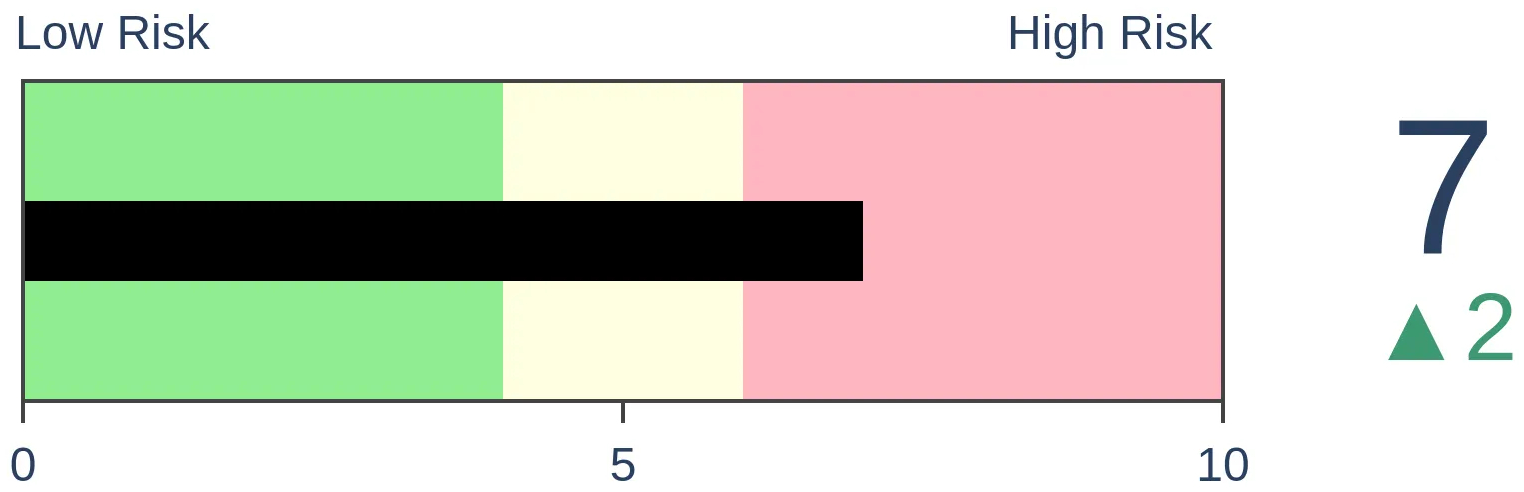
Agriculture
|
|
Research
By Jay Kaeppel
BOTTOM LINE
Pundits love to spread fear on social media. Post a data series, imply that "this occurred near The Great Depression" or "The Great Financial Crisis, etc." and leave it at that. But when things get quantified, the picture often looks quite different. Take Real Gross Domestic Income, for example.
FORECAST / TIMEFRAME
None
|
Key points
- Real Gross Domestic Income (RGDI) is a broad measure of economic activity
- The 12-month change in RGDI fell to negative in the most recent quarter, eliciting howls of gloom and doom on social media
- An objective, quantitative look at history (Hi, we're Sentimentrader.com) paints a very different picture
Real Gross Domestic Income (RGDI)
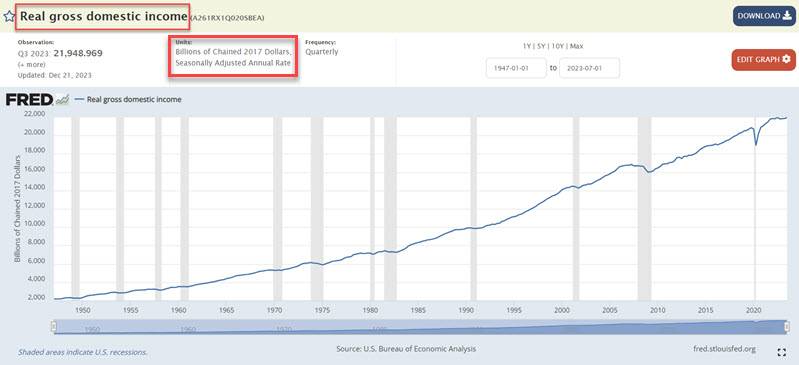
Gross domestic income is an alternative way of measuring the nation's economy. Real Gross Domestic Income (RGDI) measures the income earned and the costs incurred in producing gross domestic product.
This data series is reported quarterly with a good deal of lag. For example, the results for Q3 of 2023 were reported on 2023-12-21. So, this is not exactly a "hot read" of the economy or a precision market timing tool (although it does have some value in that regard, as we will see). The chart below displays the cumulative values for the index since 1948.
The chart below looks at the 12-month percentage rate-of-change in the indicator. Note that the latest 12-month change is negative.
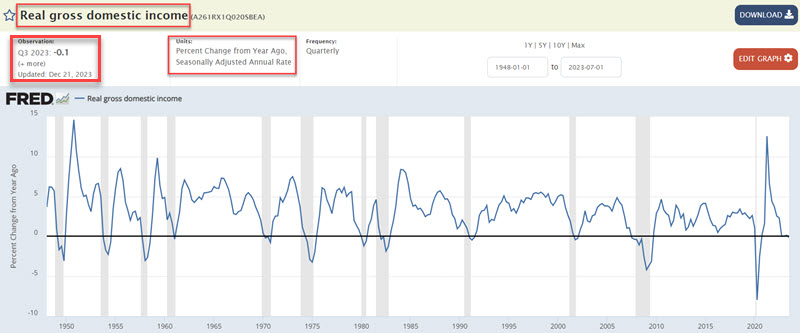
One of the most common uses of social media these days is to present a chart, declare - or at least imply - that it represents something terrible and that everyone should be fearful, and leave it at that.
The chart above recently made the rounds in such a manner, with the presenters highlighting that declines into negative territory have "always occurred around recessions," which technically is true - Queue the scary music! The latest reading reported in December 2023 represents the 13th decline below zero in the 12-month change for Real Gross Domestic Income.
So, should we panic? As always, we report, you decide.
Baseline S&P 500 quarterly performance
For our test, we examine results at the end of each quarter, regardless of when the data was actually reported. For example, the latest negative RGDI reading was reported on 2023-12-21. However, we evaluate results starting at the end of the quarter, i.e., on 2023-12-31.
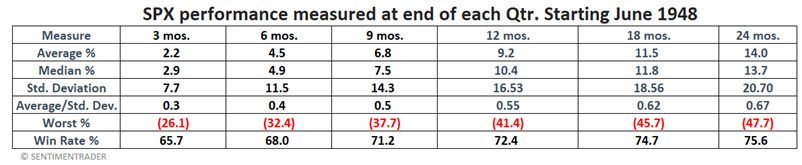
To establish a baseline, we started the test on 1948-06-30. At the end of each quarter, we measured the S&P 500 performance 3, 6, 9, 12, 18, and 24 months later. The average S&P performance (i.e., our baseline) measured at the end of each quarter since June 1948 appears in the table below.
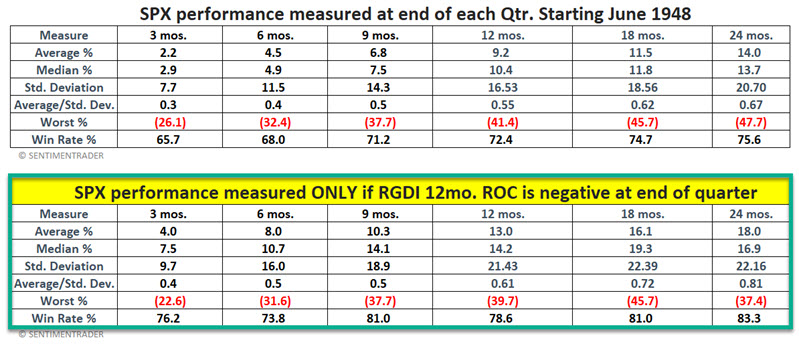
Now that we know what "average" looks like, let's look at stock market performance only following those quarters when Real Gross Domestic Income was negative over the last 12 months. Using the same starting point, we accumulated S&P 500 performance results only at the end of those quarters when the 12-month % change in RGDI was negative. Below, we display:
- Baseline results (same as above) on top
- Results for negative end-of-quarter readings on the bottom
To get to the point, the table below subtracts baseline results (i.e., the average results for All Quarters) from those for only quarters when RGDI ended negative for the previous 12 months). These results appear in the table below.
The critical thing to note is that results were somewhat better for every measure following quarters when the RGDI 12-month change was negative.
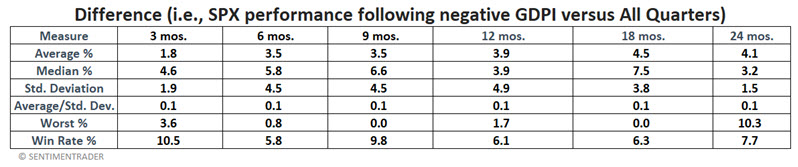
The bottom line: The implication that a 12-month decline in Real Gross Domestic Income is a sign of impending doom is inaccurate. That said, it is also not 100% false.
S&P 500 when RDPI is negative
The table below displays S&P 500 performance following each quarter since 1948 when the 12-month change for RGDI was negative.
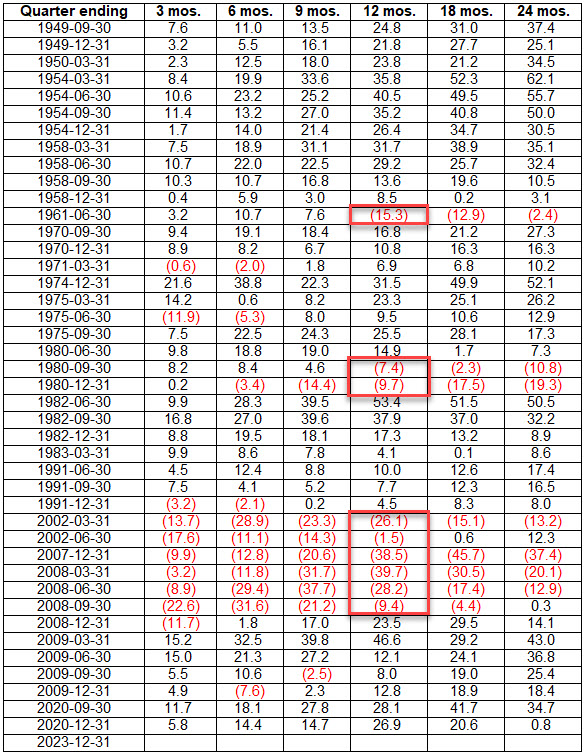
Signals in 1961, 1980, 2002, and 2007-08 saw the S&P 500 lower 12 months later. So, while probabilities favor better than average market performance following a negative end-of-quarter reading, better results are not guaranteed.
The problem is that pundits like to show 2000-2002 and 2007-2009 and say scary things like "THE LAST TIME THIS HAPPENED WAS DURING THE DOTCOM BUBBLE AND THE GREAT FINANCIAL CRISIS!!! - rather than painting the full historical pictures (which makes perfect sense if your objective is to frighten rather than inform people).
A more systematic approach
For the sake of argument (and because I can't help the way my mind works), let's attempt to create a rudimentary trading system using the data above (with the caveat that we are not recommending that it be used as a standalone trading model - only as a possible weight of the evidence tool).
Our rules are this:
- An alert occurs when the 12-month change for RGDI goes negative
- An actual signal occurs when the latest quarter 12-month change reverses higher at the end of a subsequent quarter
- When a signal occurs, we will hold the S&P 500 Index for 12 months
A couple of notes:
- Once an alert occurs, we must then wait at least three months for a reversal (although it can take longer if the subsequent quarterly values keep getting worse for a while)
- If the 12-month change once again dips lower after a signal, the original signal and 12-month holding period remain in effect (i.e., the basic strategy has no built-in stop loss provision)
- The S&P 500 holding period can be extended for 12 more months if the 12-month change once again reverses higher within 12 months of an original signal
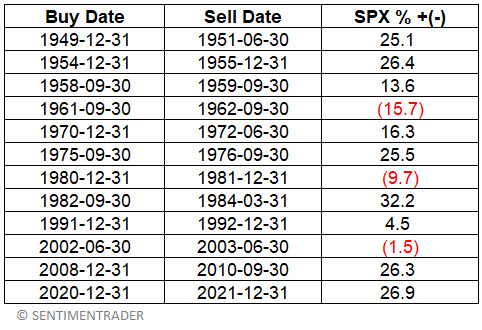
The table below displays the dates of the signals generated by the abovementioned rules and subsequent 12-month performance for the S&P 500 Index.
The chart below displays the growth of $1 invested in the S&P 500 only during the dates highlighted in the table above.
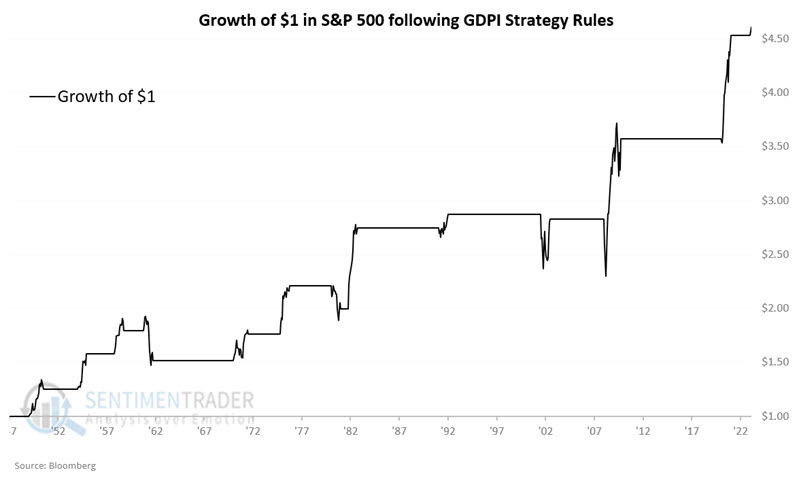
The table below summarizes the results.
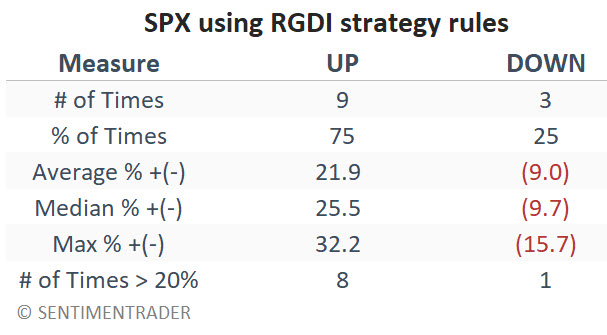
The bottom line is not exactly "precision market timing" but also not the harbinger of doom it is made out to be. Also, it's not a bad example of "making lemonade out of lemons."
What the research tells us…
A 12-month decline in Real Gross Domestic Income is not necessarily a good thing at the time it happens. However, more to the point - it is not necessarily the terrible thing it is so easily purported to be on social media. What is true is that this does tend to occur "around recessions." However, because the stock market is a discounting mechanism, in many cases, much of the damage may already be done by the time this purported "warning sign" occurs. Based on the results above, savvy investors will recognize a 12-month decline in RGDI as a sign to start "looking for an opportunity to buy" and not as a sign of impending doom.
Indicators at Extremes
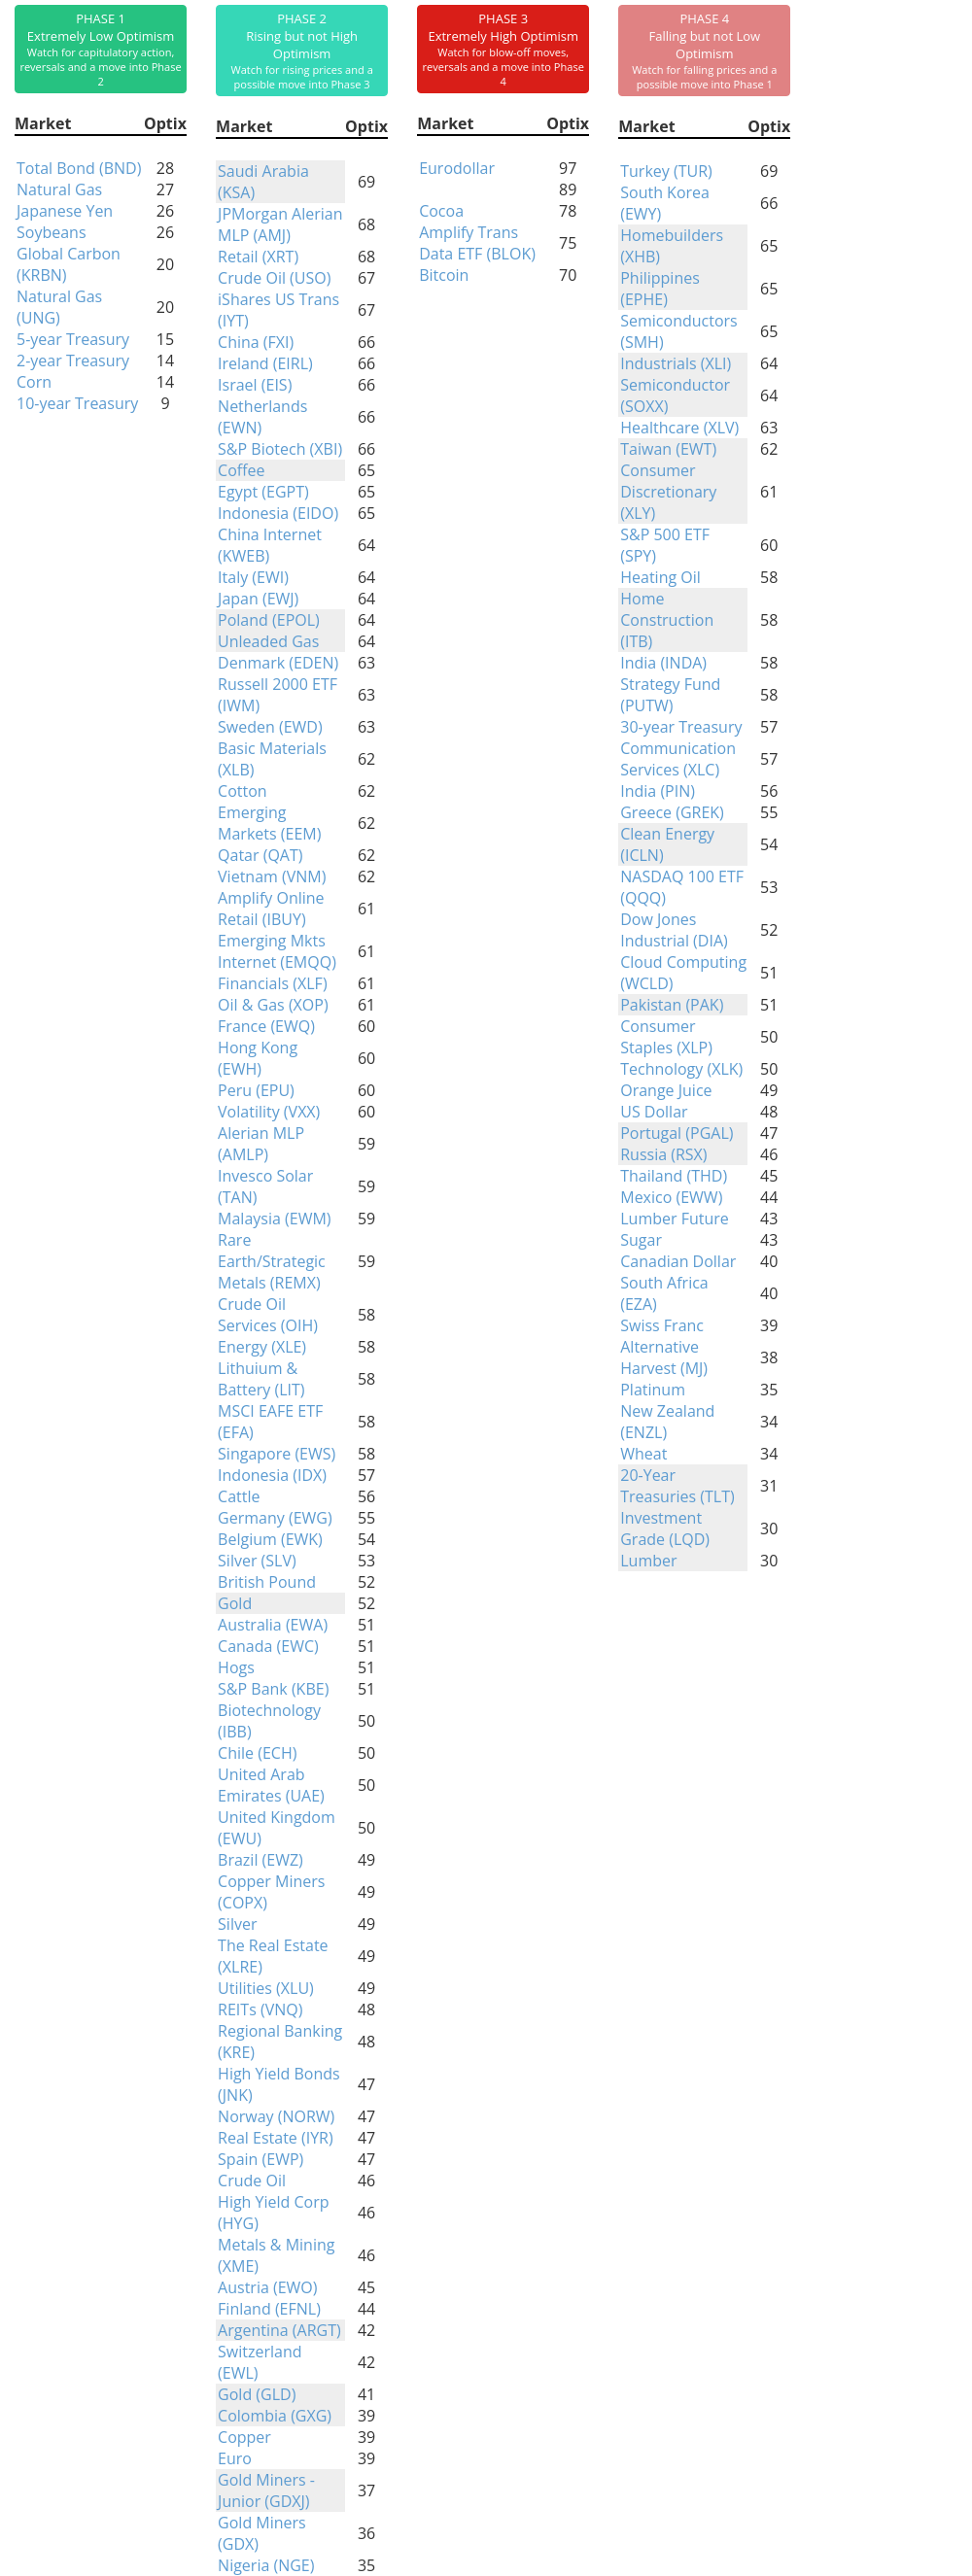
Phase Table
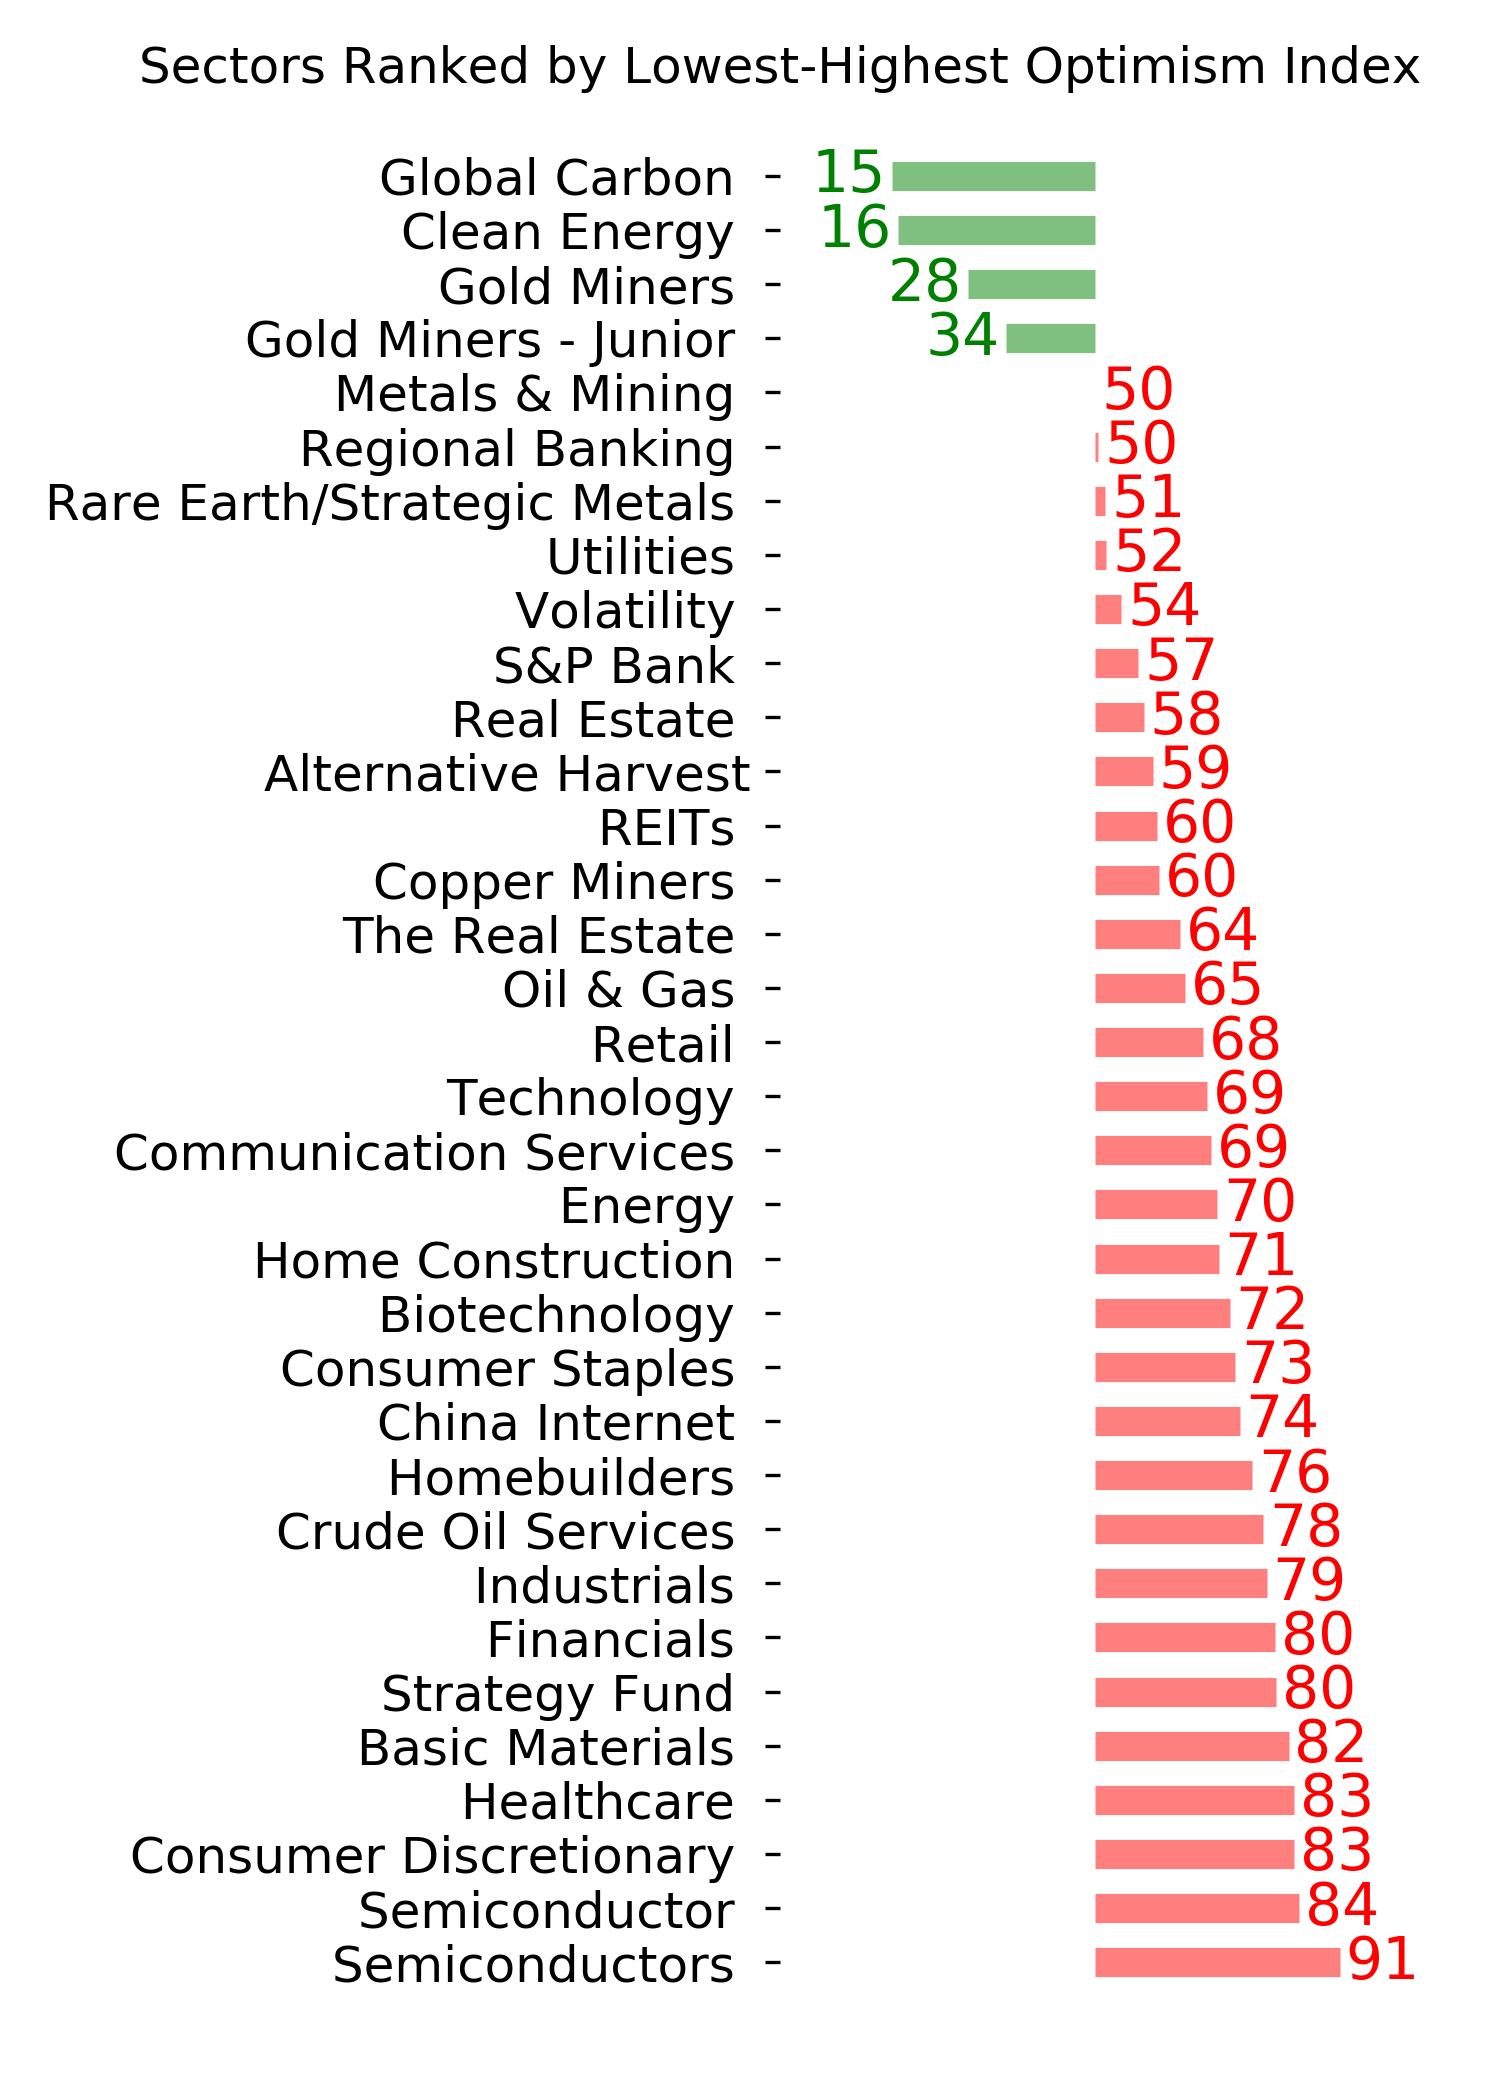
Ranks
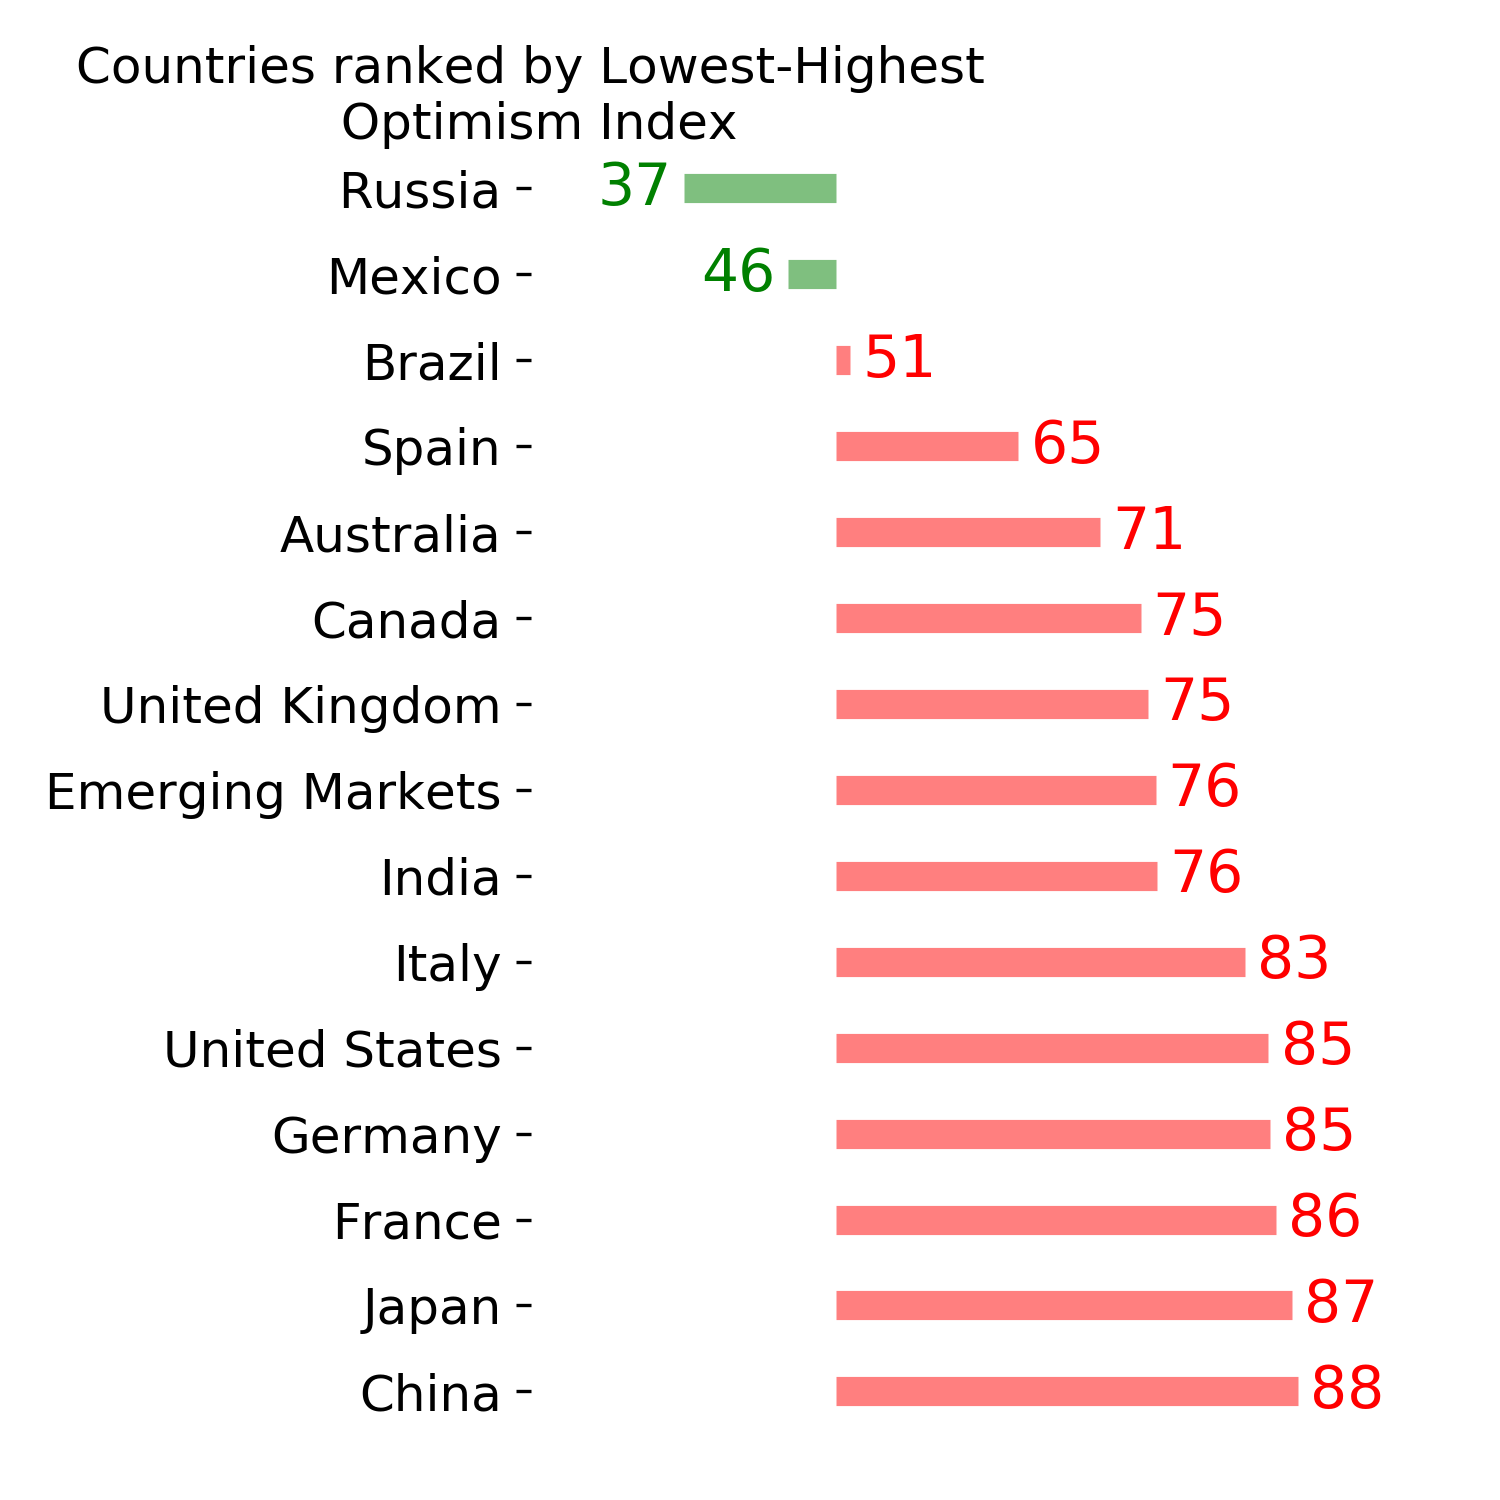
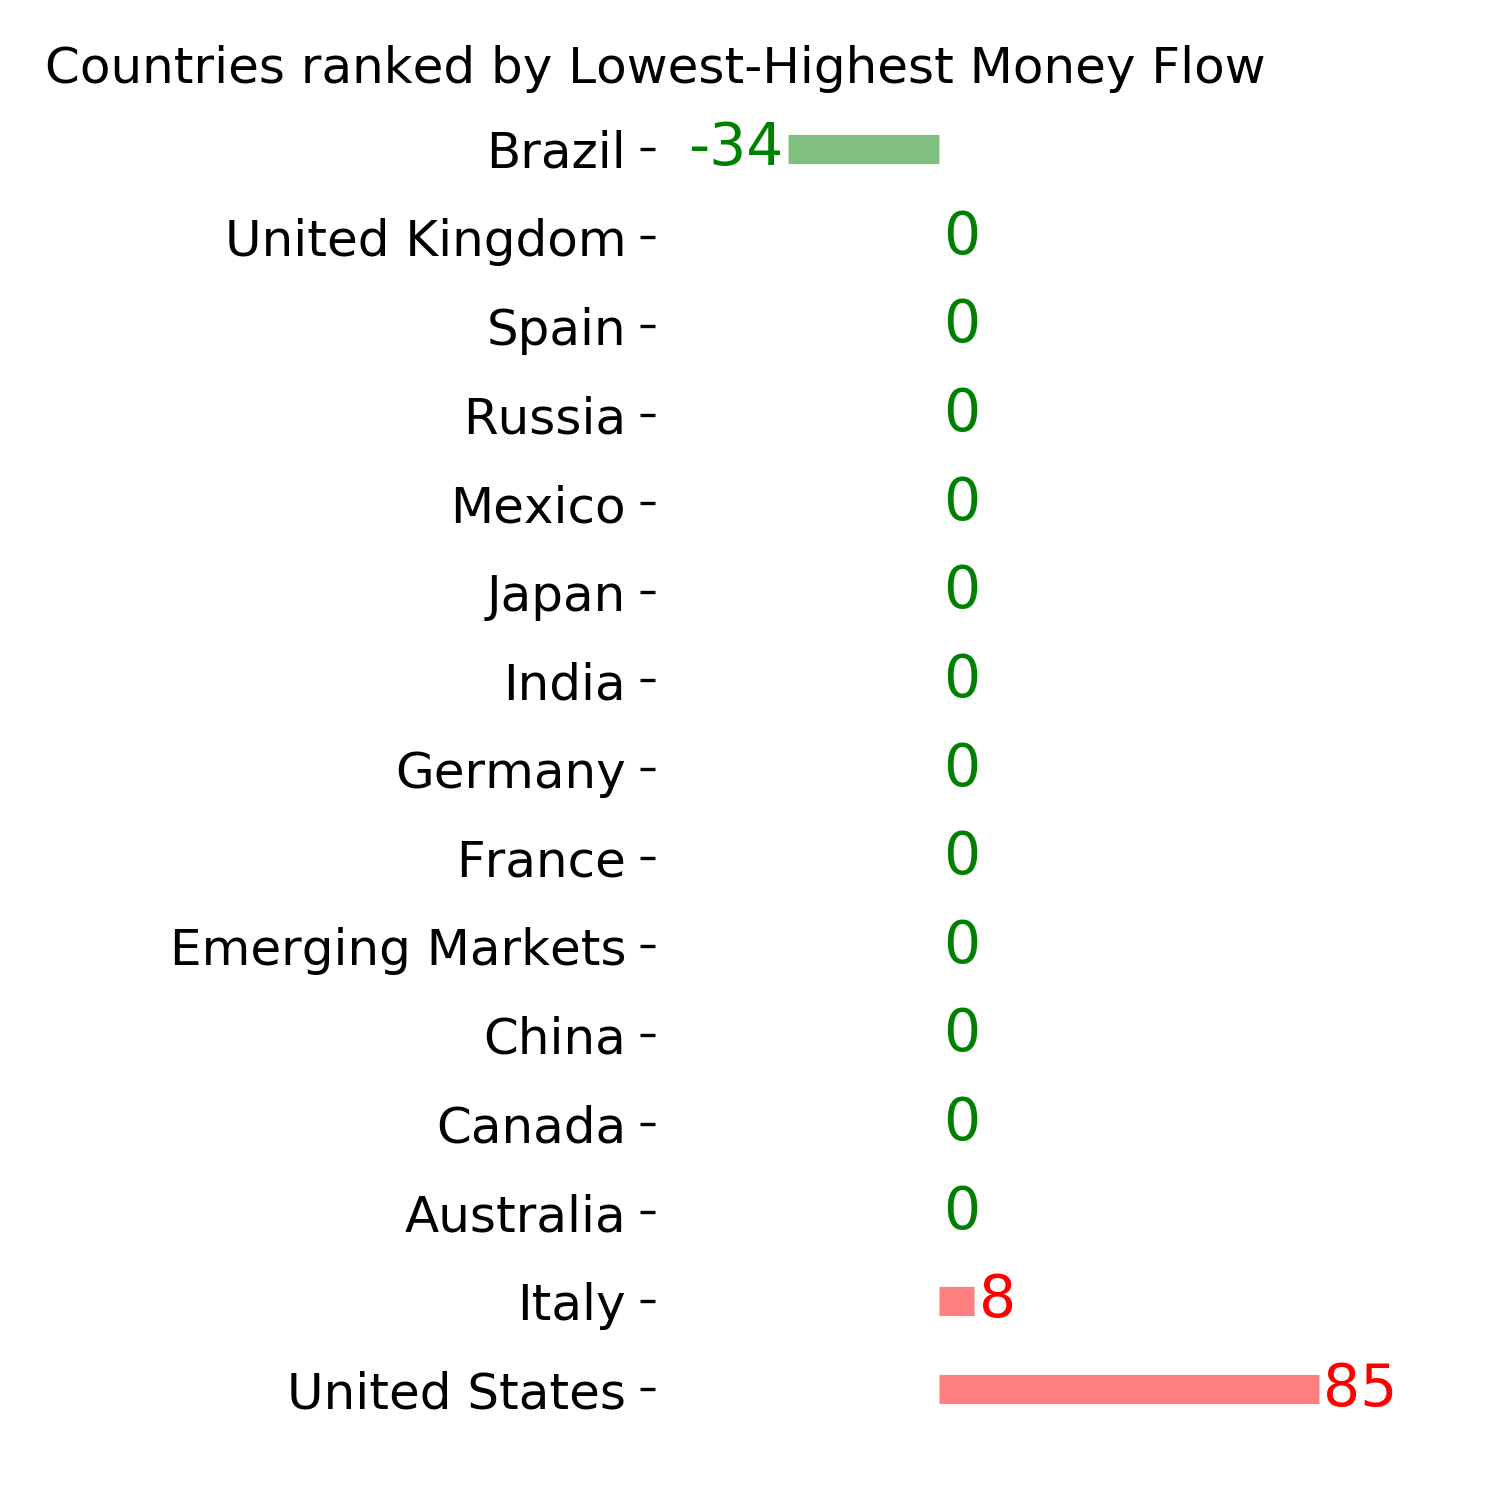
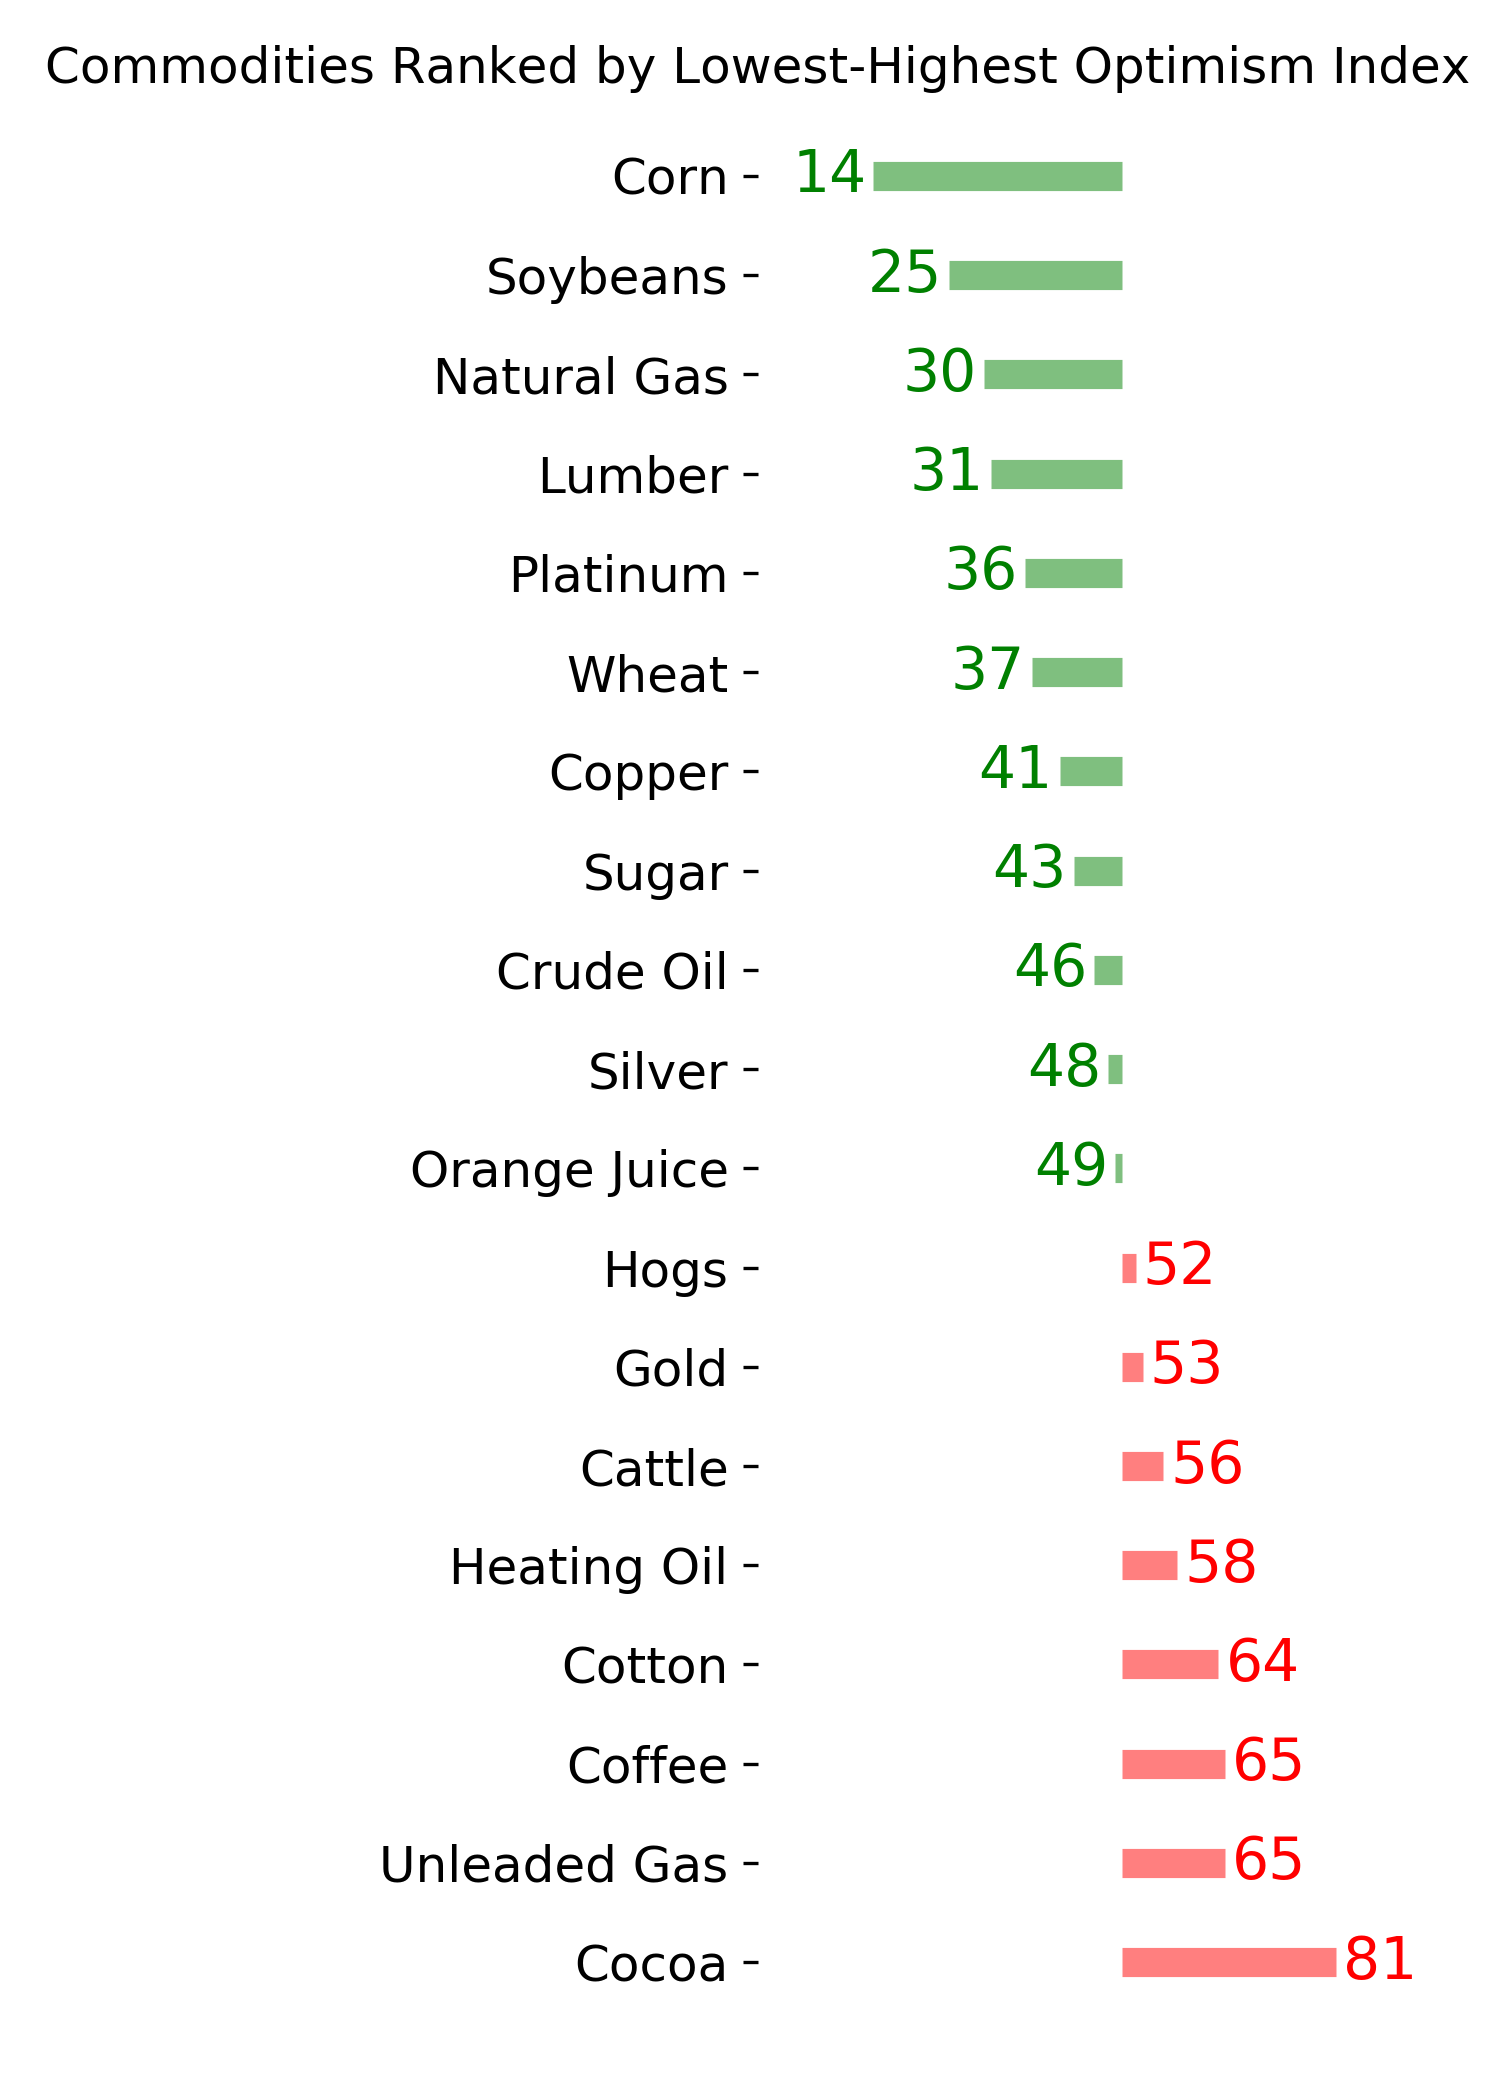
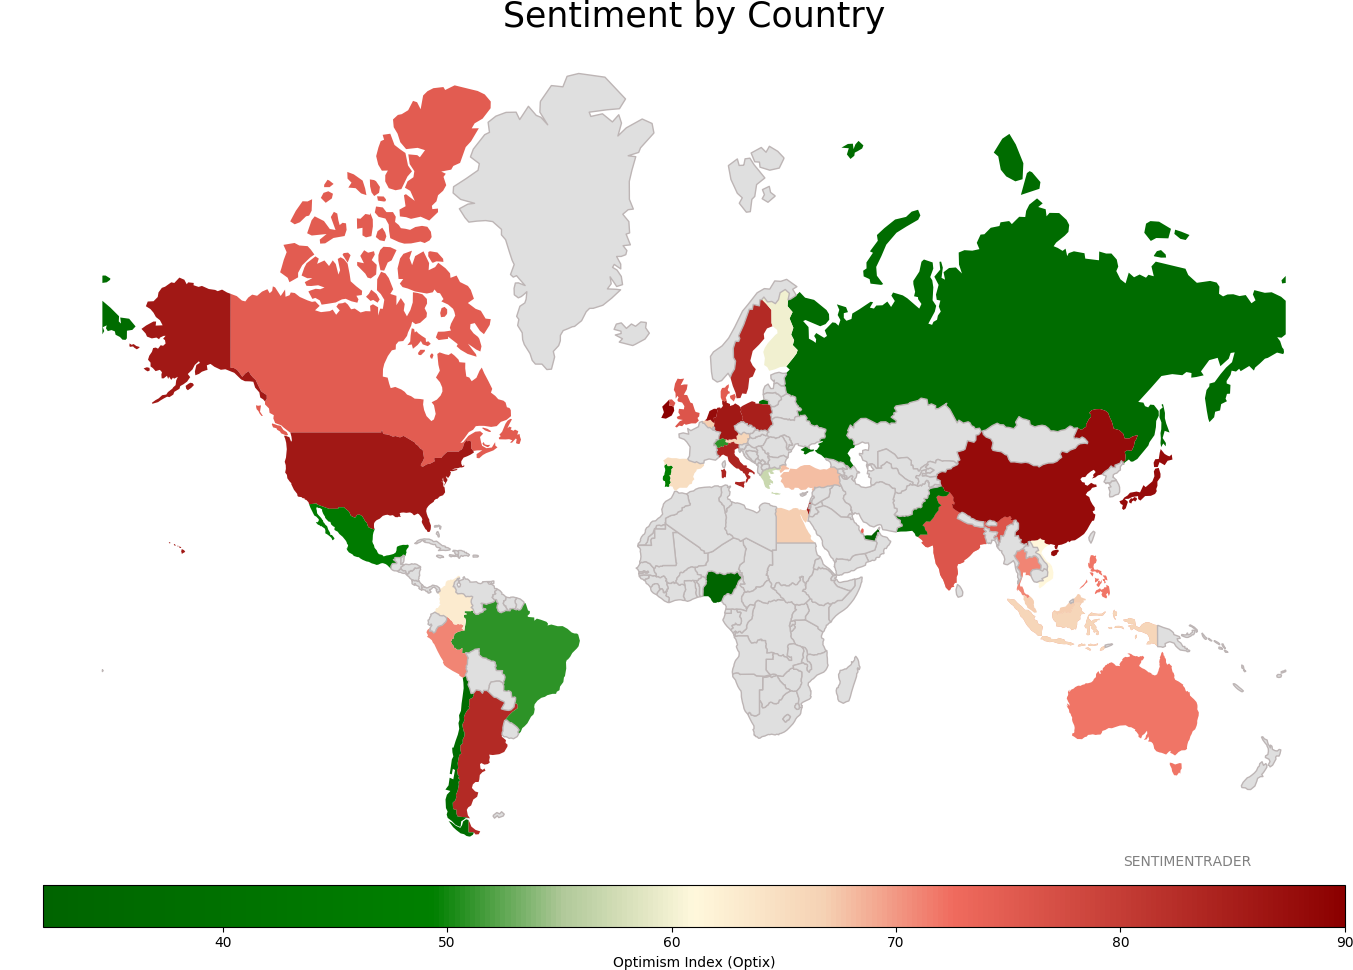
Sentiment Around The World
Optimism Index Thumbnails
|
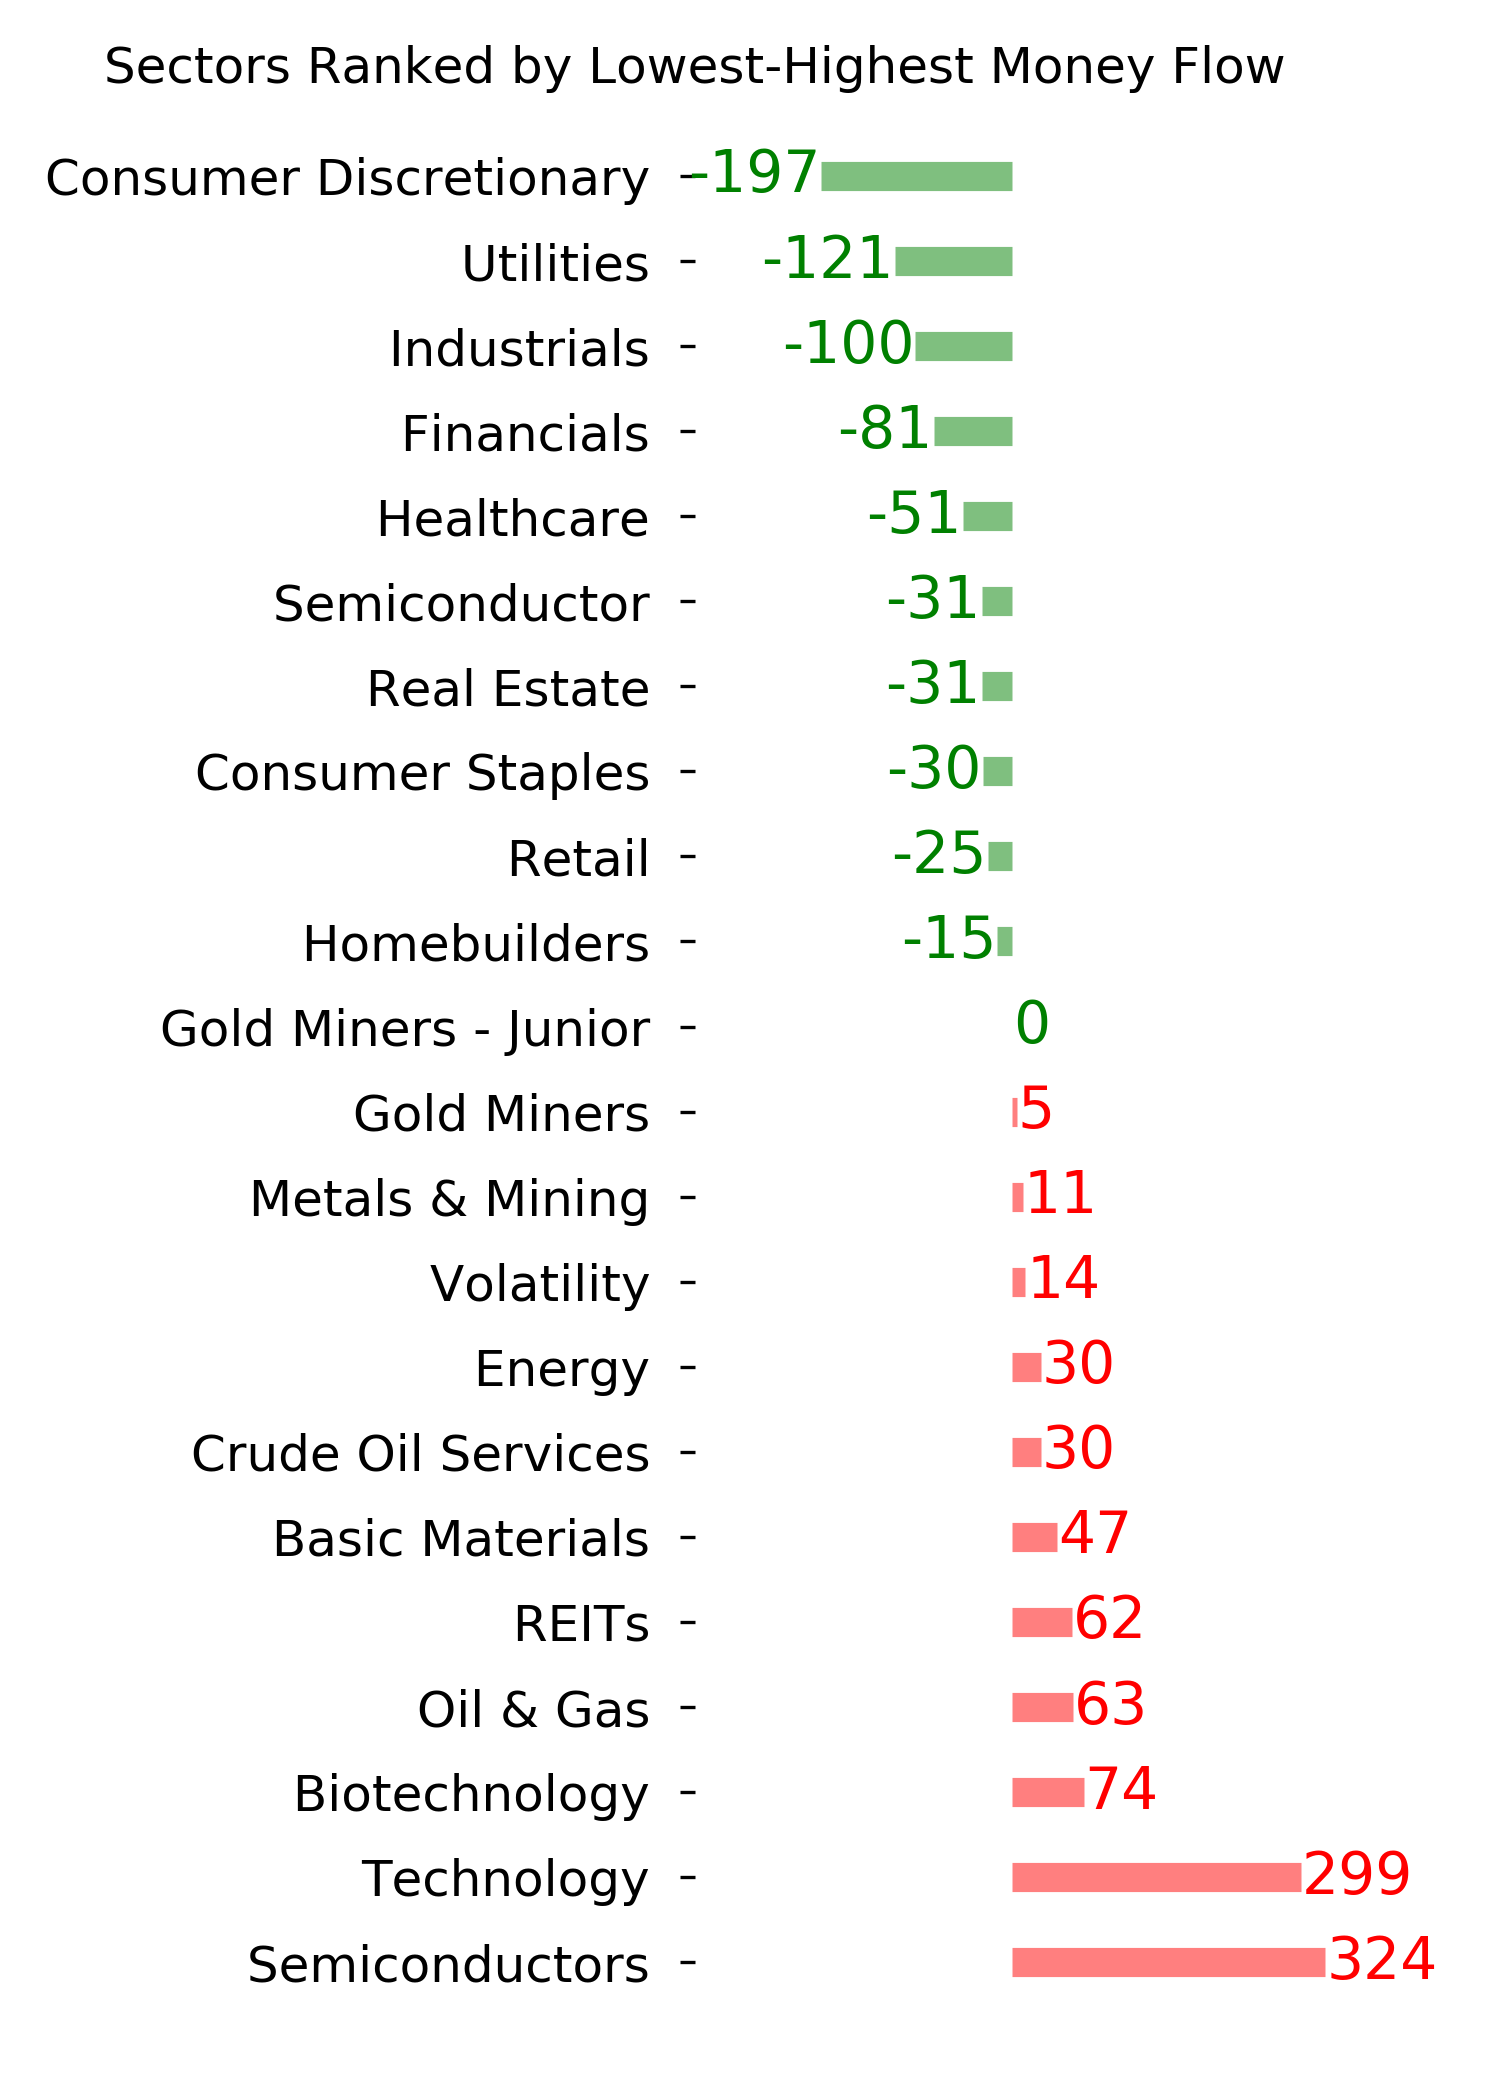
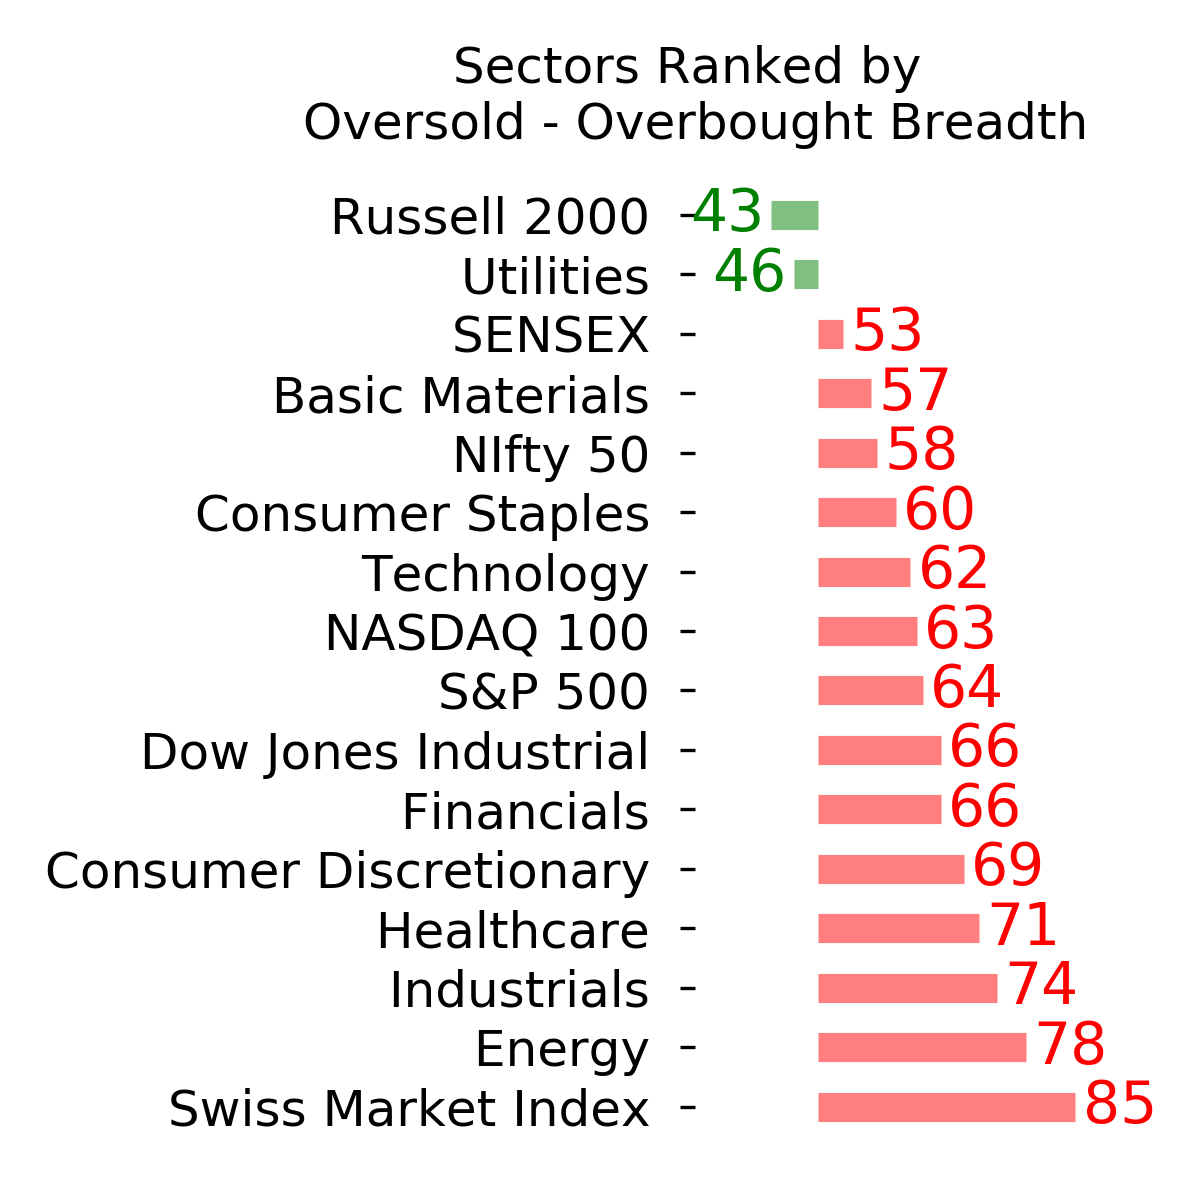
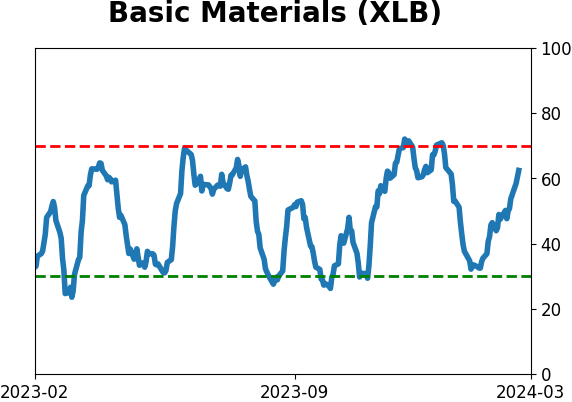
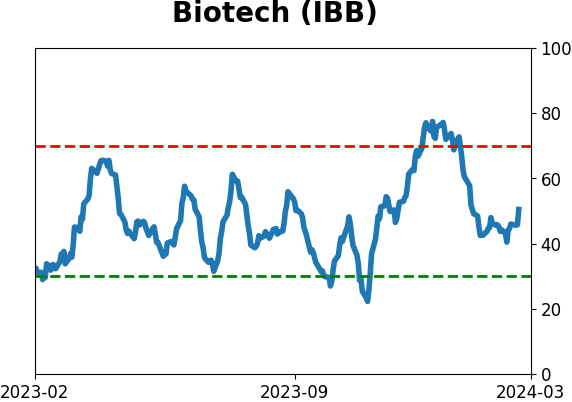
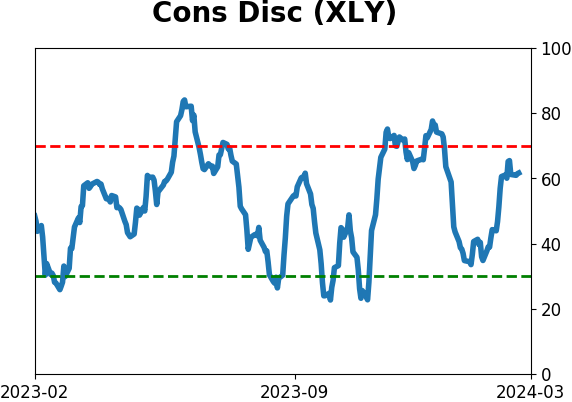
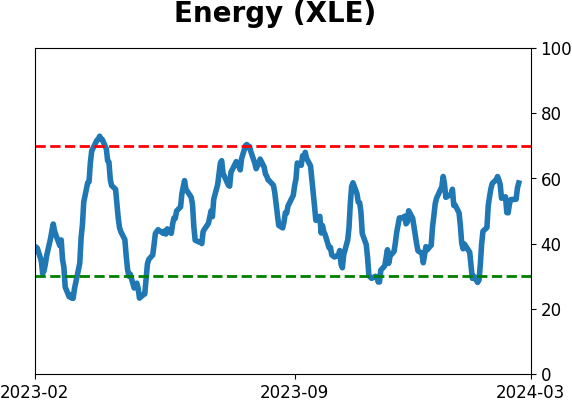
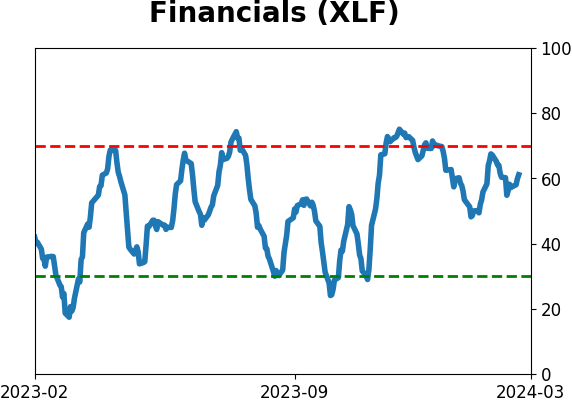
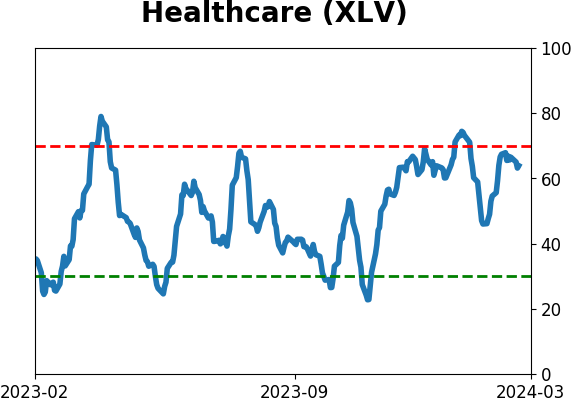
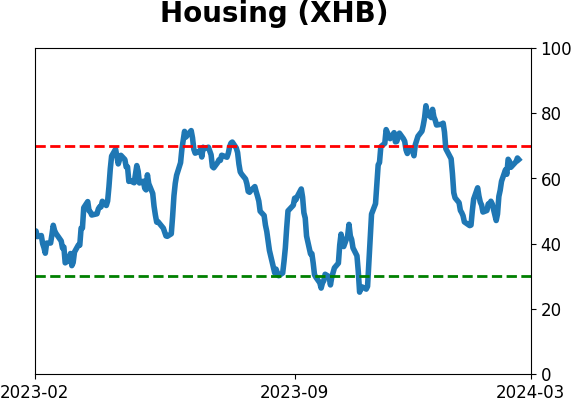
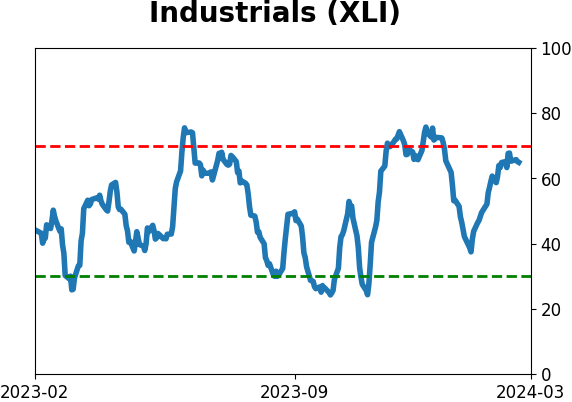
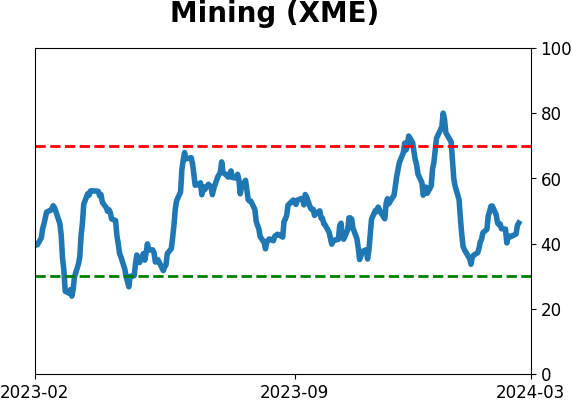
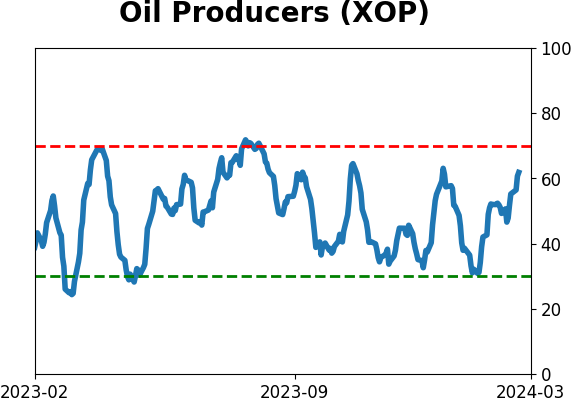
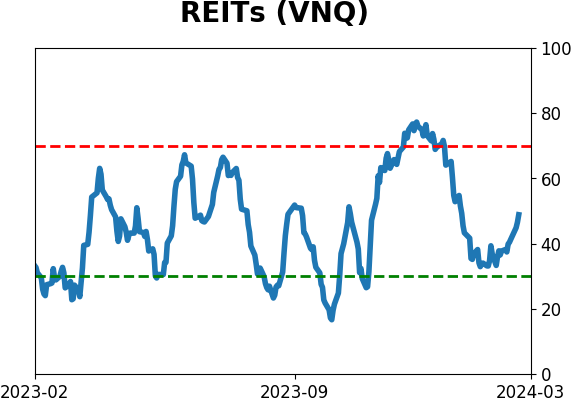
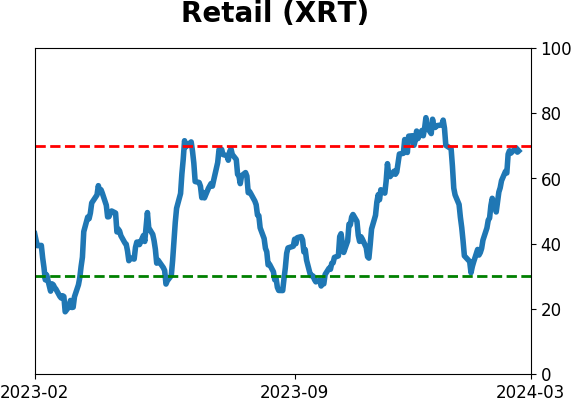
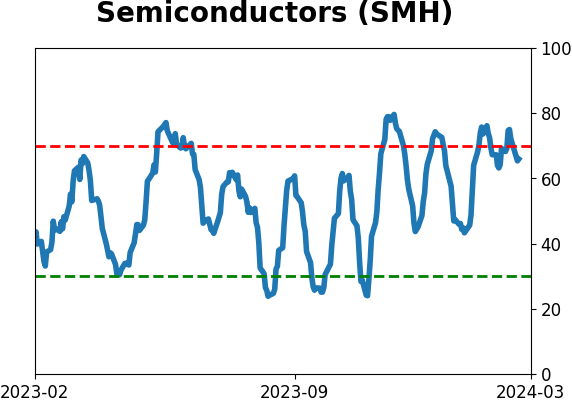
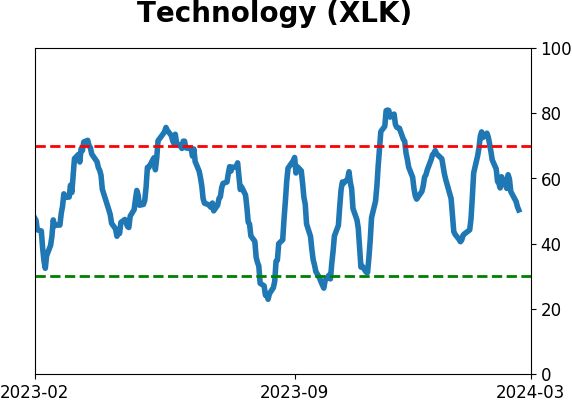
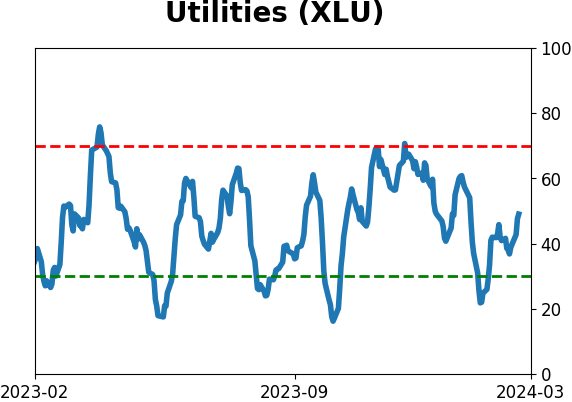
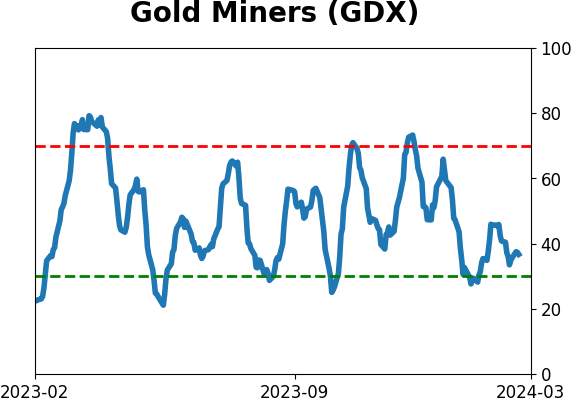
Sector ETF's - 10-Day Moving Average
|
|
|
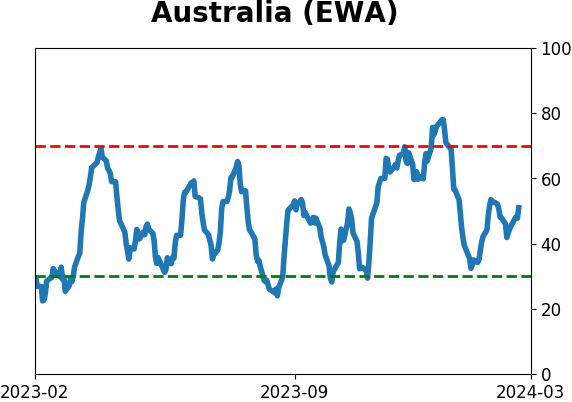
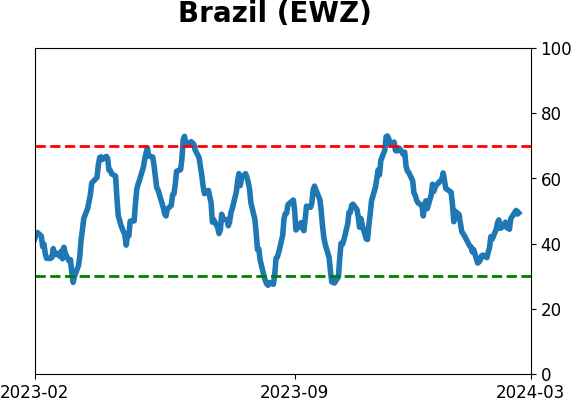
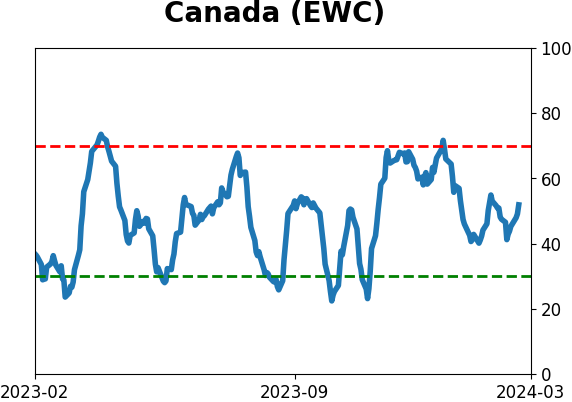
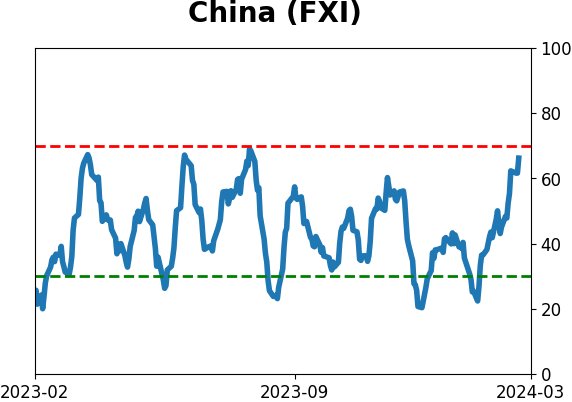
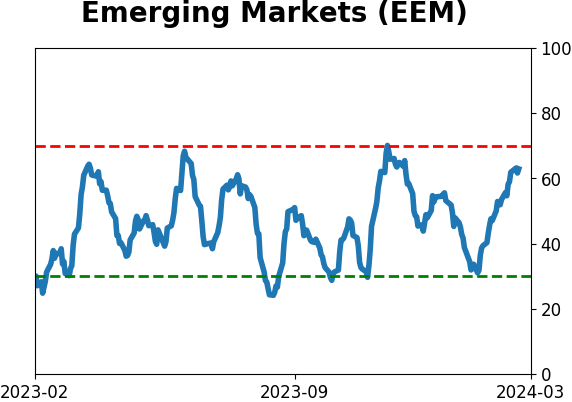
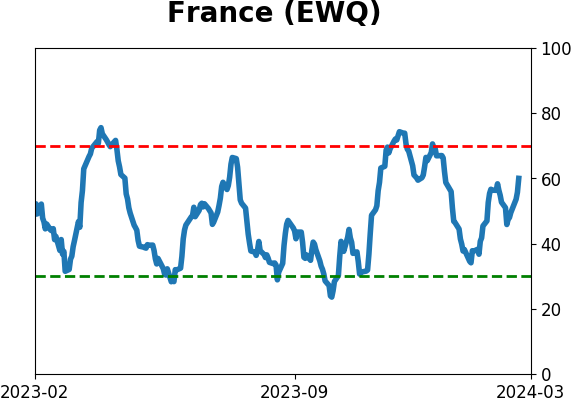
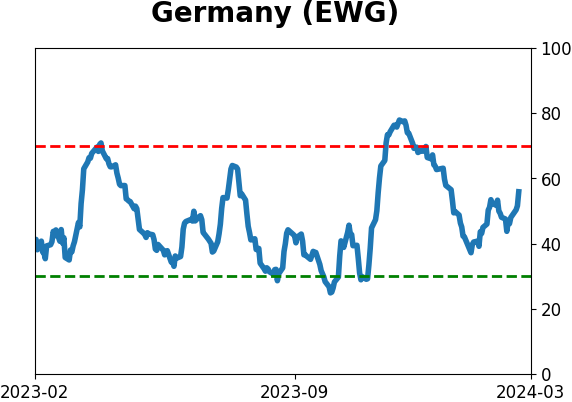
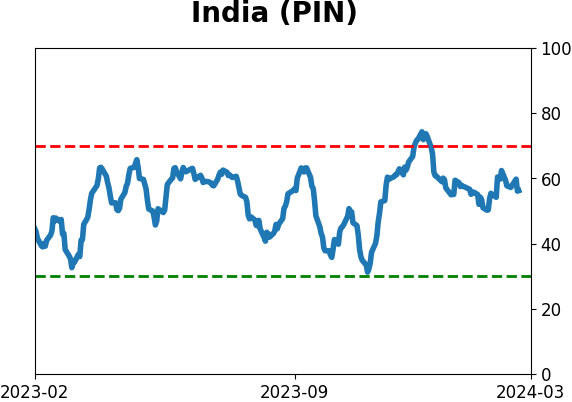
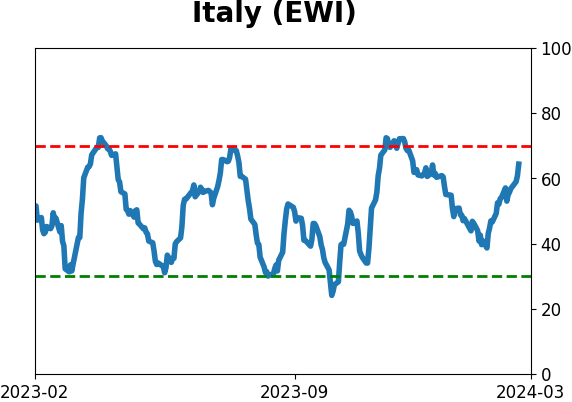
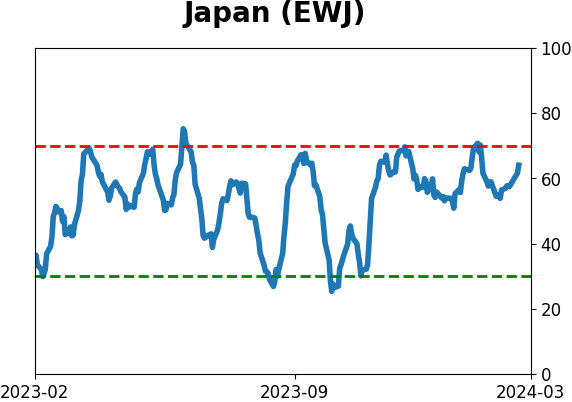
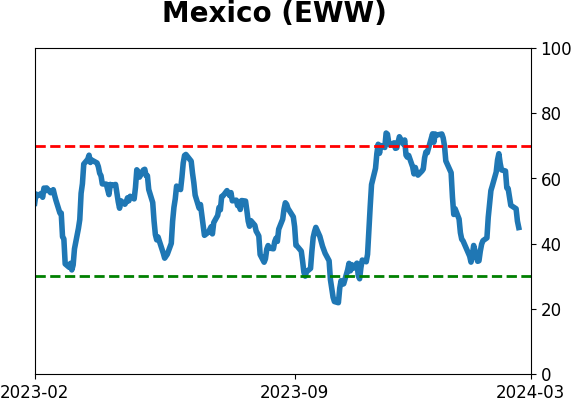
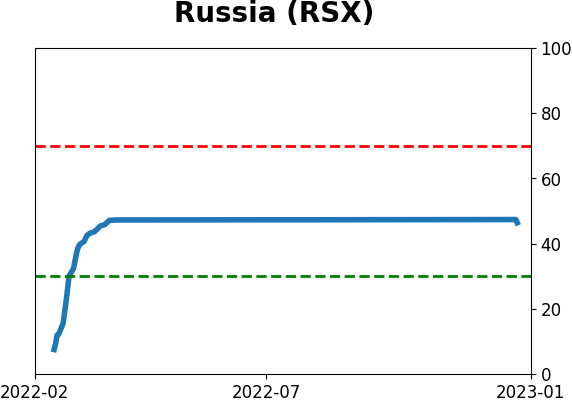
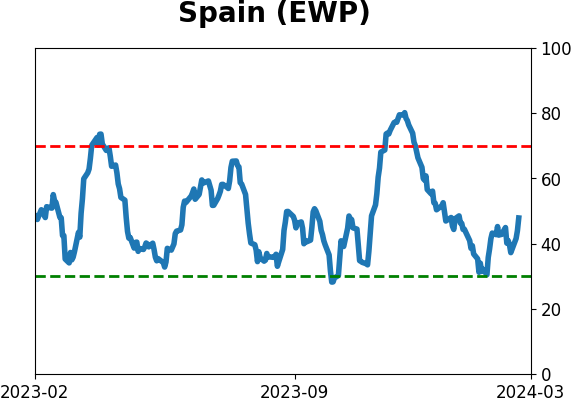
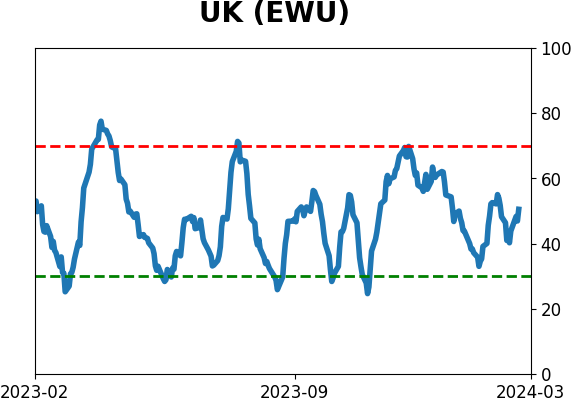
Country ETF's - 10-Day Moving Average
|
|
|
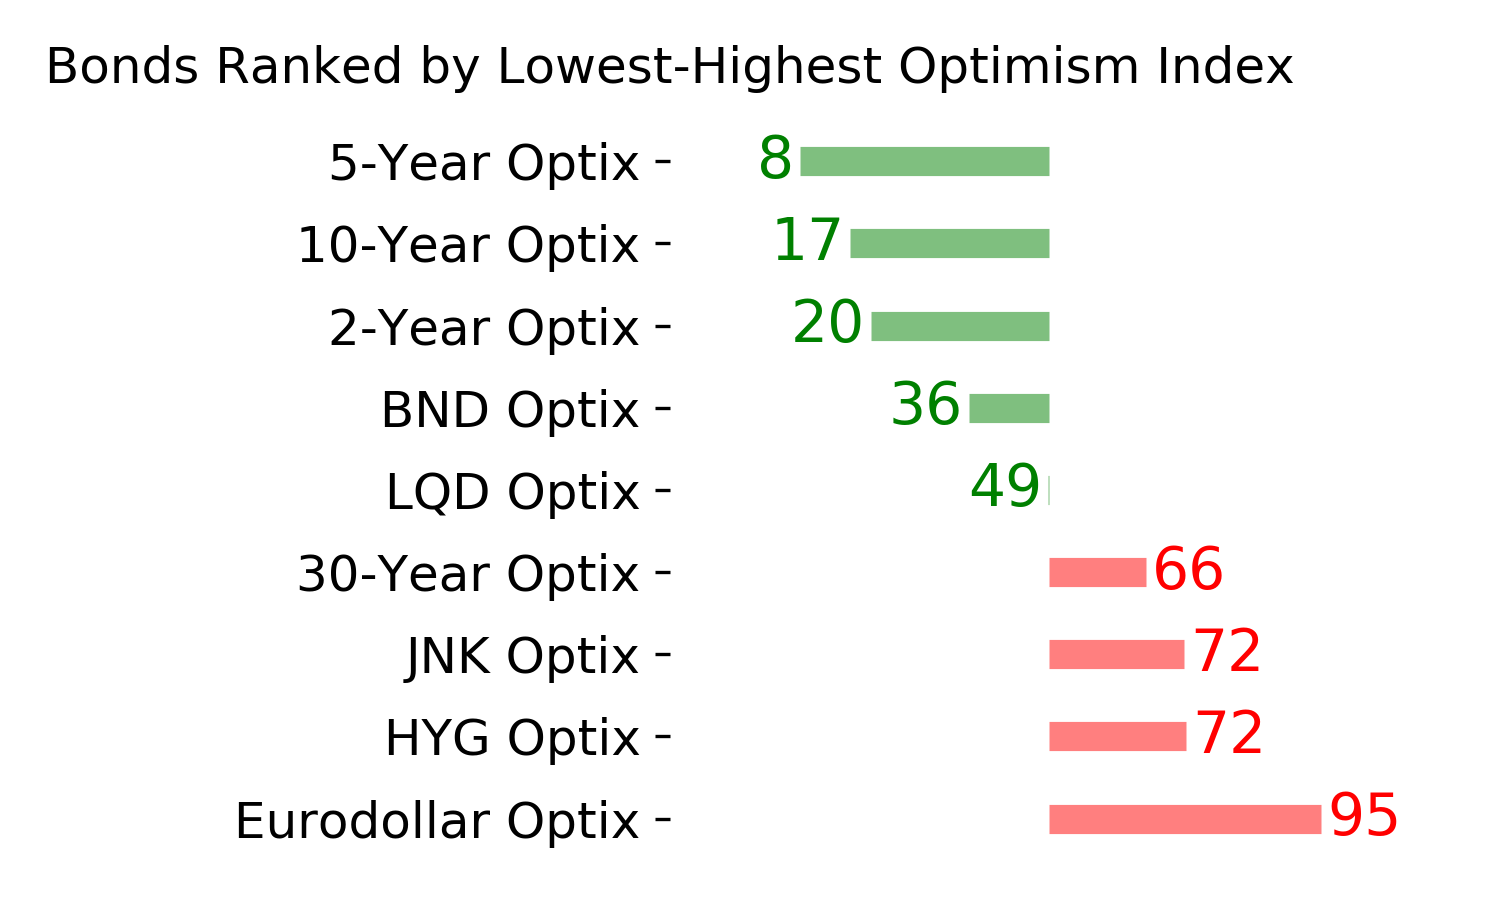
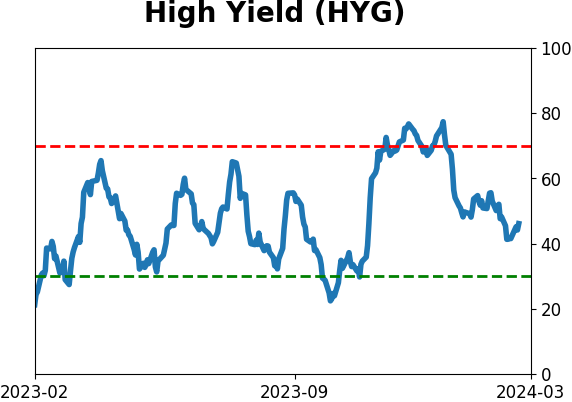
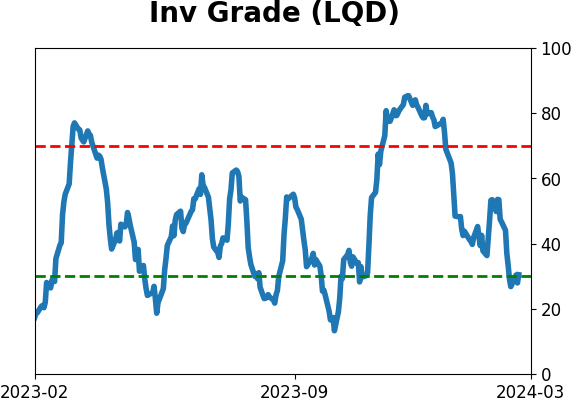
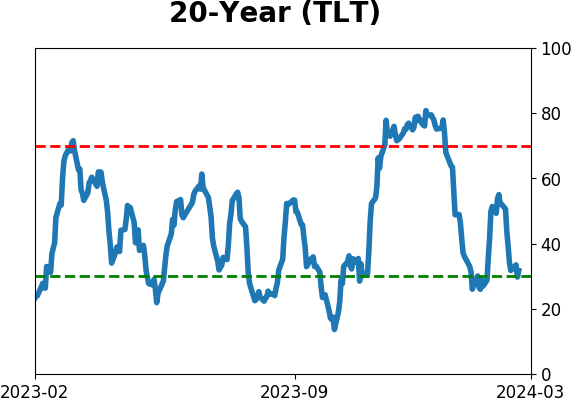
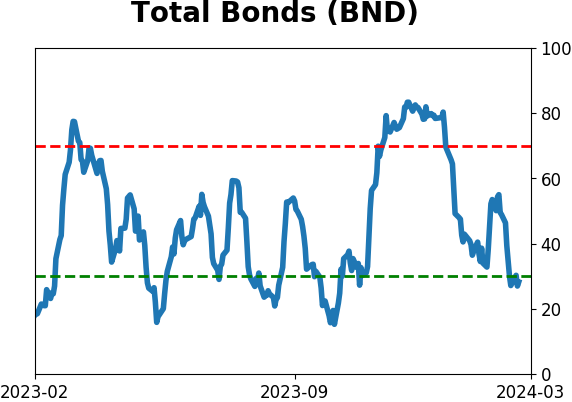
Bond ETF's - 10-Day Moving Average
|
|
|
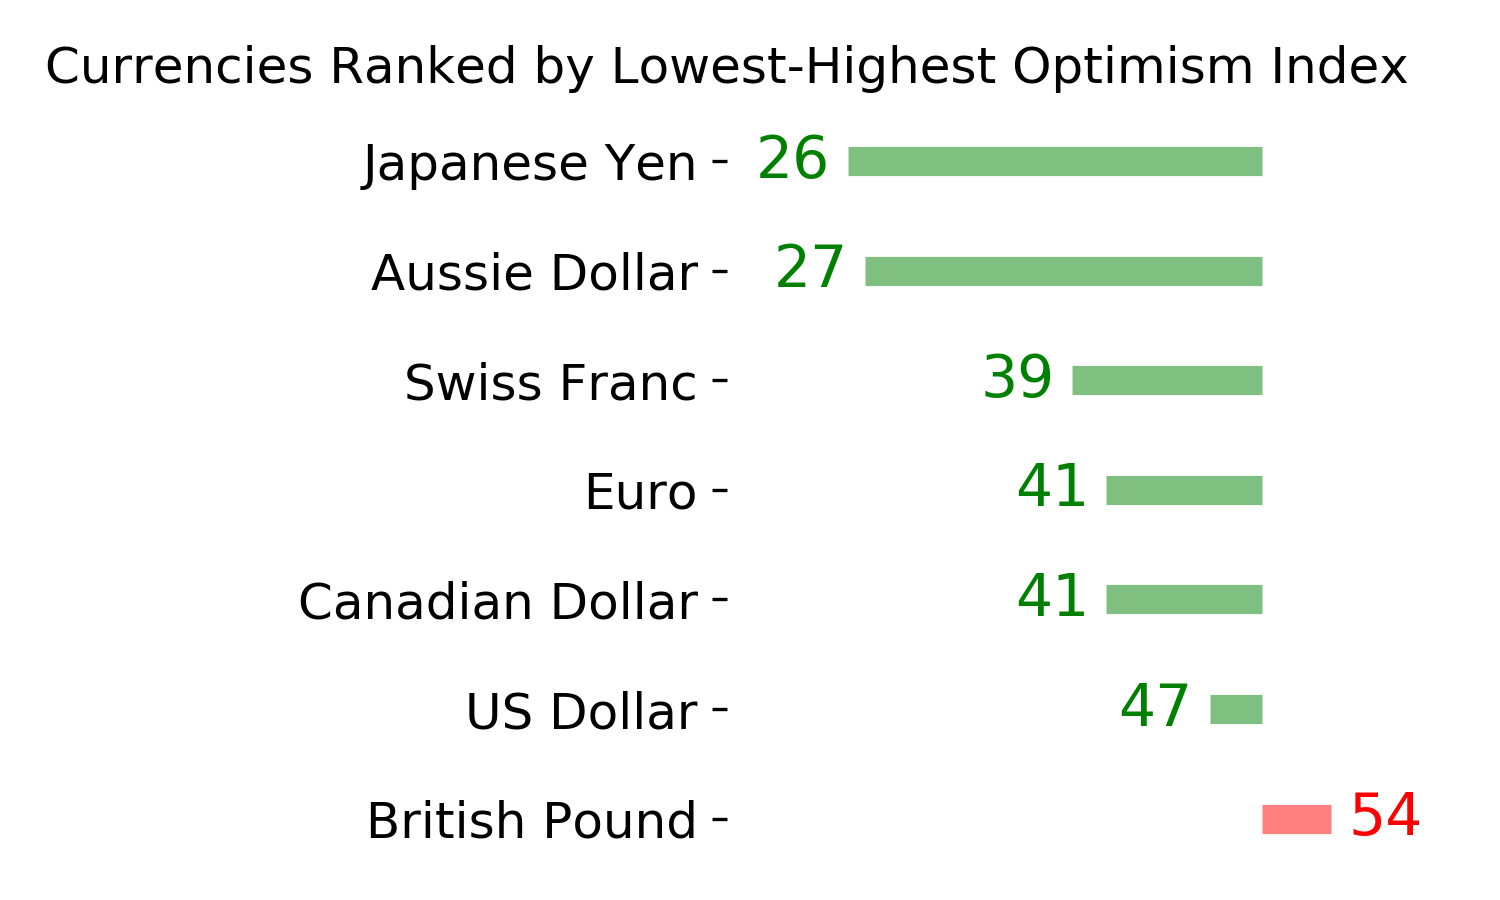
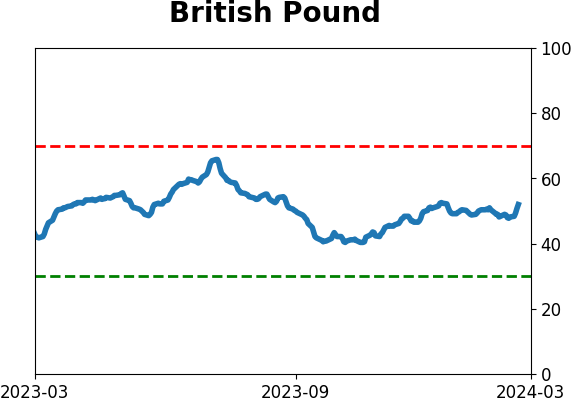
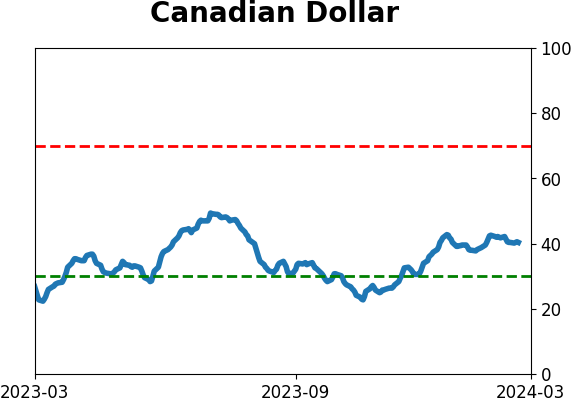
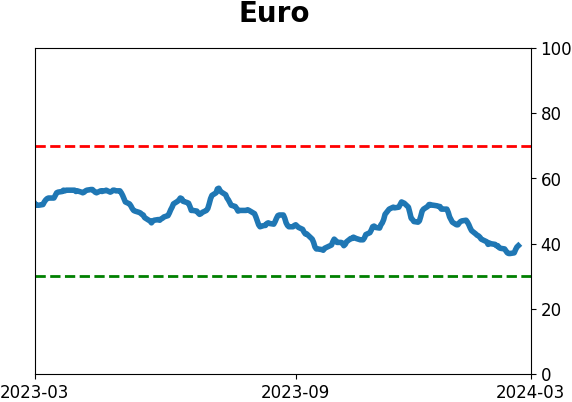
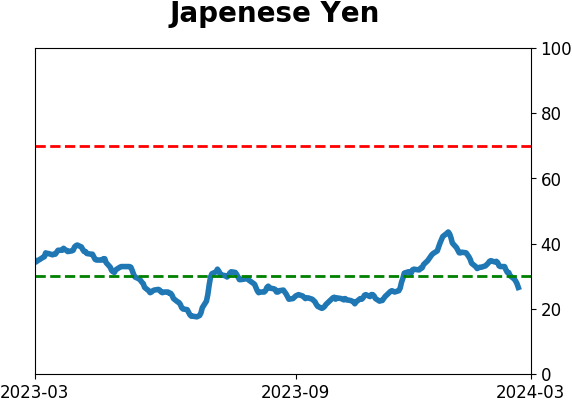
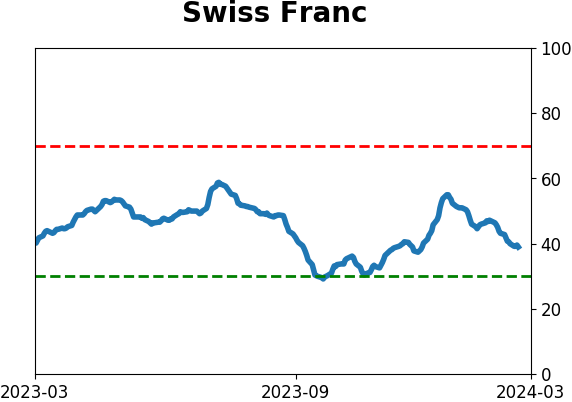
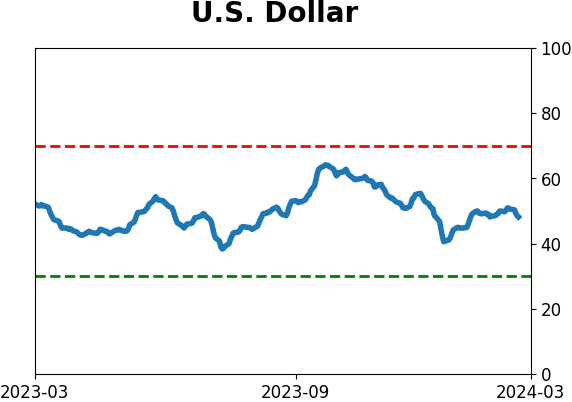
Currency ETF's - 5-Day Moving Average
|
|
|
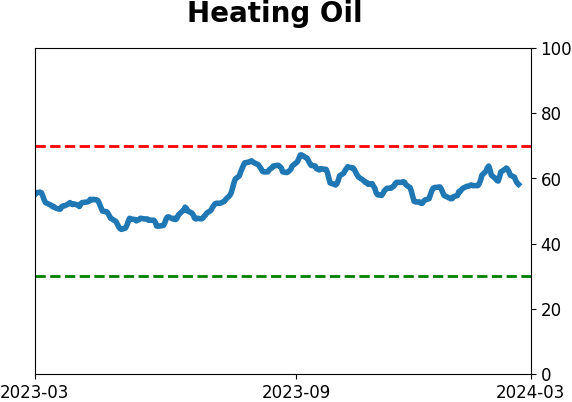
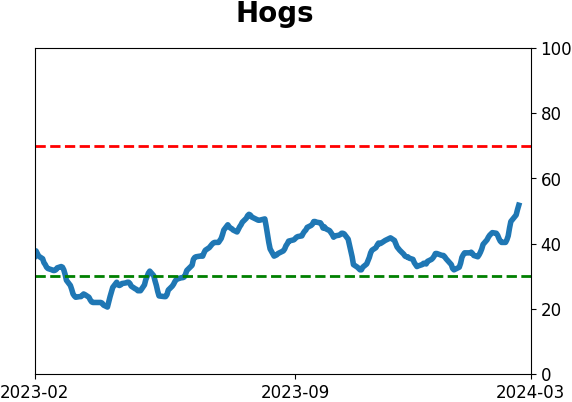
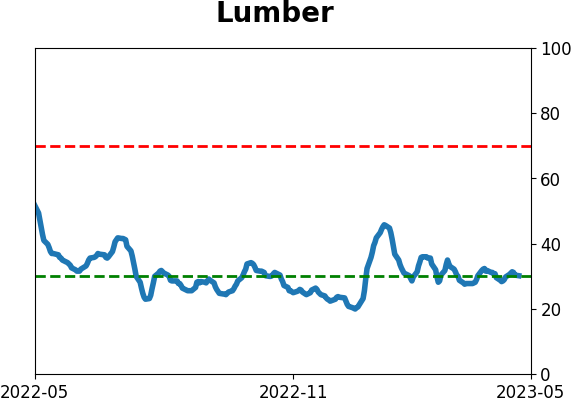
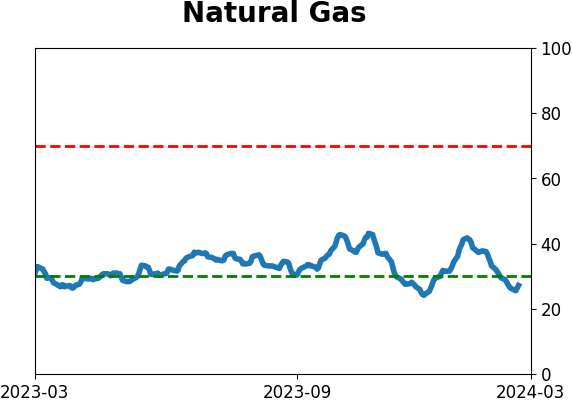
Commodity ETF's - 5-Day Moving Average
|
|