Headlines
|
|
Risk-on factors have greatly outperformed:
During the first 30 days of 2023, investors had clearly been in risk-on mode. Cyclical stocks vastly outperformed Defensive ones. Small-caps rallied more than Large-Caps. And Growth stocks surged relative to Value. These types of starts preceded much better returns than years when the risk-off factors prevailed.
|
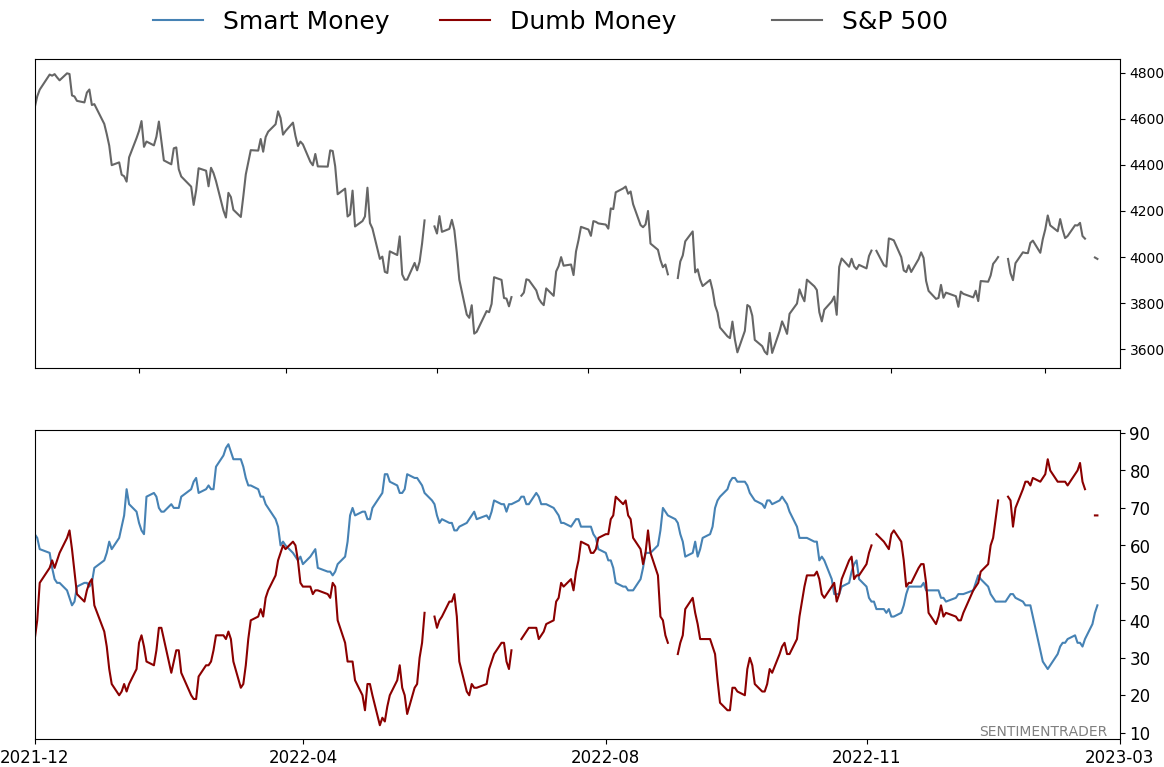
Smart / Dumb Money Confidence
|
Smart Money Confidence: 44%
Dumb Money Confidence: 68%
|
|
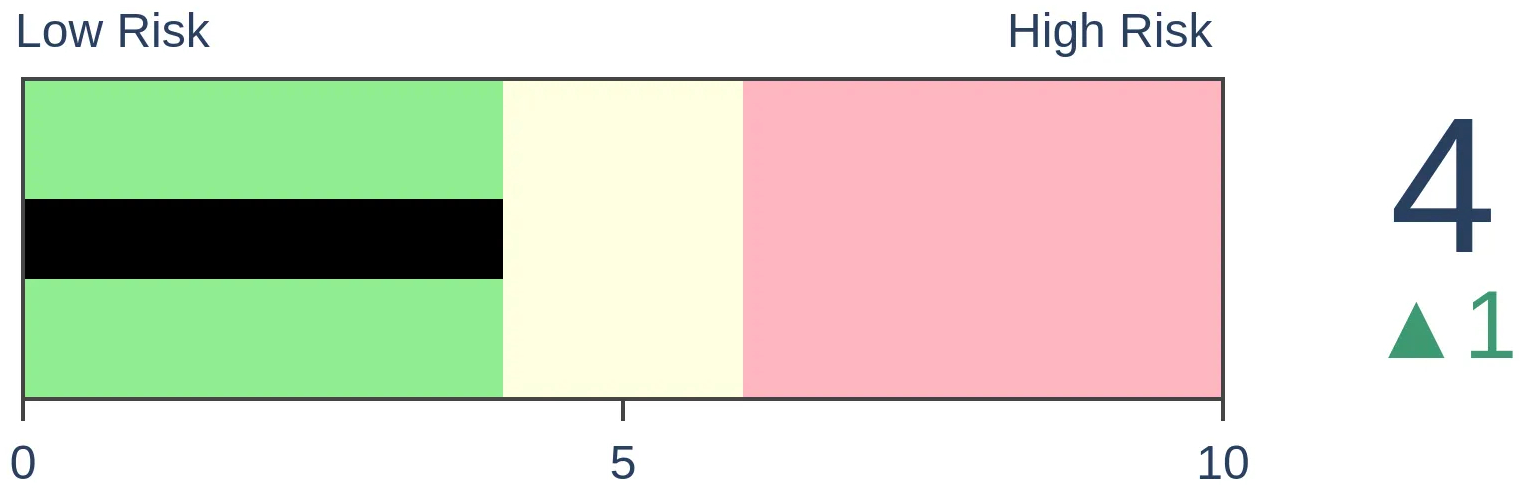
Risk Levels
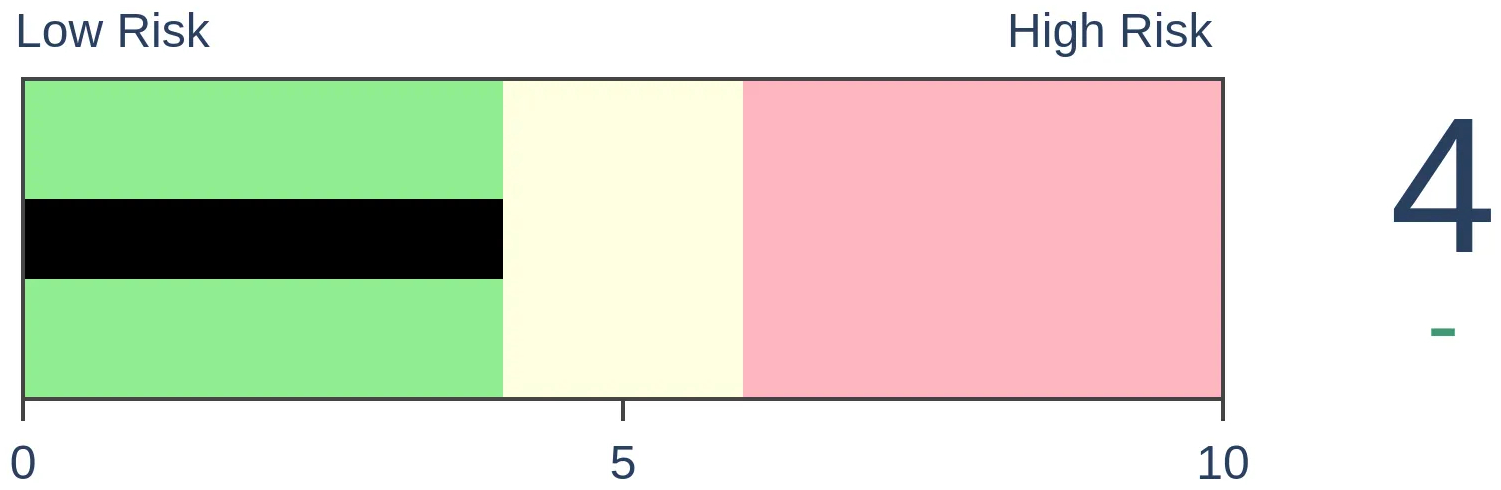
Stocks Short-Term
|
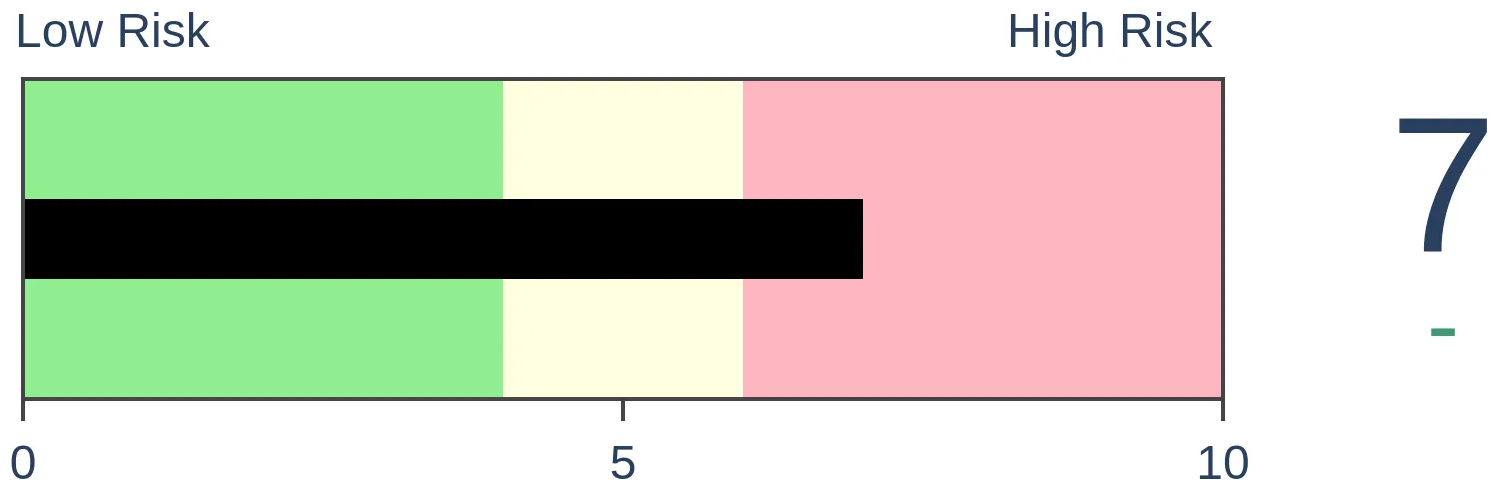
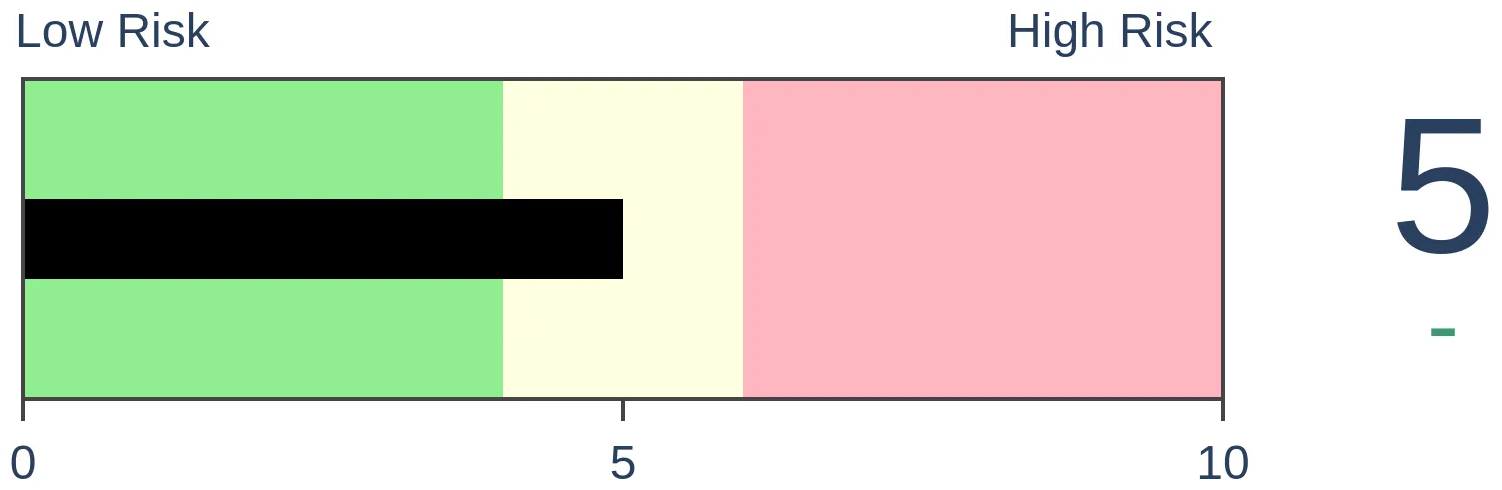
Stocks Medium-Term
|
|
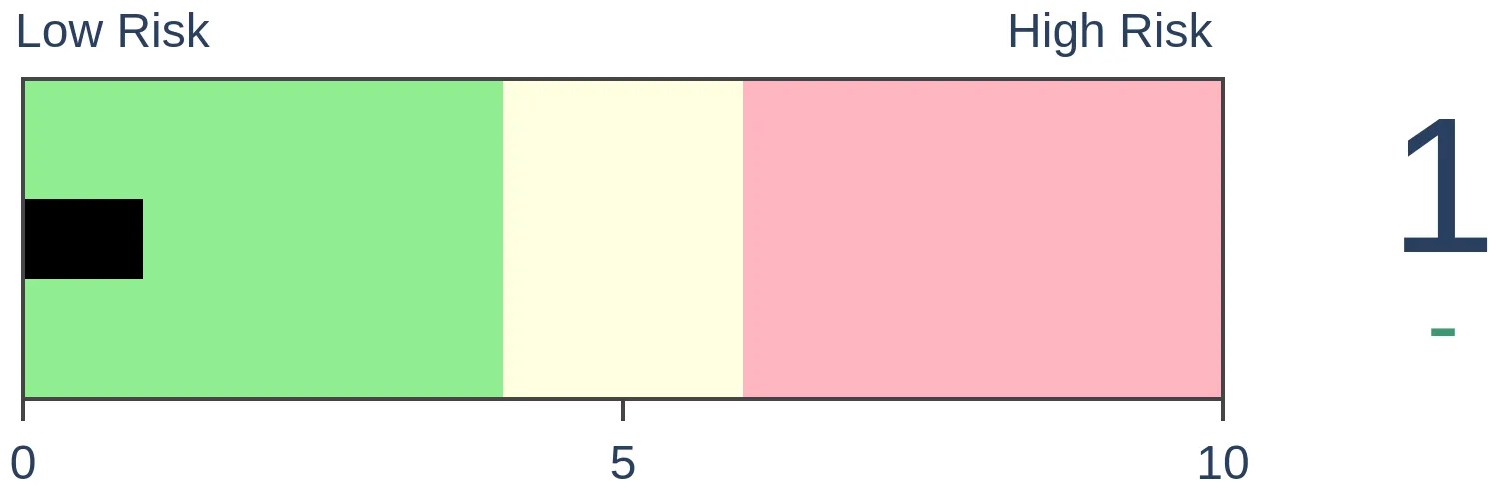
Bonds
|
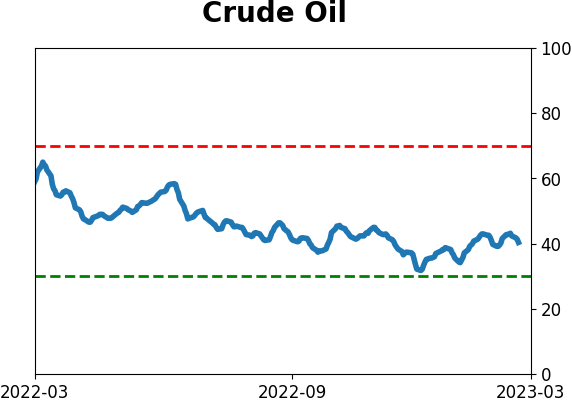
Crude Oil
|
|
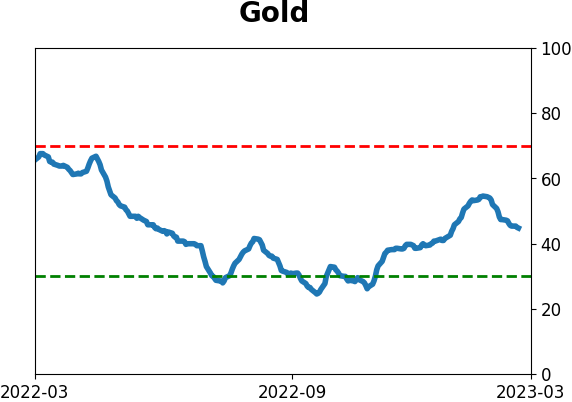
Gold
|
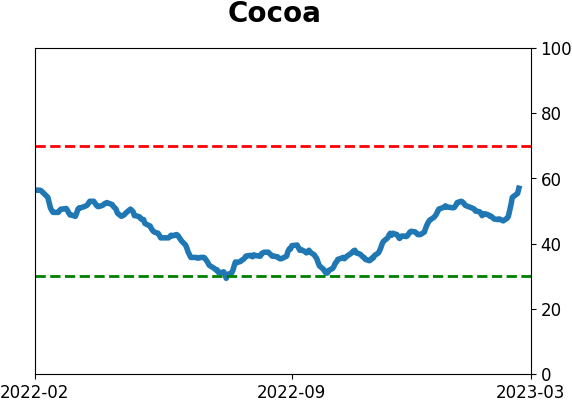
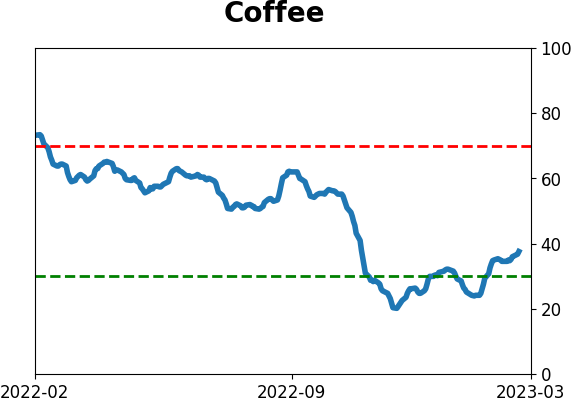
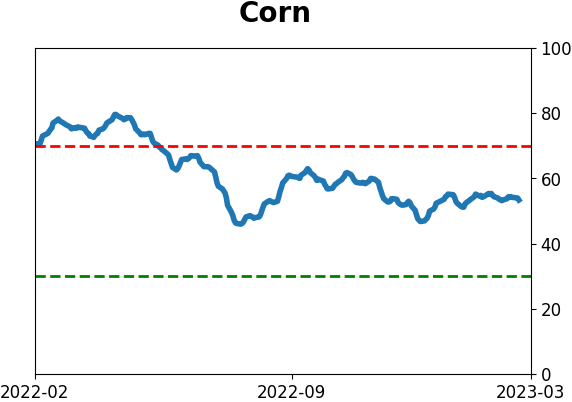
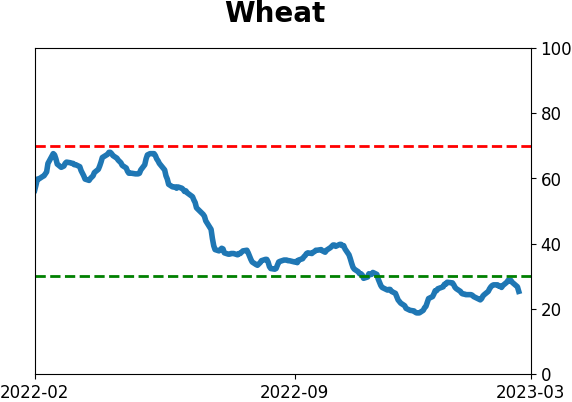
Agriculture

|
|
Research
By Jason Goepfert
BOTTOM LINE
During the first 30 days of 2023, investors had clearly been in risk-on mode. Cyclical stocks vastly outperformed Defensive ones. Small-caps rallied more than Large-Caps. And Growth stocks surged relative to Value. These types of starts preceded much better returns than years when the risk-off factors prevailed.
FORECAST / TIMEFRAME
None
|
Key points:
- Through the first 30 days of 2023, risk-on factors handily outperformed risk-off factors
- The average difference between multiple factors was the 2nd-largest of any year since 1950
- During years of risk-on factor outperformance, forward returns were consistently positive
Risk-on factors have impressively outperformed
Until recently, investors had a clear risk-on mentality to start the year. We saw that with the Nasdaq's massive outperformance relative to the Dow, and we see it within the major factors.
Through the first 30 sessions of 2023, Cyclical stocks outperformed Defensive stocks, Small-caps outperformed Large-caps, and Growth outperformed Value.
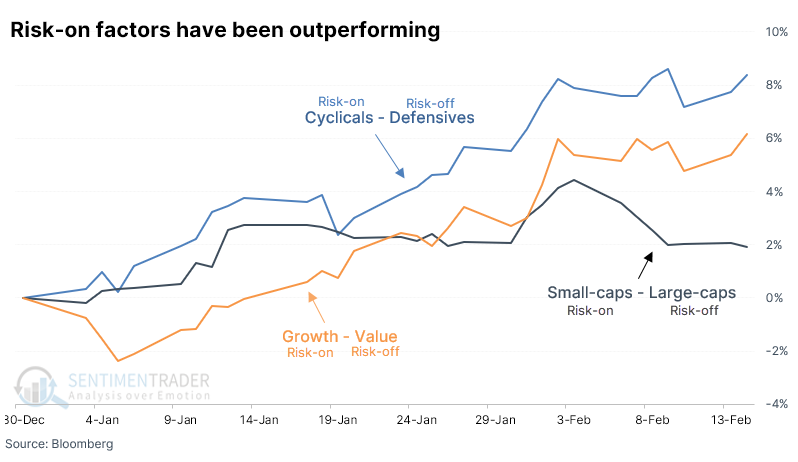
The average outperformance of risk-on versus risk-off factors at the start of the year has been the 2nd-largest since 1950.
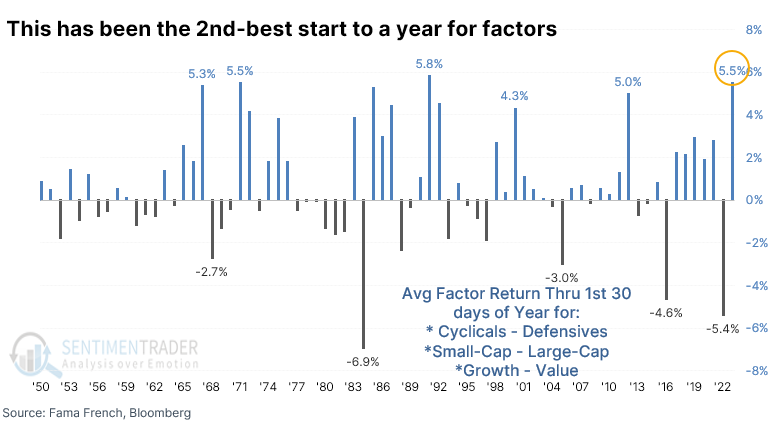
As we saw with the Nasdaq vs. the Dow, when investors have been in a clear risk-on mood to start a year, they tend to continue in the months ahead. Only one of those years ended up with a (minor) loss over the next three months, though in 1987, it ultimately proceeded into the October crash.
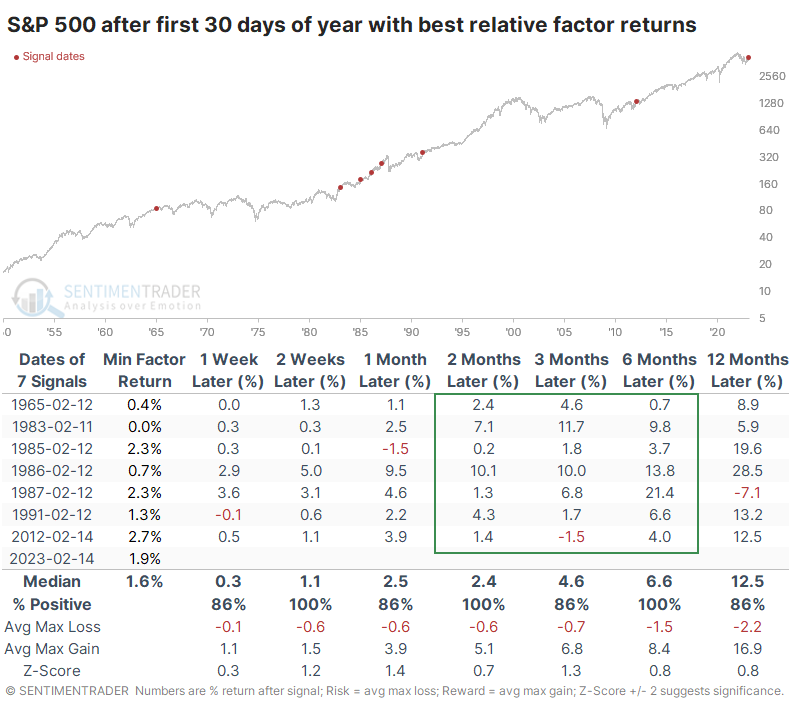
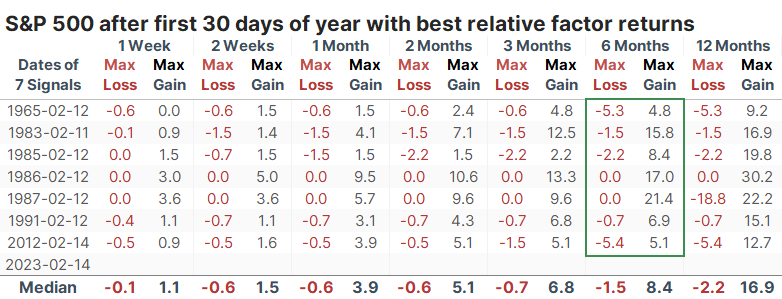
Risk was limited relative to reward during the next six months, with no losses larger than -5.4% within those next six months.
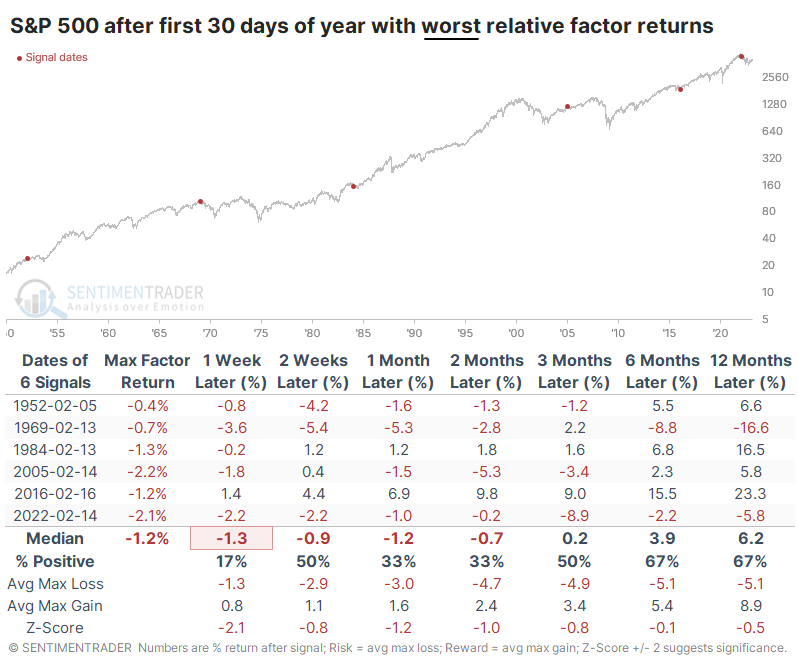
During the years with the worst relative returns between risk-on and risk-off factors, risk was higher, reward was lower, and there was an increased probability of a negative return (with the usual caveats about tiny sample sizes).
What the research tells us...
The spurt of increased risk appetite to start the year has unnerved many investors, who see the return of increased investor confidence as a major warning sign. During bear markets, that's entirely reasonable, and perhaps it will also be this time.
The issue with that is the multiple signs we've discussed over the last few months that this time has been markedly different than any other during the past year or even during any other ongoing bear market. The behavior we've witnessed lately is a hallmark of the early stages of new bull markets, and the risk-on factor returns during the first month+ of the year is another modest sign in that direction.
Indicators at Extremes
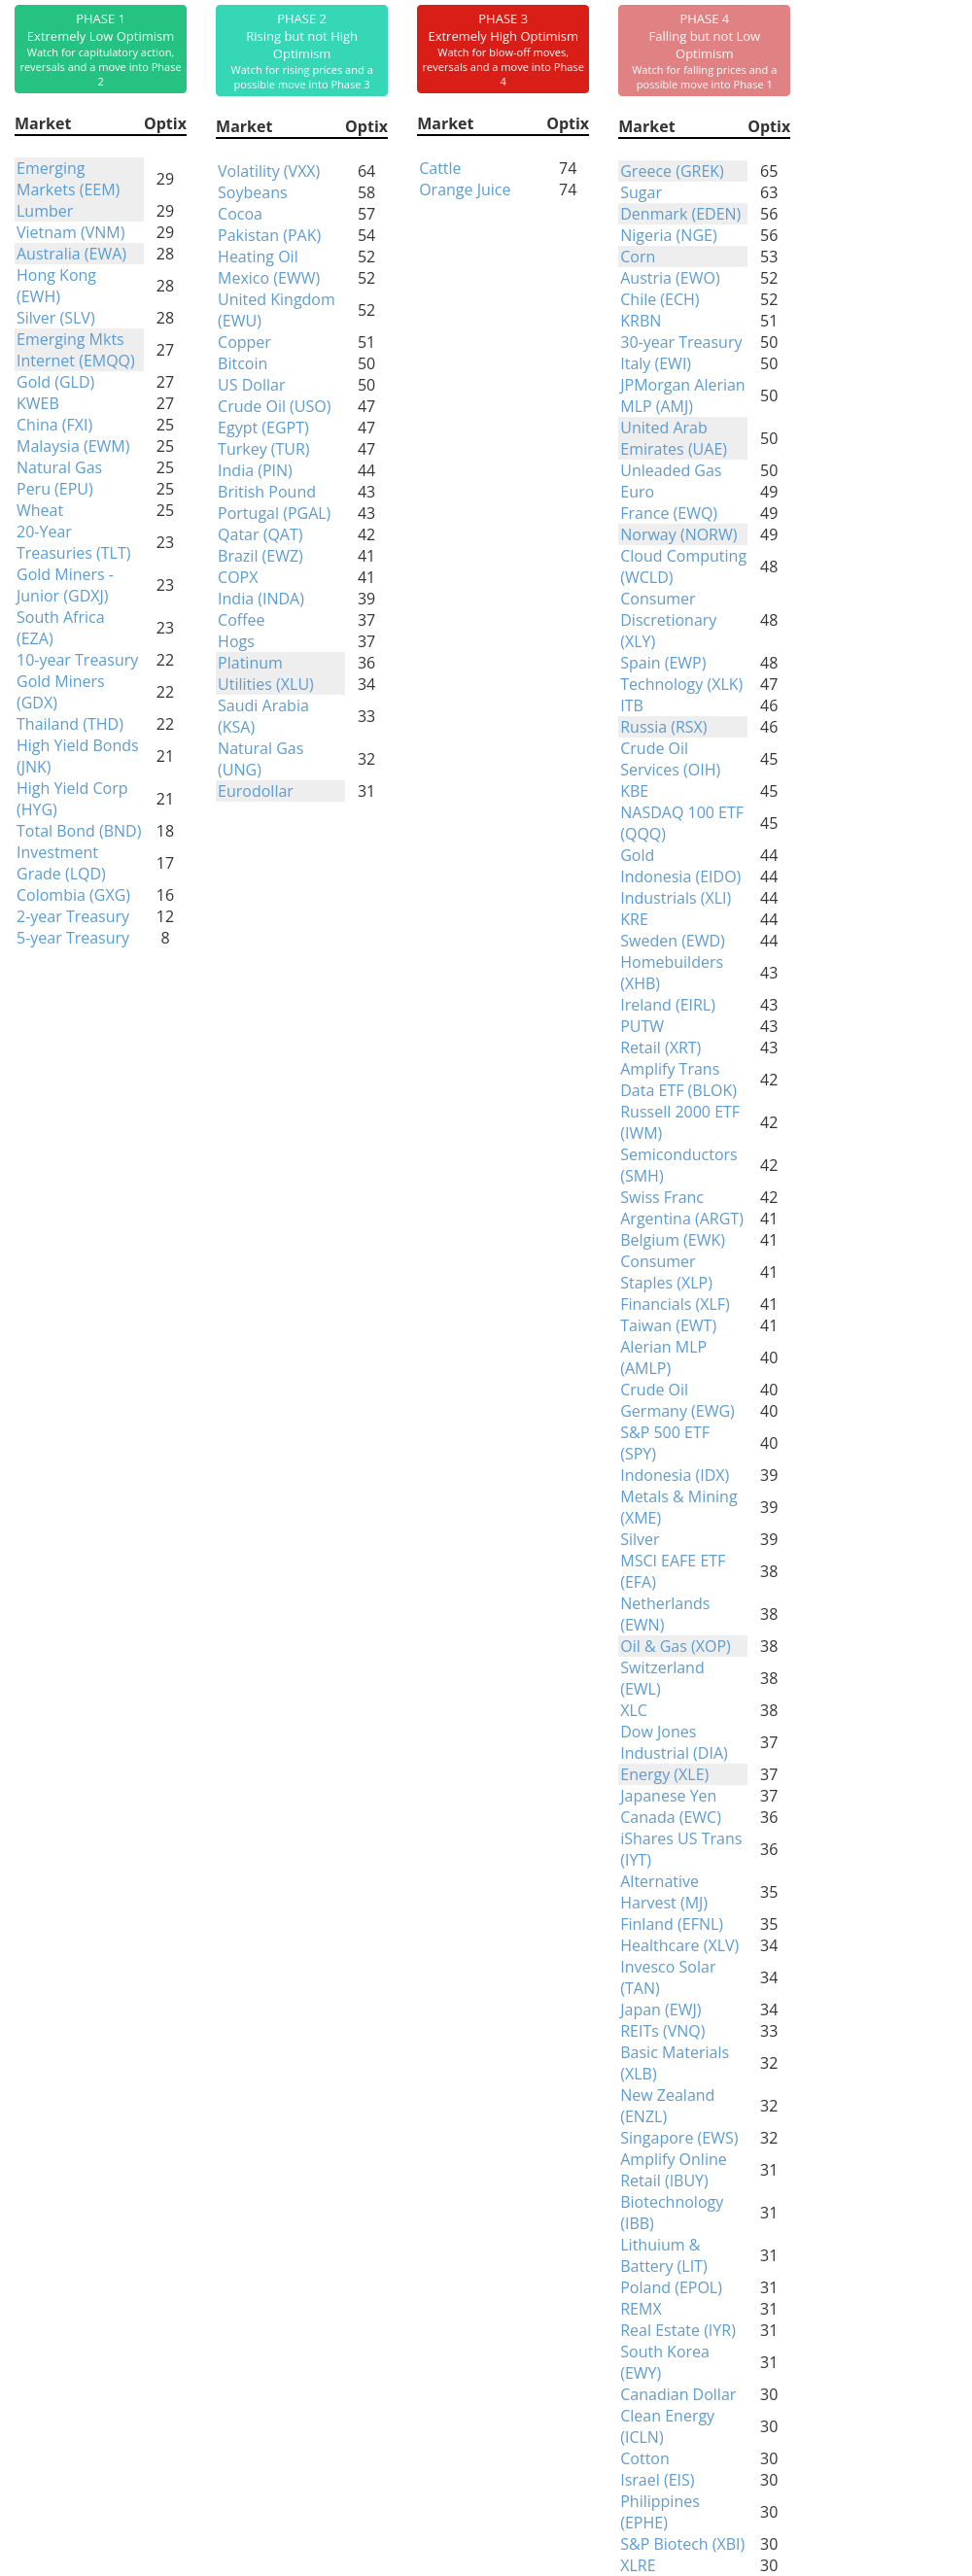
Phase Table
Ranks
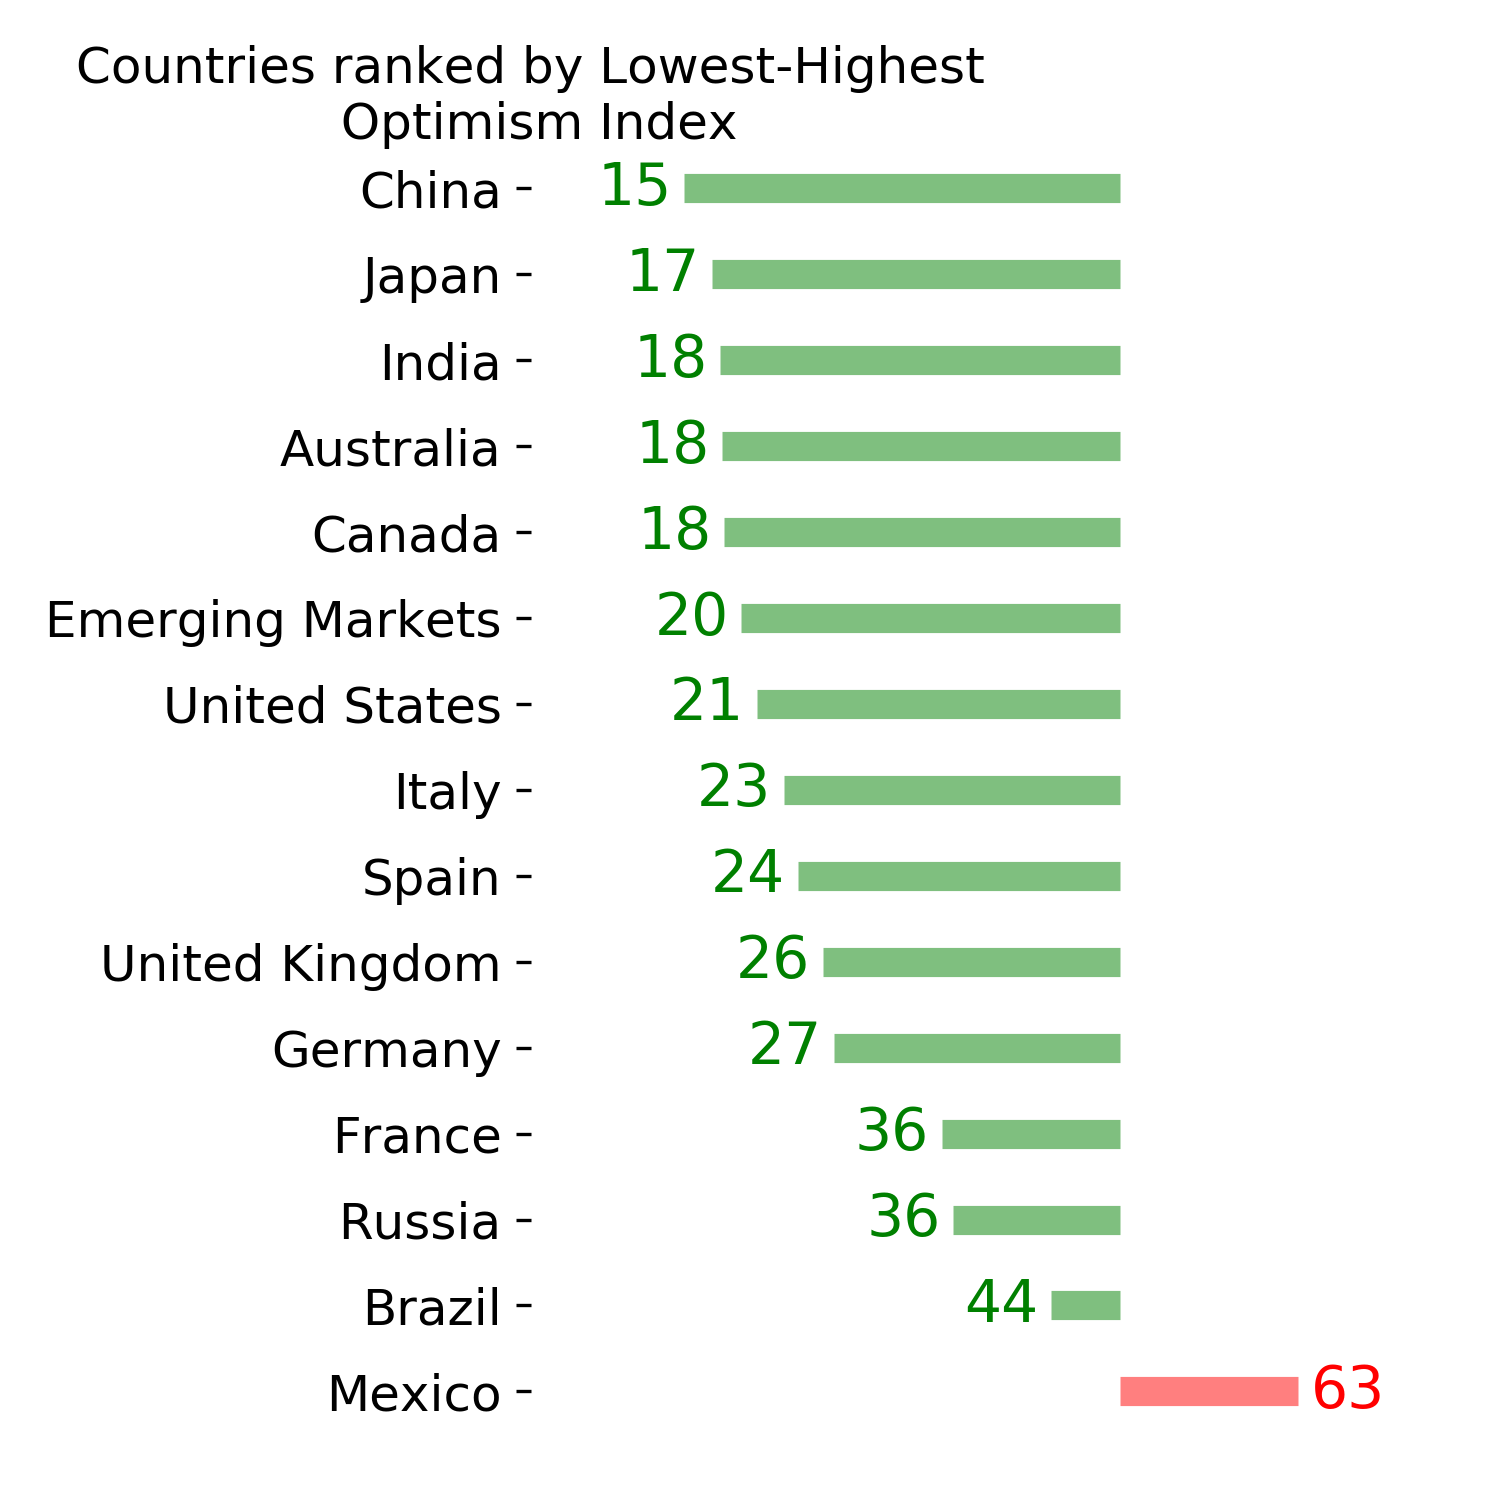
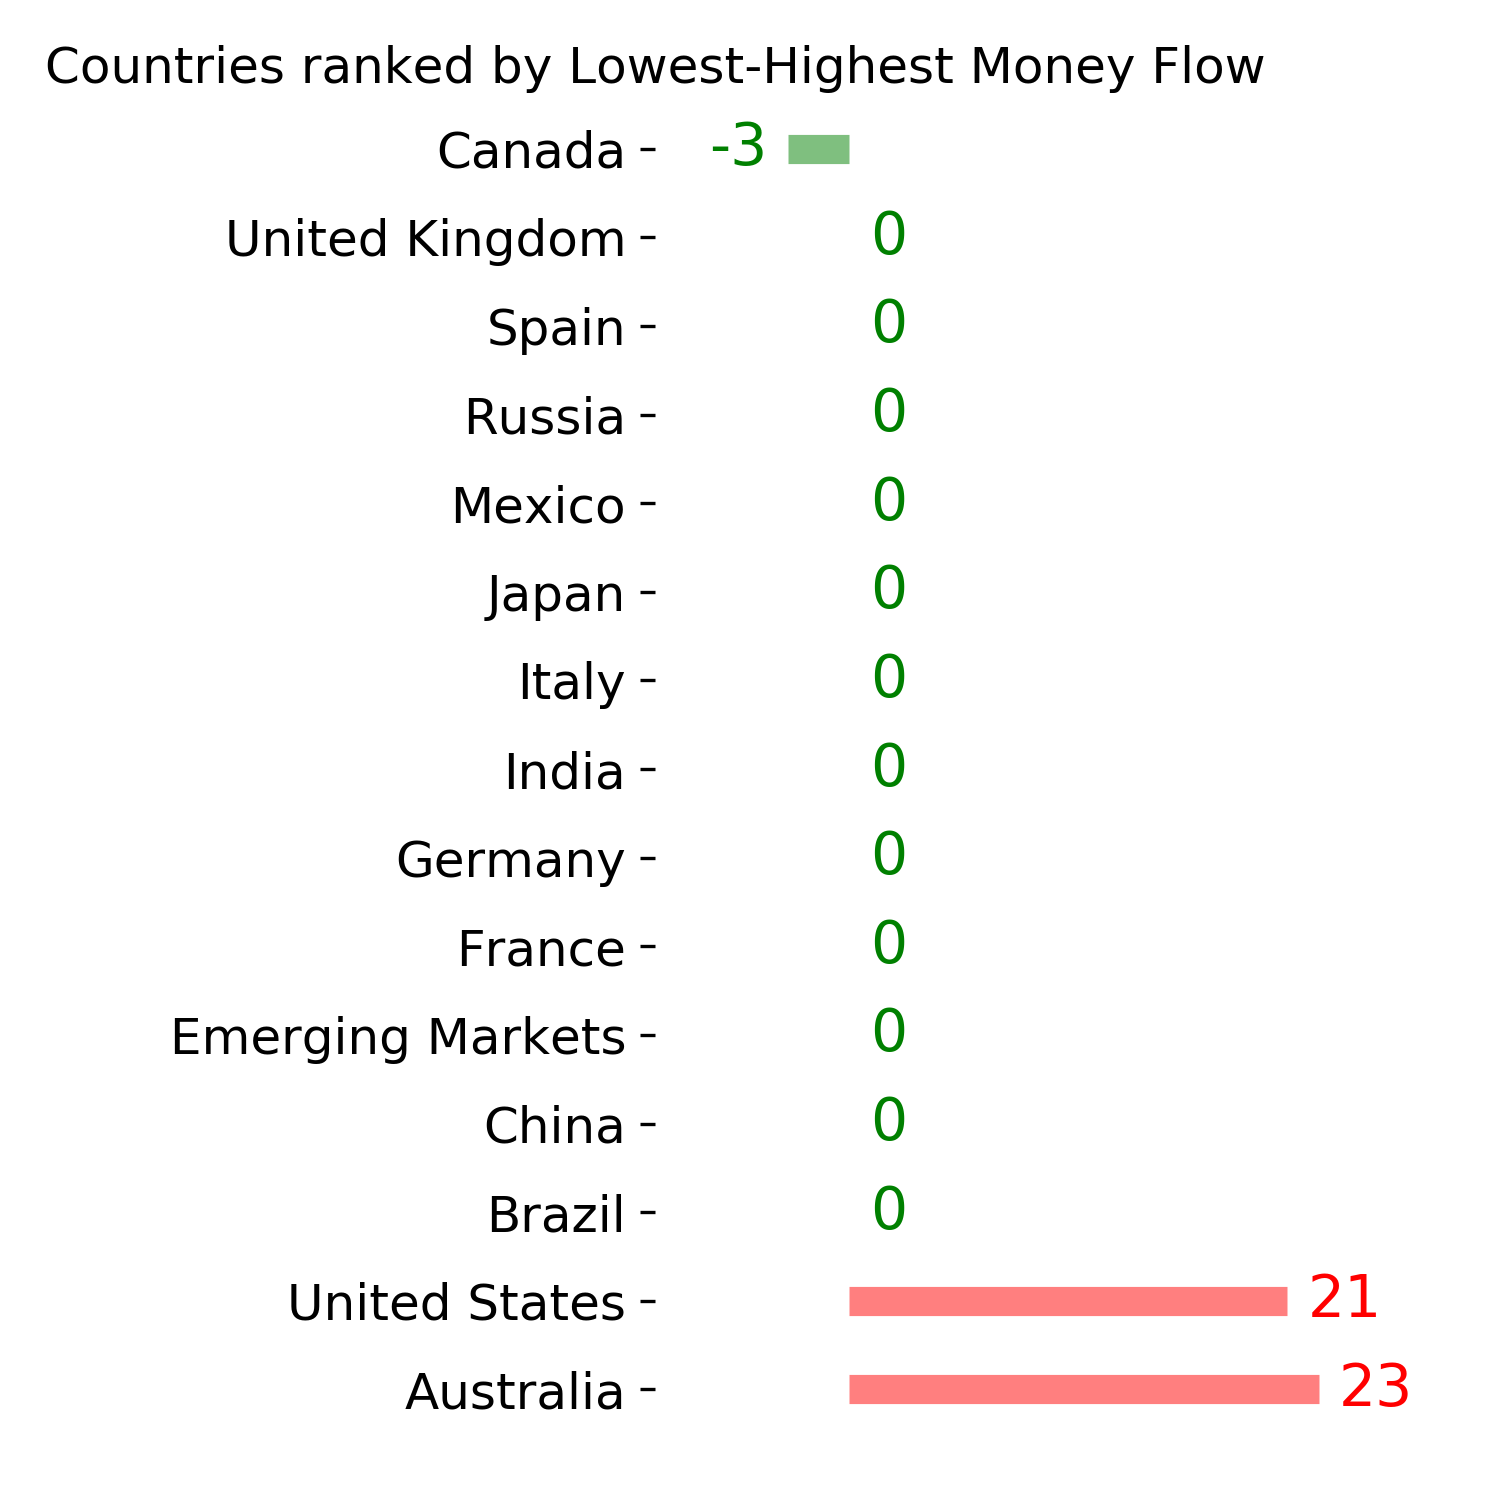
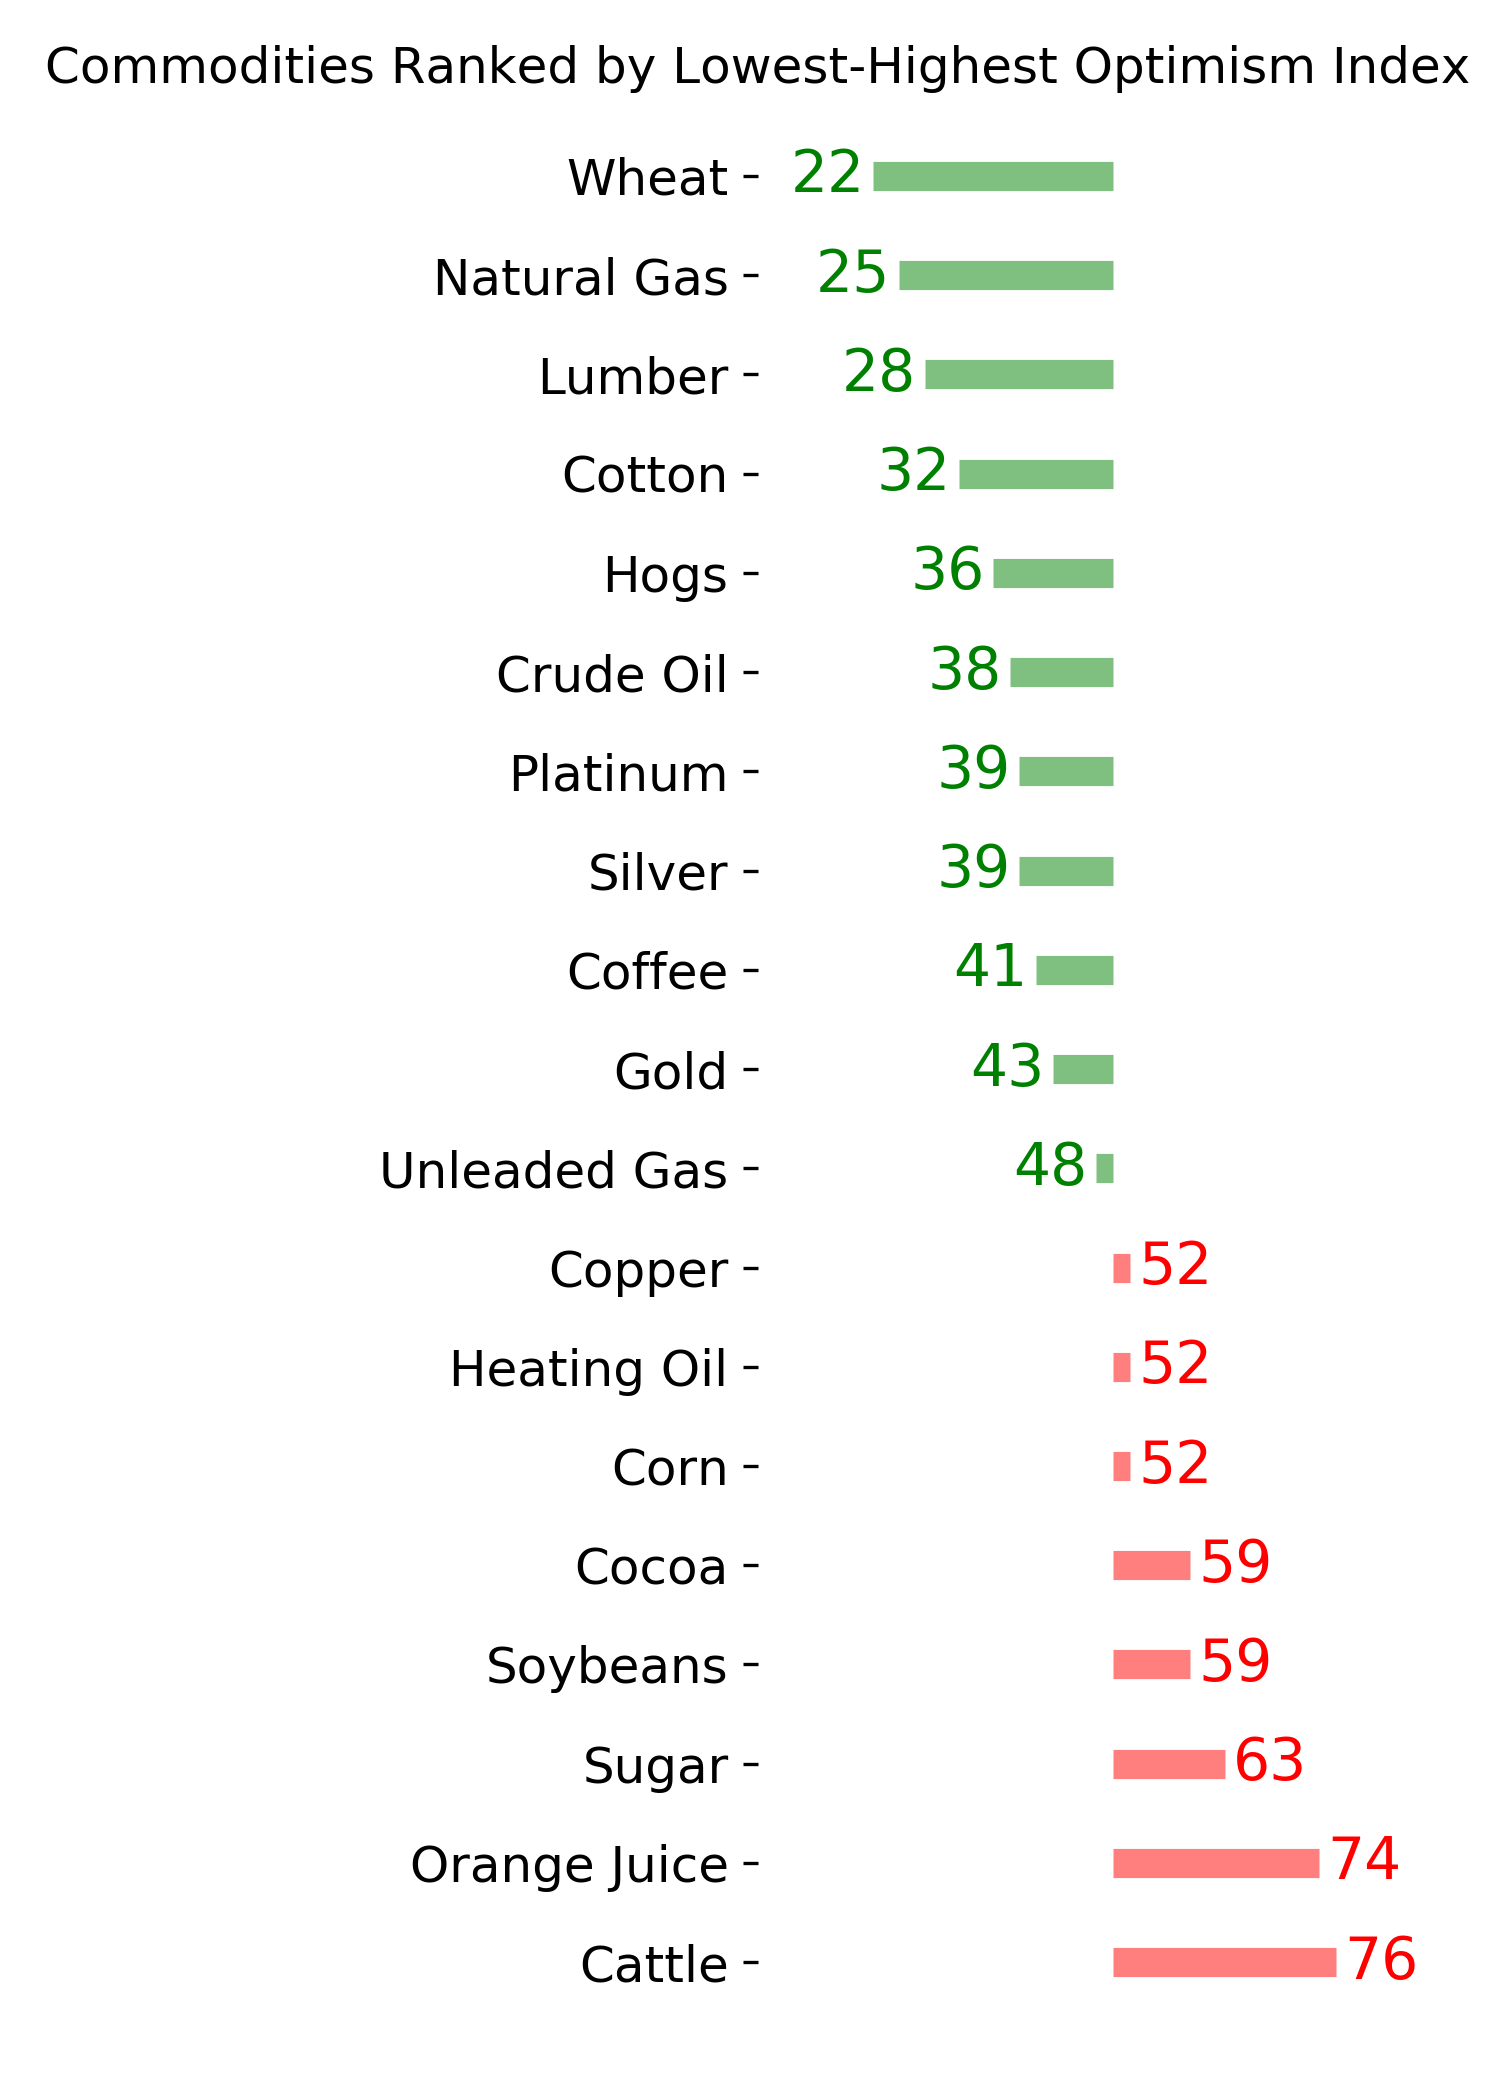
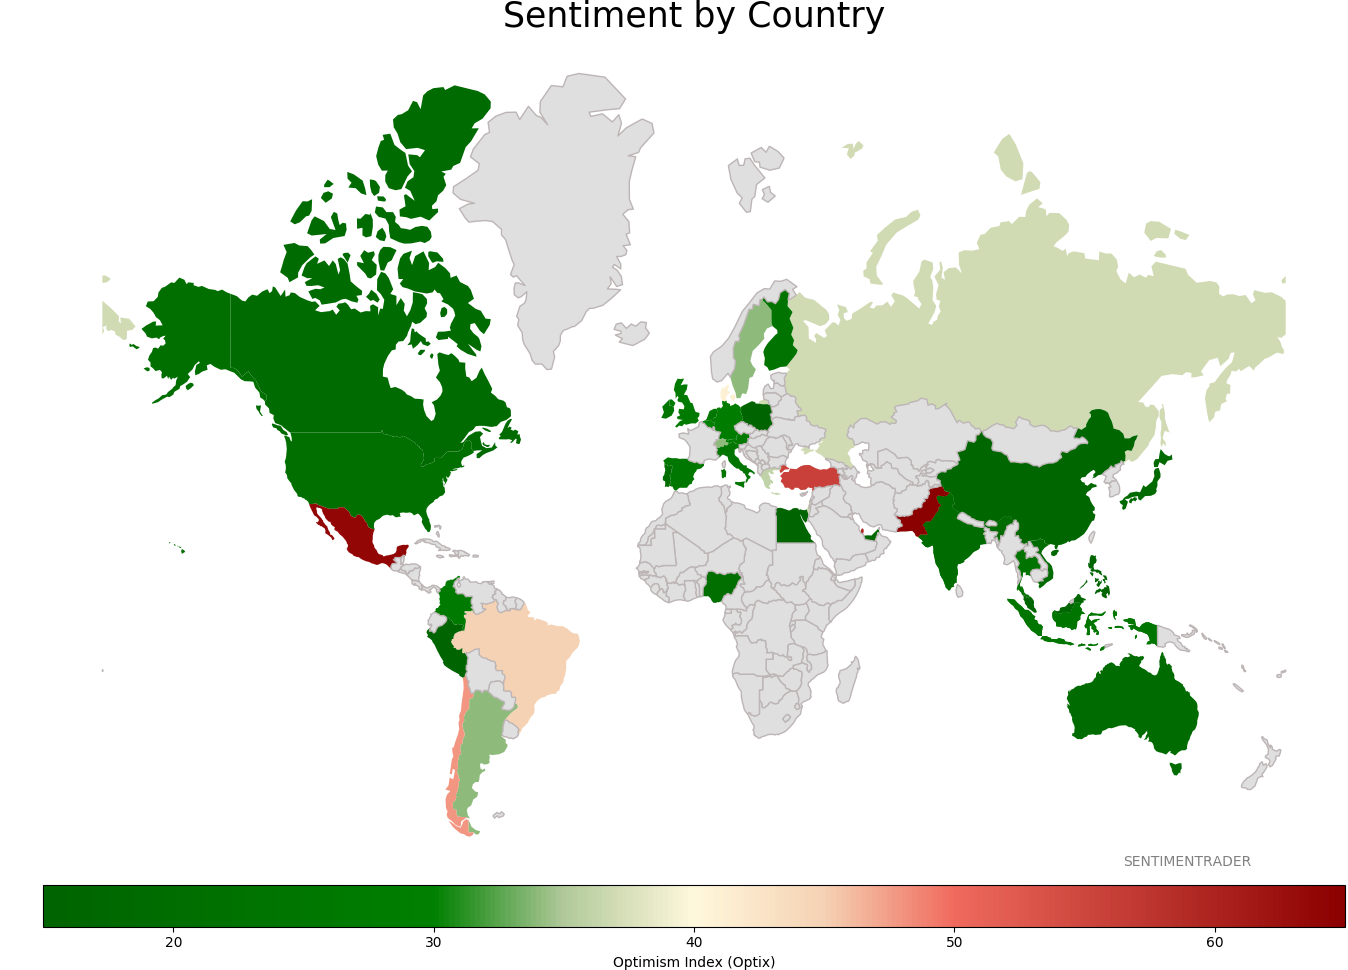
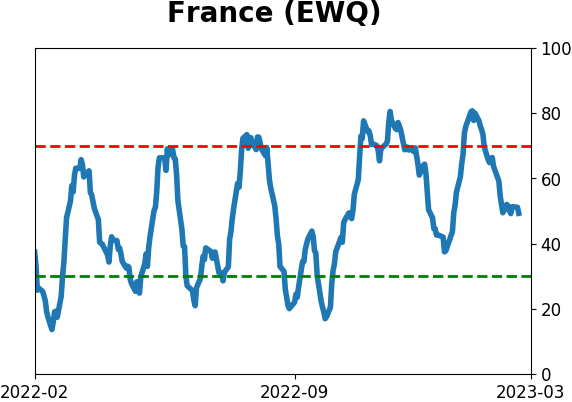
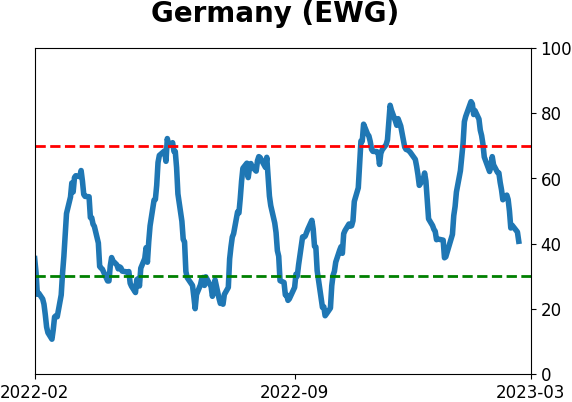
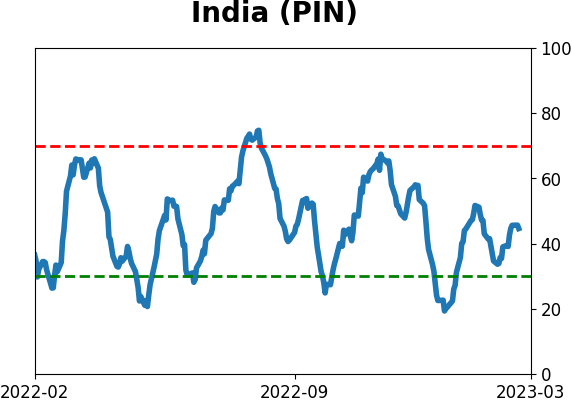
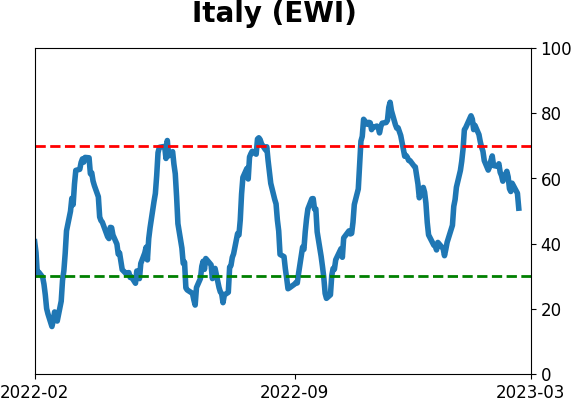
Sentiment Around The World
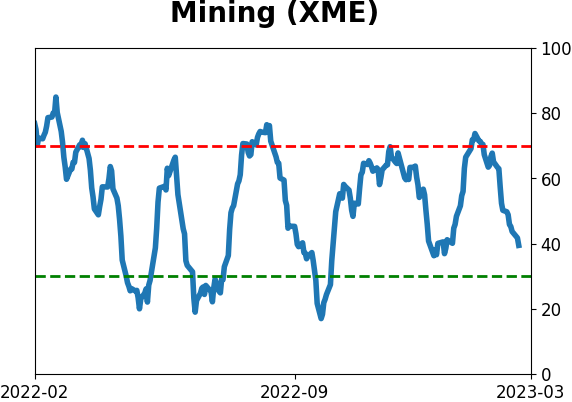
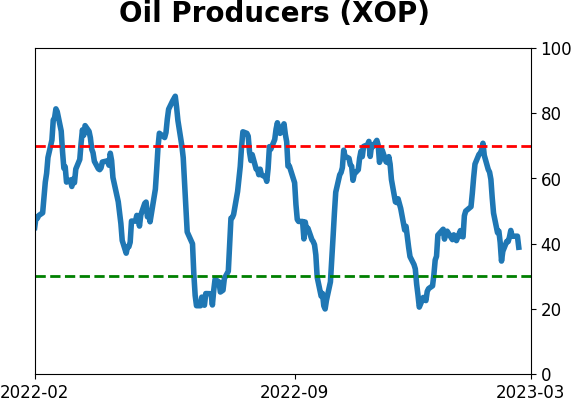
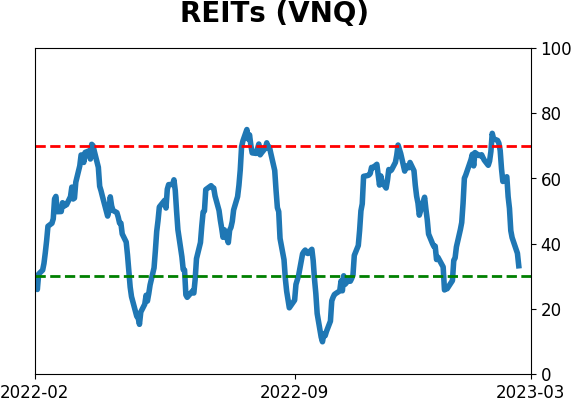
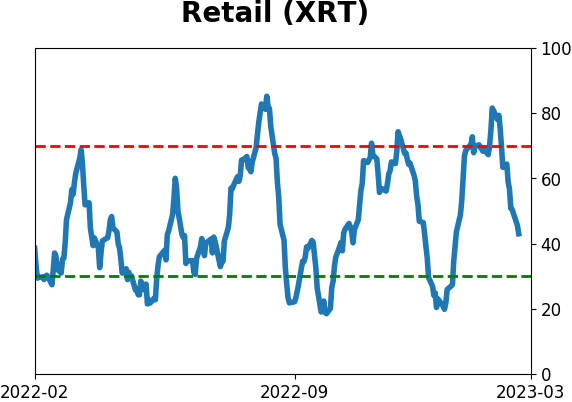
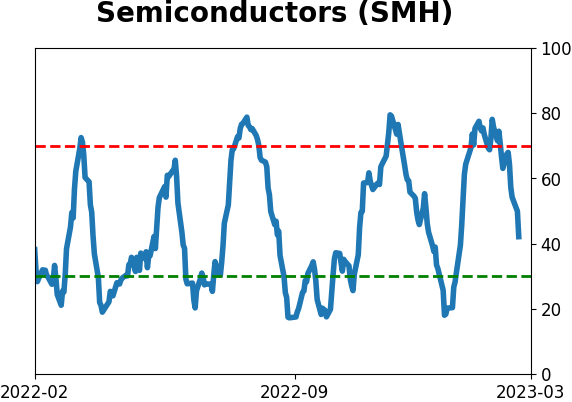
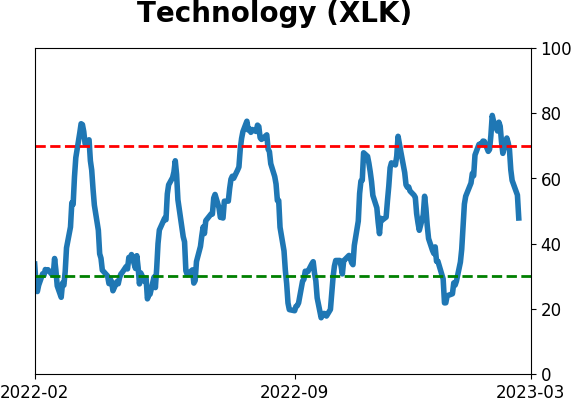
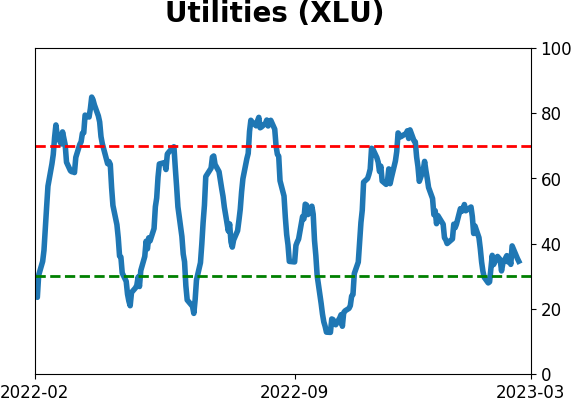
Optimism Index Thumbnails
|
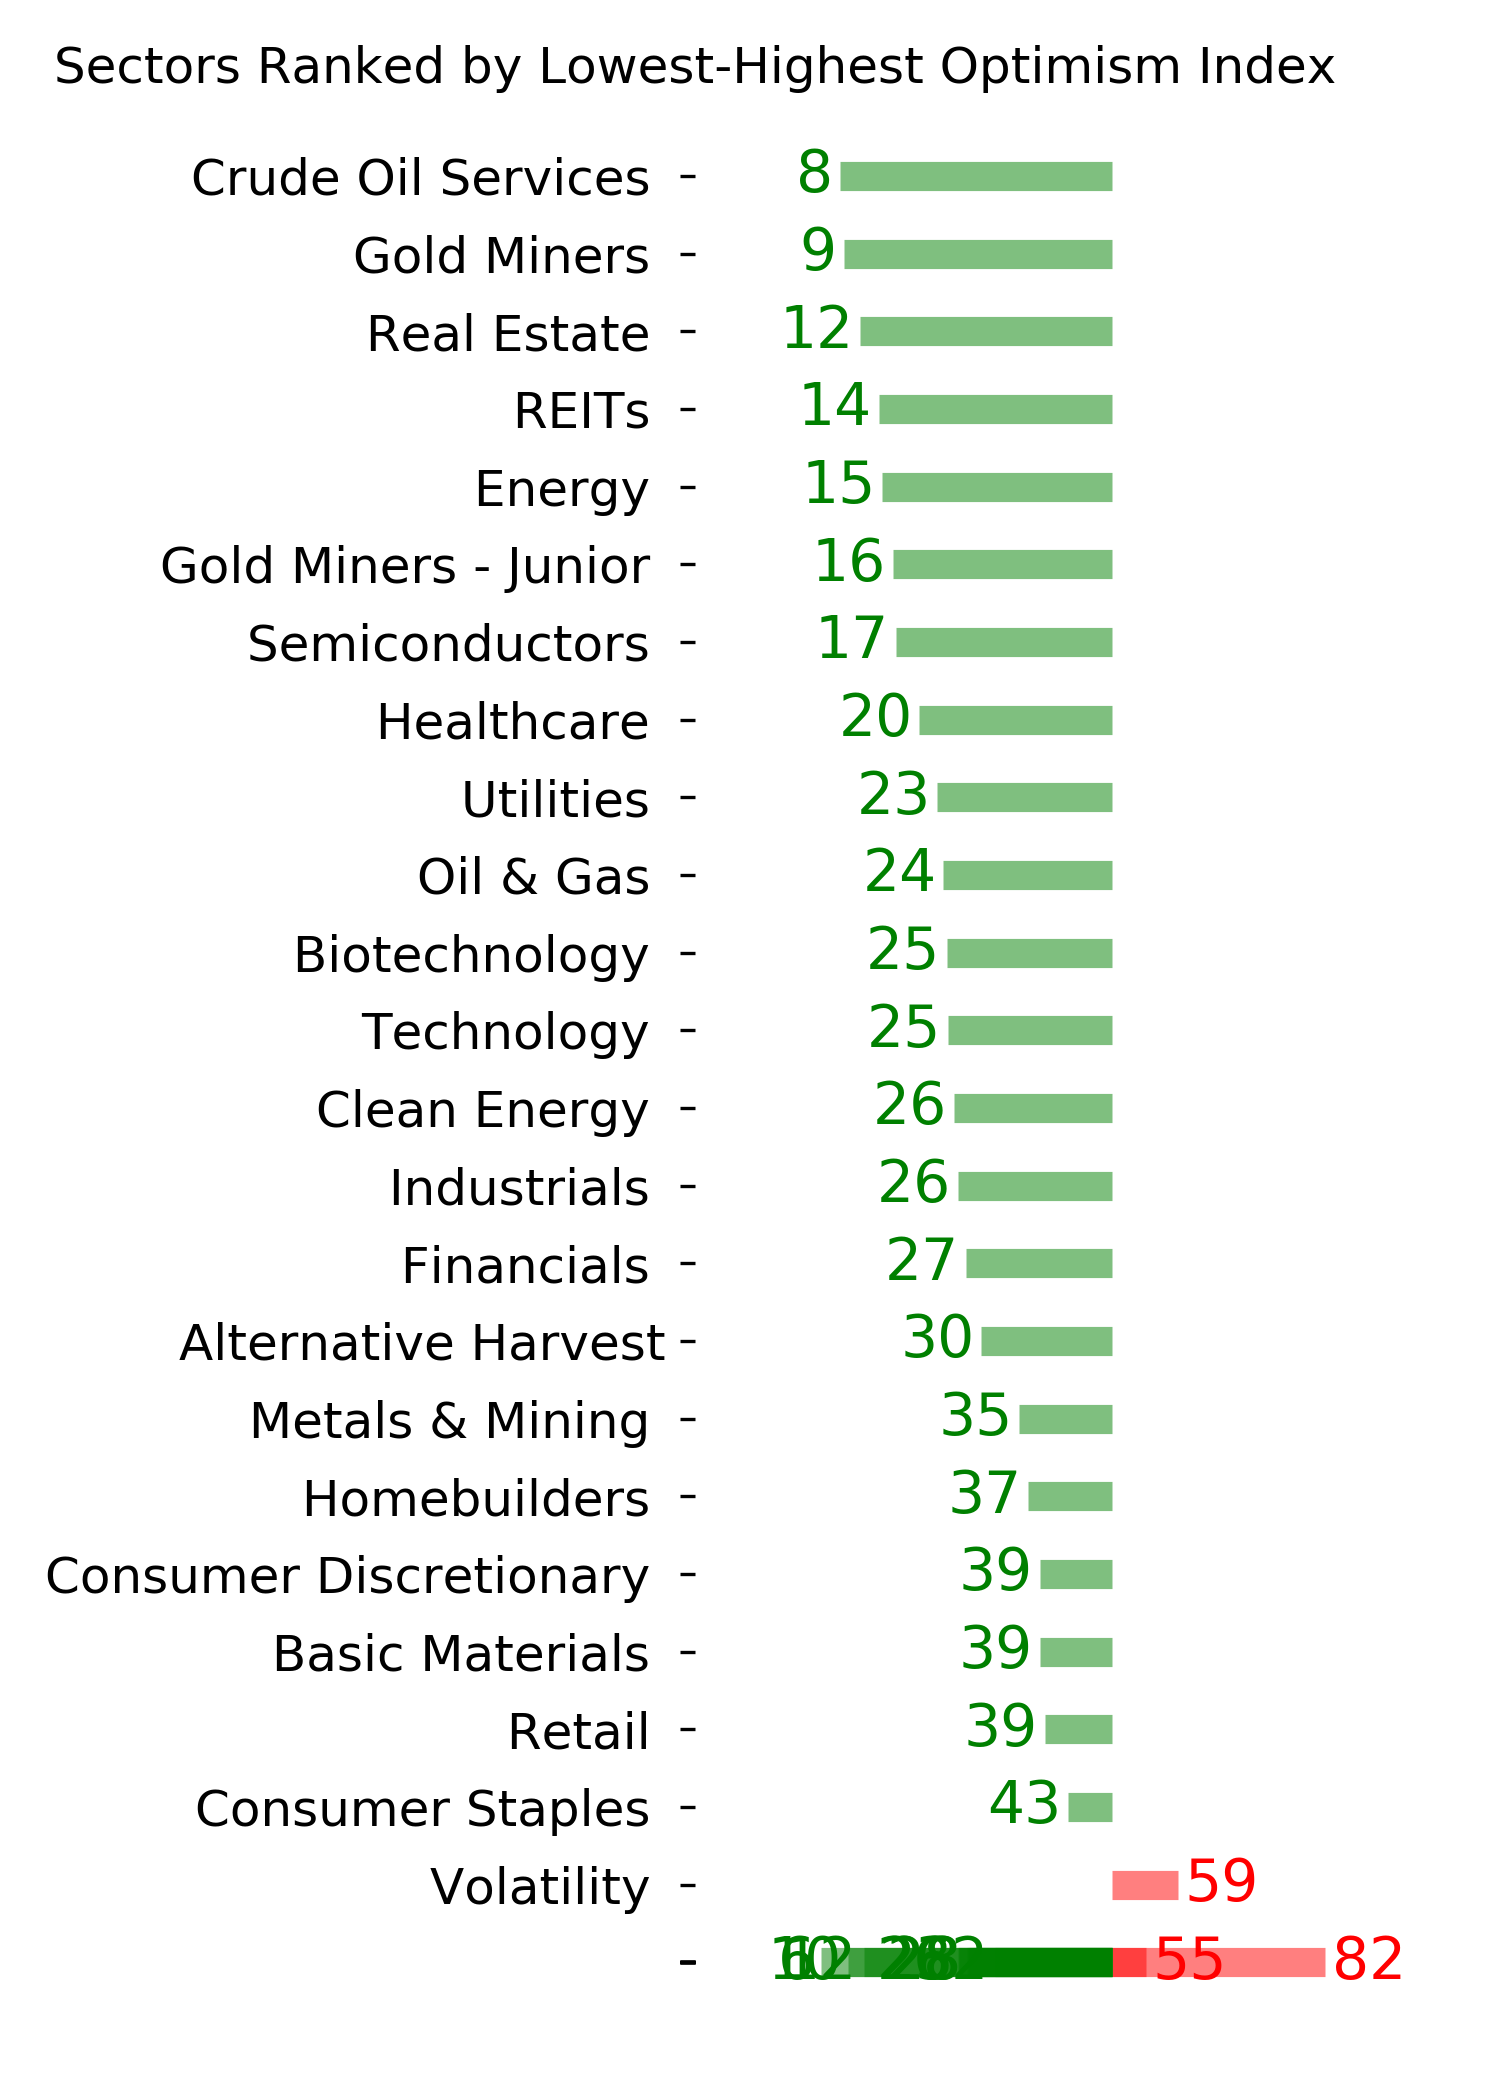
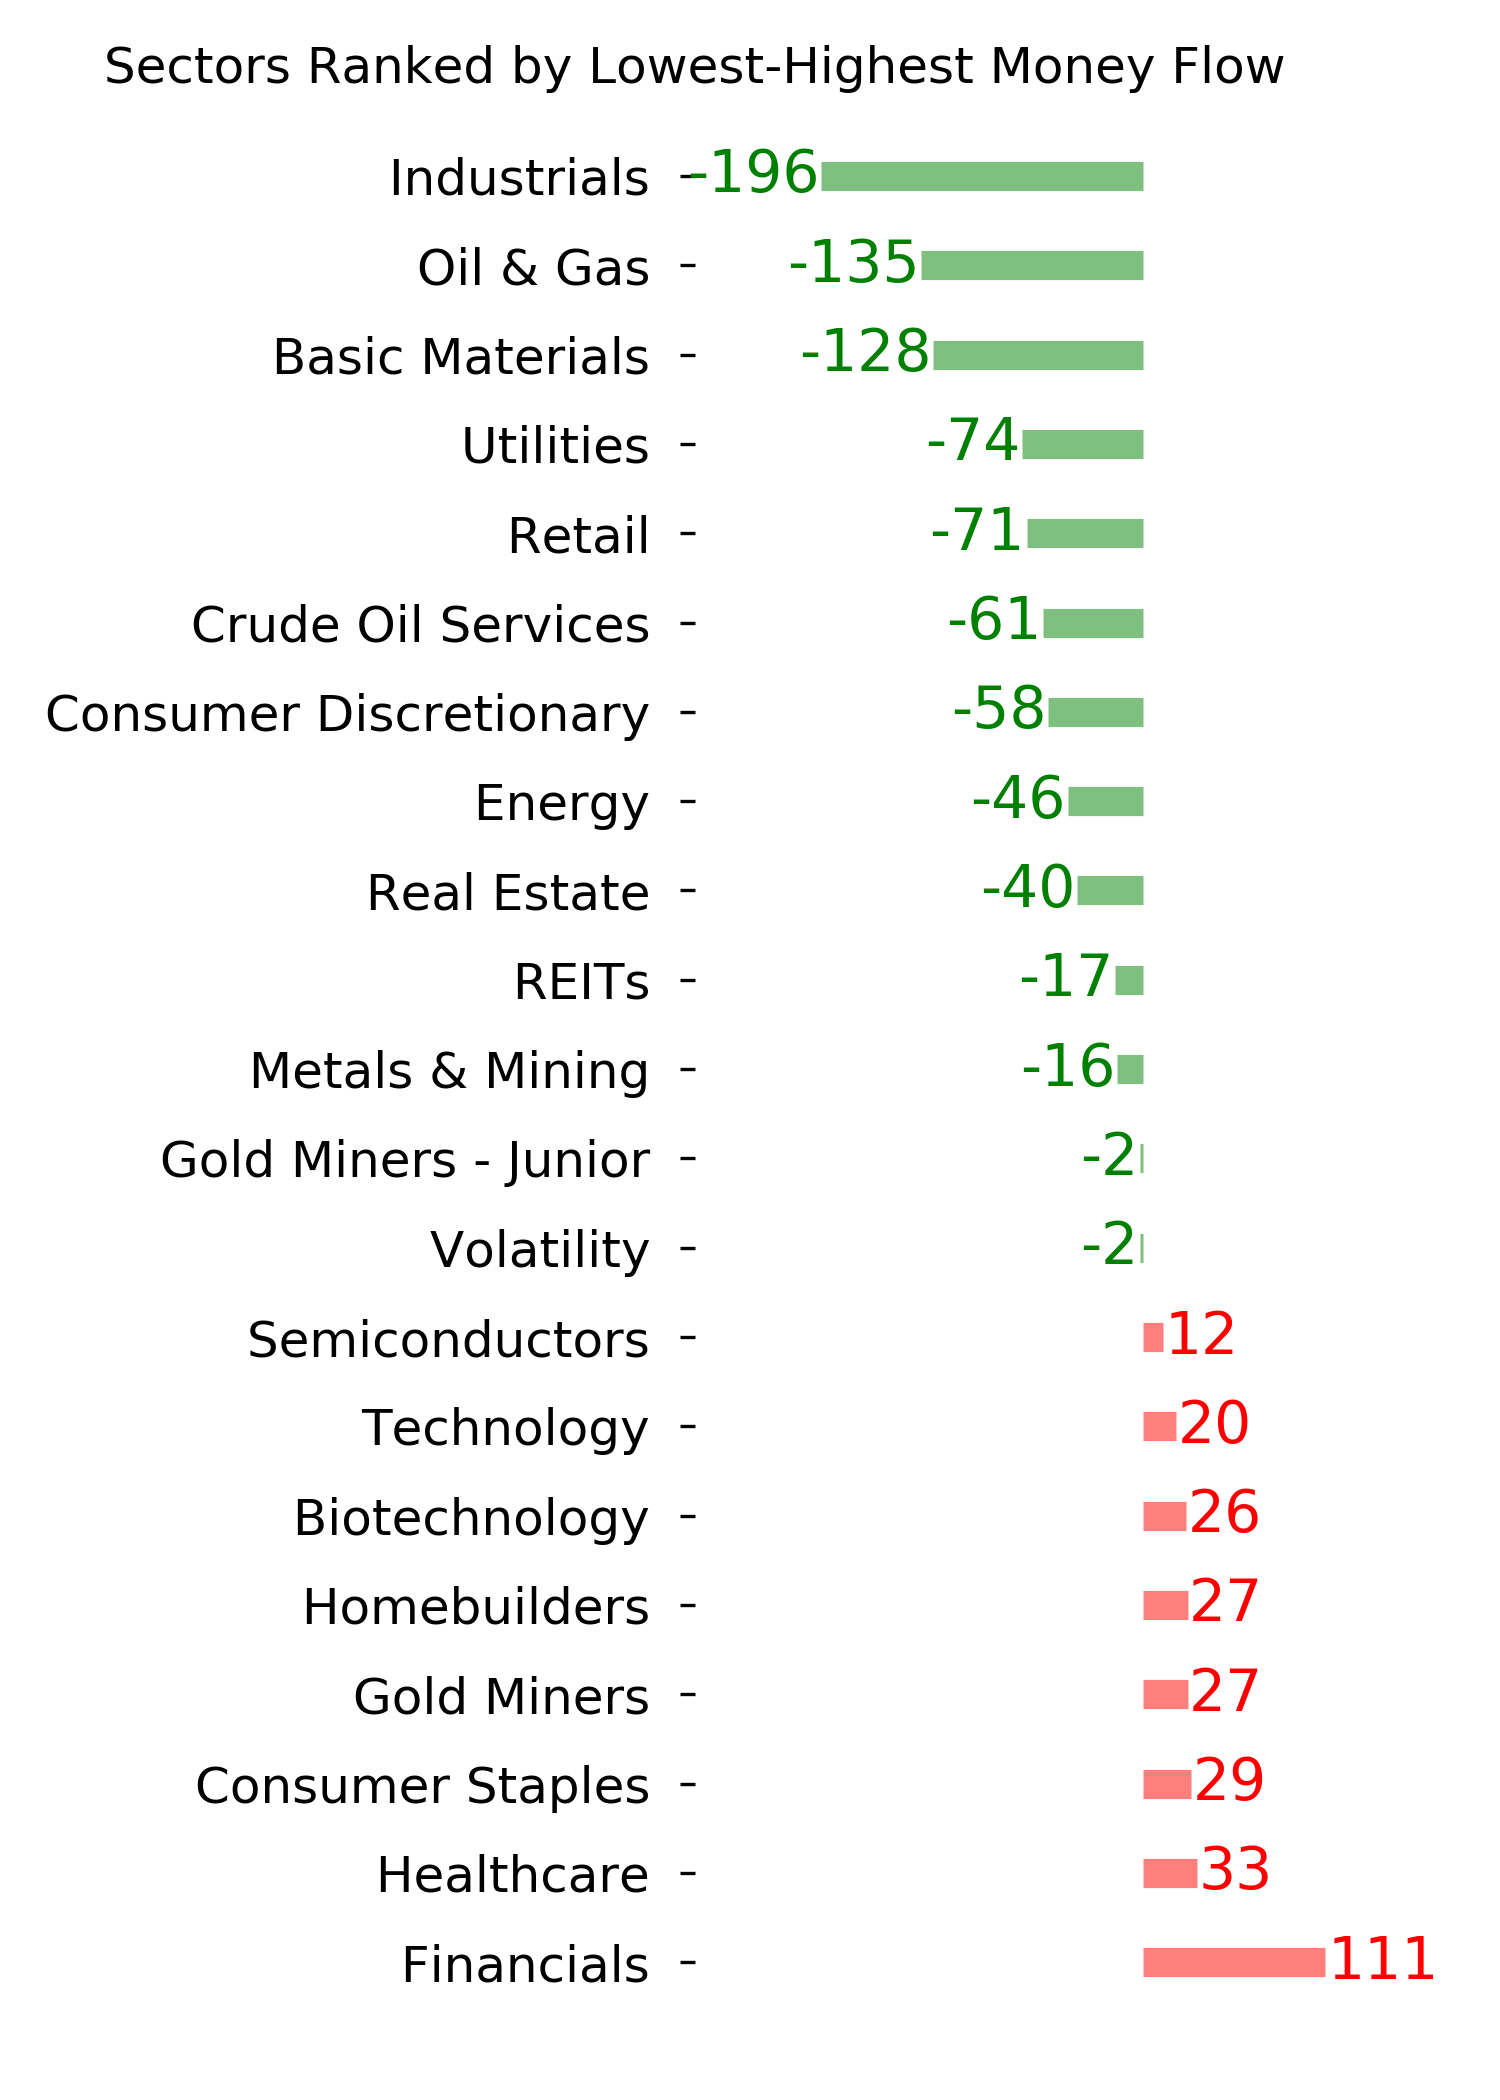
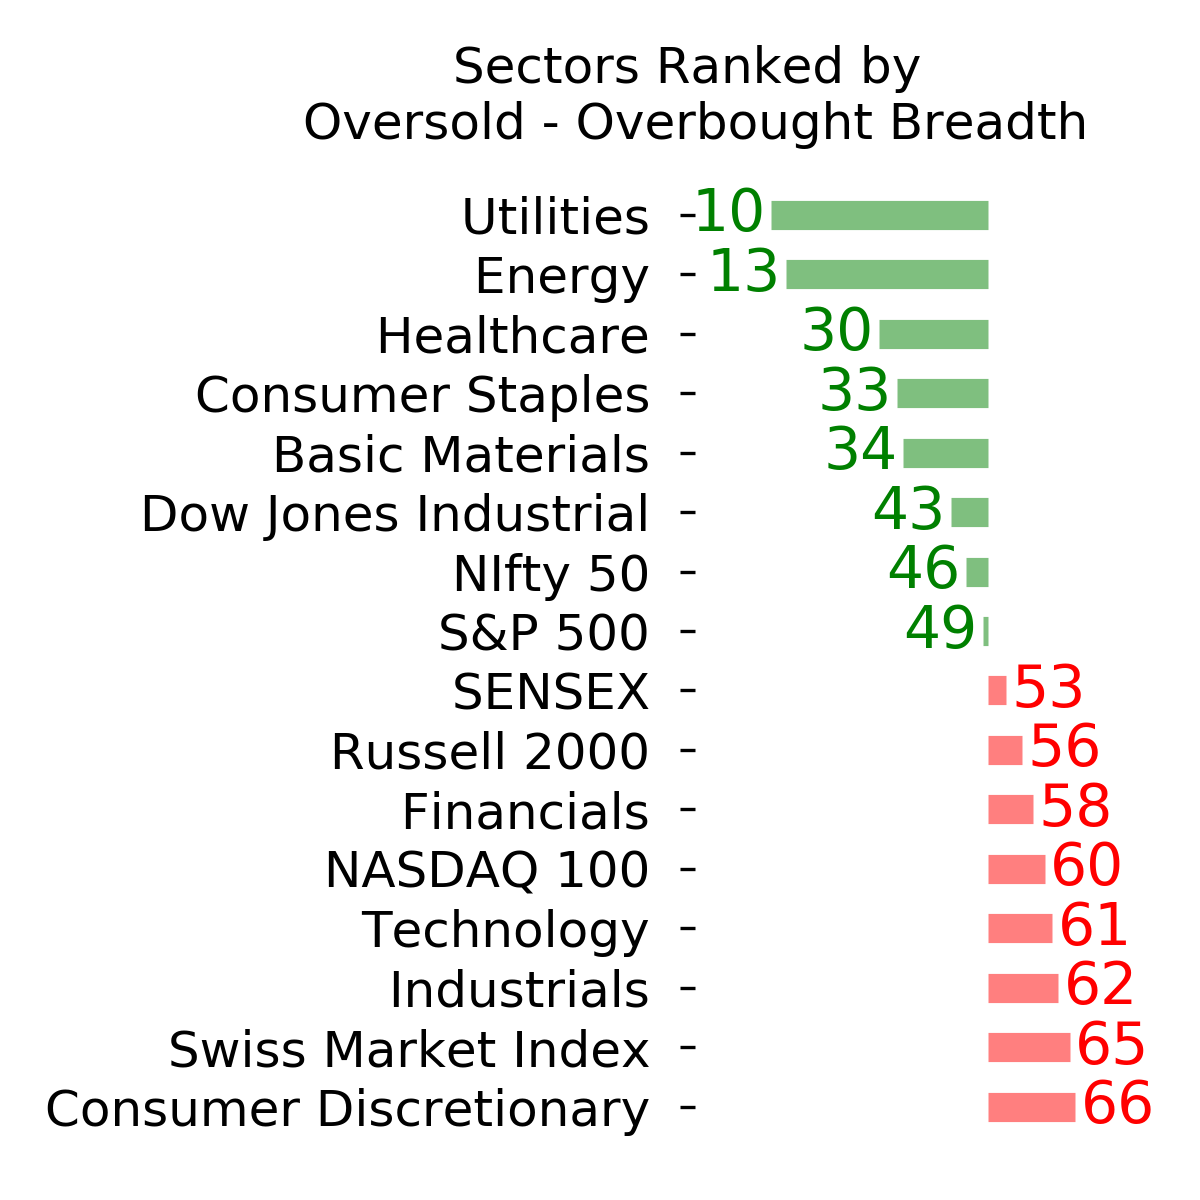
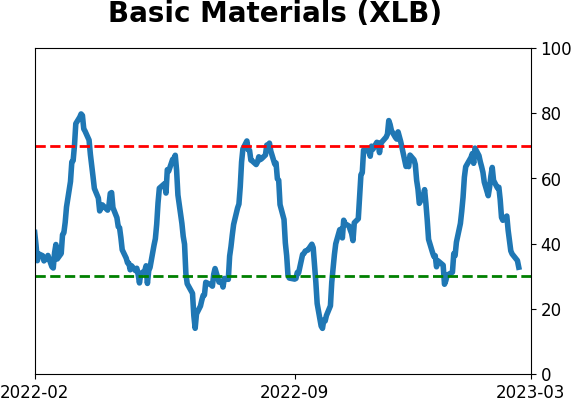
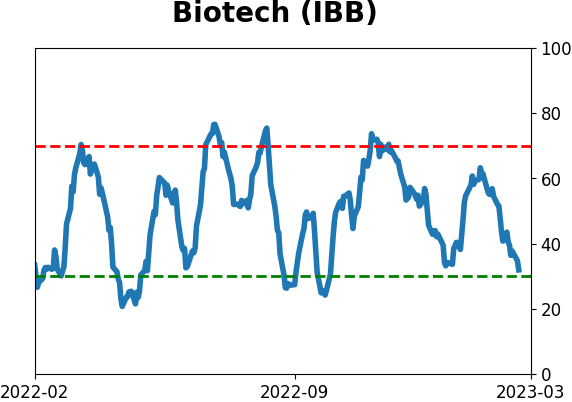
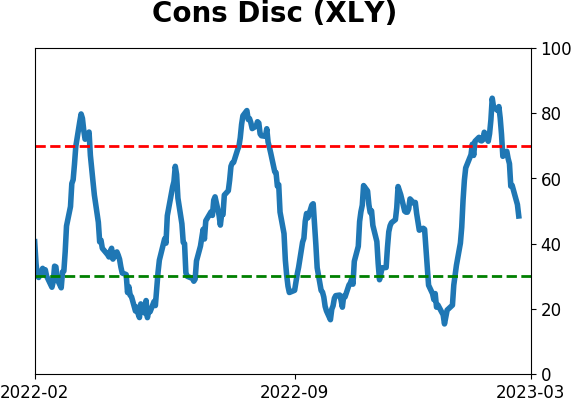
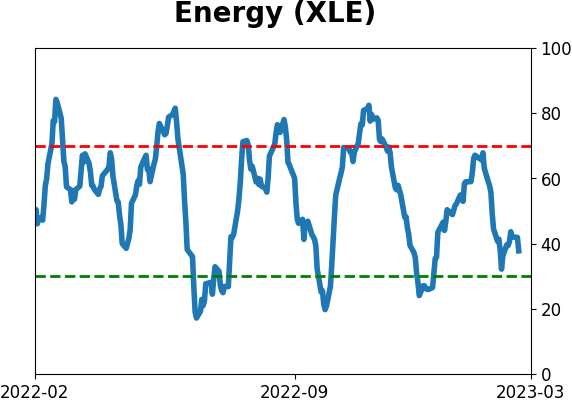
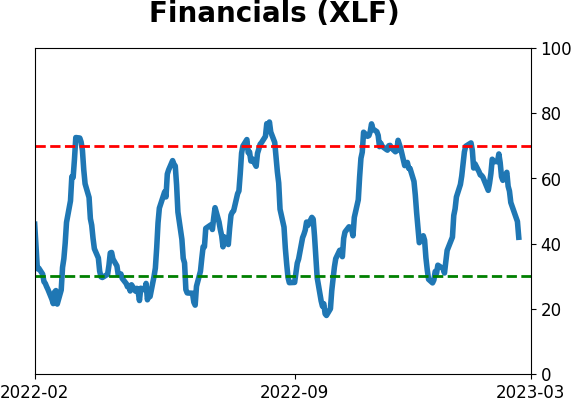
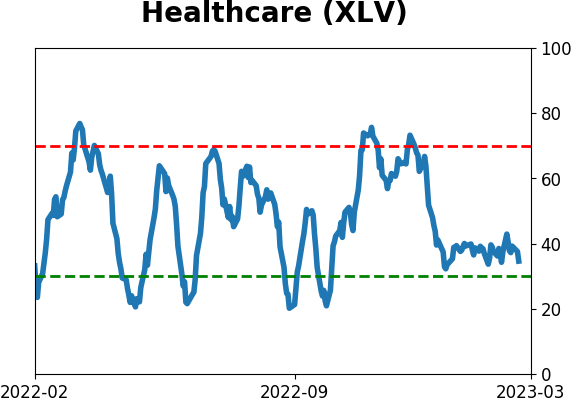
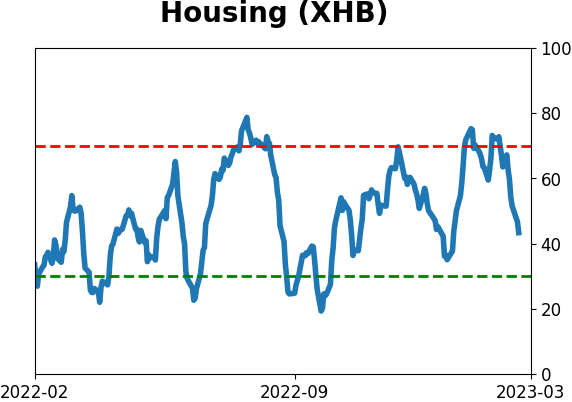
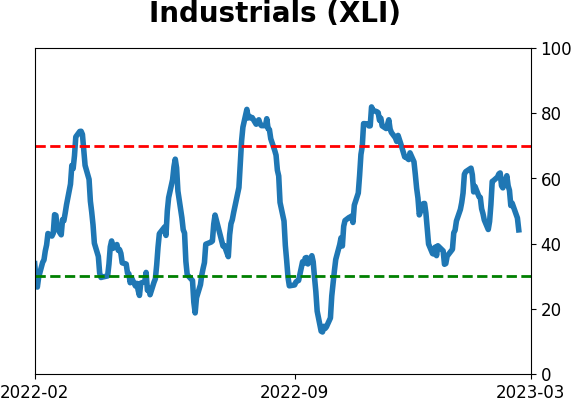
Sector ETF's - 10-Day Moving Average
|
|
|
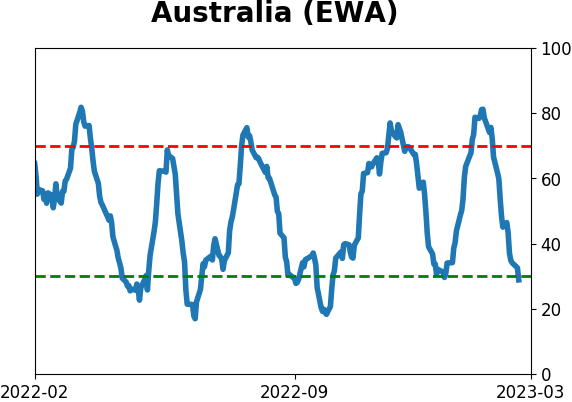
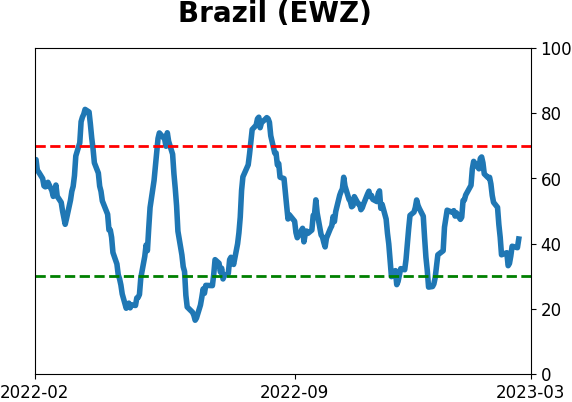
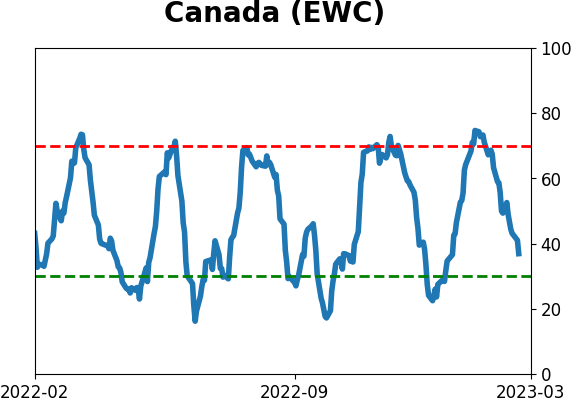
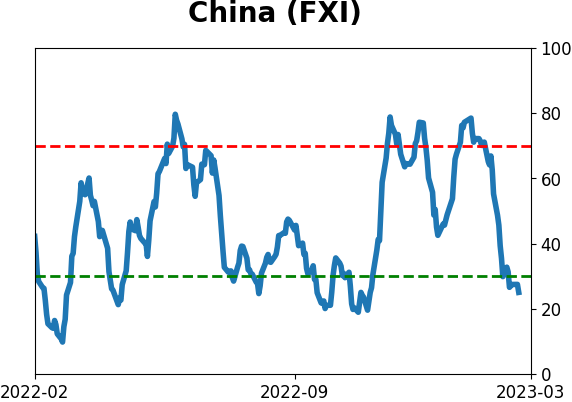
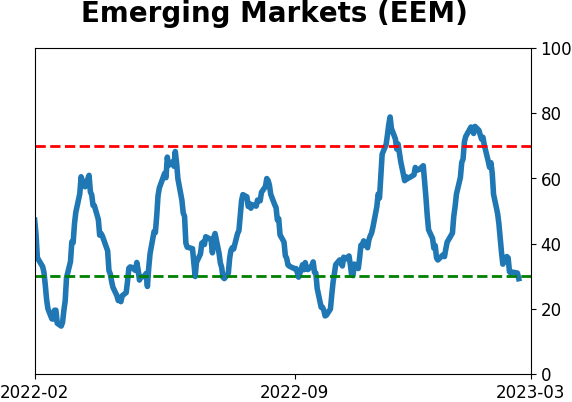
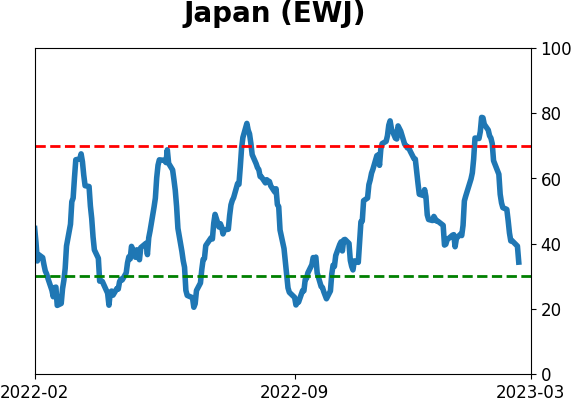
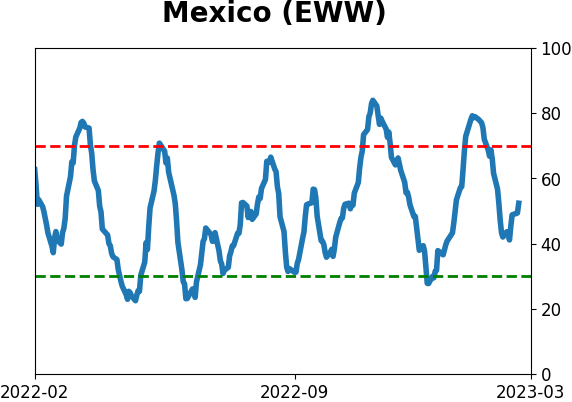
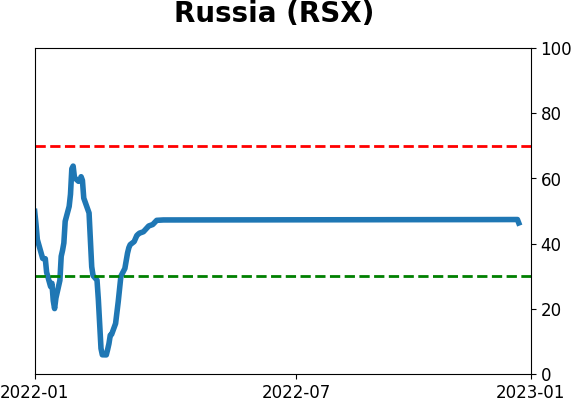
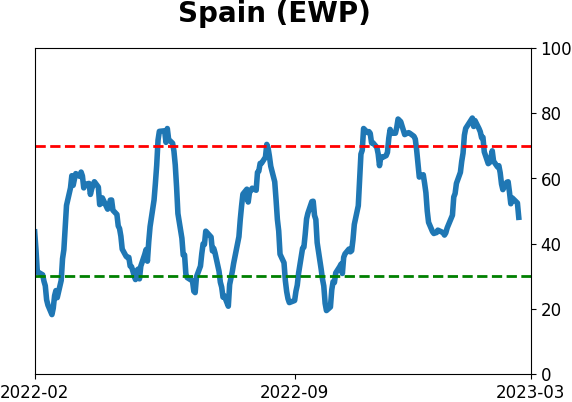
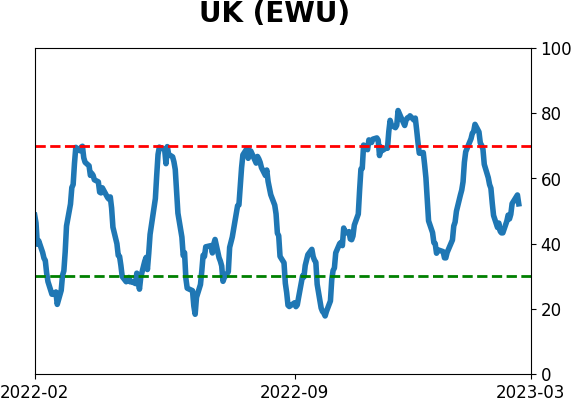
Country ETF's - 10-Day Moving Average
|
|
|
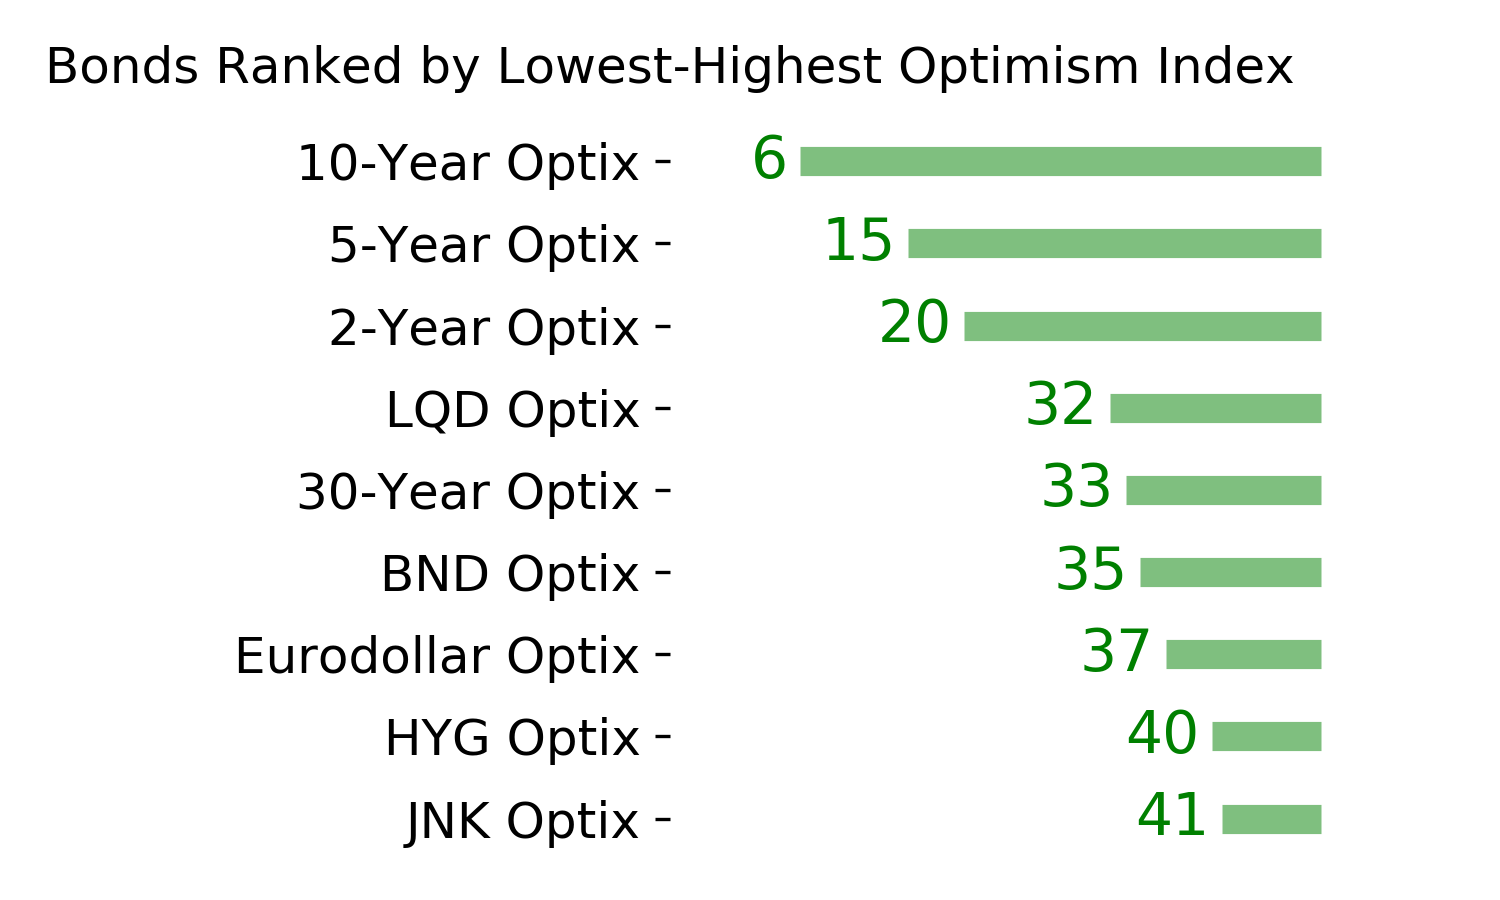
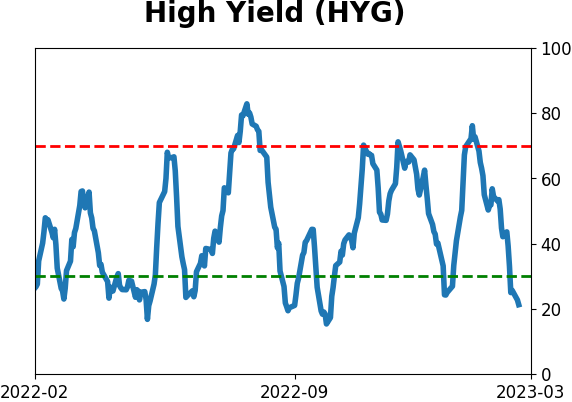
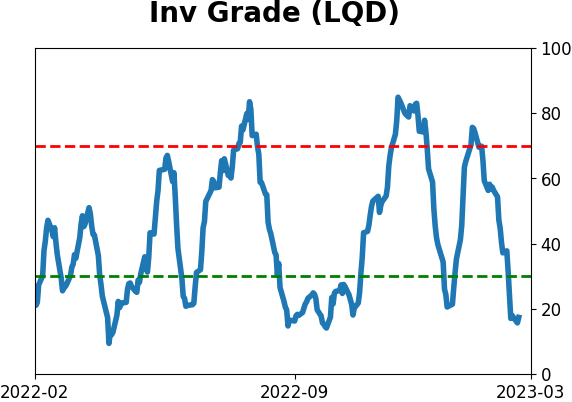
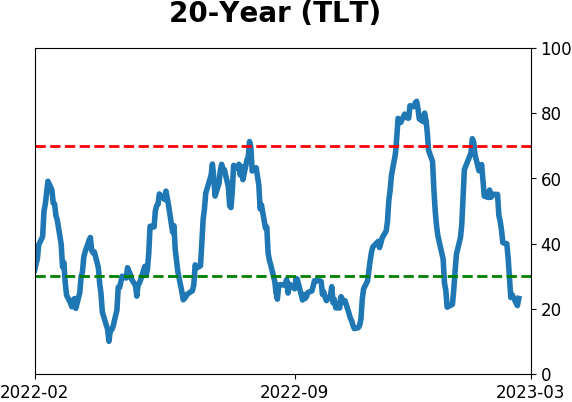
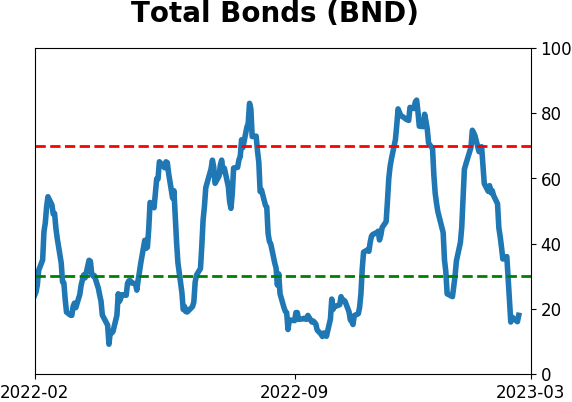
Bond ETF's - 10-Day Moving Average
|
|
|
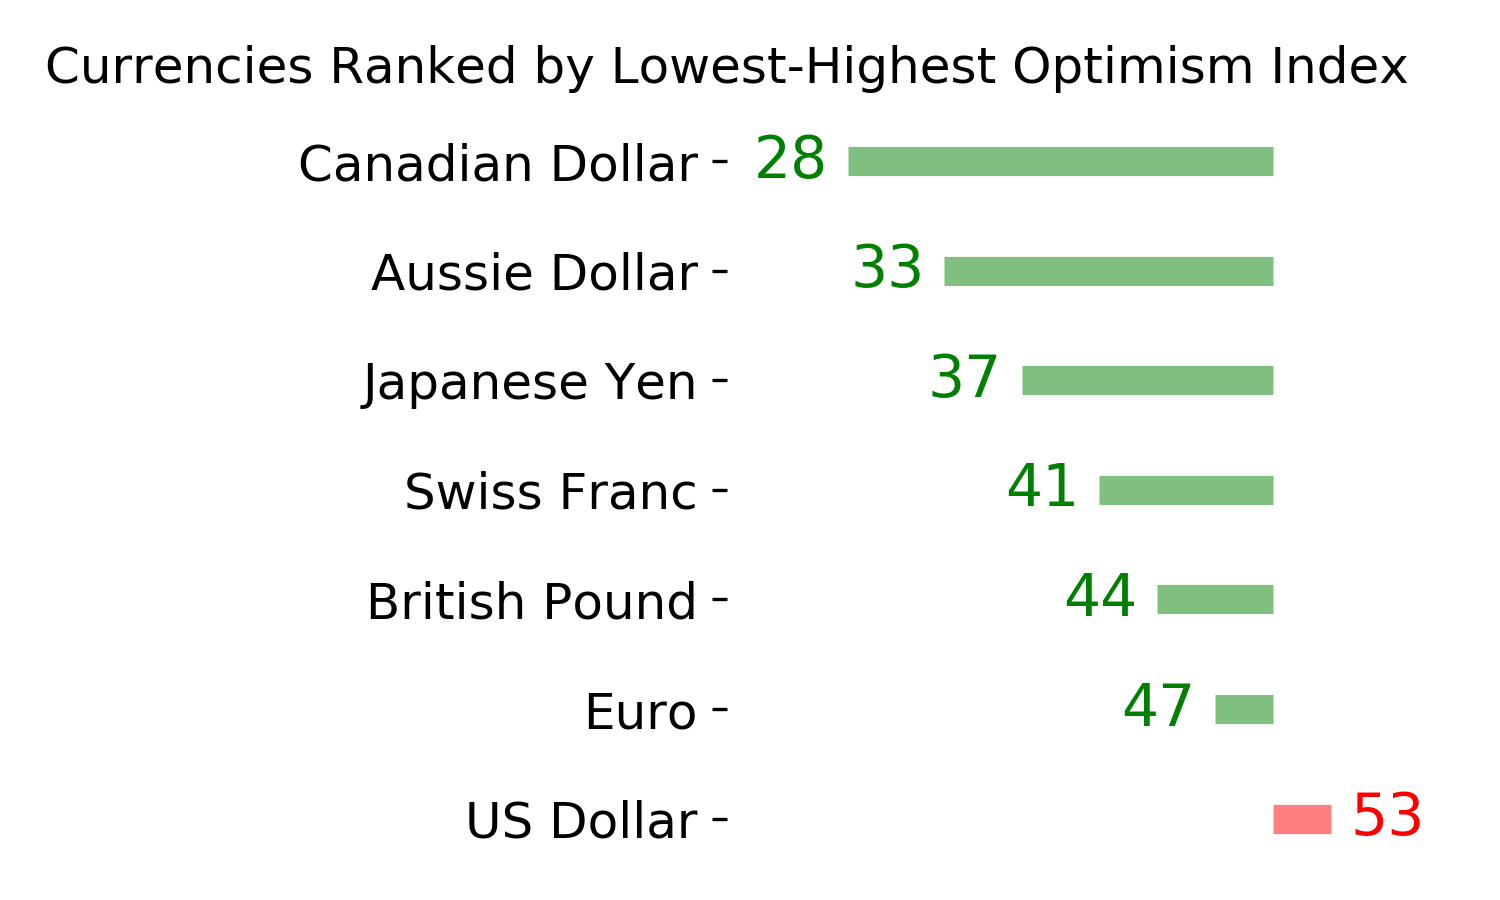
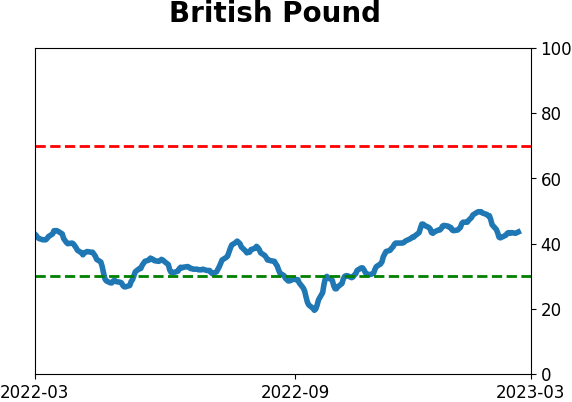
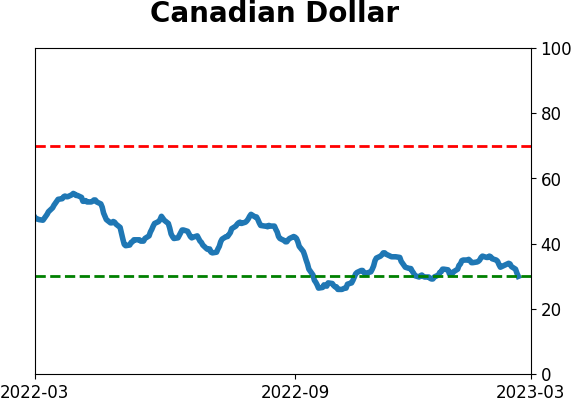
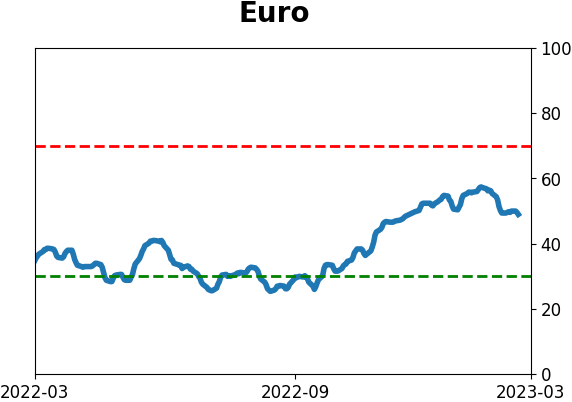
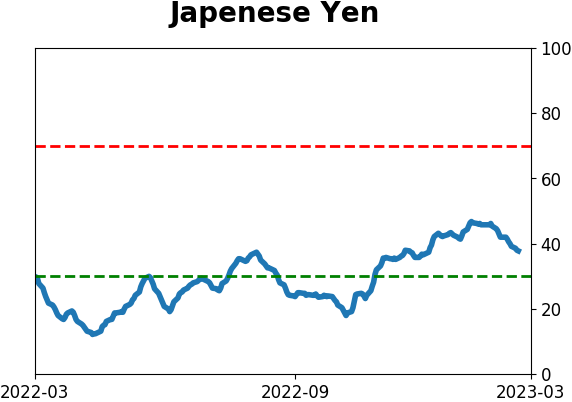
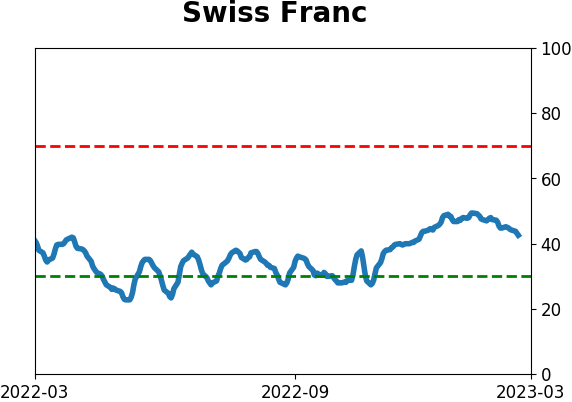
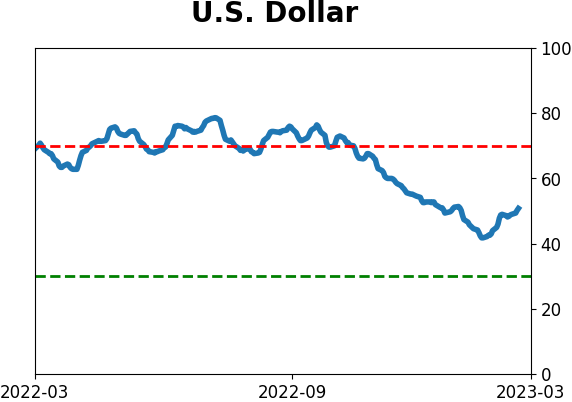
Currency ETF's - 5-Day Moving Average
|
|
|
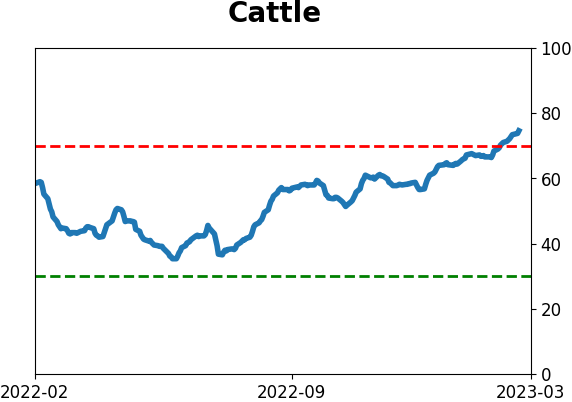
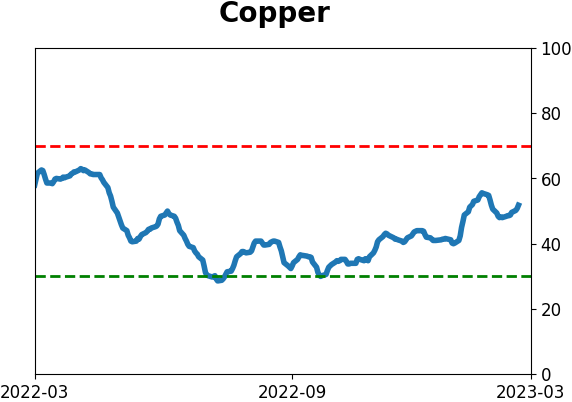
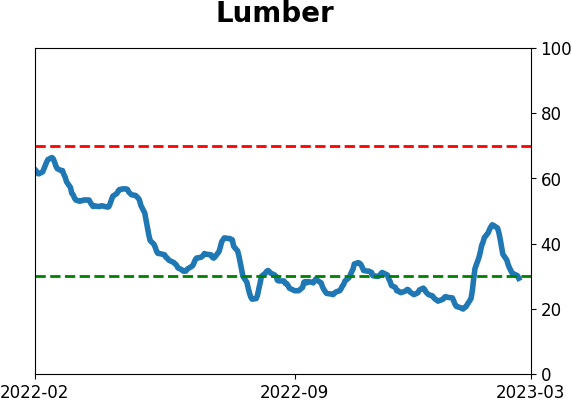
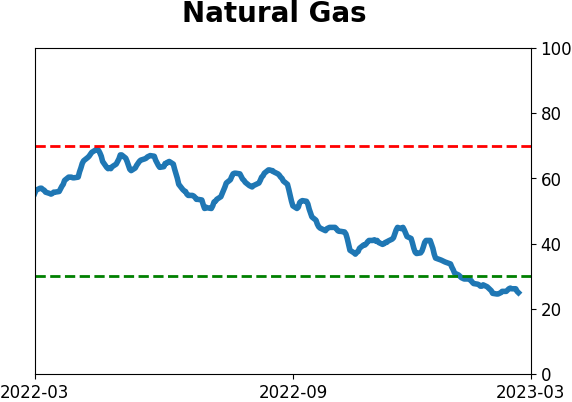
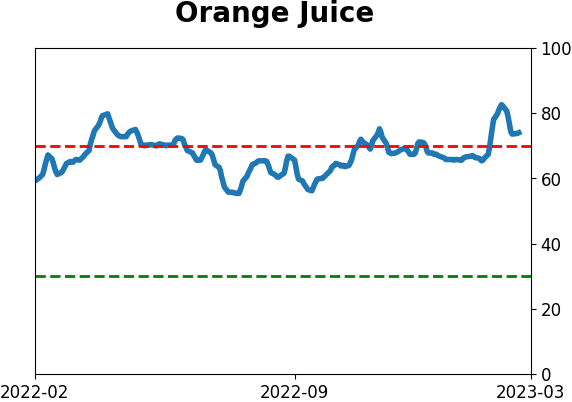
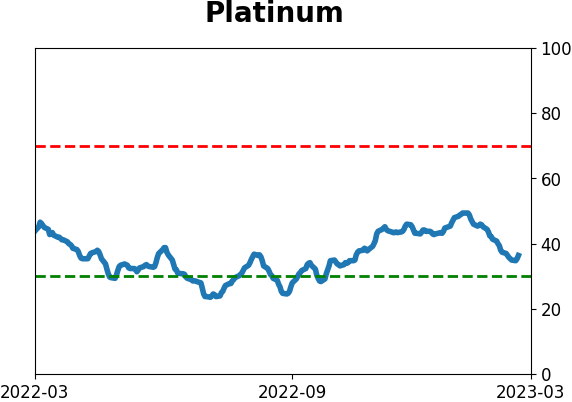
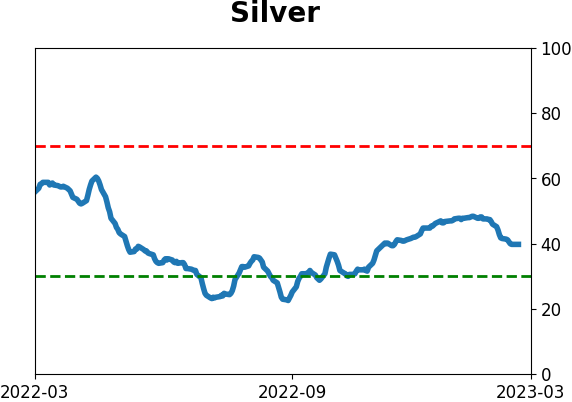
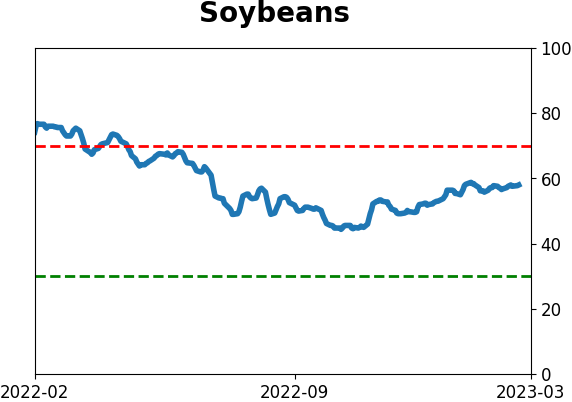
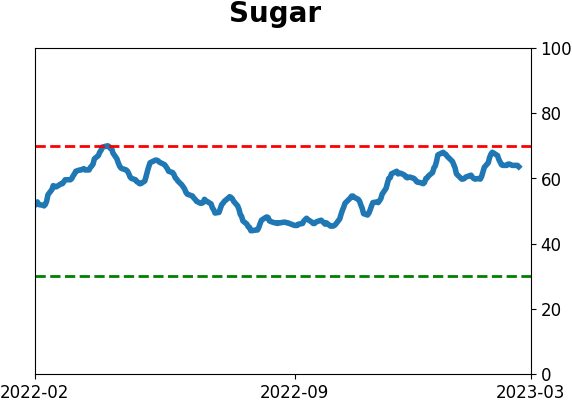
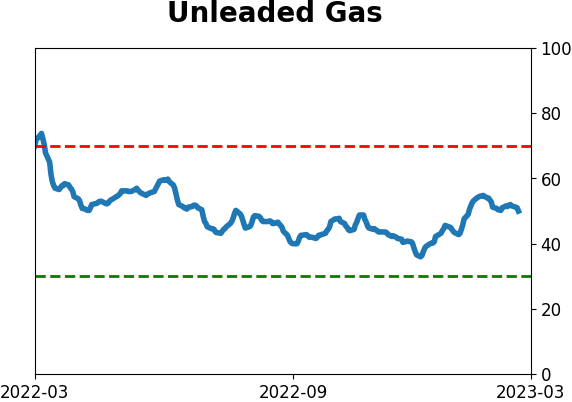
Commodity ETF's - 5-Day Moving Average
|
|