Headlines
|
|
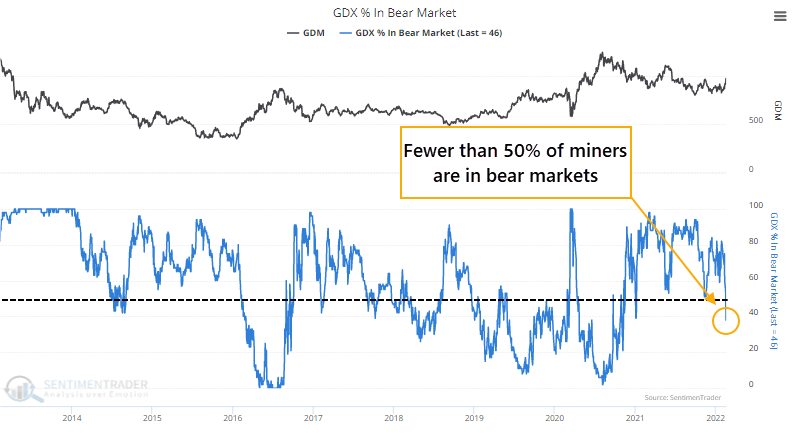
Fewer than half of gold mining stocks are in a bear market:
The surge in gold mining stocks in recent weeks allowed many of them to emerge from bear markets. For the first time in a year, fewer than half are down 20% from their highs. But fewer than 60% are yet above their 200-day moving averages, a sign of an unhealthy environment.
|
Smart / Dumb Money Confidence
|
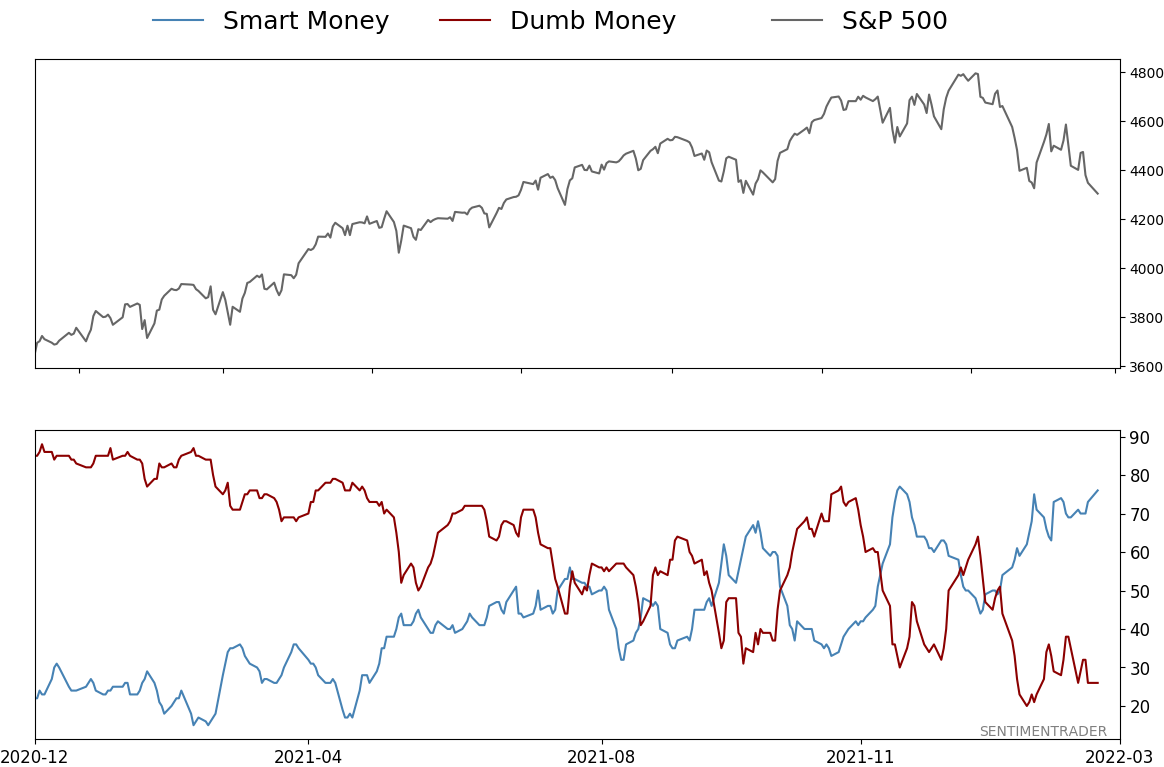
Smart Money Confidence: 76%
Dumb Money Confidence: 26%
|
|
Risk Levels
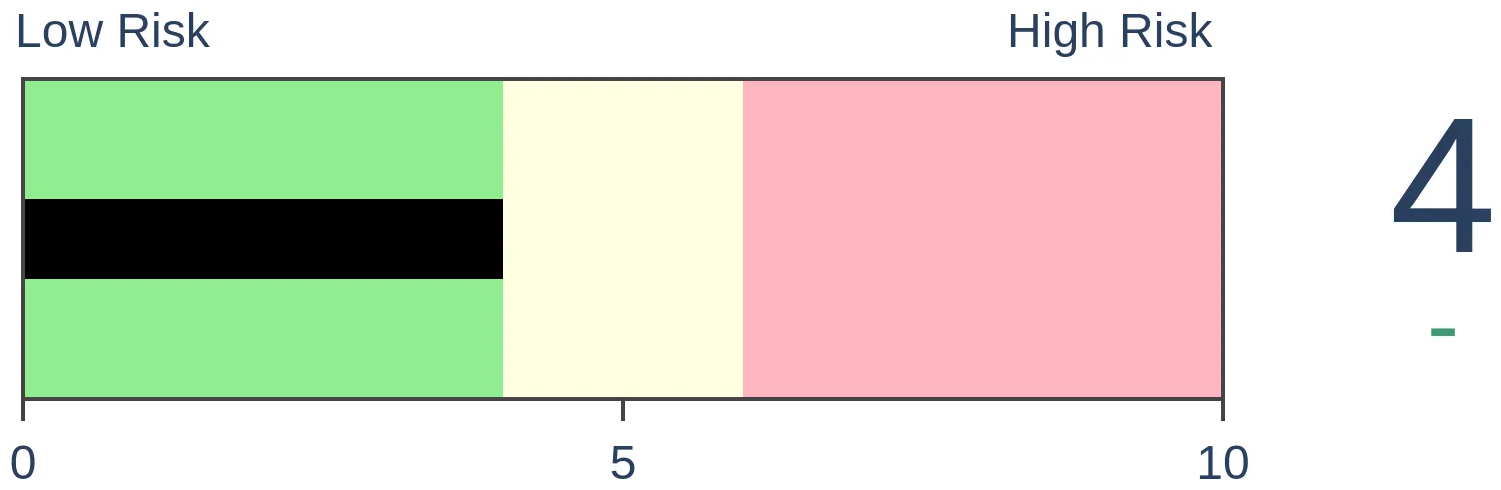
Stocks Short-Term
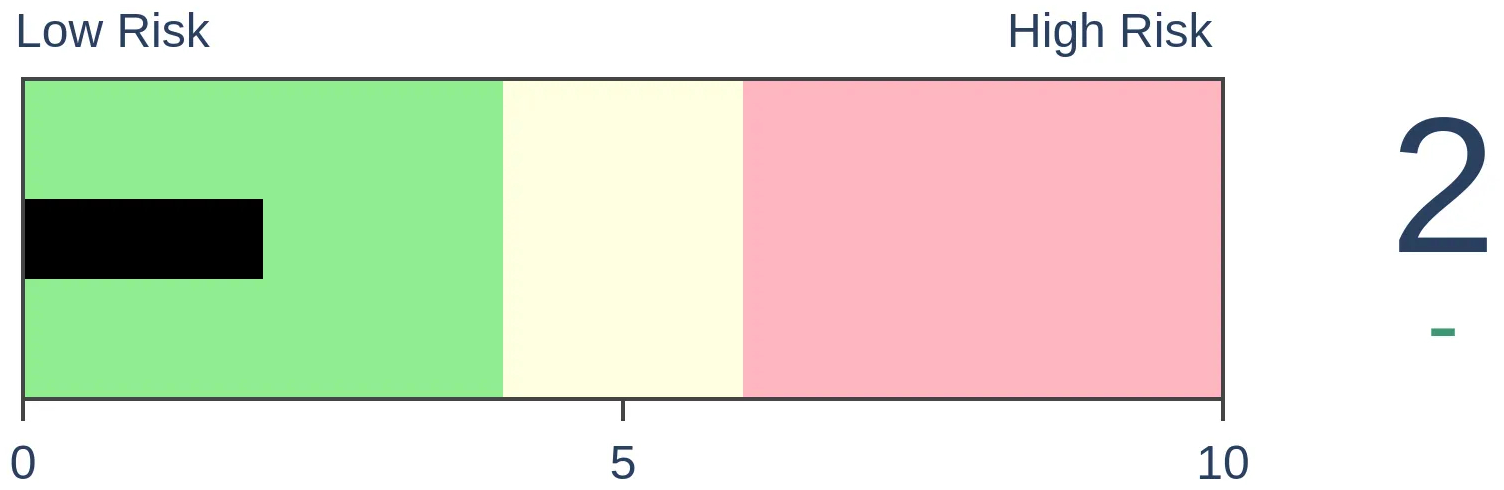
|
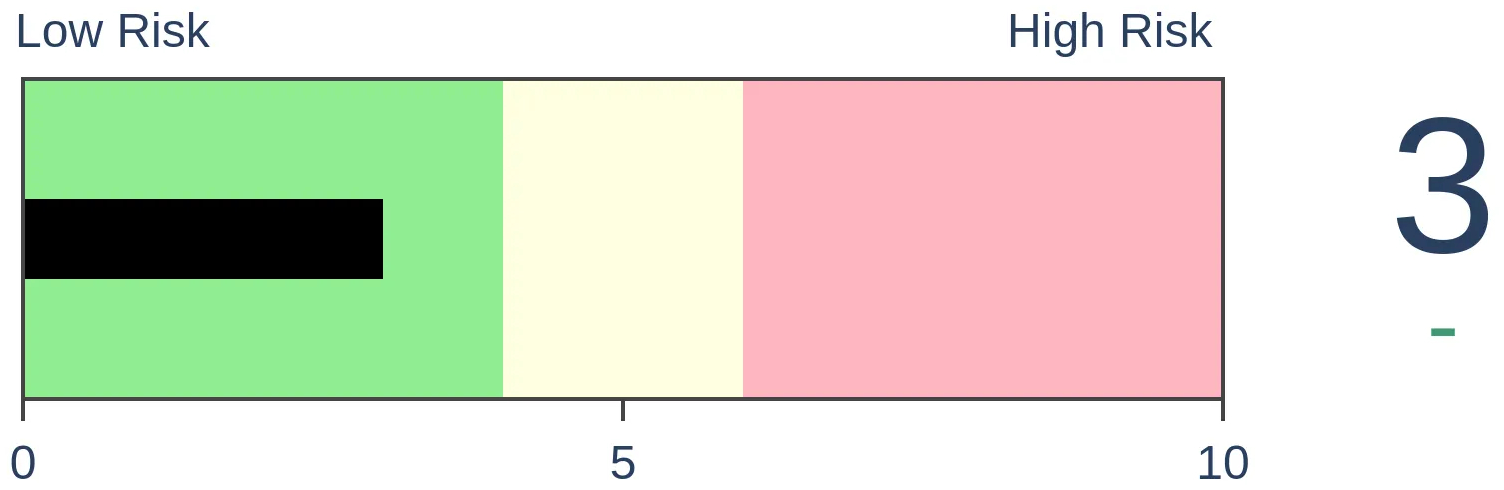
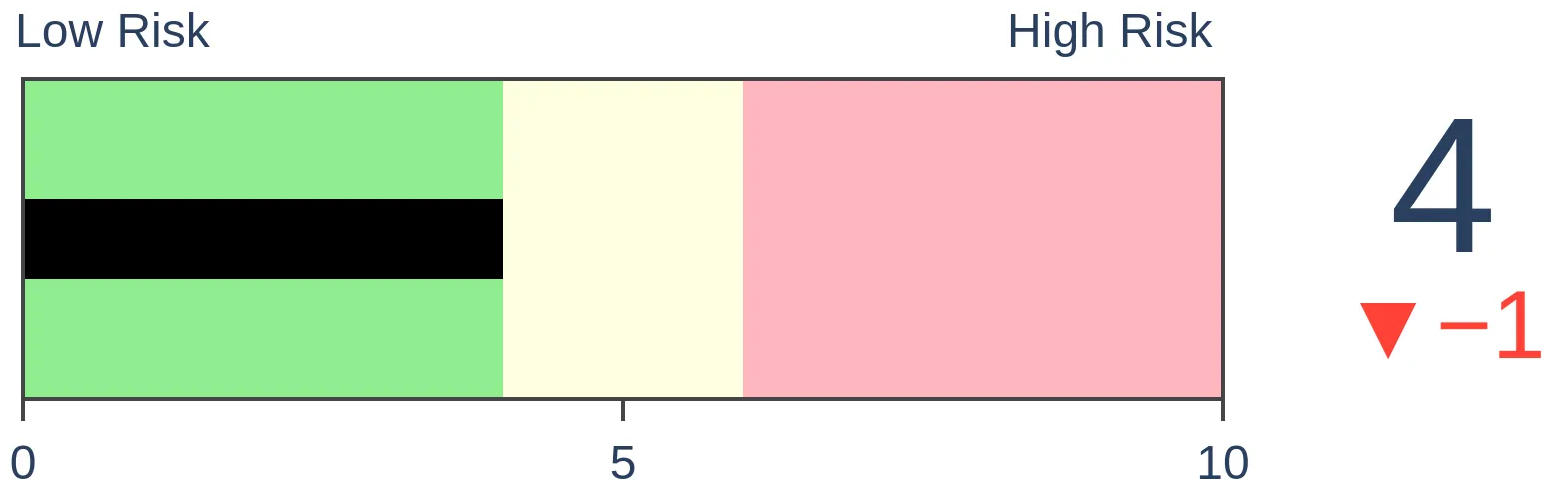
Stocks Medium-Term

|
|
Bonds
|
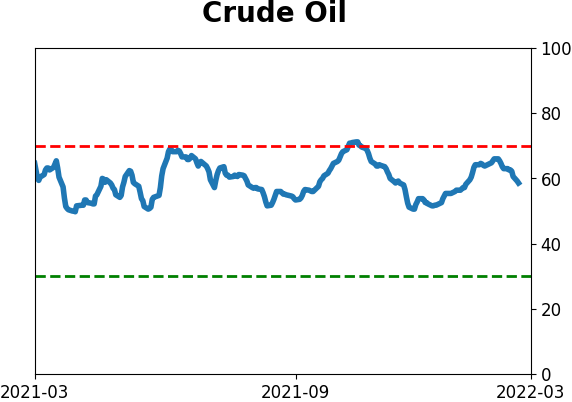
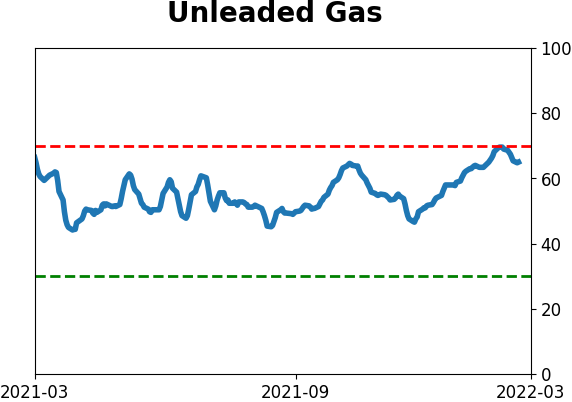
Crude Oil
|
|
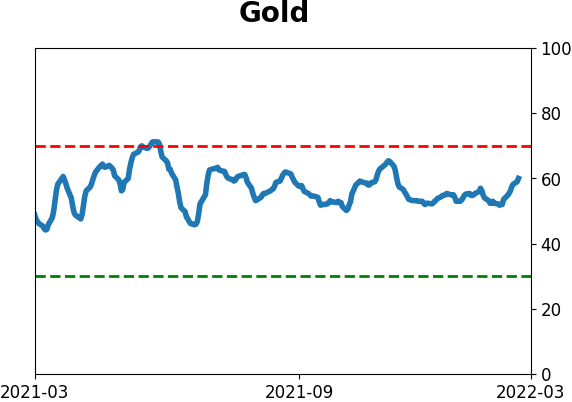
Gold
|
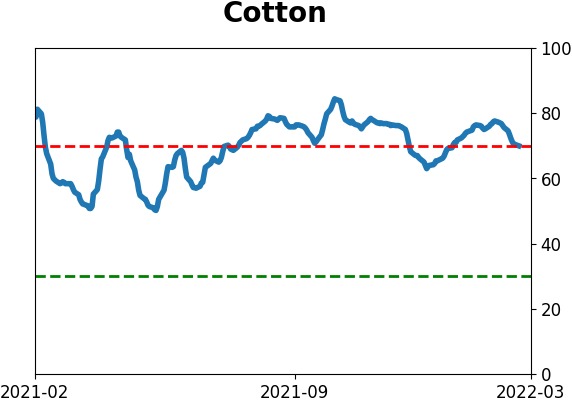
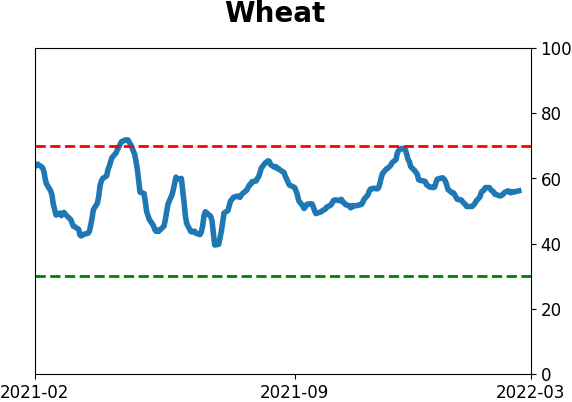
Agriculture

|
|
Research
By Jason Goepfert
BOTTOM LINE
The surge in gold mining stocks in recent weeks allowed many of them to emerge from bear markets. For the first time in a year, fewer than half are down 20% from their highs. But fewer than 60% are yet above their 200-day moving averages, a sign of an unhealthy environment.
FORECAST / TIMEFRAME
None
|
Key points:
- For the first time in a year, fewer than half of gold mining stocks are in a bear market
- There has been a surge in mining stocks above their 50-day moving averages, but not 200-day averages
- Both conditions have led to poor returns, and there is a seasonal headwind
Fewer than half of gold miners are in a bear market
It always seems like gold mining stocks have something to prove. With recent geopolitical and inflationary scares, gold and the companies that mine it are having a moment. They still have to get over the hump.
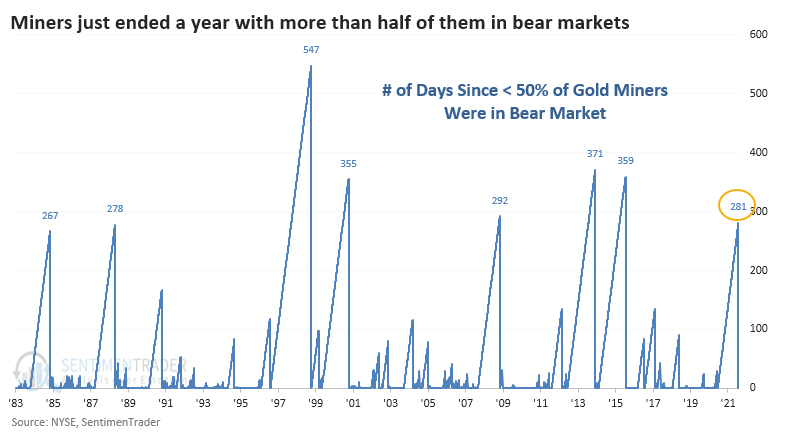
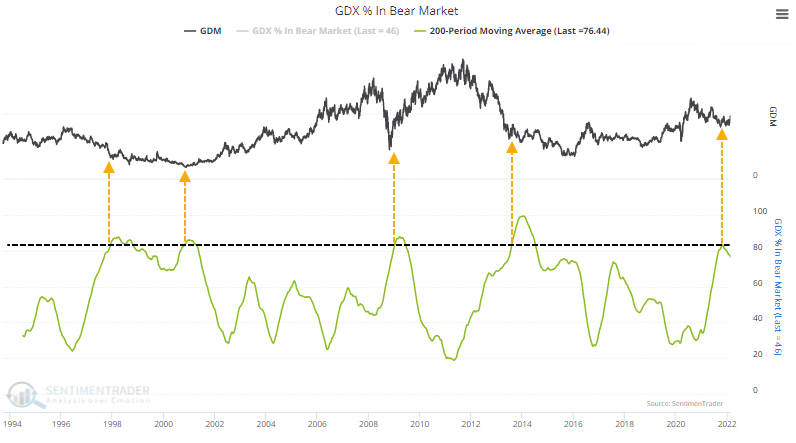
Gold bugs are getting excited because, for the first time in over a year, fewer than half of mining stocks are mired in a bear market. That's a pretty good dividing line between secular bull and bear markets in gold mining indexes. When more than half of the stocks are down 20% or more, stay out. Bull markets tend to see this figure stay below 50%, which should be a good sign for the current move.
We'd gone more than a year with more than half of miners in a bear market. This ends one of the longest streaks in 40 years.
Again, this should be a good sign, but historically it was not. Miners struggled mightily over the next 1-4 weeks to hold onto those gains. While gold bugs tend to be passionate investors, it's been a tough sell to attract mainstream investment dollars even when (or especially when) momentum turns positive.
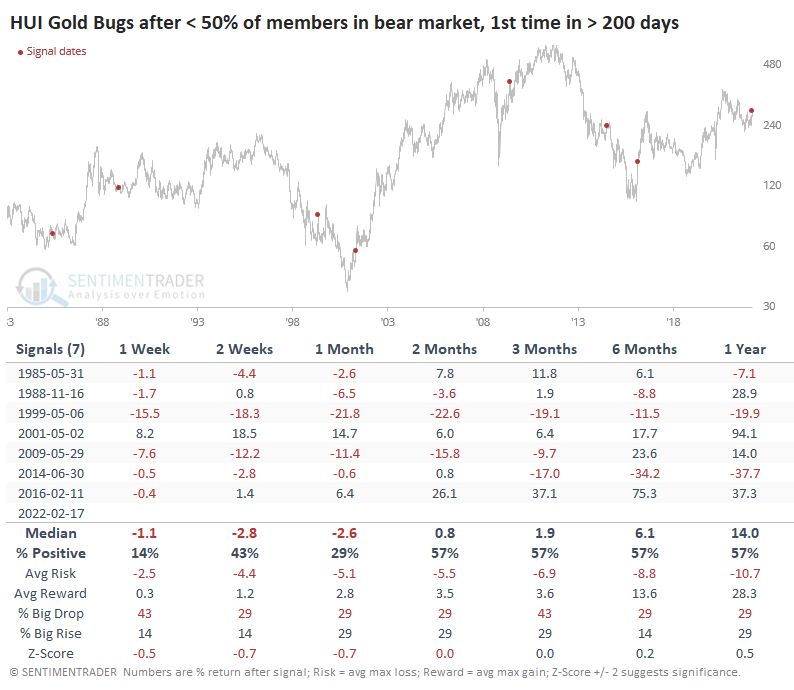
The sample size is tiny, but there was a decent correlation to how miners performed short-term vs. long-term. If sellers returned immediately and aggressively, the stocks didn't really recover. But if the newfound momentum could attract more investors, then it was a better sign for long-term returns.
Only twice, in May 2001 and February 2016, did mining stocks continue to rally without looking back. Gold bulls would argue that both were periods when investors were distrusting mainstream financial markets, particularly equities domestic and abroad. The same could be said now.
A surge in medium-term uptrends, but not long-term
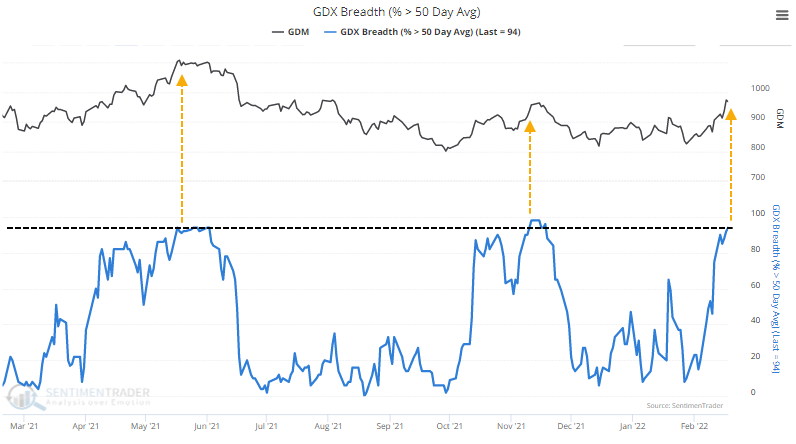
As miners surged in recent weeks, more than 93% of them closed above their 50-day moving averages. Over the past year, this high of a figure coincided with overbought readings and a stall in the rallies.
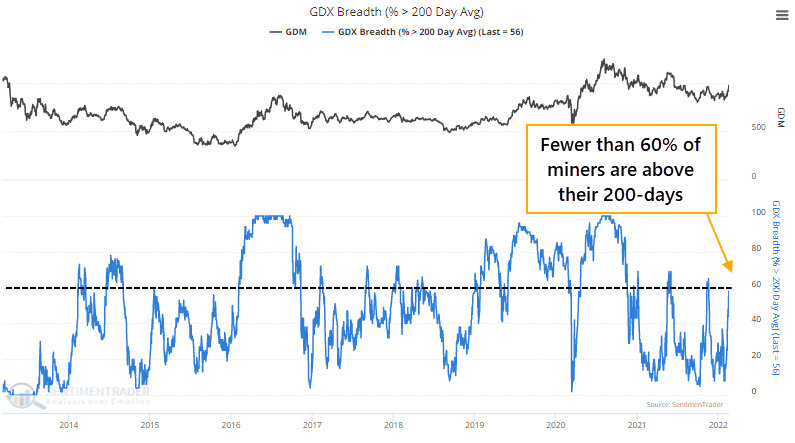
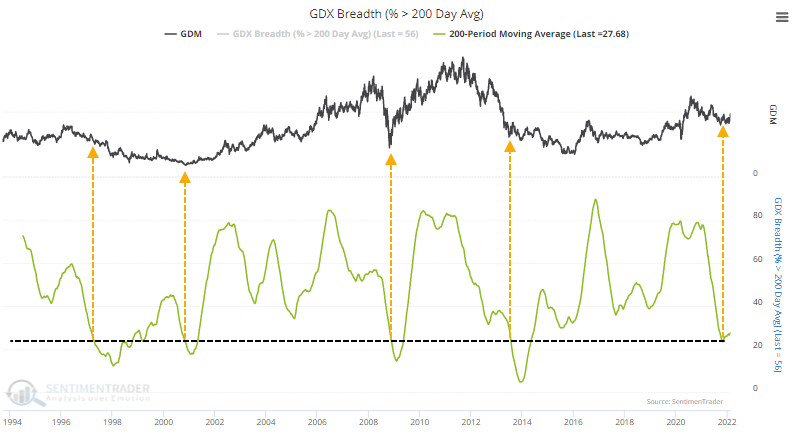
Just as concerning, fewer than 60% of miners have recovered above their 200-day moving averages. As we see in almost all sectors and broad indexes, healthy environments tend to see more than 60% of member stocks holding above their long-term averages, with dips below 40% coinciding with bottoms.
In unhealthy environments, we tend to see fewer than 40% of members above their 200-day averages, with rallies above 60% quickly bringing in sellers. That's what we've seen for the past year.
When more than 93% of miners rallied above their 50-day averages while fewer than 60% closed above their 200-day averages, miners struggled to add to their gains. Over the next 1-2 months, only 36% of signals showed a gain, and average returns were well below random. Out of 14 signals, 13 showed a loss either 1 or 2 months later.
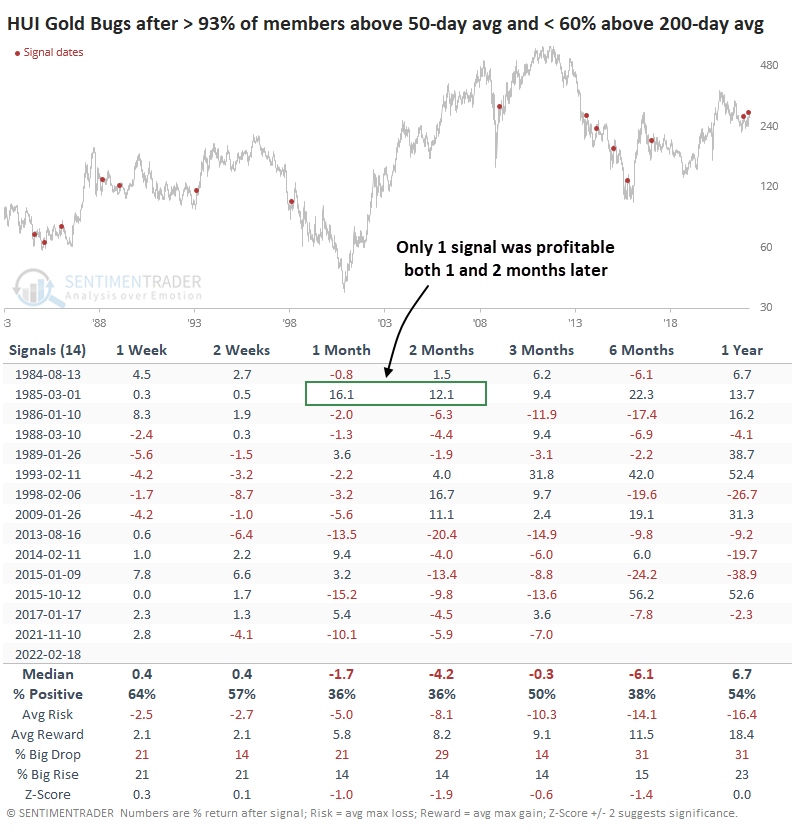
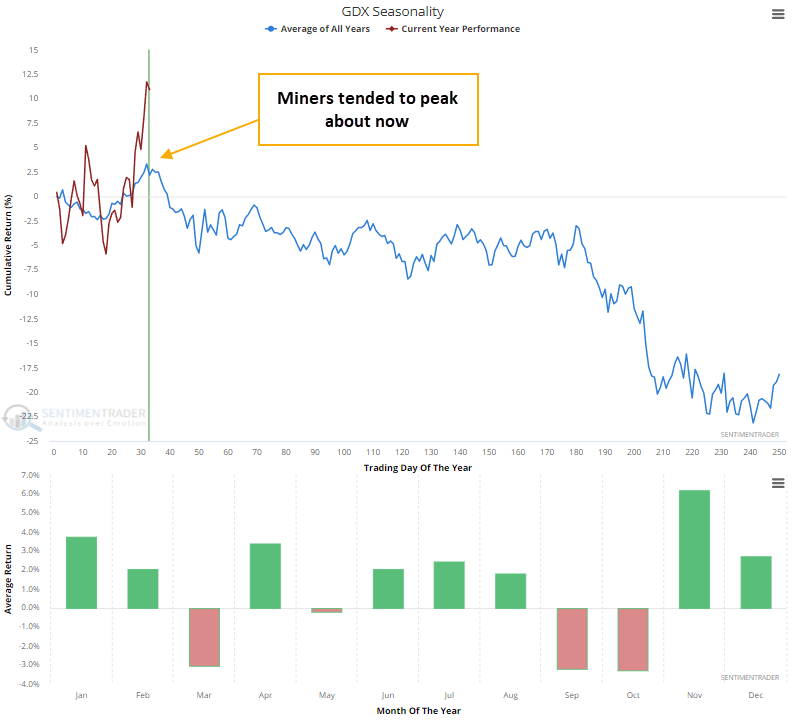
As a further headwind, the seasonal window for gold miners now turns decidedly negative. The GDX fund's worst months have been March, September, and October, with its seasonal peak occurring right about now. Seasonality is not a reliable factor in any given year, but generally, we'd prefer to have the breeze at our back rather than in our face.
Long-term potential
One of the most compelling arguments suggesting that this time might be different for gold mining stocks is simply how long they've been left out in the cold. When we look at 200-day moving averages of a couple of the indicators from above, it's clear that the stocks have been on the back burner for a long time.
On an average day over the past 200 sessions, fewer than 30% of mining stocks held above their 200-day averages. That didn't mean much in 1997 or 2013 but was as washed out as the bottoms in 2001 and 2009.
The same goes for the percentage of mining stocks mired in a bear market. More than 80% of them had been down 20% or more from their 52-week high on an average day over the past 200 sessions.
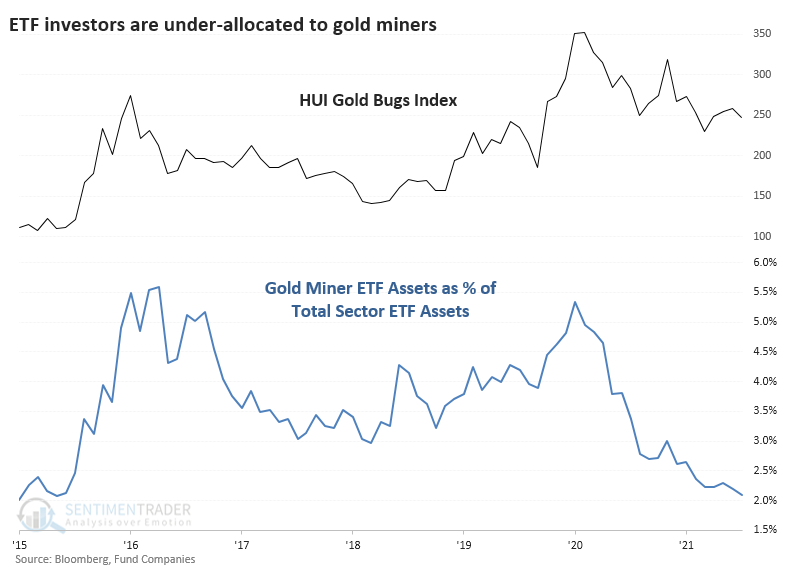
Even more compelling, ETF investors have seemingly left the group for dead. Total fund assets in the 7 largest gold mining ETFs are barely 2% of total sector ETF assets. That's the lowest allocation since 2015 and is well off the peaks from 2016 and 2020 when gold miners accounted for more than 5% of sector assets.
What the research tells us...
Gold and the companies that mine it are heavily influenced by outside events that can overwhelm any other factor. We're likely seeing that play out at the moment. Due to that tendency, it's easy to get caught flat-footed either way, and investors will argue passionately that either it's the greatest investment in our lifetimes or that it's an idea best left for fools. Historically, it's been an okay hedge as a small part of a portfolio, with occasional bouts of being attractive for a more significant allocation. That has usually come during extreme pessimism and washed-out conditions in mining stocks. Periods of newly positive momentum, like we're seeing right now, have been much more of a challenge. Miners still have a lot to prove before we'd consider them to be in a healthy environment.
Active Studies
| Time Frame | Bullish | Bearish | | Short-Term | 3 | 0 | | Medium-Term | 18 | 2 | | Long-Term | 15 | 5 |
|
Indicators at Extremes
Portfolio
| Position | Description | Weight % | Added / Reduced | Date | | Stocks | RSP | 21.4 | Added 10.2% | 2022-01-28 | | Bonds | 32.7% BND, 7.1% SCHP | 40.1 | Added 8.3% | 2021-10-26 | | Commodities | GCC | 2.4 | Reduced 2.1%
| 2020-09-04 | | Precious Metals | GDX | 4.6 | Reduced 4.2% | 2021-05-19 | | Special Situations | 8.1% KWEB, 3.6% XLE, 1.7% PSCE | 13.4 | Reduced 3.9% | 2022-01-18 | | Cash | | 17.9 | | |
|
Updates (Changes made today are underlined)
With a typical time frame of several months in this account, I normally don't make changes so quickly. I've added back part of the stock exposure I took off earlier in January due to the washed-out conditions and extreme pessimism we're seeing across a wide array of metrics. The biggest issue is that the environment is unhealthy and we could be in the throes of a protracted bear market. Even so, the readings we've seen recently have a good record at preceding relief rallies, so we'll have to see how that pans out. Bond sentiment is trying to recover from a recent bout of pessimism, and gold stocks are doing their thing which is not much at all. They've been flat for six months. Chinese tech stocks were doing exactly what they're supposed to do, then did *not* by plunging to new lows. This is troubling on a shorter-term time frame, but this was never meant for a trade, rather a multi-year investment. Recent behavior is troubling and I will not be adding any exposure as long as that's the case. RETURN YTD: -1.1% 2021: +8.7%, 2020: +8.1%, 2019: +12.6%, 2018: +0.6%, 2017: +3.8%, 2016: +17.1%, 2015: +9.2%, 2014: +14.5%, 2013: +2.2%, 2012: +10.8%, 2011: +16.5%, 2010: +15.3%, 2009: +23.9%, 2008: +16.2%, 2007: +7.8%
|
|
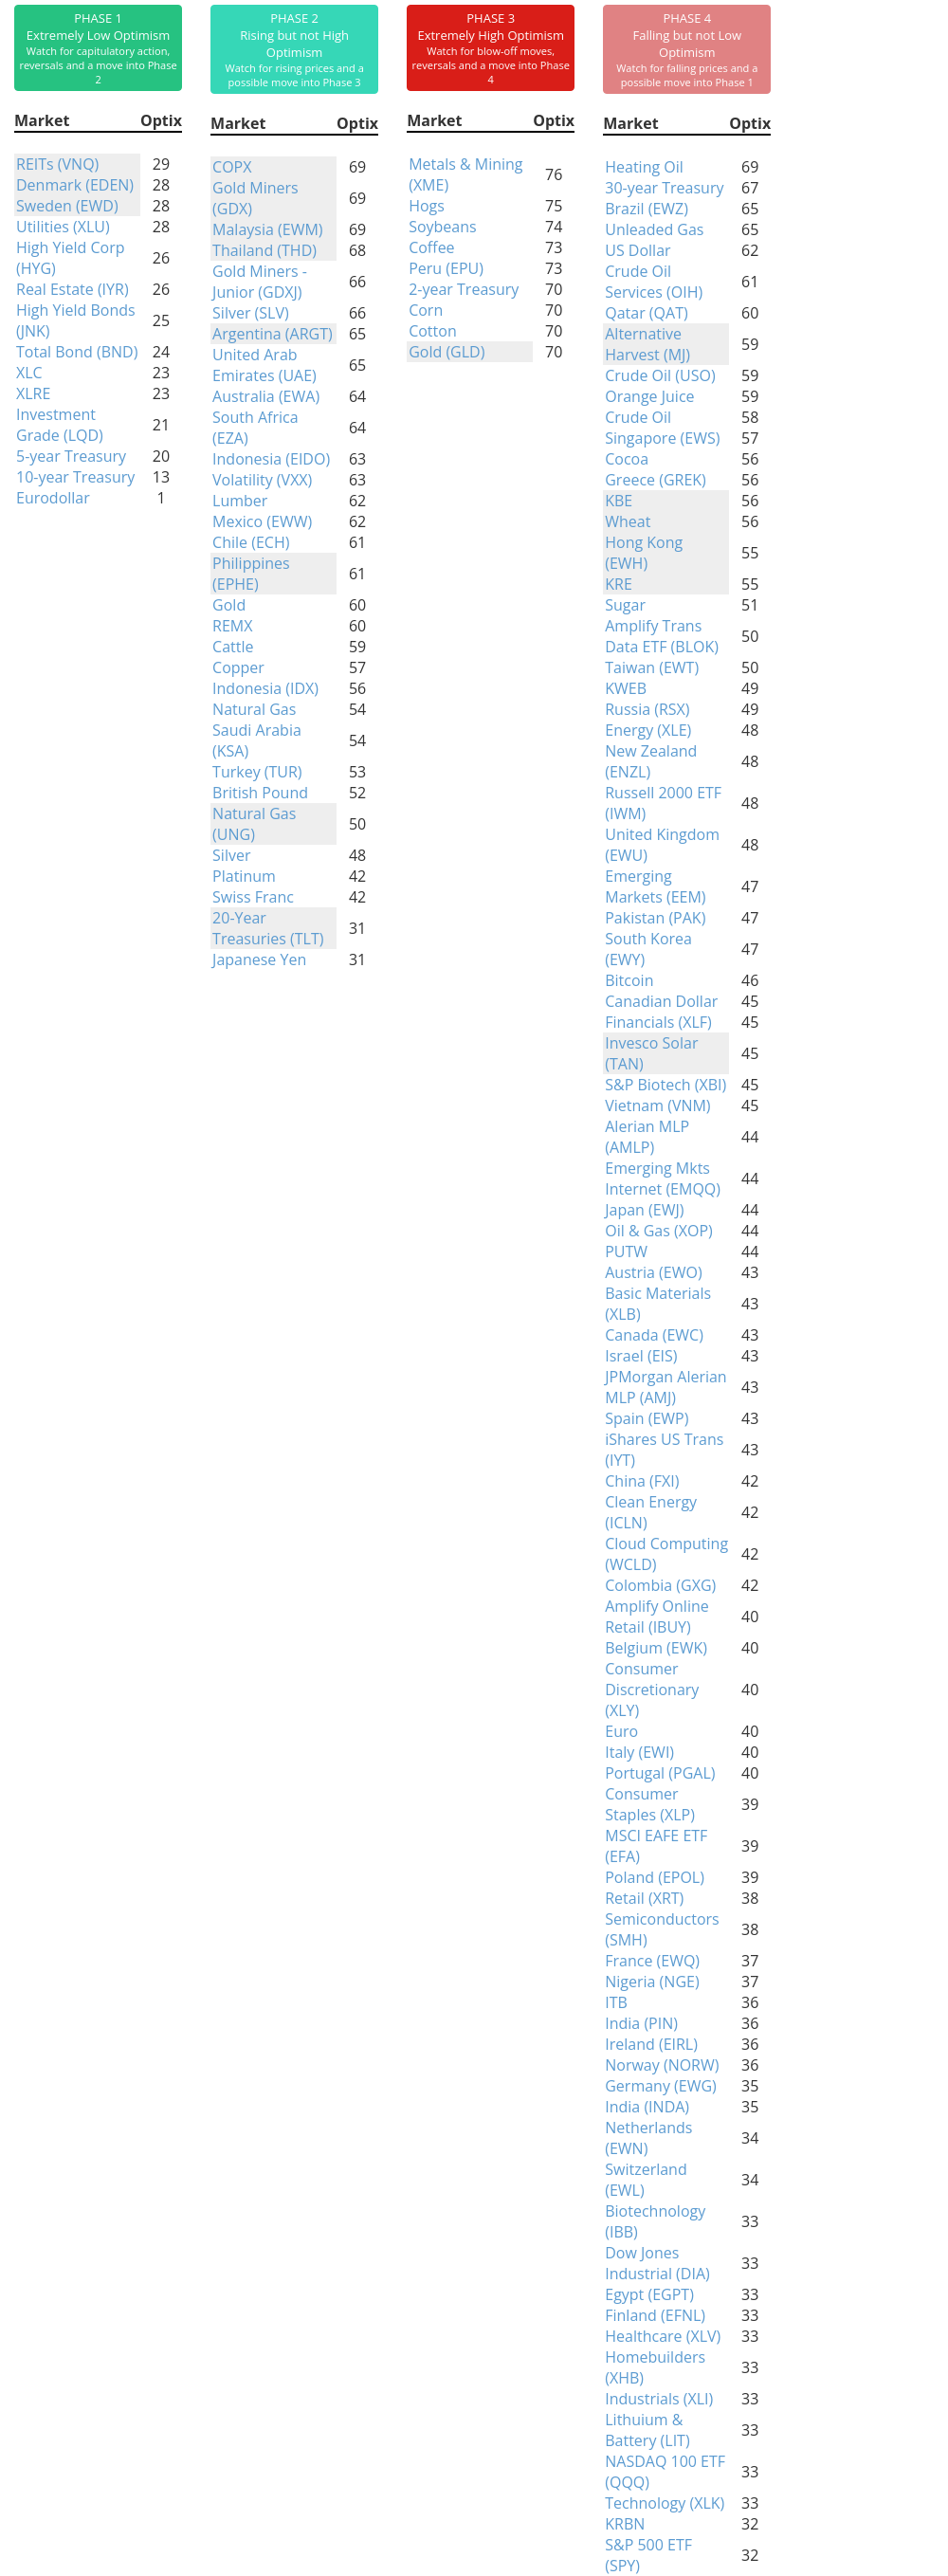
Phase Table
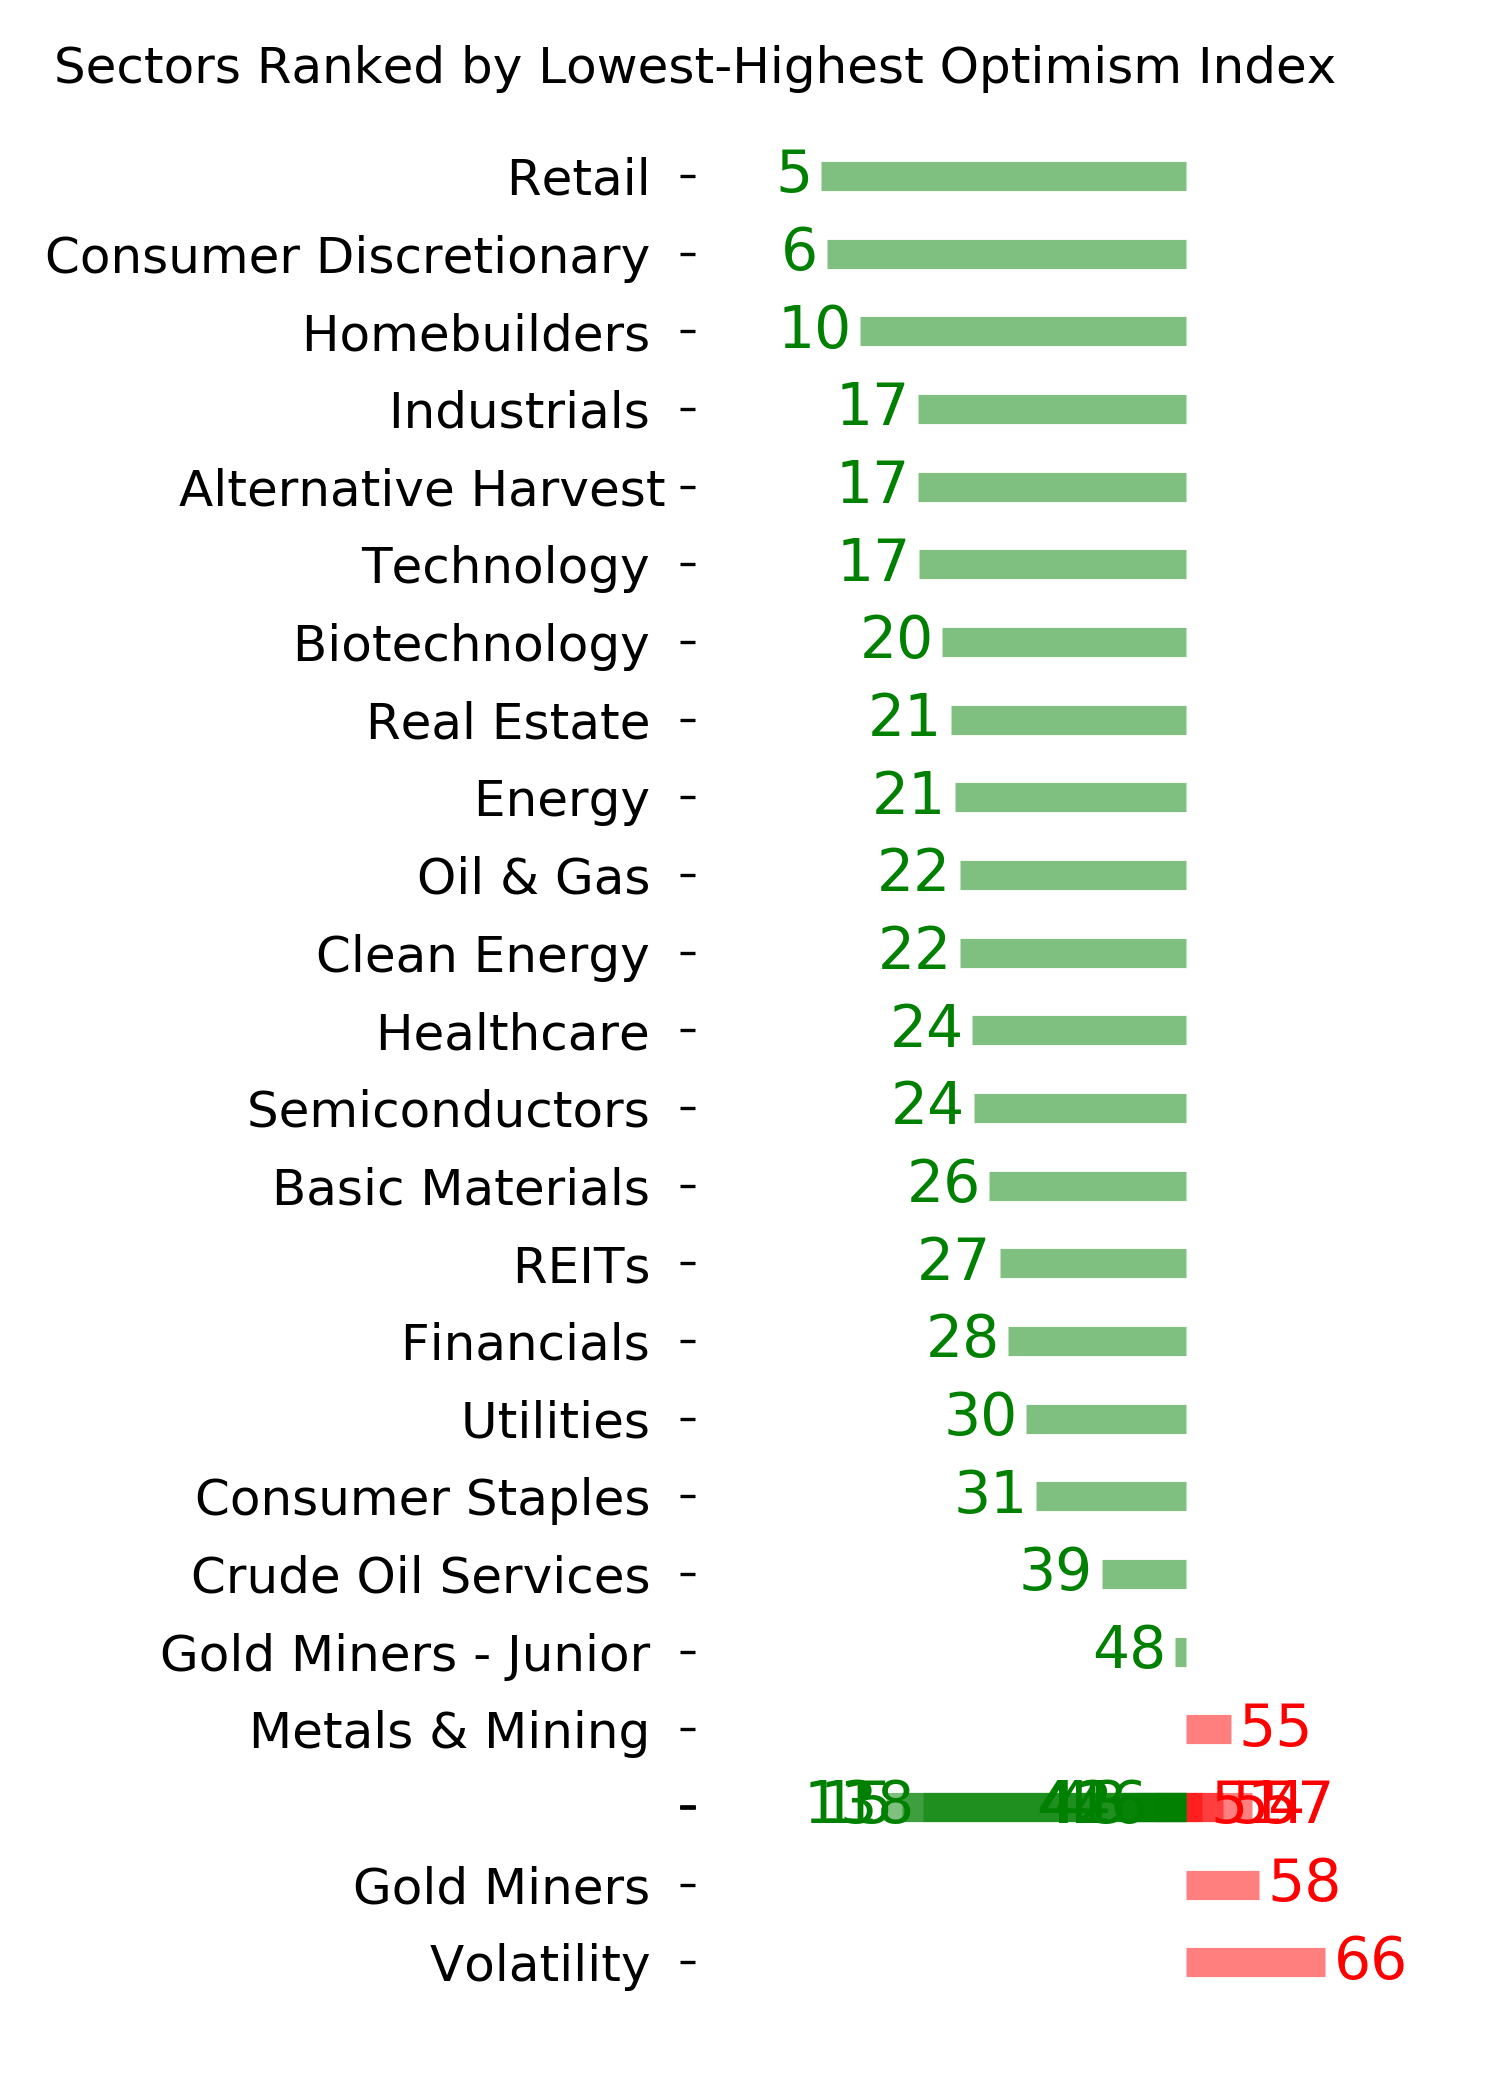
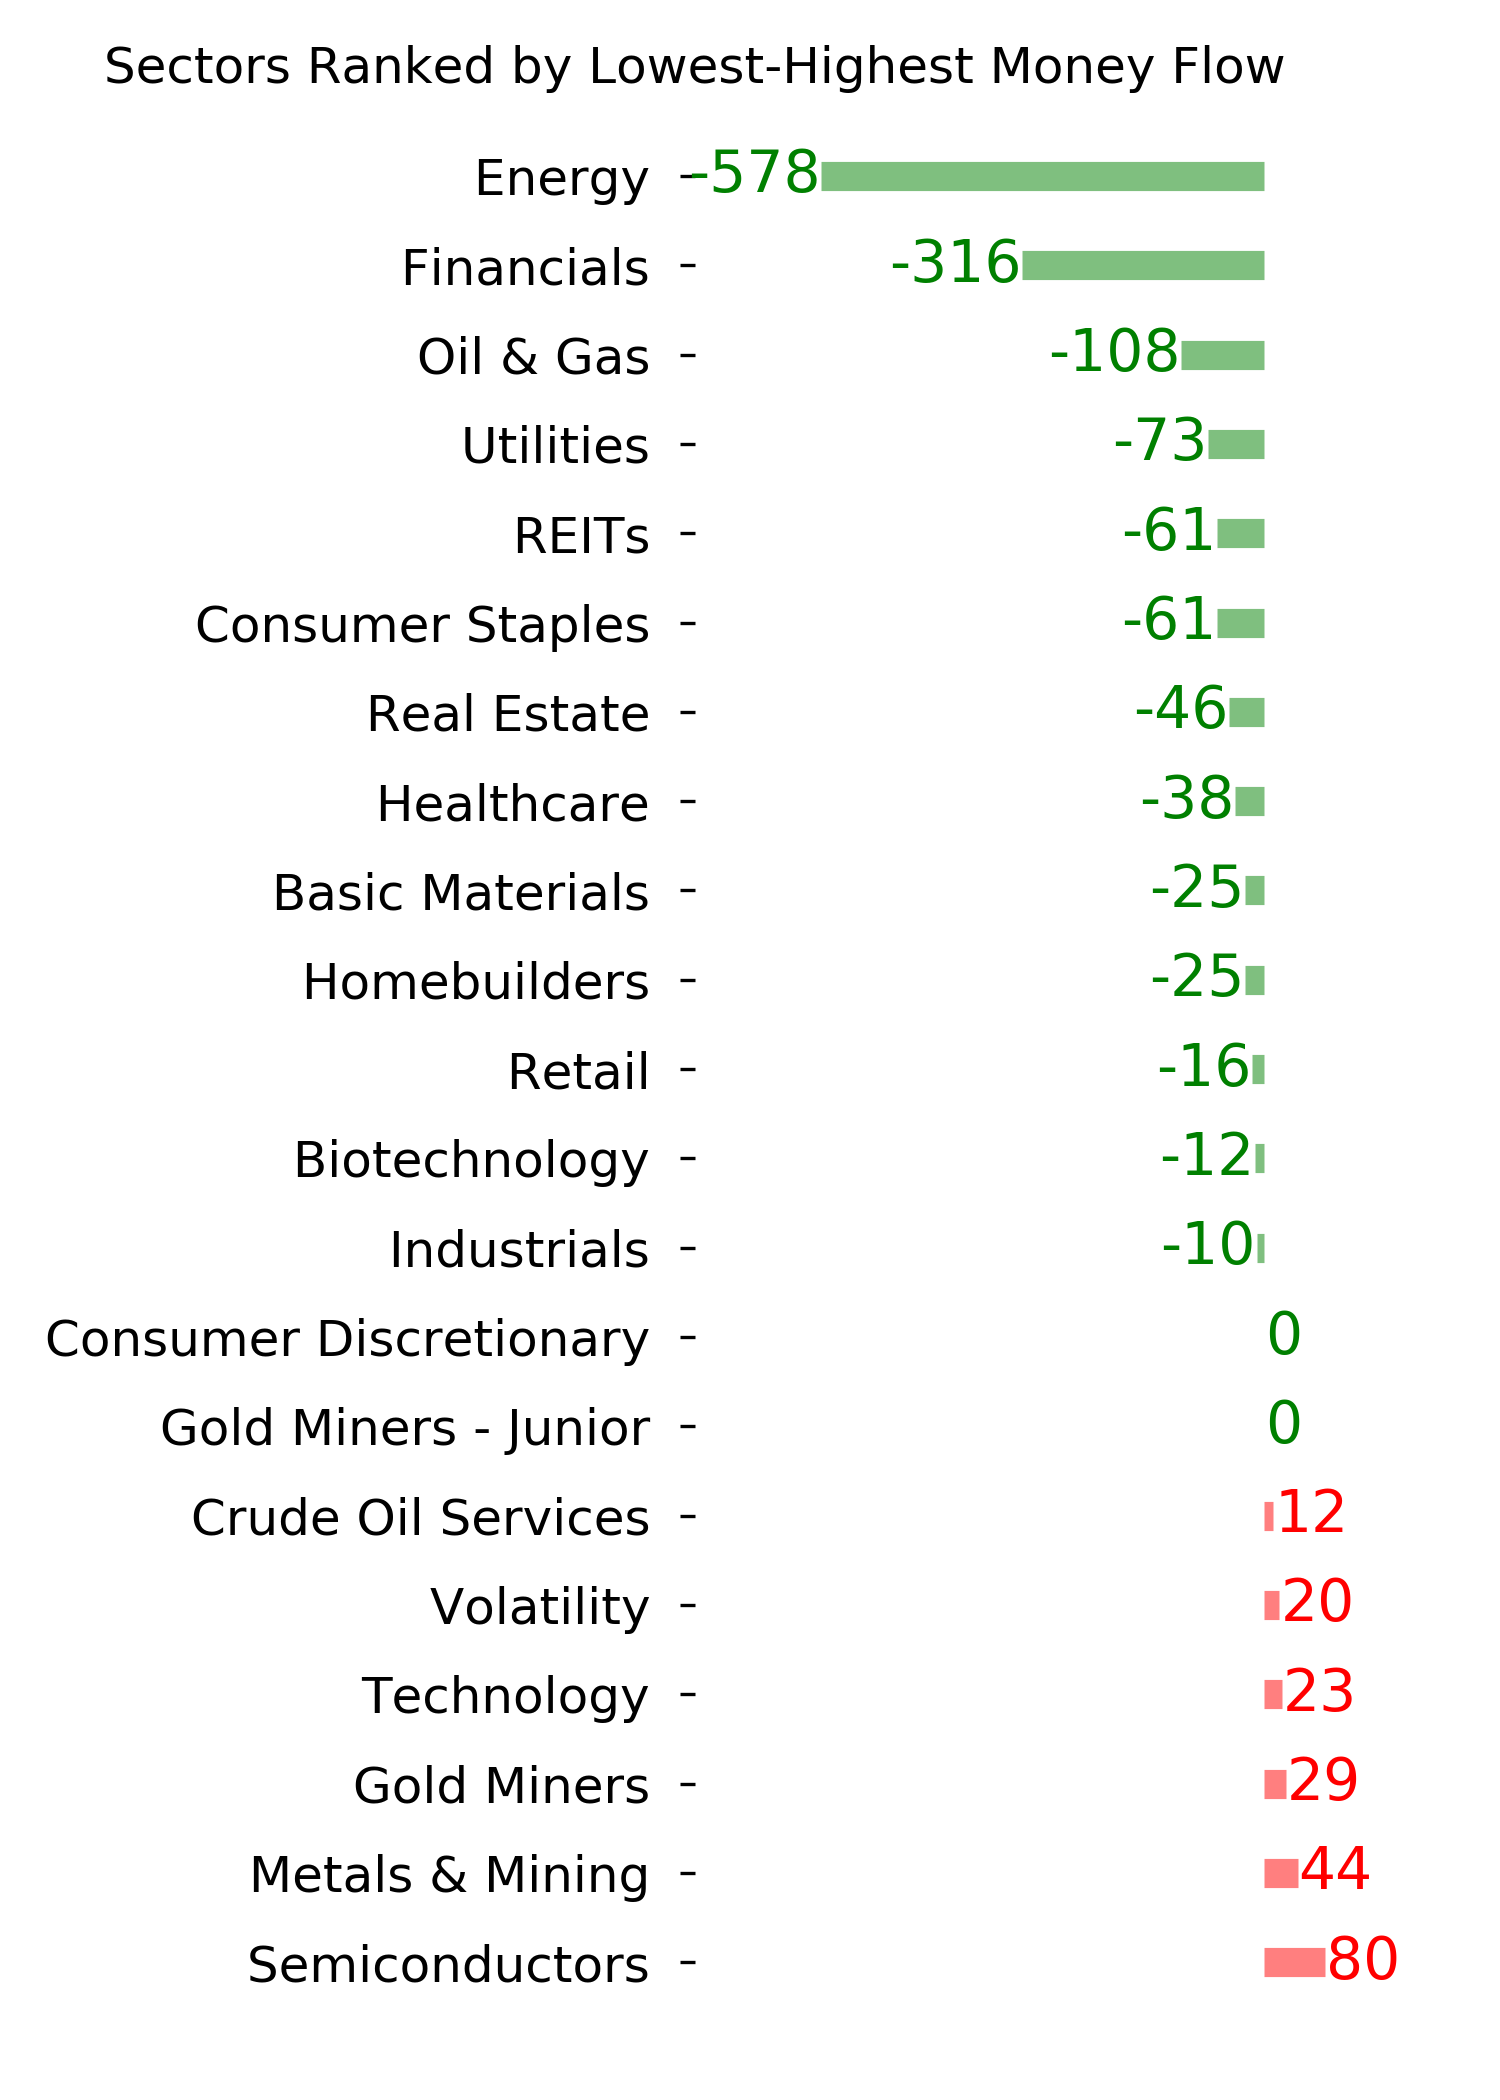
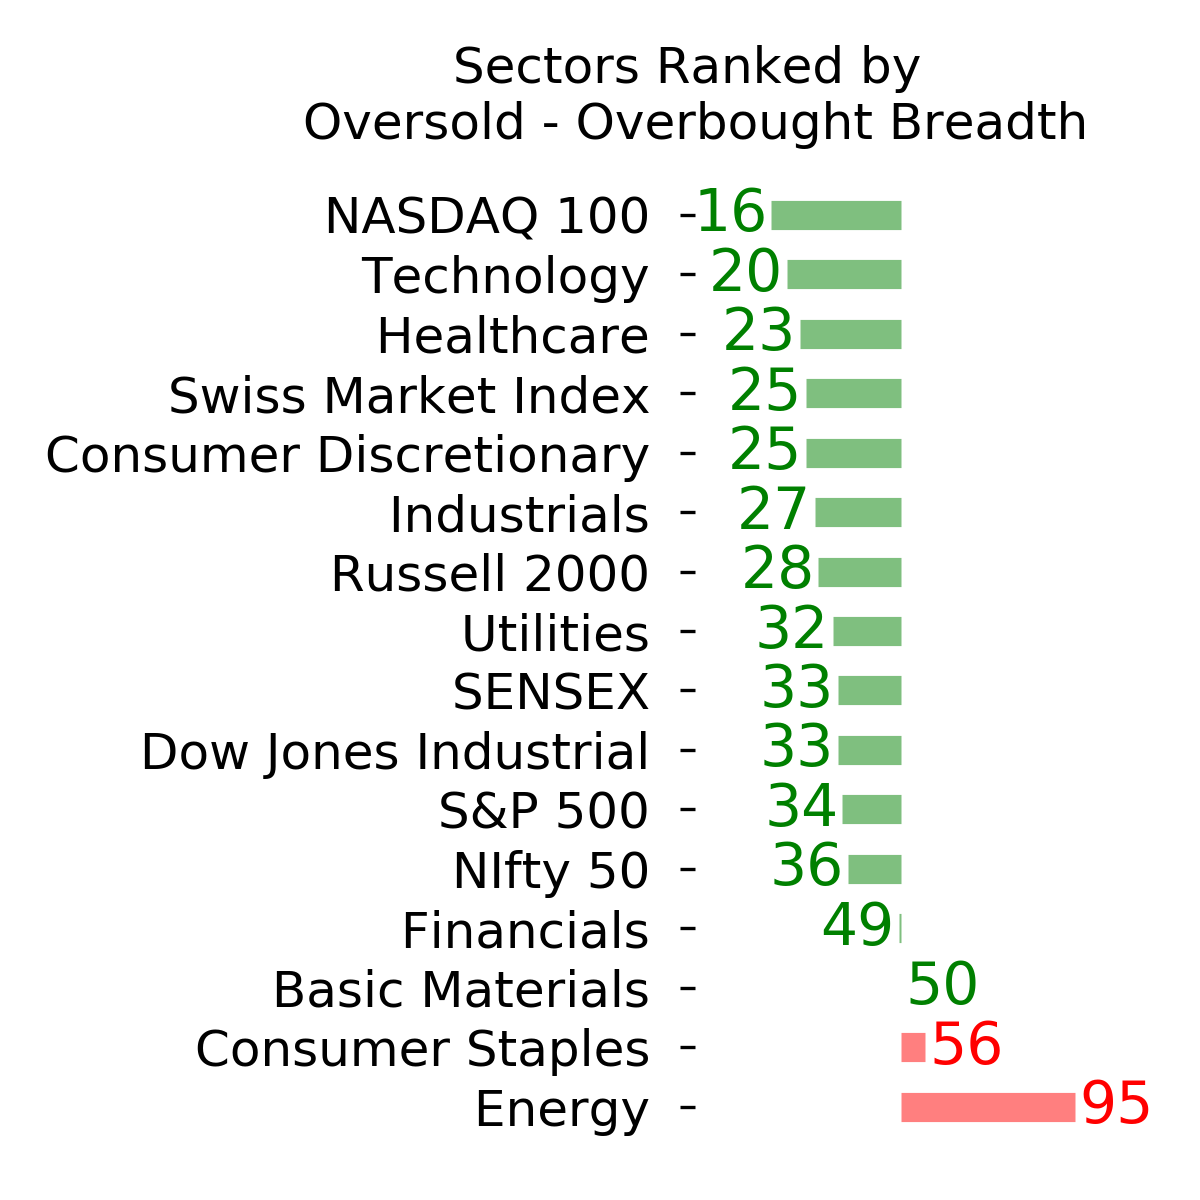
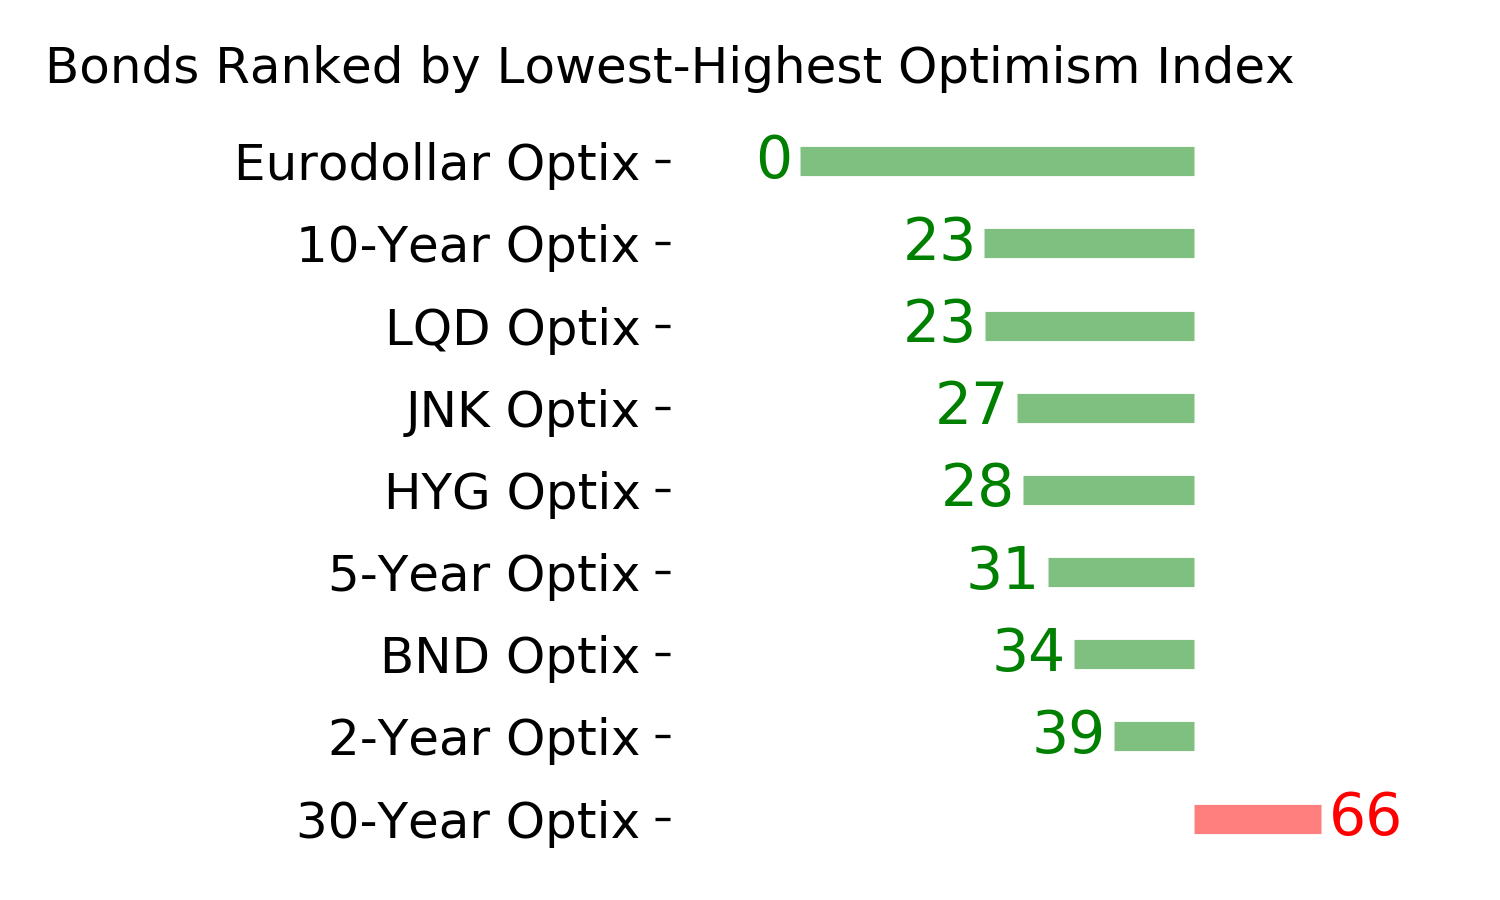
Ranks
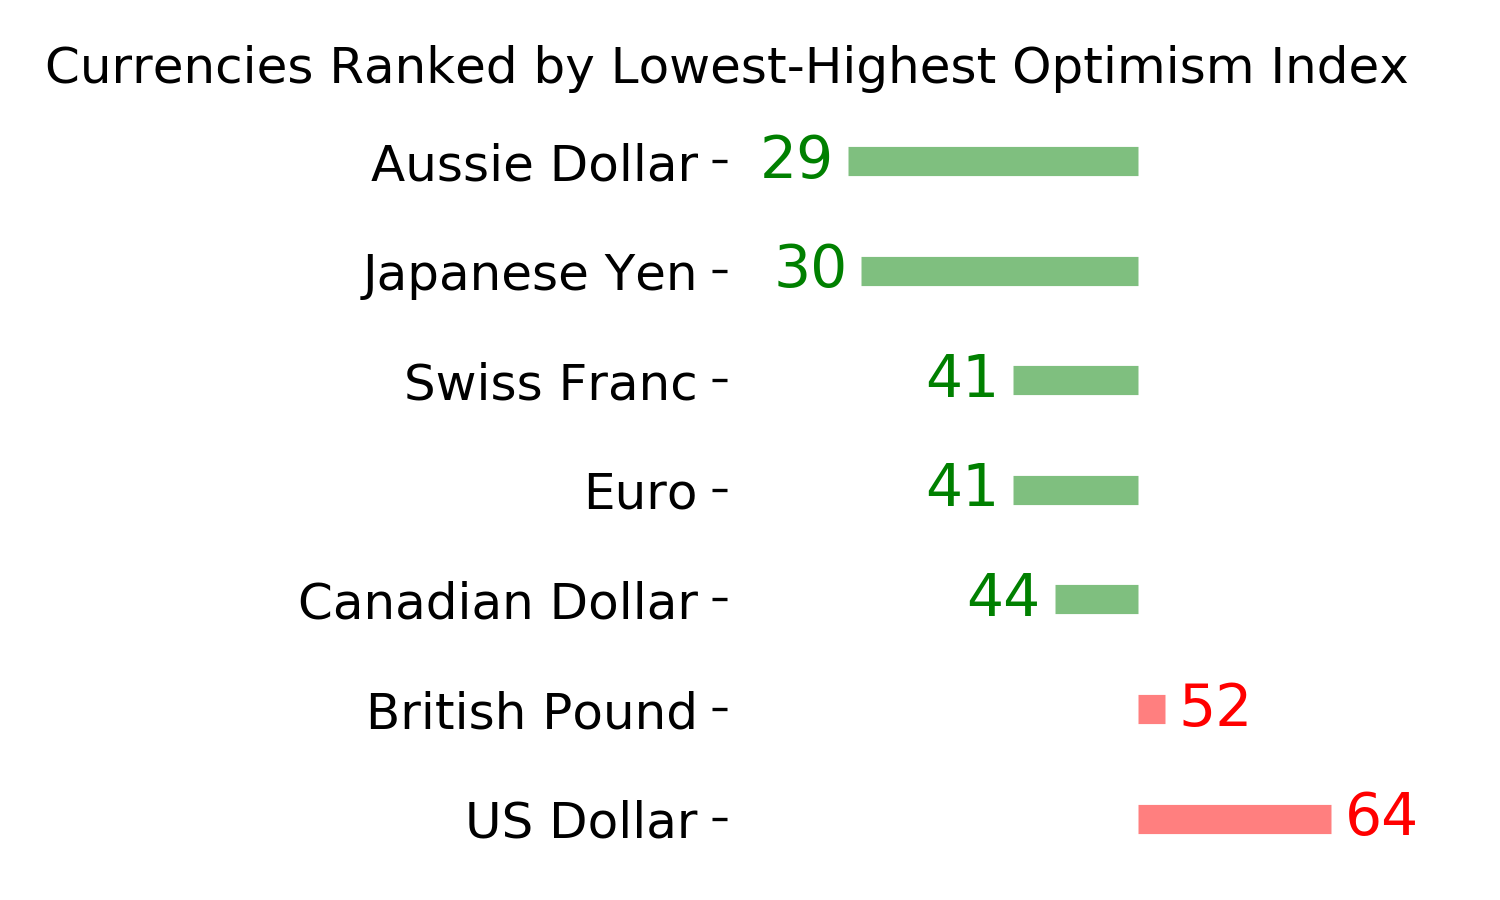
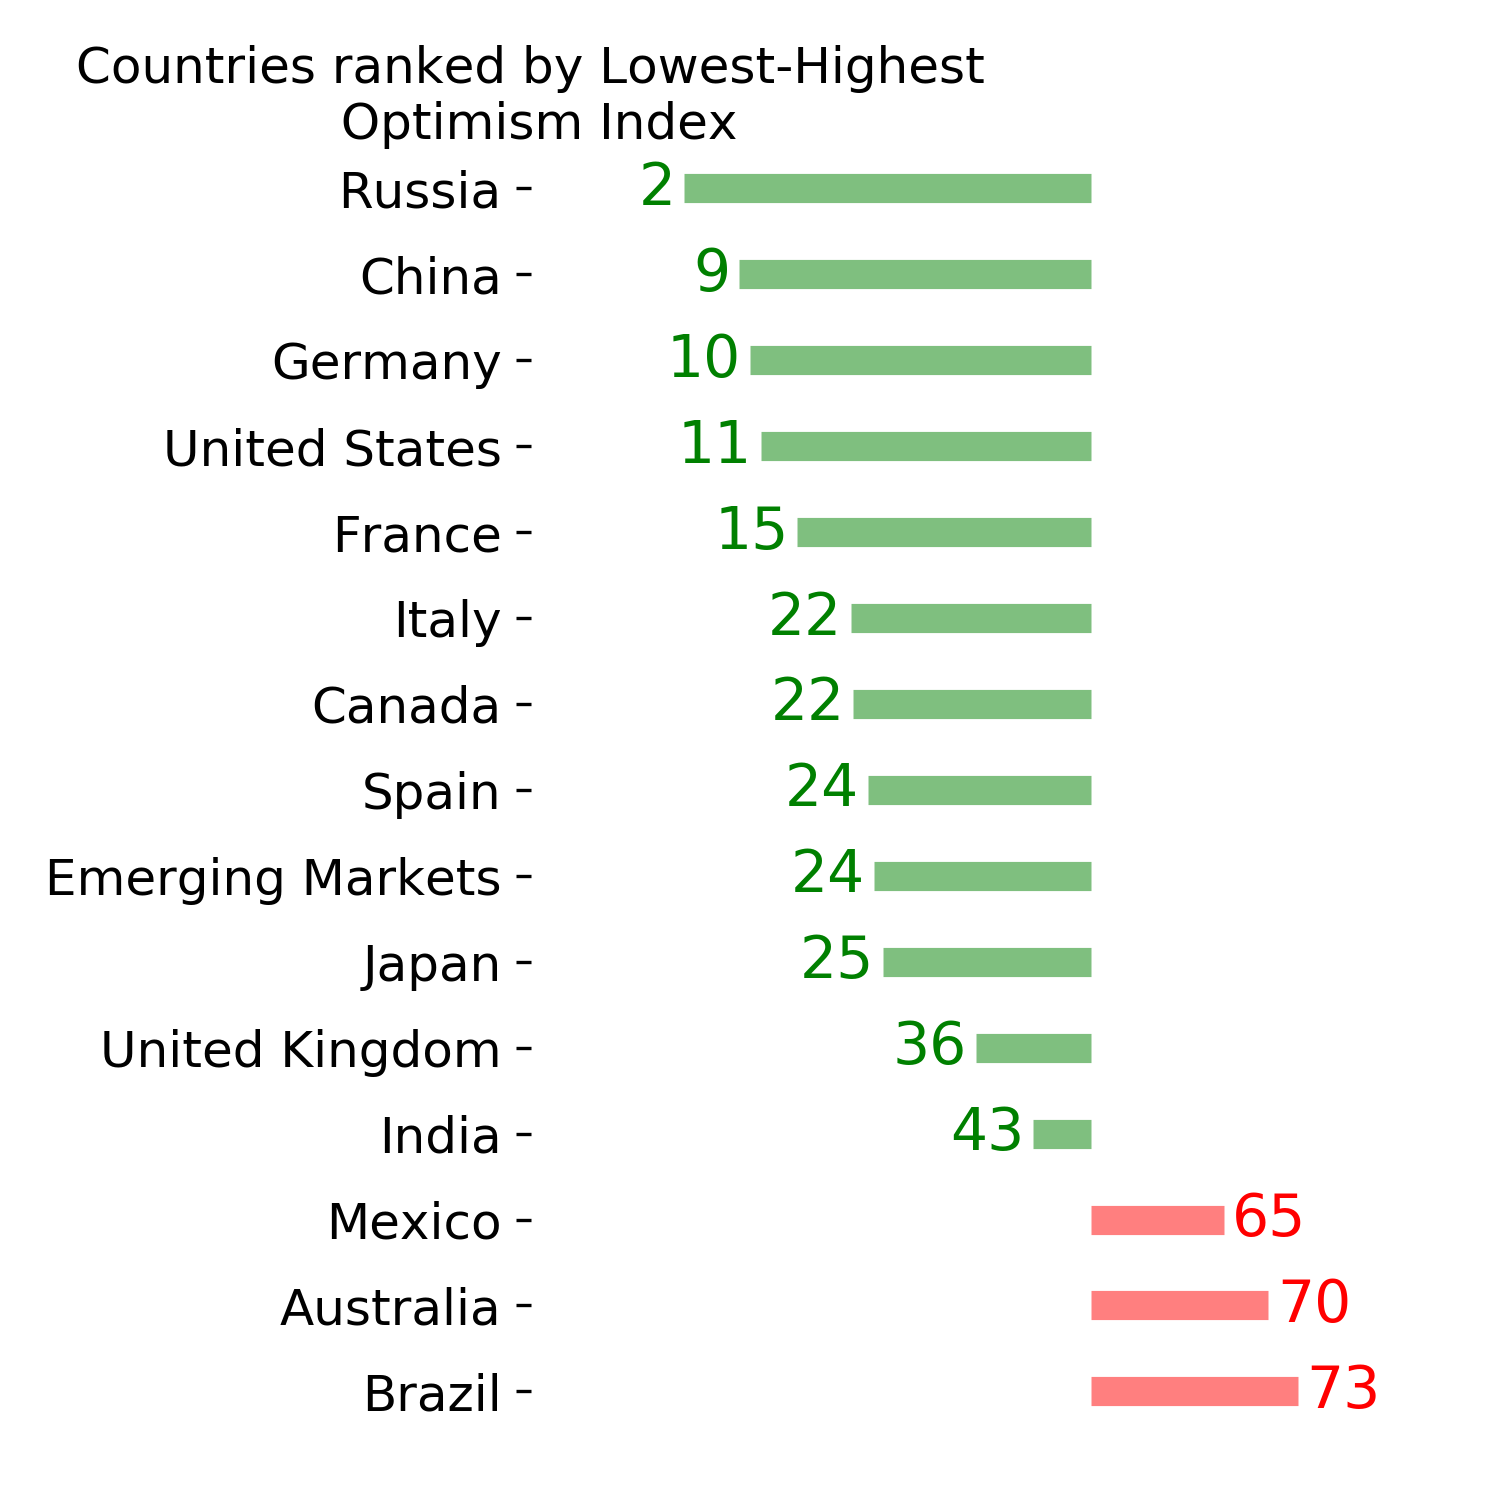
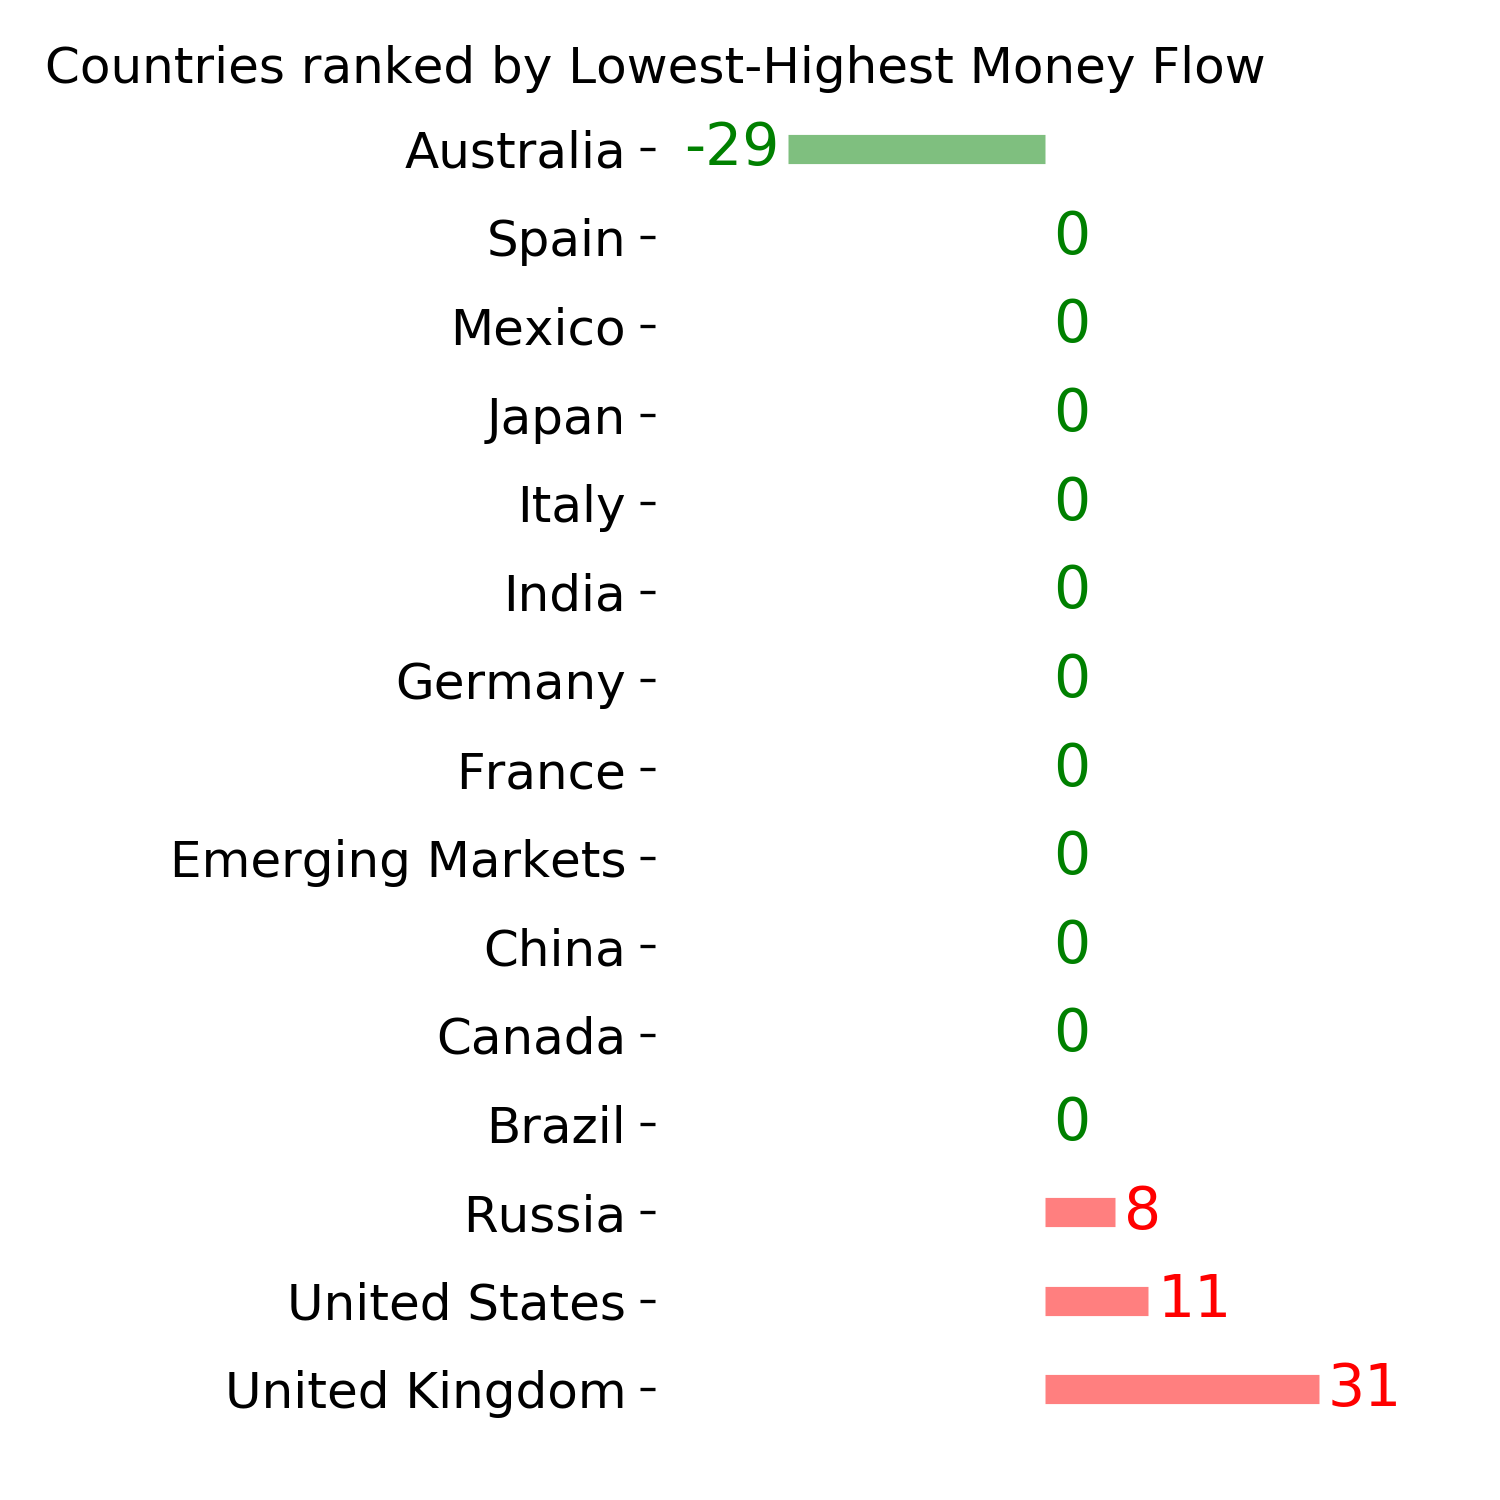
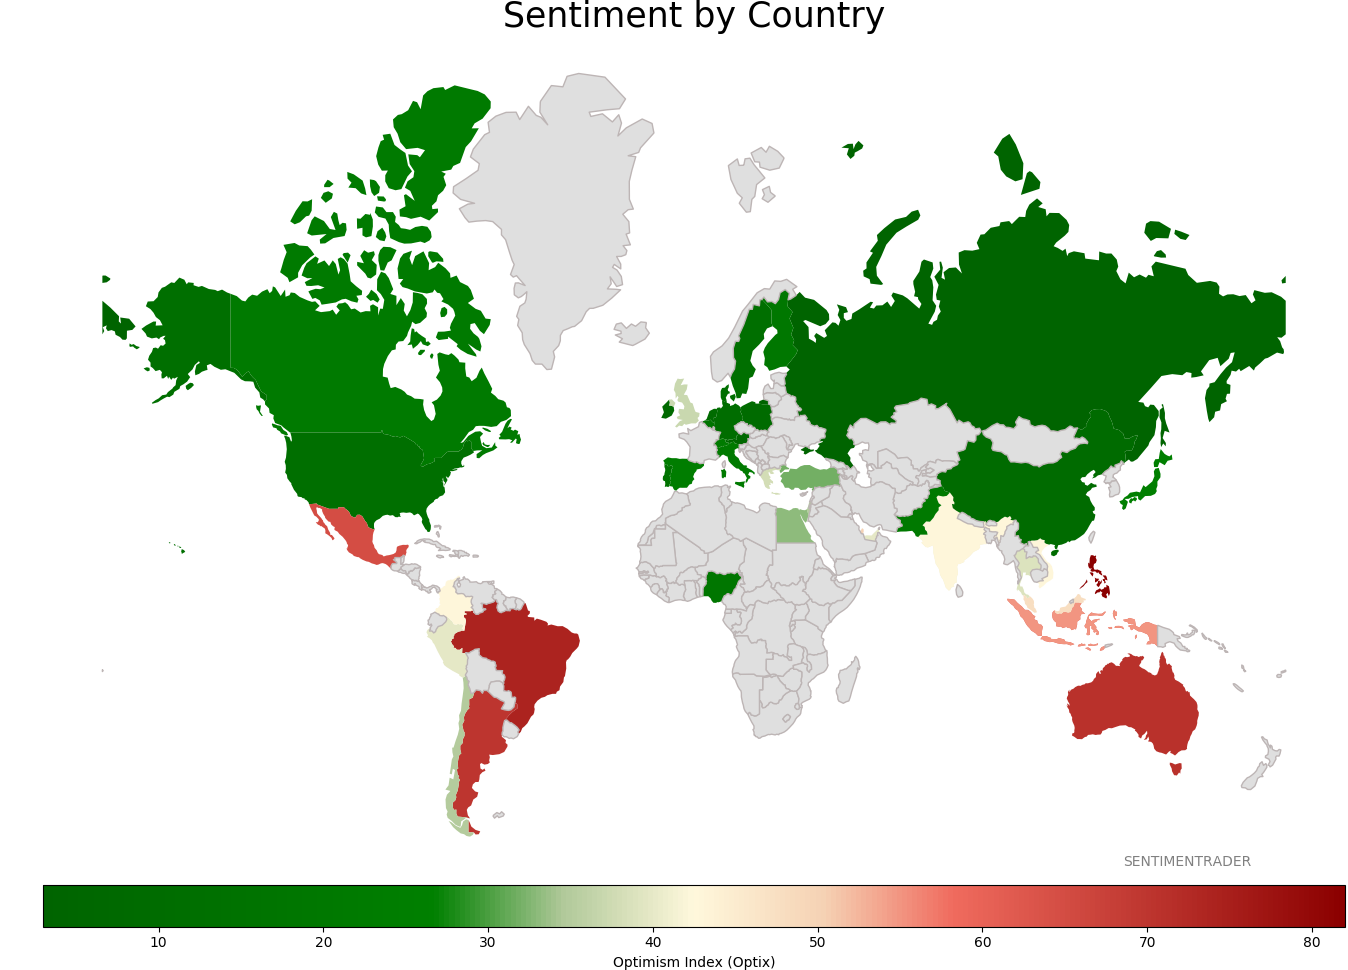
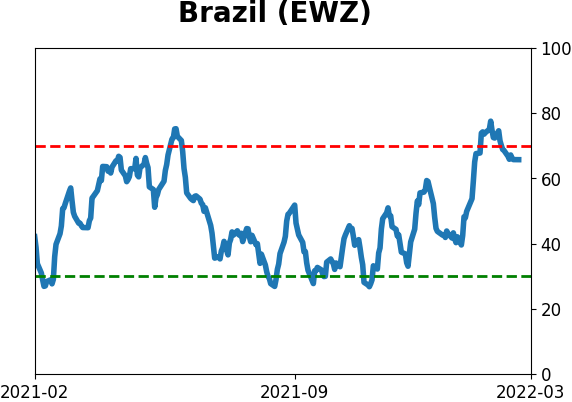
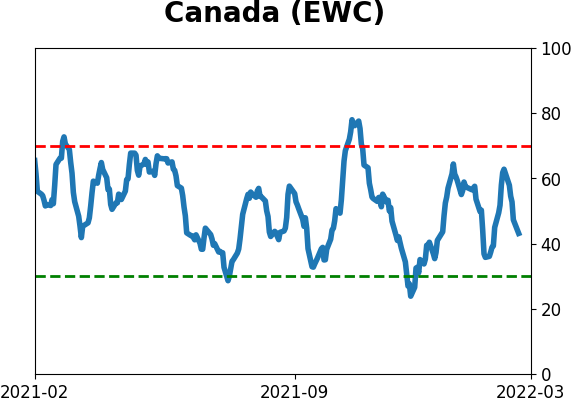
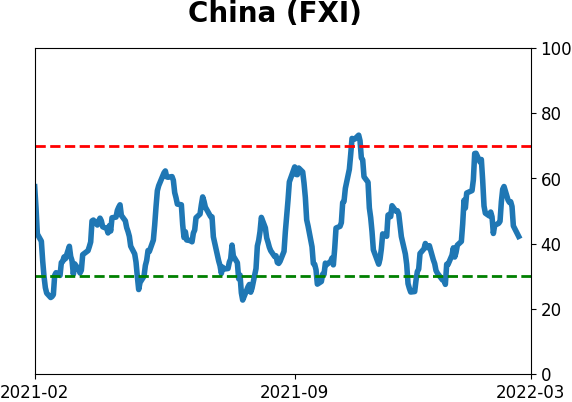
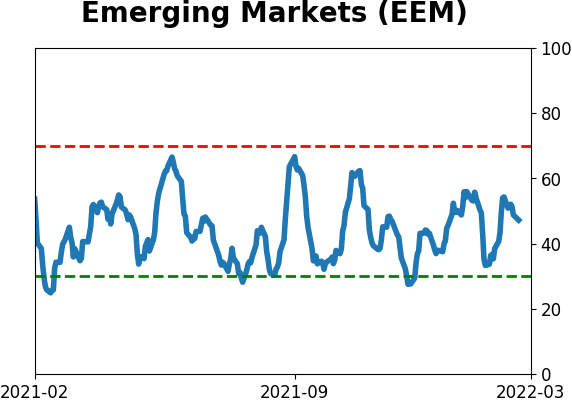
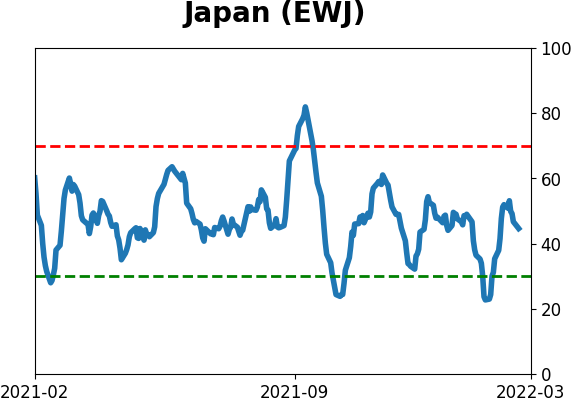
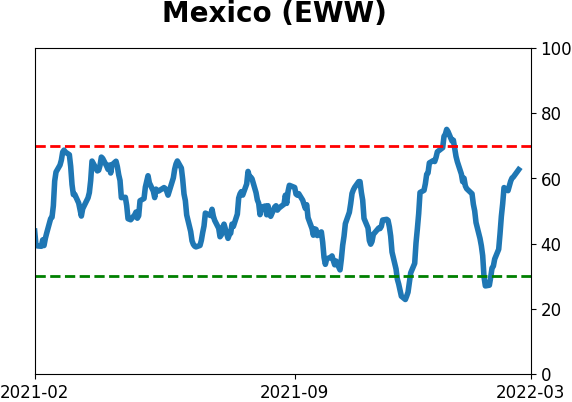
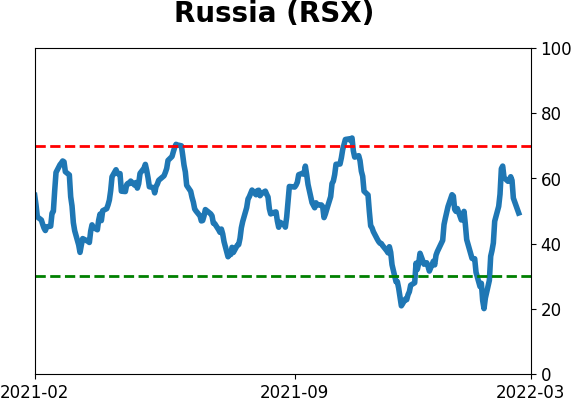
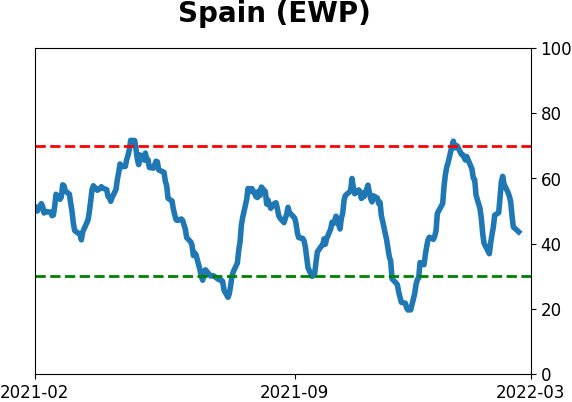
Sentiment Around The World
Optimism Index Thumbnails
|
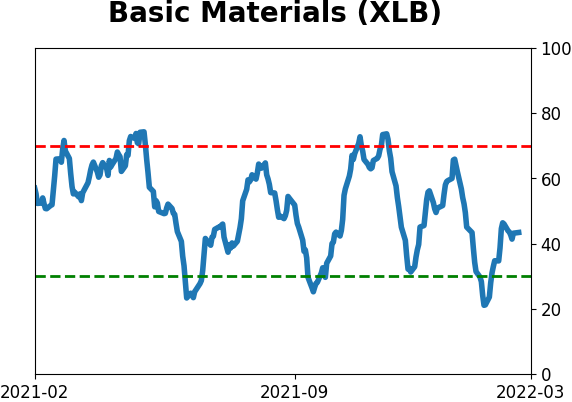
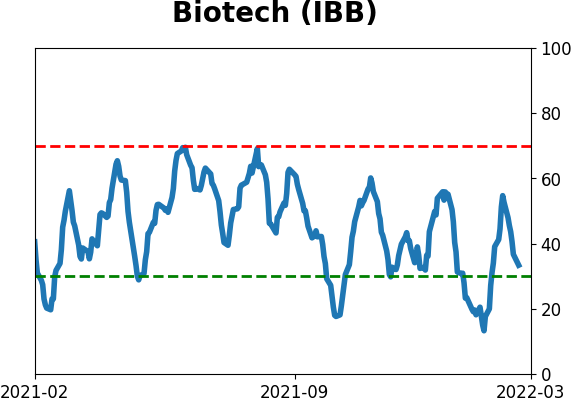
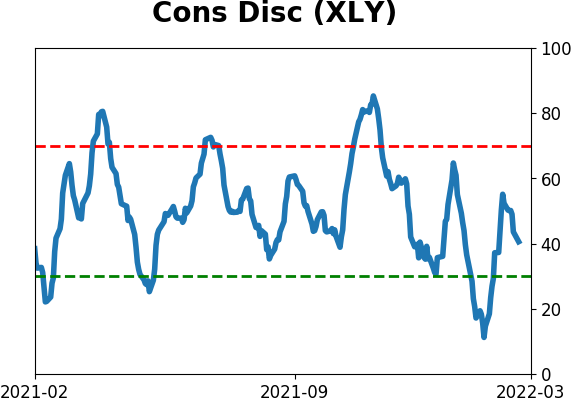
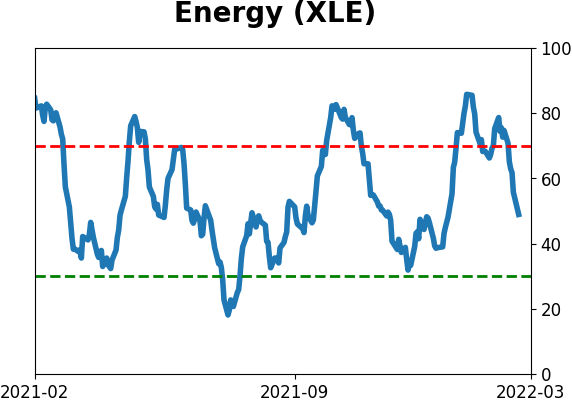
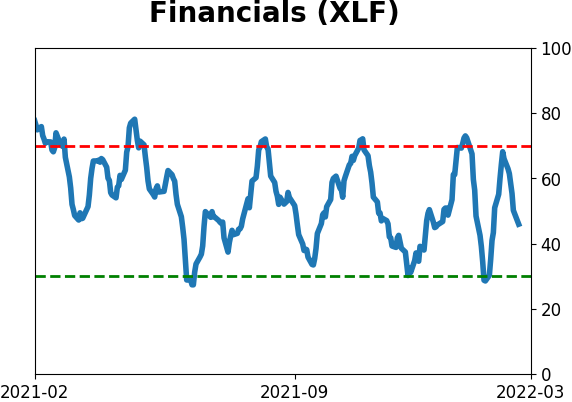
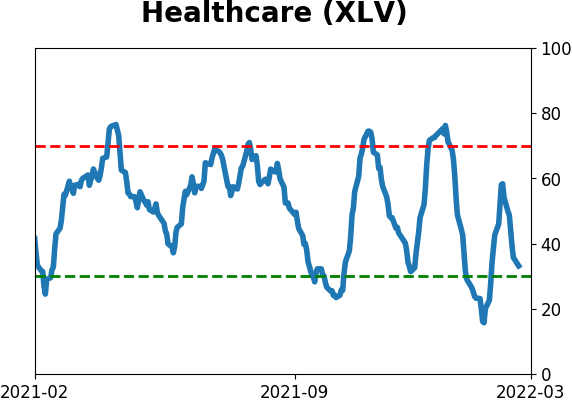
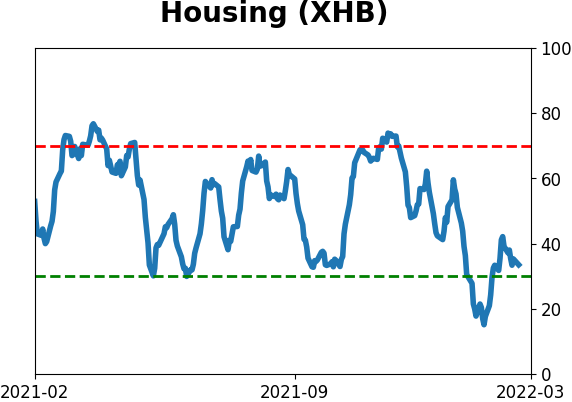
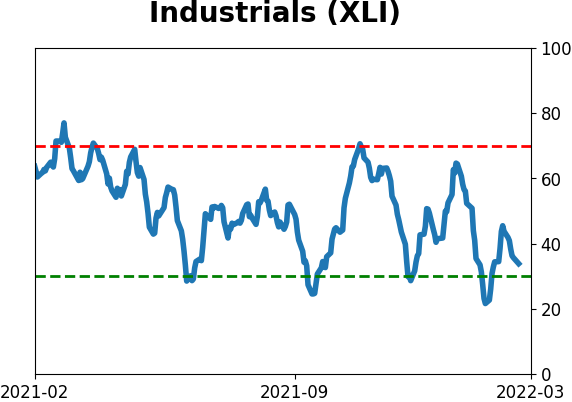
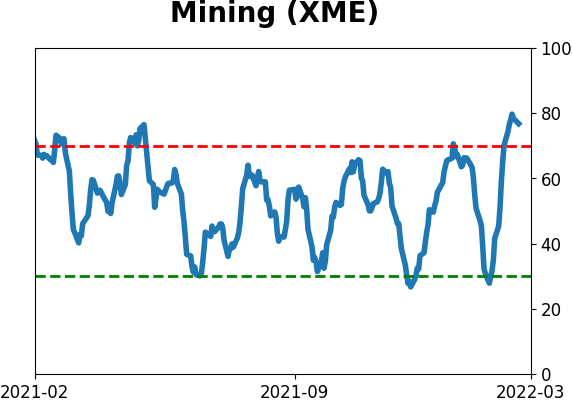
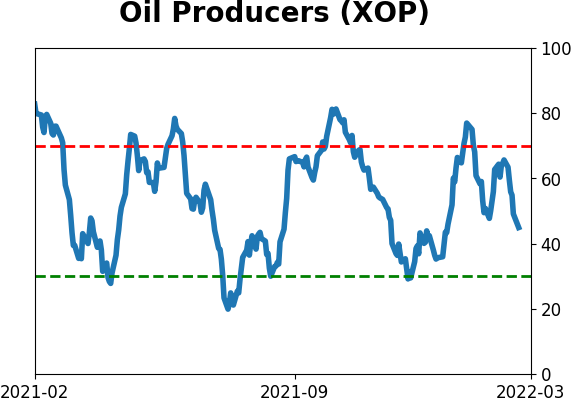
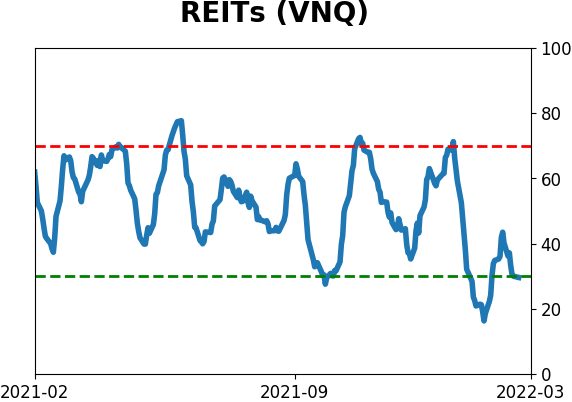
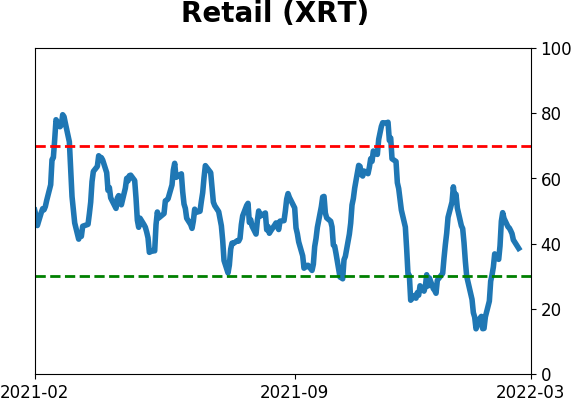
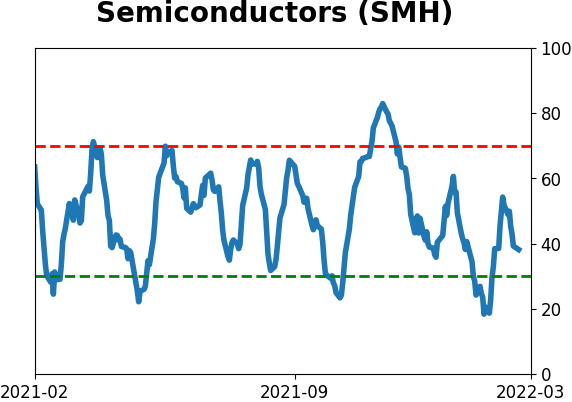
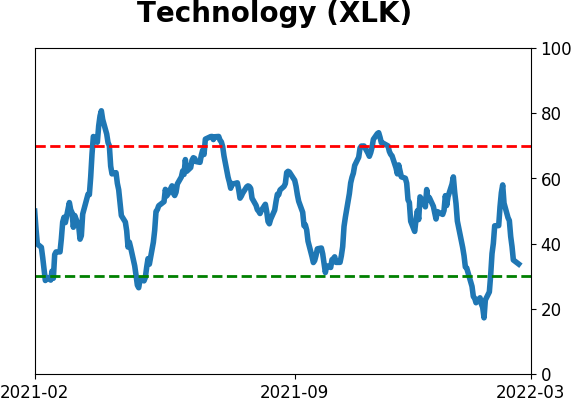
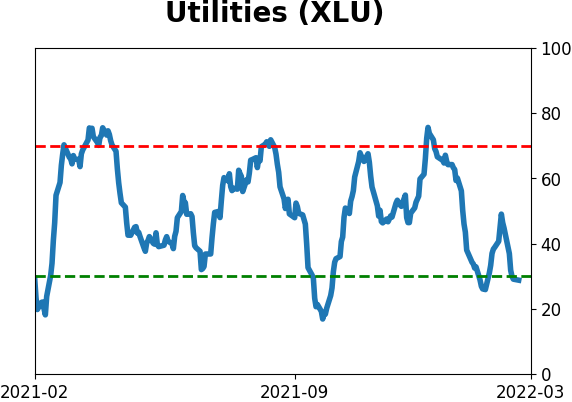
Sector ETF's - 10-Day Moving Average
|
|
|
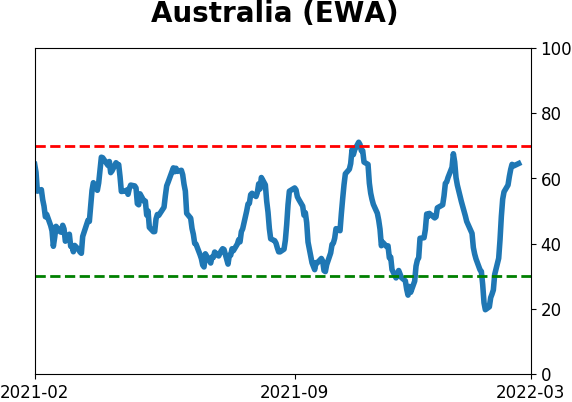
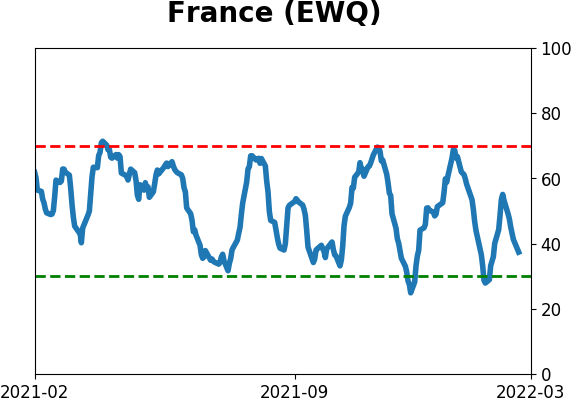
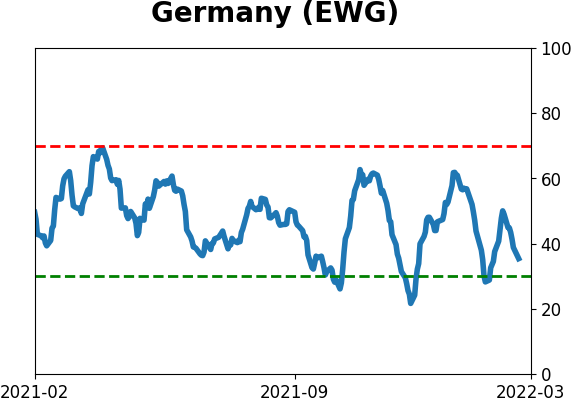
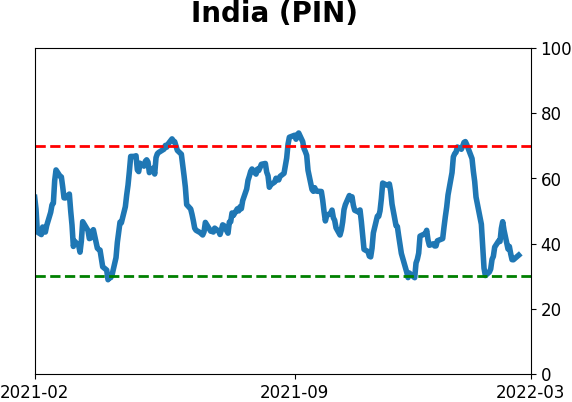
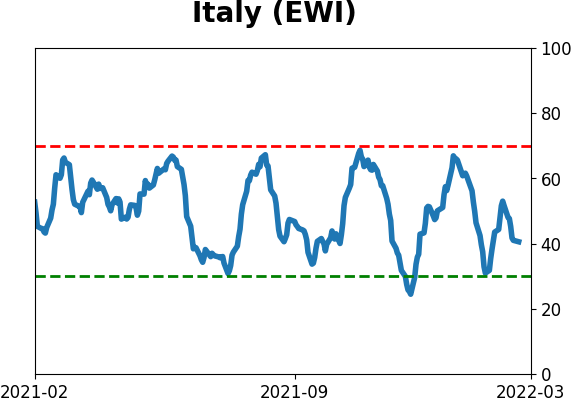
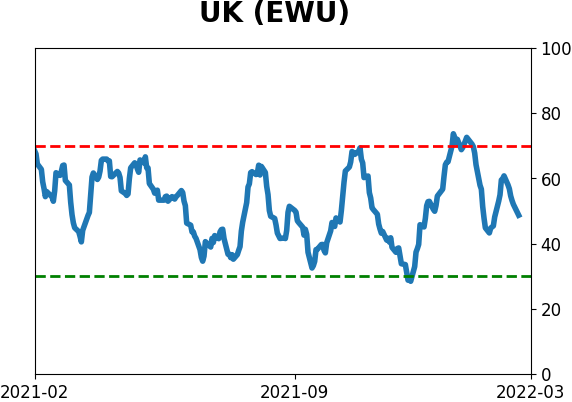
Country ETF's - 10-Day Moving Average
|
|
|
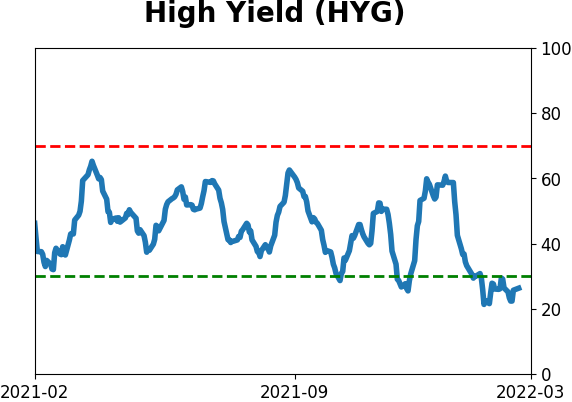
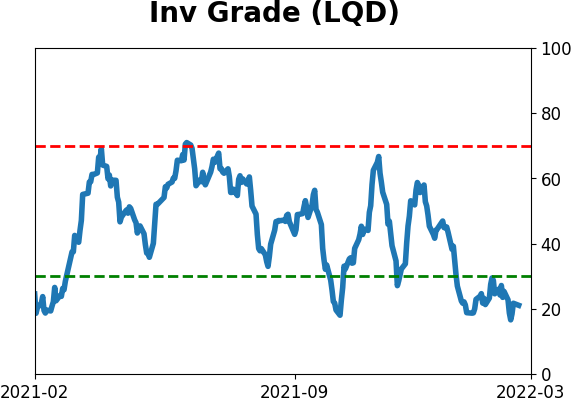
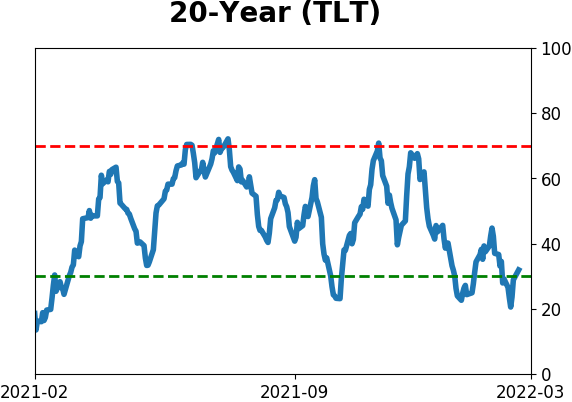
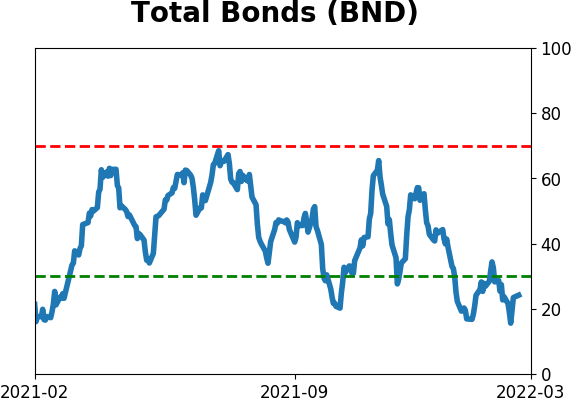
Bond ETF's - 10-Day Moving Average
|
|
|
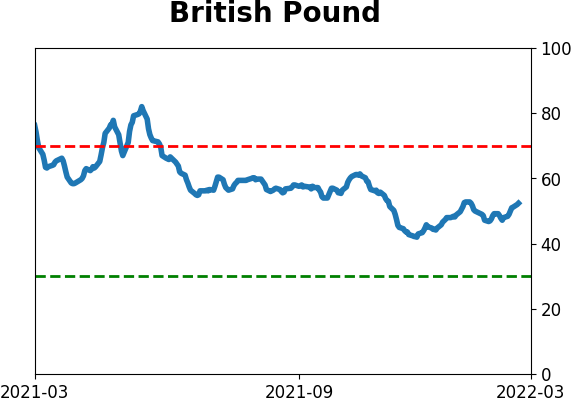
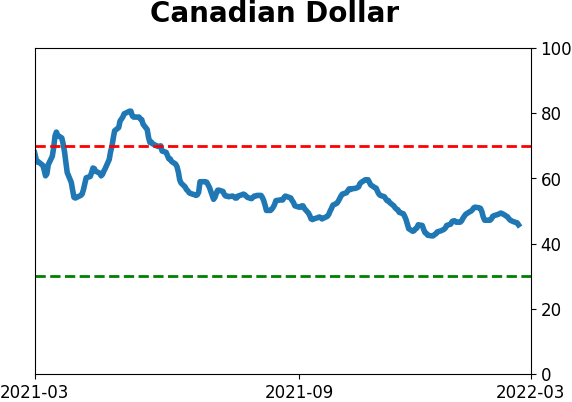
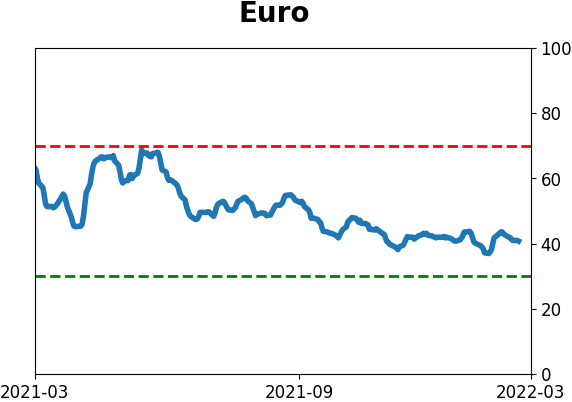
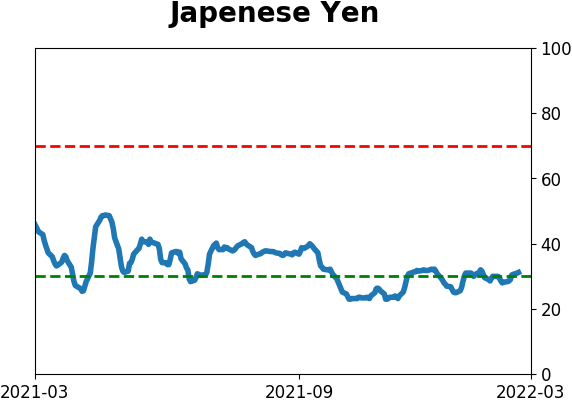
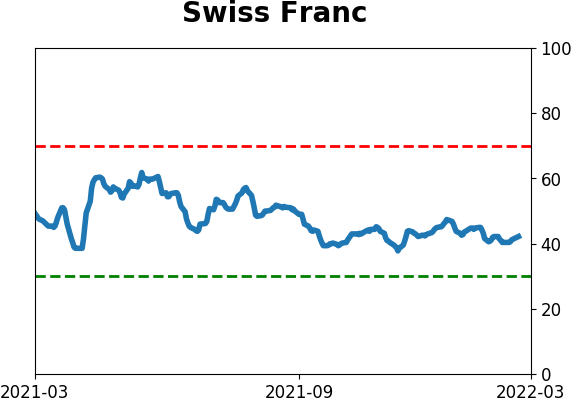
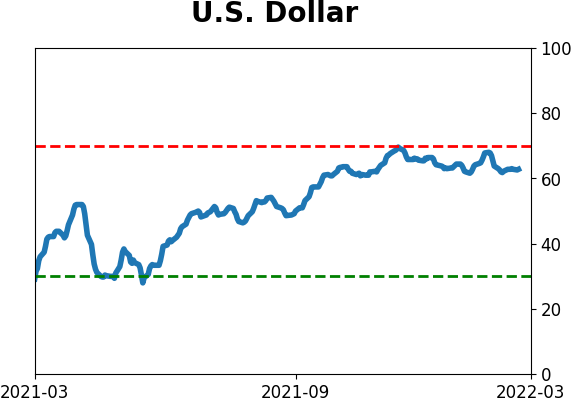
Currency ETF's - 5-Day Moving Average
|
|
|
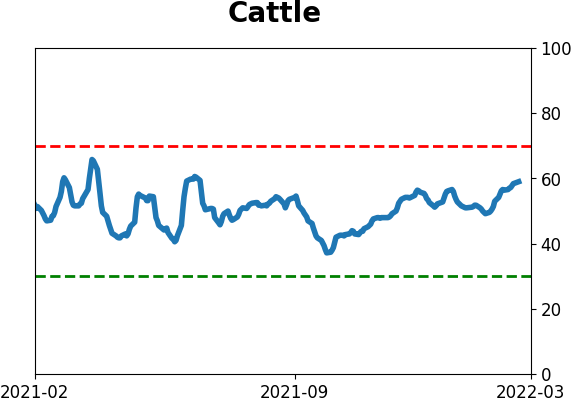
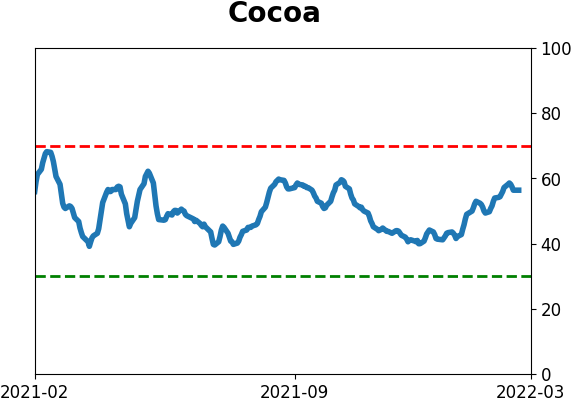
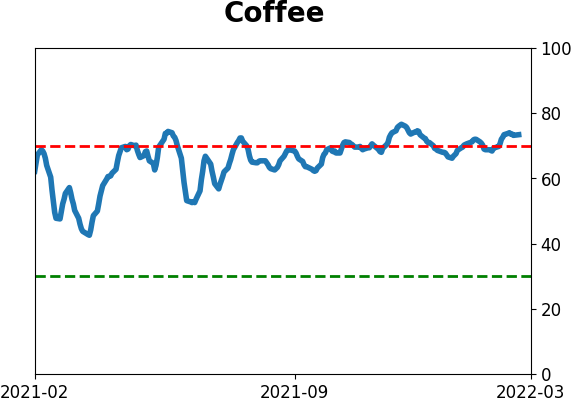
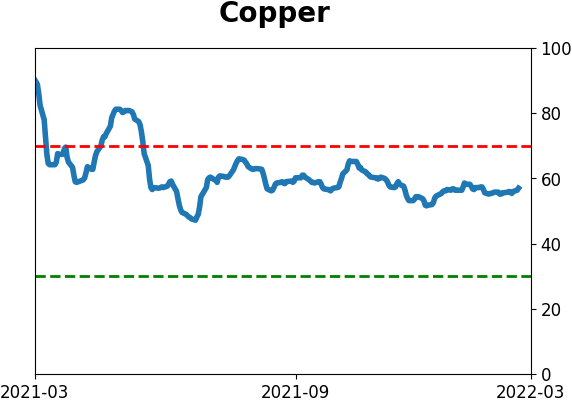
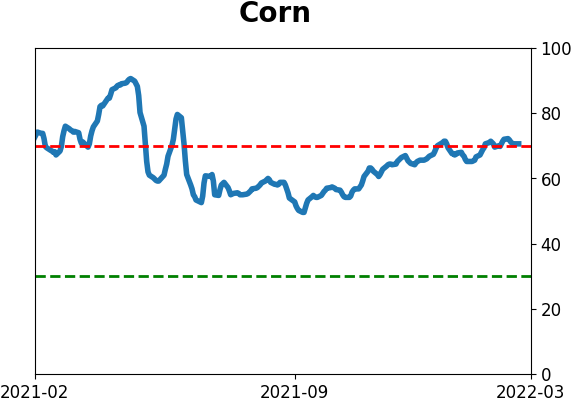
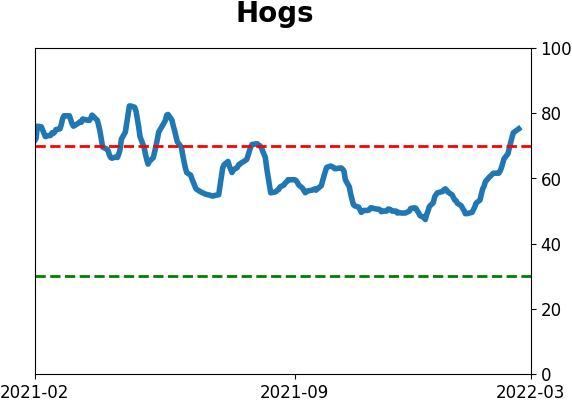
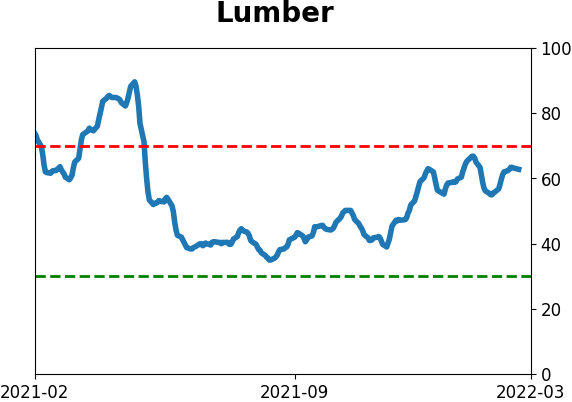
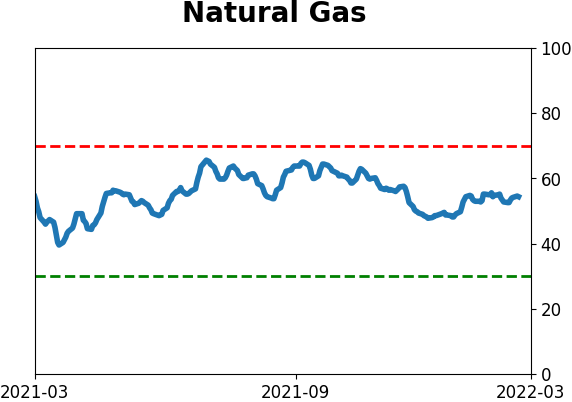
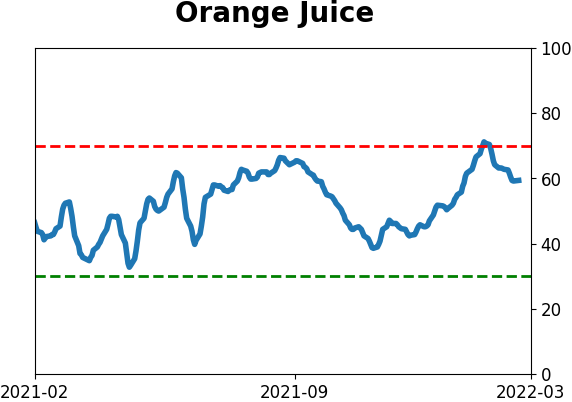
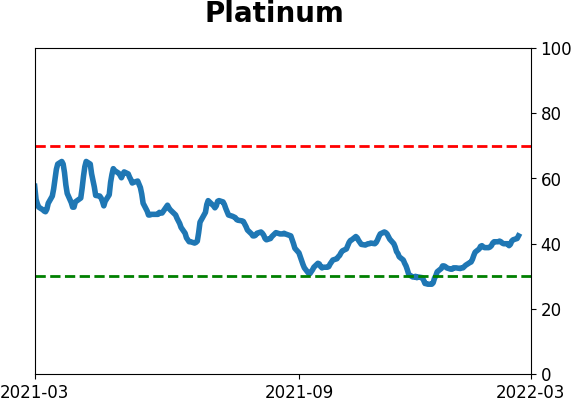
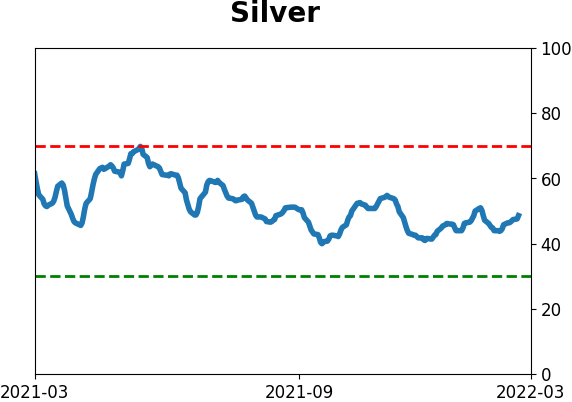
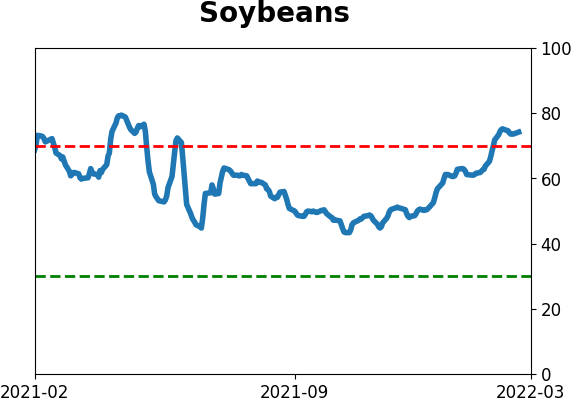
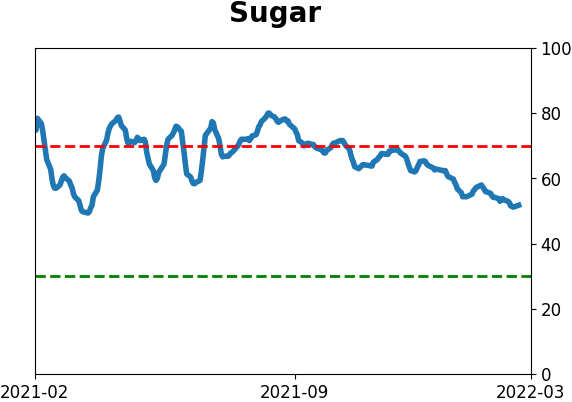
Commodity ETF's - 5-Day Moving Average
|
|