Headlines
|
|
A dozen records for the Dow (and S&P) in a rabid start to the year:
The S&P 500 and Dow Industrials have both set more than 10 record highs so far in 2024. That ranks among the best starts to the year for both indexes, dating back to 1900 for the Dow. After similar fast starts, both indexes tended to show poor average returns over the next two months, but good returns over the following 6-12 months.
|
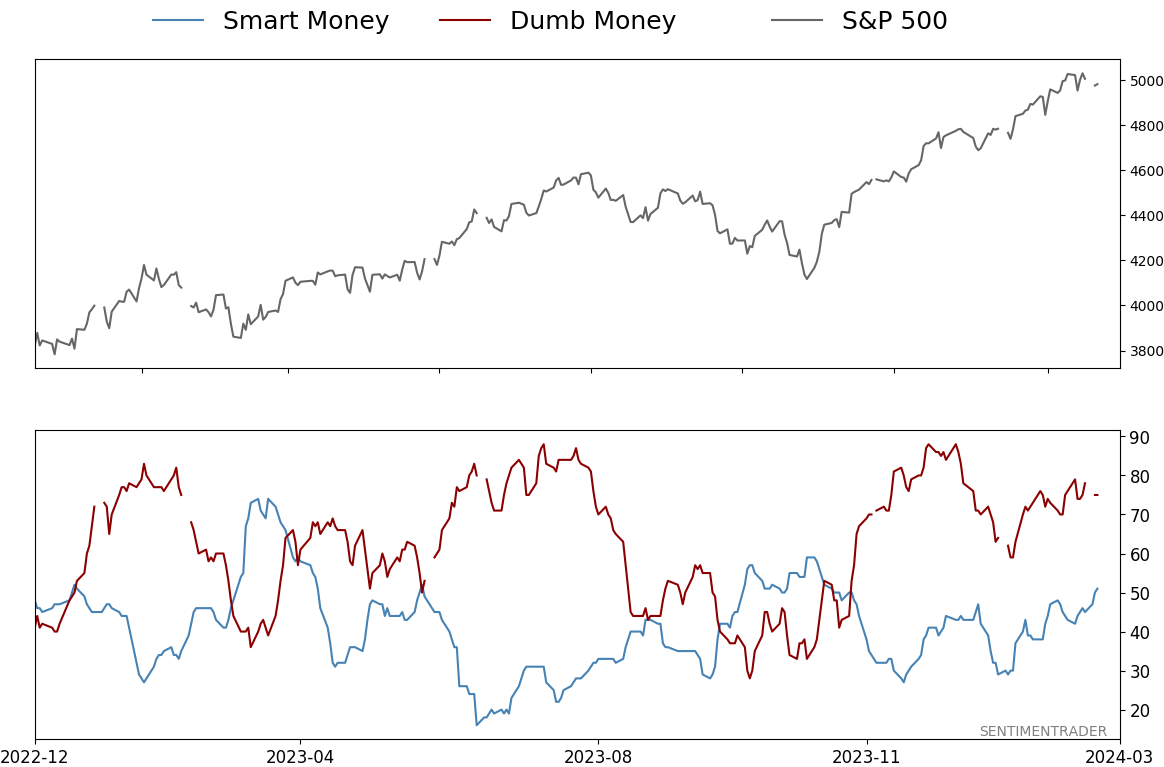
Smart / Dumb Money Confidence
|
Smart Money Confidence: 51%
Dumb Money Confidence: 75%
|
|
Risk Levels
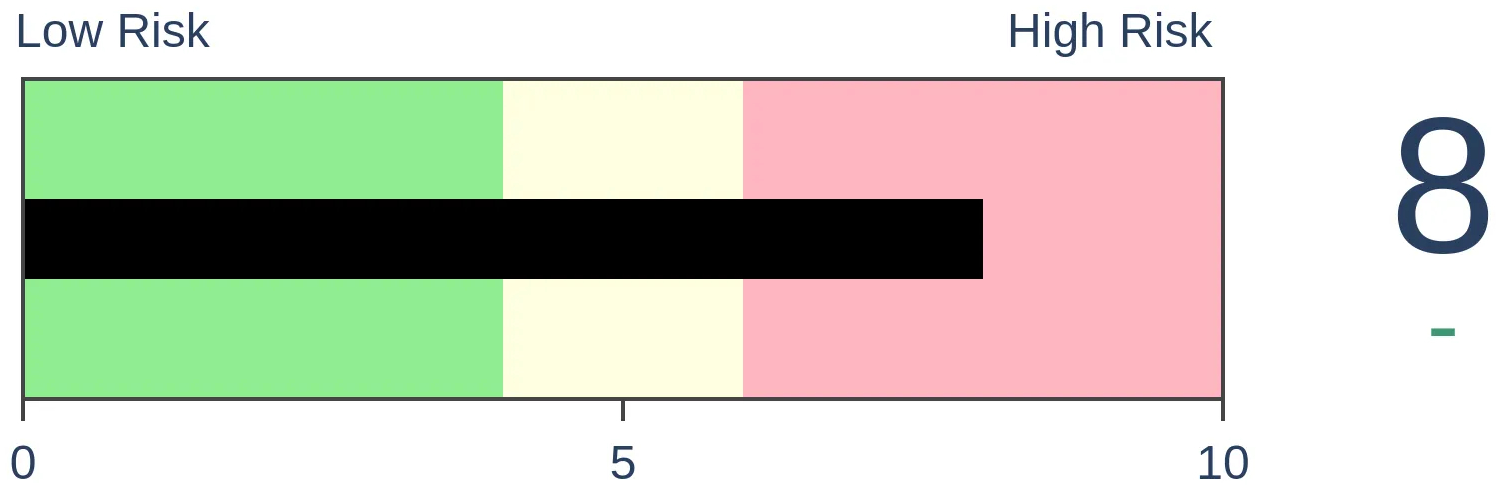
Stocks Short-Term
|
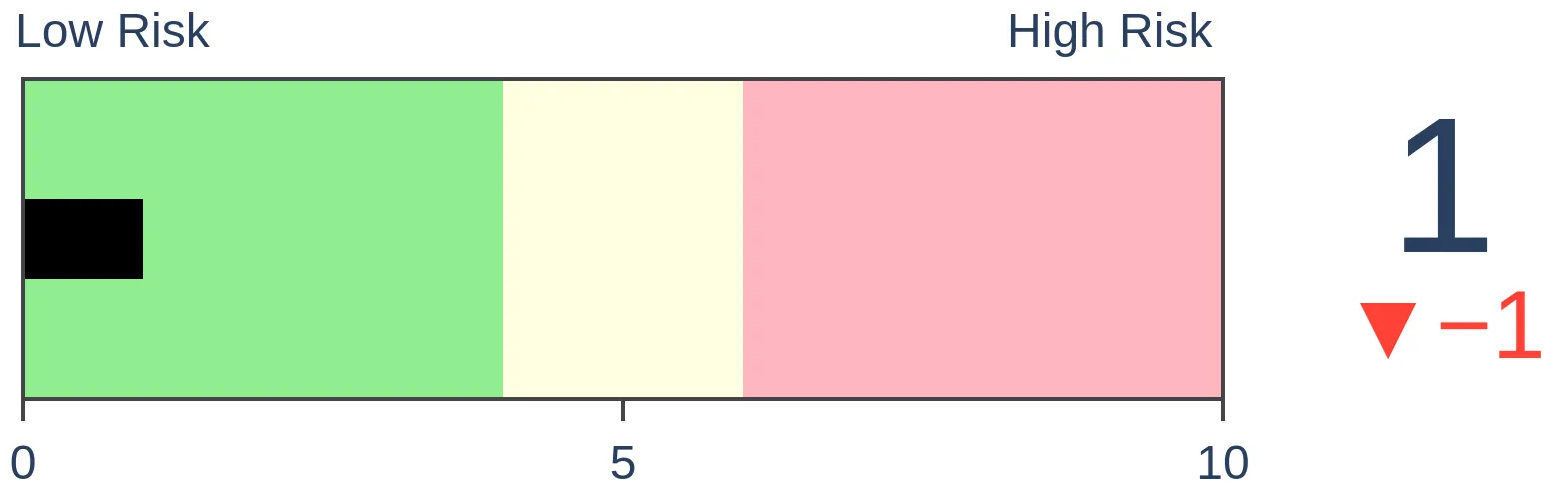
Stocks Medium-Term
|
|
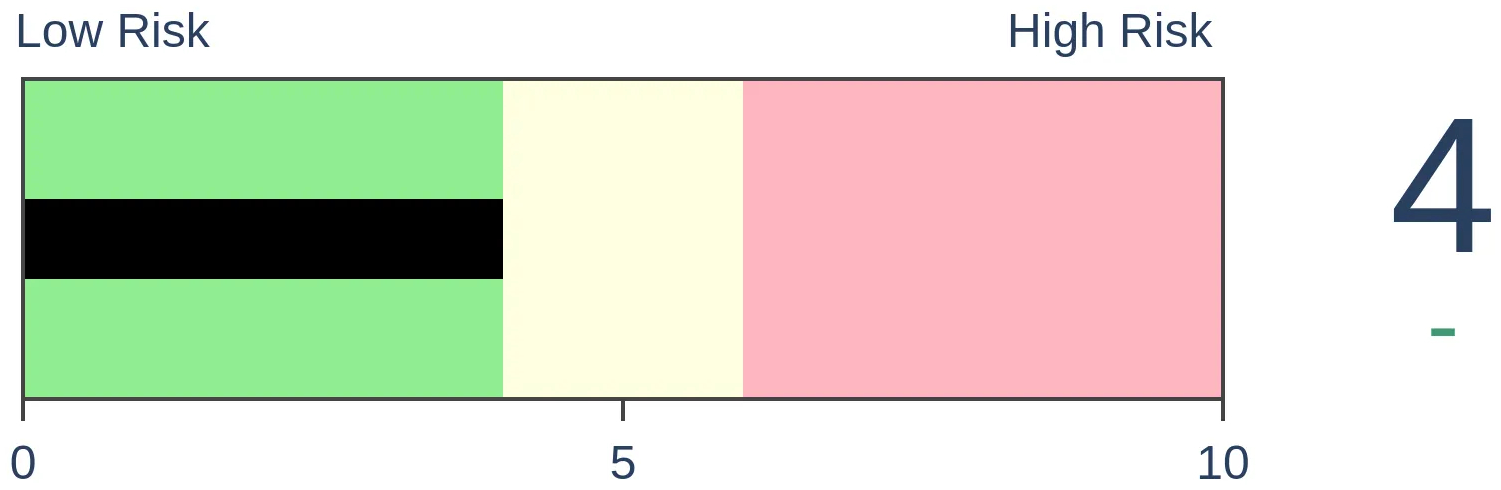
Bonds
|
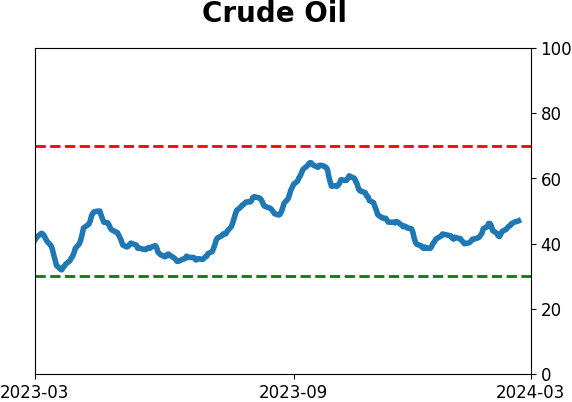
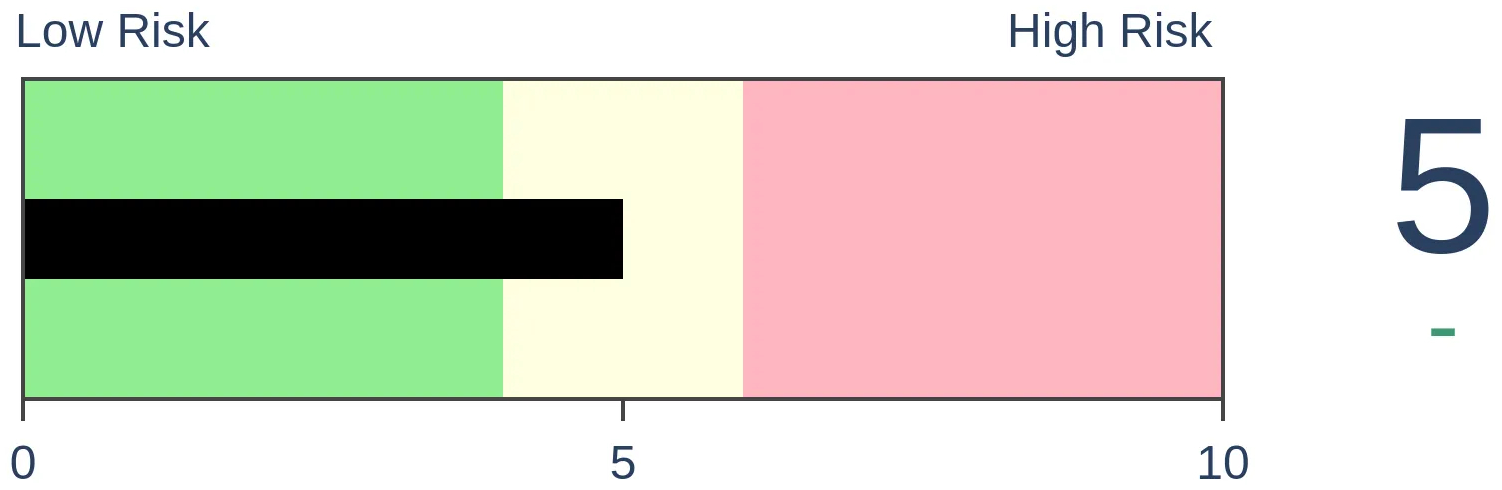
Crude Oil
|
|
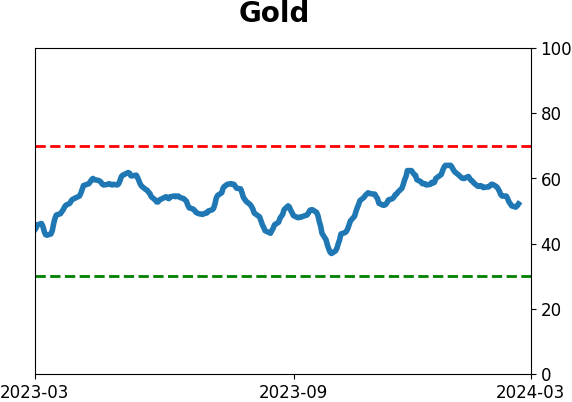
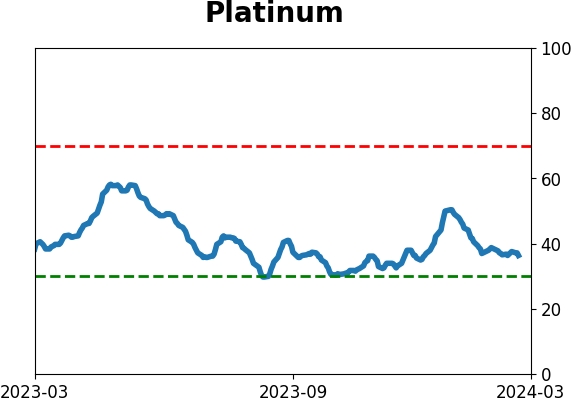
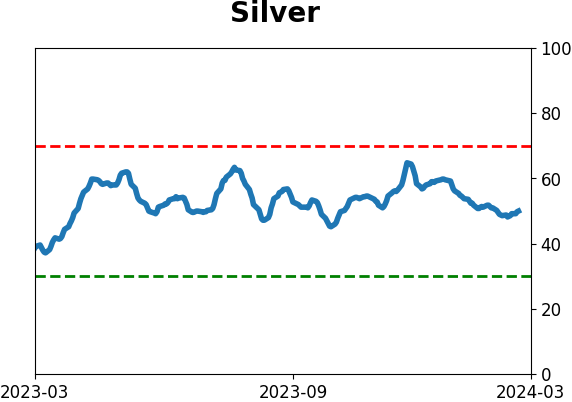
Gold

|
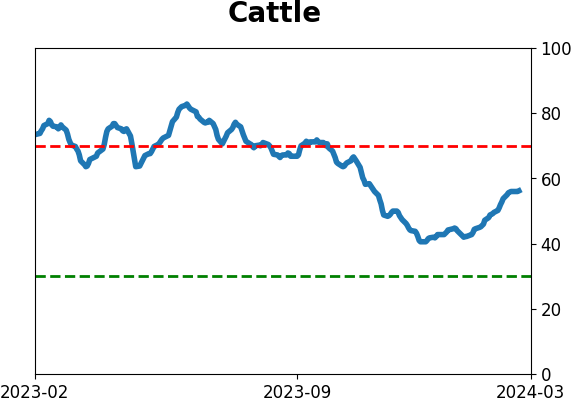
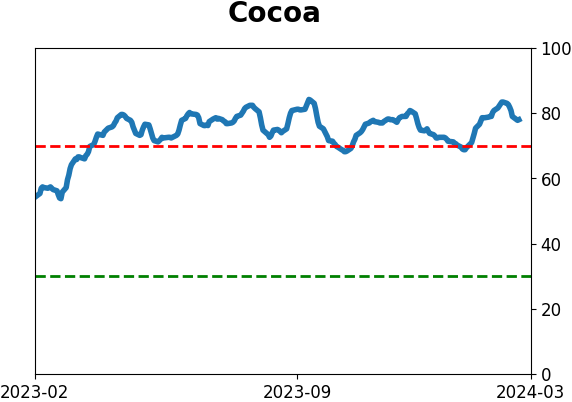
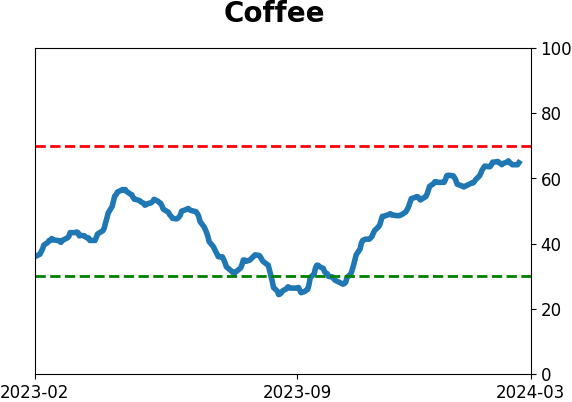
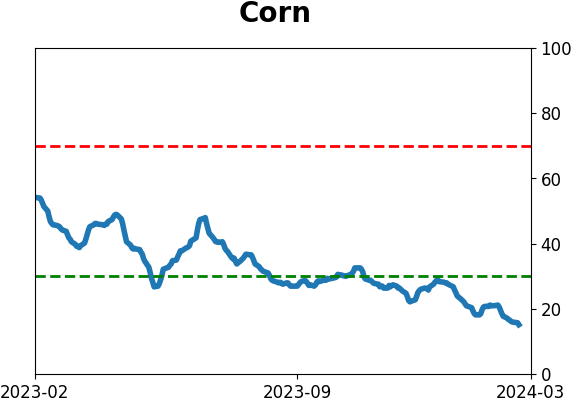
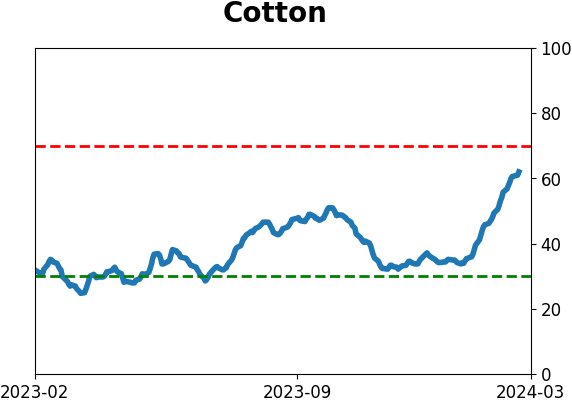
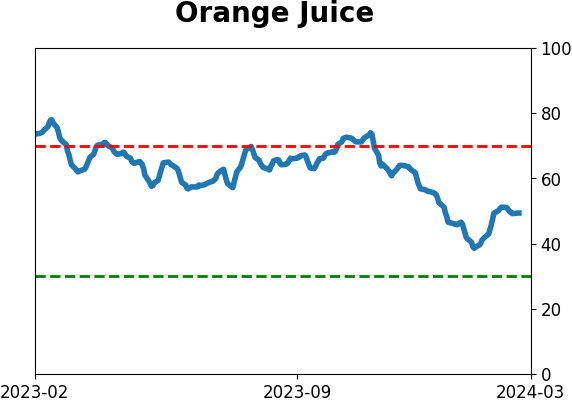
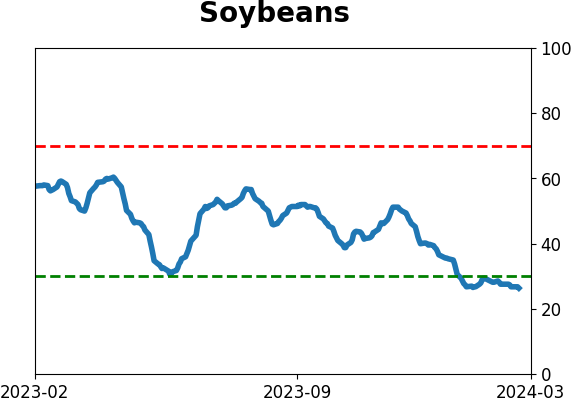
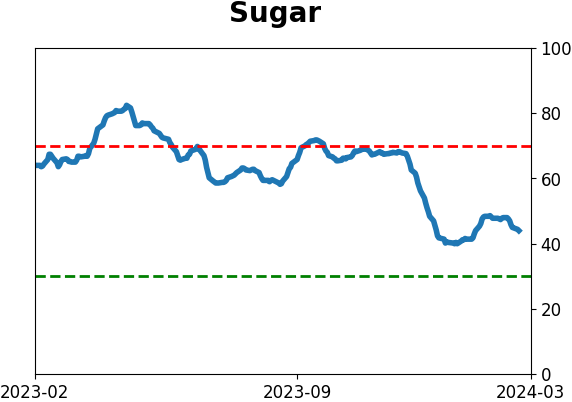
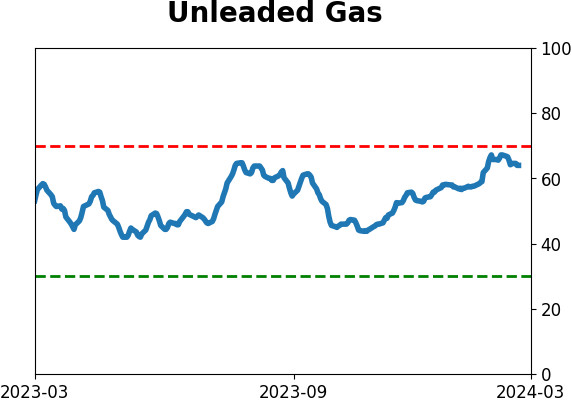
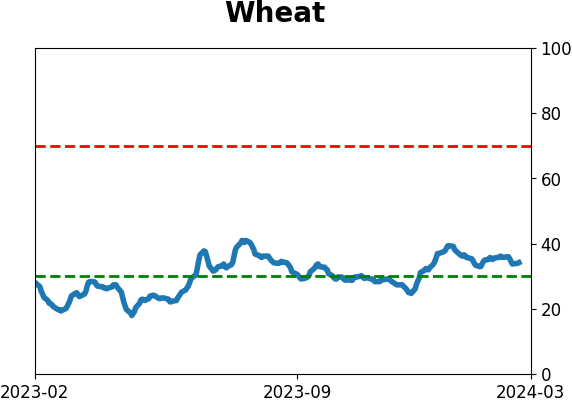
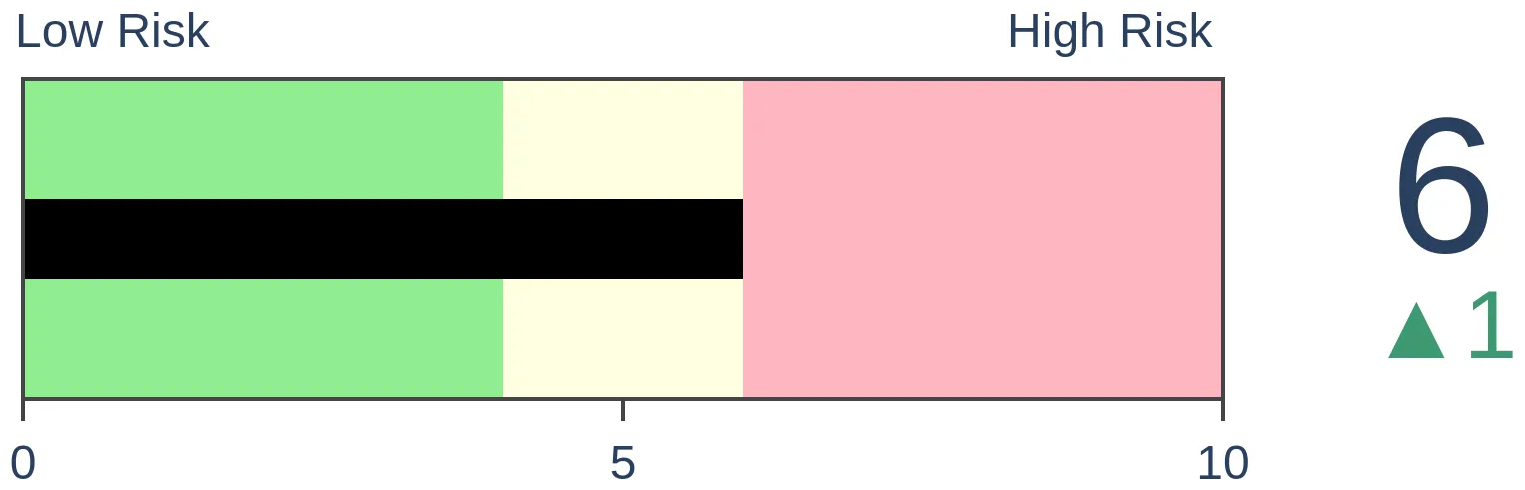
Agriculture
|
|
Research
By Jason Goepfert
BOTTOM LINE
The S&P 500 and Dow Industrials have both set more than 10 record highs so far in 2024. That ranks among the best starts to the year for both indexes, dating back to 1900 for the Dow. After similar fast starts, both indexes tended to show poor average returns over the next two months, but good returns over the following 6-12 months.
FORECAST / TIMEFRAME
None
|
Key points:
- This year has been a boon for bulls, with the S&P 500 setting a record about once every three days
- It's been an even better start for the Dow Industrials, ranking among the best since 1900
- After such rabid starts to a year, both indexes tended to show below-average returns over the next couple of months
The S&P 500 has set a record every third day in 2024
This year started about as well as any bull could have hoped. Not even two months into the new year, a couple of the most widely-watched indexes in the world have set record highs about once every three days.
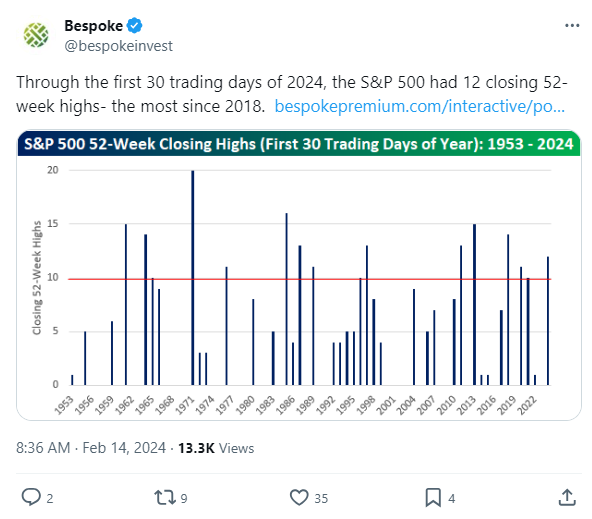
The folks at Bespoke noted that this was the most 52-week high for the S&P 500 through the first 30 sessions since 2018.
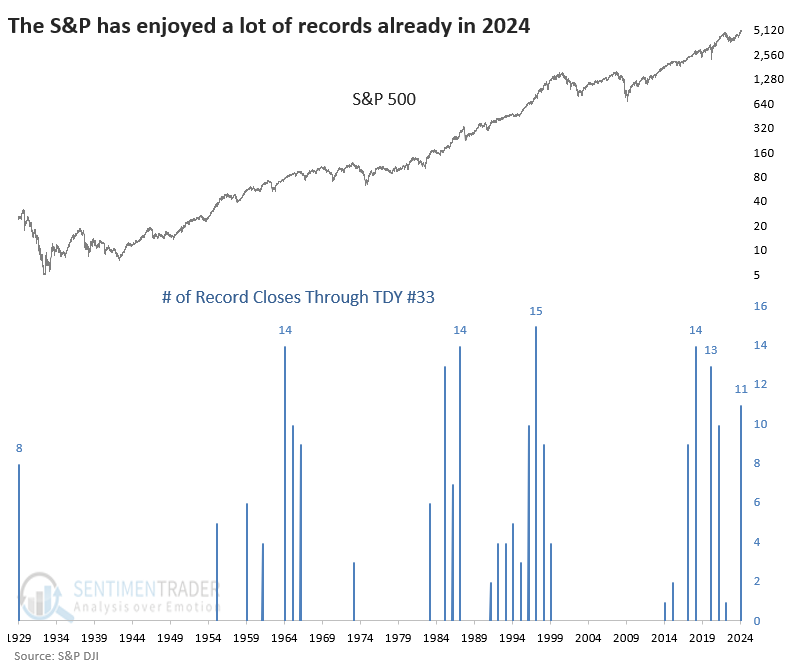
The S&P's performance is even more remarkable because it wasn't setting just 52-week highs but all-time highs. Our data shows 11 record closes through the 33rd Trading Day of the Year (TDY), which ranks among the very best starts since 1928.
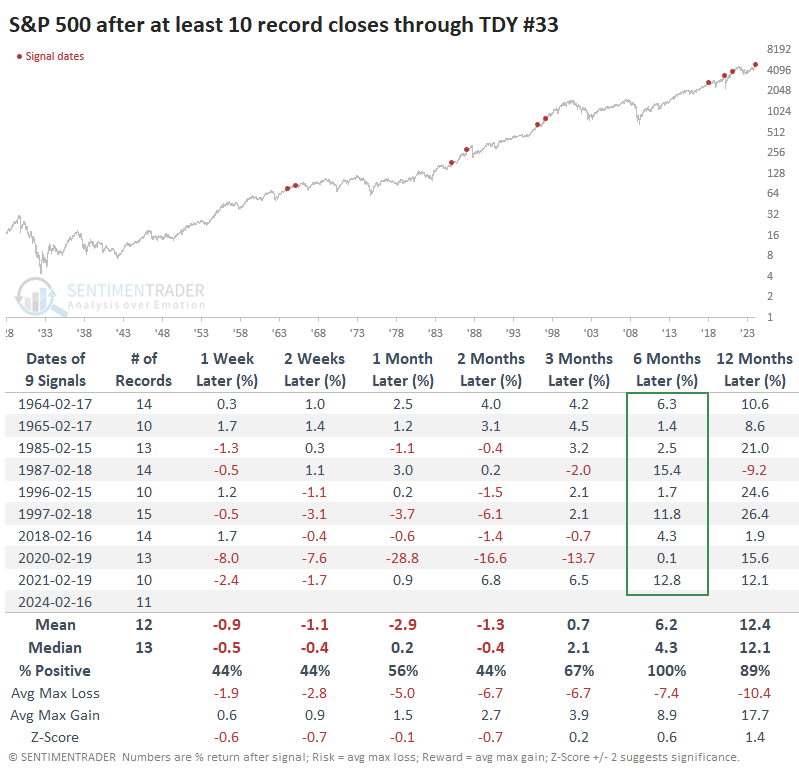
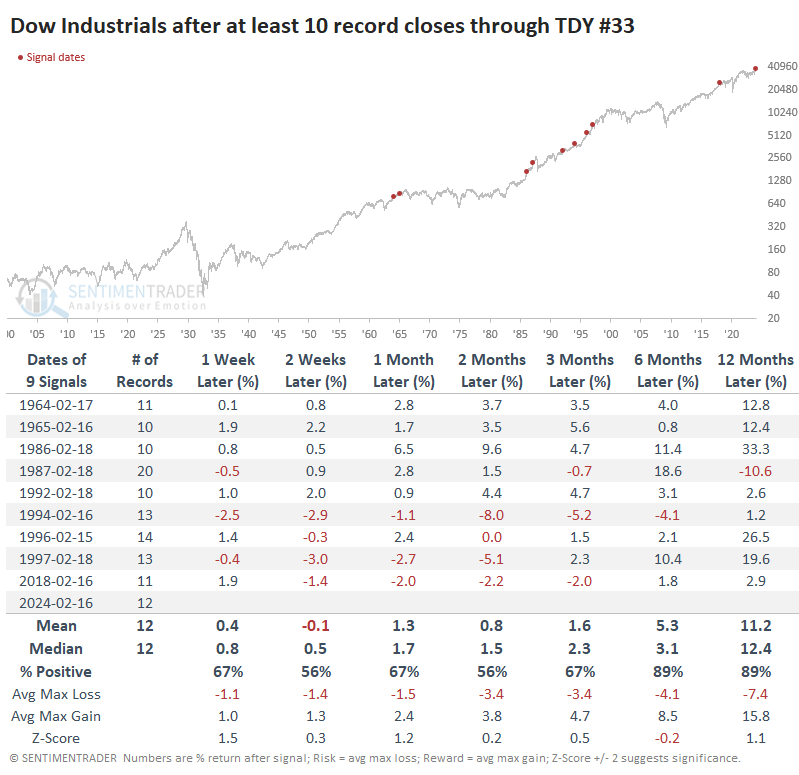
After setting at least ten records within the first 33 trading days, the S&P struggled over the next couple of months. Only one year, 1964, rallied and kept building on its gains as time progressed. The others showed either outright negative returns or gave back some of the gains in the months that followed. Bulls could at least take solace in the fact that over the next six months, all the signals sported a positive return.
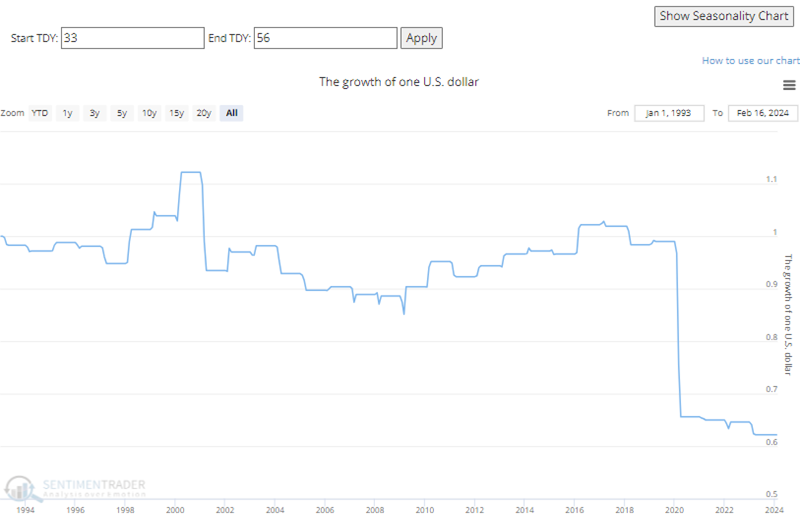
Part of the weakness is due to seasonality. The seasonal tendency for the SPY fund over the past 30 years has been to peak right about now and generally decline over the next month or so. If you click the "Show Growth of $1 Chart" in the upper right-hand corner of the seasonal charts, you can now plot the return of $1 over various time frames.
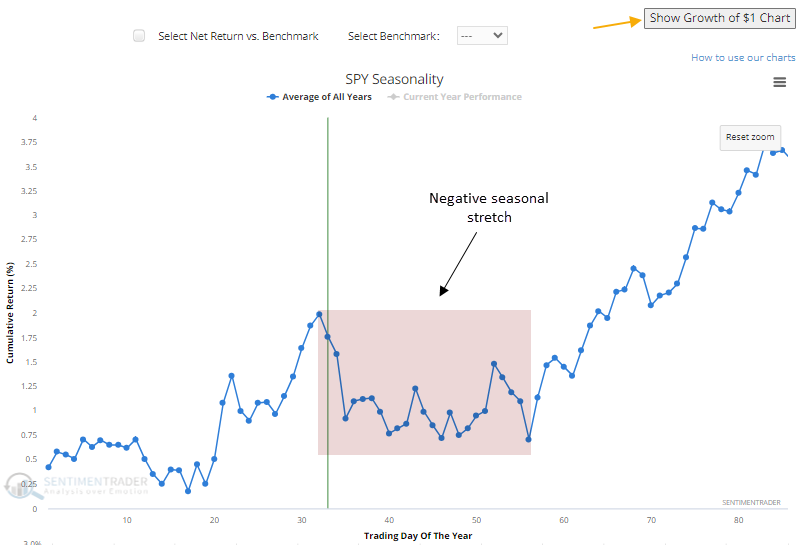
If we click that button for SPY seasonality and compute the growth of $1 from Trading Day of the Year #33 through #56, and look over the fund's entire history, we can see that $1 turned into $0.62.
There were some years when SPY did very well during this time frame, so like anything, it's not foolproof. It just shows us tendencies over time, and this one has been relatively consistent.
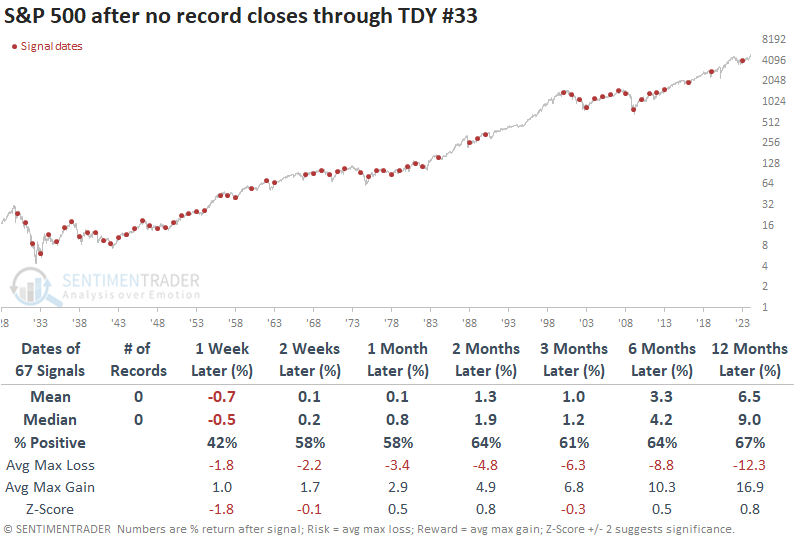
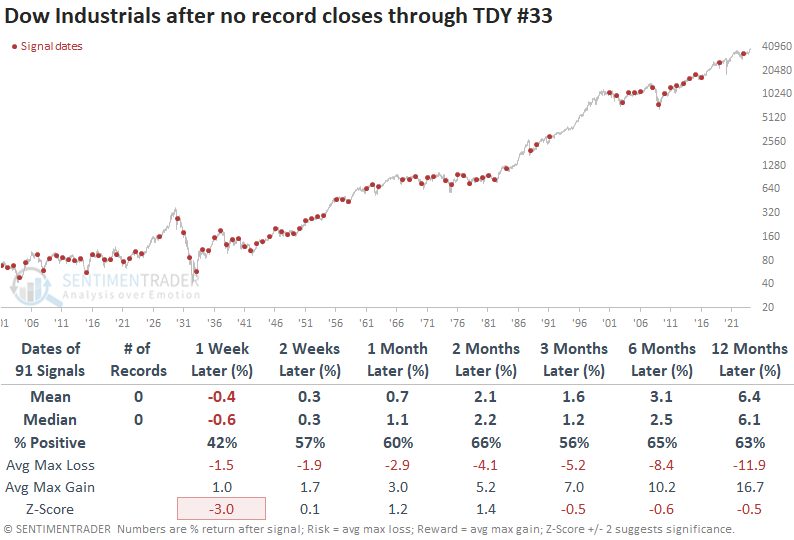
The summary table below shows us returns in the S&P after years when it didn't set any records during the first 33 trading days. After these disappointing starts, the S&P's medium-term returns were better than when it set many records. But 6-12 month returns were less than that during momentum years.
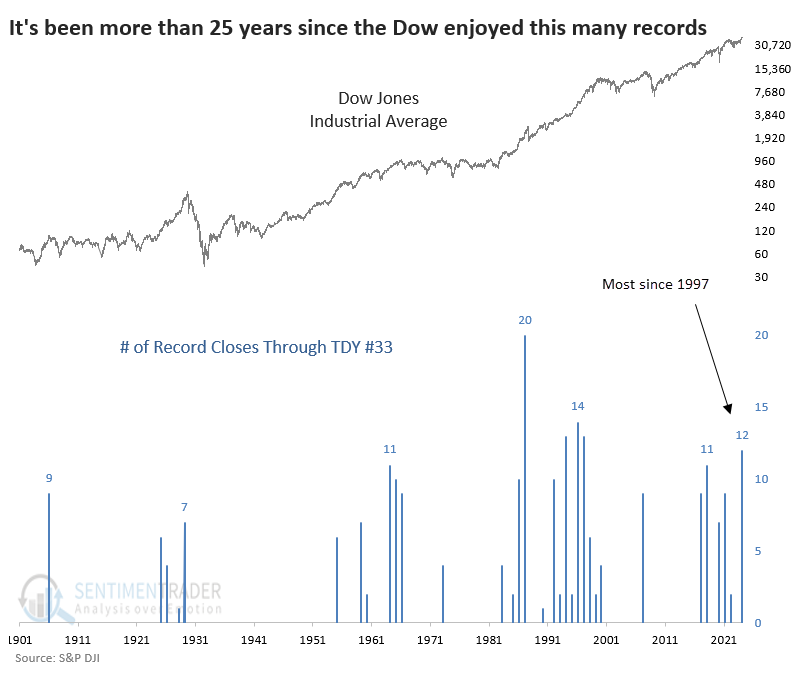
It's been an even better start for the Dow
The Dow Industrials has a longer history, but 2024 has seen a robust start even for that index. It has recorded some of the most record highs this far into a year for any year since 1900 and the most since 1997.
For the Dow, this high momentum has held up better than the S&P 500. One caveat there, though, is that the past four signals have all preceded a negative return for the Dow over the next two months. But, again, its 6-12 month returns tended to be quite good.
We see the same pattern in the Dow that we did for the S&P, in that medium-term returns were better after years when there were no record highs during the first 33 sessions. But 6-12 month returns tended to be significantly worse.
What the research tells us...
Stock indexes have enjoyed robust momentum in 2024, setting record highs on about 1/3 of all sessions. That remarkable achievement ranks among the best in a hundred or more years. That momentum, however, is running into what has tended to be a seasonal soft spot. After other years that showed impressive momentum this far into the year, there was a tendency to see relatively weak performance for weeks or even months afterward. For bulls, though, the bright side was that returns over the next 6-12 months tended to be quite good and consistently positive.
Indicators at Extremes
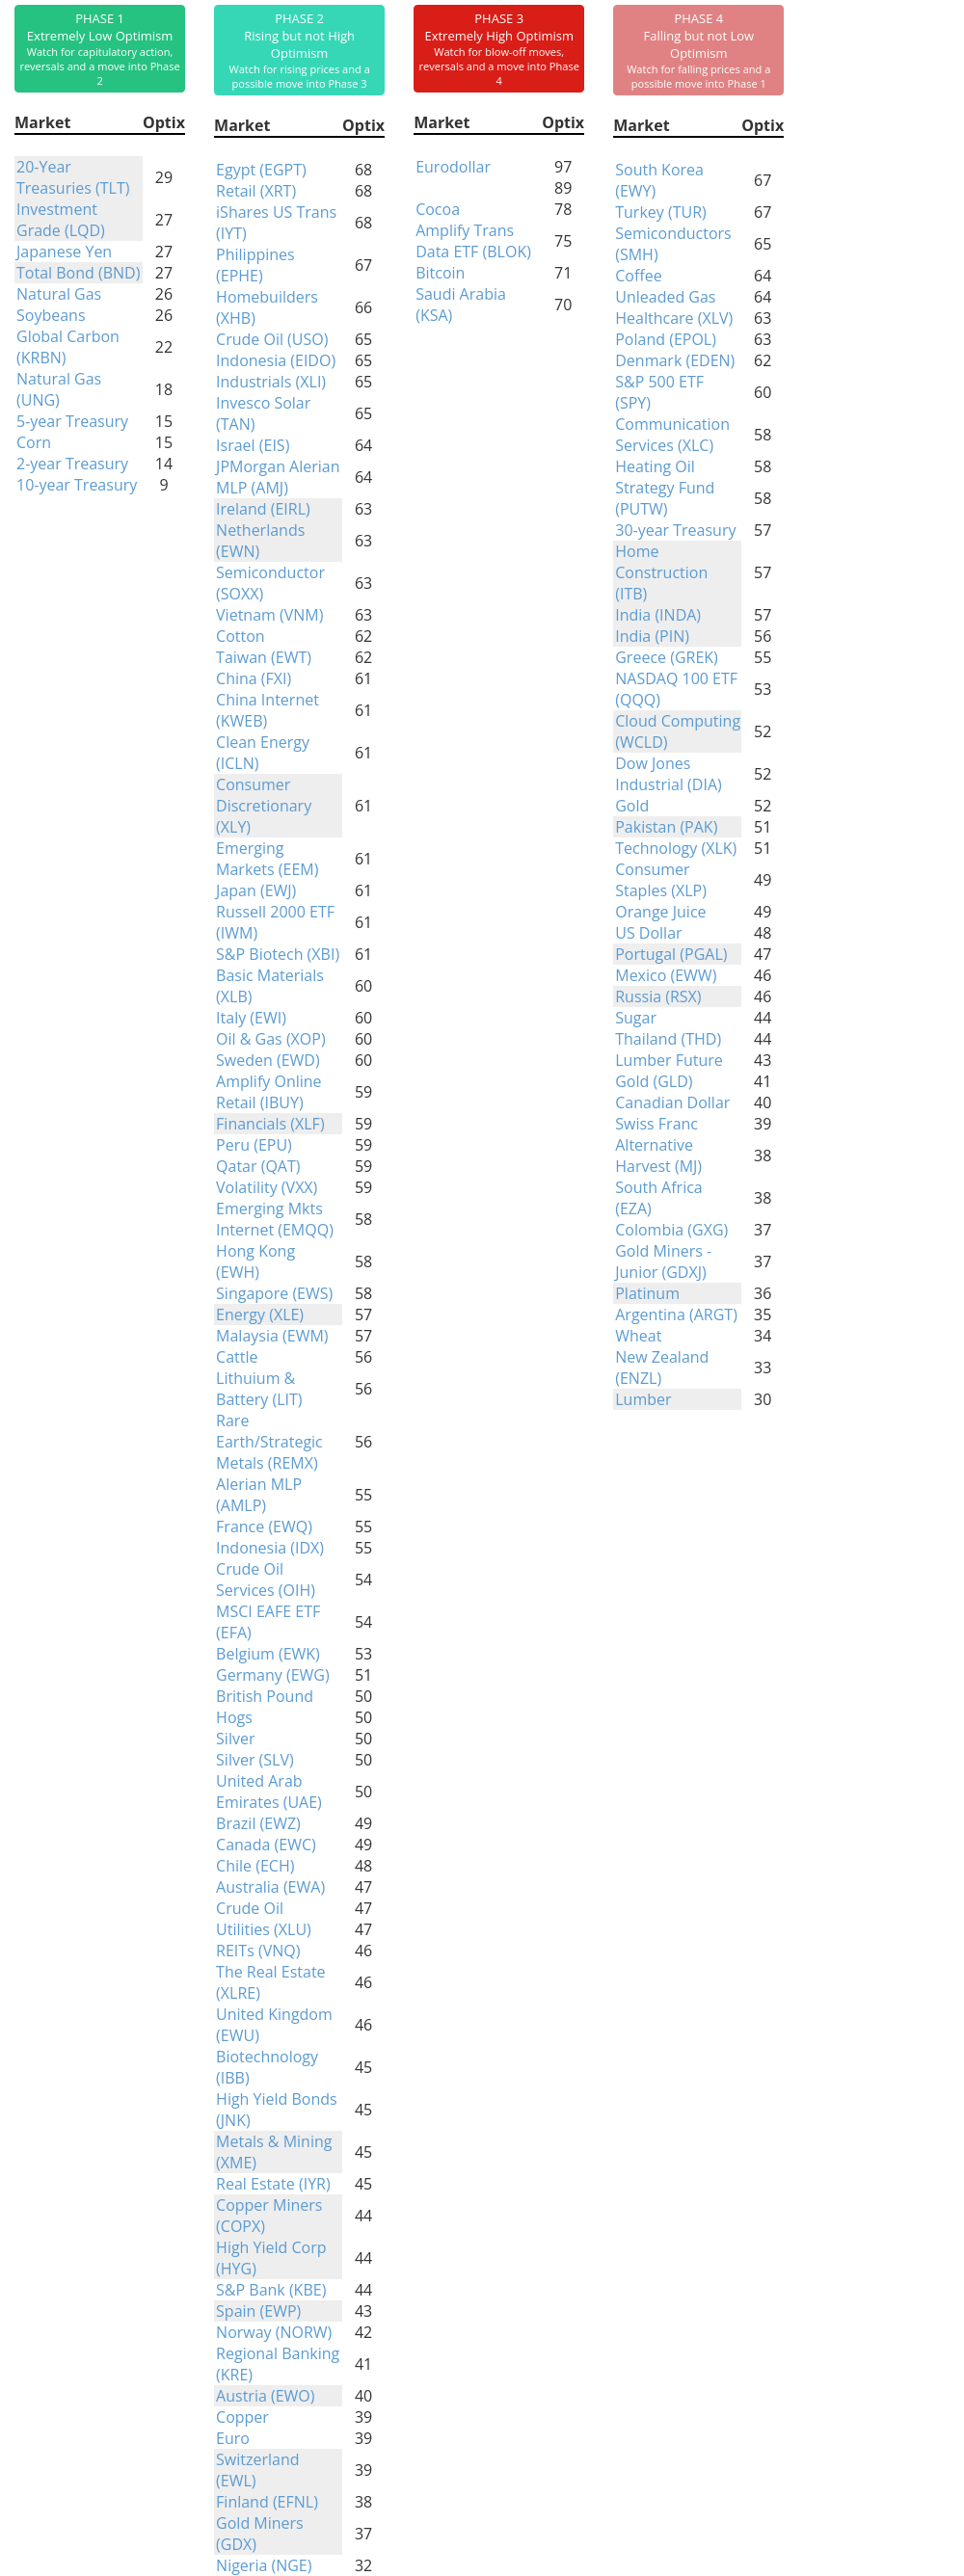
Phase Table
Ranks
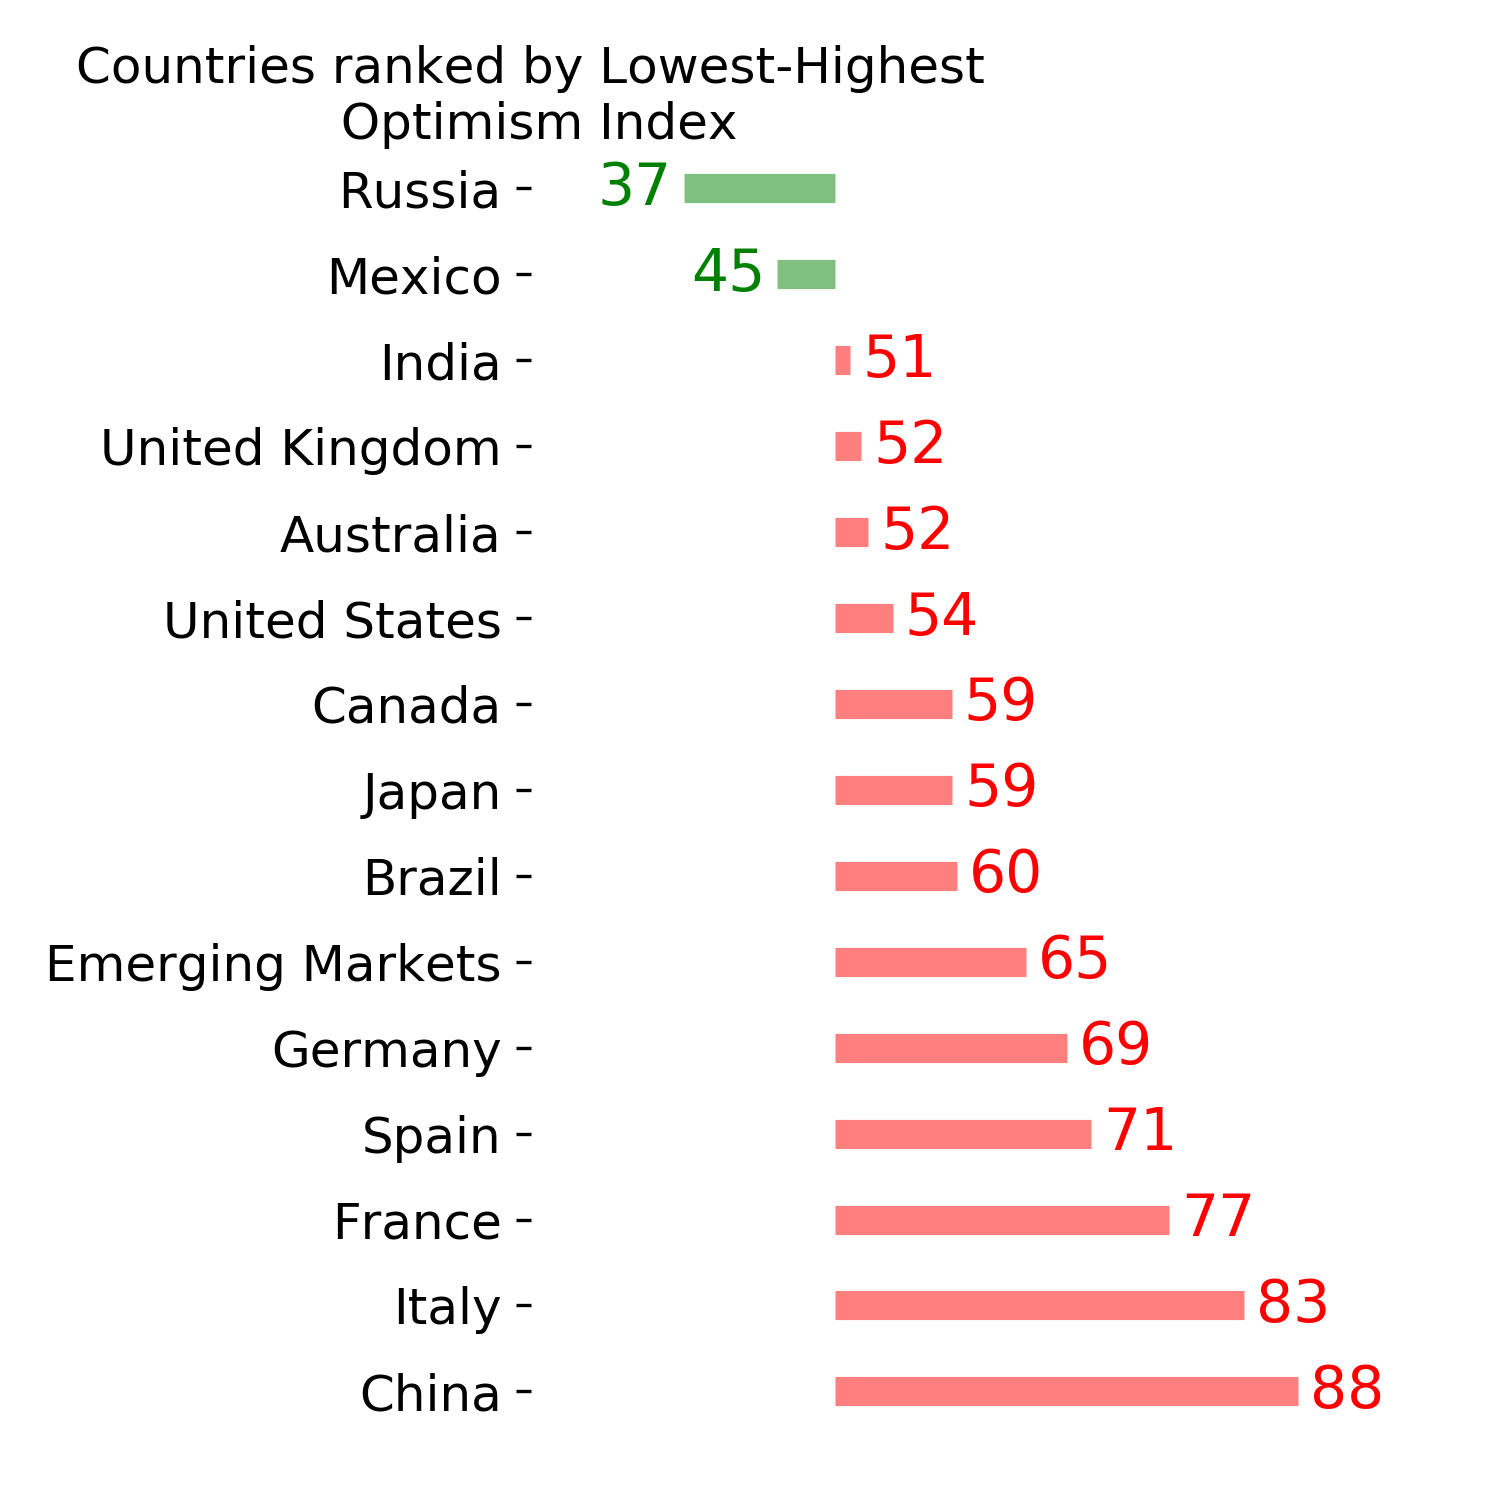
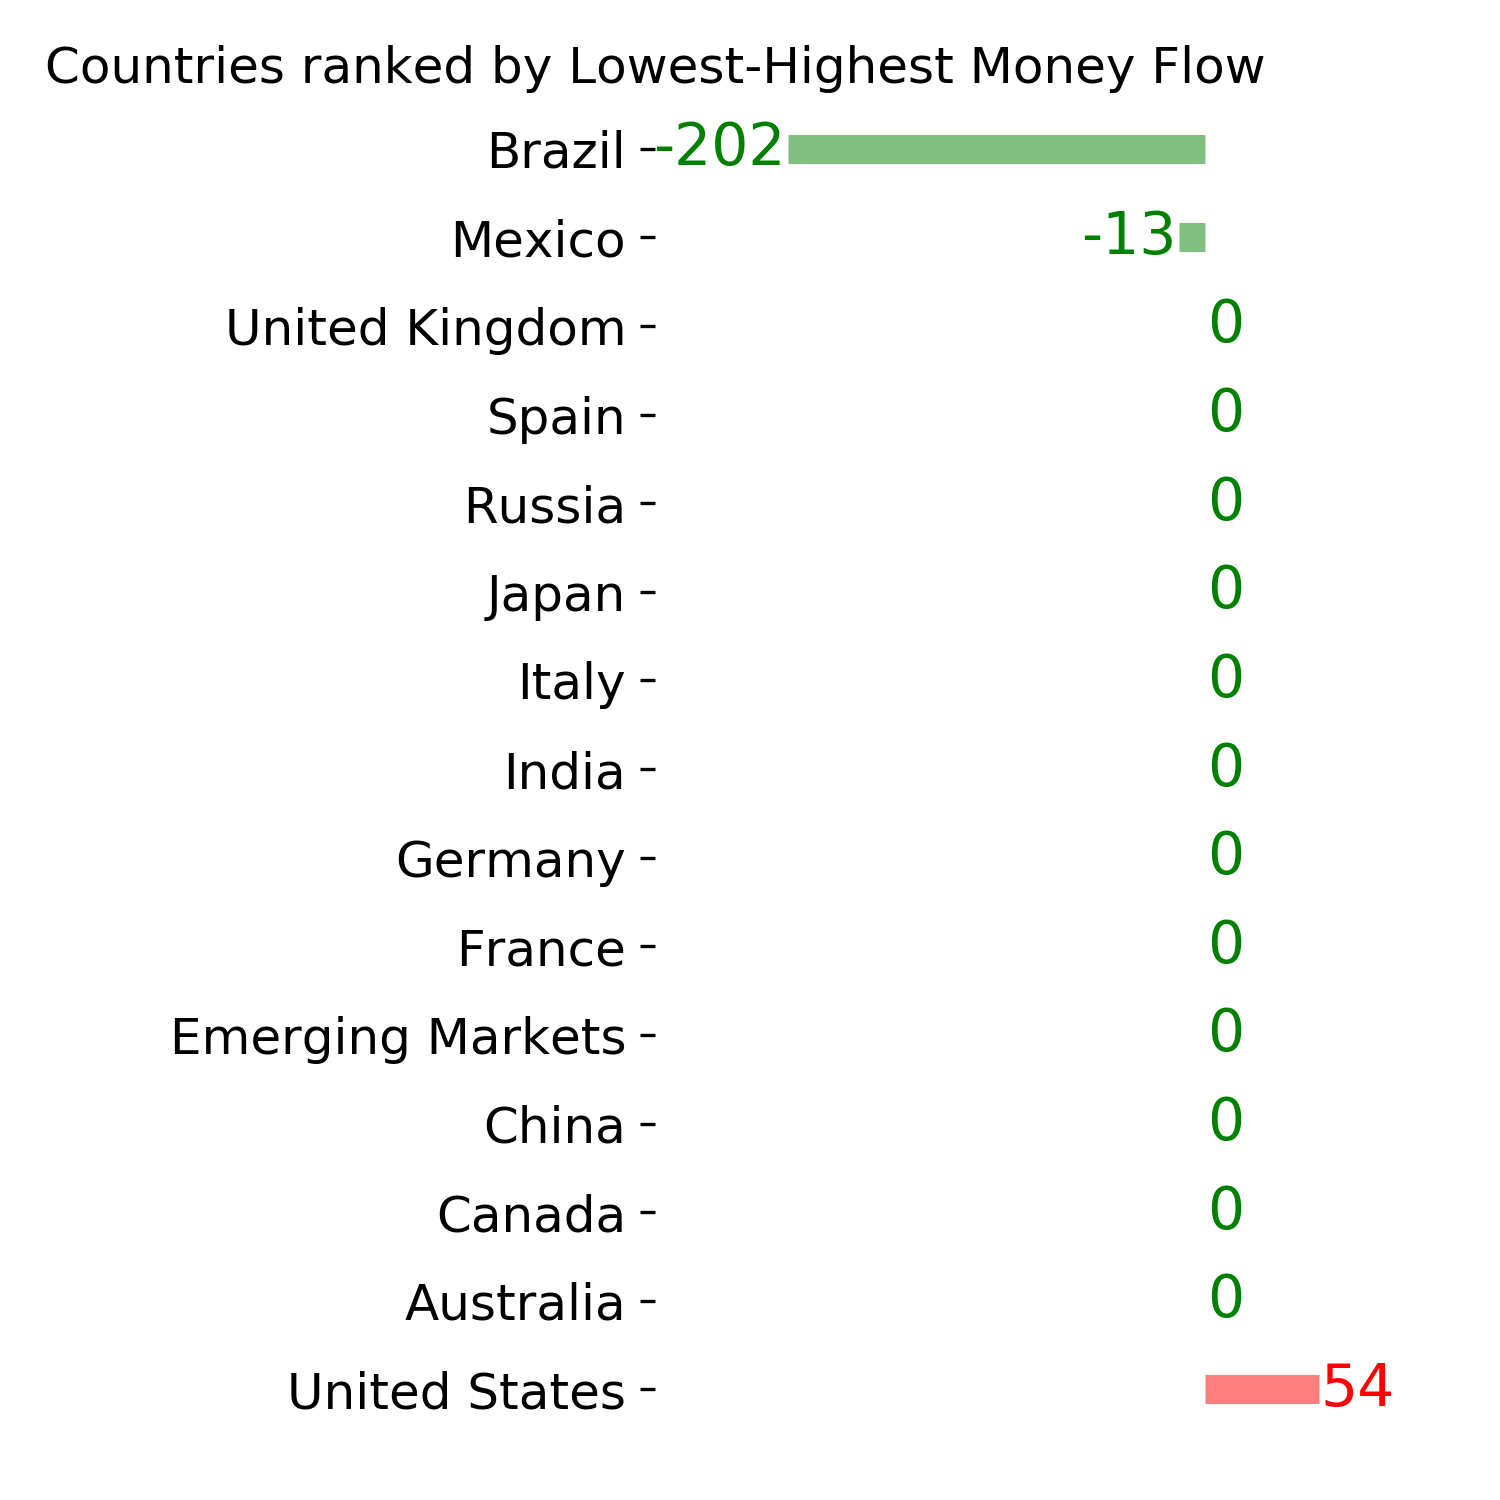
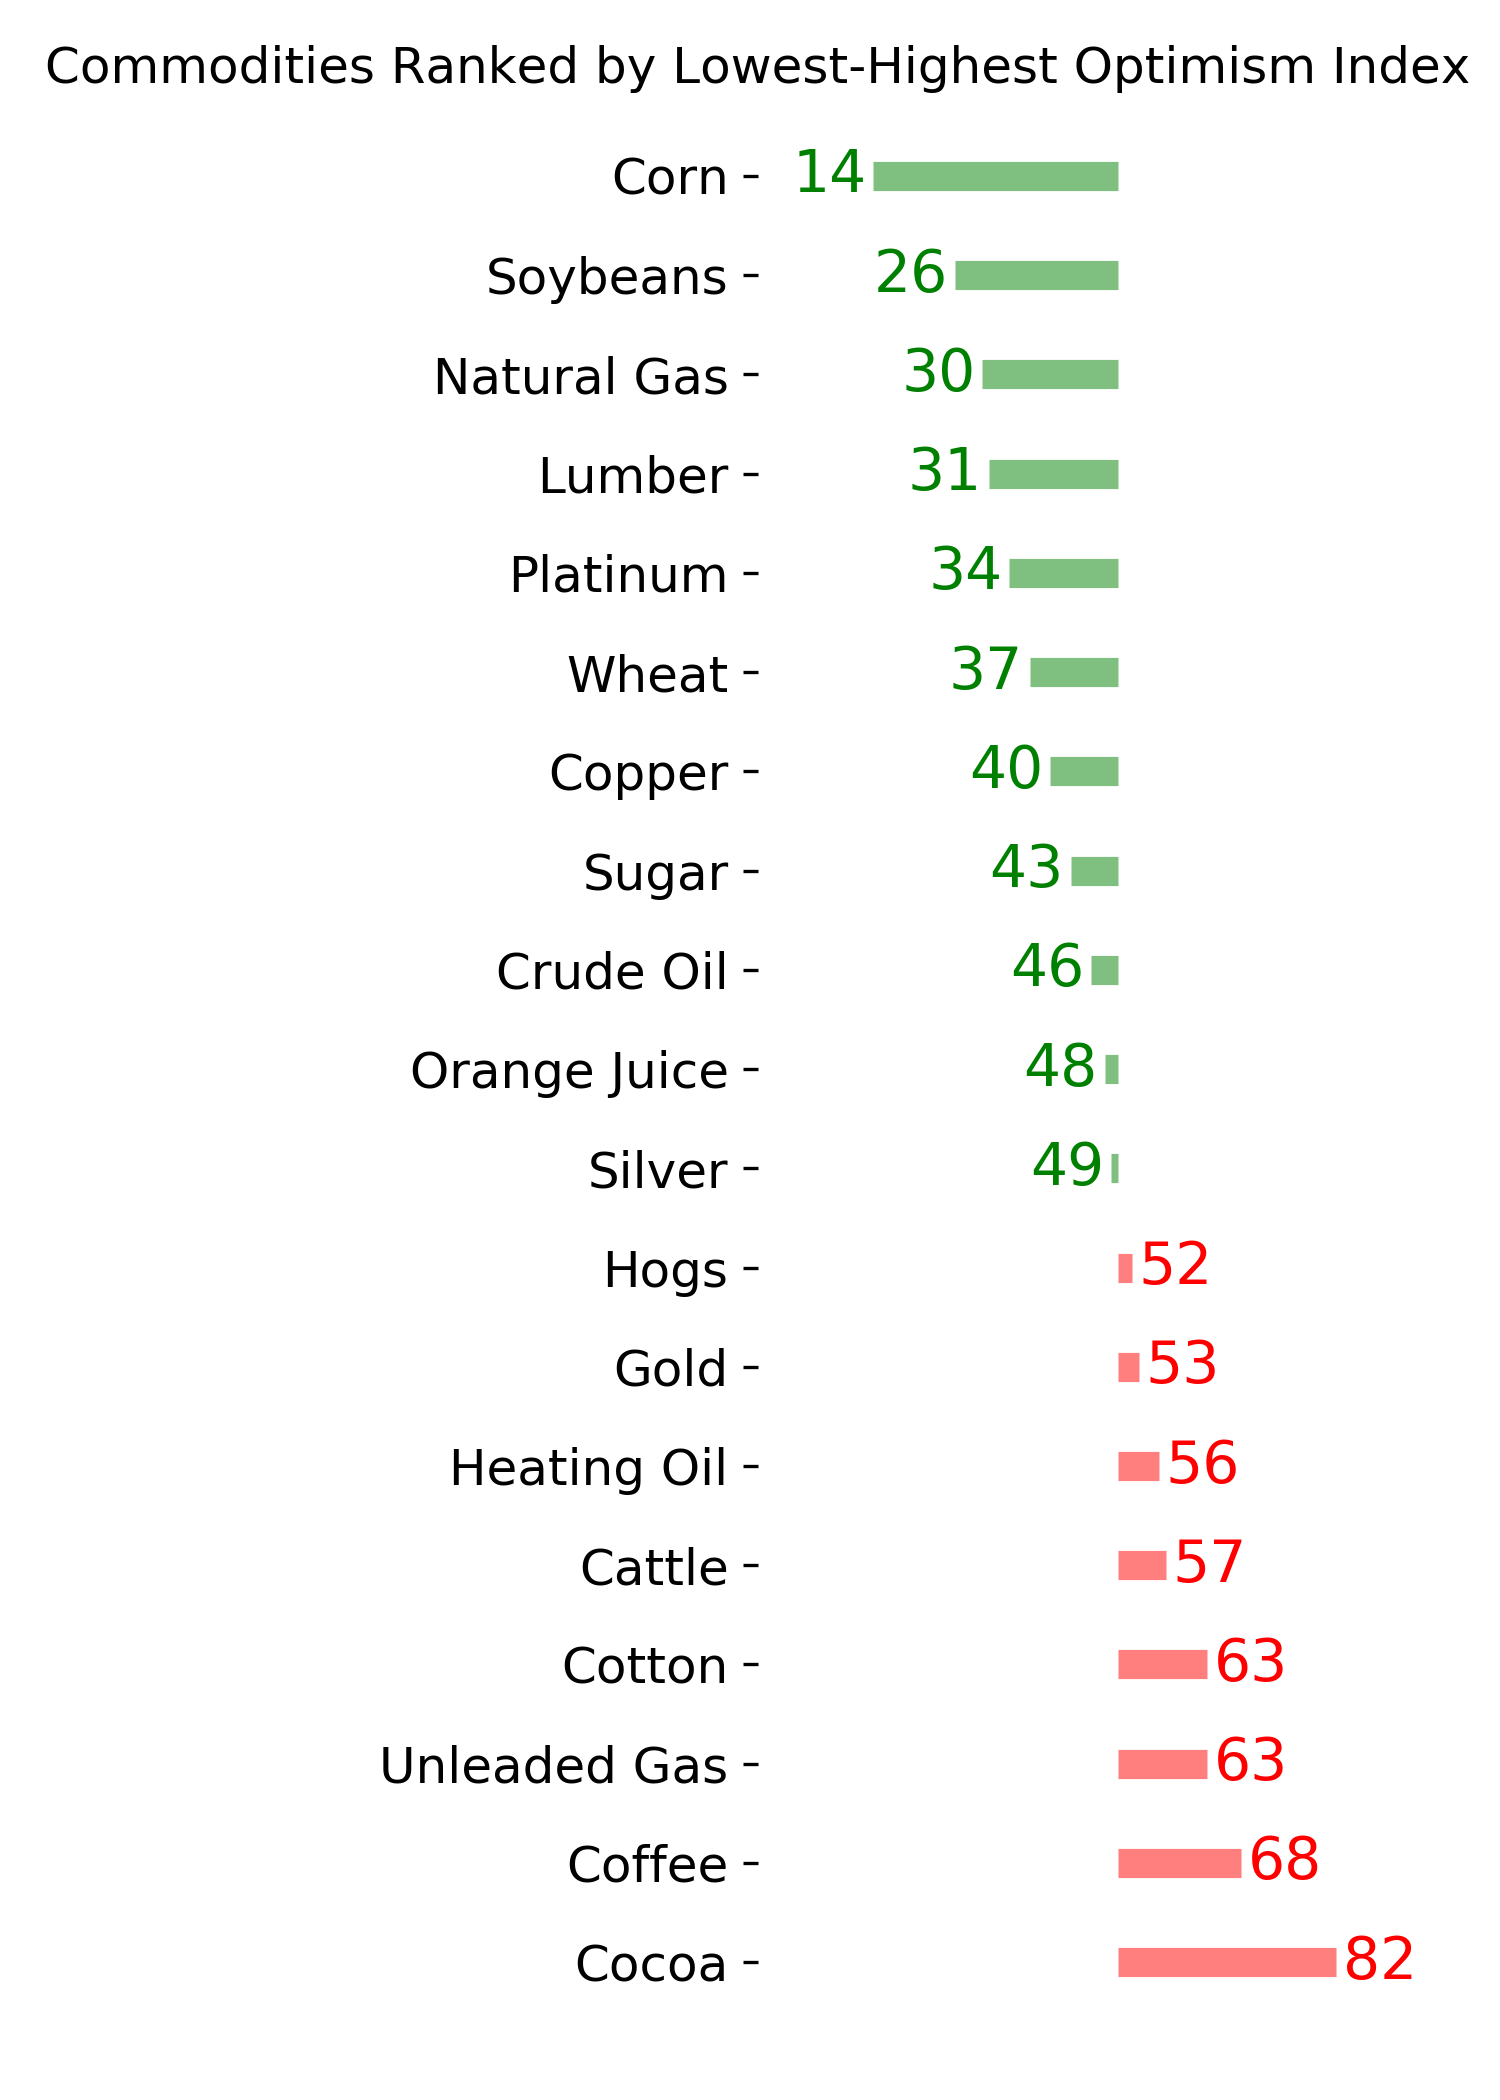
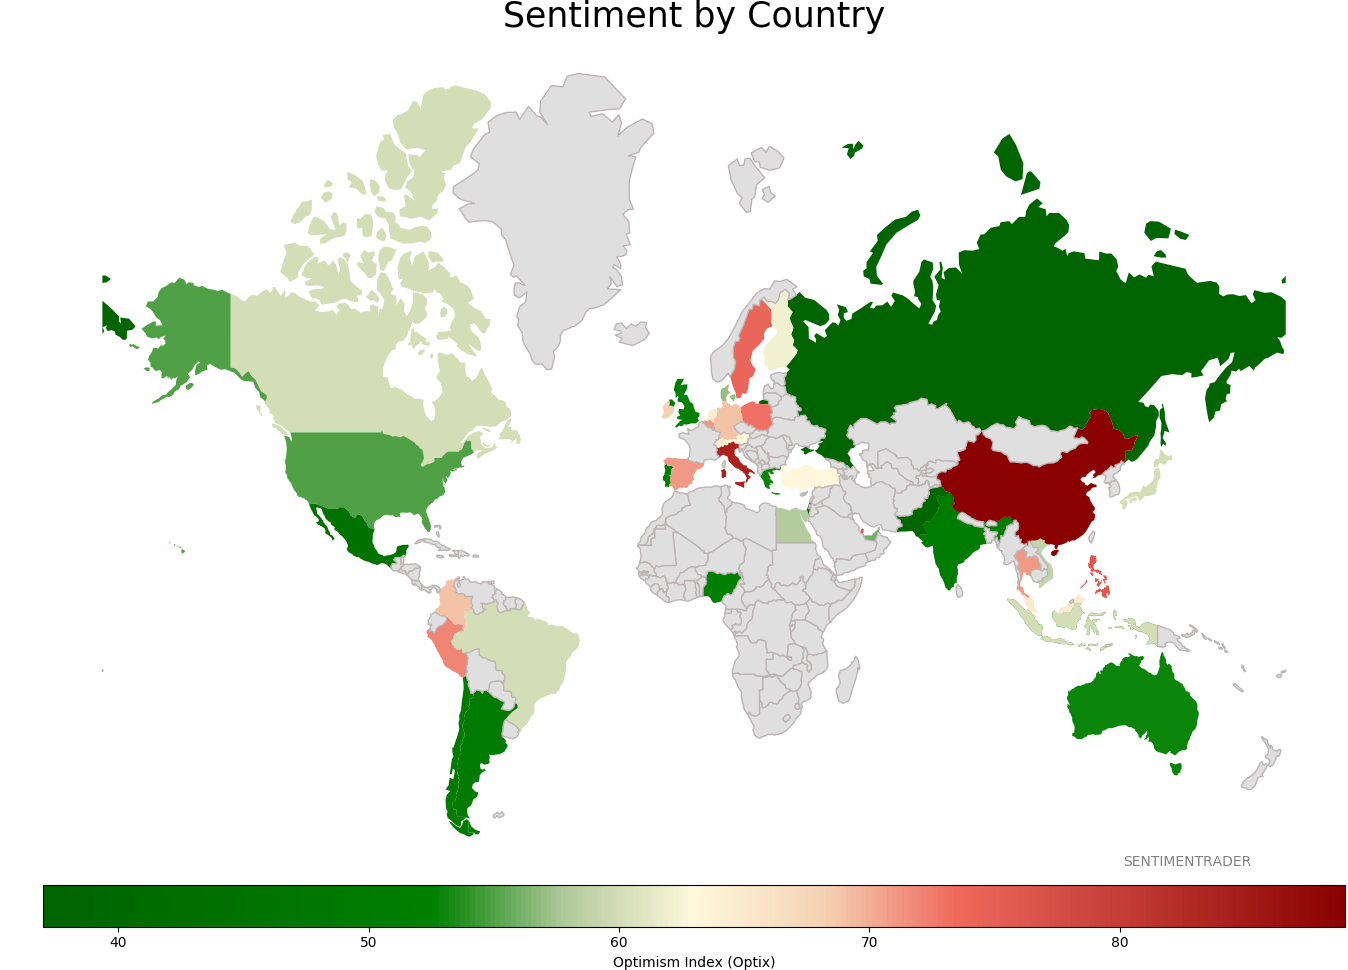
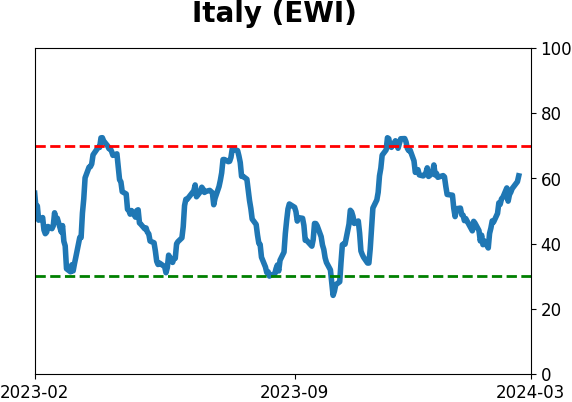
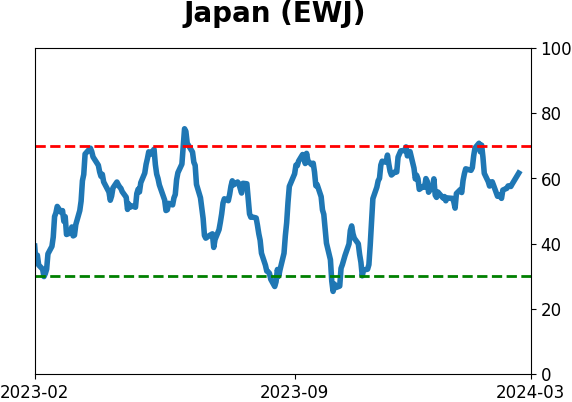
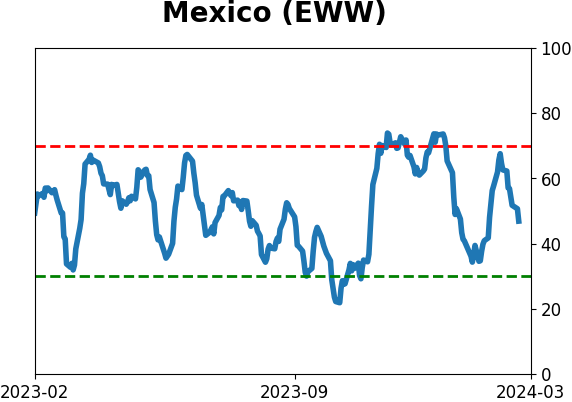
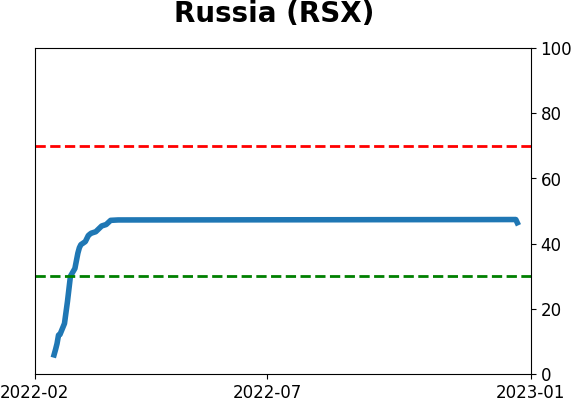
Sentiment Around The World
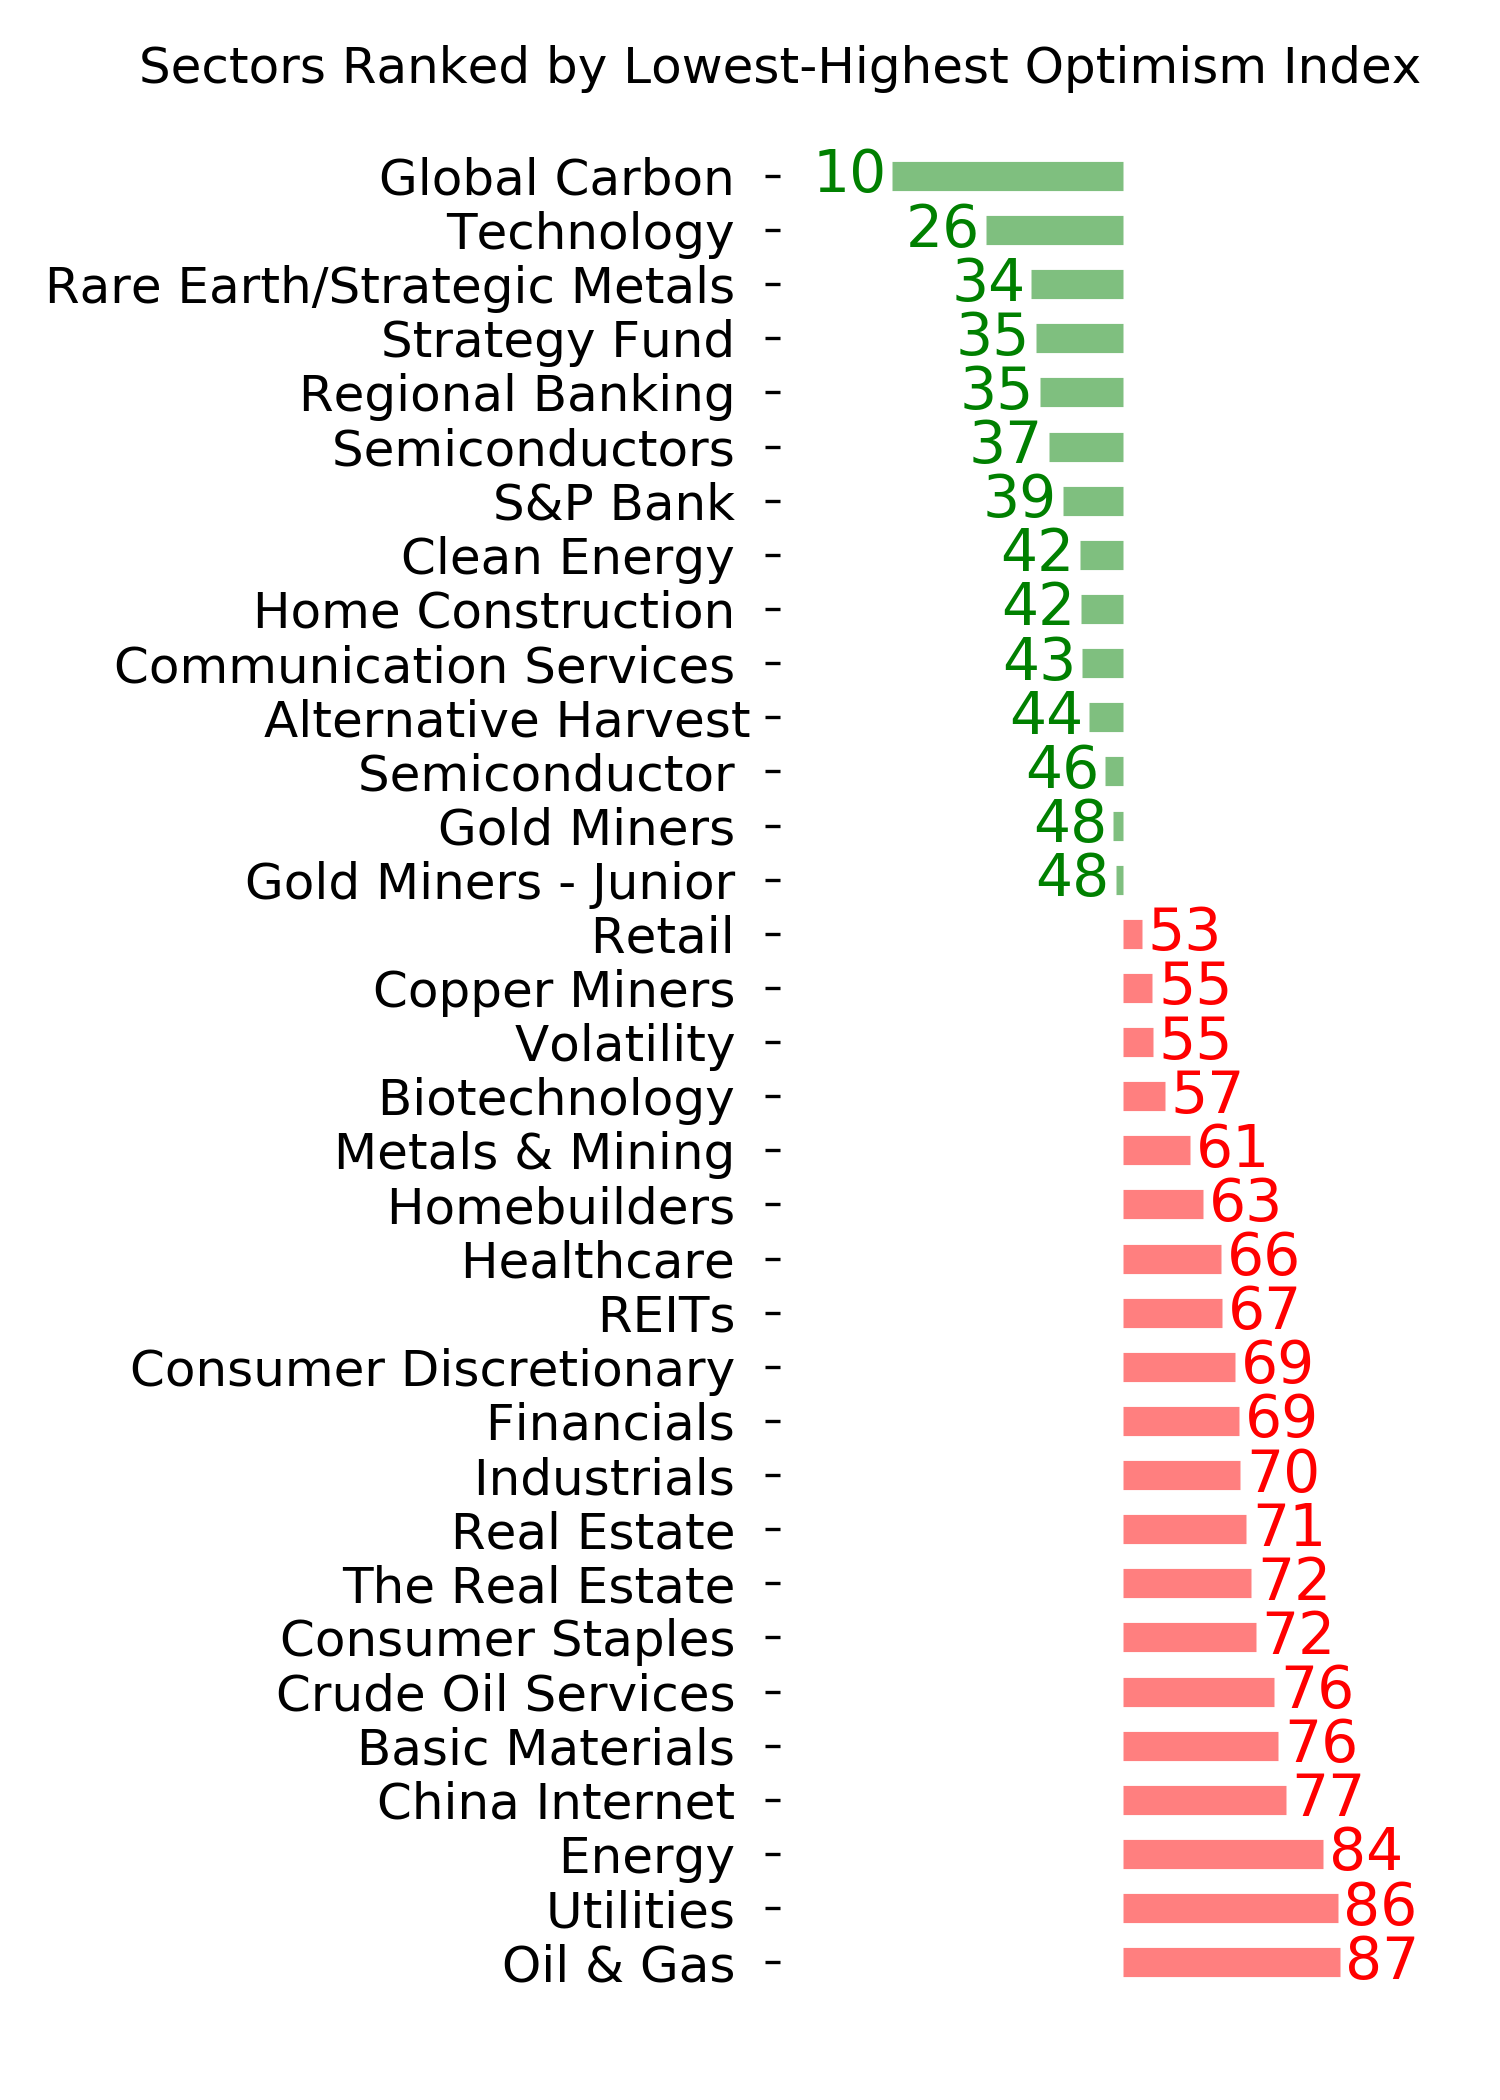
Optimism Index Thumbnails
|
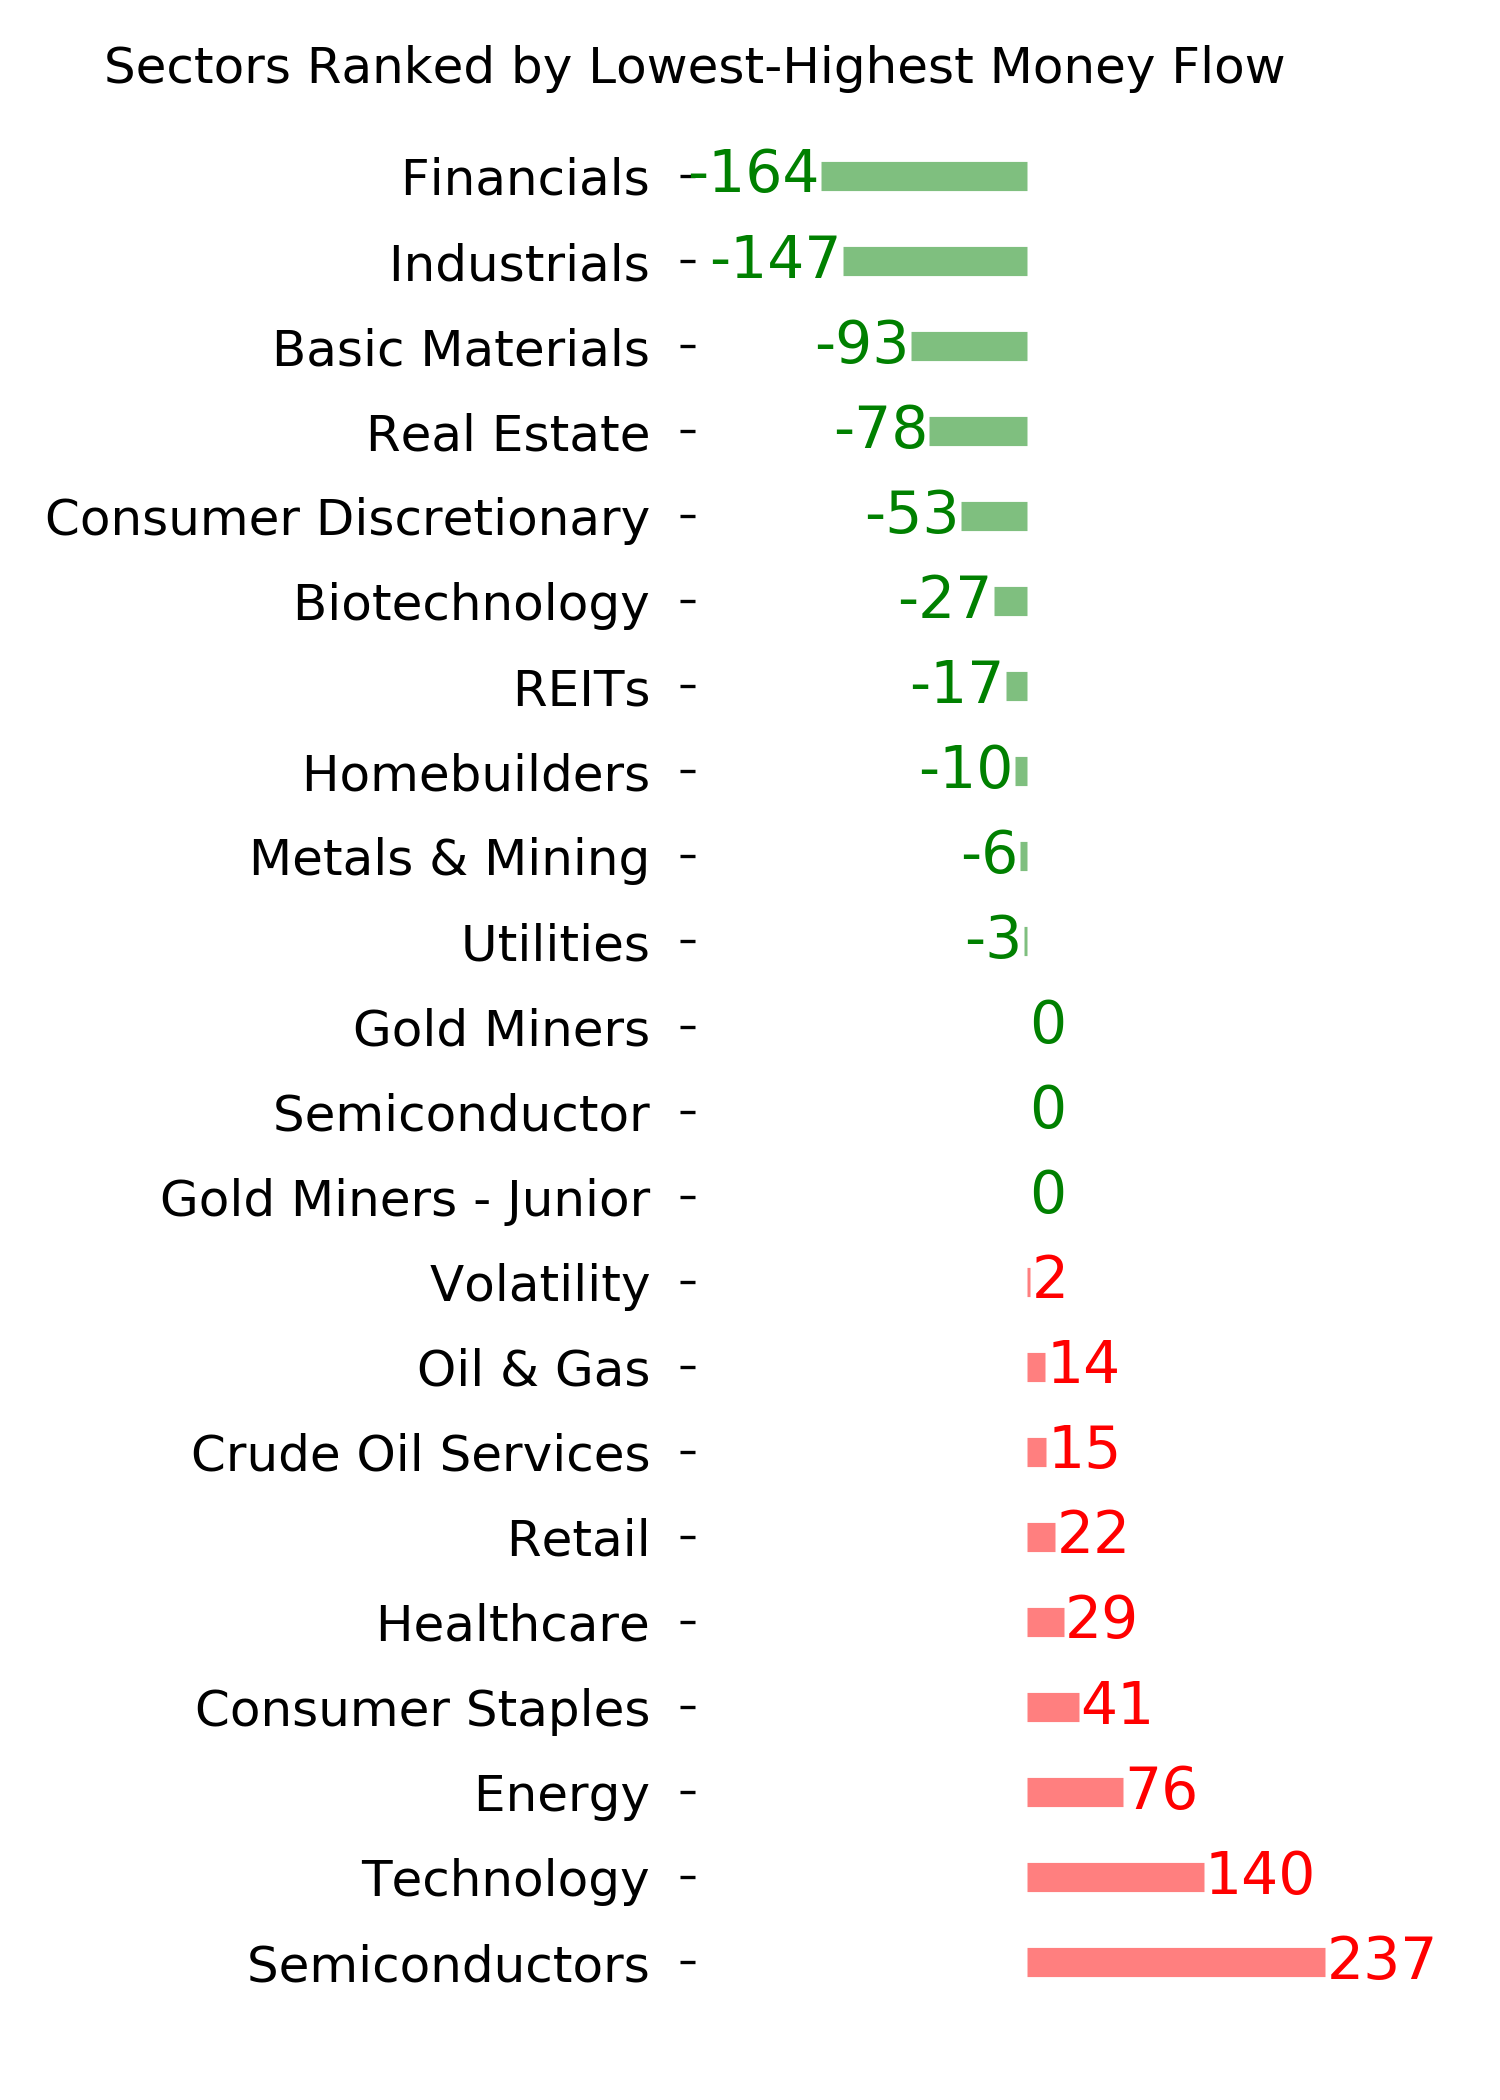
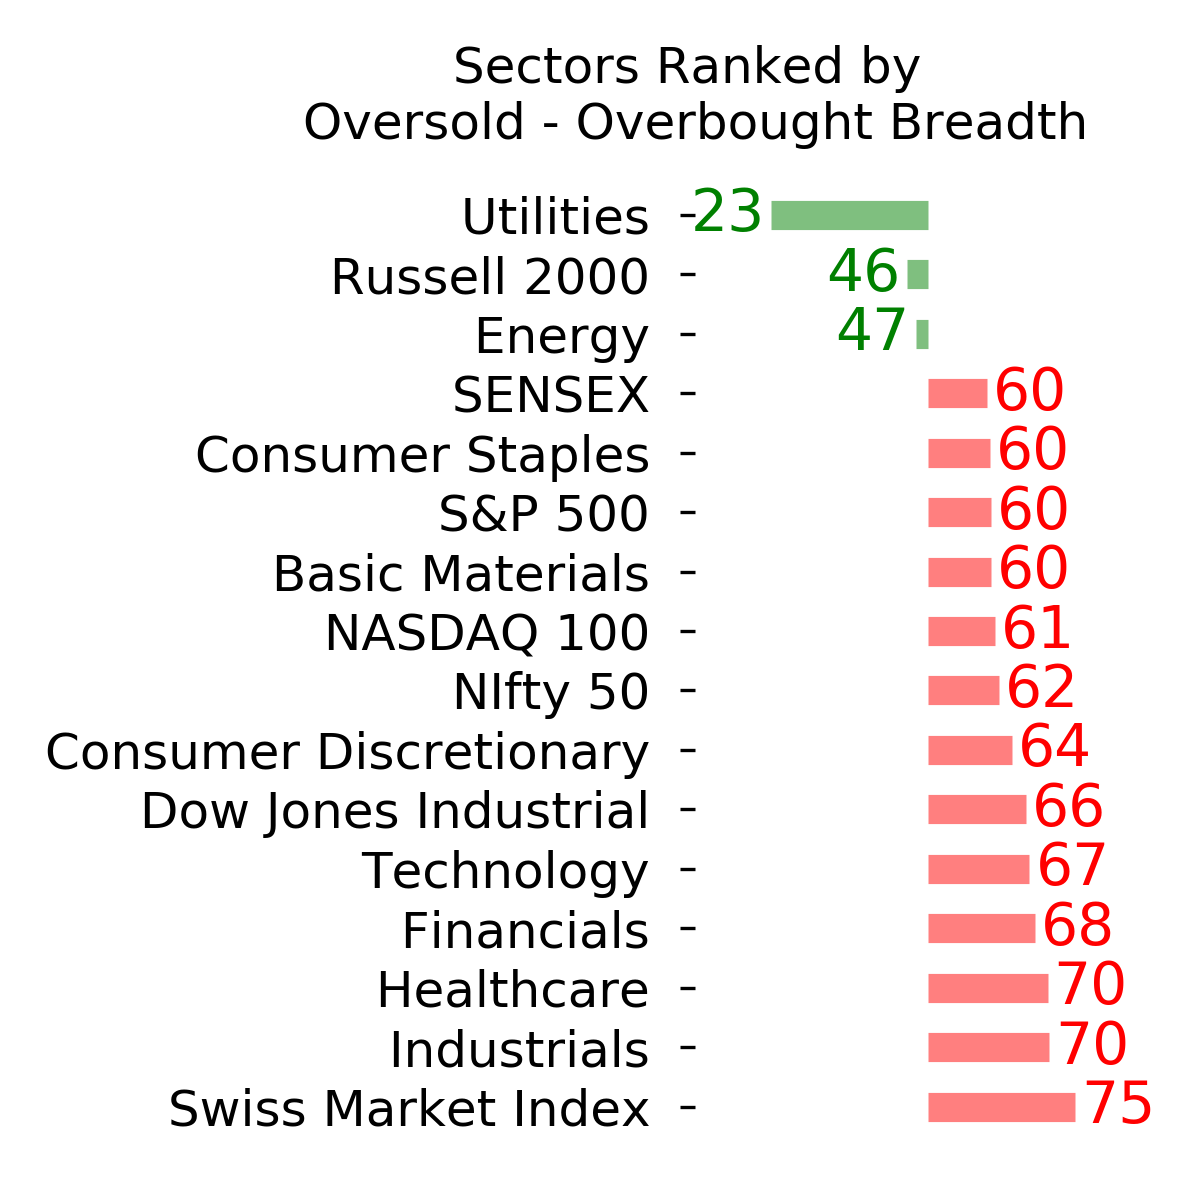
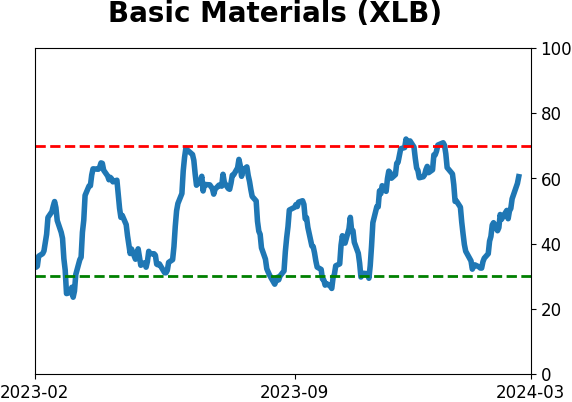
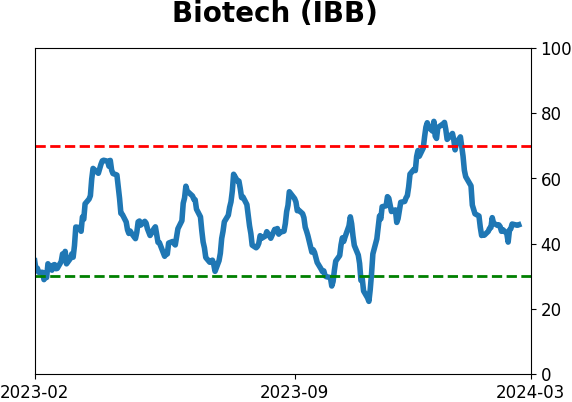
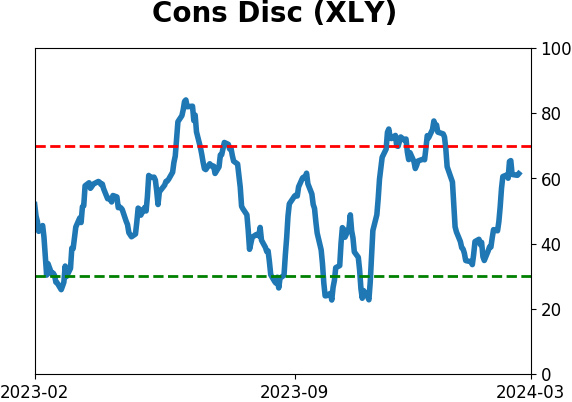
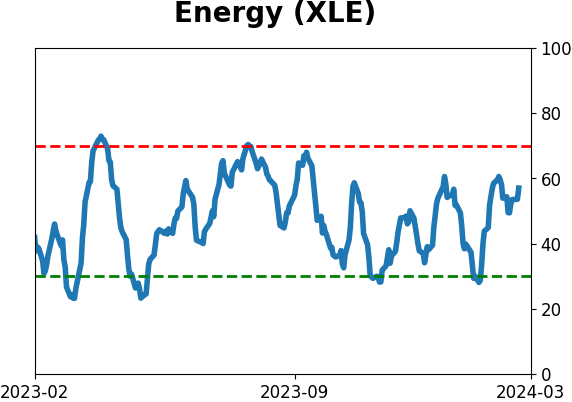
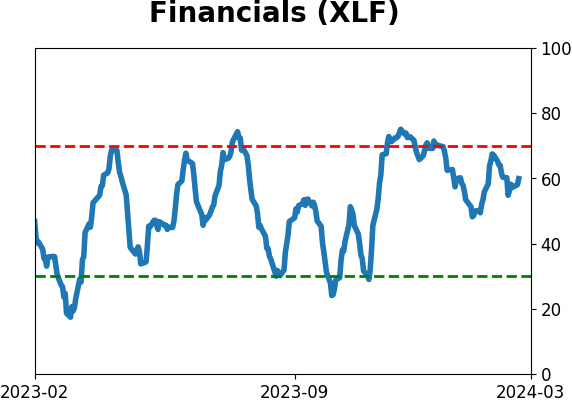
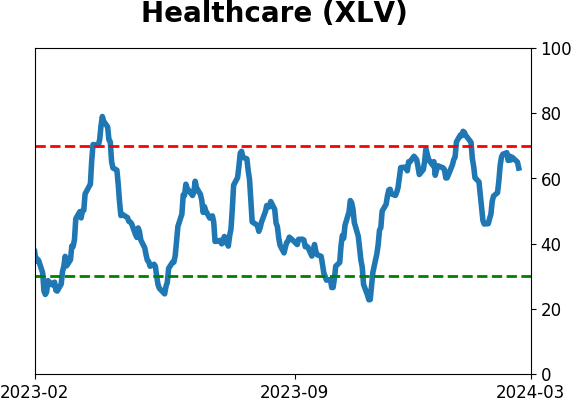
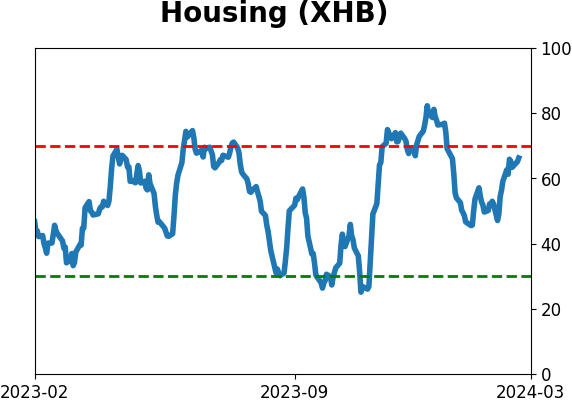
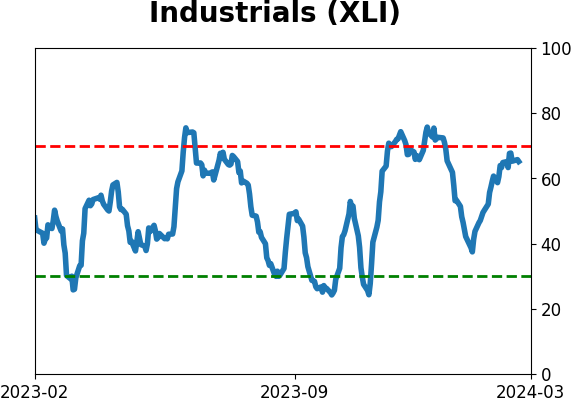
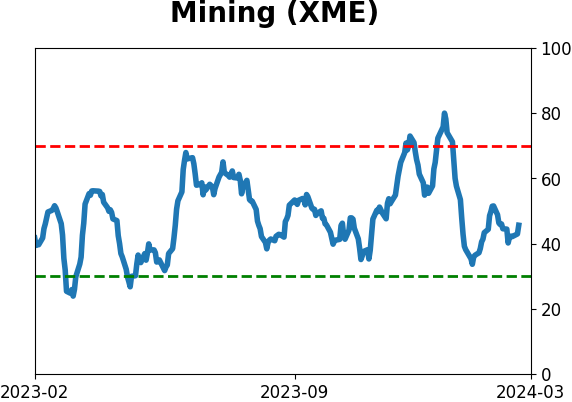
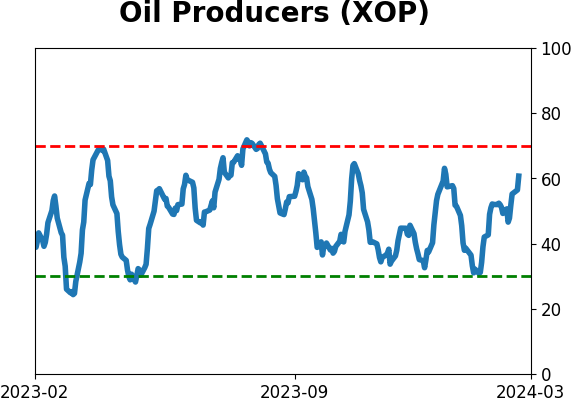
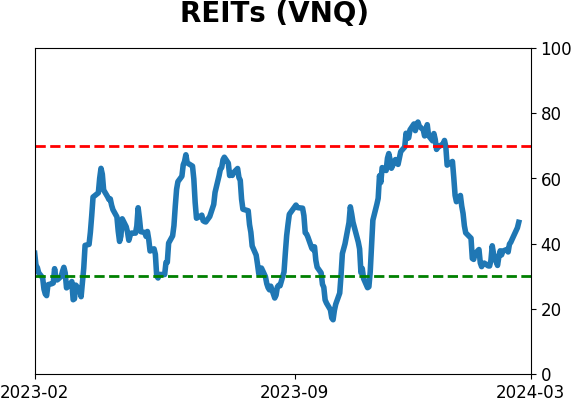
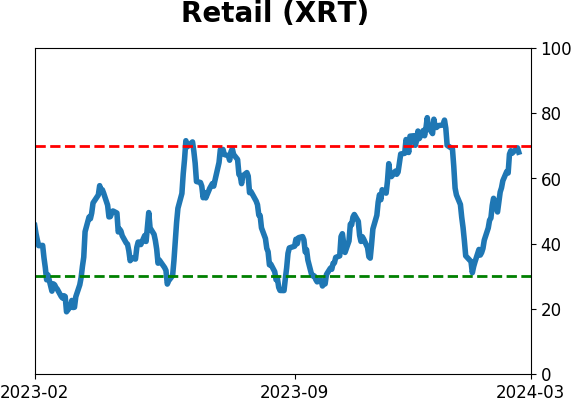
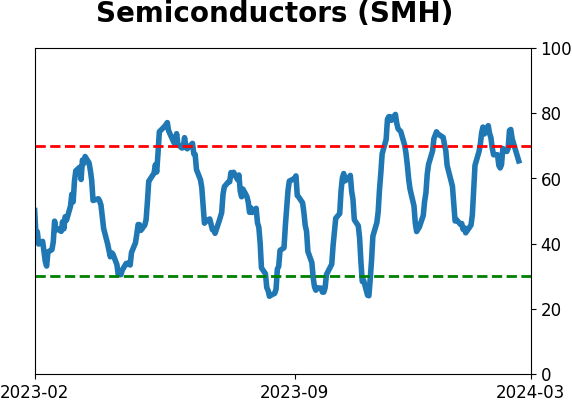
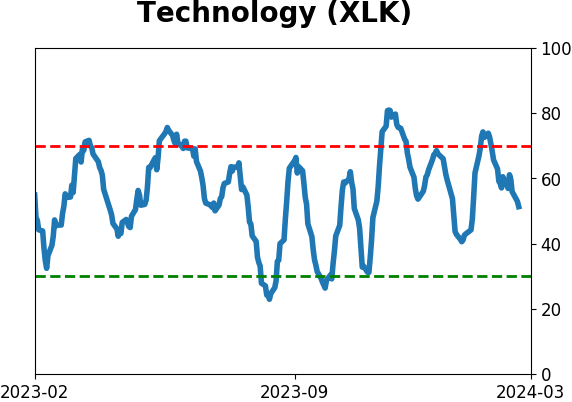
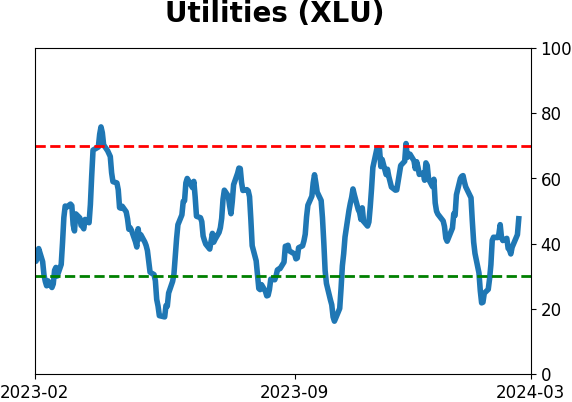
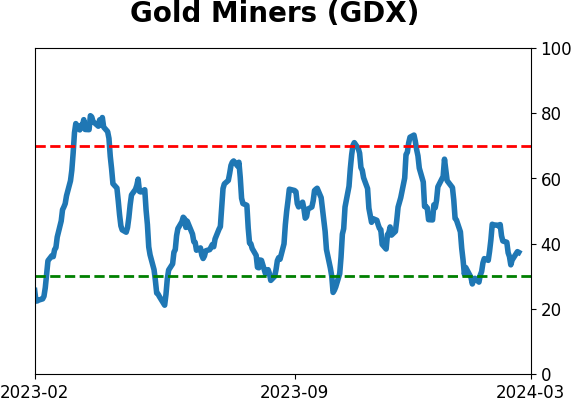
Sector ETF's - 10-Day Moving Average
|
|
|
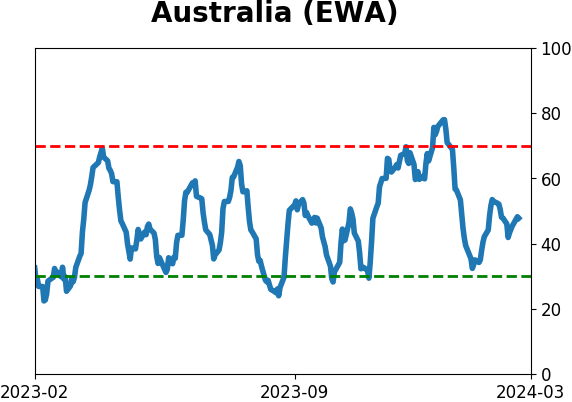
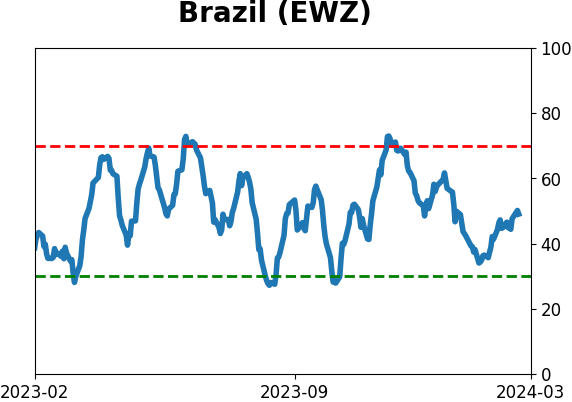
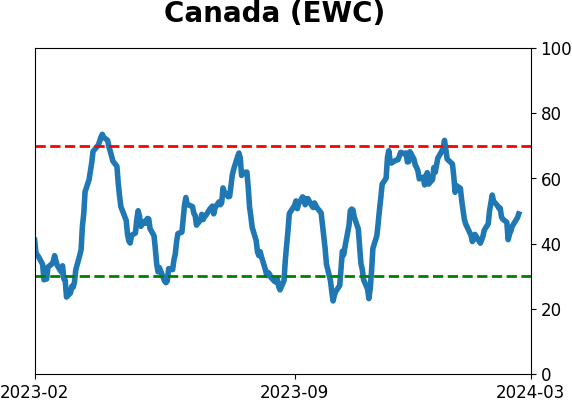
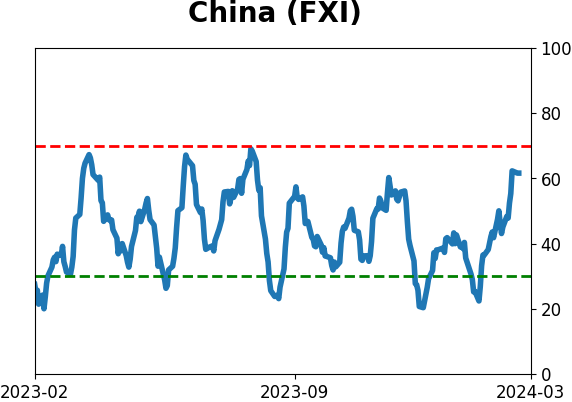
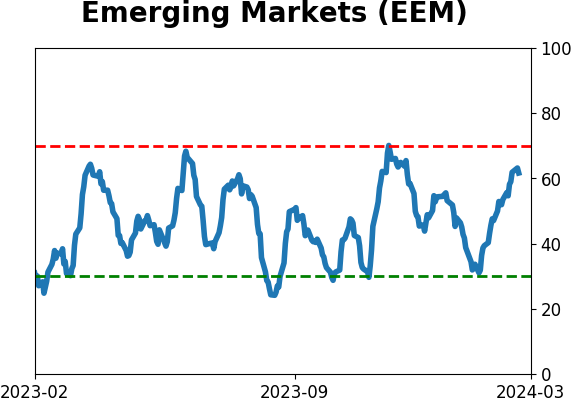
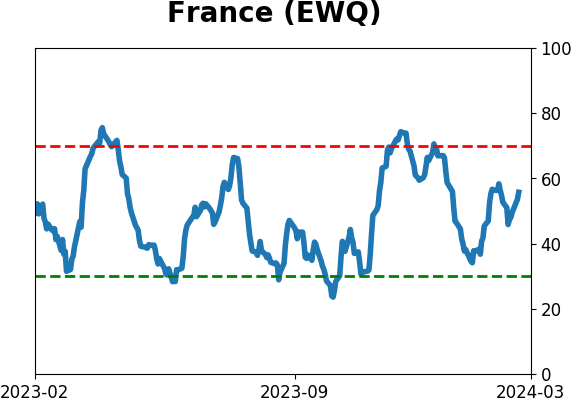
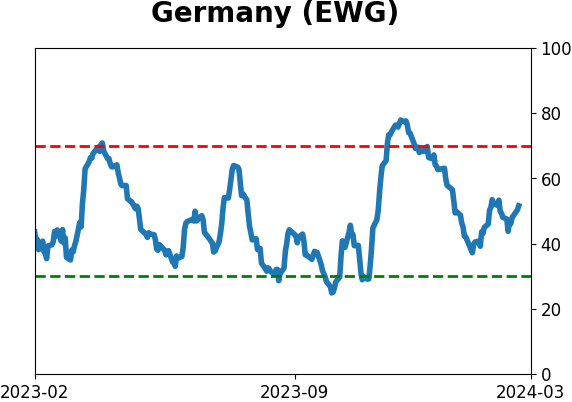
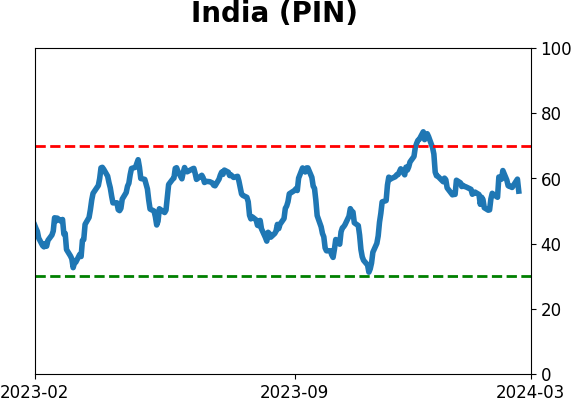
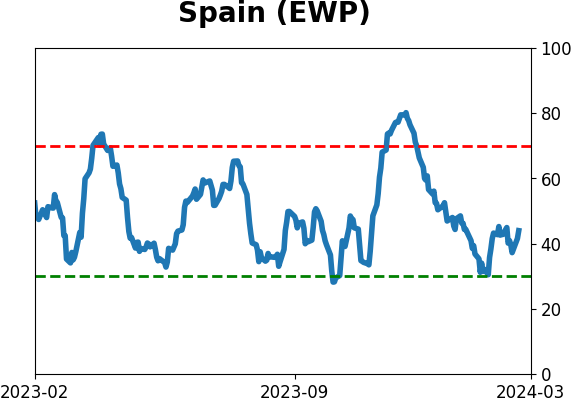
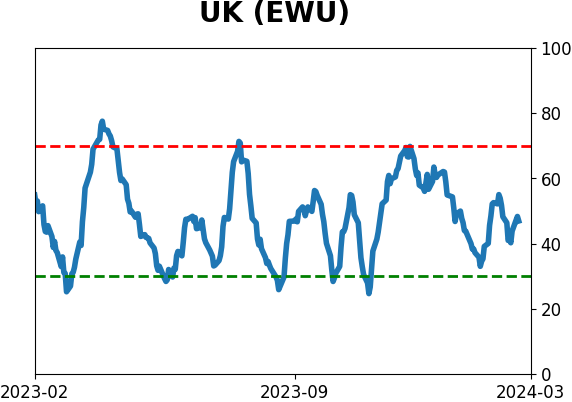
Country ETF's - 10-Day Moving Average
|
|
|
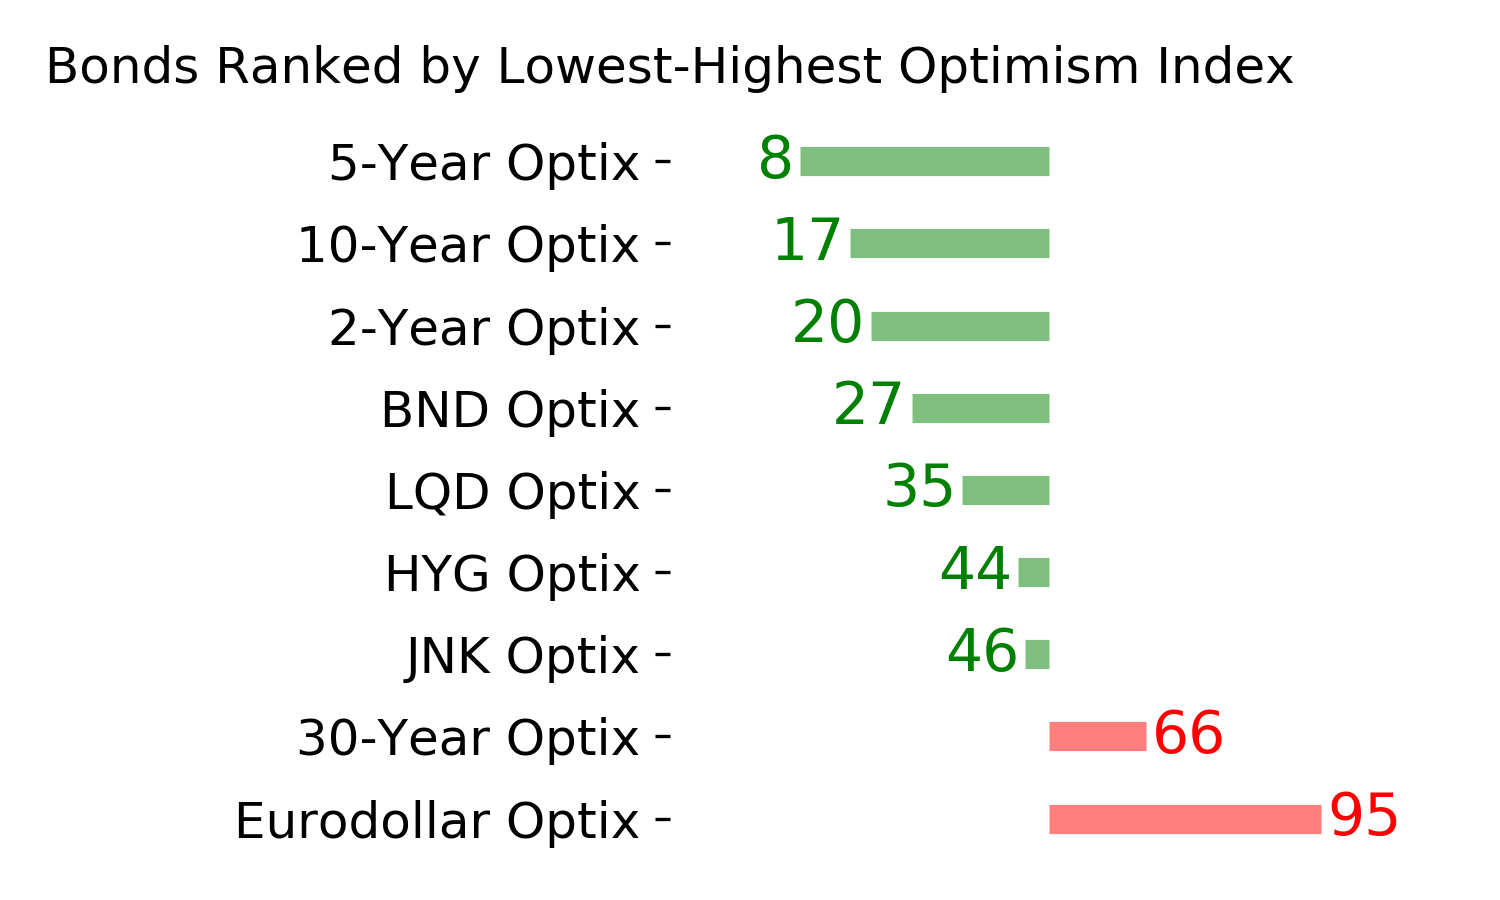
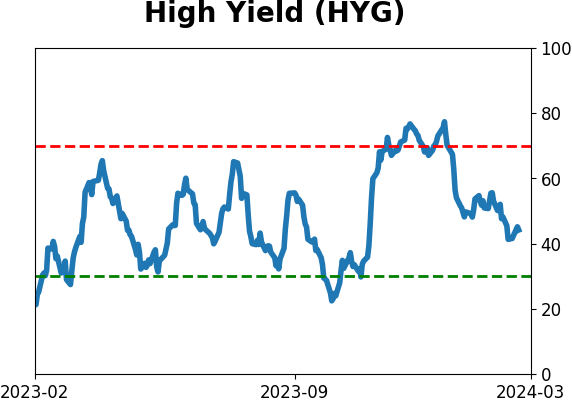
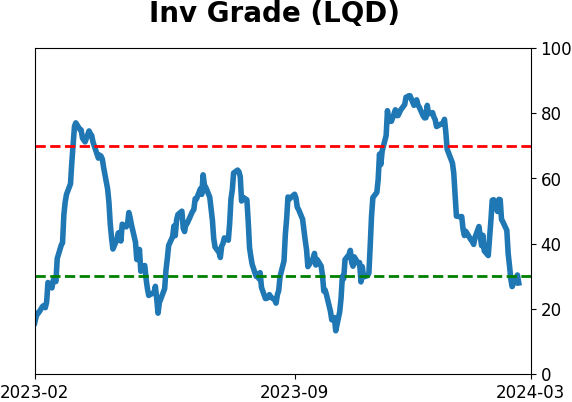
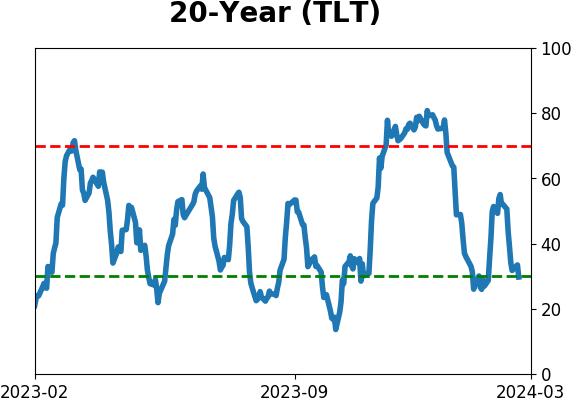
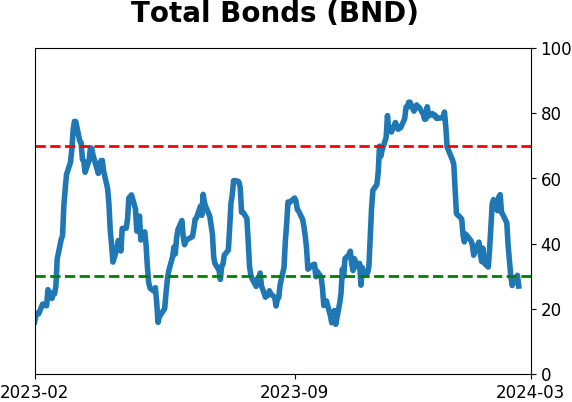
Bond ETF's - 10-Day Moving Average
|
|
|
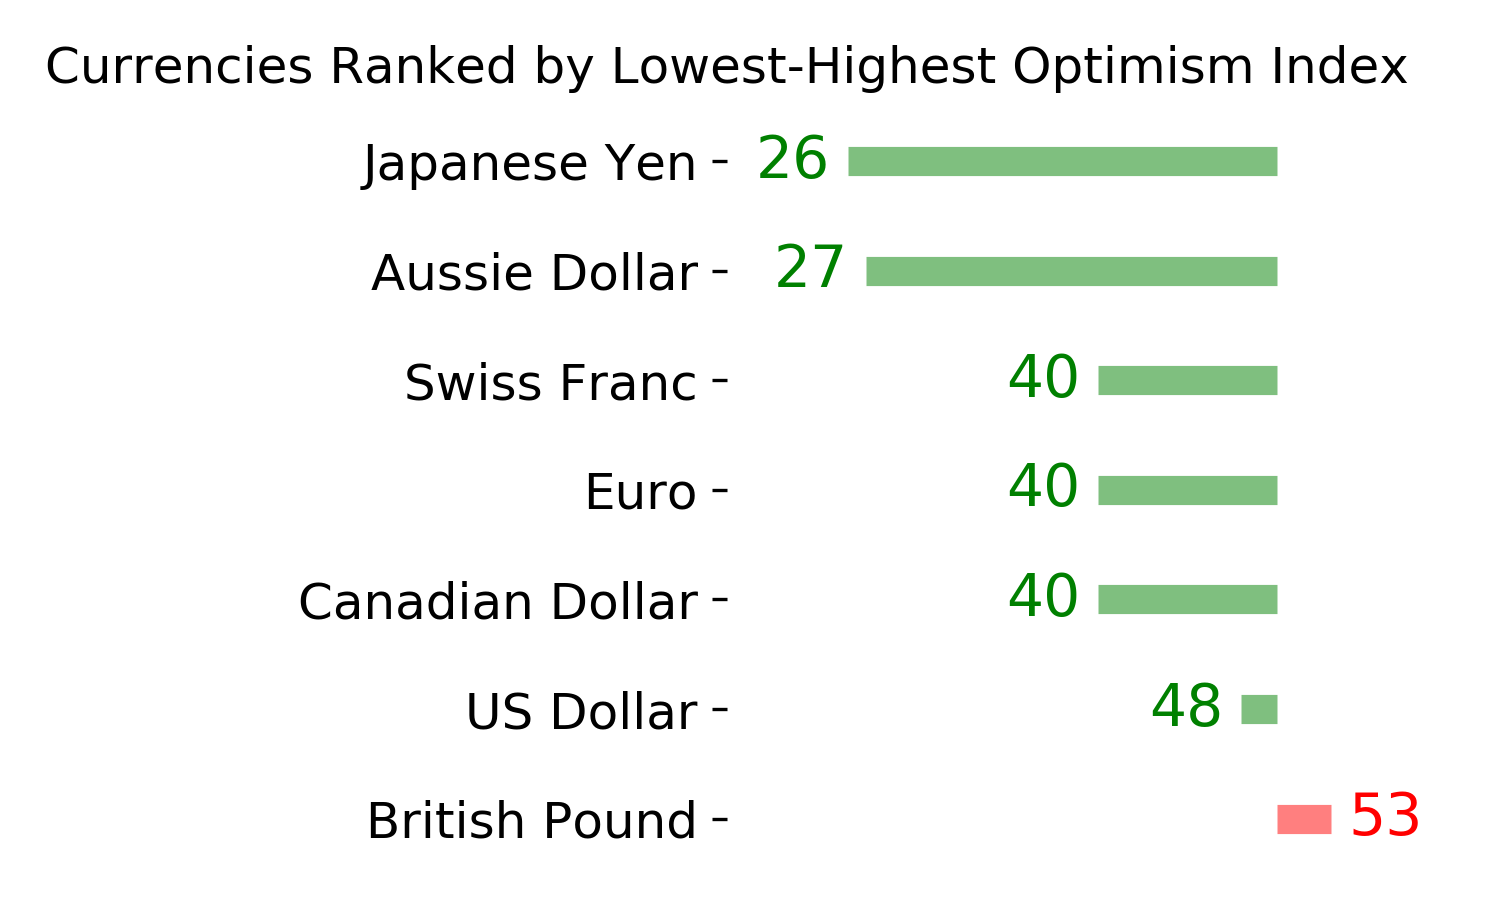
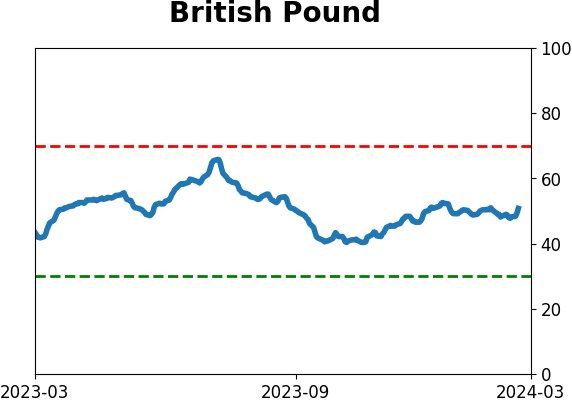
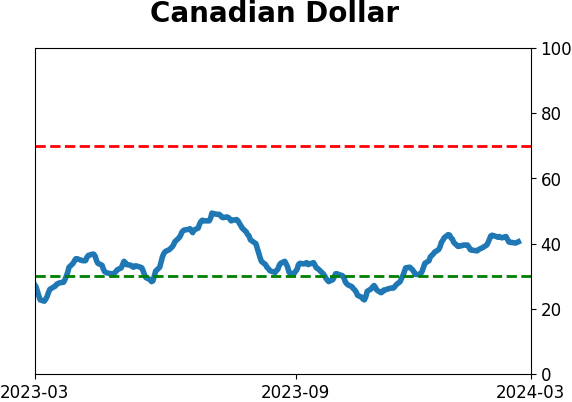
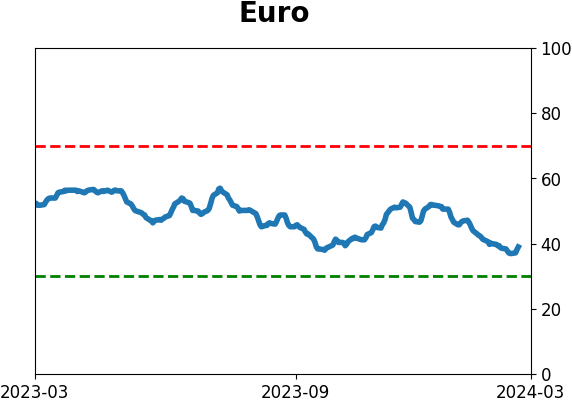
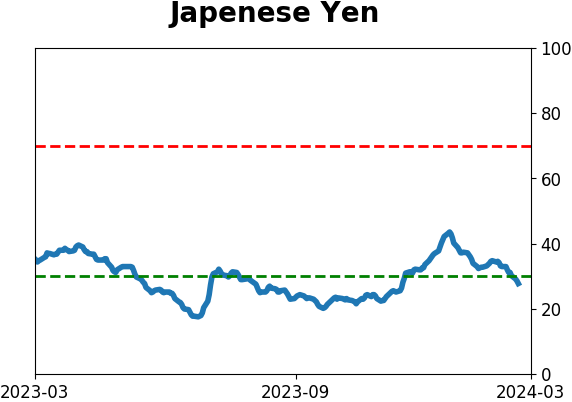
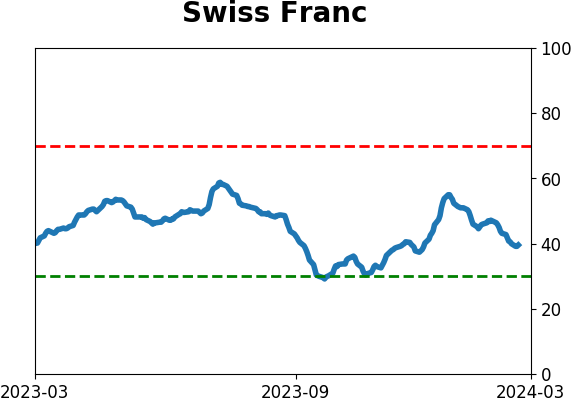
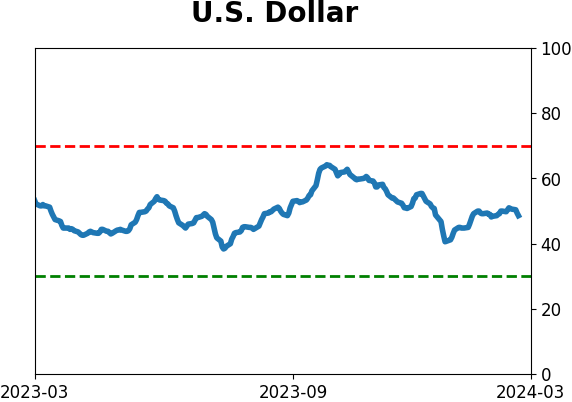
Currency ETF's - 5-Day Moving Average
|
|
|
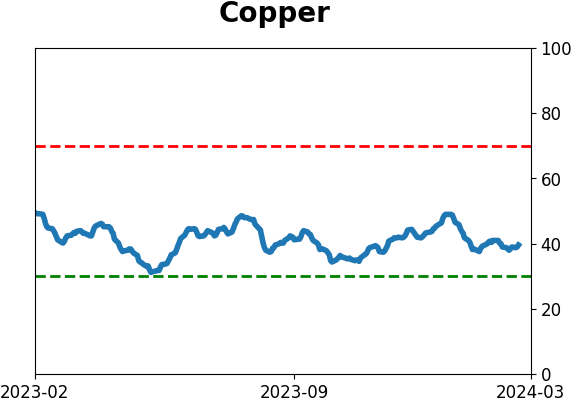
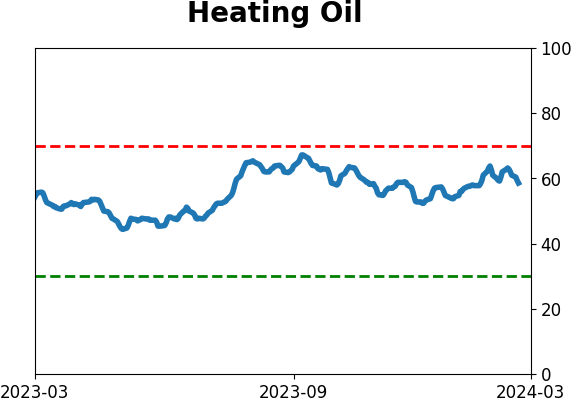
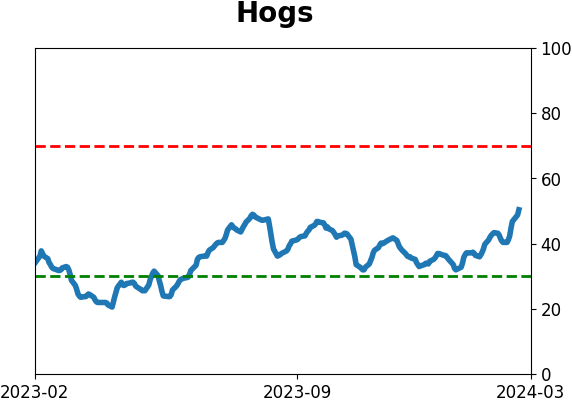
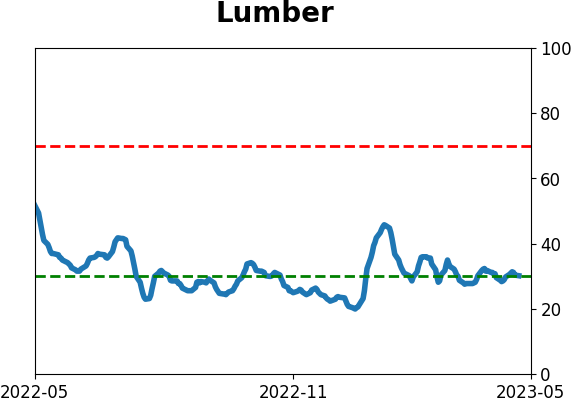
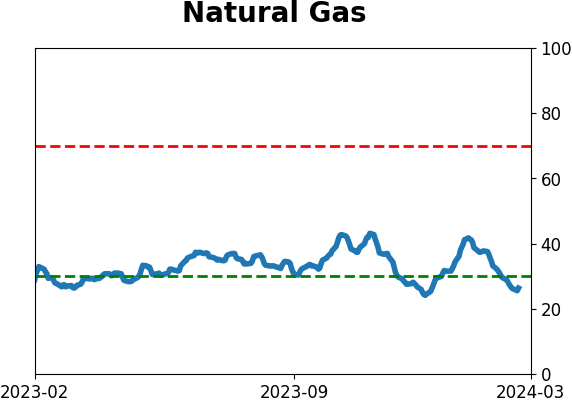
Commodity ETF's - 5-Day Moving Average
|
|