Headlines
|
|
Relative breadth thrusts show eager buyers:
In the four months since the S&P 500 bottomed, there has been a historic number of days with overwhelming buying interest. Even when netting out the number of days with overwhelming selling interest, the overall effect is impressive and has preceded mostly positive returns.
|
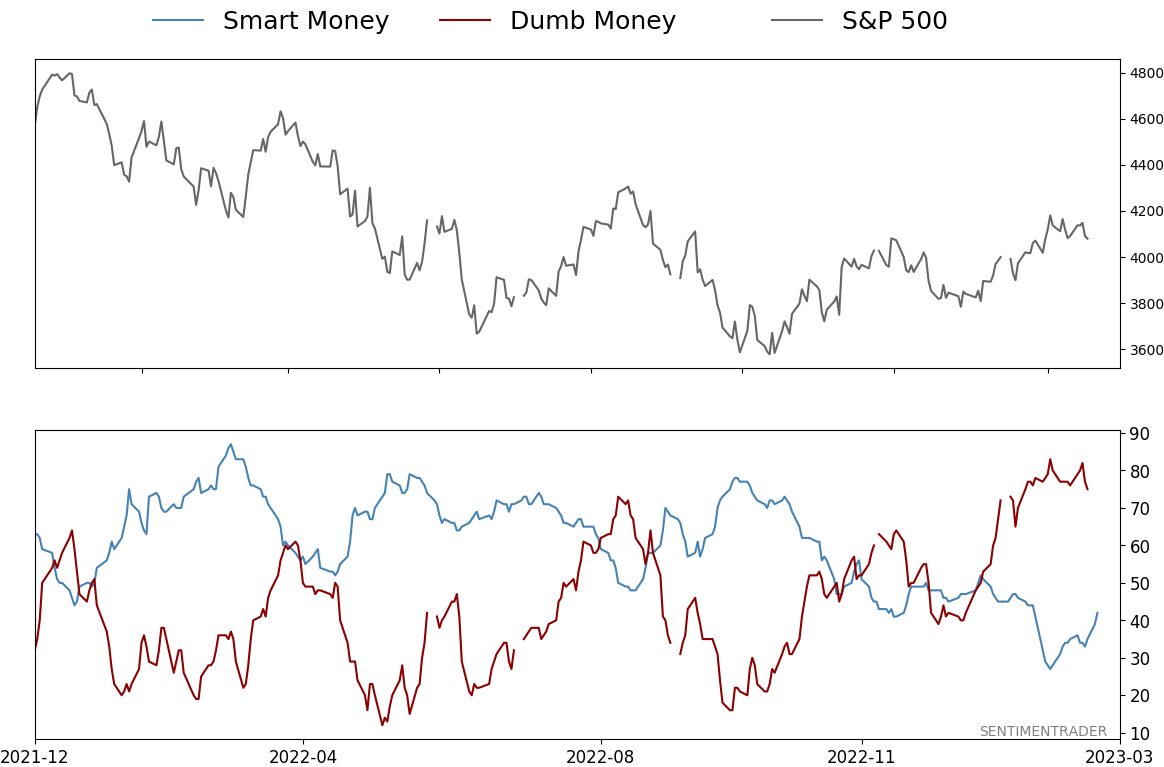
Smart / Dumb Money Confidence
|
Smart Money Confidence: 42%
Dumb Money Confidence: 75%
|
|
Risk Levels
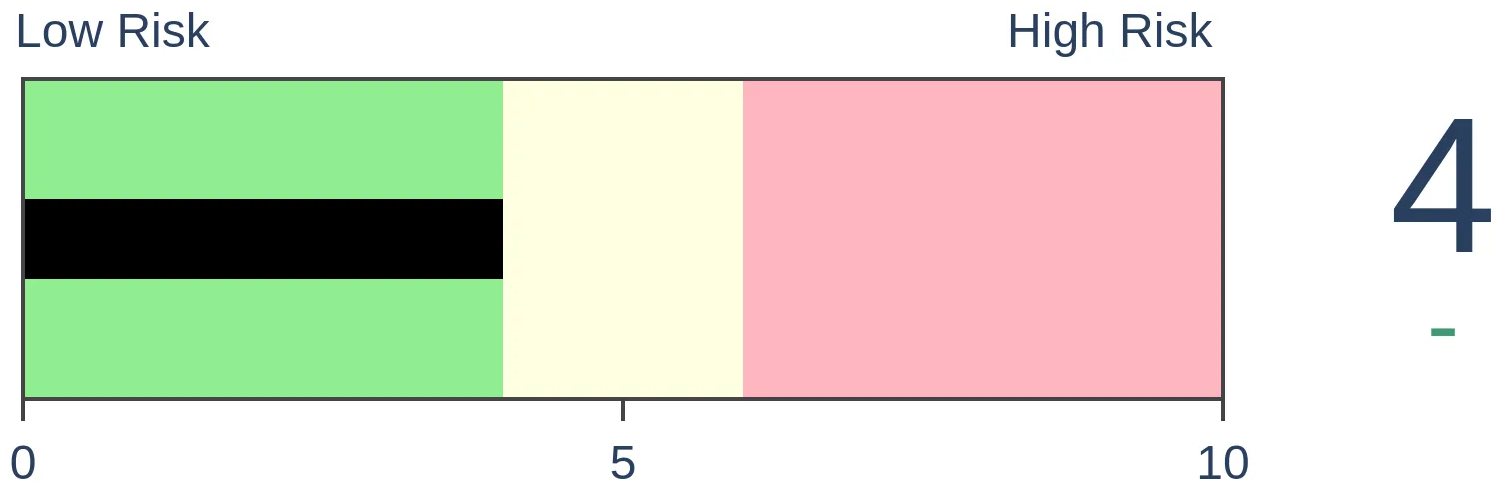
Stocks Short-Term
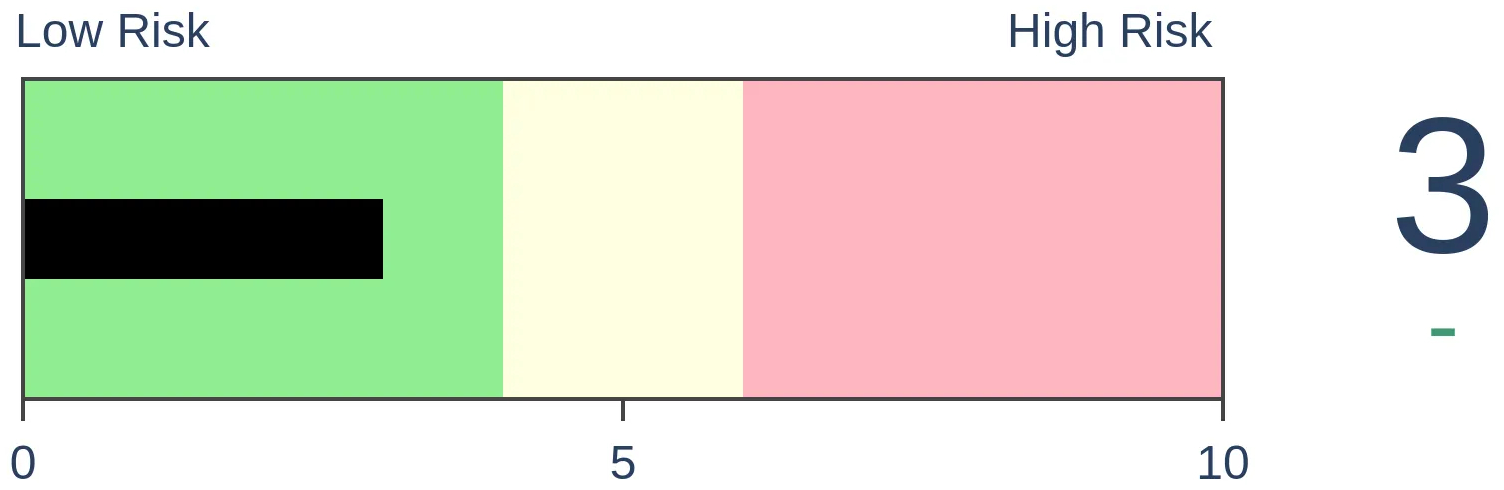
|
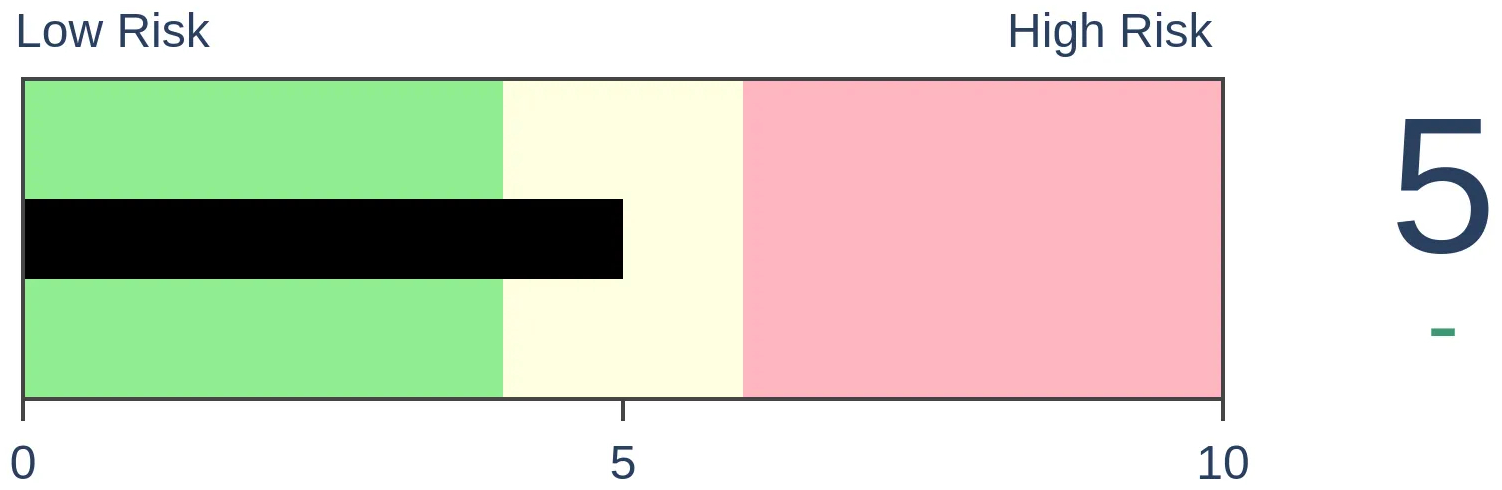
Stocks Medium-Term
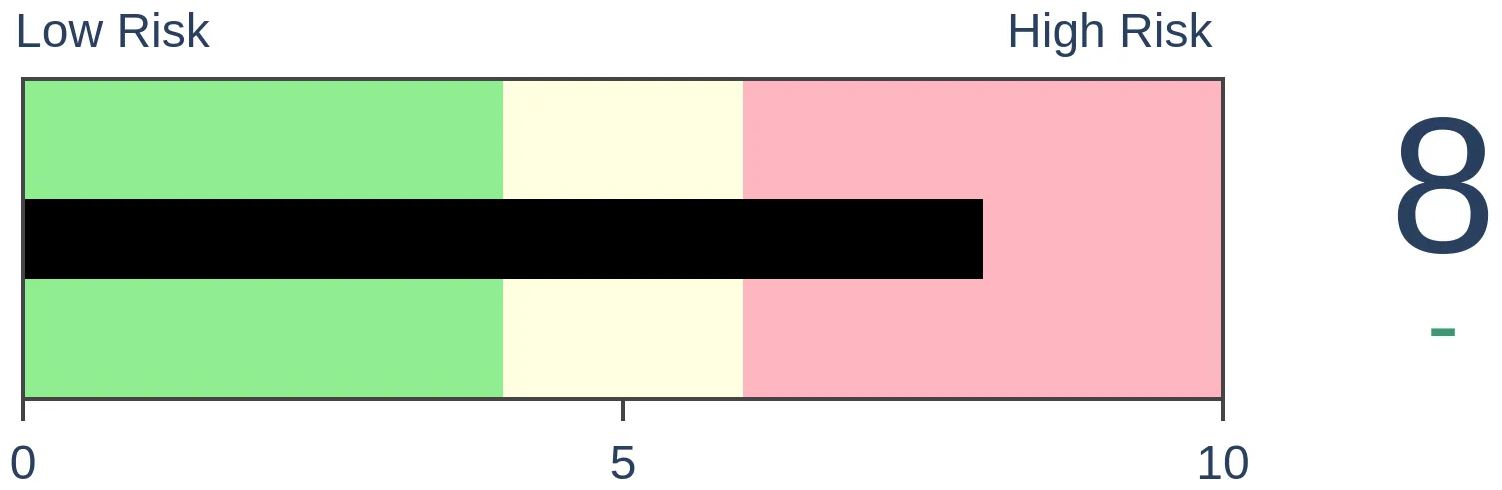
|
|
Bonds
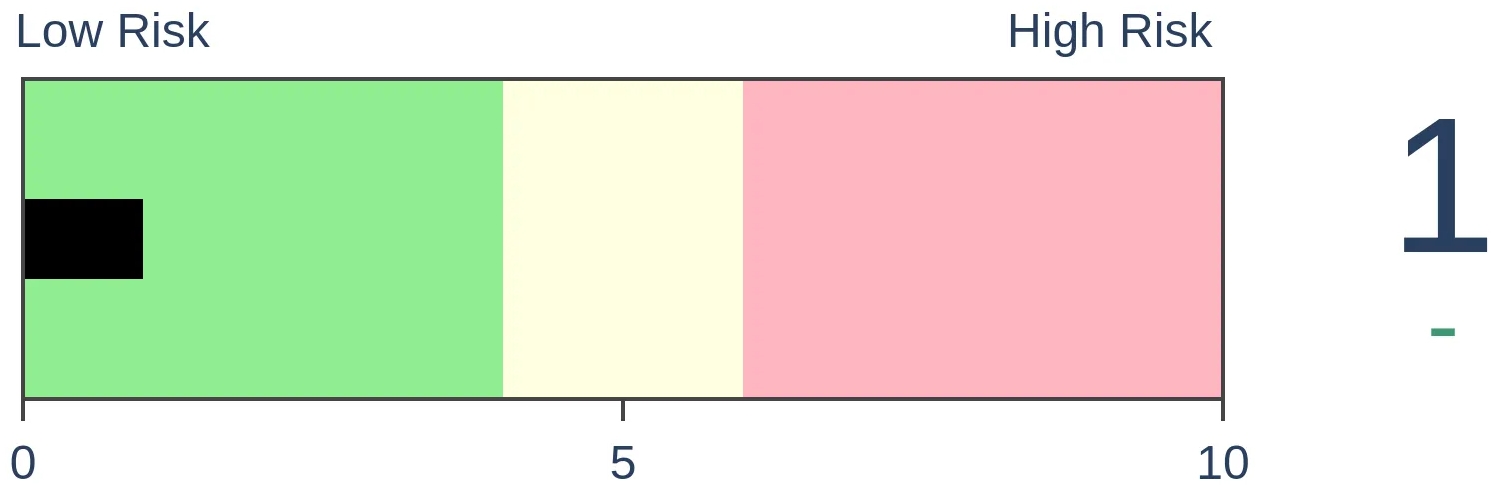
|
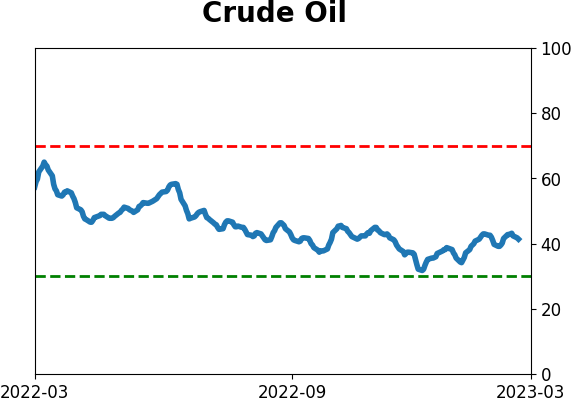
Crude Oil
|
|
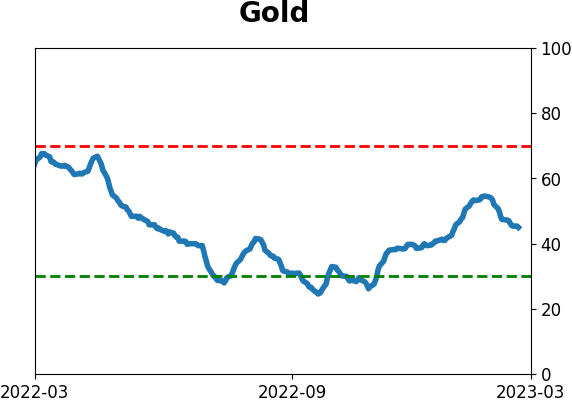
Gold
|
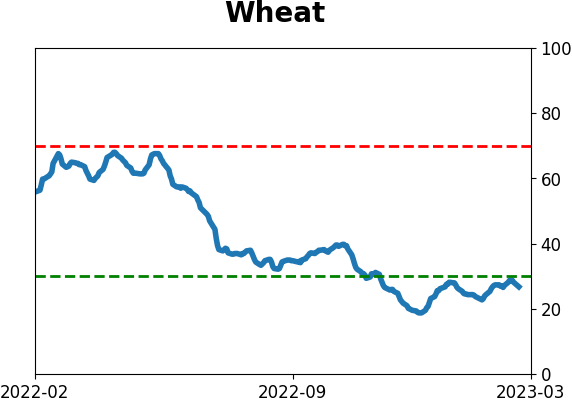
Agriculture

|
|
Research
By Jason Goepfert
BOTTOM LINE
In the four months since the S&P 500 bottomed, there has been a historic number of days with overwhelming buying interest. Even when netting out the number of days with overwhelming selling interest, the overall effect is impressive and has preceded mostly positive returns.
FORECAST / TIMEFRAME
None
|
Key points:
- Over the past 20 years, internal breadth metrics have become more volatile
- That reduces their efficacy in comparing current markets to historical ones, especially in terms of thrusts
- The past four months have seen an impressive rebound in buying interest, even accounting for volatility
Breadth is more volatile, but thrusts remain compelling
Whenever we look at something like breadth thrusts or evidence of overwhelming pressure either way, like last week, we get the usual poo-poos about their efficacy given high-frequency trading, zero-dated options, or a handful of other excuses.
For over 20 years, we've acknowledged that breadth statistics are fluid and influenced by various factors. The most significant factor is the one that few discuss anymore - the impact of decimalization when stocks ceased trading in fractions. It became easier for a security to rise or decline instead of being considered unchanged on the day.
The chart below shows the daily Up Issues Ratio (Up Issues / (Up Issues + Down Issues)) for the S&P 500 since 1950, along with its rolling one-year standard deviation. The impact of decimalization seems clear, and it's really the only factor we've looked at that seems to have had a pronounced and lasting impact.
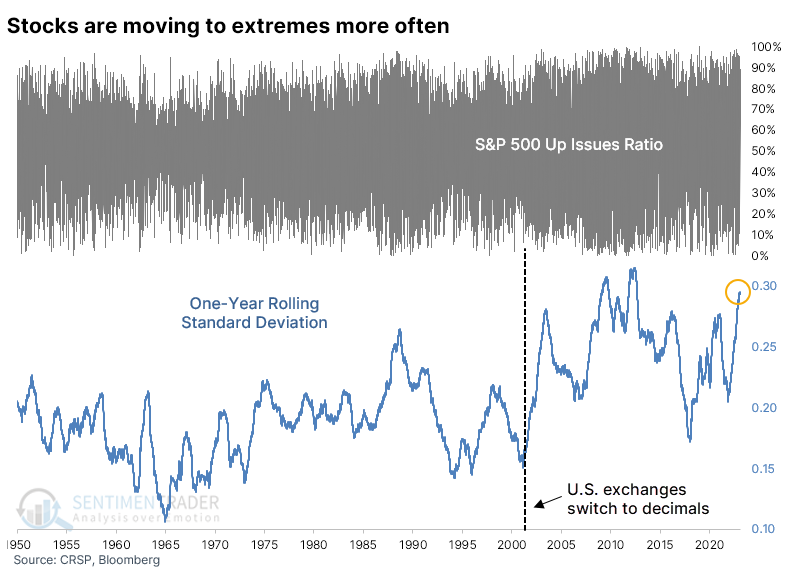
There are various ways to account for the rise in the volatility of breadth figures. One way is subtracting the number of overwhelming selling days from overwhelming buying days.
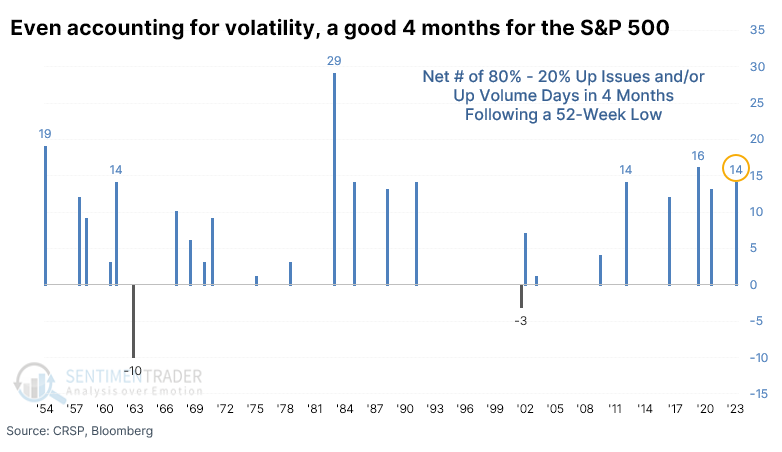
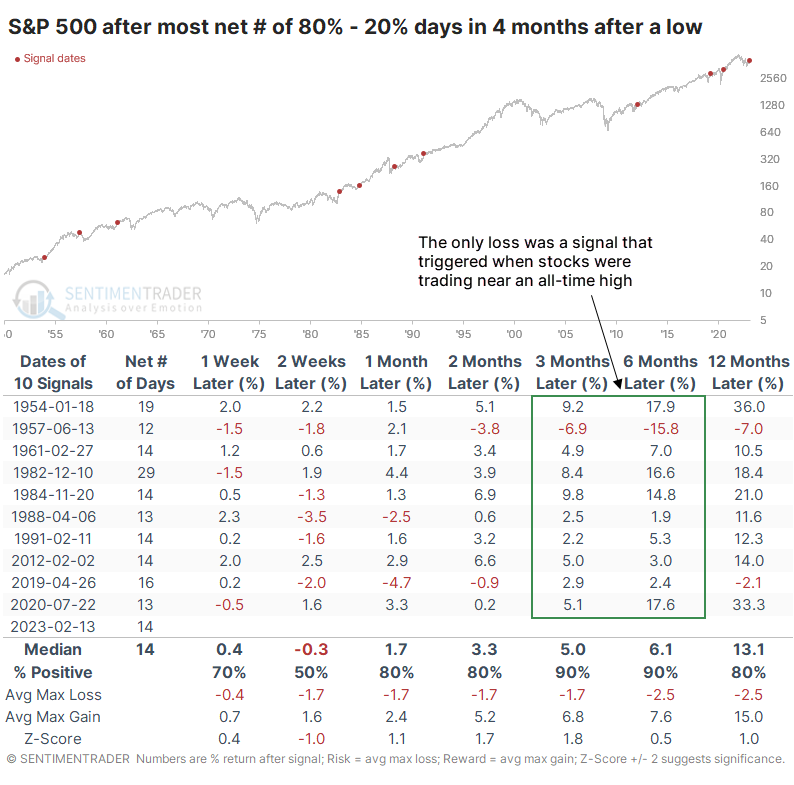
If we net out the number of 80% days (overwhelming buying pressure) minus 20% days (overwhelming selling pressure), the last four months since the S&P 500's bottom still rank among the best.
Periods of heavy net buying following a low tend to generate more buying
The table below is similar to the one we looked at last week. It shows the four-month periods following a 52-week low in the S&P 500 with the highest net number of heavy buying days.
While not as compelling as the study from last week, the S&P's returns were still very good, with only one meaningful loss within the following year. That was in 1957 when the S&P was trading near an all-time high; not the case now.
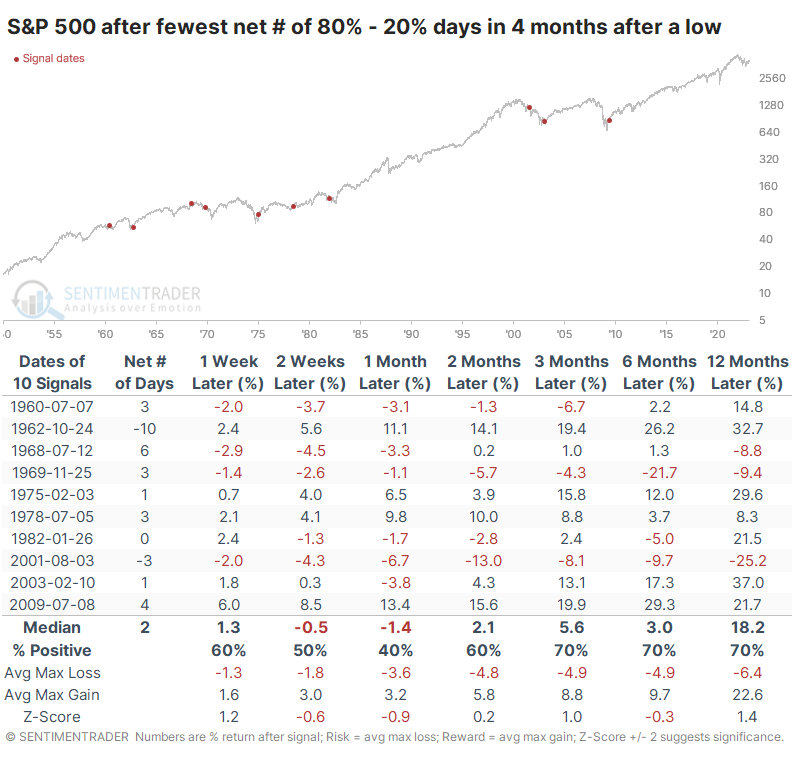
Let's look at the opposite scenarios, those four-month periods following a bottom with the fewest net number of overwhelming buying days. Again, this isn't as drastic as what we saw last week, but it still showed worse consistency and more risk than bottoms with many days of buying interest.
What the research tells us...
The increased volatility in breadth statistics over the past 20 years makes comparing situations like thrusts with prior decades a bit more challenging. Using comparative ratios helps to even the playing field. On the surface, the tremendous surge in days with overwhelming buying interest has been an excellent sign for future returns. Adding the additional hurdle of netting out the bad days, the past four months still rank among the best four-month stretches following a bottom since 1950. While the bullish implications dim somewhat, they remain bright.
Indicators at Extremes
Phase Table
Ranks
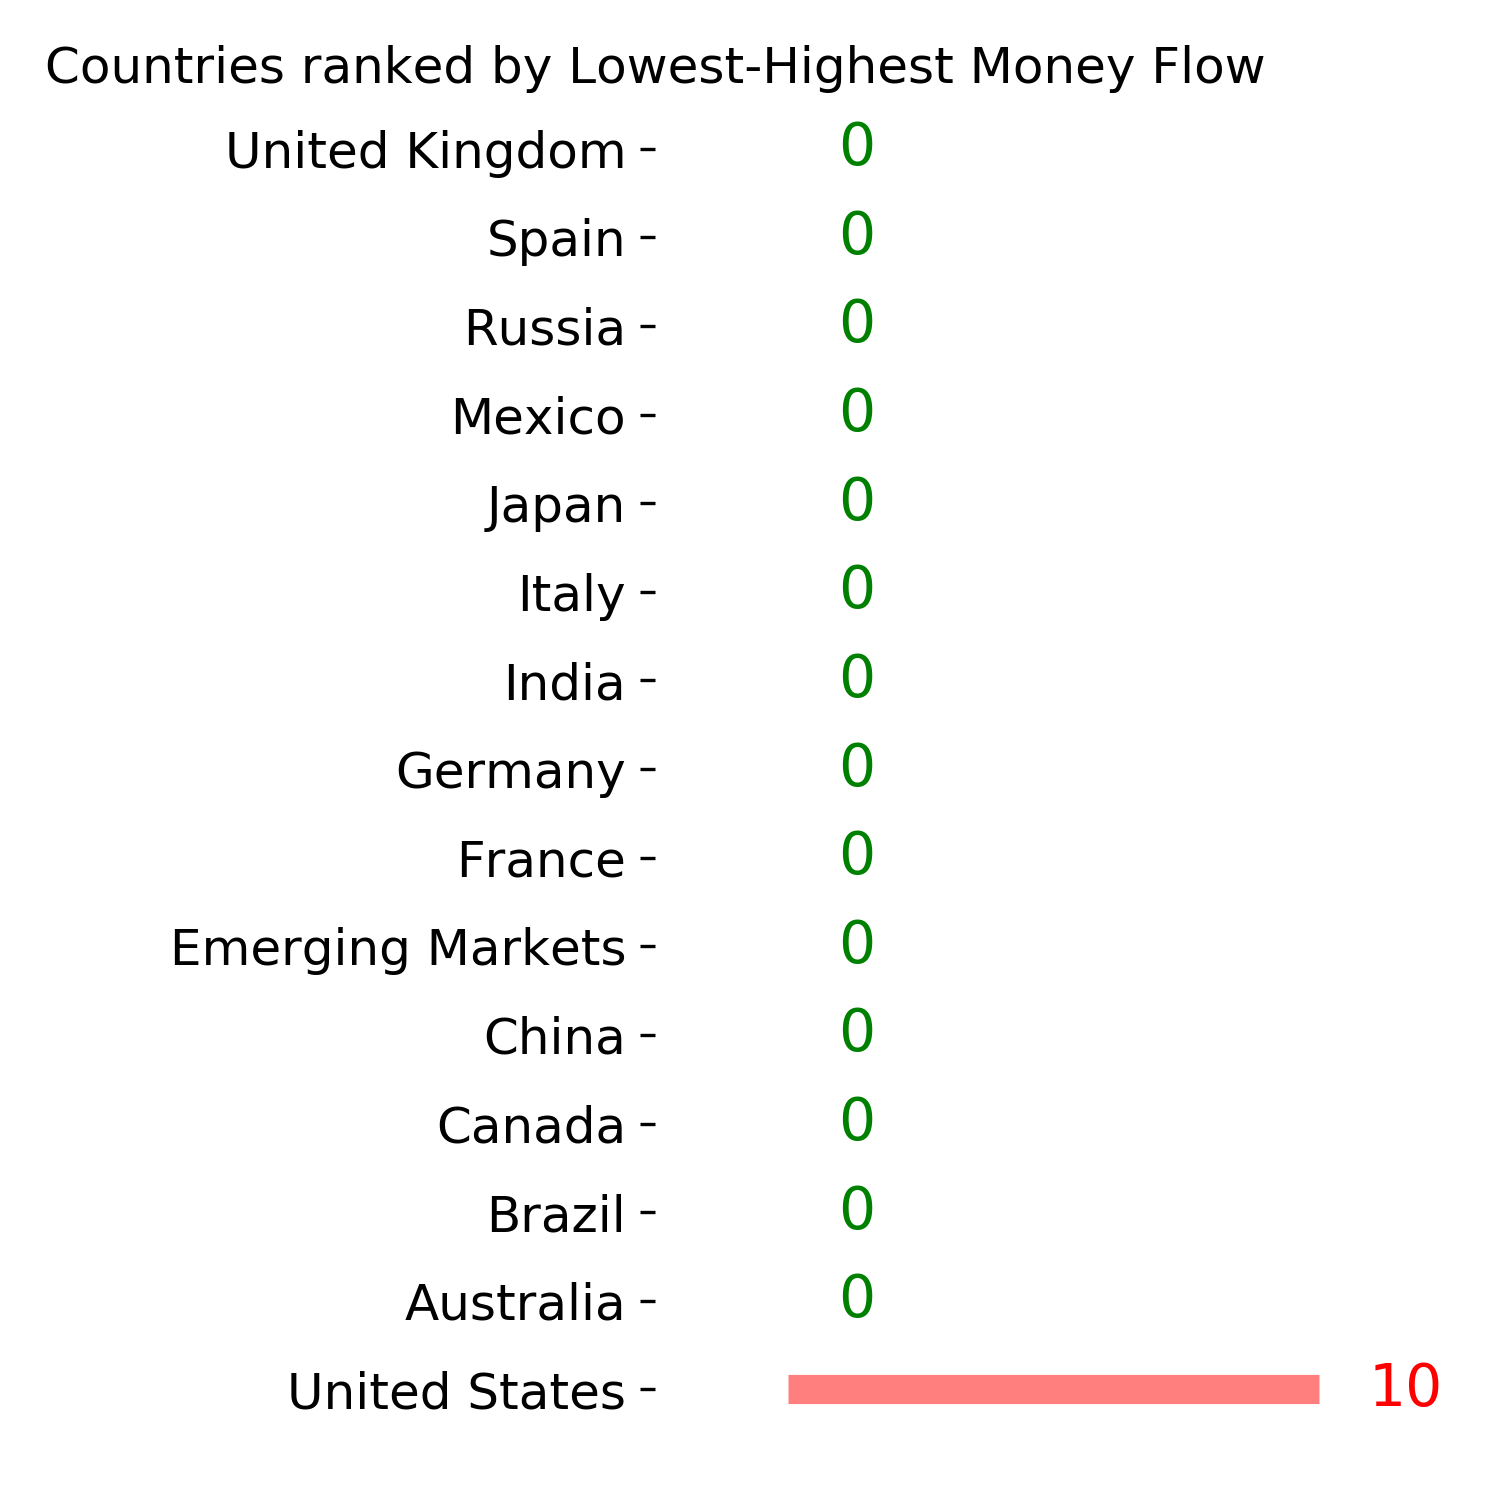
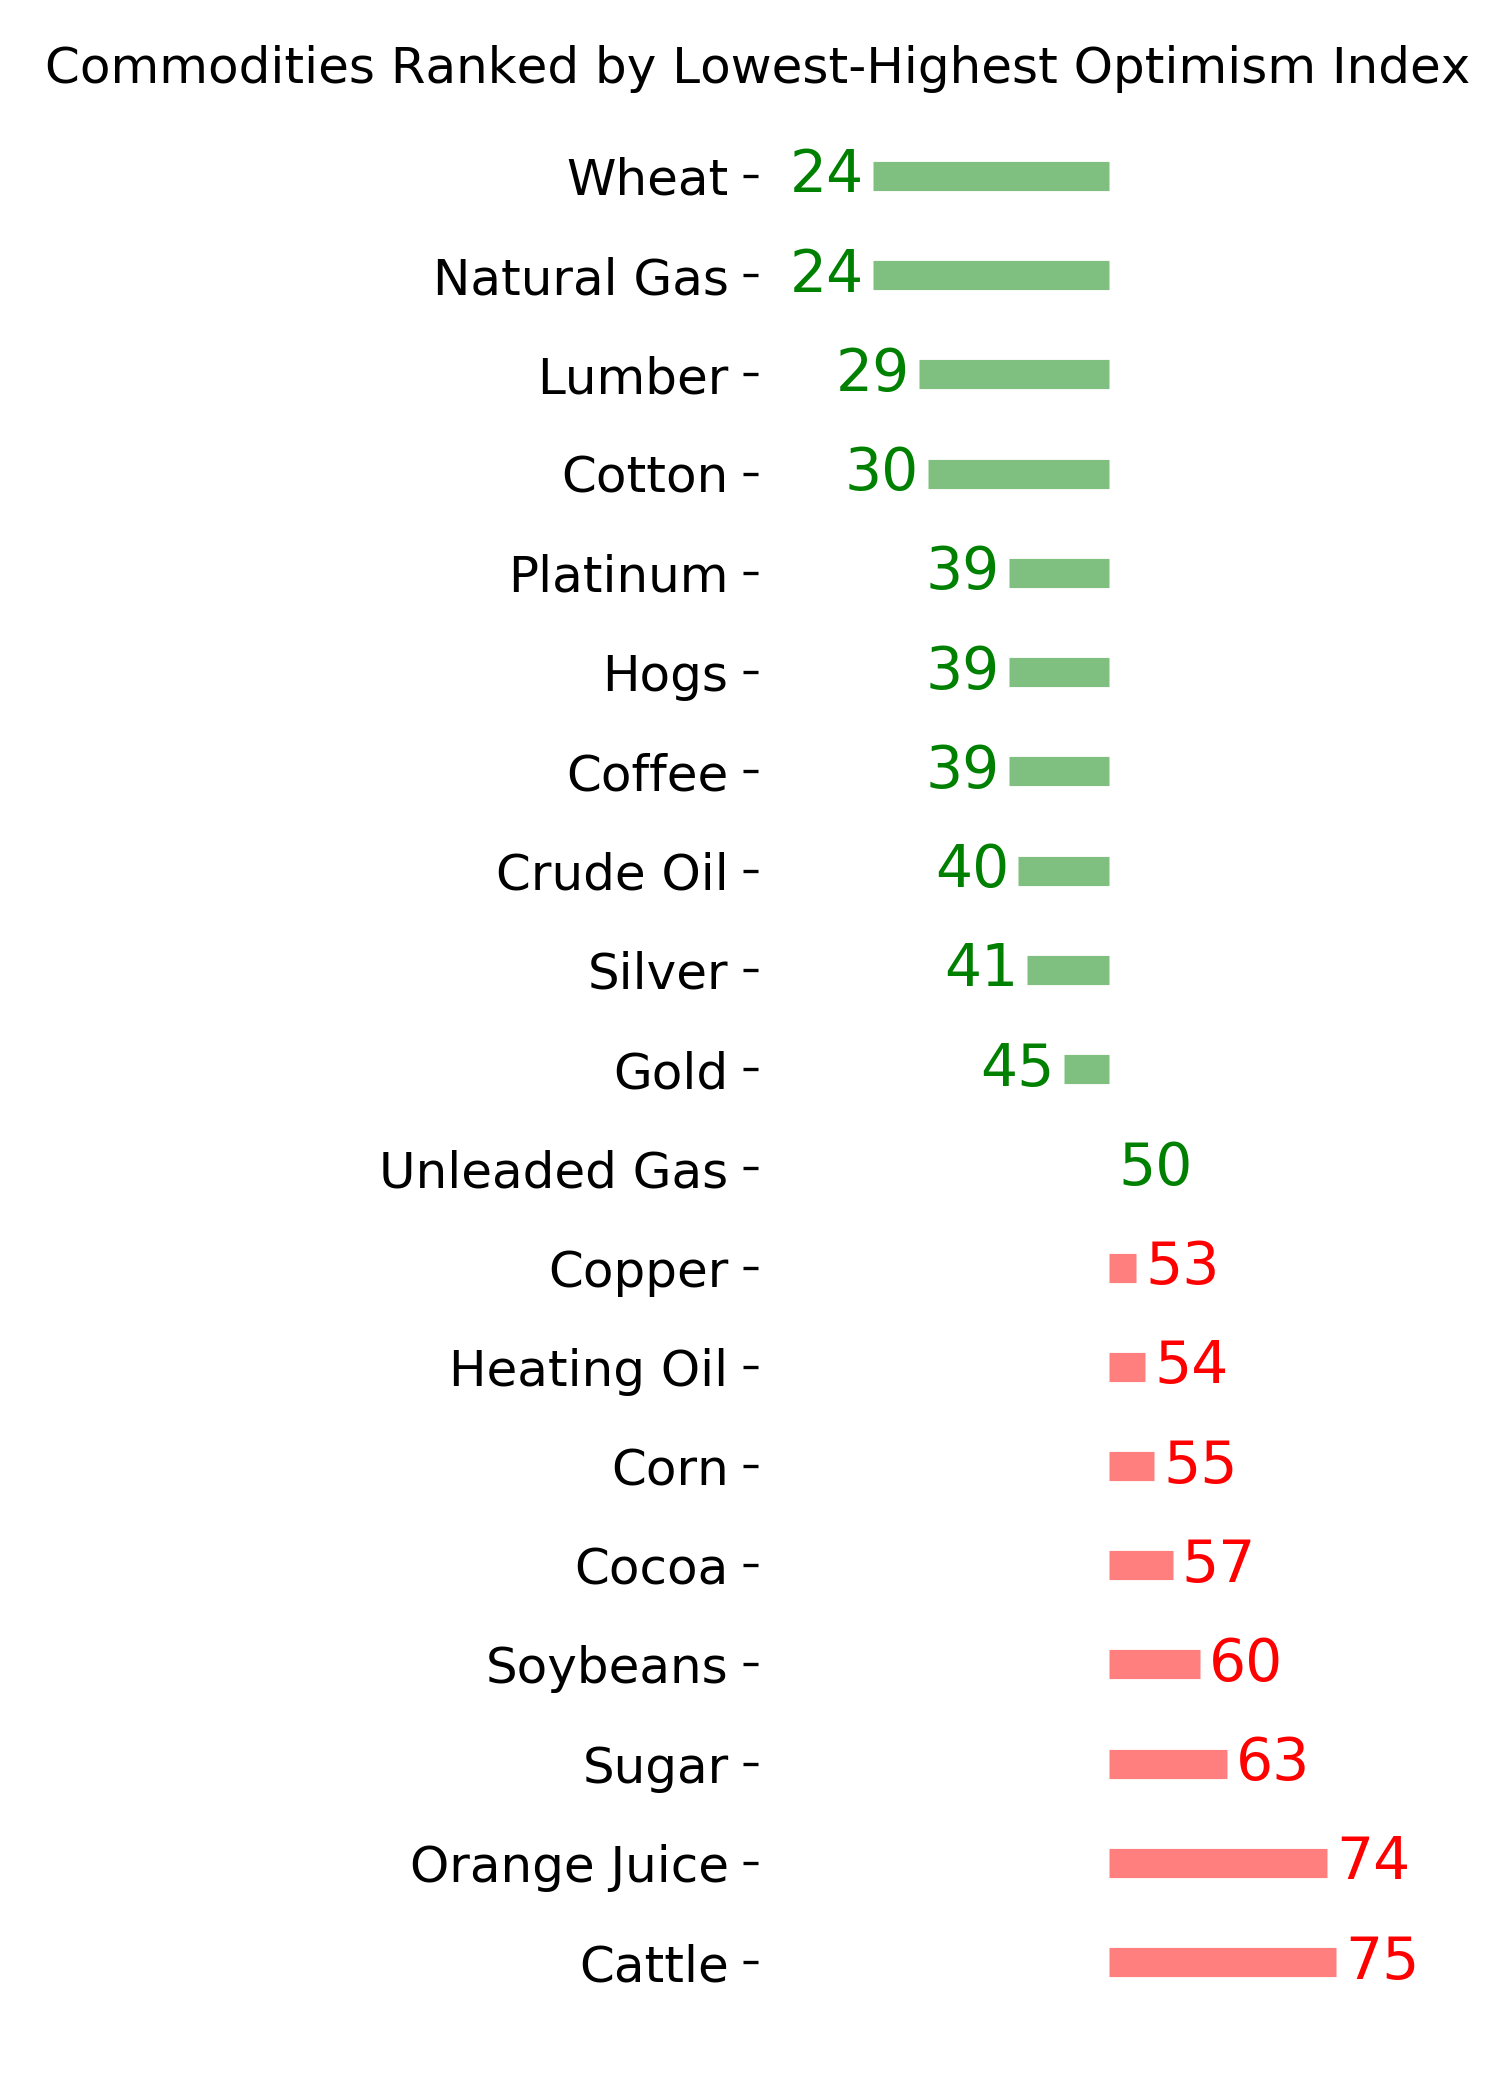
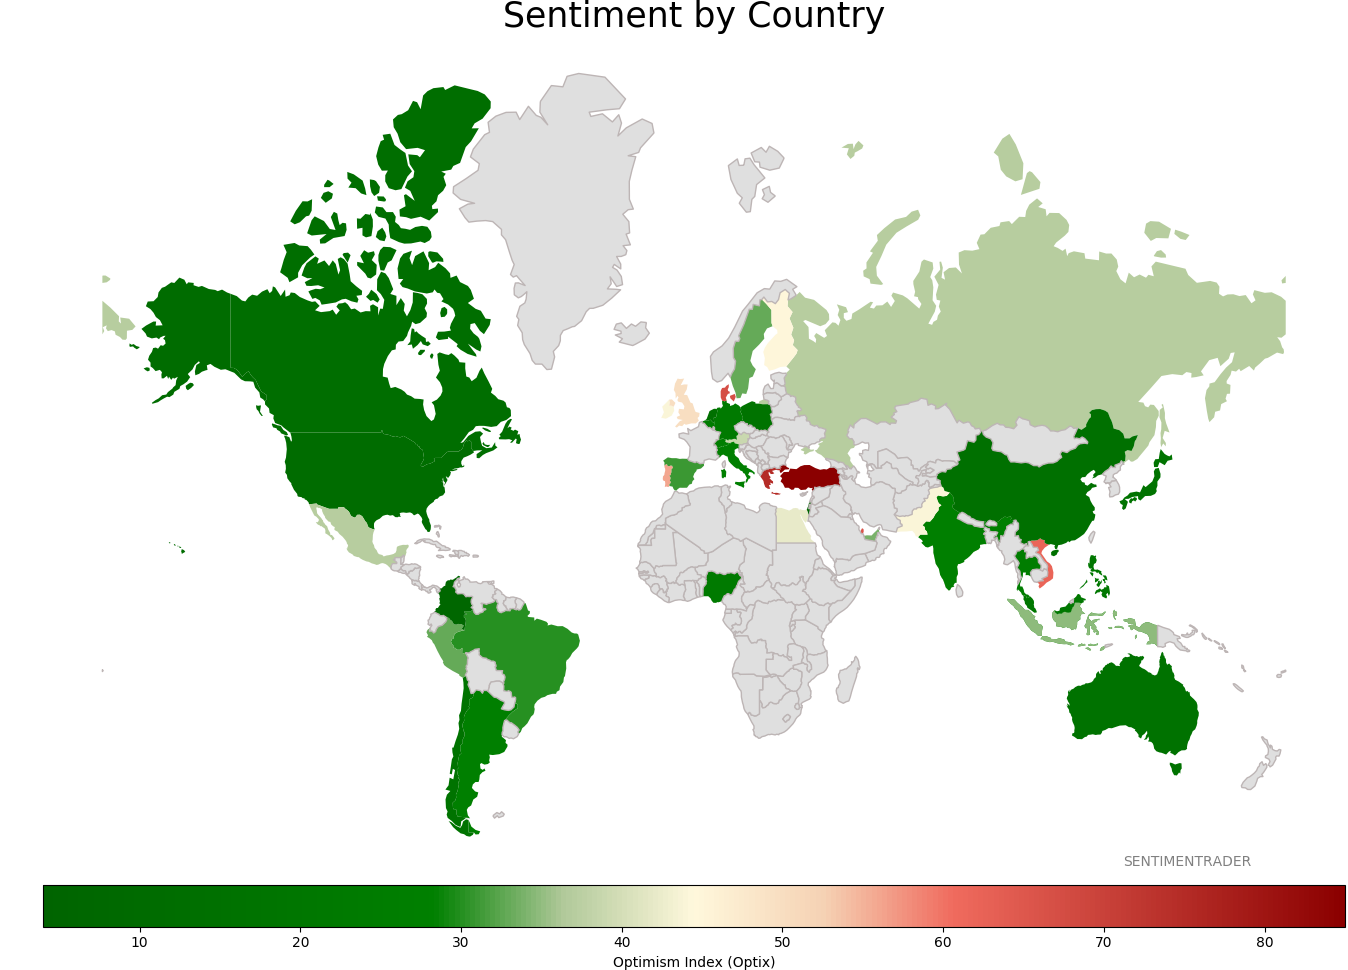
Sentiment Around The World
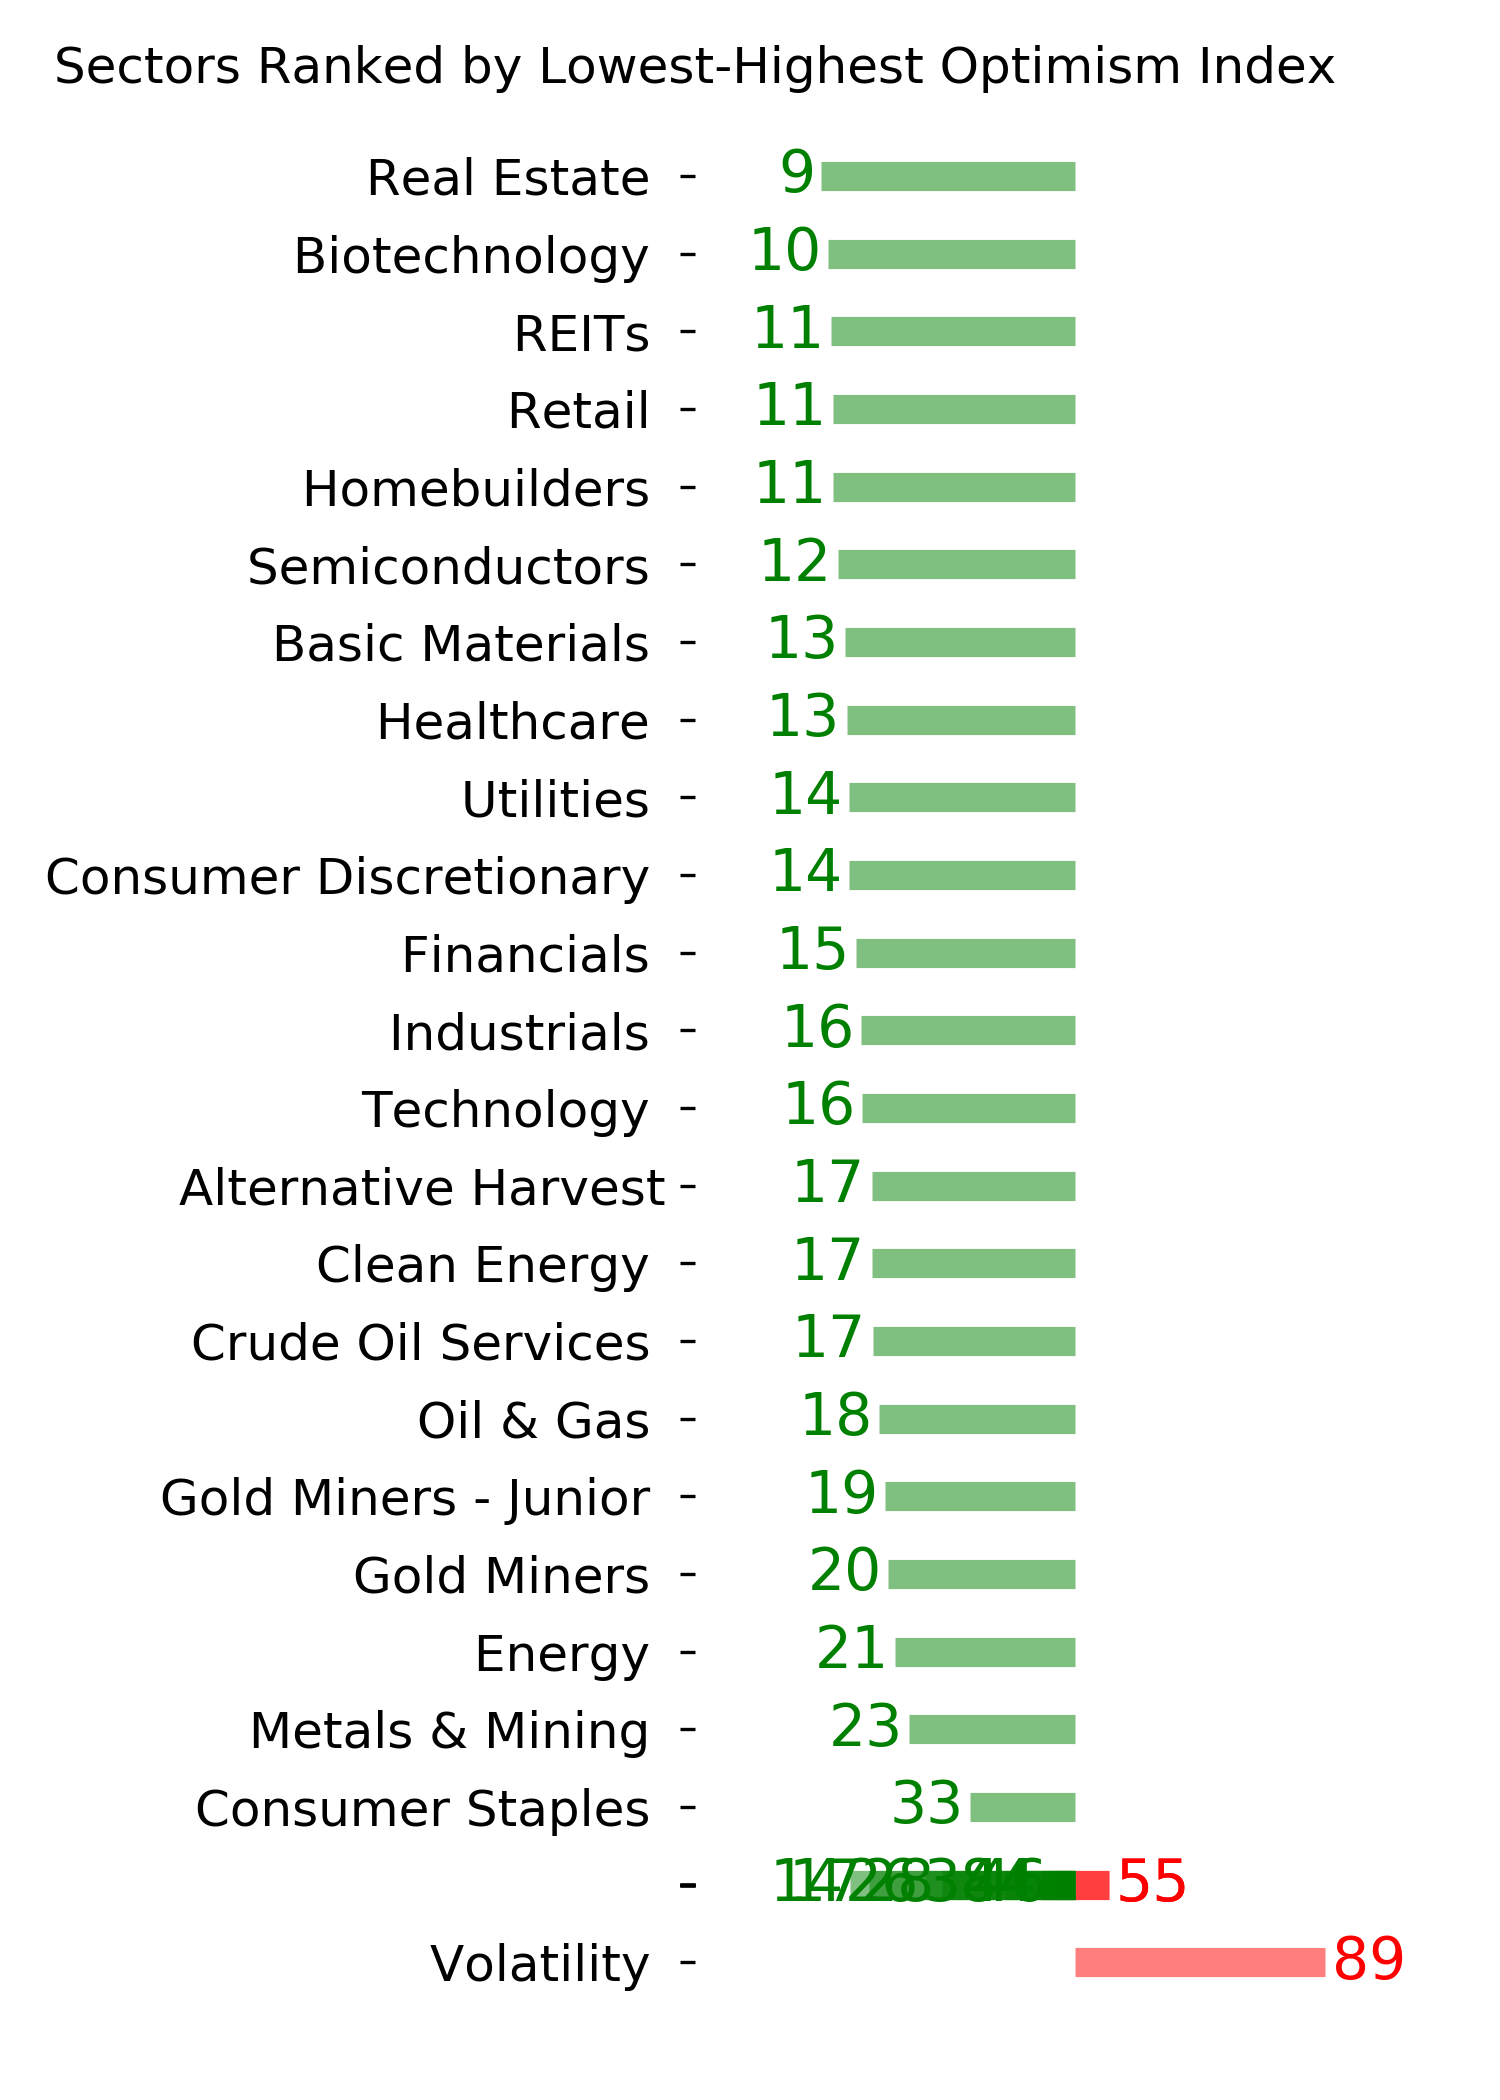
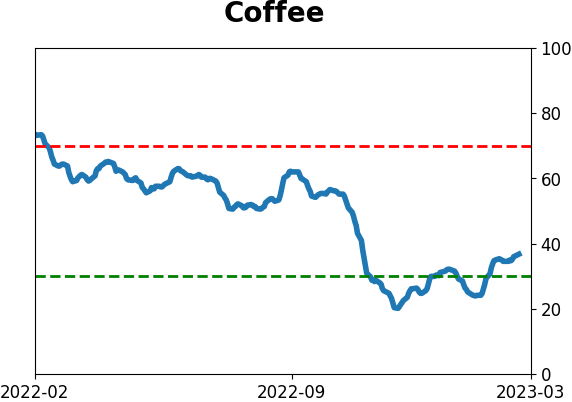
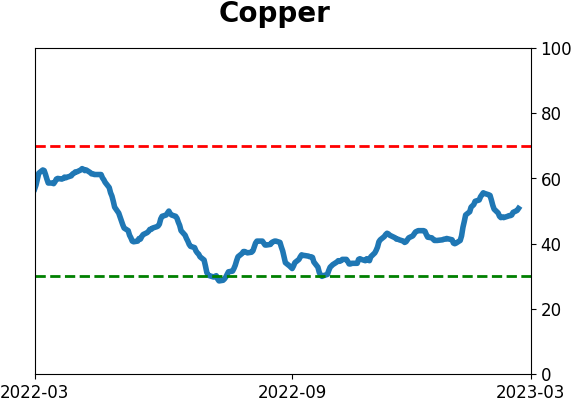
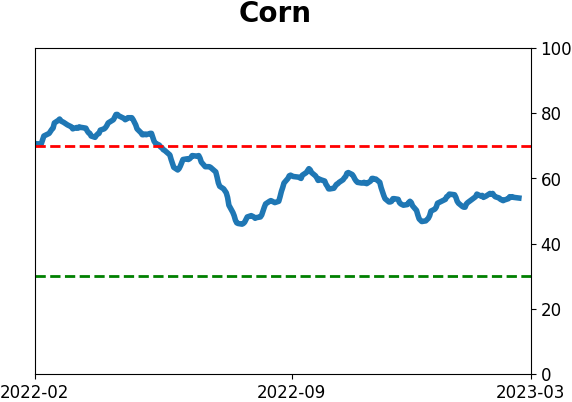
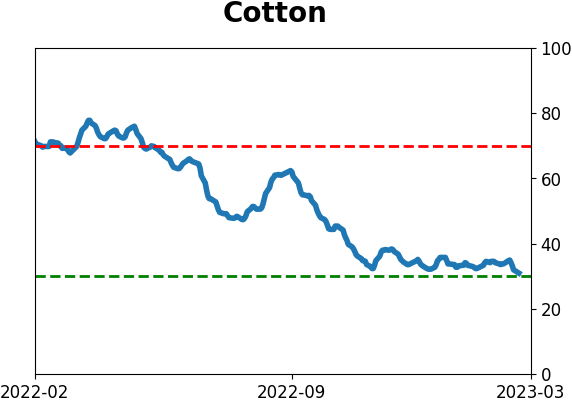
Optimism Index Thumbnails
|
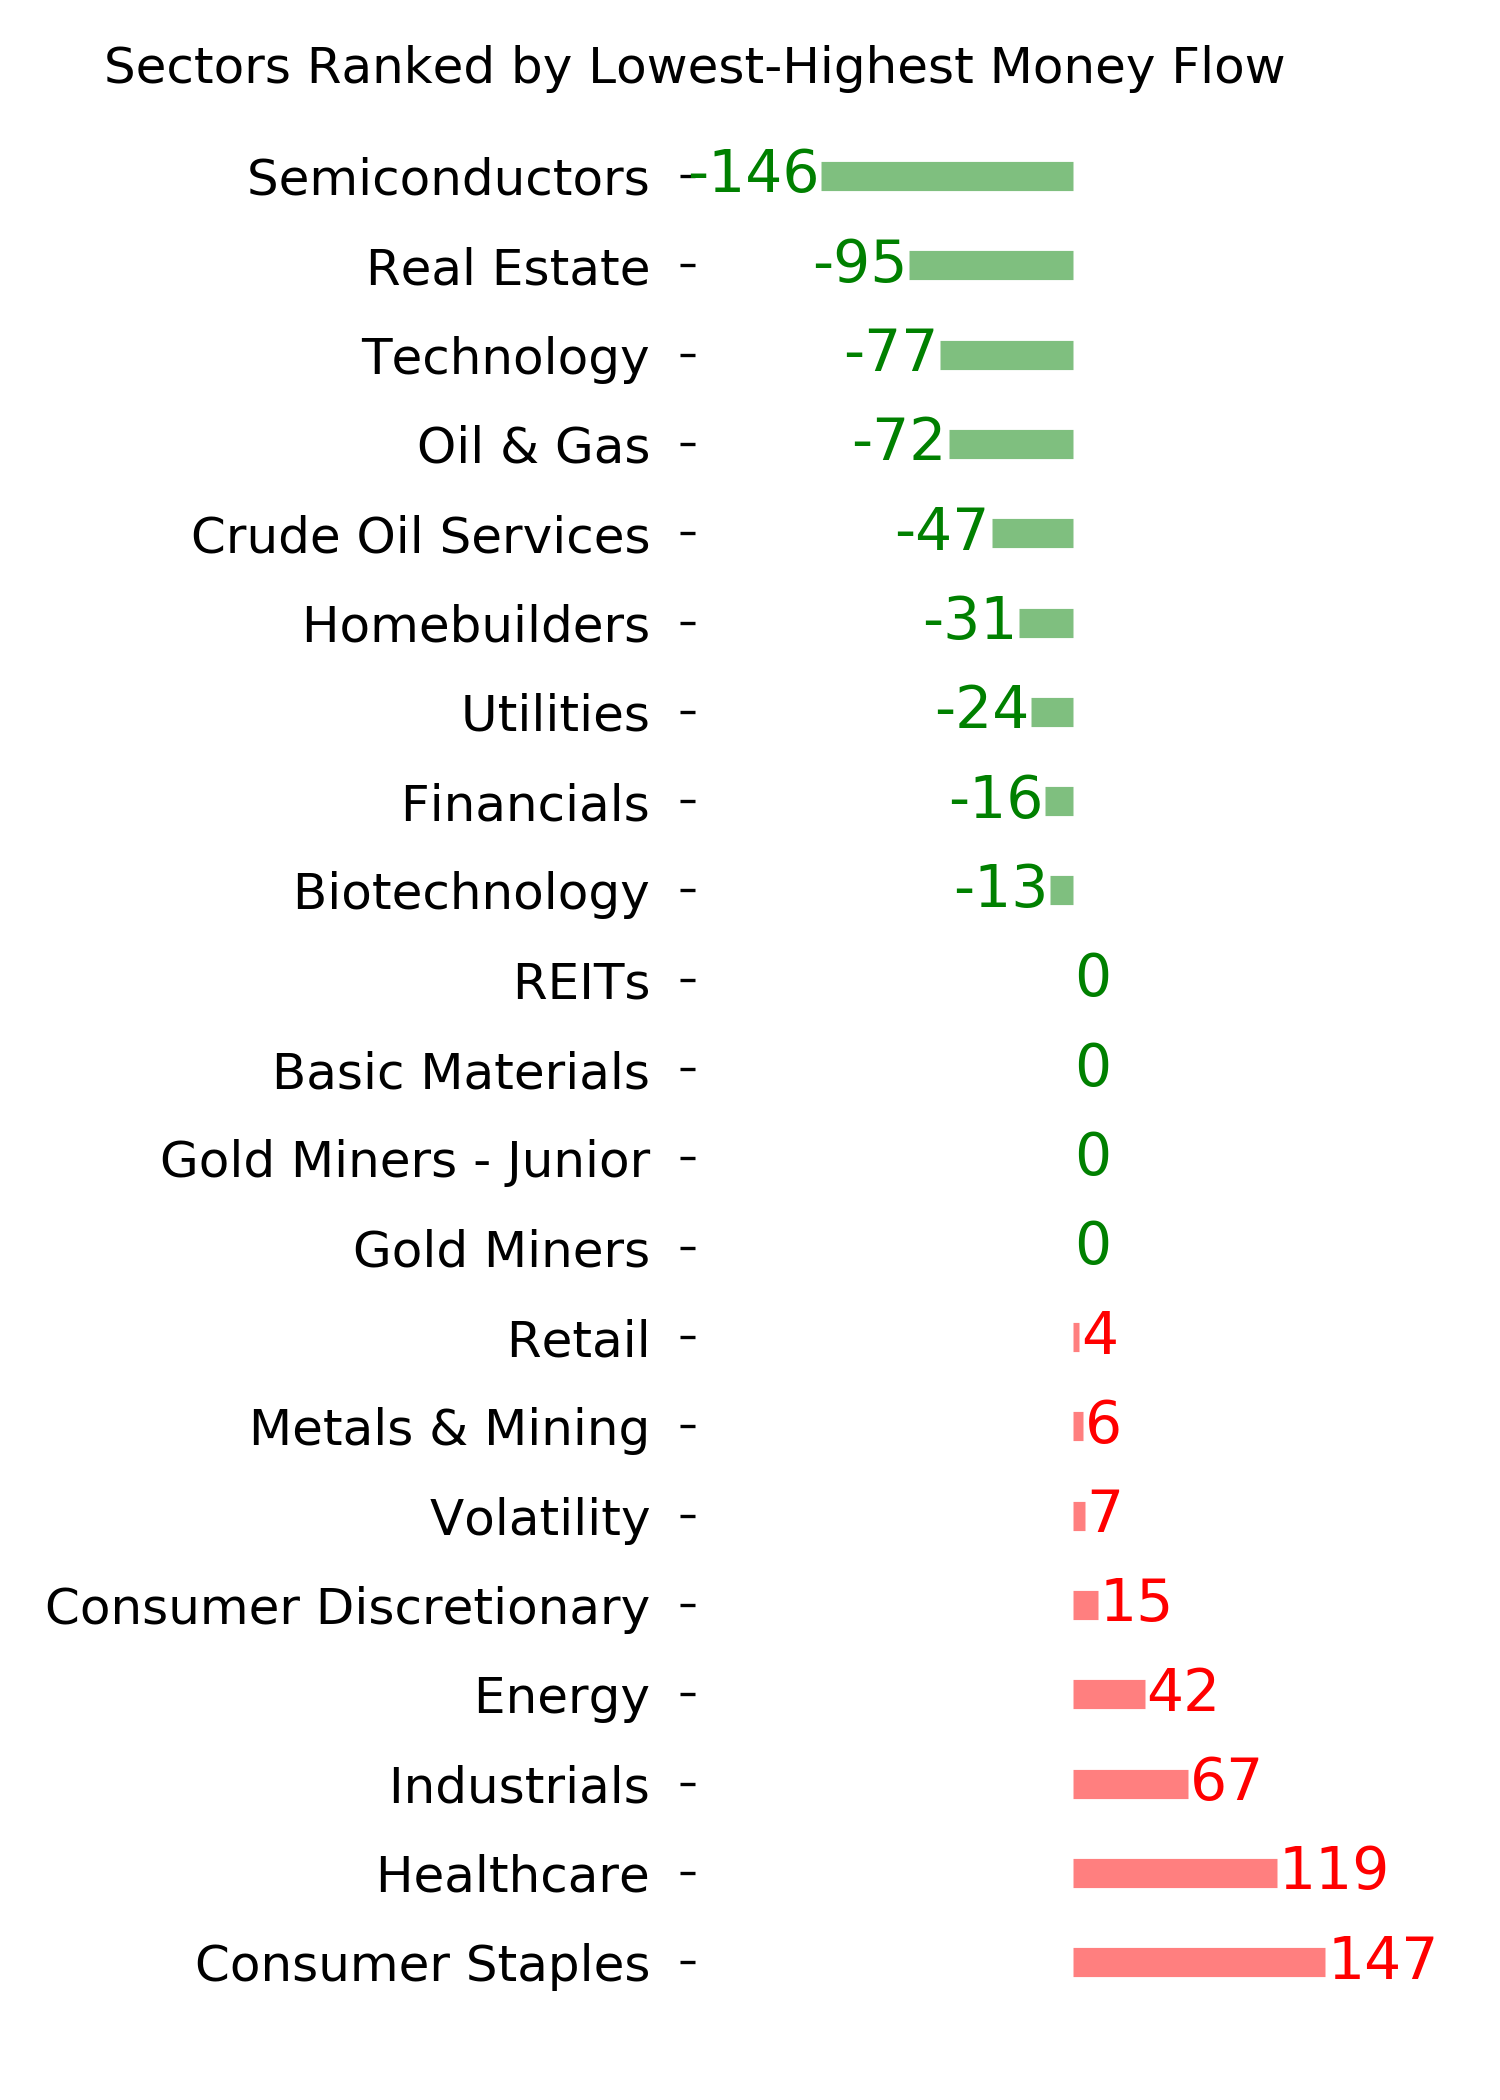
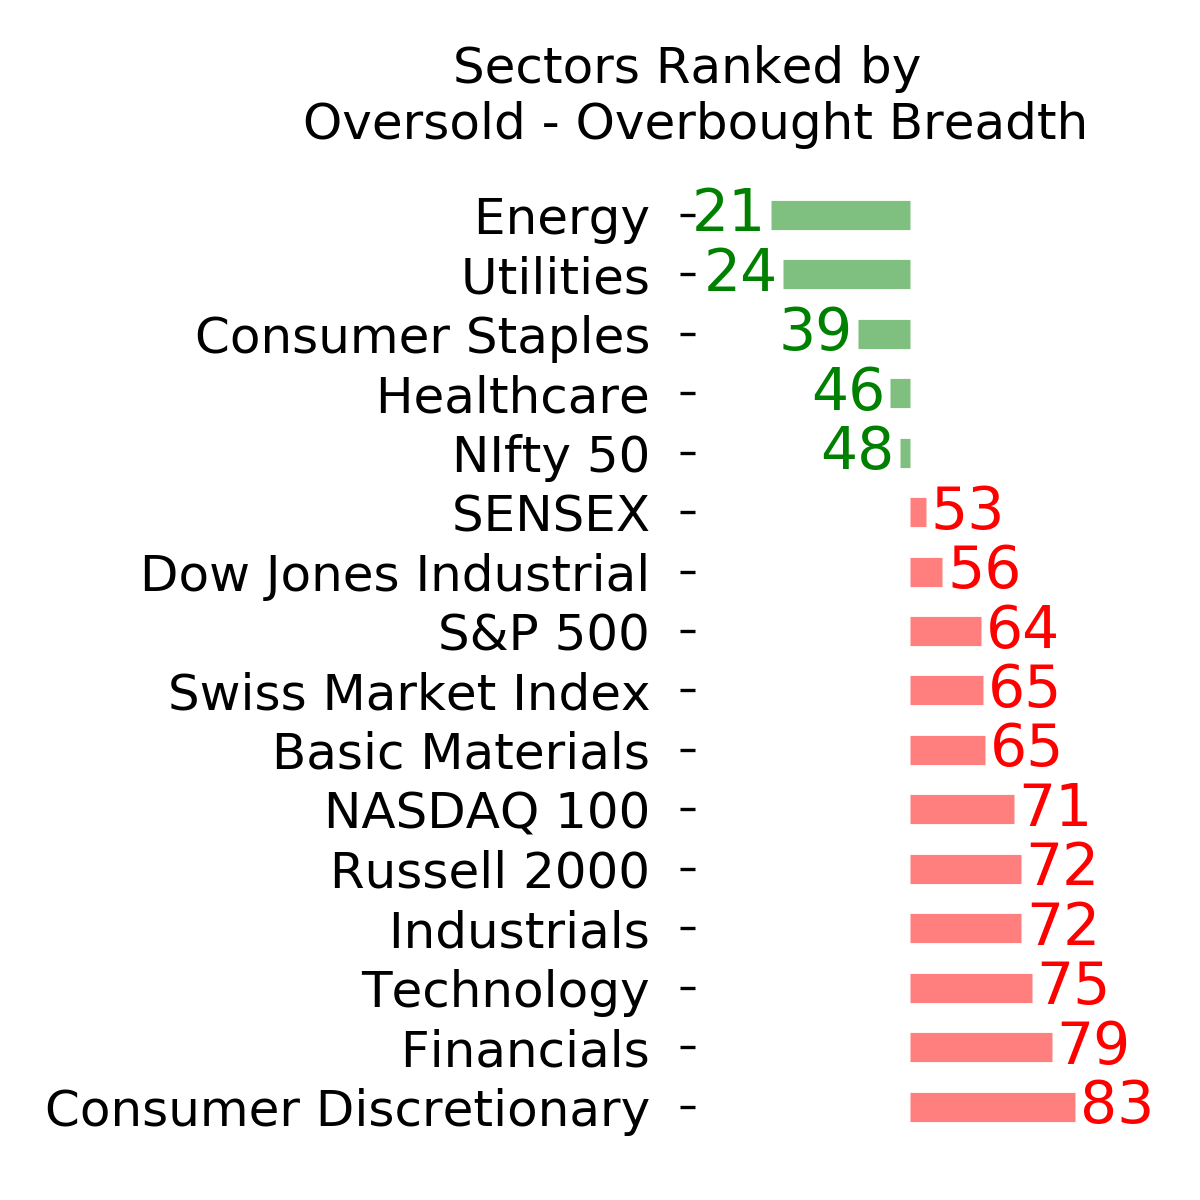
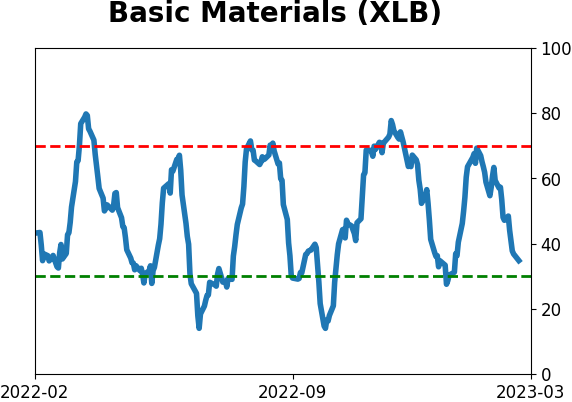
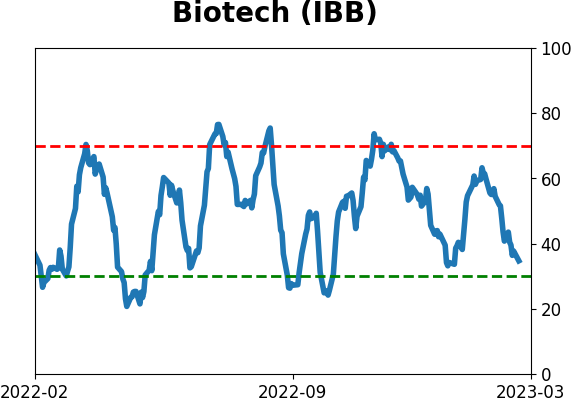
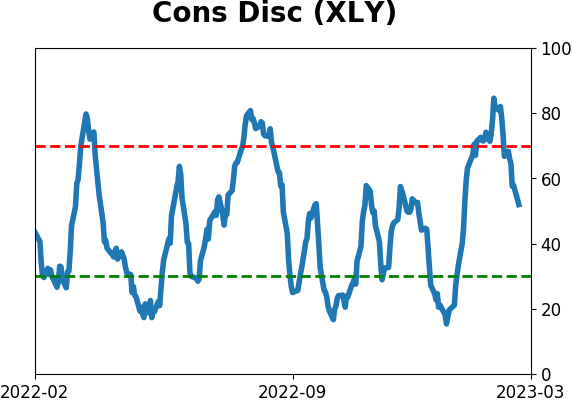
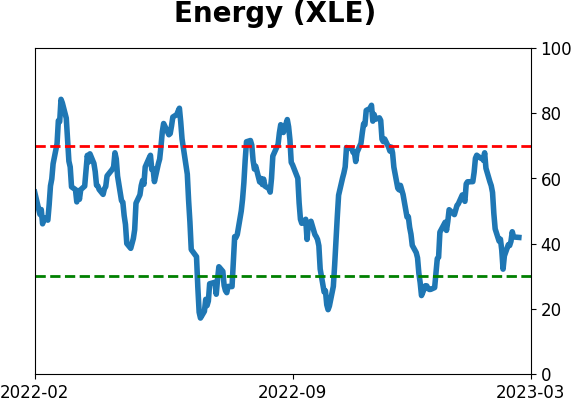
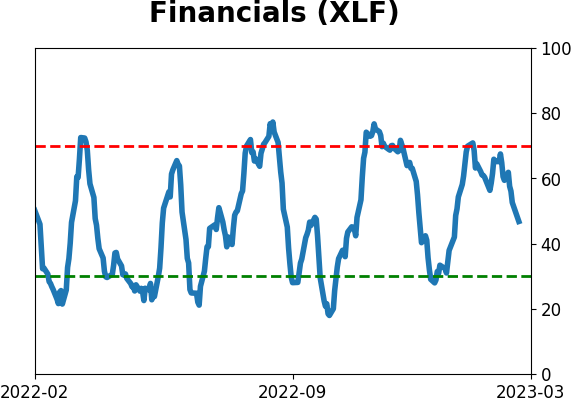
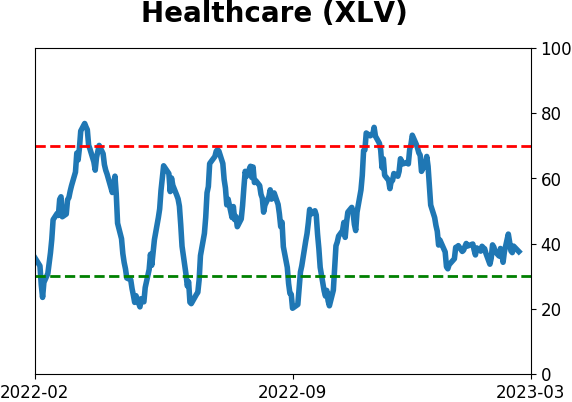
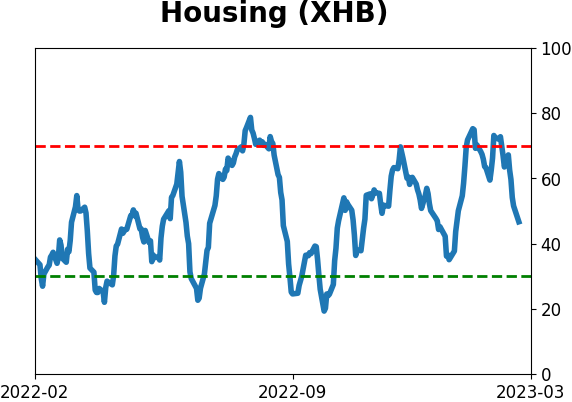
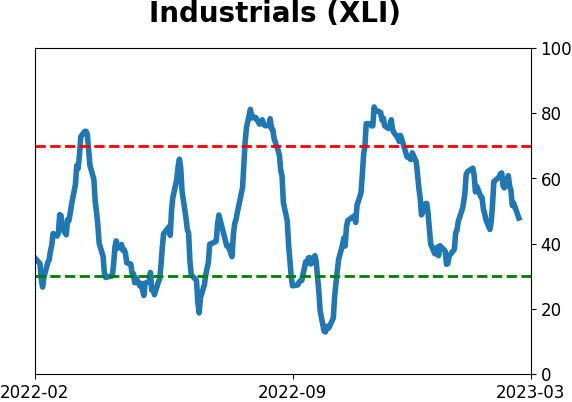
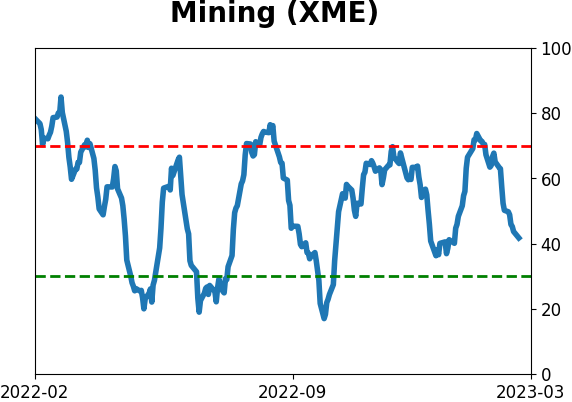
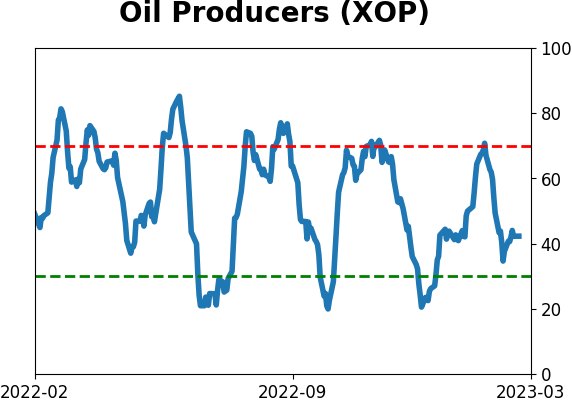
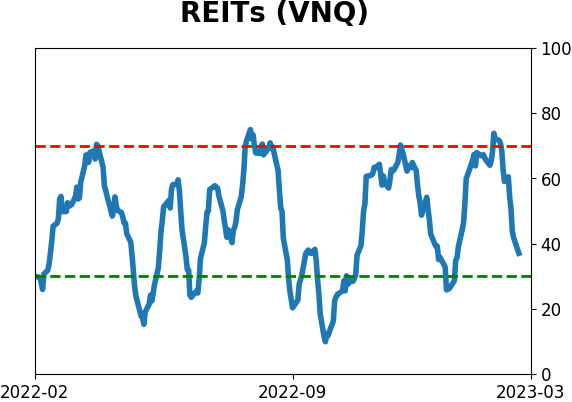
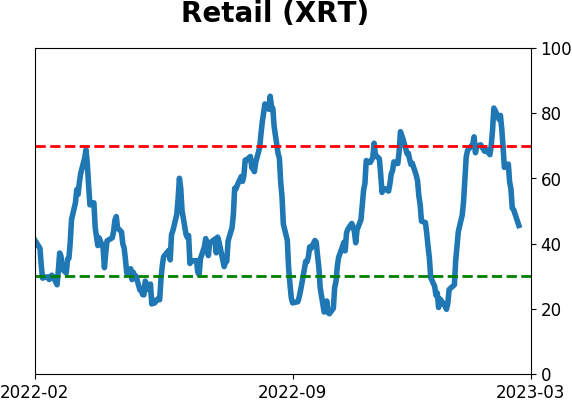
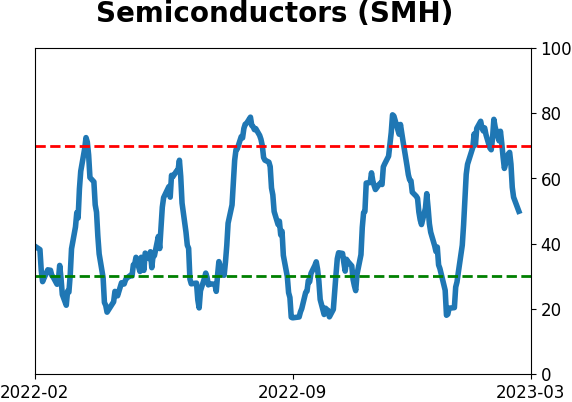
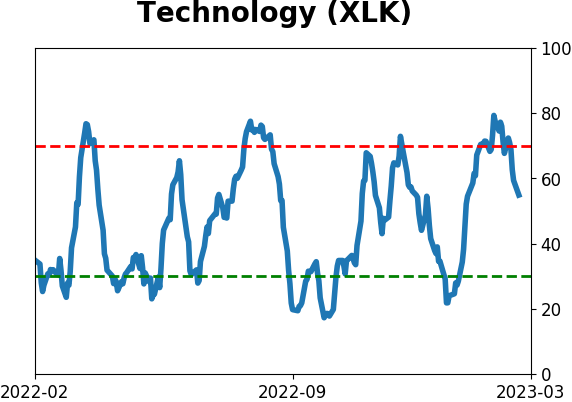
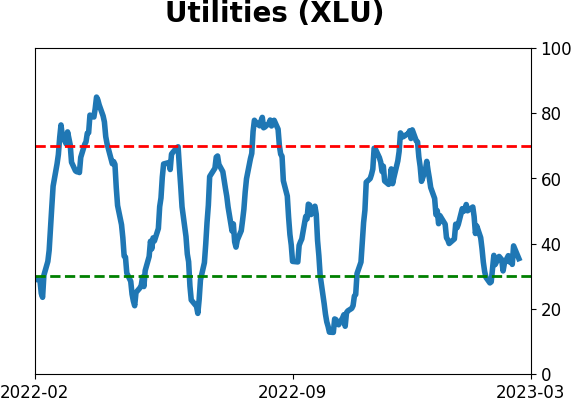
Sector ETF's - 10-Day Moving Average
|
|
|
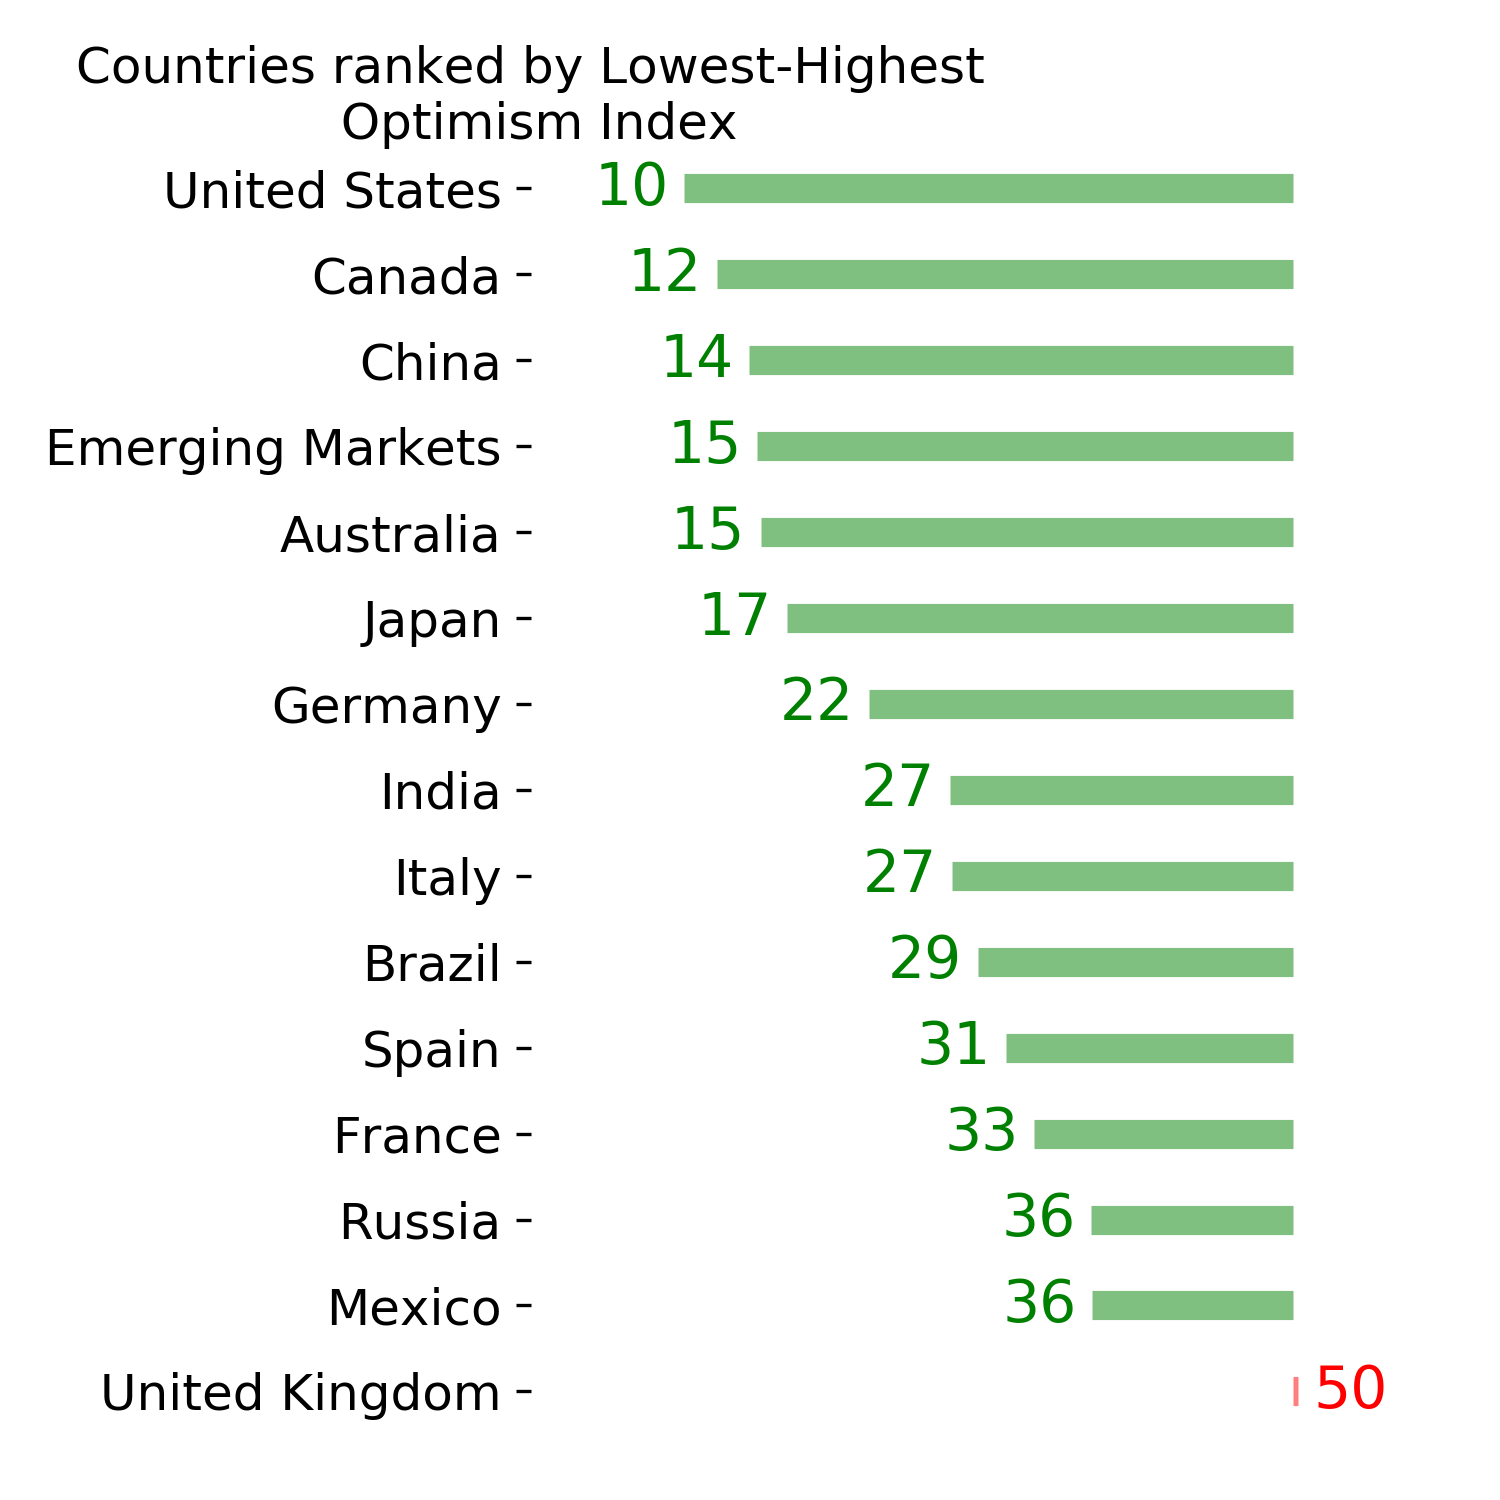
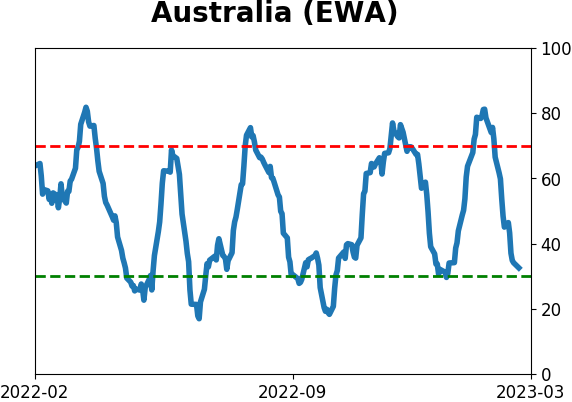
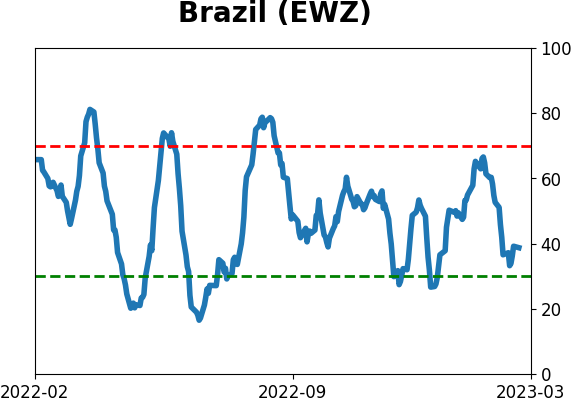
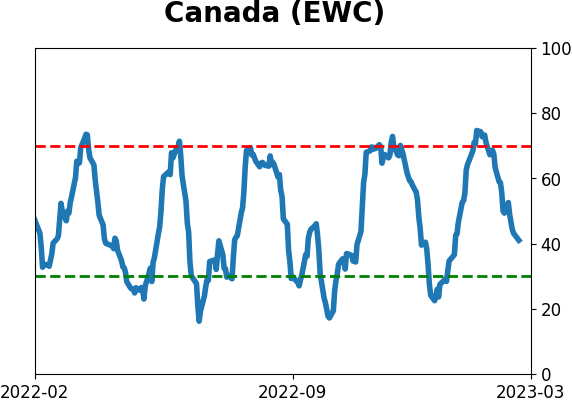
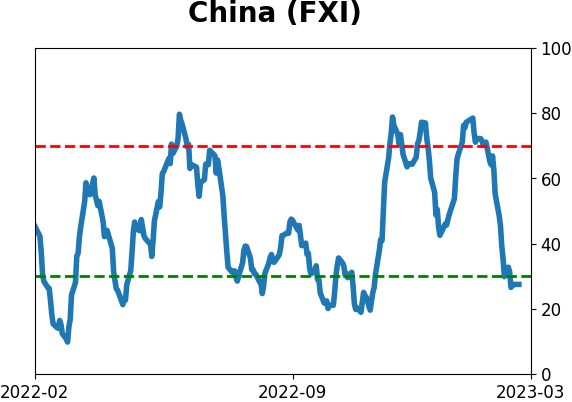
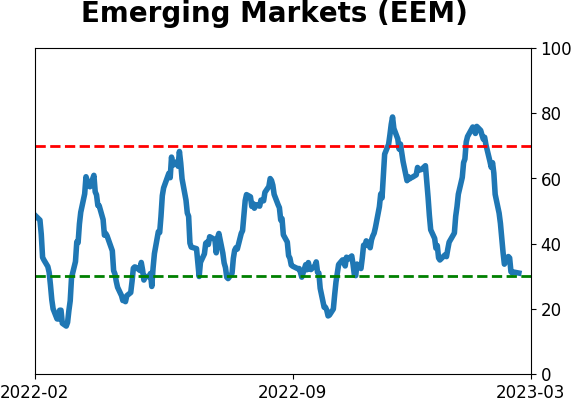
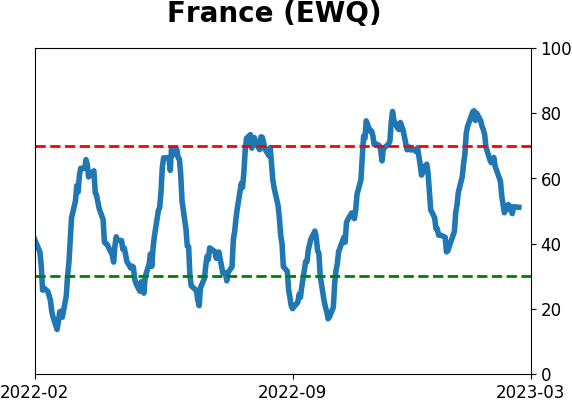
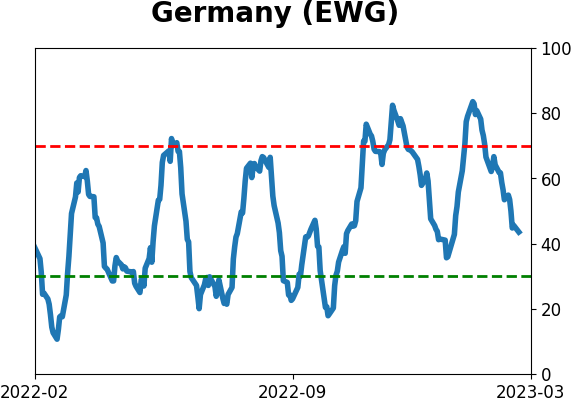
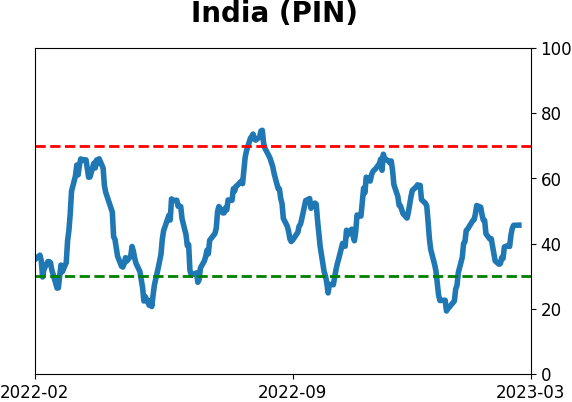
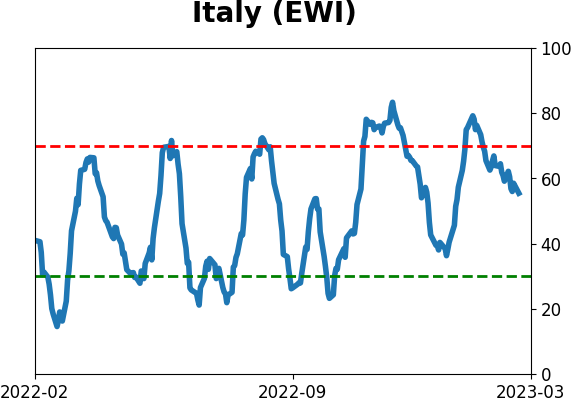
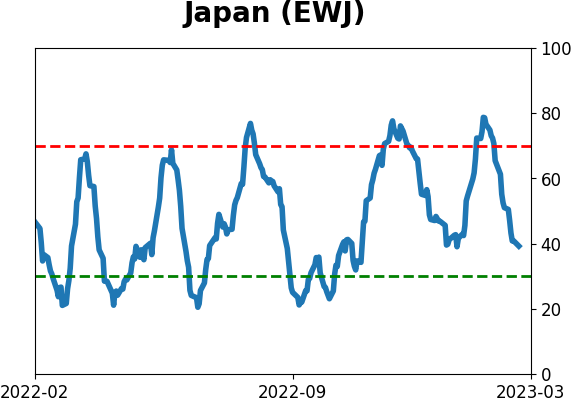
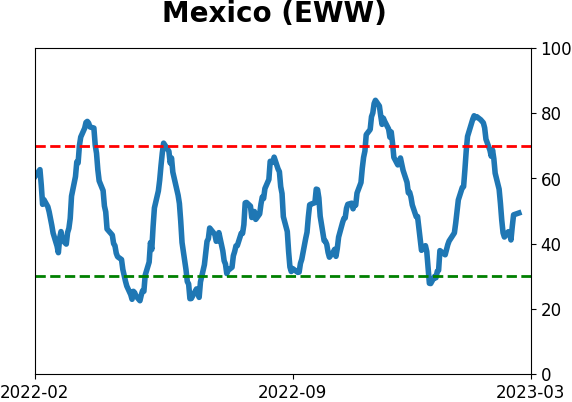
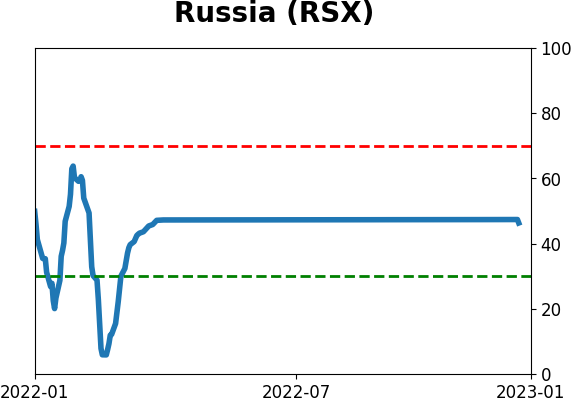
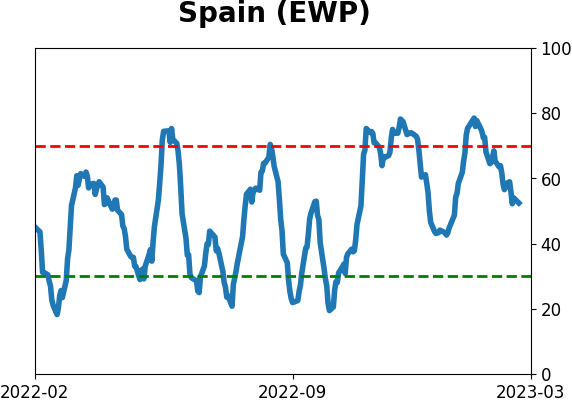
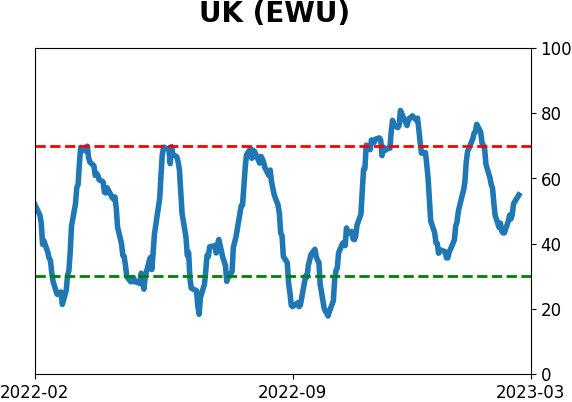
Country ETF's - 10-Day Moving Average
|
|
|
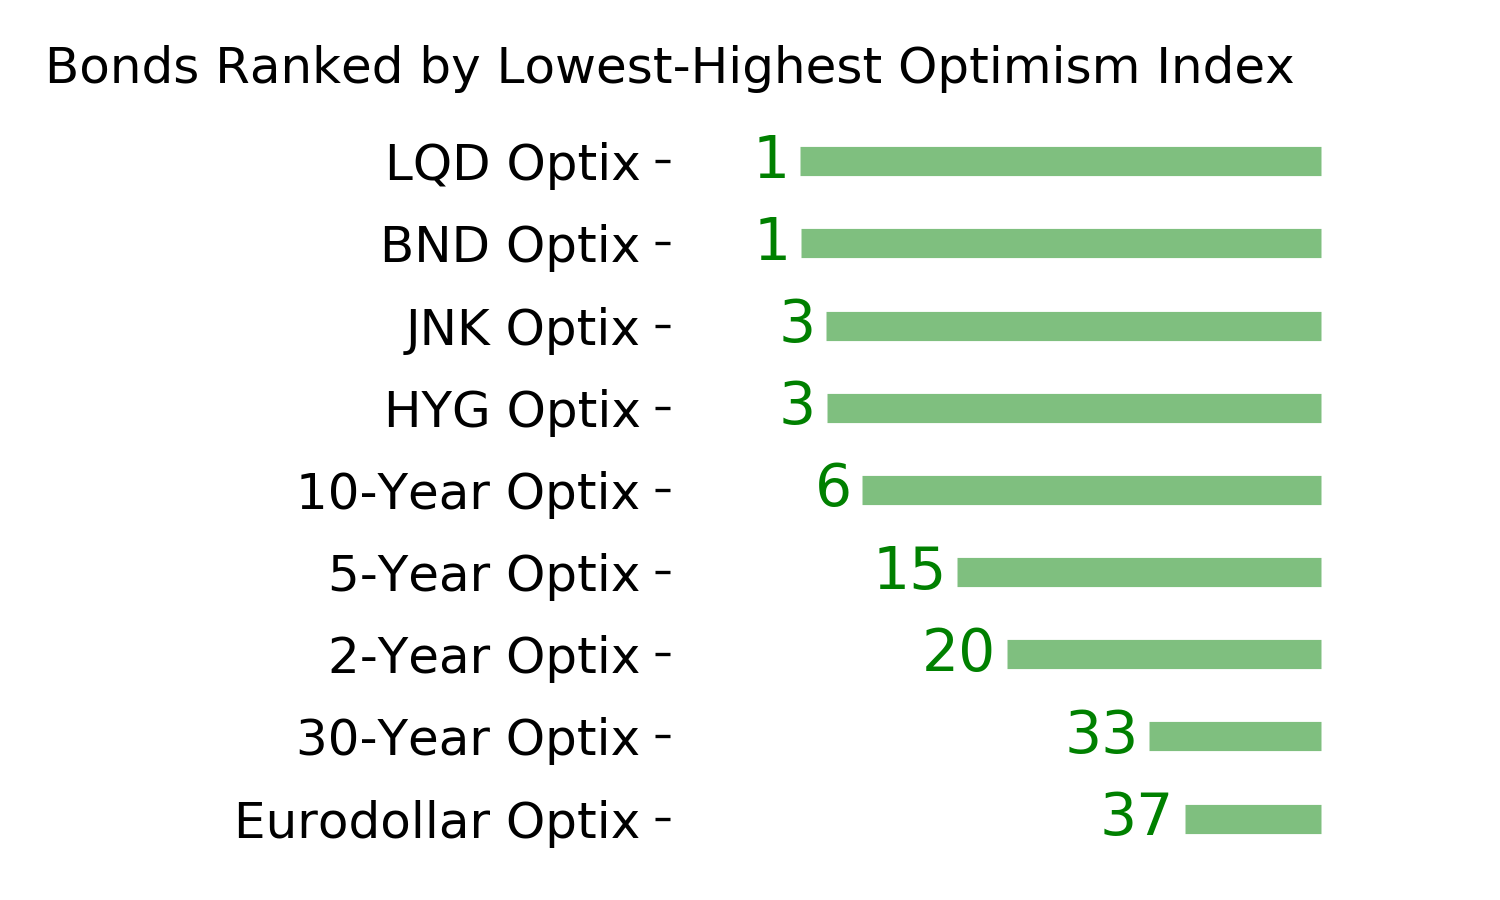
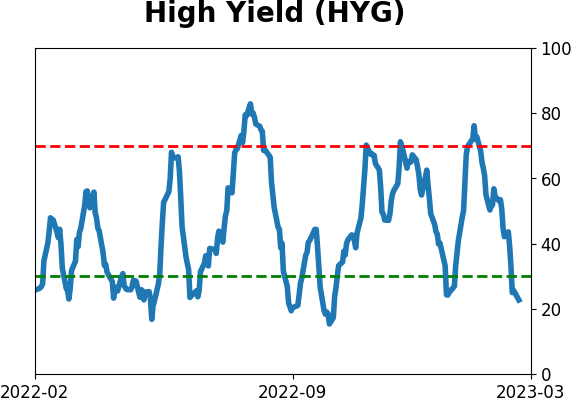
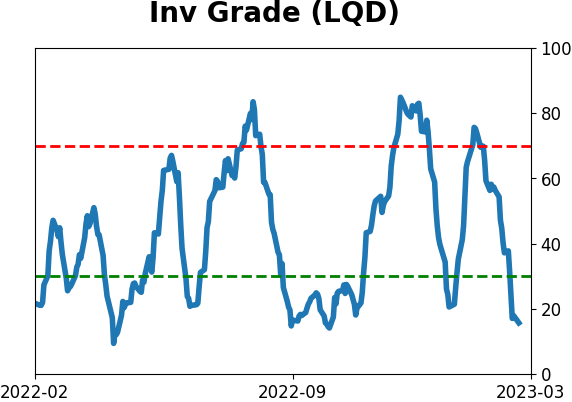
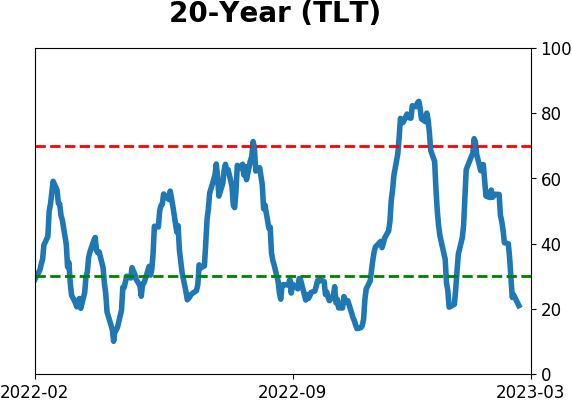
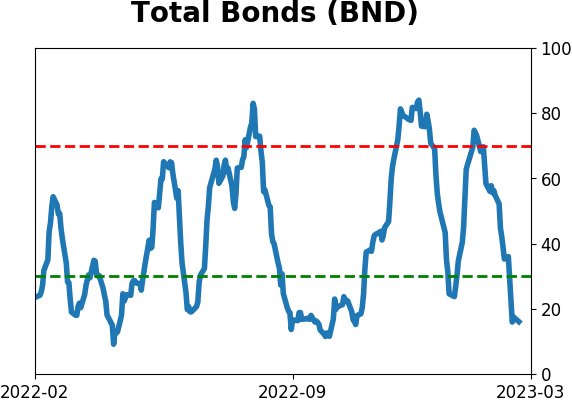
Bond ETF's - 10-Day Moving Average
|
|
|
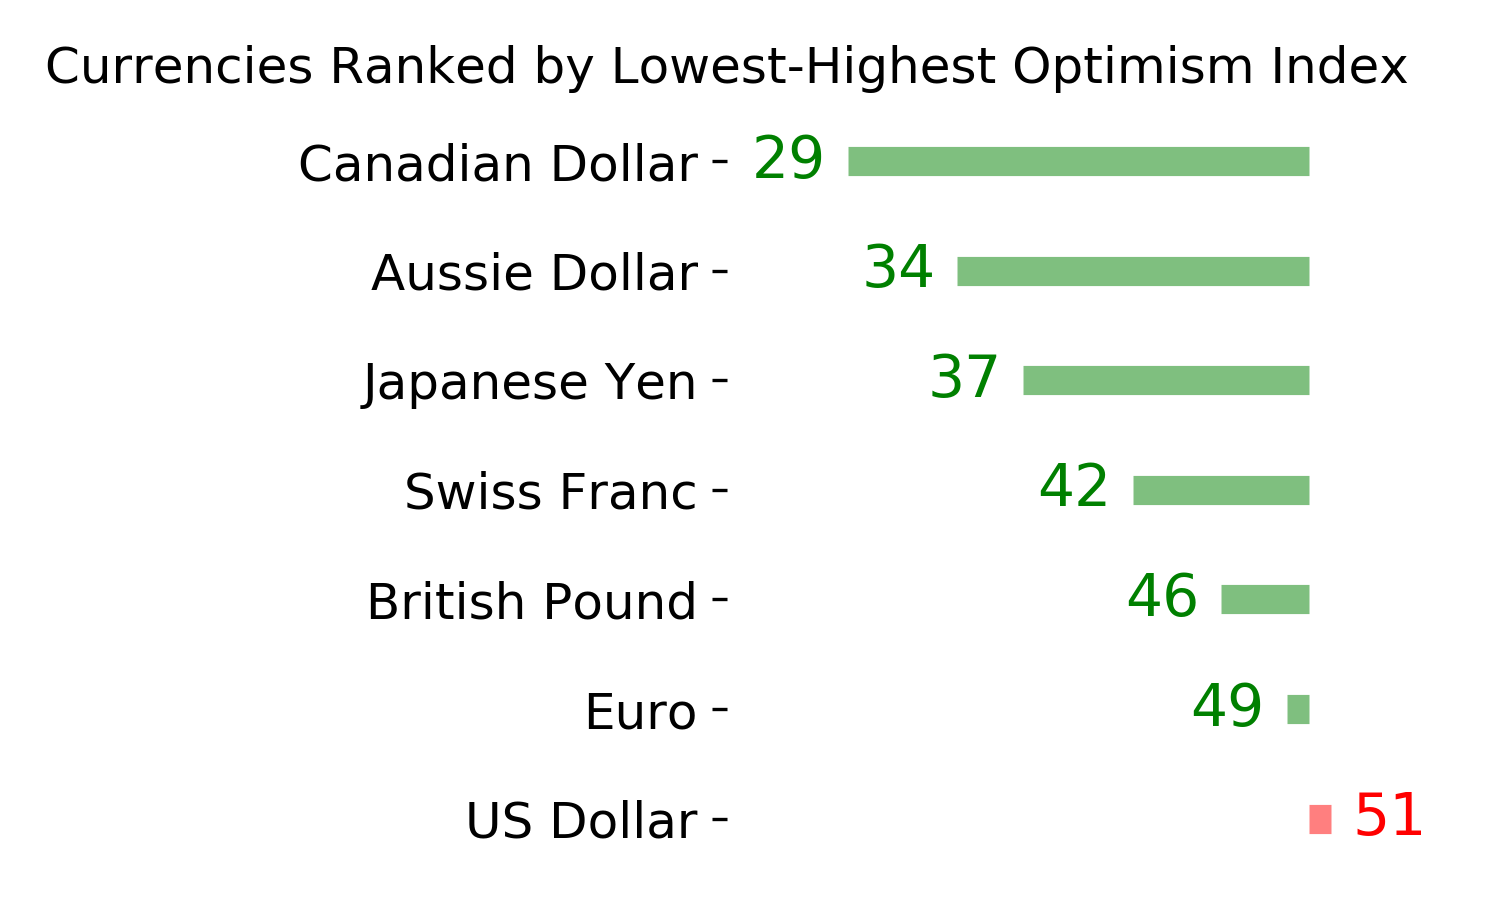
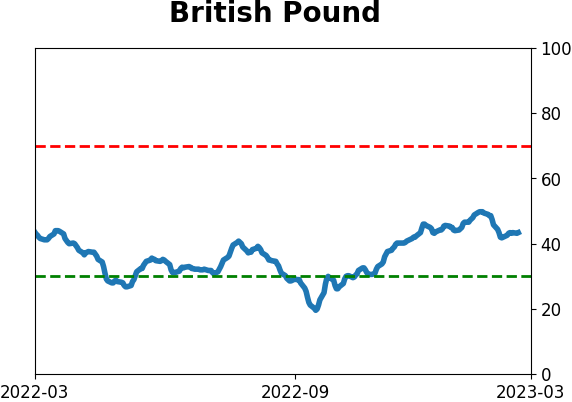
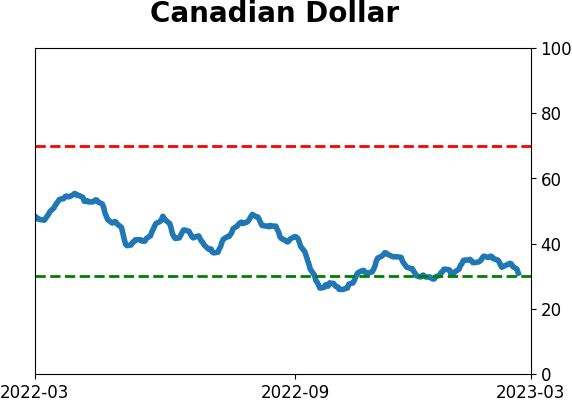
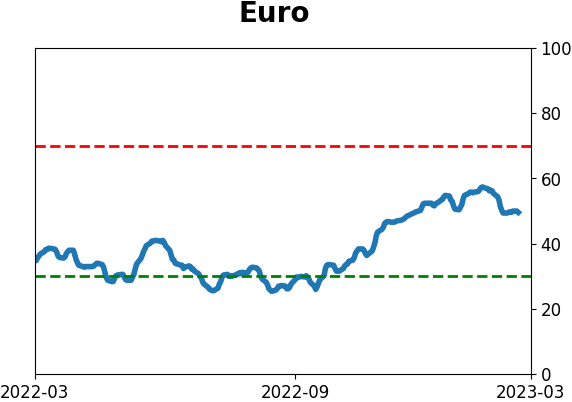
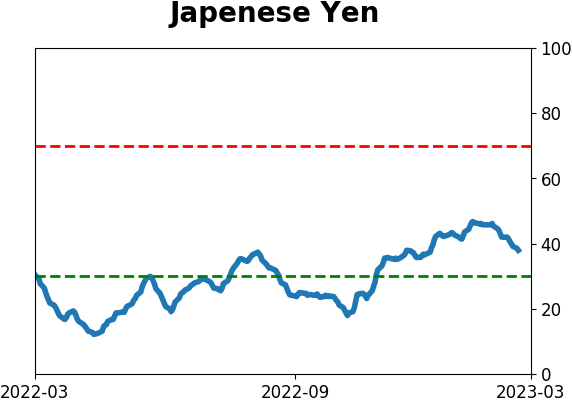
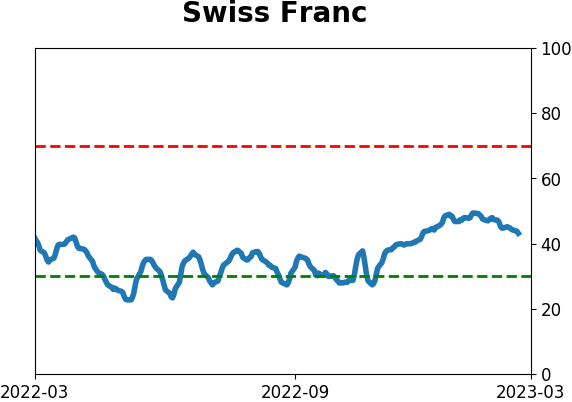
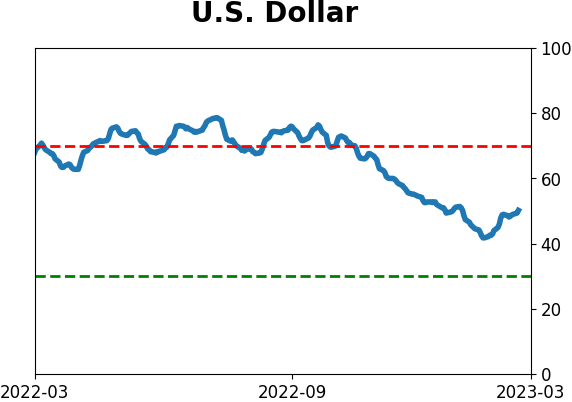
Currency ETF's - 5-Day Moving Average
|
|
|
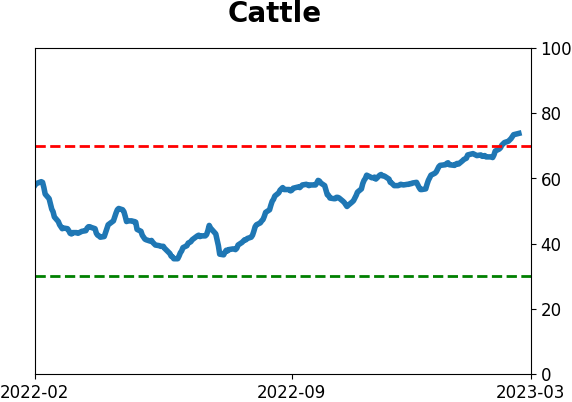
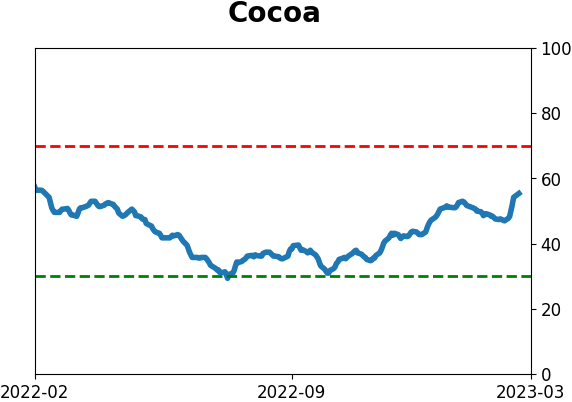
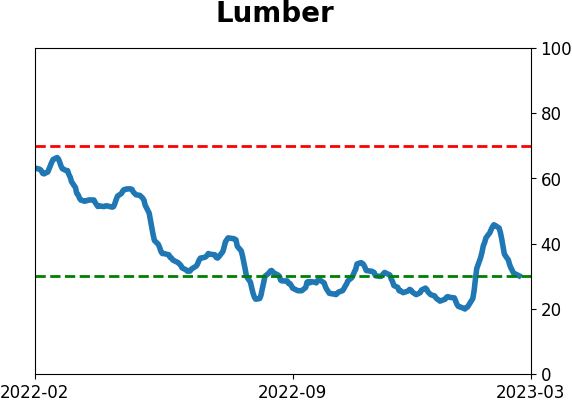
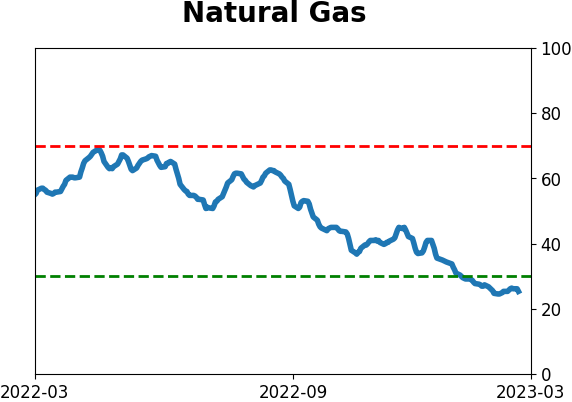
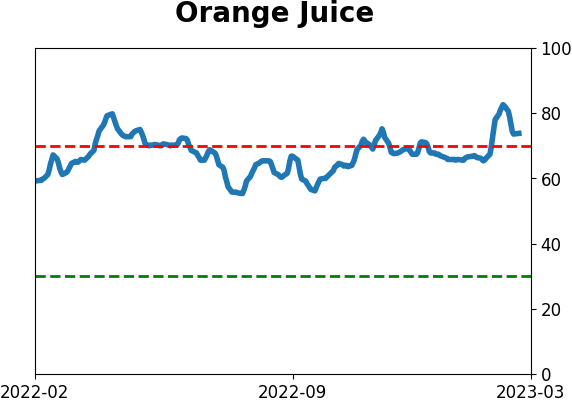
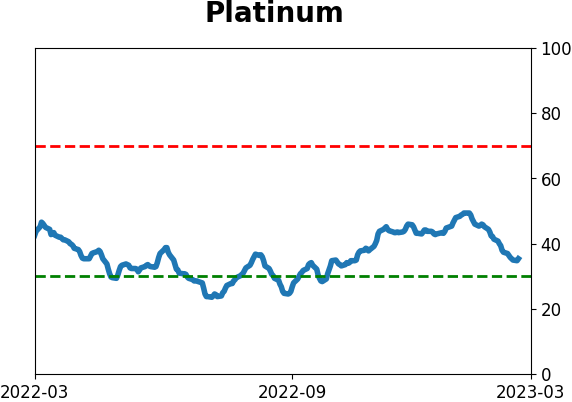
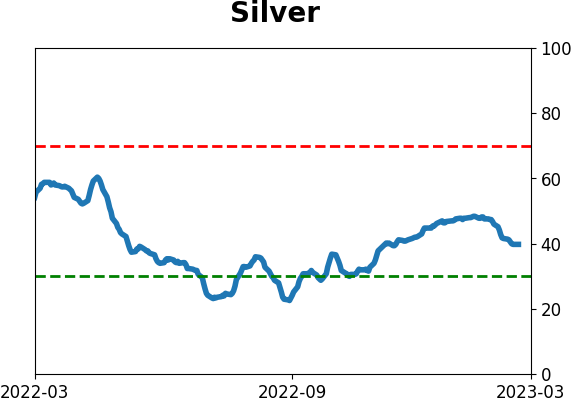
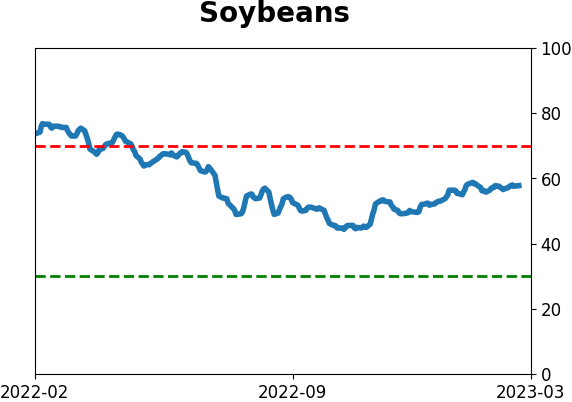
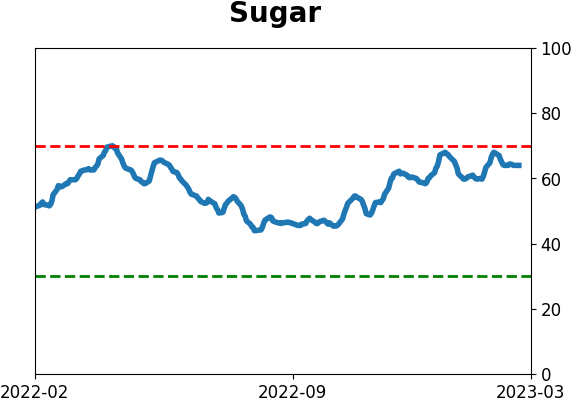
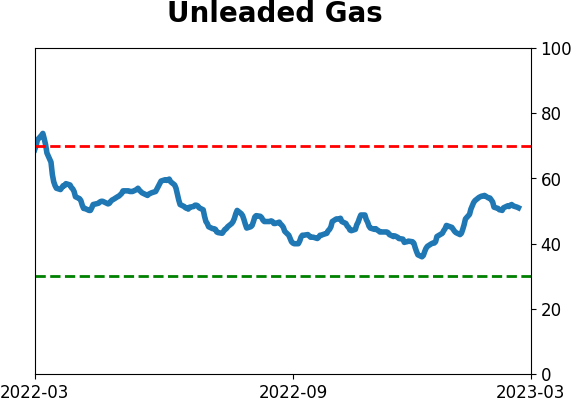
Commodity ETF's - 5-Day Moving Average
|
|