Headlines
|
|
A new record in an old (and broad) index:
While there have been some signs of weak participation under the surface, a resurgence in some of those lagging stocks last week helped propel the NYSE Composite Index to a record high, ending its 5th-longest streak without one. Other major breakouts preceded weak medium-term returns but strong ones over the next year.
|
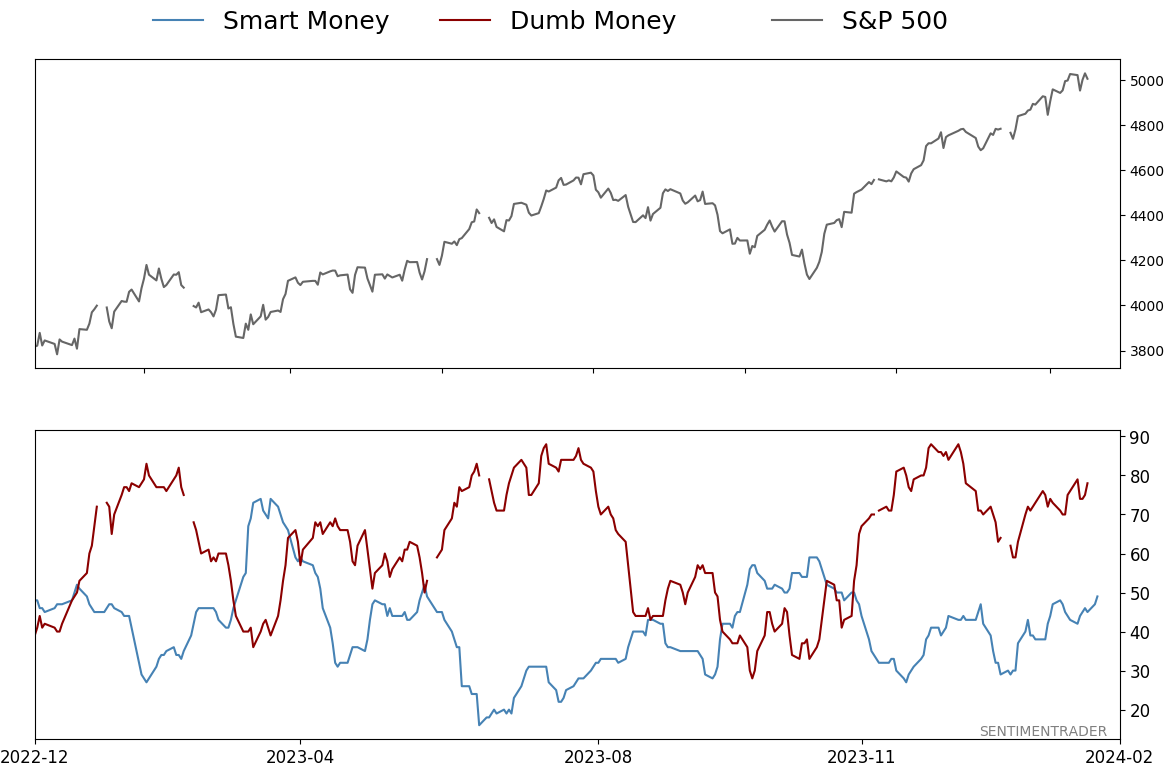
Smart / Dumb Money Confidence
|
Smart Money Confidence: 49%
Dumb Money Confidence: 78%
|
|
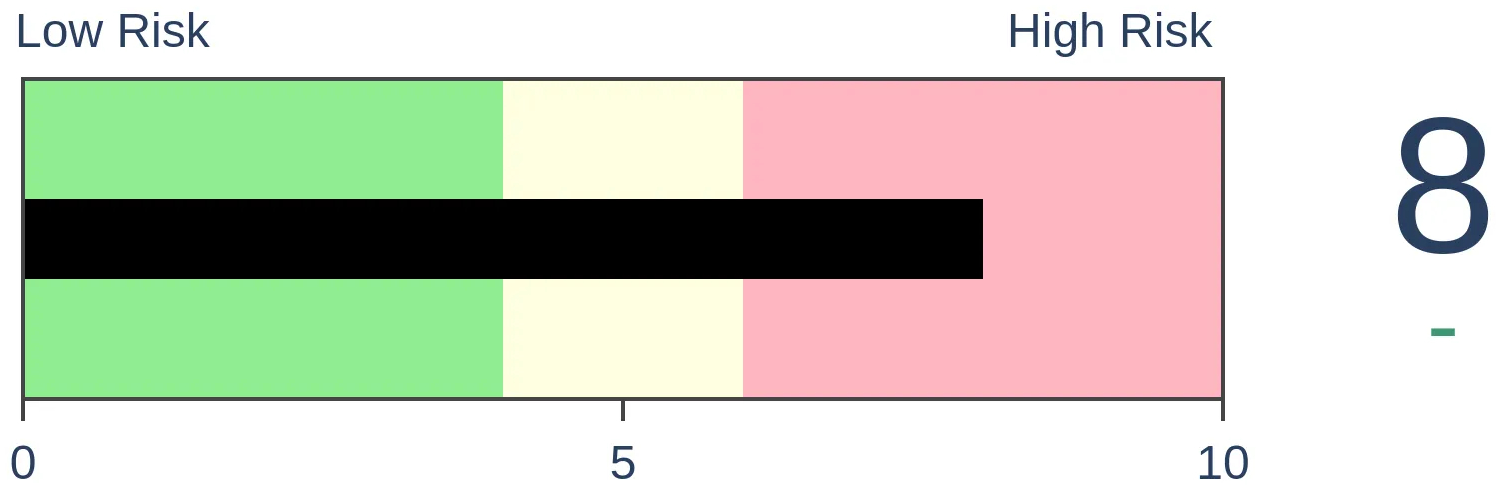
Risk Levels
Stocks Short-Term

|
Stocks Medium-Term
|
|
Bonds
|
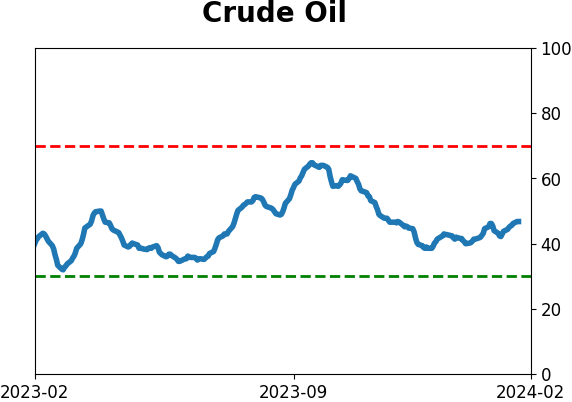
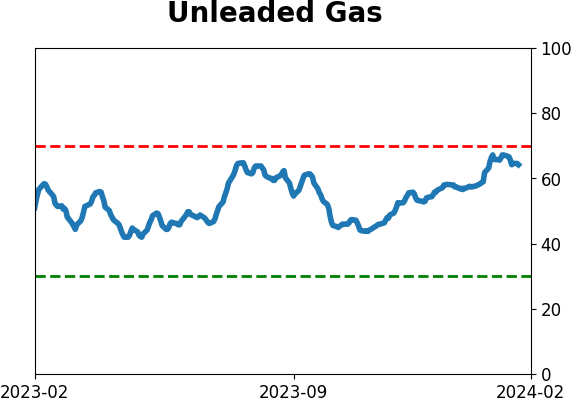
Crude Oil
|
|
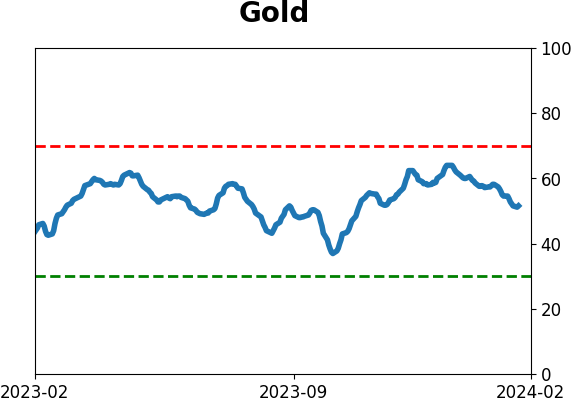
Gold

|
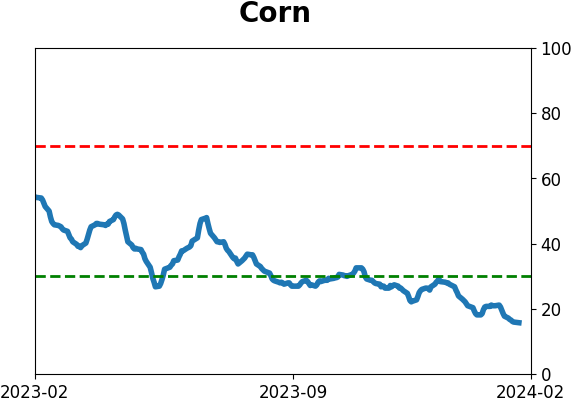
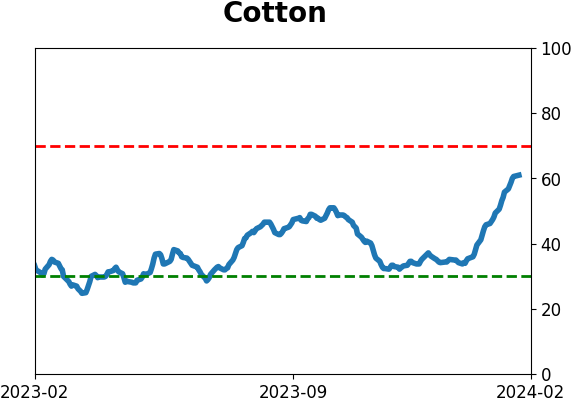
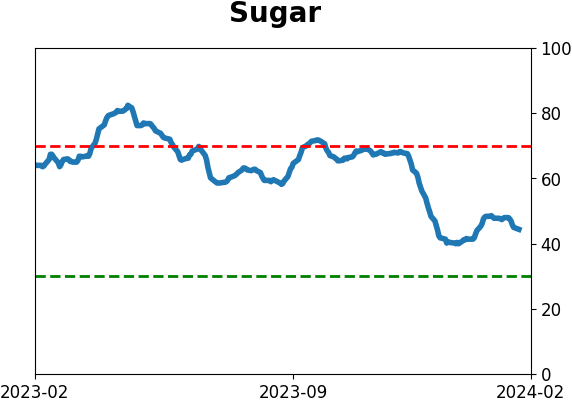
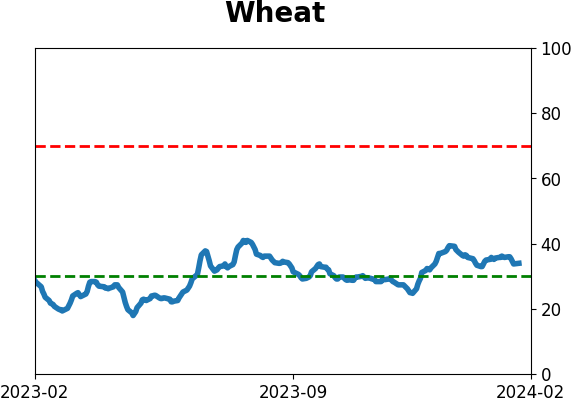
Agriculture
|
|
Research
By Jason Goepfert
BOTTOM LINE
While there have been some signs of weak participation under the surface, a resurgence in some of those lagging stocks last week helped propel the NYSE Composite Index to a record high, ending its 5th-longest streak without one. Other major breakouts preceded weak medium-term returns but strong ones over the next year.
FORECAST / TIMEFRAME
None
|
Key points:
- The NYSE Composite Index set a record high, ending its 5th-longest streak without one
- Fresh records tended to precede weak medium-term returns for the index and the S&P 500
- Over the next year, returns were good, especially for the S&P 500 and a couple of defensive sectors
A new record in a very broad index
In recent weeks, we've been seeing an increasing number of signs of a split market. While a handful of large stocks were doing exceedingly well and helping drive record highs in many major indexes, under the surface, there was a lot more turmoil. That has traditionally been a warning sign for future returns.
Some of those concerns have been alleviated in recent sessions. Smaller stocks have been doing a bit better, and that is helping to resolve what had been underlying divergences.
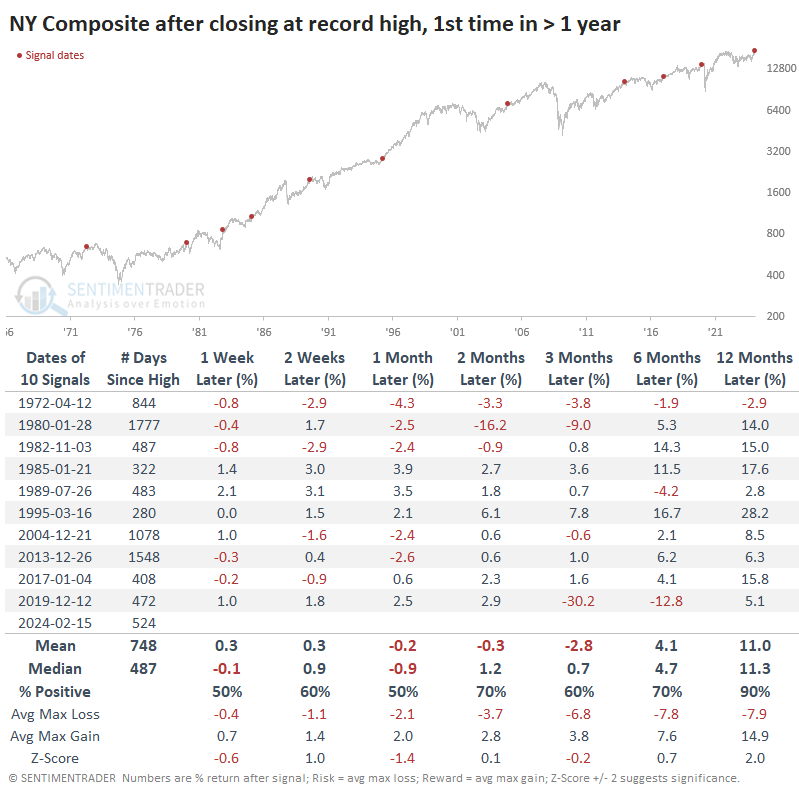
One of the best examples of this is a record-high close in the New York Stock Exchange Composite Index. While larger stocks can also drive this index higher, it has a vast constituency and is a decent reflection of "the U.S. stock market." In that regard, the move to a new high is notable because it's the first one in more than two years, ending the 5th-longest streak without a record close in its history.
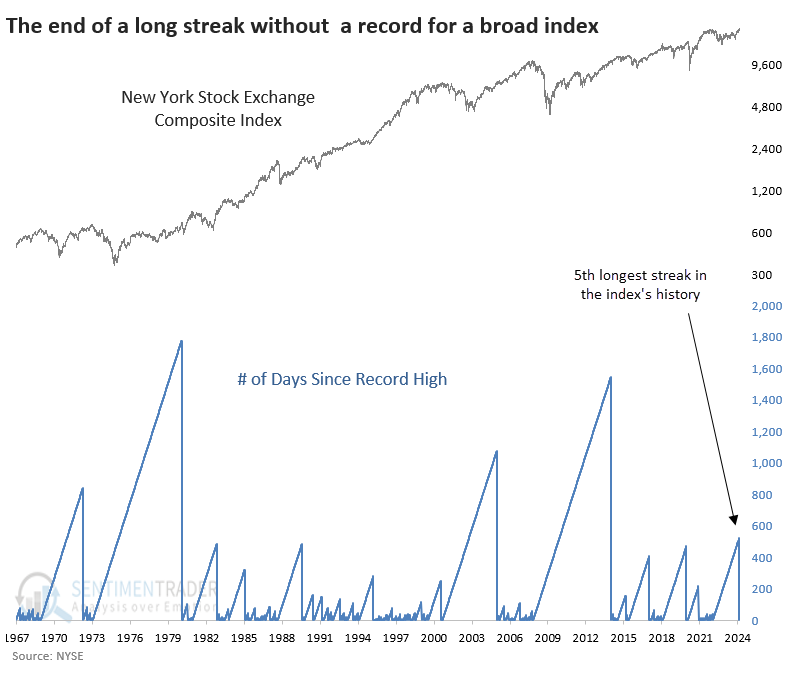
After it ended a streak of at least a year without a record high, the Composite's medium-term returns weren't anything special. It suffered a negative mean return up to three months later, though by a year later, it was higher after nine of the ten signals.
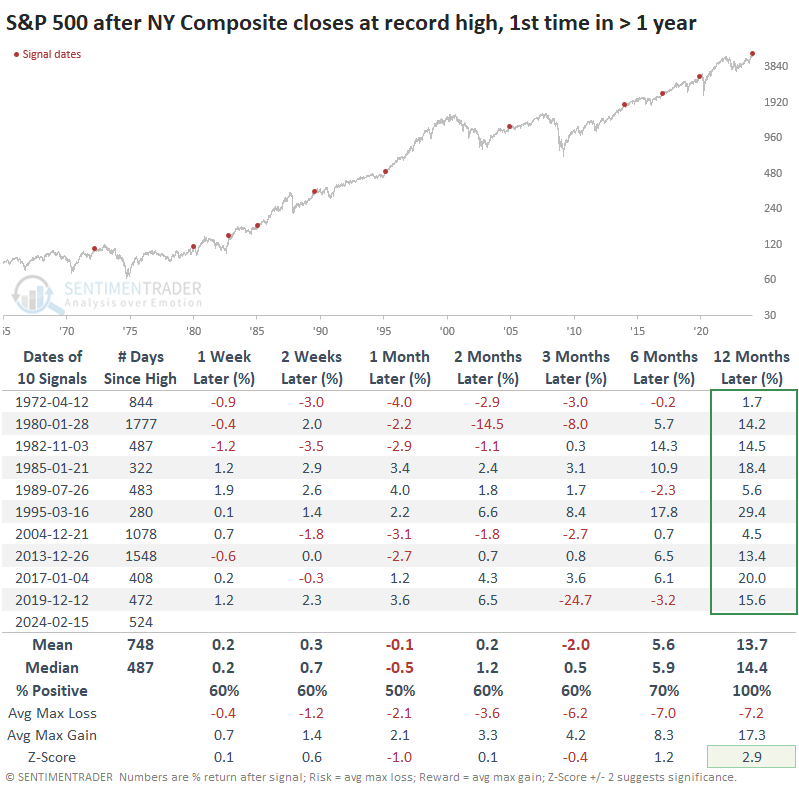
When the NYSE Composite hit a record, the S&P rallied over the next year
For the more widely benchmarked S&P 500, these record closes in the NY Composite led to similarly mediocre medium-term returns. Up to three months later, the S&P's median return was essentially flat, and its median maximum decline was nearly 50% larger than its median maximum loss. Over the next year, however, the S&P sported a gain every time, well above a random one-year return.
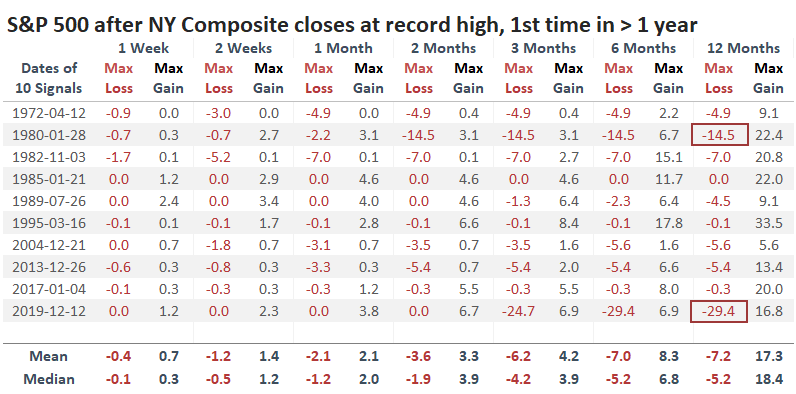
For the S&P, only two of the signals suffered more than a -10% drawdown at any point within the following year, and one of those was due to the pandemic panic. So, although its prospects were relatively dim over the ensuing months, its long-term returns were quite good and with relatively low risk.
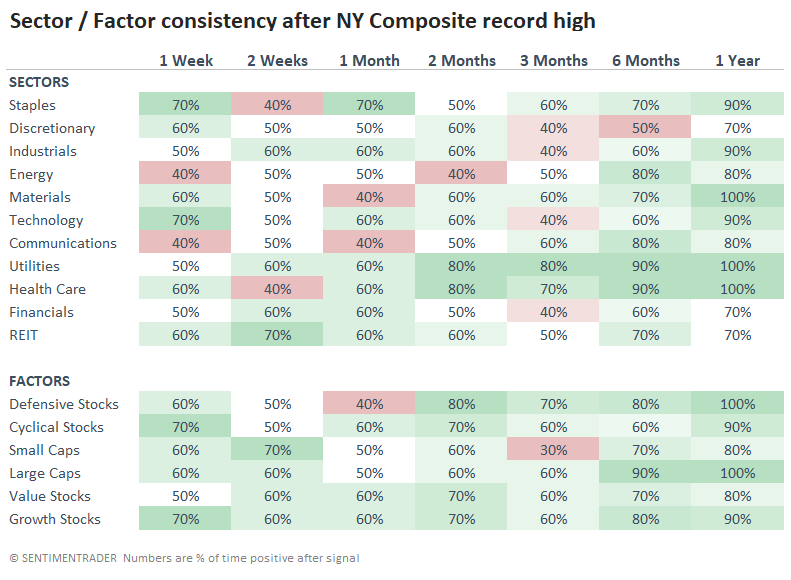
After broad market breakouts, a couple of defensive sectors held up well
Among sectors and factors, the best and most consistent returns include a couple of defensive sectors - utilities and health care. The latter's median return was a robust +24.5% over the following year.
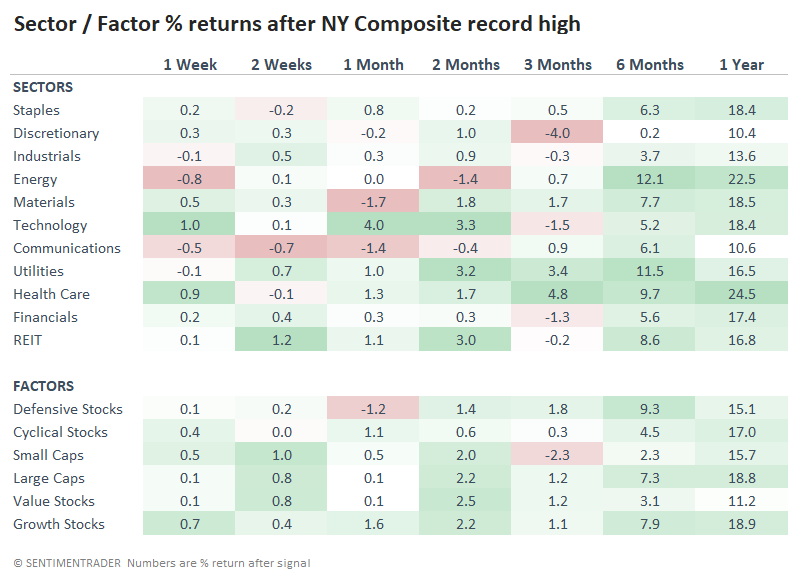
If we look at the percentage of time each of those was positive across time frames, we can see that those two sectors were positive 80% of the time (or just about) from two to twelve months later and were positive a year later after every signal.
What the research tells us...
There have been some concerning technical signals in recent weeks, especially on the Nasdaq. More and more, we had seen evidence of a split market, with many winners and losers at the same time. While not a foolproof signal, these types of conditions have a nasty habit of preceding poor returns over the following weeks and even months.
The rebound last week in many stocks helped to alleviate those conditions somewhat, and it propelled some broader indexes to record highs. While that does tend to be a good long-term sign of confidence in stocks, over the medium term, there has been more of a tendency to see some backing-and-filling. Combined with the earlier warnings, it suggests we're facing higher risk now than we have in quite a while.
Indicators at Extremes
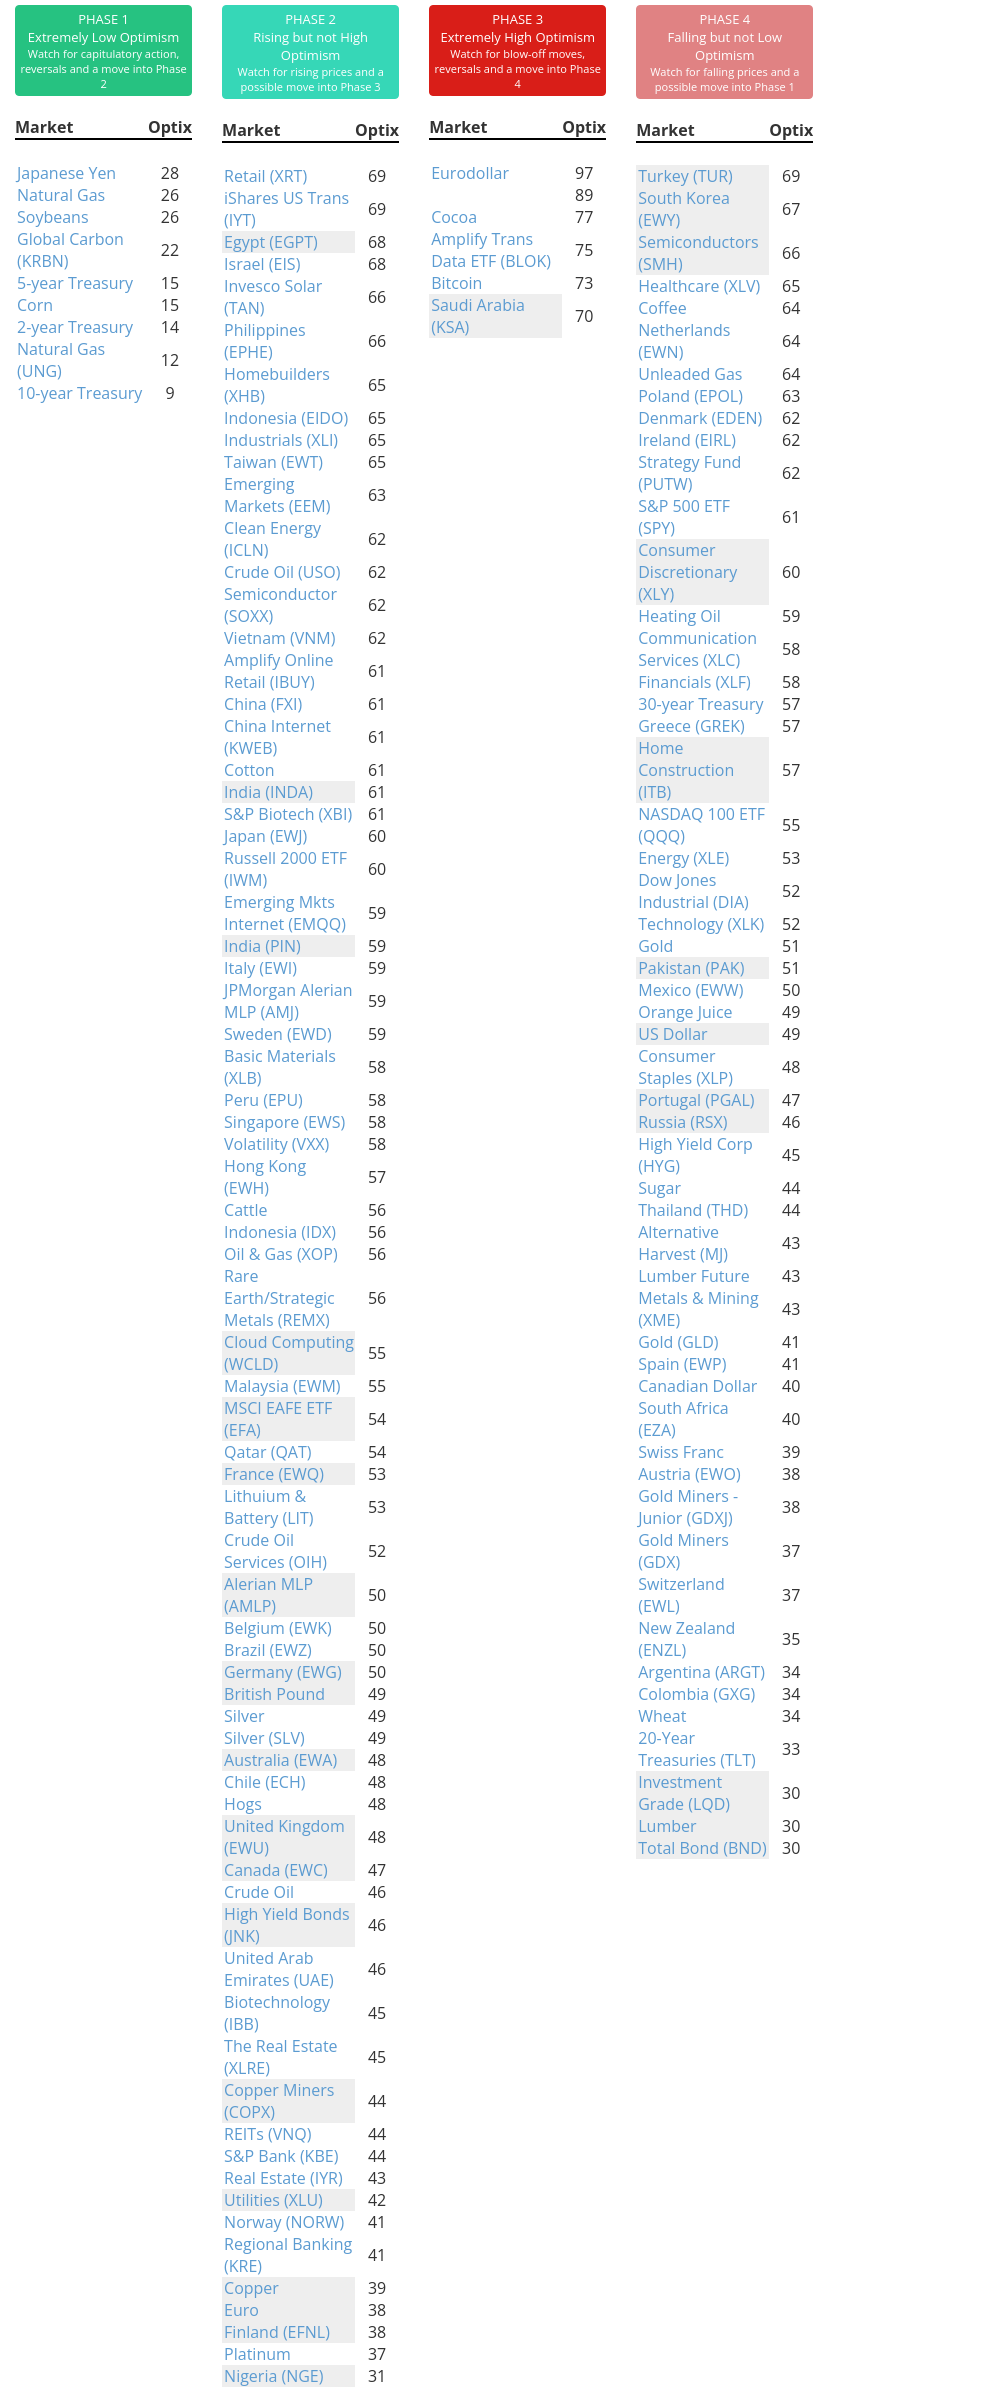
Phase Table
Ranks
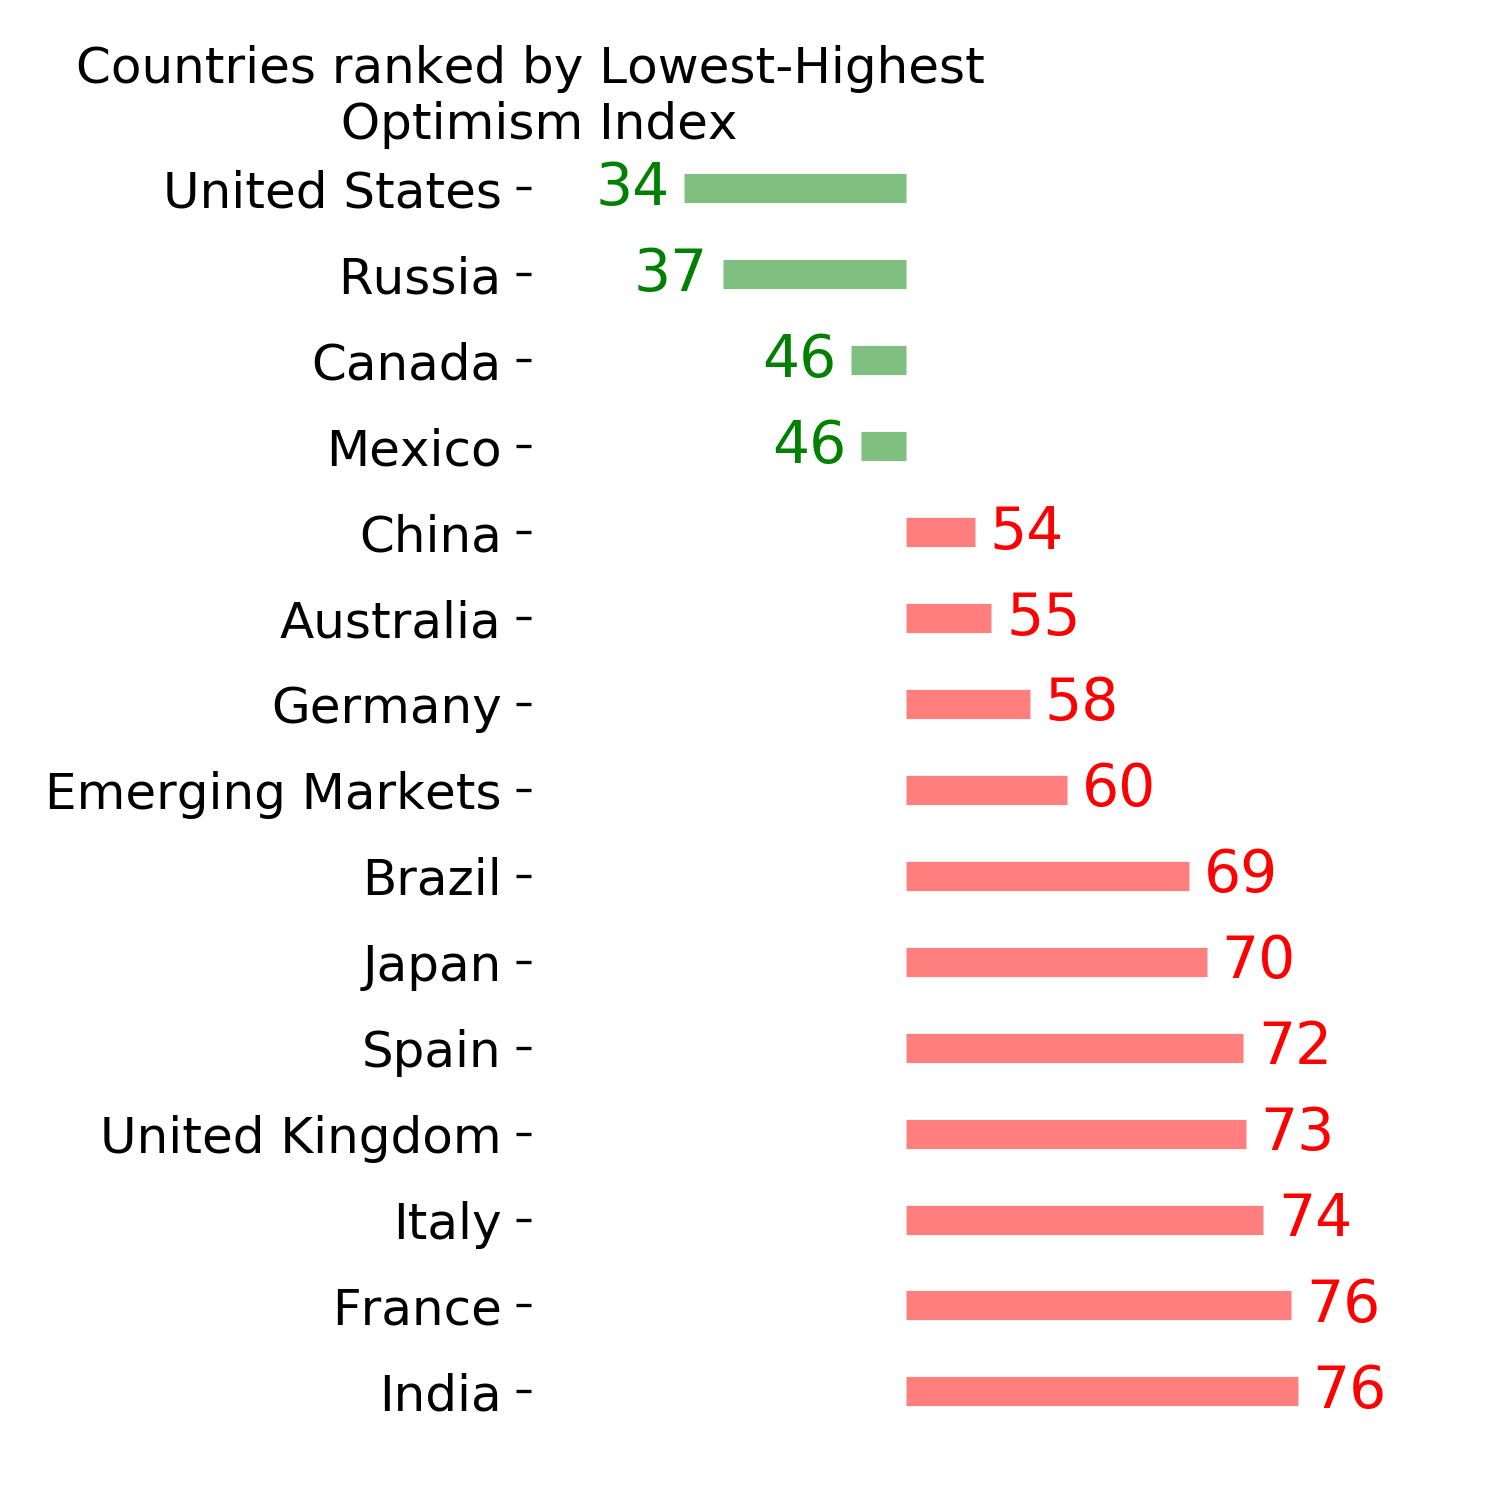
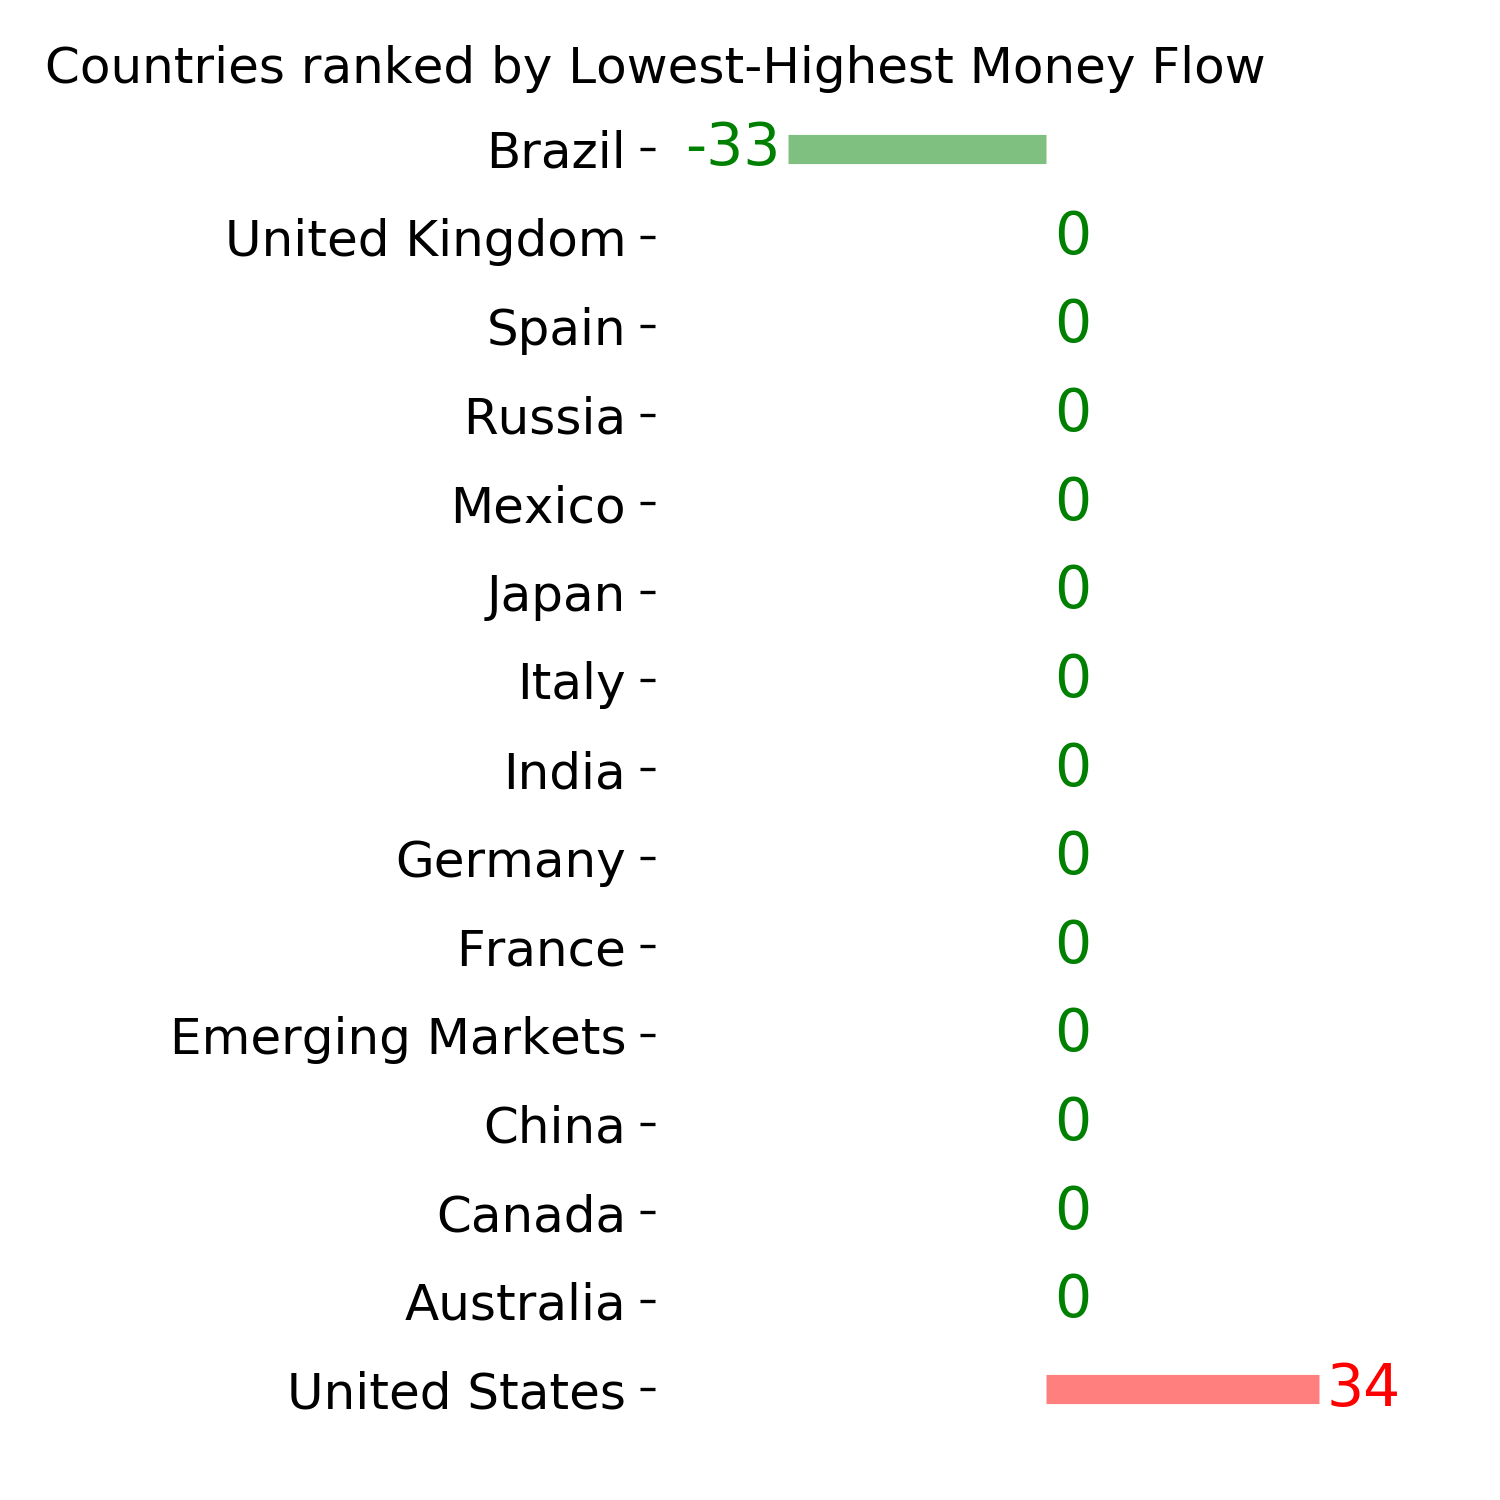
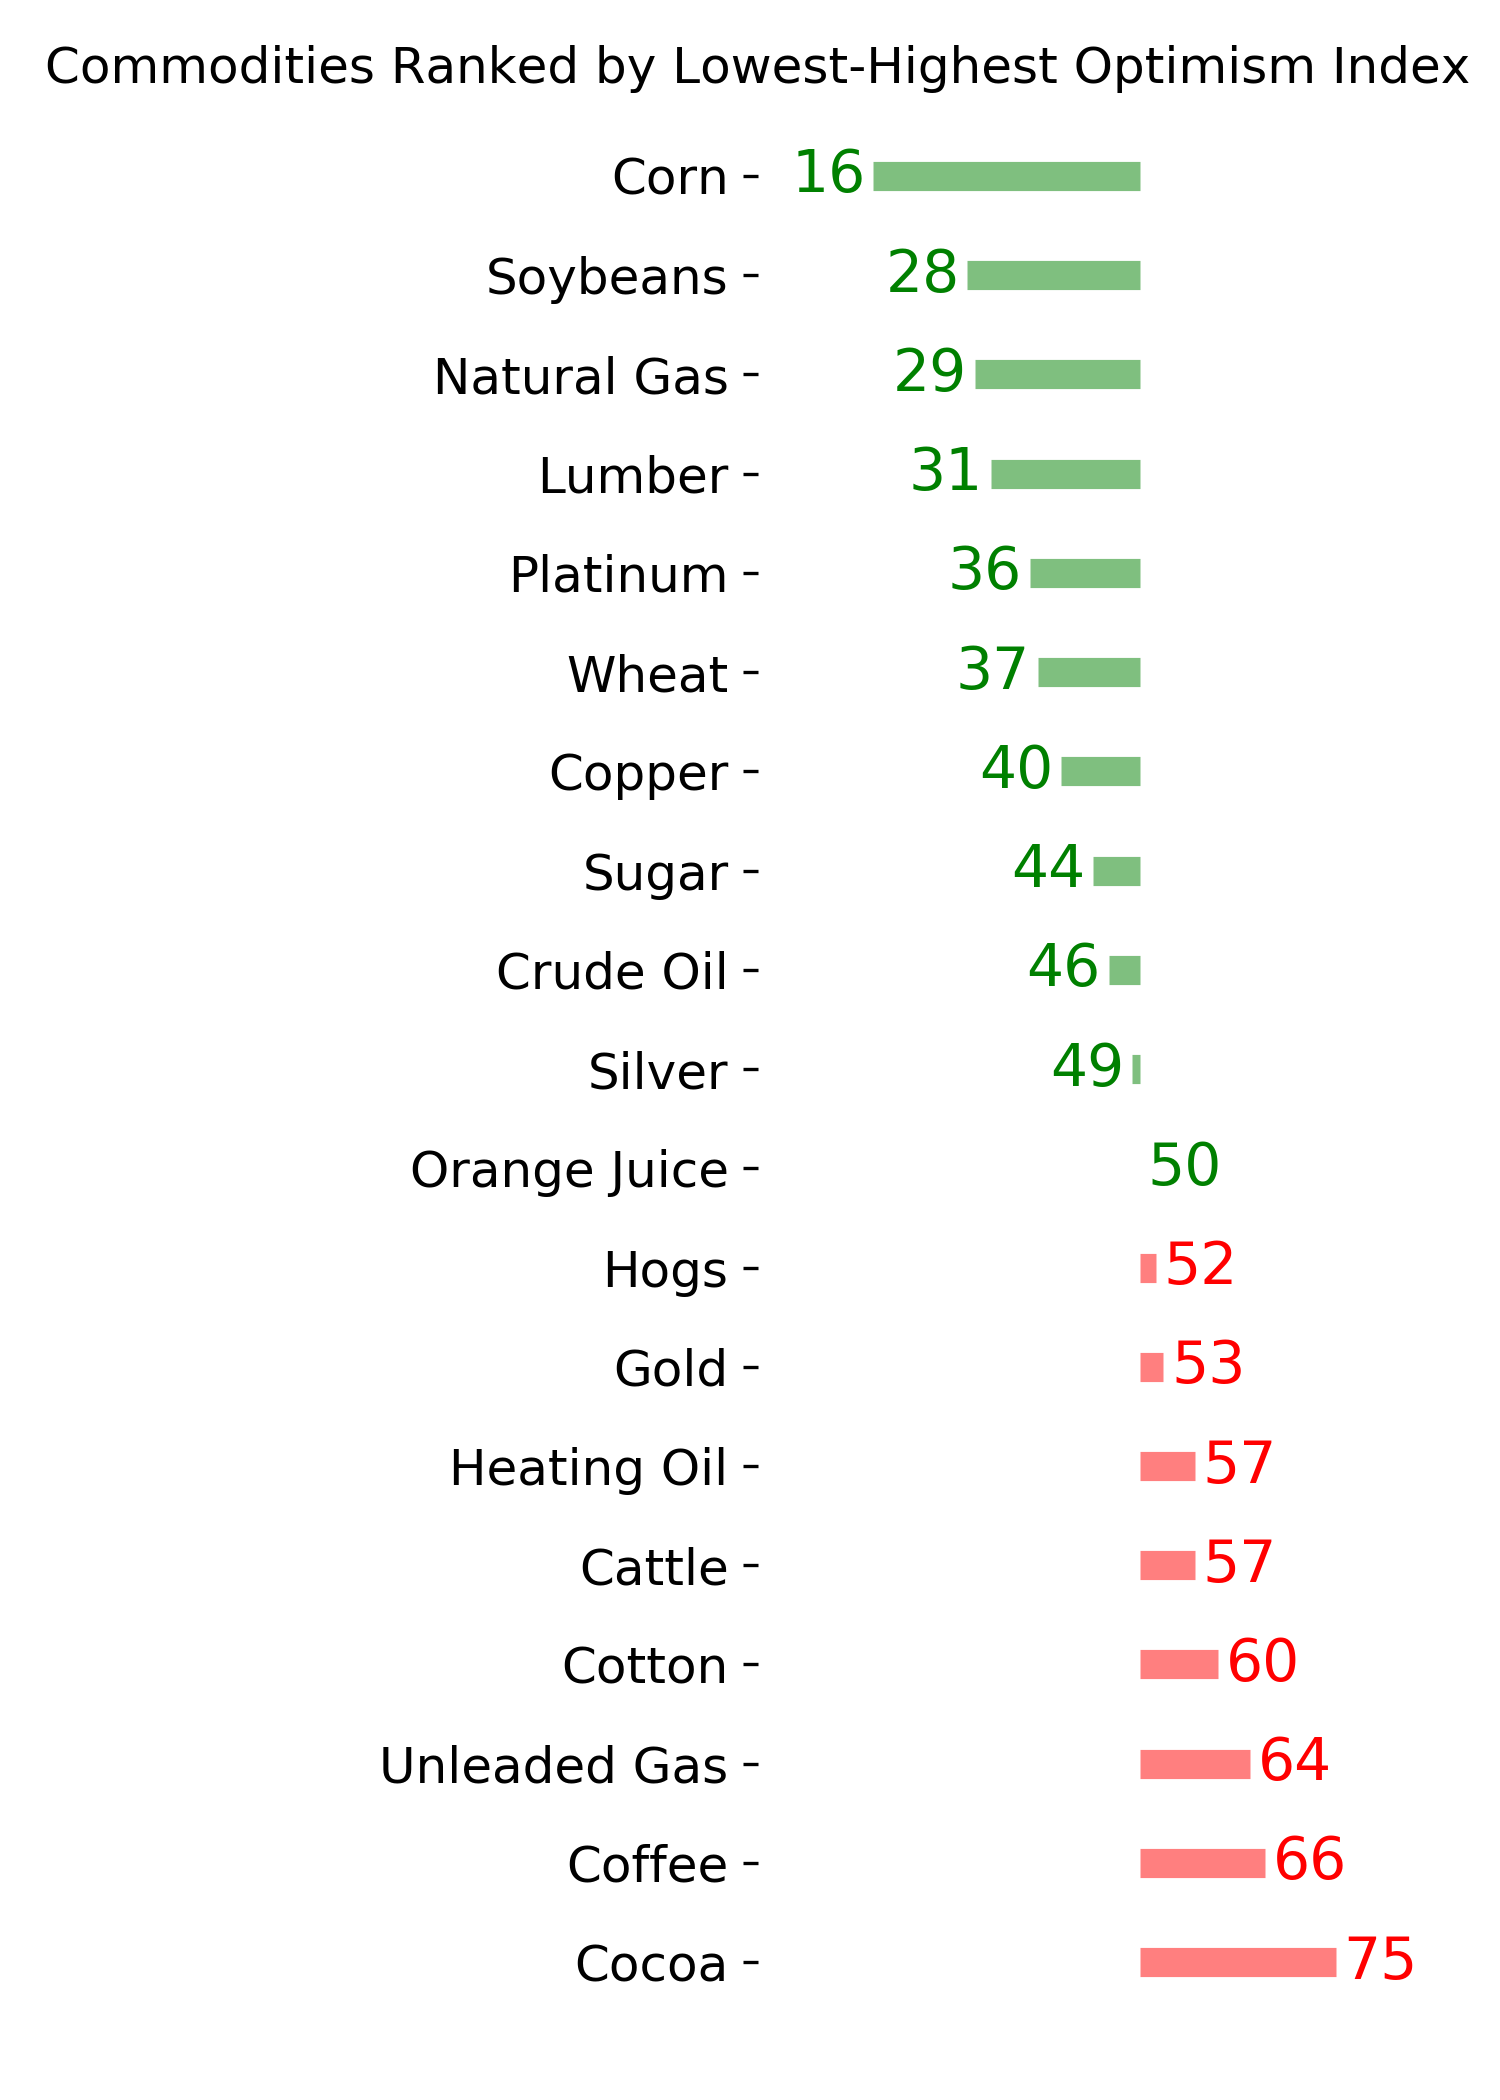
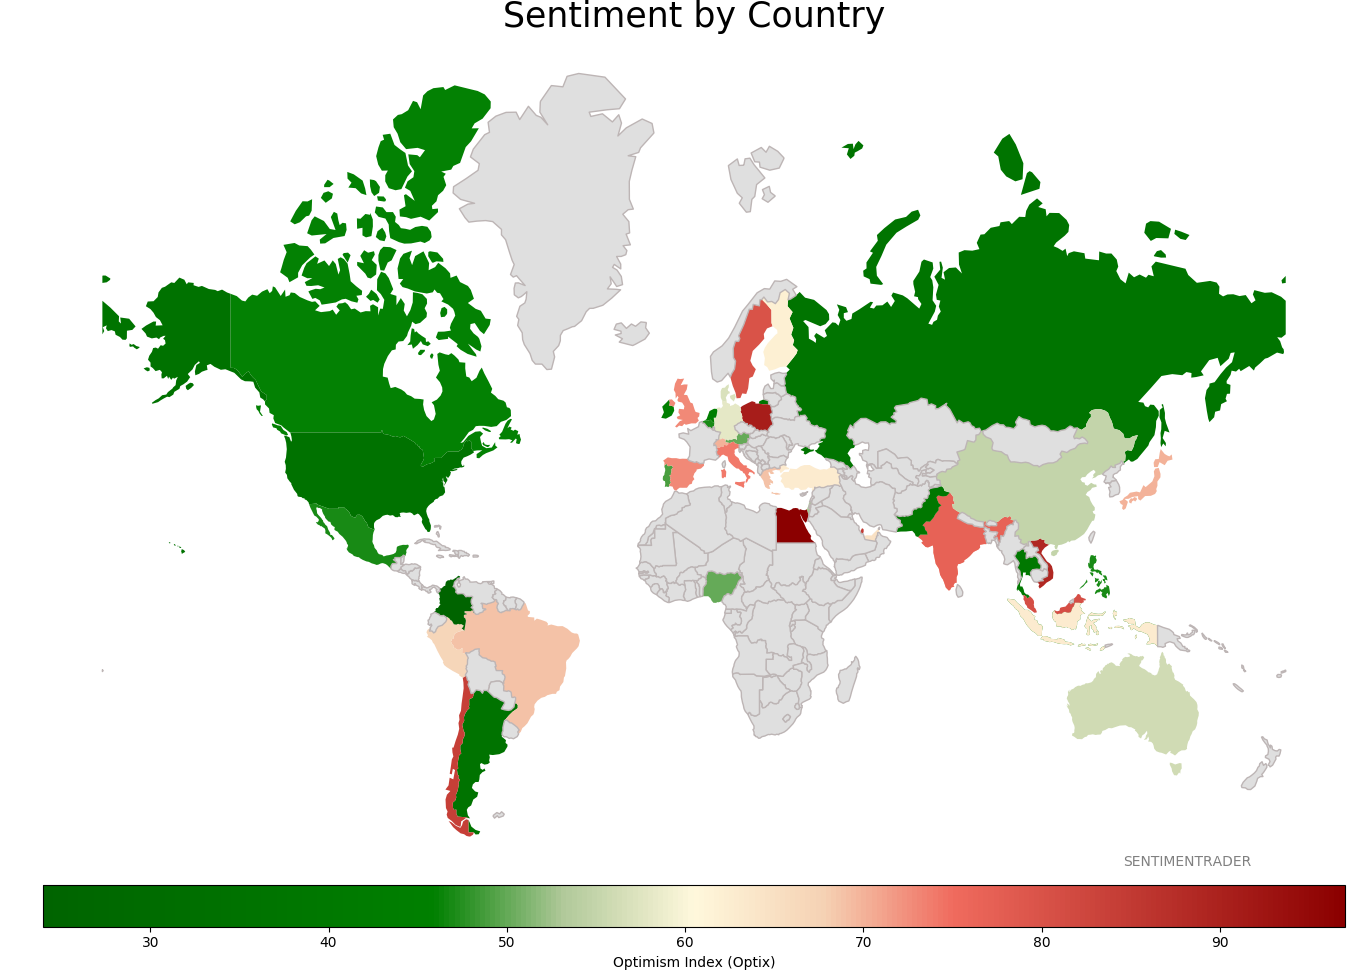
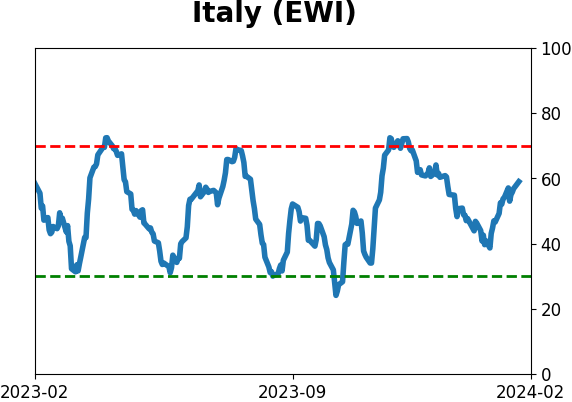
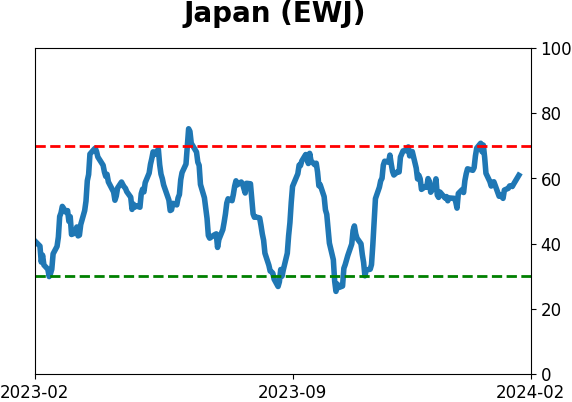
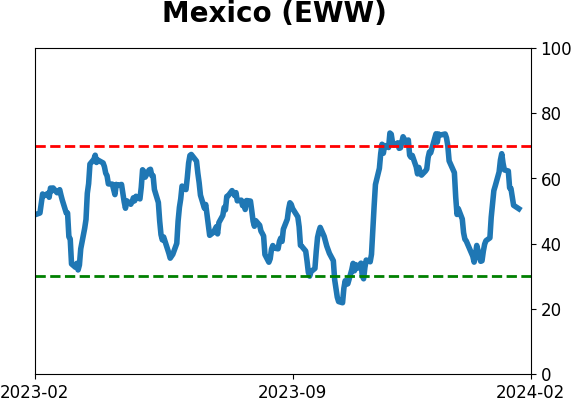
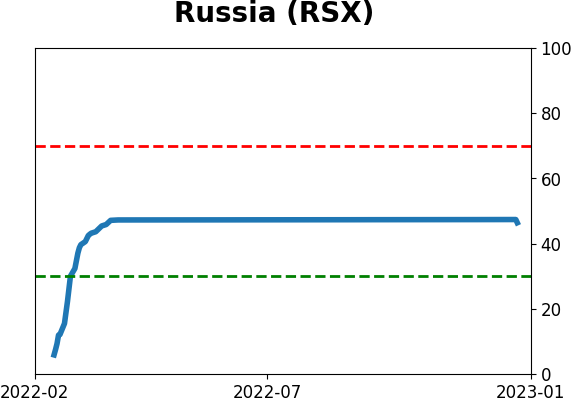
Sentiment Around The World
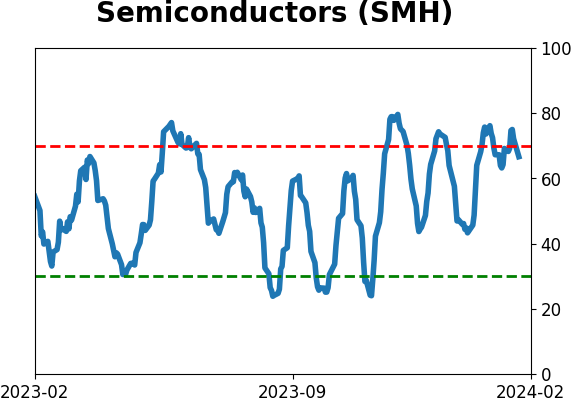
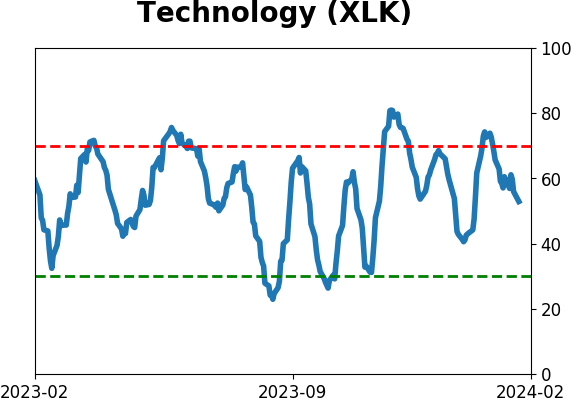
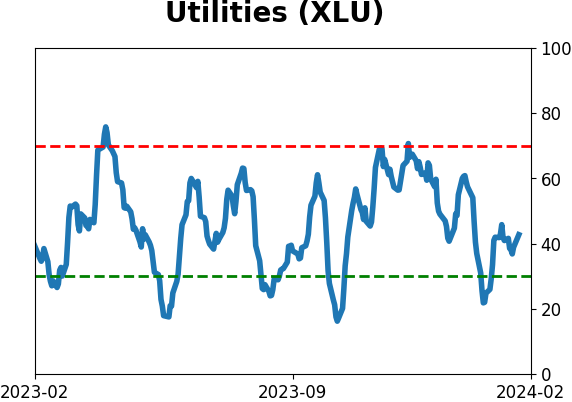
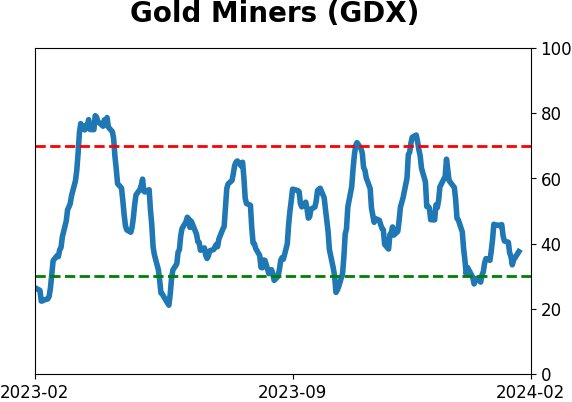
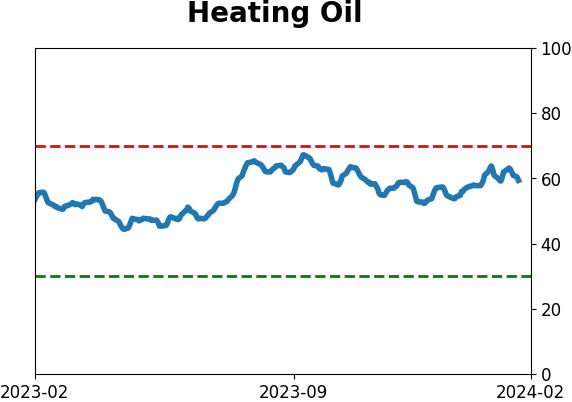
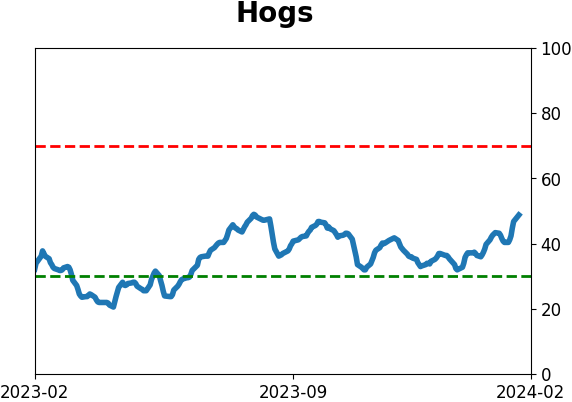
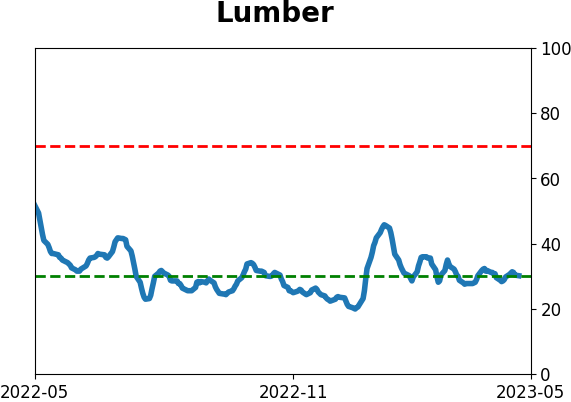
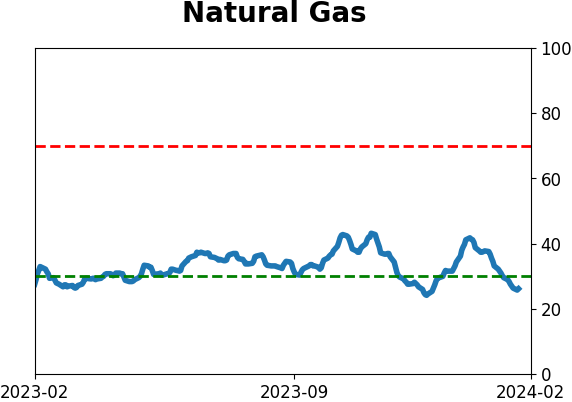
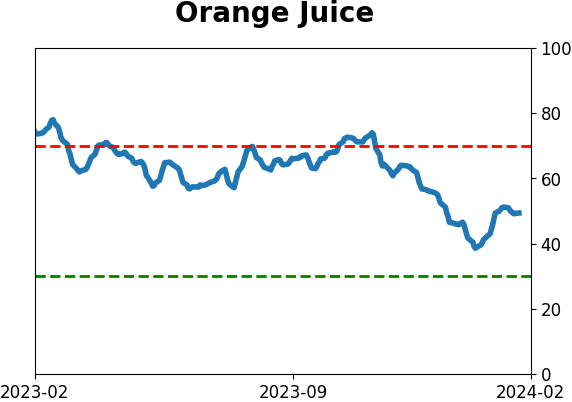
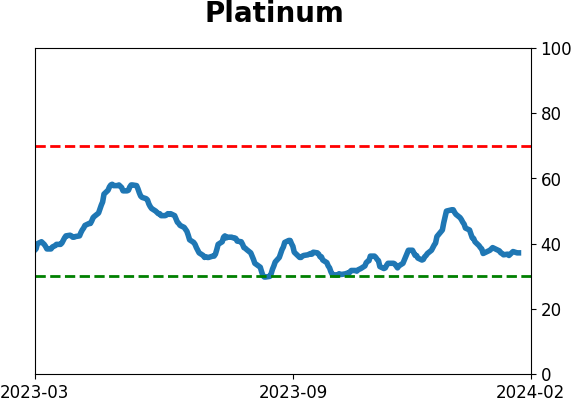
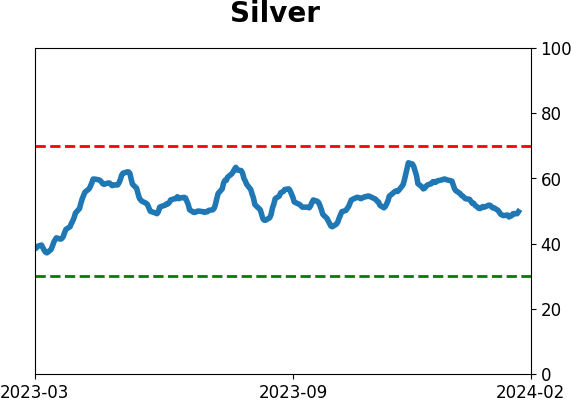
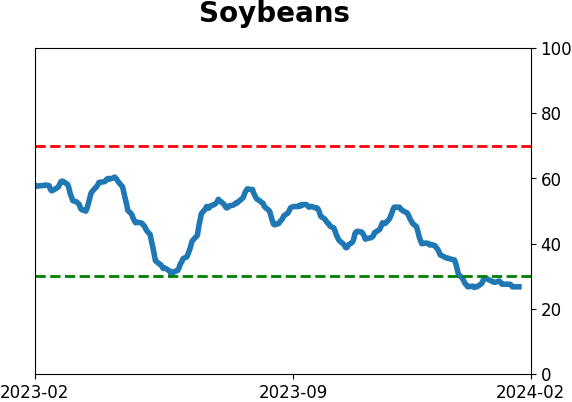
Optimism Index Thumbnails
|
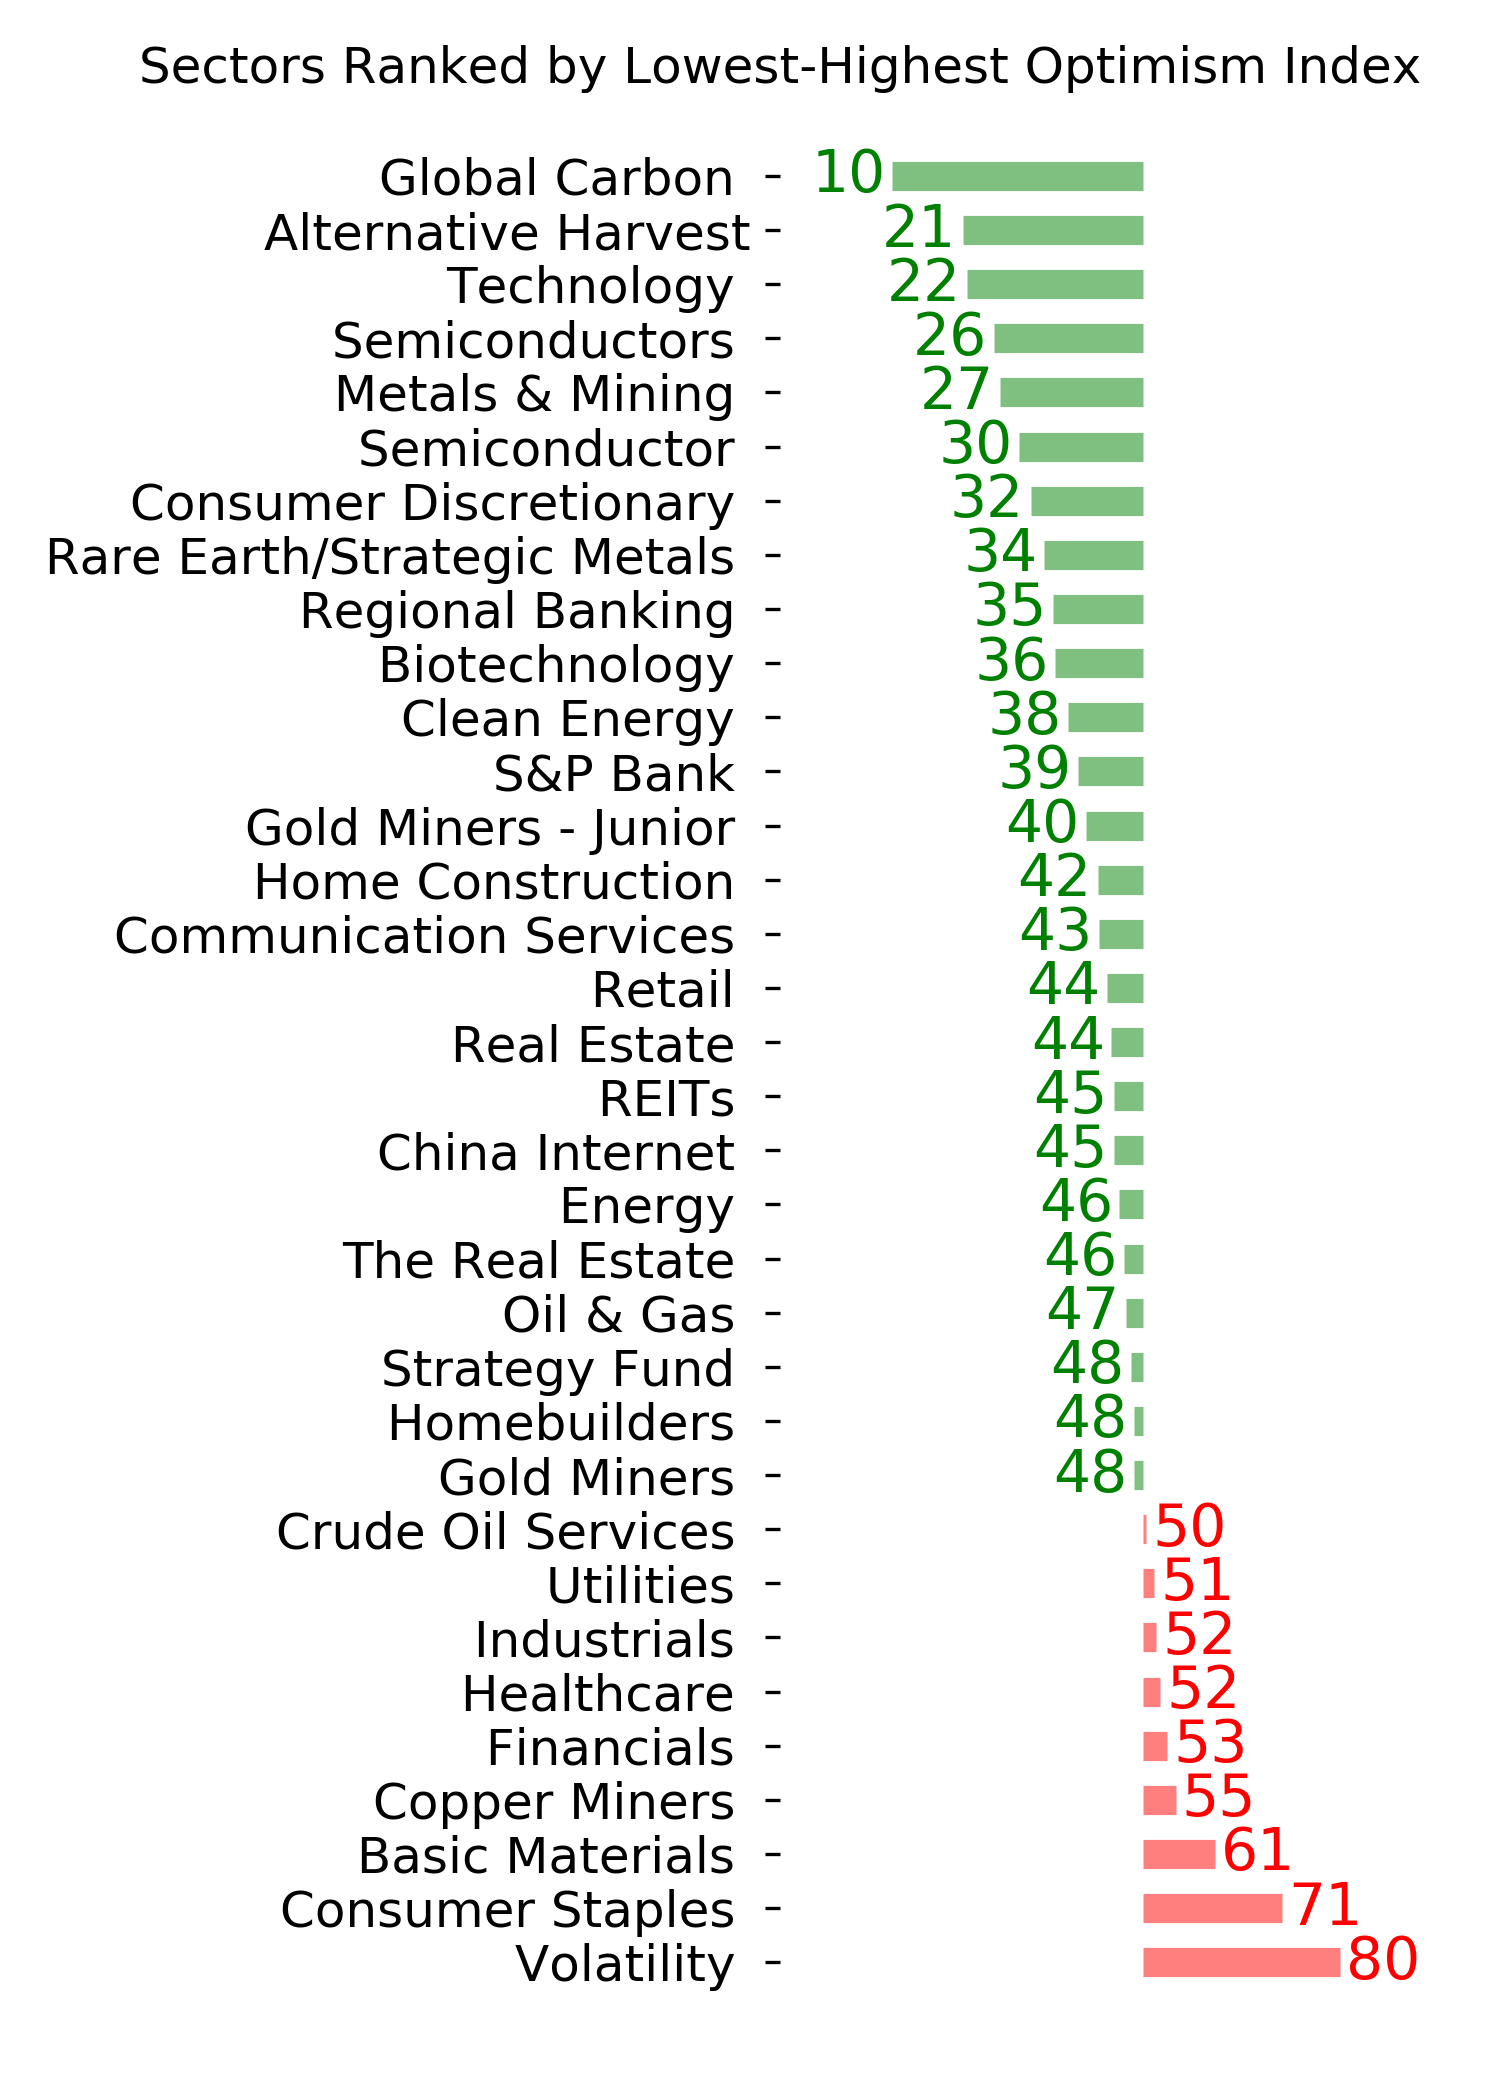
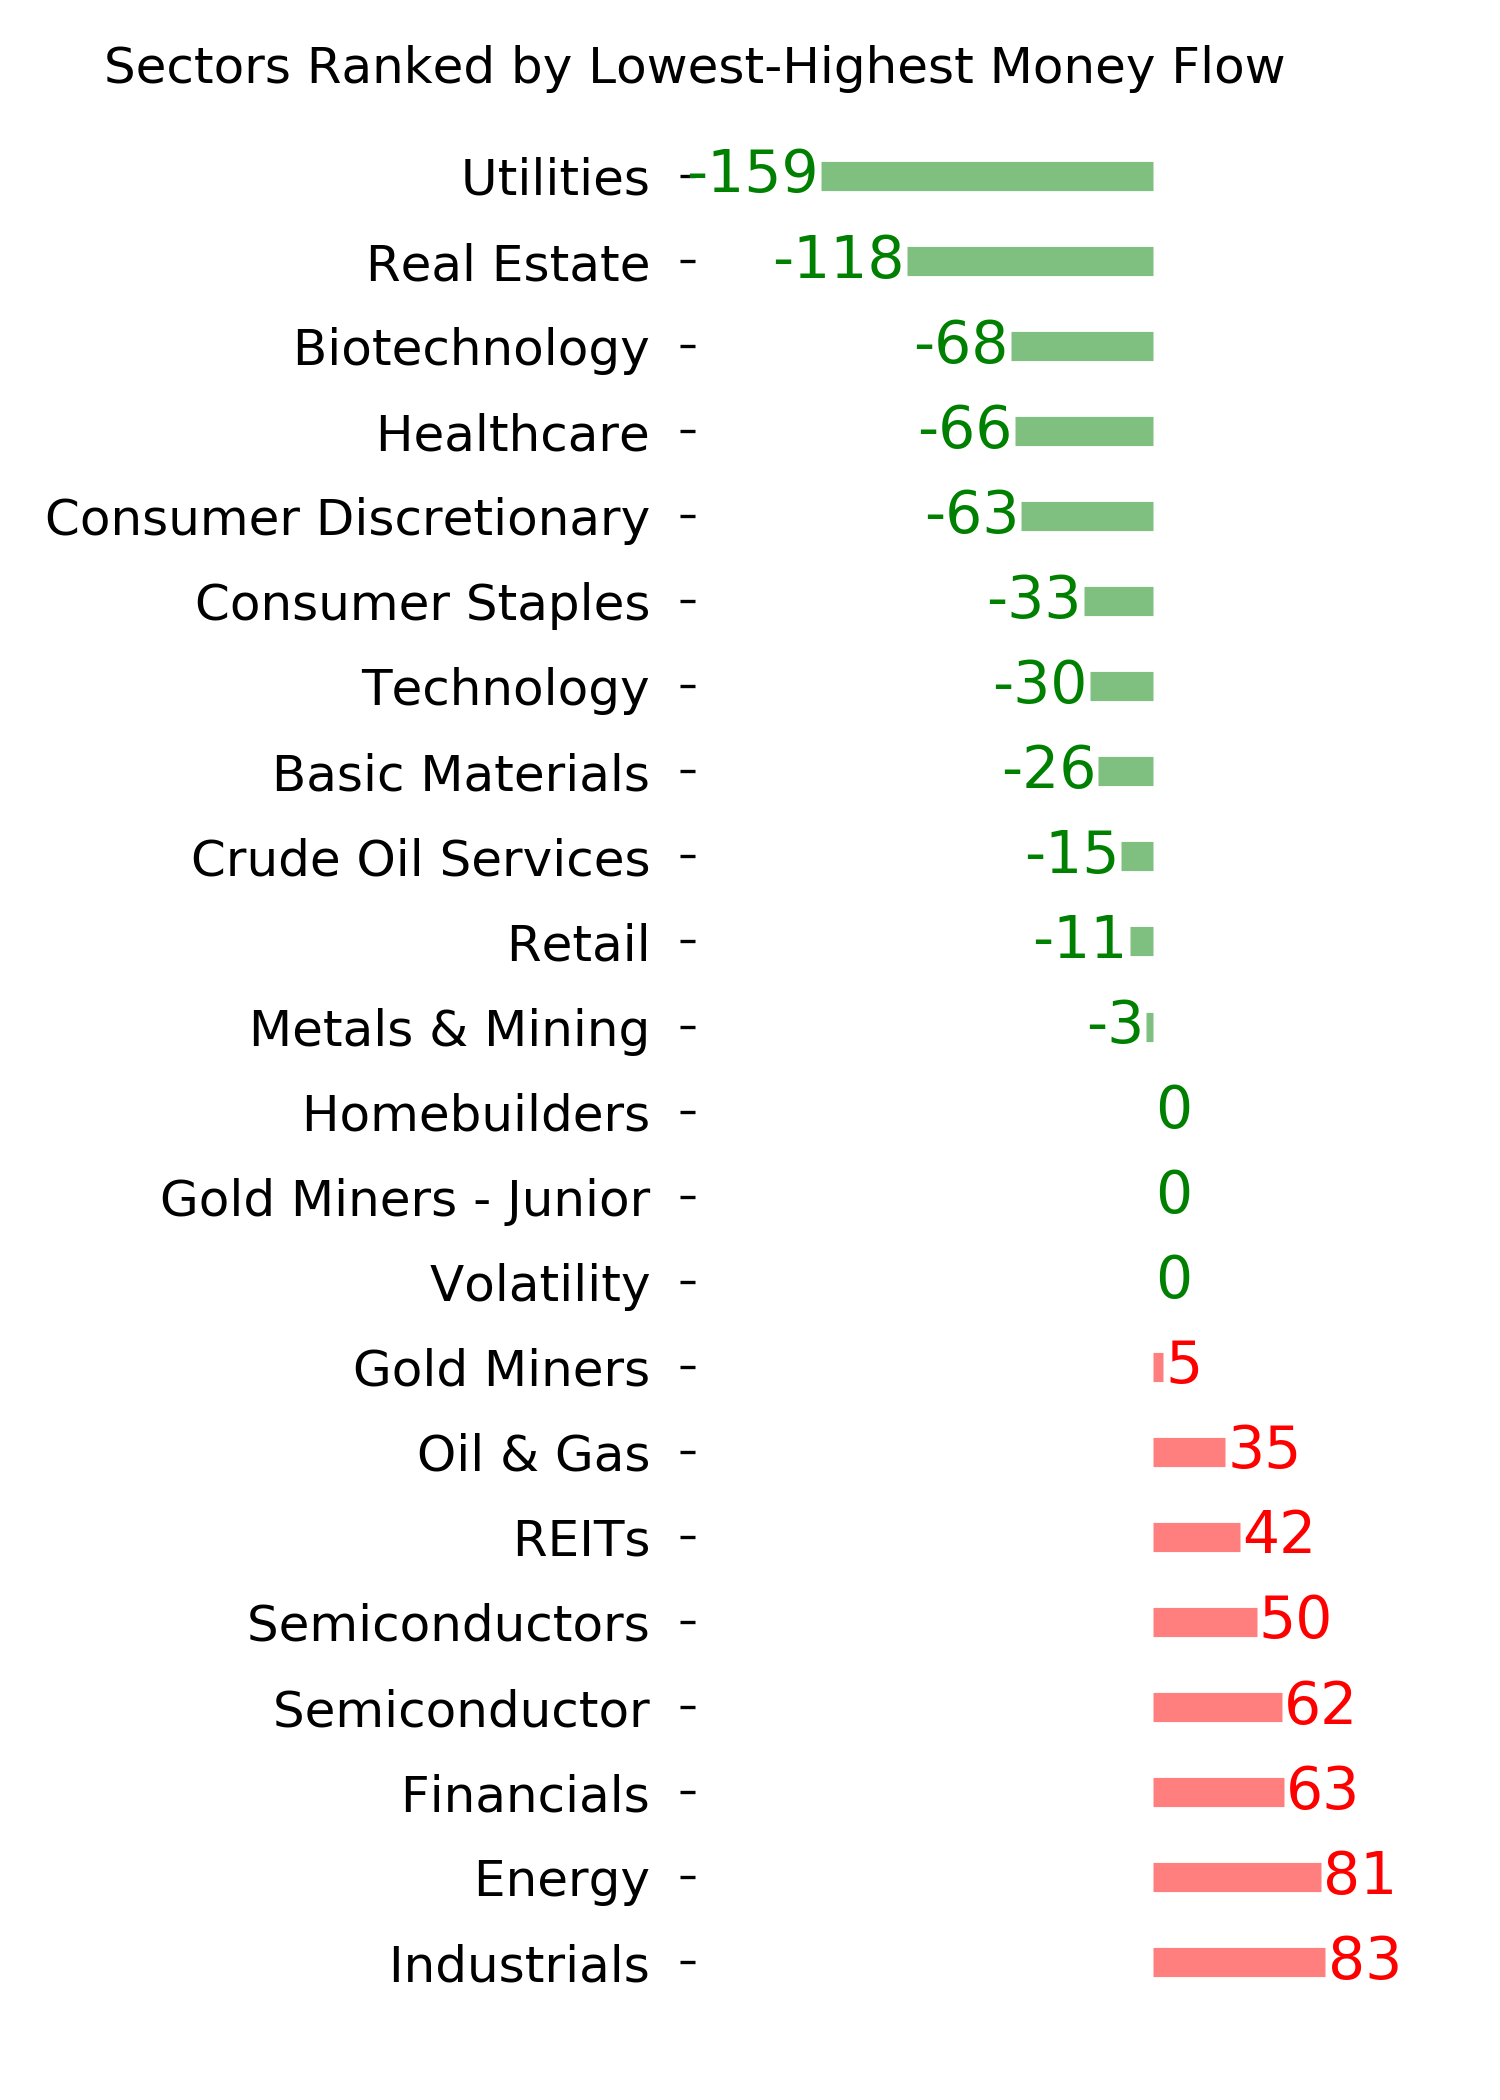
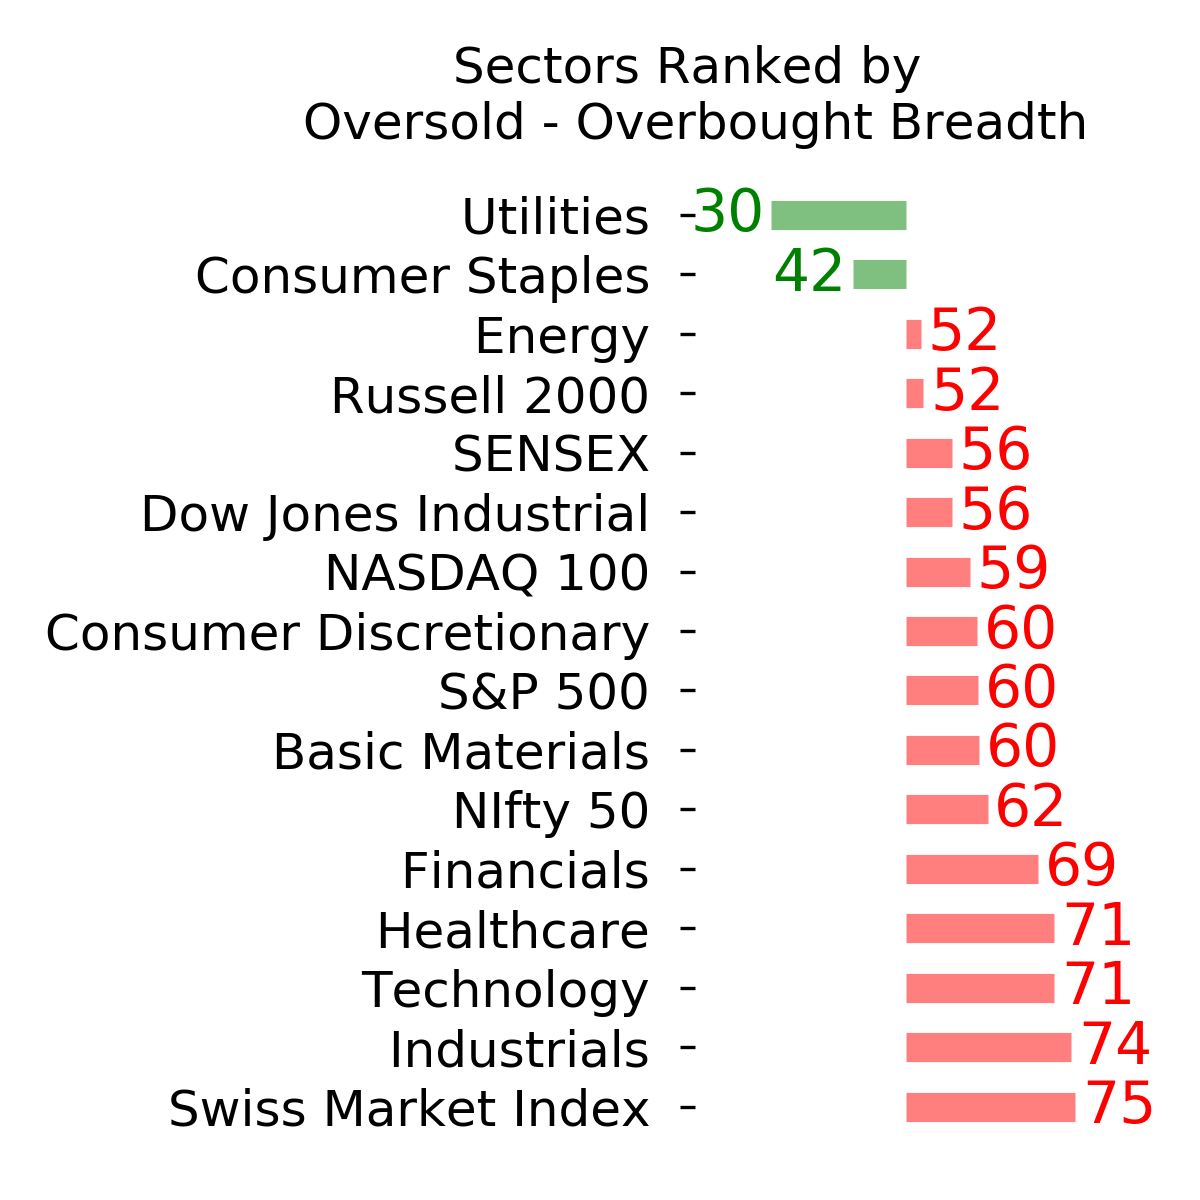
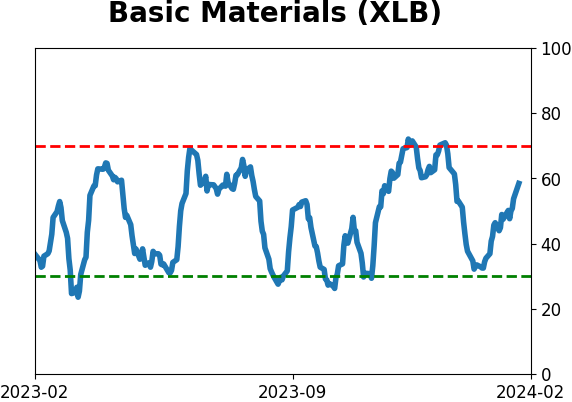
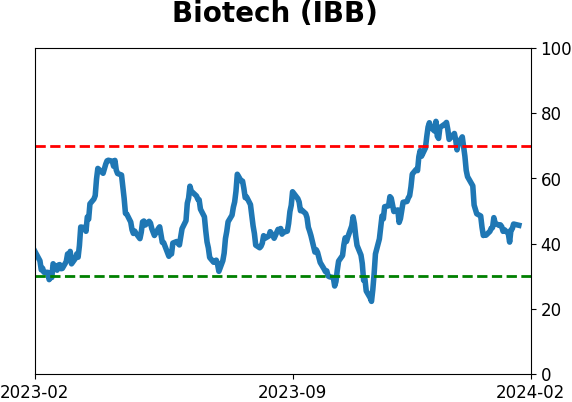
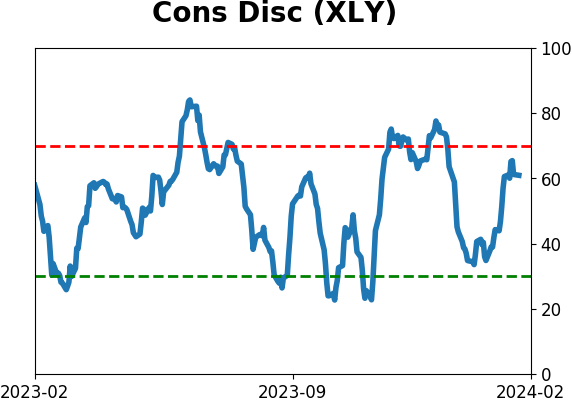
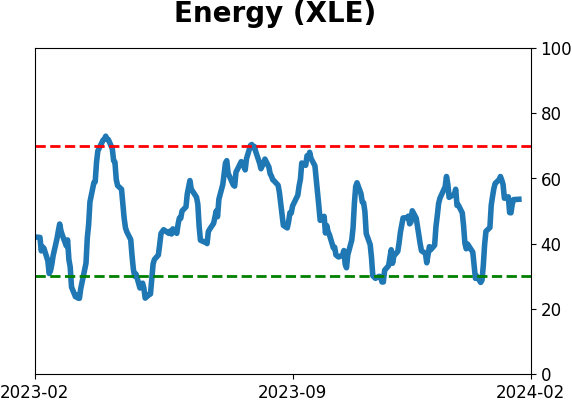
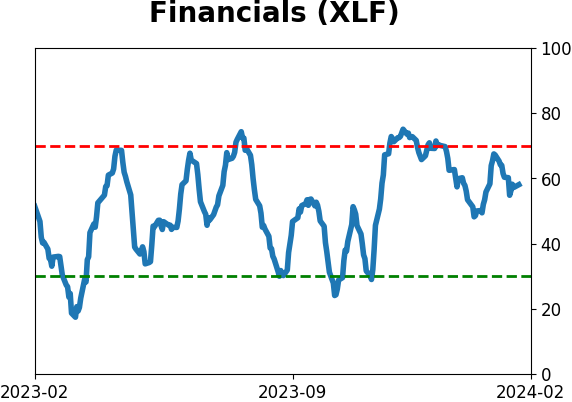
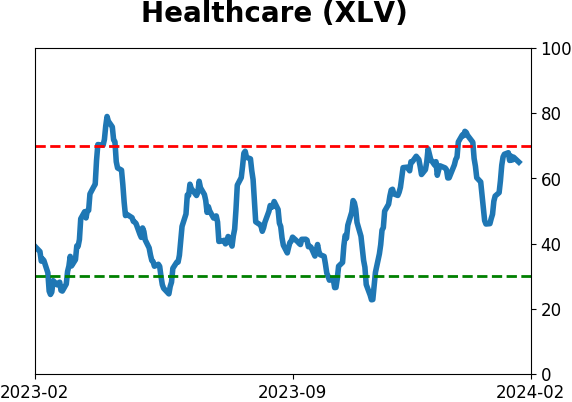
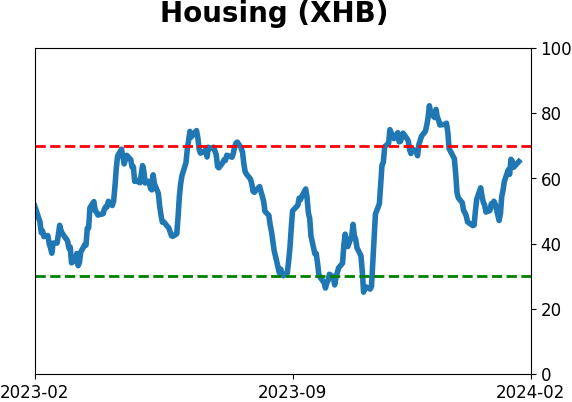
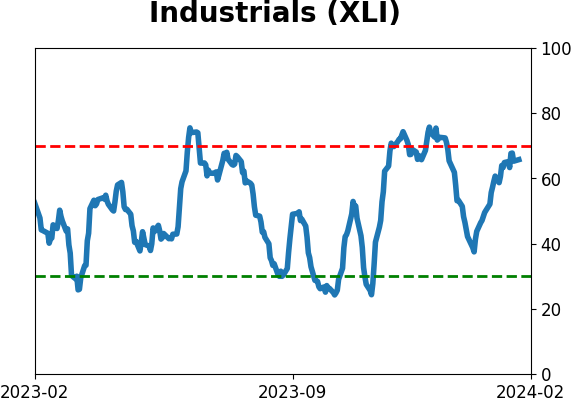
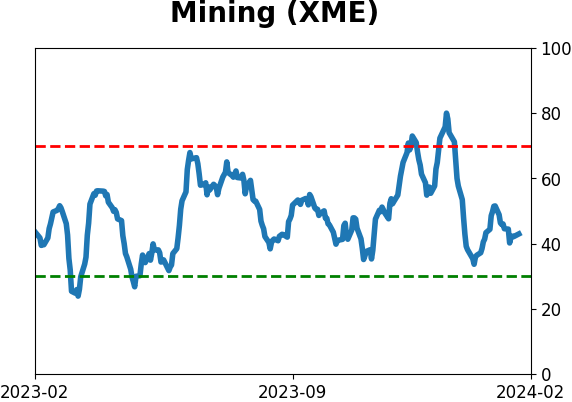
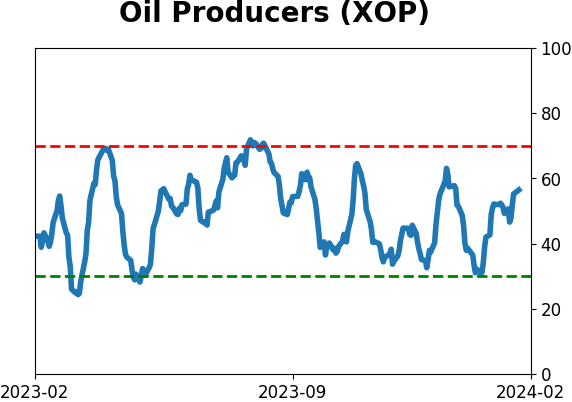
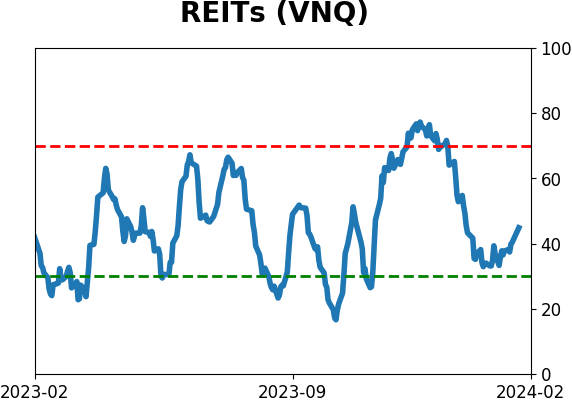
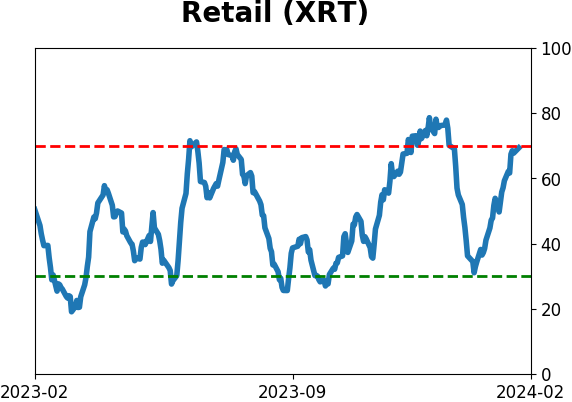
Sector ETF's - 10-Day Moving Average
|
|
|
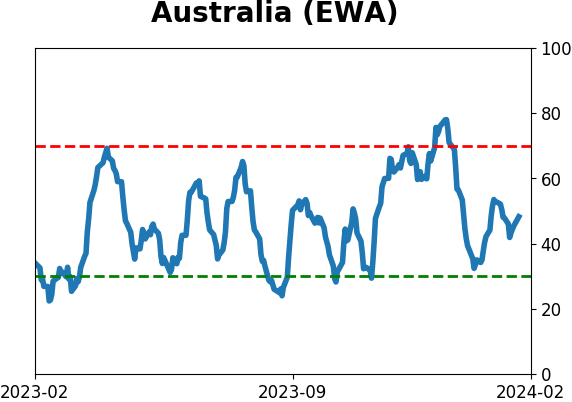
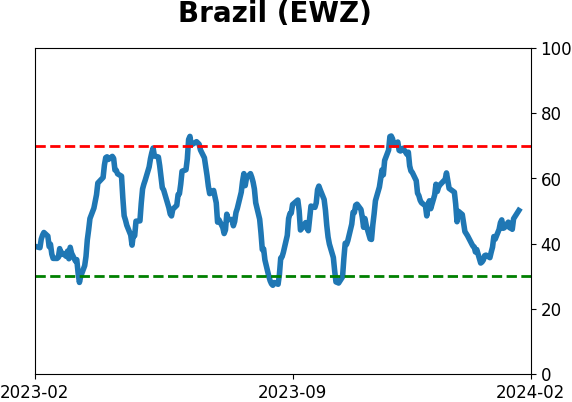
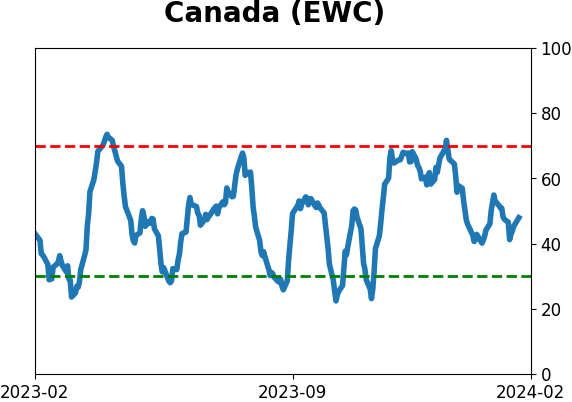
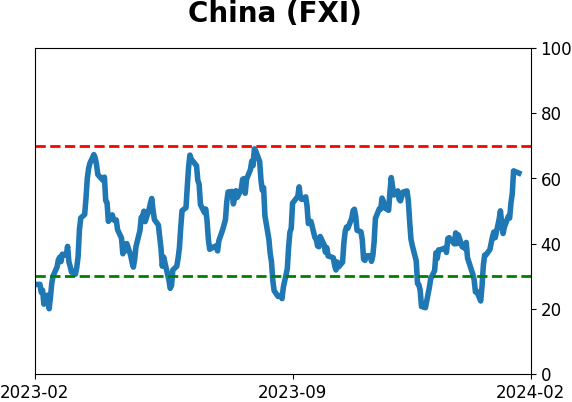
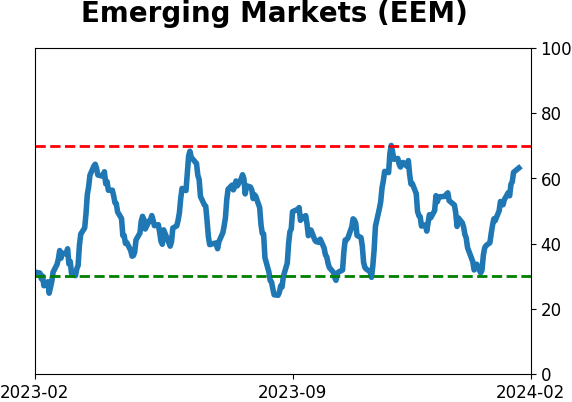
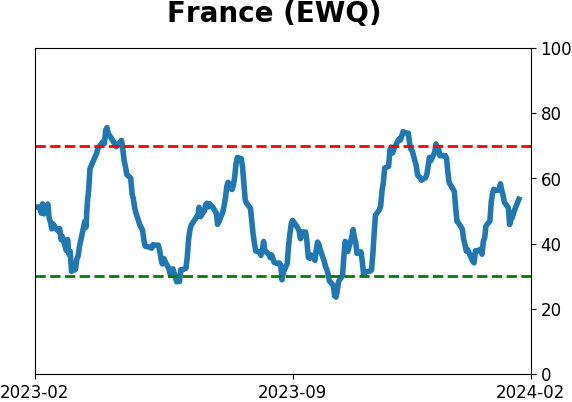
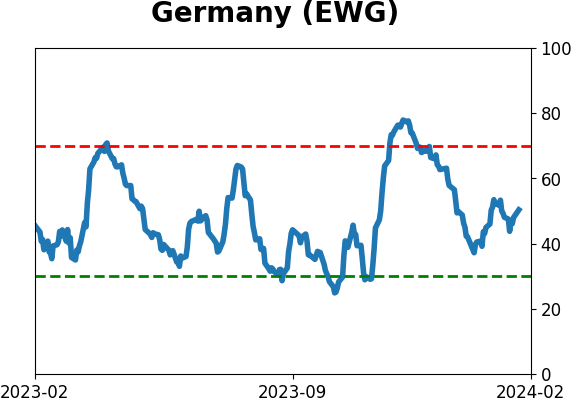
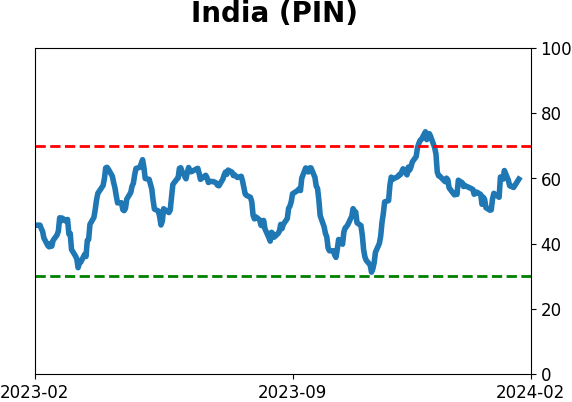
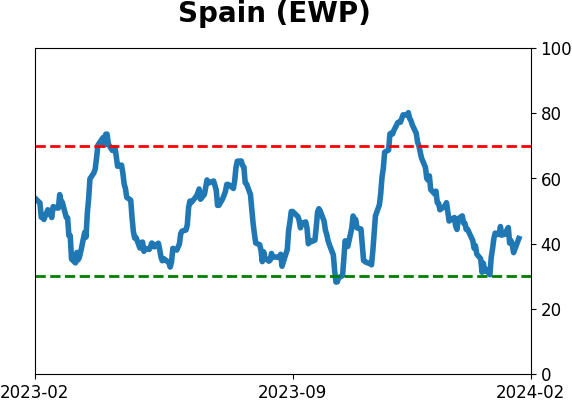
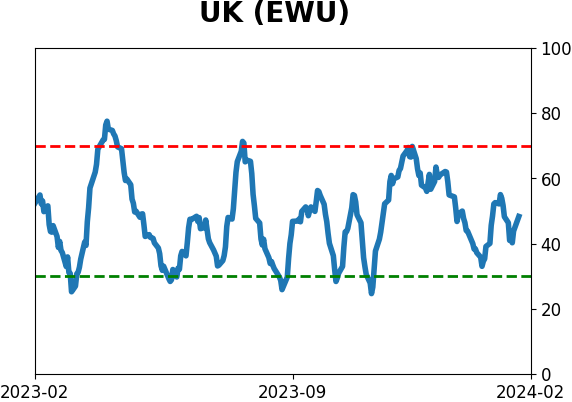
Country ETF's - 10-Day Moving Average
|
|
|
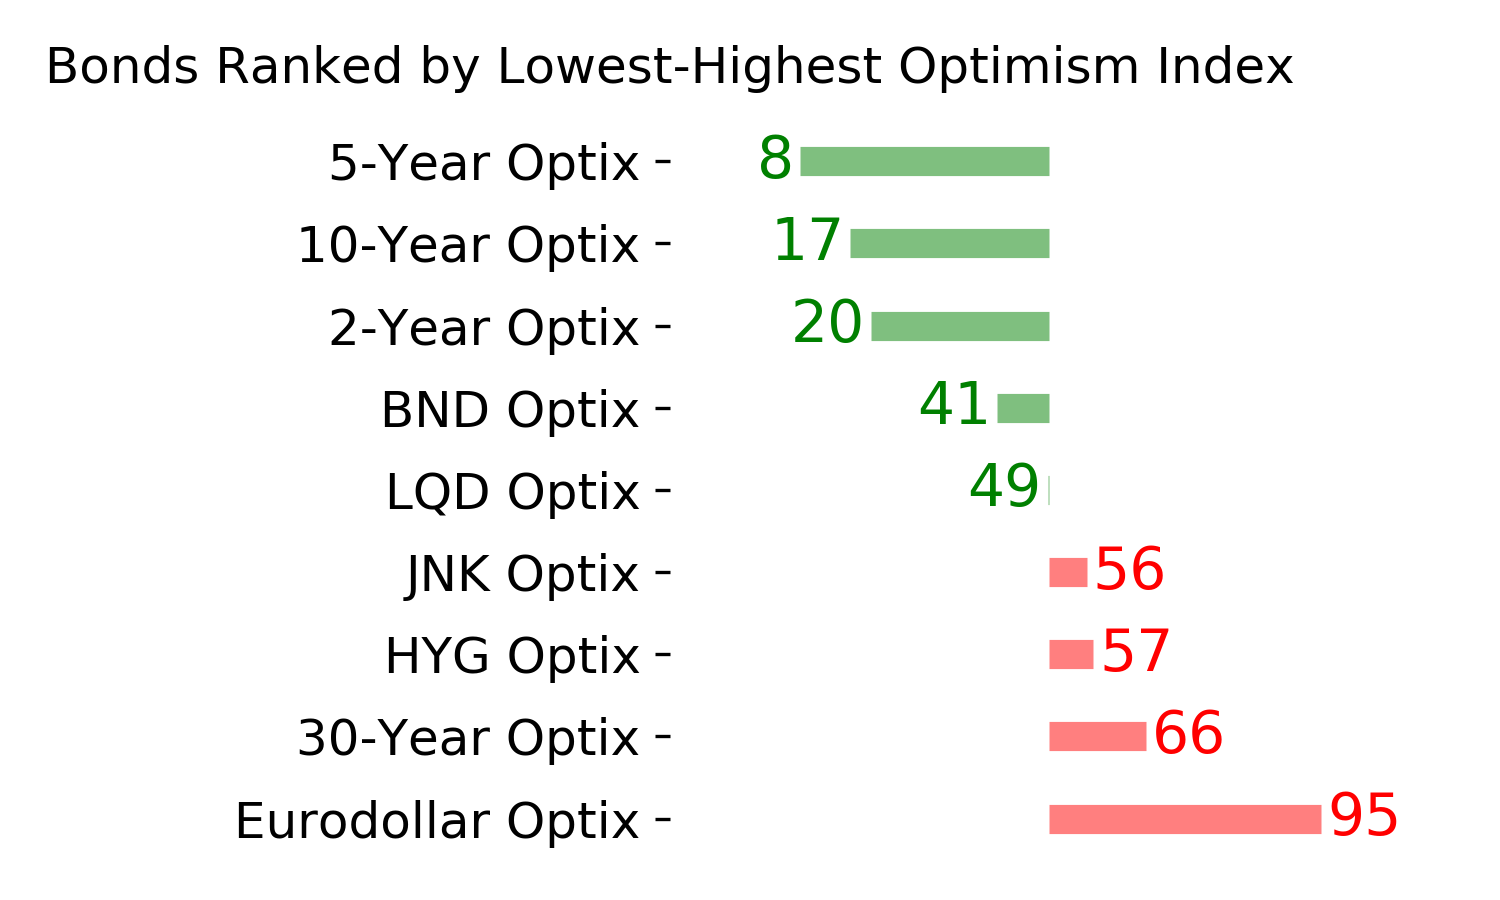
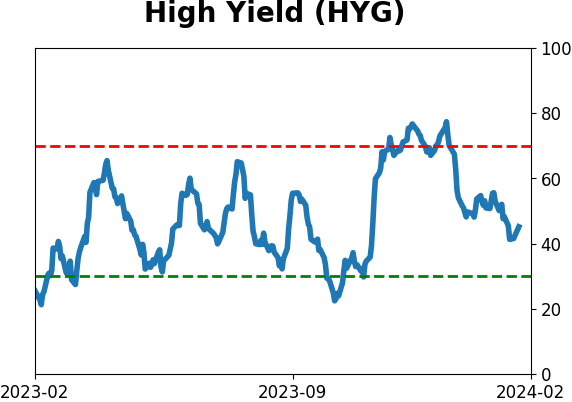
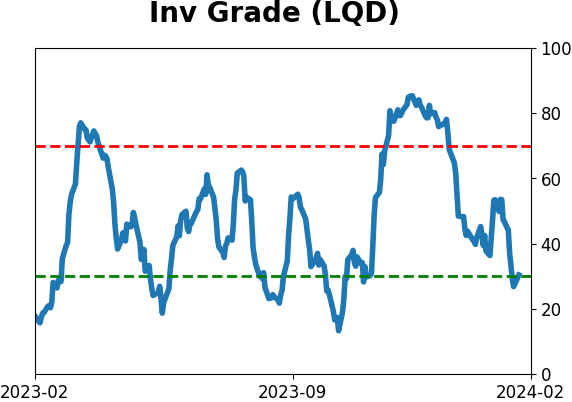
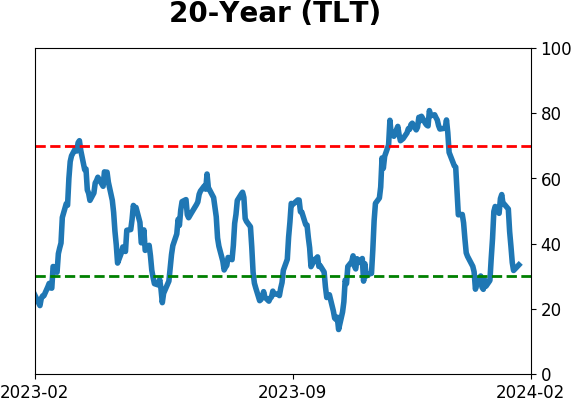
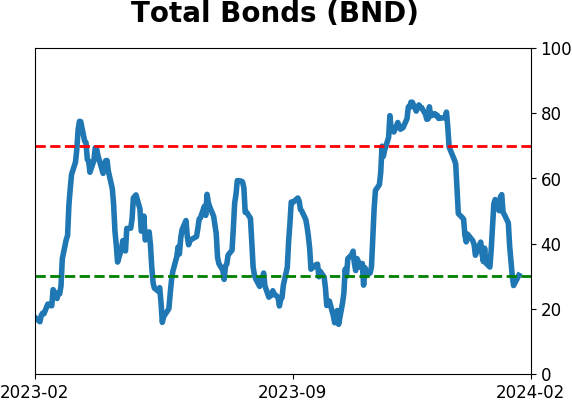
Bond ETF's - 10-Day Moving Average
|
|
|
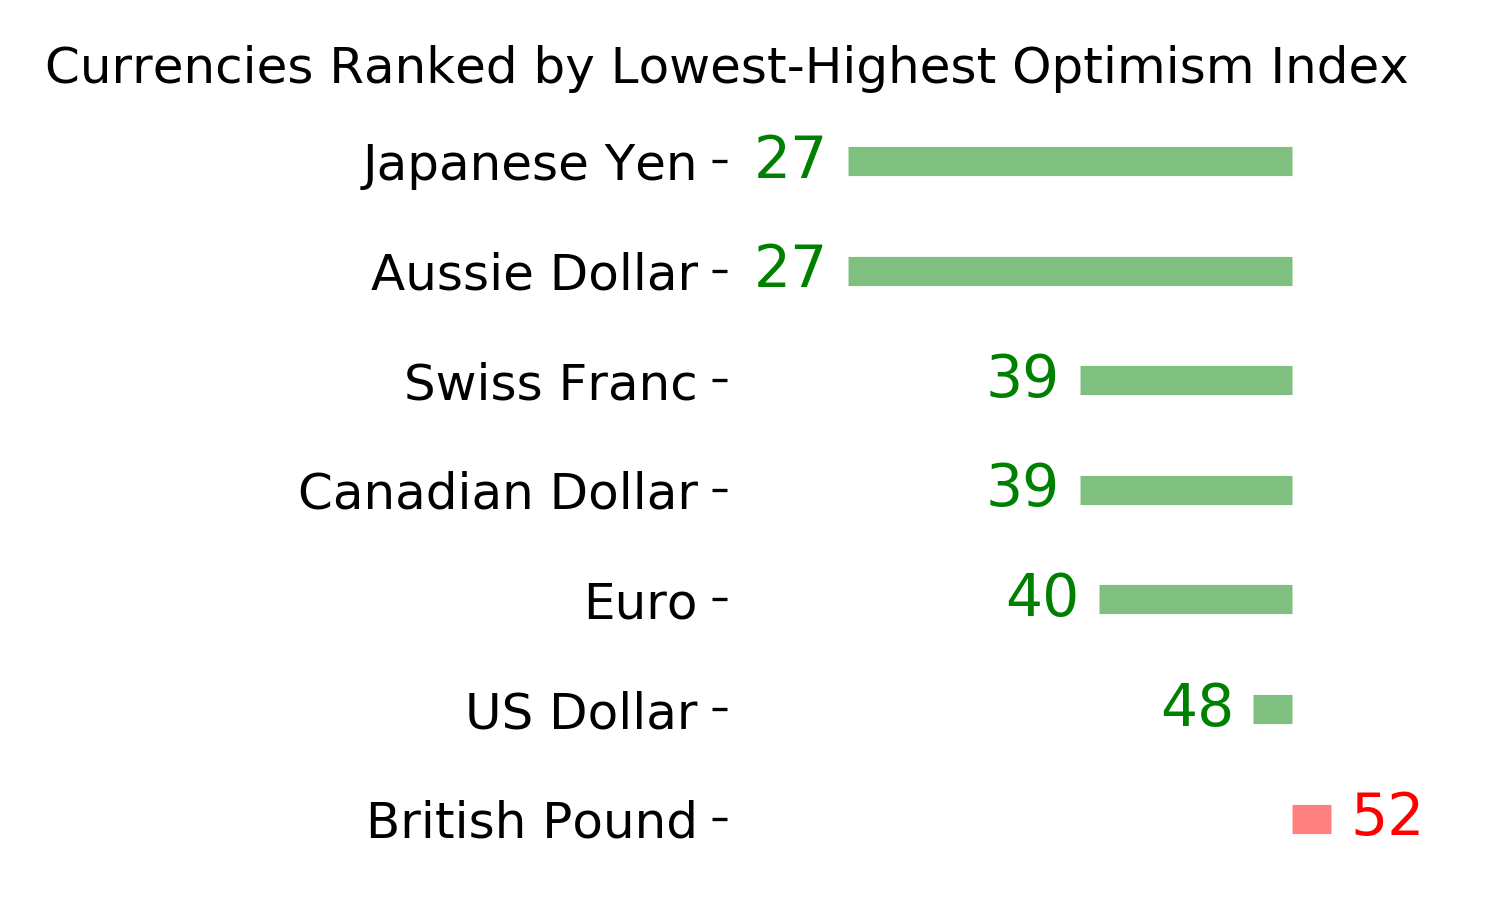
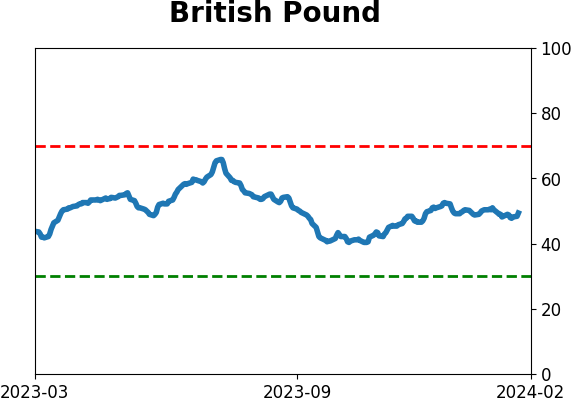
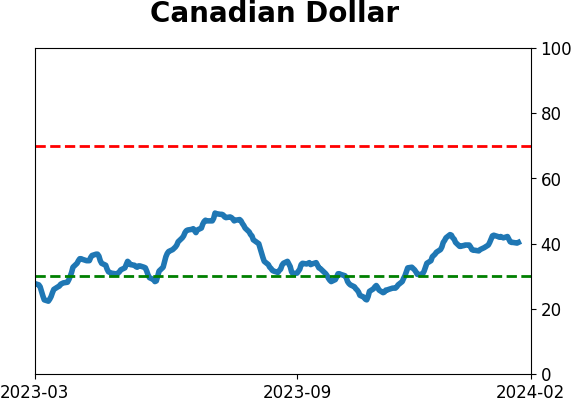
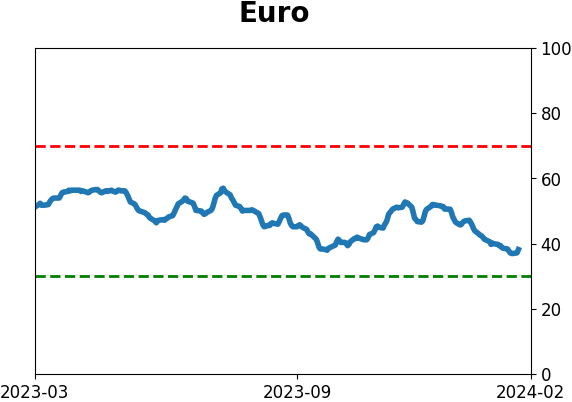
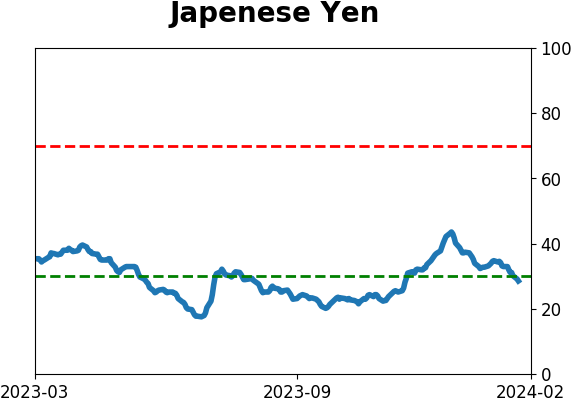
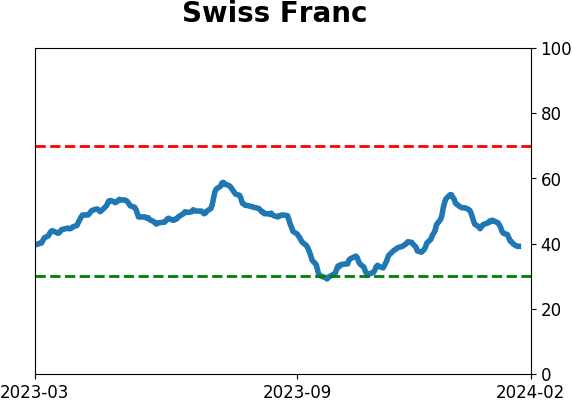
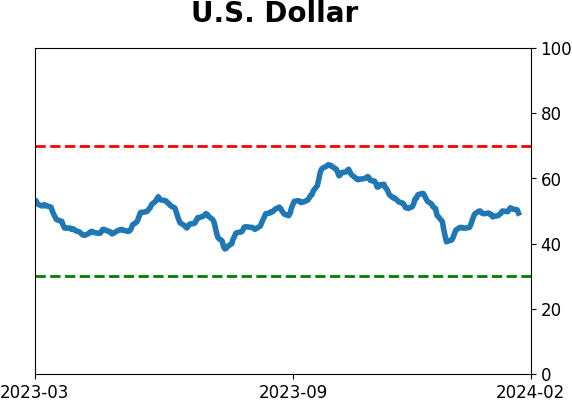
Currency ETF's - 5-Day Moving Average
|
|
|
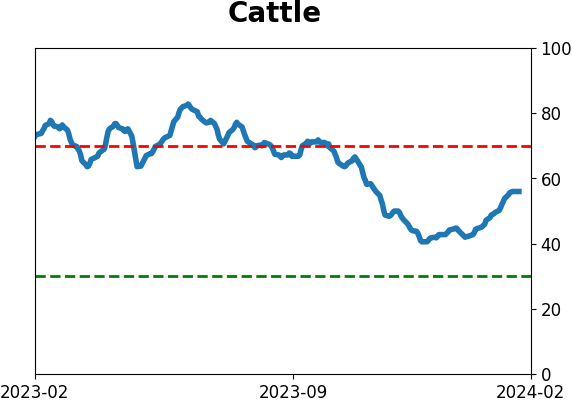
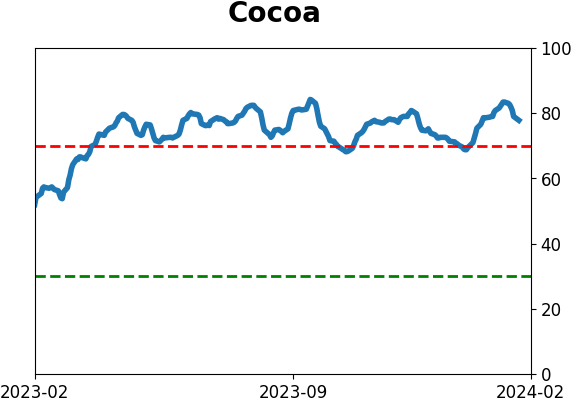
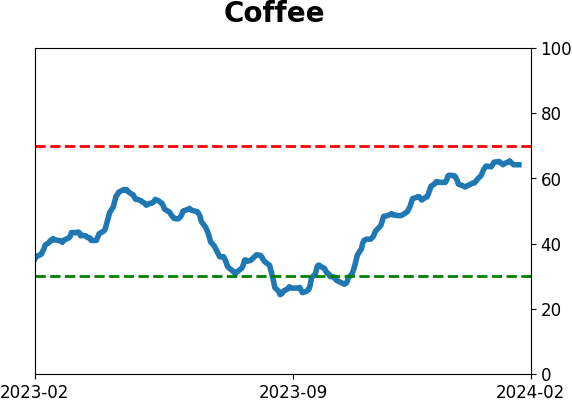
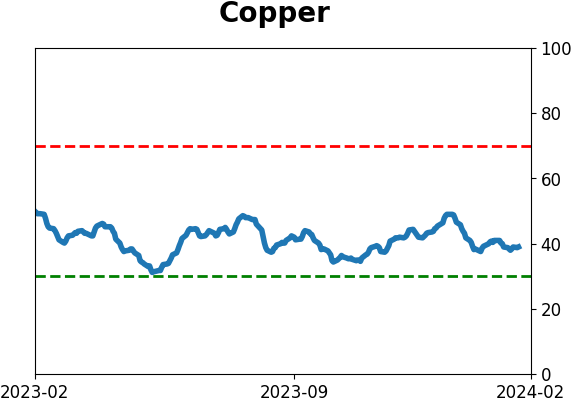
Commodity ETF's - 5-Day Moving Average
|
|