Headlines
|
|
Weekly Wrap for Feb 18 - Bond market sells off along with stocks, Brazil and Biotech are recovering:
This week, we saw a historic bout of selling pressure in high-yield bonds, on par with the worst declines in 15 years. The total return in an aggregate bond index has dropped 5% from its high, at the same time as the total return in stocks - extremely rare. Brazil is trying to recover, showing impressive internal momentum. Biotechnology stocks are recovering from historic selling, too. Gold has some proving to do.
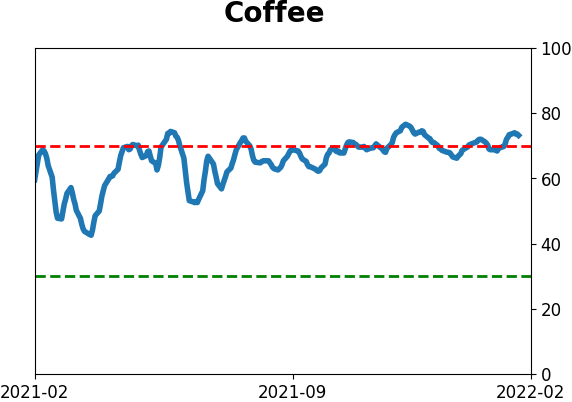
The latest Commitments of Traders report was released, covering positions through Tuesday: The 3-Year Min/Max Screen showed that "smart money" commercial hedgers didn't make any major moves this week. Mostly, they undertook minor reversals of existing positions. In coffee, they're now holding nearly 30% of open interest net short, the most since November 2016. According to the Backtest Engine, such a large net short preceded negative median returns across all time frames, though it didn't prevent super trends like 2010. Thanks to a large short position in the S&P 500, they're still holding about $84 billion worth of short exposure to major equity index contracts. They didn't make any major changes in markets like gold, the dollar, 10-year Treasuries, or the VIX.
|
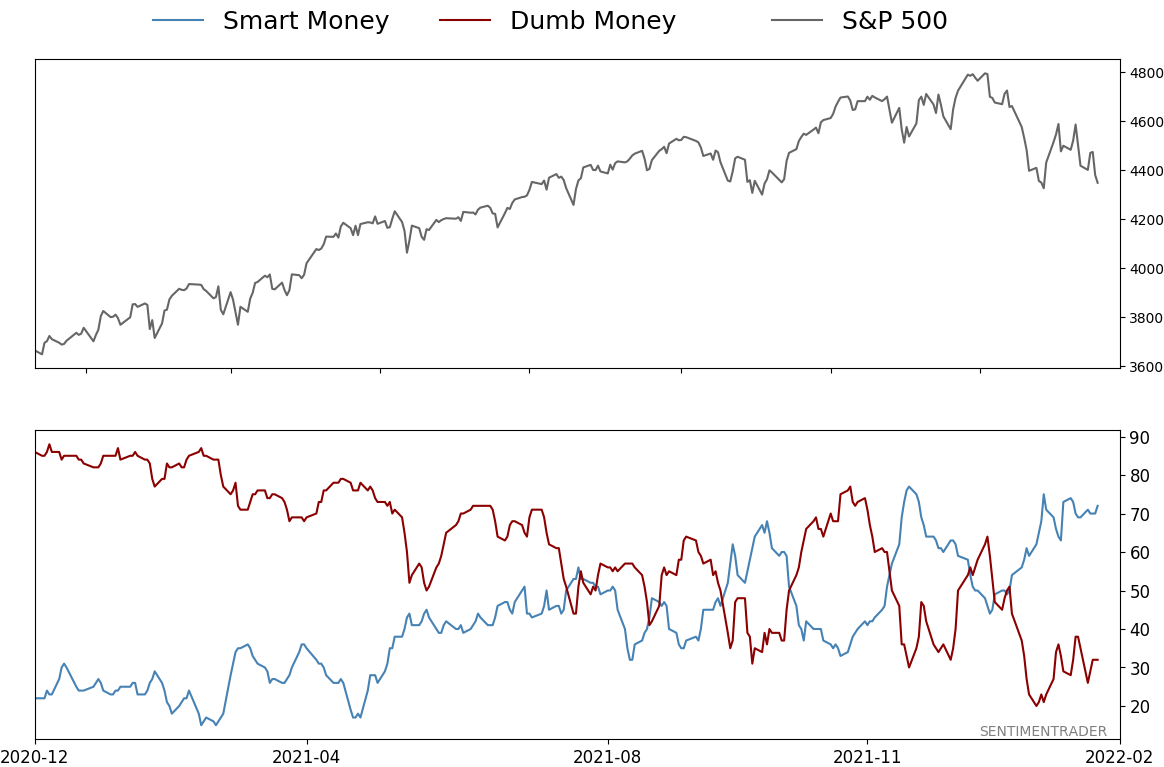
Smart / Dumb Money Confidence
|
Smart Money Confidence: 72%
Dumb Money Confidence: 32%
|
|
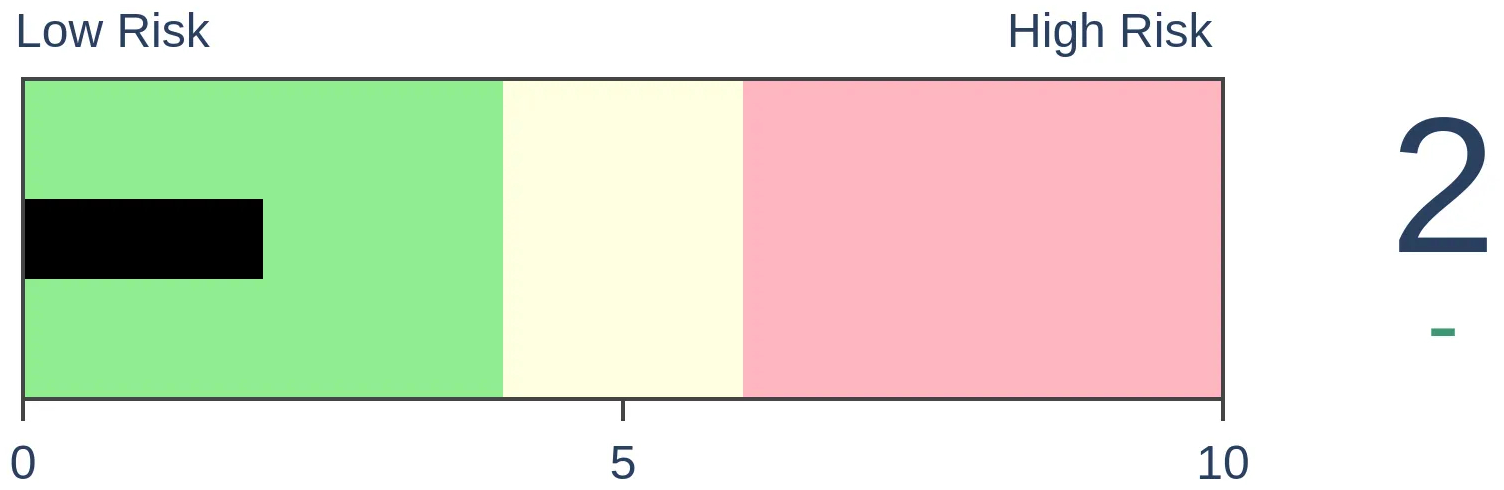
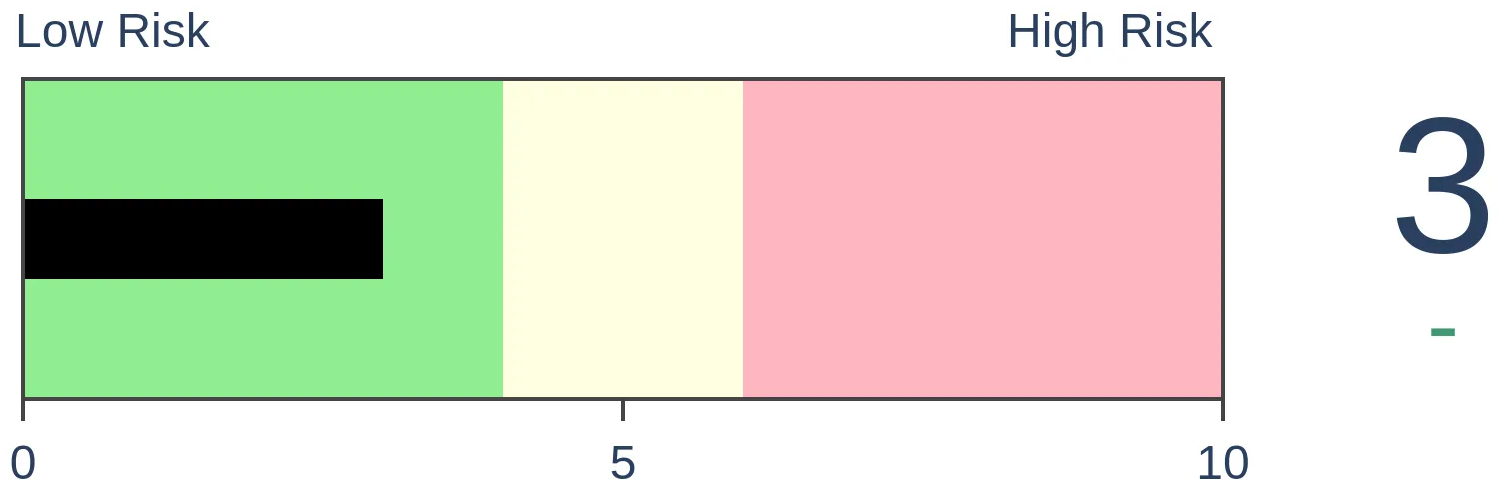
Risk Levels
Stocks Short-Term
|
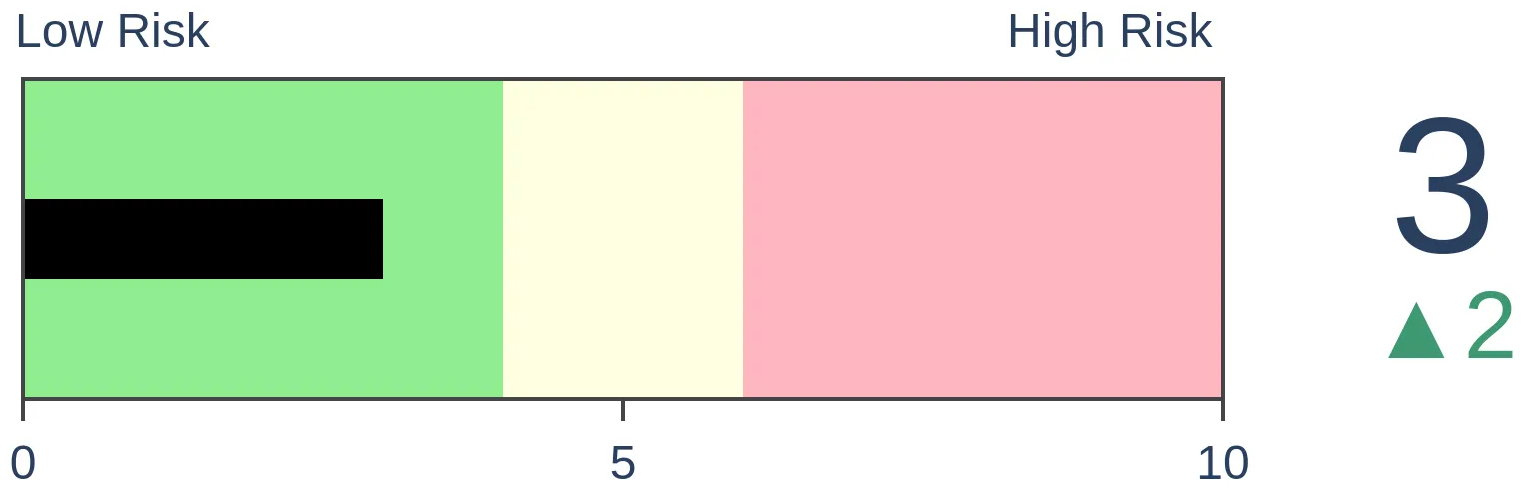
Stocks Medium-Term
|
|
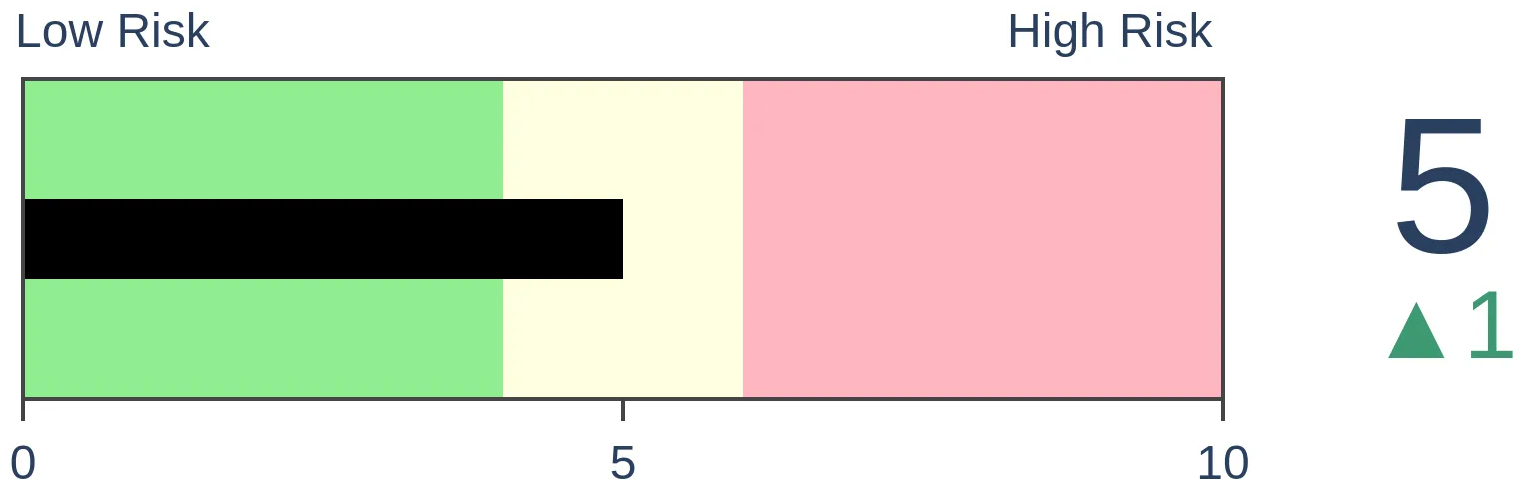
Bonds
|
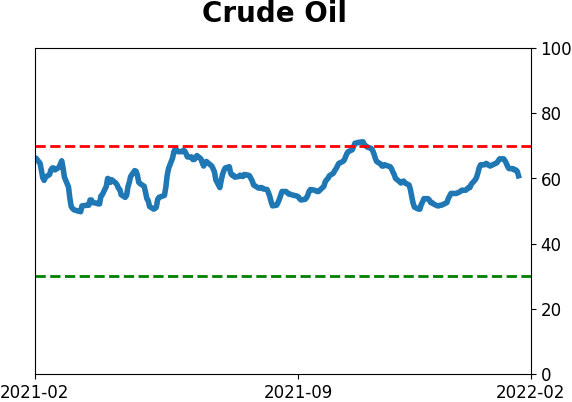
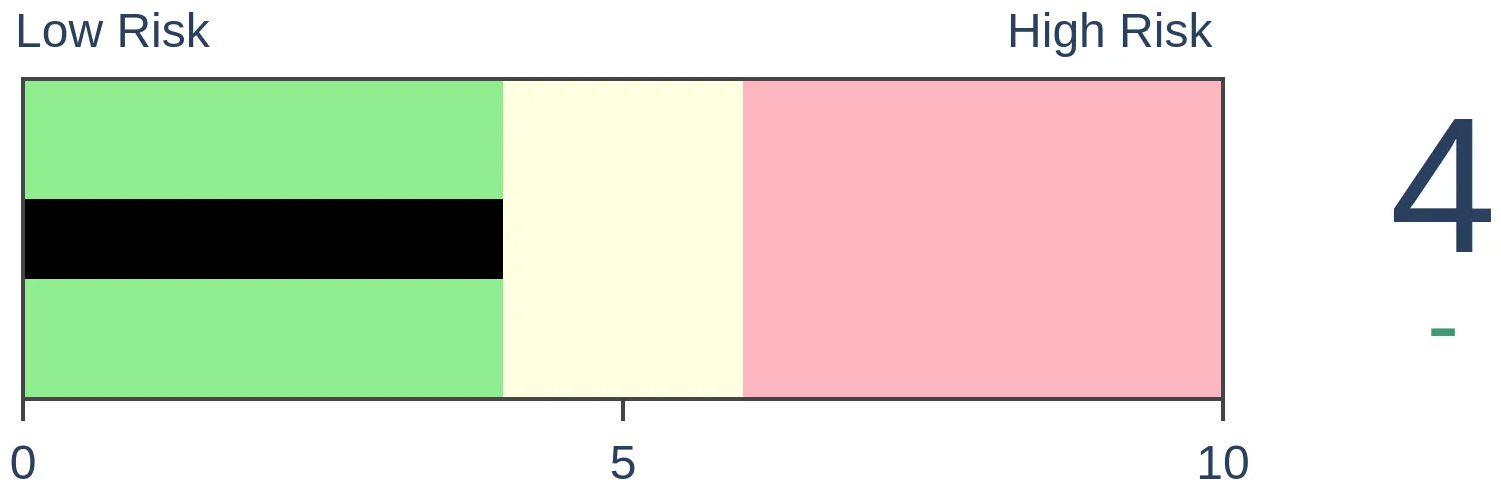
Crude Oil

|
|
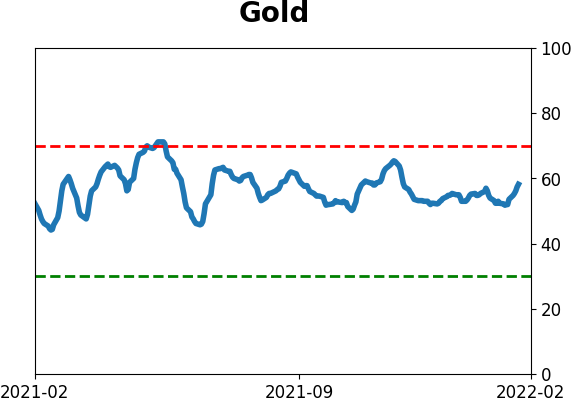
Gold
|
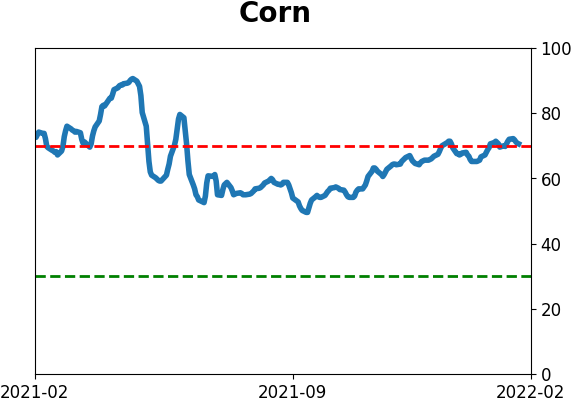
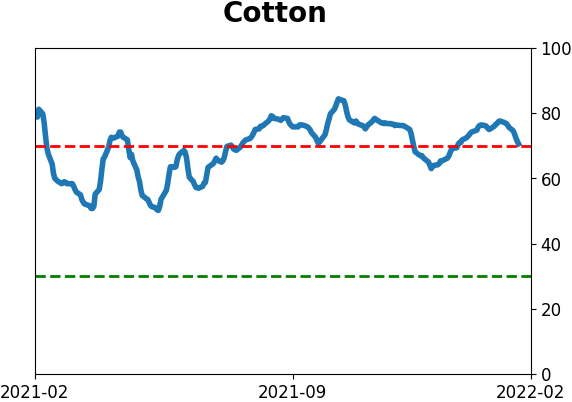
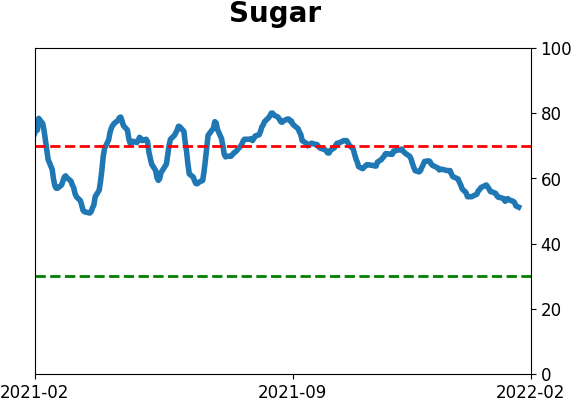
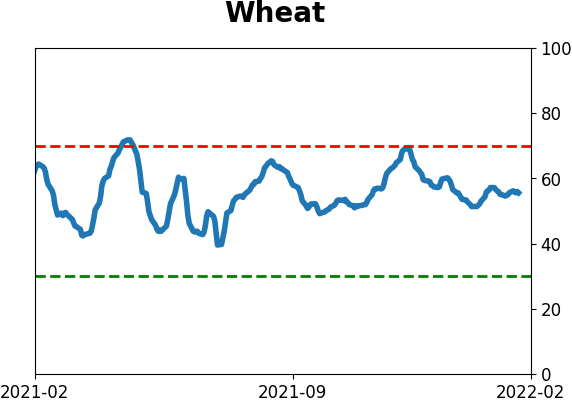
Agriculture
|
|
Research
By Jason Goepfert
BOTTOM LINE
This week, we saw a historic bout of selling pressure in high-yield bonds, on par with the worst declines in 15 years. The total return in an aggregate bond index has dropped 5% from its high, at the same time as the total return in stocks - extremely rare. Brazil is trying to recover, showing impressive internal momentum. Biotechnology stocks are recovering from historic selling, too. Gold has some proving to do.
FORECAST / TIMEFRAME
None
|
Key points:
- High-yield bonds have suffered selling pressure on par with the two worst declines in the past 15 years
- The total return in the aggregate bond market is pulling back along with stocks, a rare event
- Utility stocks are taking a backseat relative to the broader market
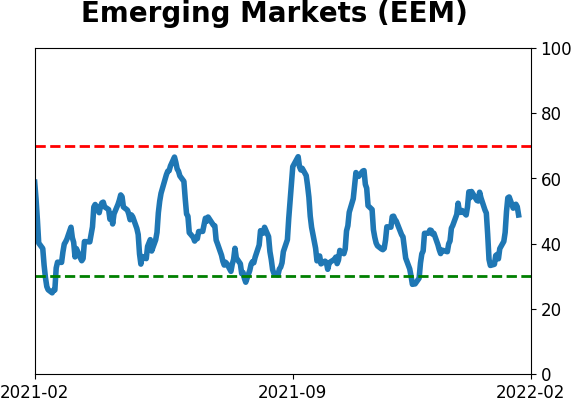
- Emerging markets are doing well, and Brazil is showing impressive internal momentum
- Biotechnology stocks are trying to recover from historic selling pressure
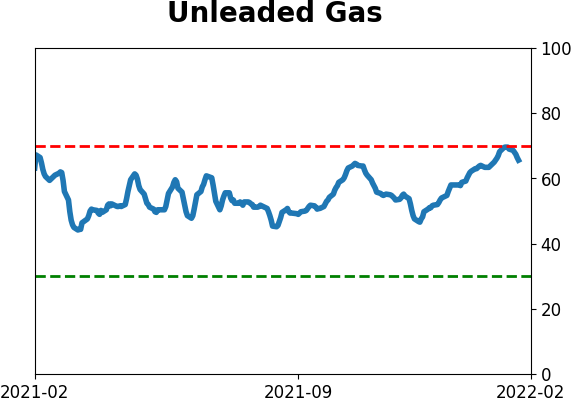
- Unleaded gas is entering a positive seasonal window
- Gold prices have some proving to do
High-yield bond selling weighs on sentiment
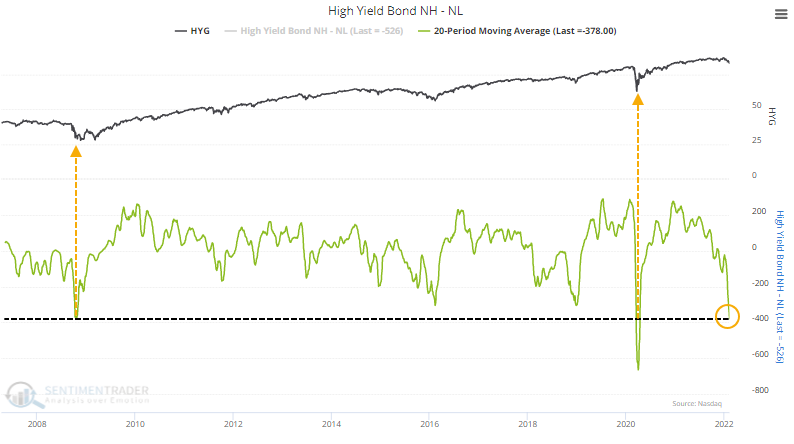
Starting in November, we looked at suspect performance in high-yield bonds as a worrying sign. The Cumulative Advance/Decline Line was diverging as more and more bonds were declining even as stocks hit new highs.
High-yield bonds made a comeback at the end of the year, but soon after, more bonds were falling to 52-week lows than rising to 52-week highs, a clear sign of risk-off behavior among some of the most sensitive and forward-looking investors.
About the only bright spot is that selling pressure has been so focused over the past month that we're nearing some historic extremes. Over the past 20 sessions, an average day has had nearly 400 more bonds hitting 52-week lows than 52-week highs. That's on par with the 2 worst bear markets in the past 15 years.
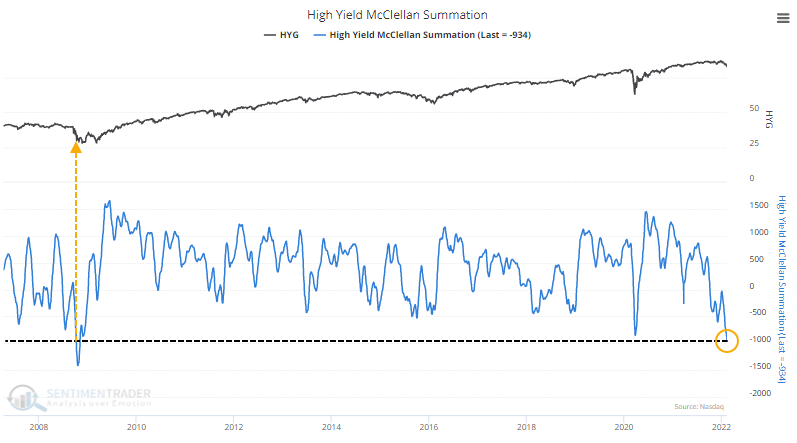
Most damning of all, the McClellan Summation Index for the high-yield bond market has been below zero and declining for weeks. We've repeatedly seen that when the Summation Index is below zero and declining, it's the worst possible environment for any sector or index.
Again, though, the selling pressure has been so severe and persistent that the indicator has surpassed its extreme from the pandemic. It is as stretched to the downside as it was during the height of the financial crisis panic.
We all know that extreme readings can always get more extreme. It's a trade-off for investors whether to try to buy at a reasonable price and risk further declines or wait for a recovery. There is no guarantee that recoveries won't fail, either, but it gives some comfort that the worst may be behind us. With a universally negative market environment, it usually takes historically extreme pessimism for a market to bottom, and even then it's often a testing process. In high-yield bonds, we seem to be quickly nearing one of those extremes.
It's not just high-yield issues that are suffering
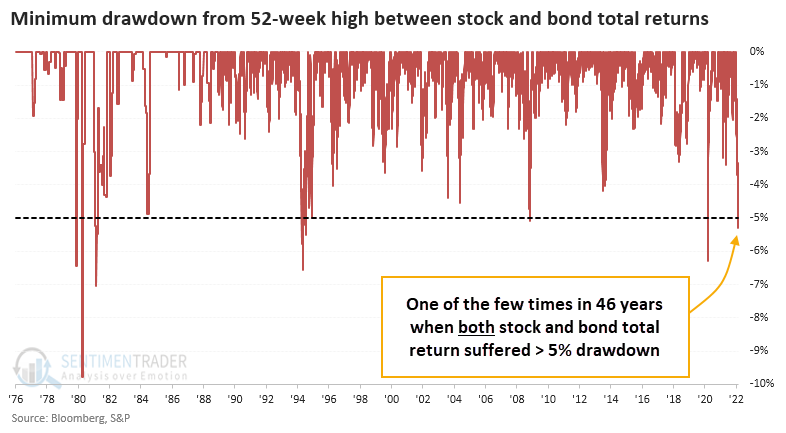
It's not just junk bonds that investors are selling. Investment-grade bonds, municipals, Treasuries - all have suffered. This sell-everything mentality has created an unusual situation where both stocks and bonds are losing ground simultaneously.
It's extremely rare to see both stocks and bonds in a pullback at the same time, defined as a 5% decline from a 52-week high. Starting late last week, the total return in the S&P 500 and Bloomberg U.S. Aggregate Bond Index were both more than 5% off their highs. Investors have endured a dual pullback only a handful of times in the past 46 years.
These dual pullbacks were a good sign that whatever macro concerns were driving the selling was mostly overdone. The S&P did suffer some losses in the months ahead, especially in 2008 as the final bout of panic hit markets. But over the next year, there was only a single small loss, which was quickly and dramatically reversed.
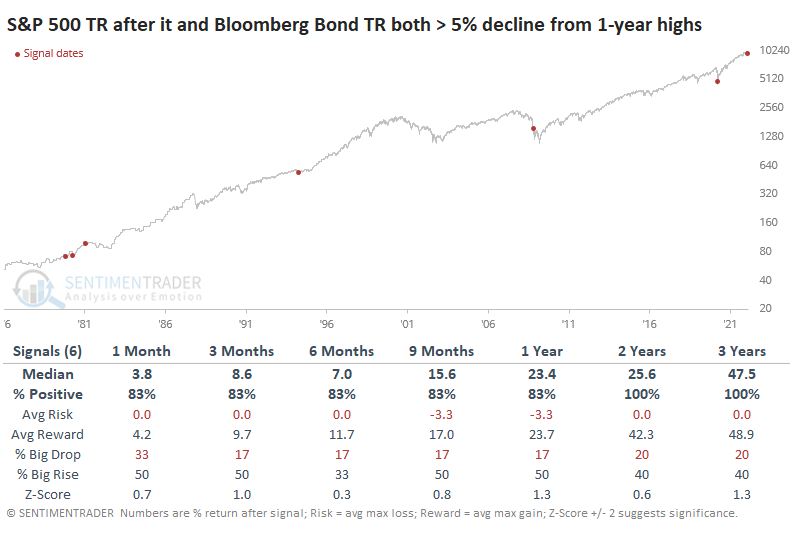
It's been mostly a tailwind for the bond market over the past 40+ years, so it's not a big surprise that the total return on the Bloomberg U.S. Bond Aggregate was mouth-watering. From 9 months and beyond, the Bloomberg Aggregate showed gains every time, well above random returns.
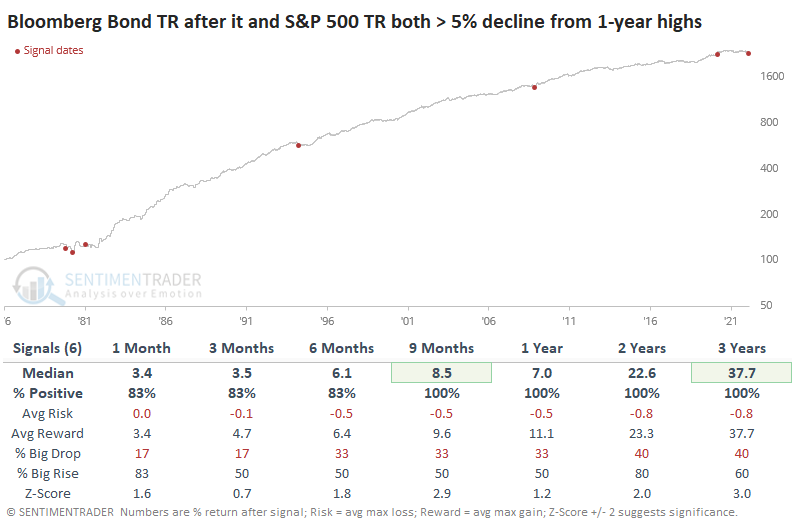
The secular bull market in bonds will end at some point, and investors will have to deal with a multi-year, or multi-decade, rise in interest rates. This is where reliance on history shows its shortcomings, but generally, we rely on investors to behave more or less in line with how they have in the past. In that sense, the dual pullback in stocks and bonds smacks of wholesale selling pressure that is due in part to emotional anxiety. After similar behavior, assets had a strong tendency to rebound, bonds most of all.
Utilities have been suffering as rates rise...potentially a good sign
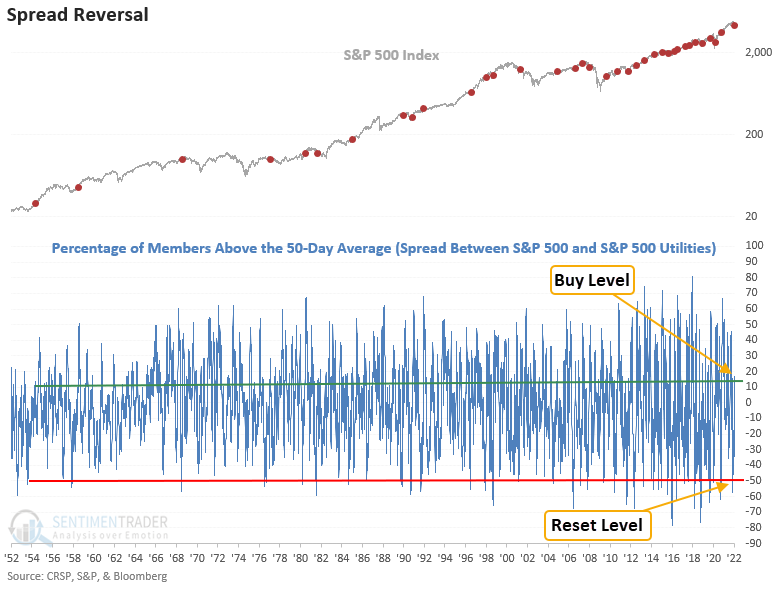
Dean noted that a trading model that measures the difference between medium-term uptrends for S&P 500 and S&P 500 utility sector members registered an alert on Monday at the close of trading.
The model identifies when the spread between members above the 50-day average reverses from -50% to greater than 11%. The reversal in medium-term uptrends suggests that the broad market is potentially transitioning from a more defensive environment to a more risk-seeking one. It might also indicate that interest-rate-sensitive stocks have succumbed to the pressure of higher rates.
This signal triggered 35 other times over the past 68 years. After the others, S&P 500 future returns, win rates, and risk/reward profiles were excellent across all time frames, especially the 2-month window. Drawdowns were minimal in the first 2 months, with only 1 instance greater than 5%.
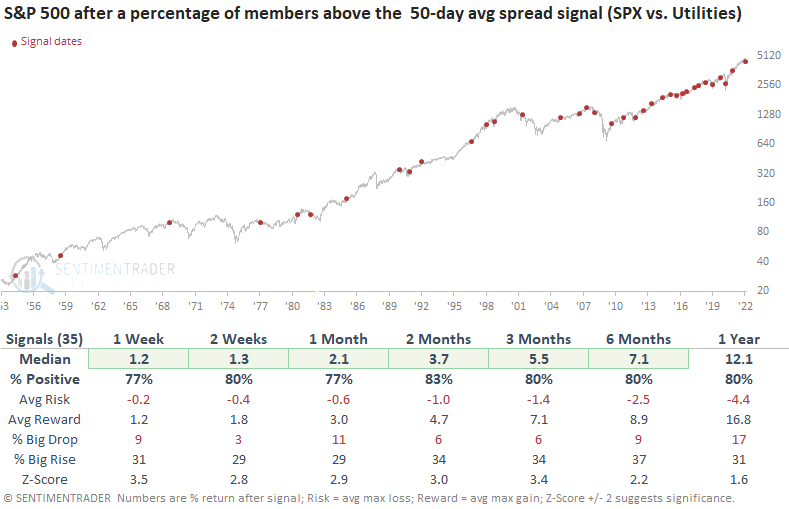
The reversal in medium-term uptrends suggests that the broad market is potentially transitioning from a more defensive environment to a more risk-seeking one.
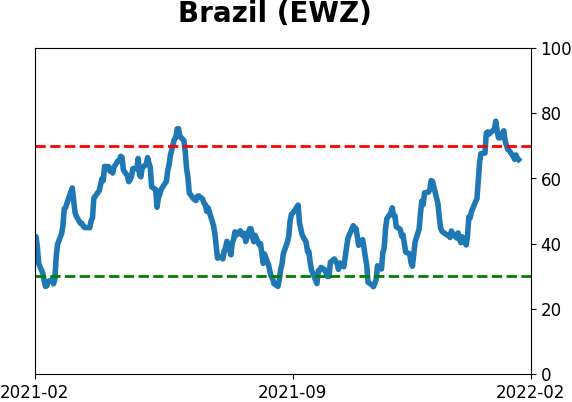
Emerging markets have been outperforming, especially Brazil
The long-suffering investors in Brazil have finally gotten a reprieve, and it may last a while.
Last October, we showed how sellers were piling on Brazil. Stocks in the Ibovespa index were suffering a historic avalanche of selling pressure that subsided soon after.
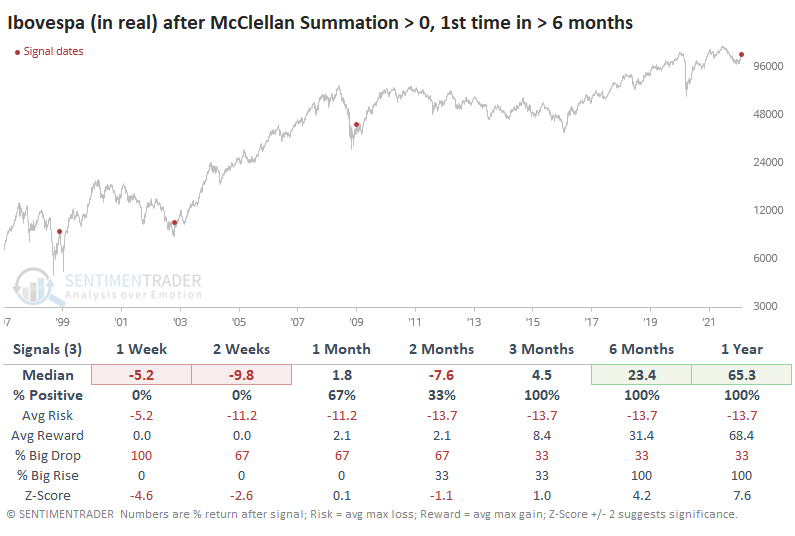
One of the guides we looked at was the McClellan Summation Index. It had been persistently and heavily negative for months. According to the Backtest Engine, the test we ran in October triggered a buy signal on January 21. It's now positive for the first time in more than 6 months.
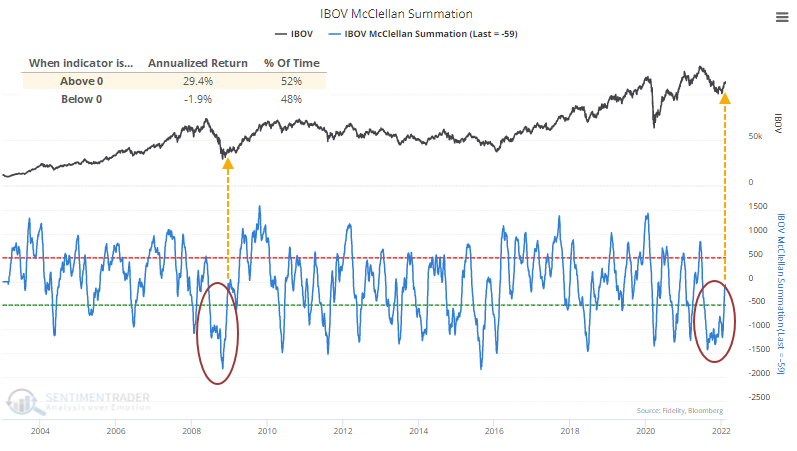
The Ibovespa has shown an extreme difference in performance depending on the position of the Summation Index. When it was above zero, the Ibovespa showed an annualized return of +29.4% since 1997. The recovery above zero just ended the longest-ever streak in negative territory dating back to at least 1997.
There were only a few other times when the Summation Index rose above zero for the first time in at least 6 months. Priced in reals, the Ibovespa showed a consistent tendency to settle back in the short-term (well, as much as we can determine consistency from a sample size of 3).
But all 3 also marked important long-term turning points in Brazilian stocks; the index sported double-digit gains over the next 6 months each time. A year later, the Ibovespa showed a remarkable average gain of more than 65%.
Thanks to periods of runaway inflation, the real has lost consistent ground against the U.S. dollar. When we price the Ibovespa in dollars, the McClellan Summation Index recoveries were less impressive but still positive over the next year.
Brazil isn't the only one
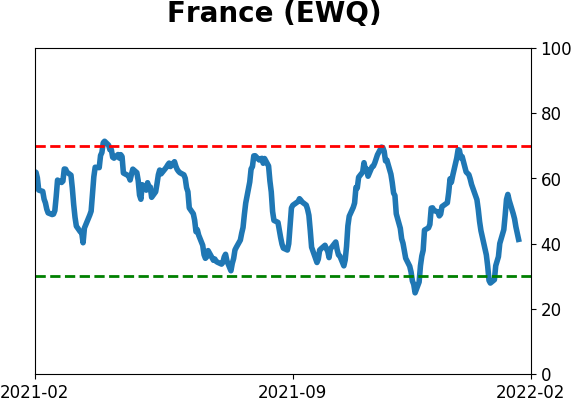
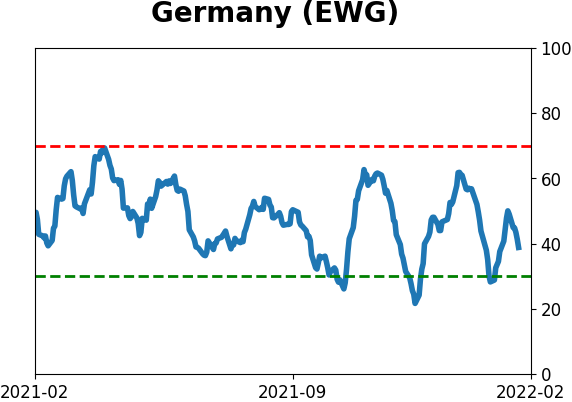
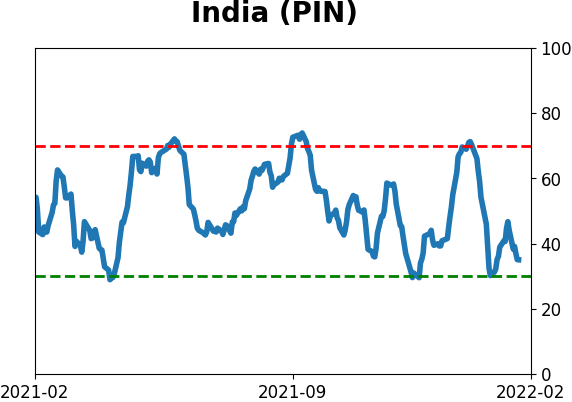
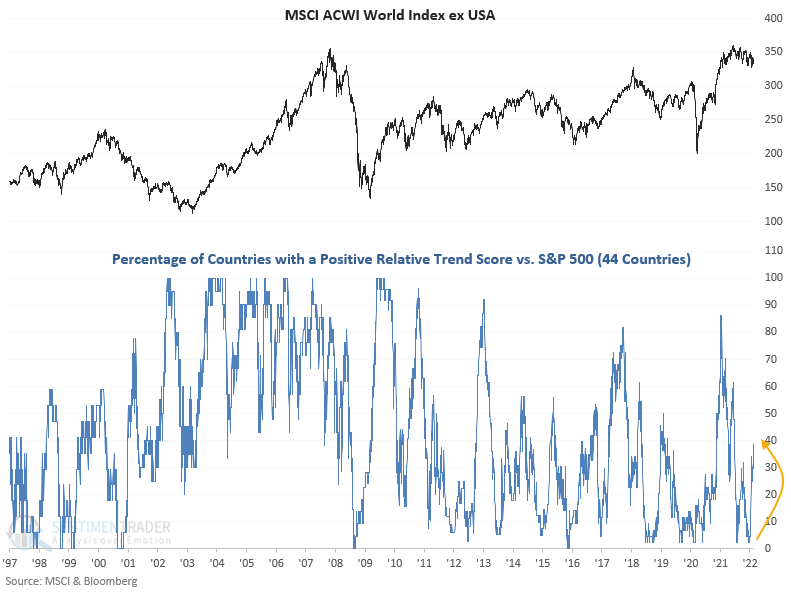
Dean noted that on a YTD basis, an overwhelming number of foreign markets are outperforming the S&P 500.
Countries with positive scores have a heavy index weighting geared toward value-oriented industries like energy, mining, and banking. The number of countries with a positive relative trend score versus the S&P 500 continues to improve, with a 30% increase from the lows in December 2021.
The percentage of country ETFs outperforming the S&P 500 on a rolling 3-month basis has climbed to the highest level in more than a year.
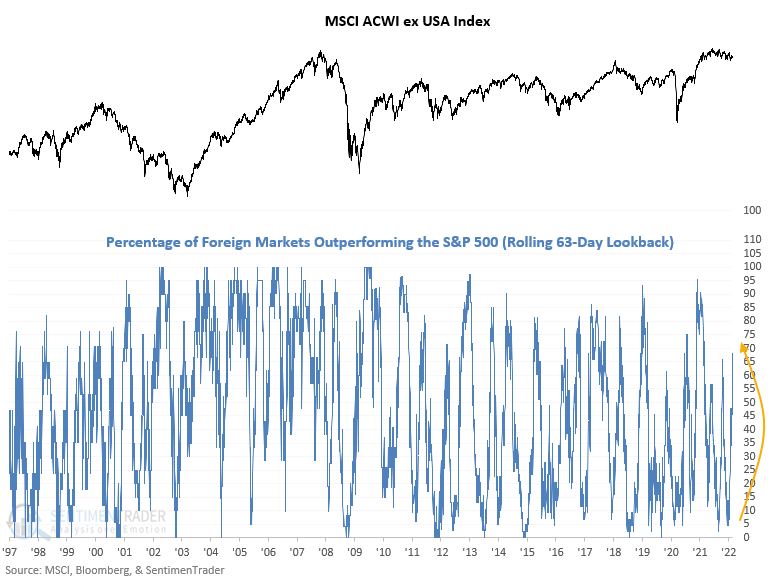
When countries are outperforming the U.S. like this, it typically leads to better returns for indexes like the MSCI All-World ex. U.S. index.
Biotech stocks are trying to recover, too
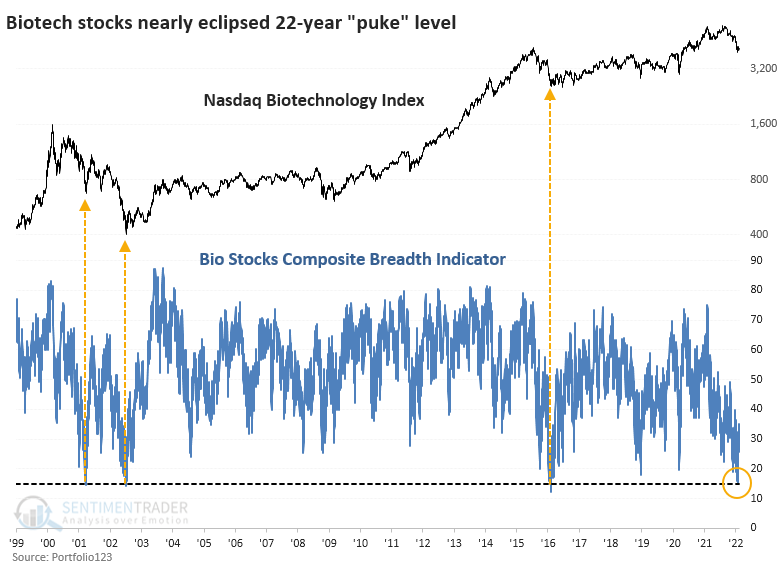
In December, we looked at the near-washout in Biotechnology stocks. As we saw with the high level of stocks in the Nasdaq cut in half, many of those were in Health Care, specifically Biotechnology.
It turns out it wasn't a total washout. Sellers returned in force and pushed the stocks to lower lows. That false bottom in December triggered several new extremes now attempting a reversal.
Most notably, the median decline these stocks suffered was so massive that we need to go back to at least 1999 to see similar behavior. Near the end of January, the average Biotech stock had lost more than 60% of its value from its 52-week high. The only dates that exceeded this were a couple in late March and early April 2001. It got close in February 2016 when the median drawdown reached -57%.
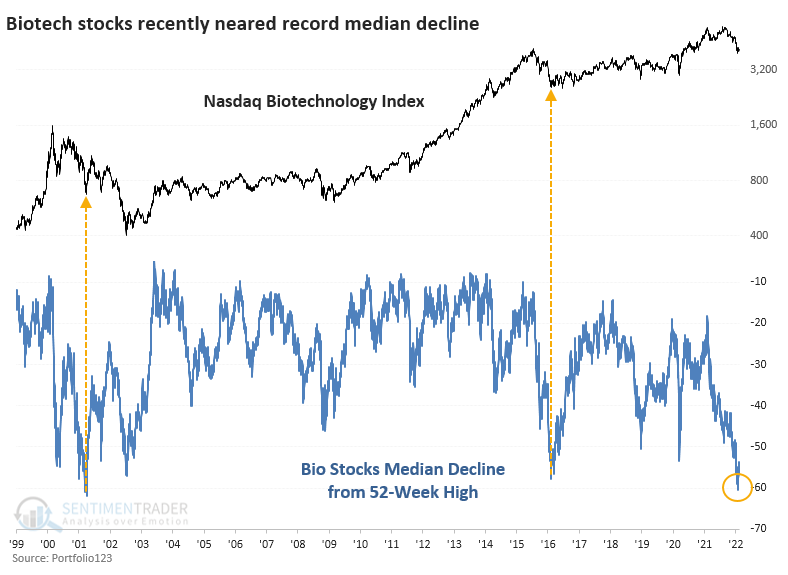
The chart below shows the overall breadth composite as we looked at in December. It dropped below 15% in late January, exceeded only by a few days in March 2001, July 2002, and February 2016.
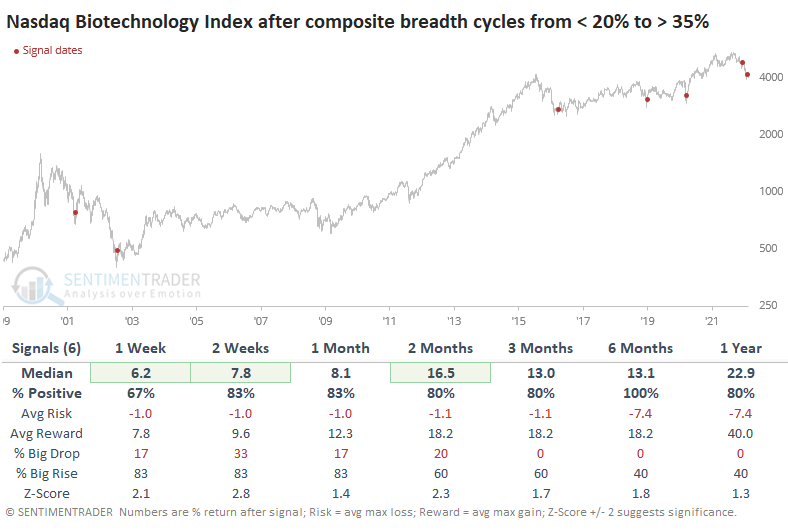
The table below shows every time the composite fell below 20% and then recovered above 35%, which it just did. Returns in the months ahead were excellent, though that pesky December failure shows up.
Why unleaded gas may be in for a good (then bad) (then good) time
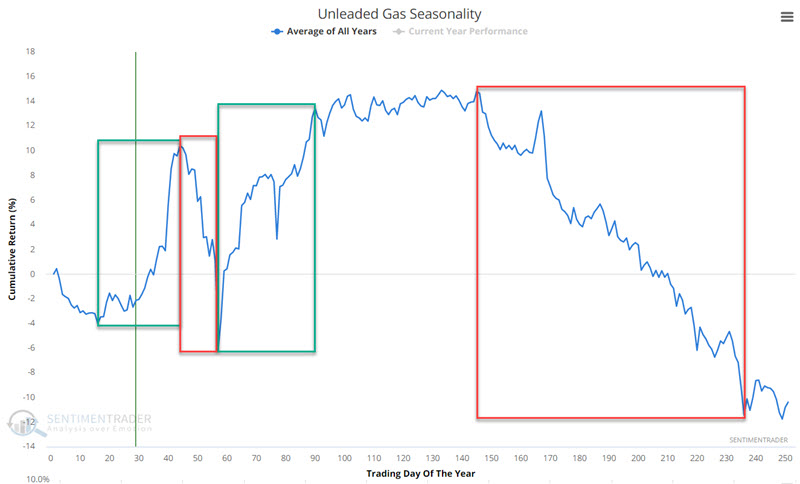
Jay showed that unleaded gas is one of the most cyclical markets around. Within the calendar year, there are several reasonably consistent bullish and bearish periods.
The chart below displays the annual seasonal trend for unleaded gas futures. There are four periods highlighted - two bullish (green) and two bearish (red).
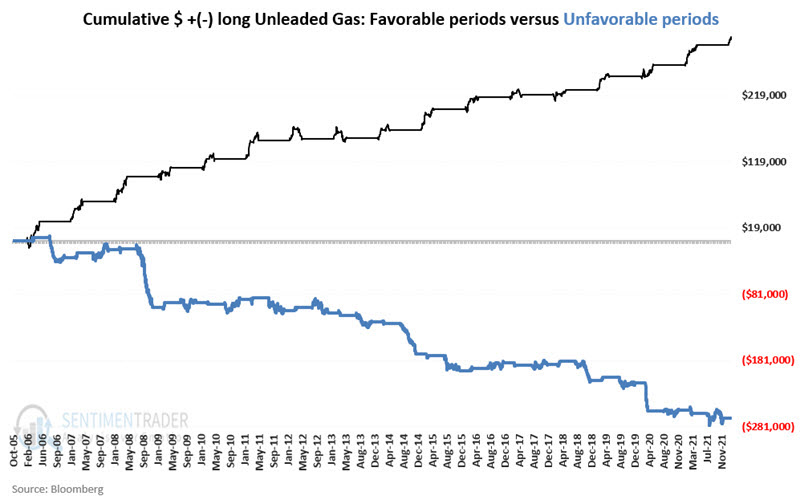
For each period highlighted in the chart above, we will look at the historical performance of unleaded gas futures from 10/3/2005 through 2/11/2022.
The chart below displays the cumulative hypothetical $ gain/loss achieved by holding a long position in unleaded gas futures during the two favorable periods (black line) versus the two unfavorable periods. The difference is stark.
The good news is that unleaded gas is a highly cyclical market. Knowledge of these cycles may help a trader timing when to be long, short, or flat gasoline. The bad news is that no cycle works every time. So beyond just timing, a trader must also make critically important decisions about capital allocation and risk management before they enter any trade. The other potential piece of good news is that UGA offers non-futures traders to trade this important commodity market just as they would shares of stock.
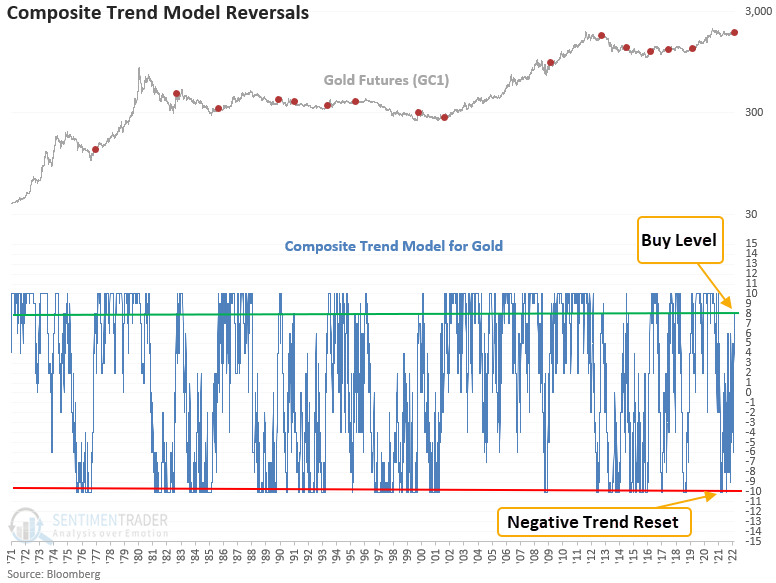
Gold has some proving to do
Dean showed that a composite trend model for gold recently increased to 8 out of 10 components with a positive trend. The shift comes after 10 out 10 members showed a negative direction. Let's conduct a study to assess the outlook for gold after similar trend score reversals.
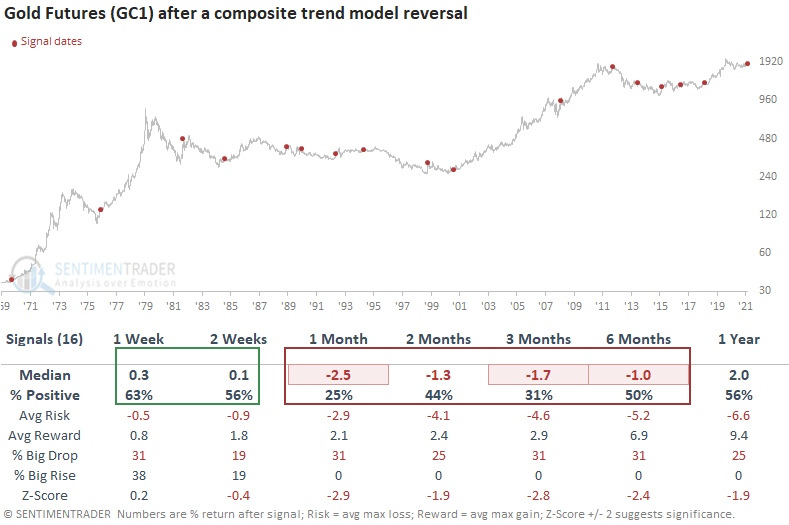
This signal triggered 16 other times over the past 52 years. After the others, Gold future returns, win rates, and risk/reward profiles were underwhelming across all medium-term time frames, especially the 1-month window. The 1-2 week time frames suggest that gold could drift higher, especially given the Russia/Ukraine situation. Even if this time is different, it's unlikely that we would see gold prices zoom higher as 13 out of 16 instances showed a negative return at some point in the first 2 months. The 1976 instance is the only case where gold never looked back.
About the Weekly Wrap...
The goal of the Weekly Wrap is to summarize our recent research. Some of it includes premium content (underlined links), but we're highlighting the key focus of the research for all. Sometimes there is a lot to digest, with this summary meant to highlight the highest conviction ideas we discussed. Tags will show any symbols and time frames related to the research.
Active Studies
| Time Frame | Bullish | Bearish | | Short-Term | 3 | 0 | | Medium-Term | 18 | 2 | | Long-Term | 15 | 5 |
|
Indicators at Extremes
Portfolio
| Position | Description | Weight % | Added / Reduced | Date | | Stocks | RSP | 21.4 | Added 10.2% | 2022-01-28 | | Bonds | 32.7% BND, 7.1% SCHP | 40.1 | Added 8.3% | 2021-10-26 | | Commodities | GCC | 2.4 | Reduced 2.1%
| 2020-09-04 | | Precious Metals | GDX | 4.6 | Reduced 4.2% | 2021-05-19 | | Special Situations | 8.1% KWEB, 3.6% XLE, 1.7% PSCE | 13.4 | Reduced 3.9% | 2022-01-18 | | Cash | | 17.9 | | |
|
Updates (Changes made today are underlined)
With a typical time frame of several months in this account, I normally don't make changes so quickly. I've added back part of the stock exposure I took off earlier in January due to the washed-out conditions and extreme pessimism we're seeing across a wide array of metrics. The biggest issue is that the environment is unhealthy and we could be in the throes of a protracted bear market. Even so, the readings we've seen recently have a good record at preceding relief rallies, so we'll have to see how that pans out. Bond sentiment is trying to recover from a recent bout of pessimism, and gold stocks are doing their thing which is not much at all. They've been flat for six months. Chinese tech stocks were doing exactly what they're supposed to do, then did *not* by plunging to new lows. This is troubling on a shorter-term time frame, but this was never meant for a trade, rather a multi-year investment. Recent behavior is troubling and I will not be adding any exposure as long as that's the case. RETURN YTD: -0.4% 2021: +8.7%, 2020: +8.1%, 2019: +12.6%, 2018: +0.6%, 2017: +3.8%, 2016: +17.1%, 2015: +9.2%, 2014: +14.5%, 2013: +2.2%, 2012: +10.8%, 2011: +16.5%, 2010: +15.3%, 2009: +23.9%, 2008: +16.2%, 2007: +7.8%
|
|
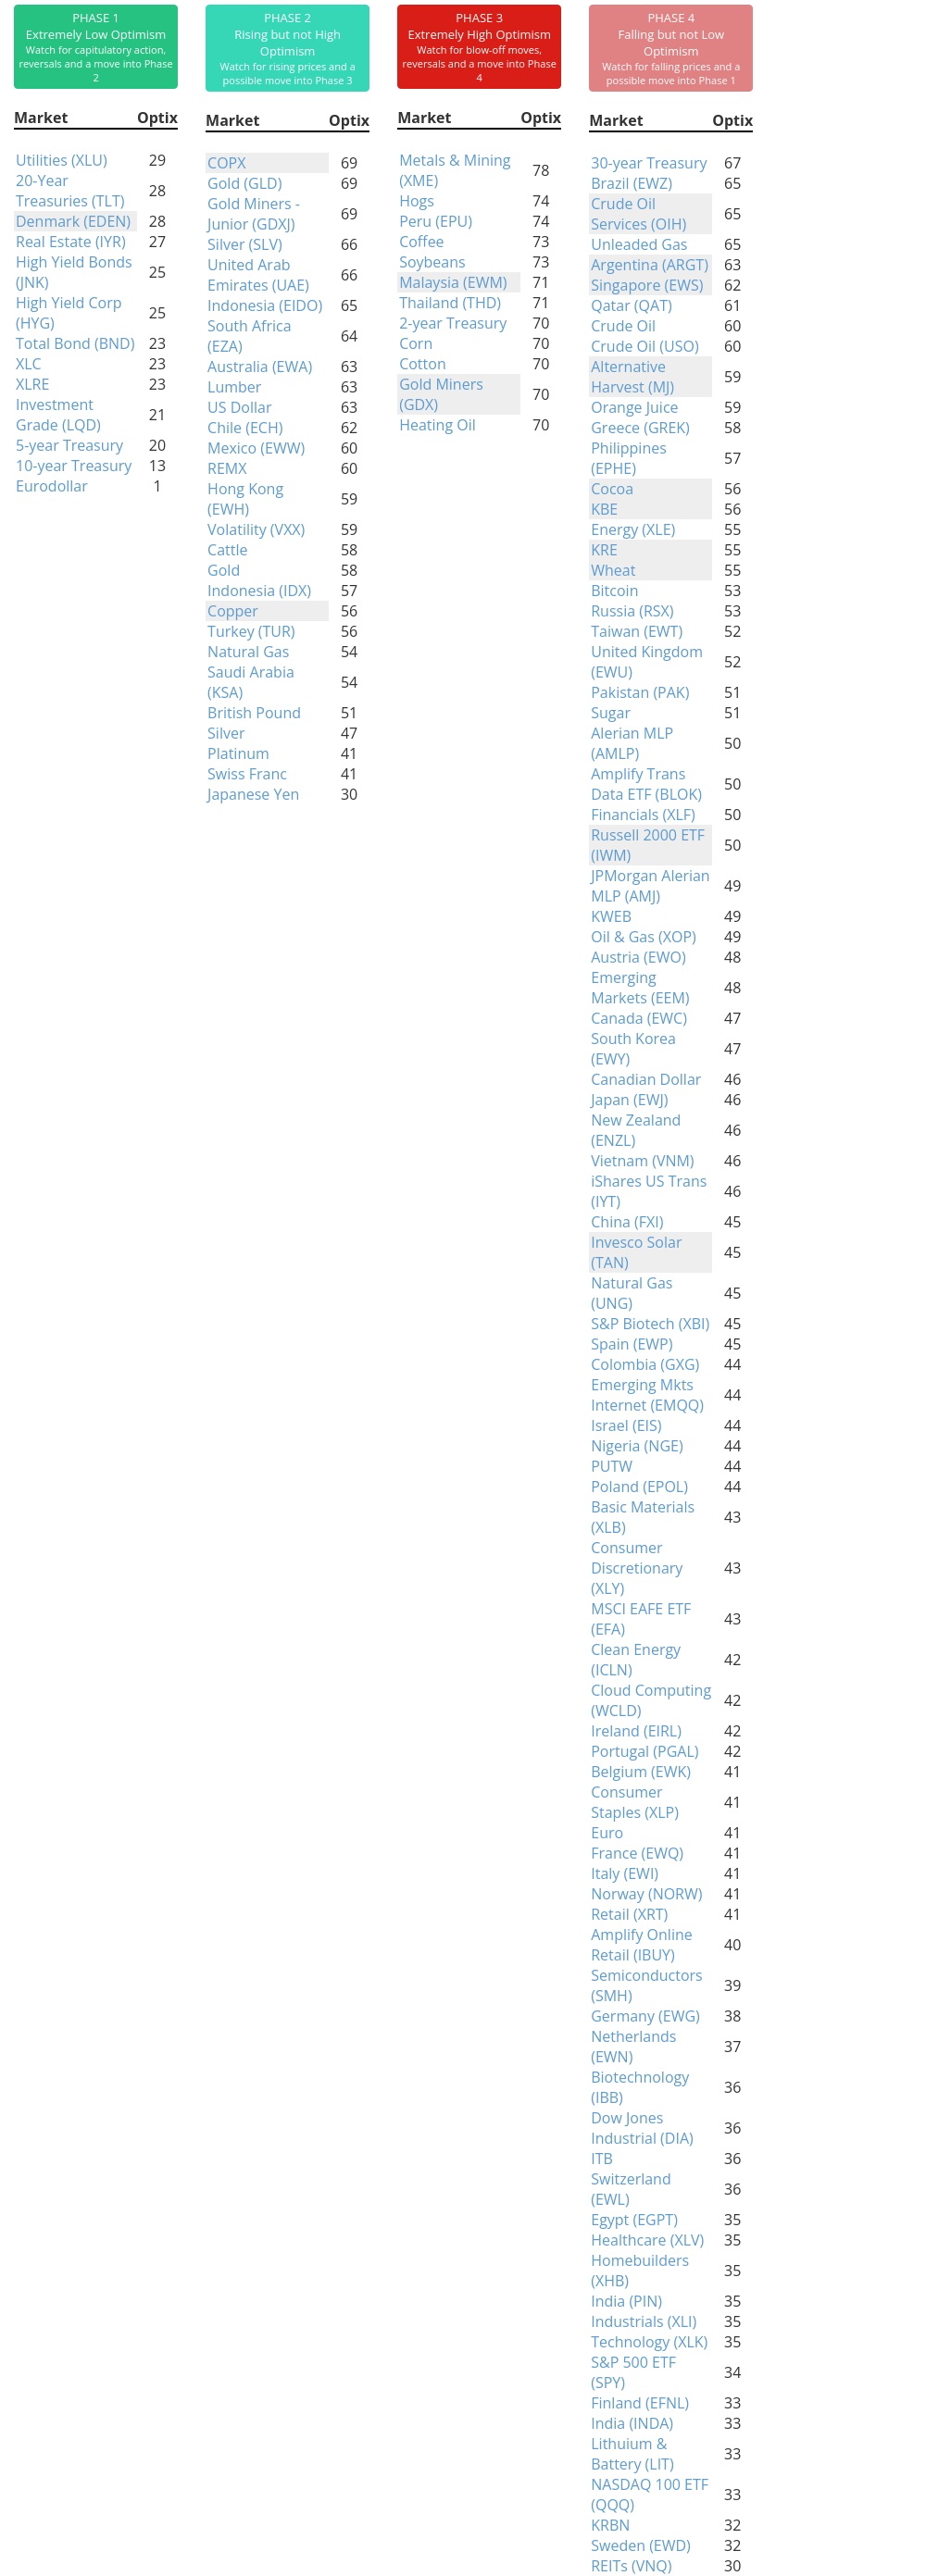
Phase Table
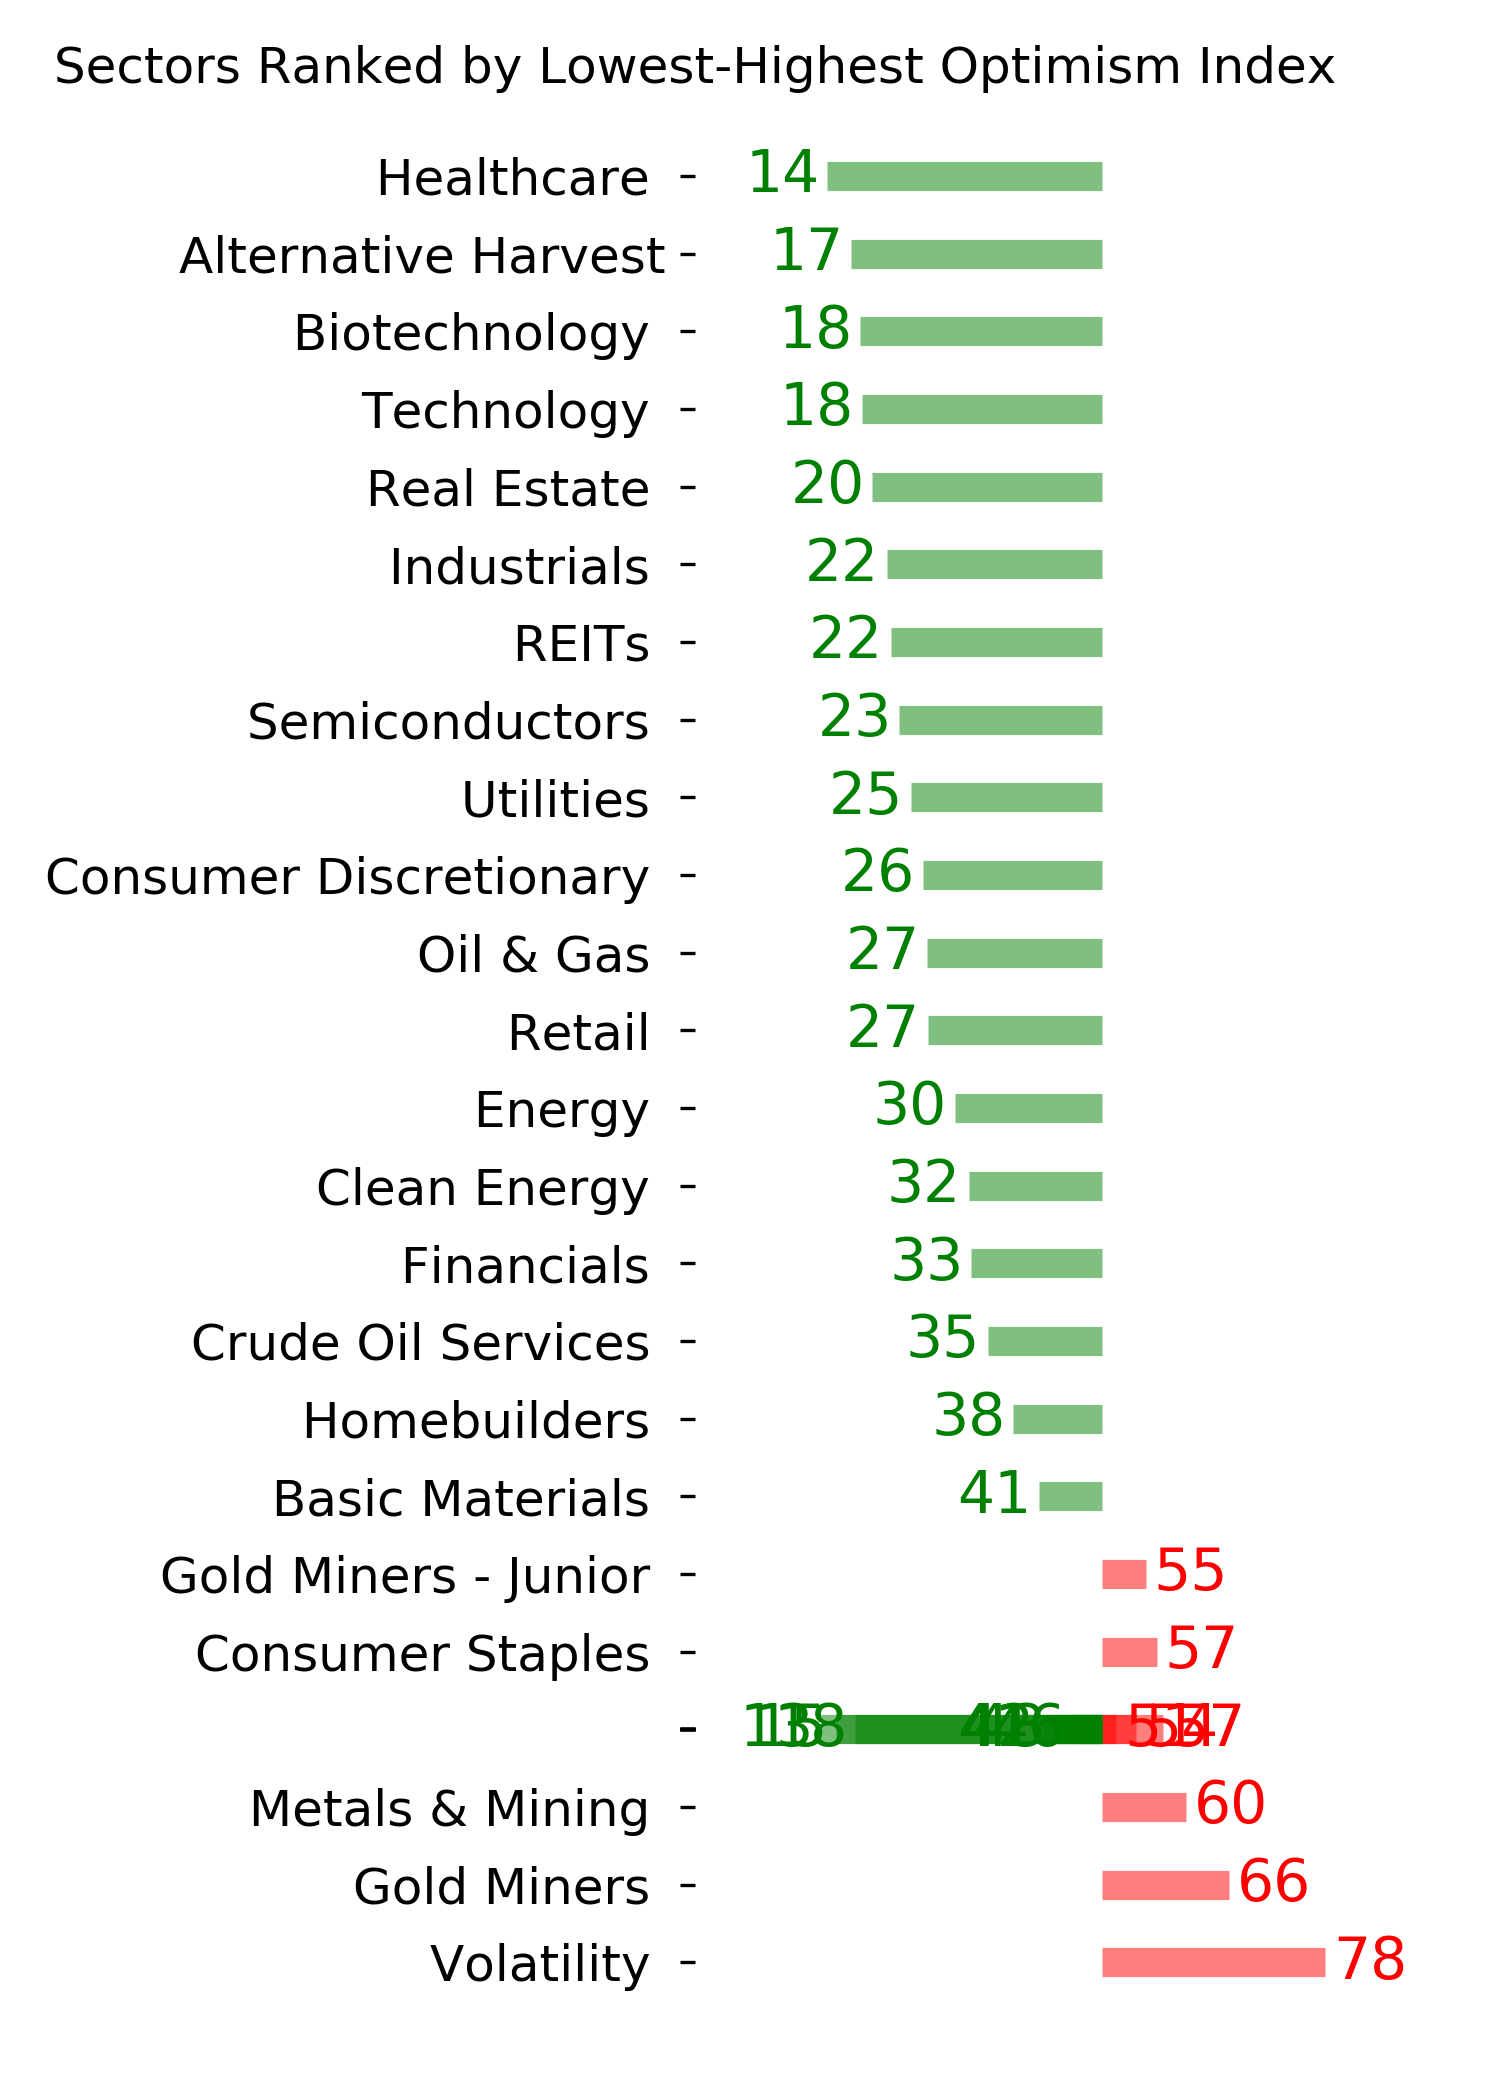
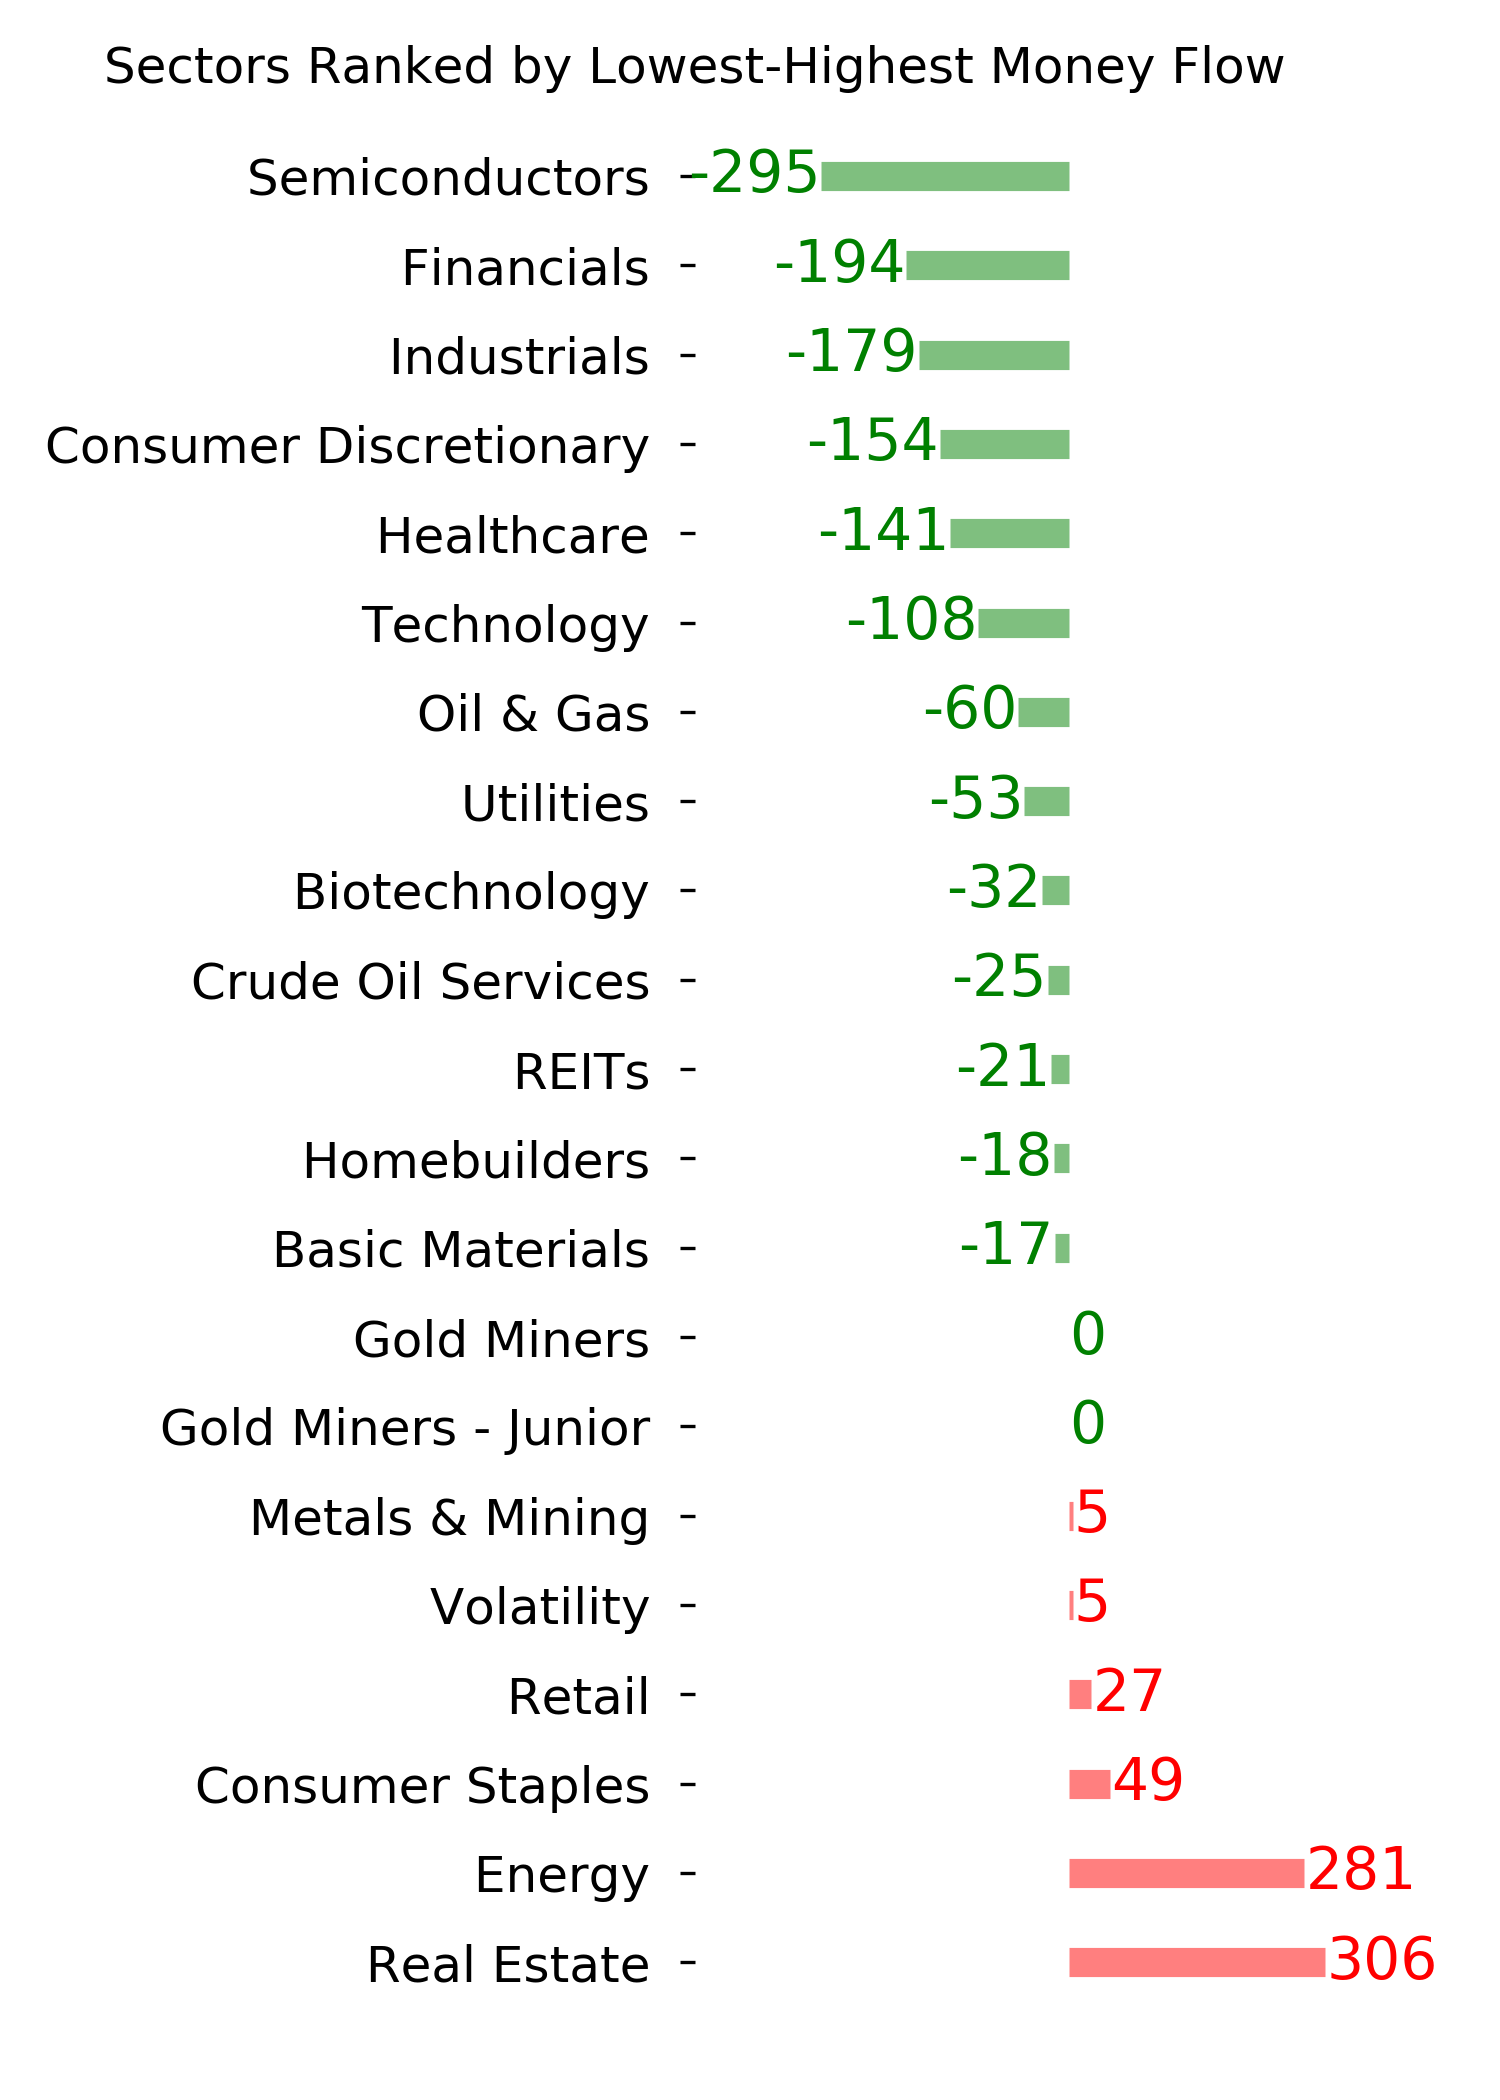
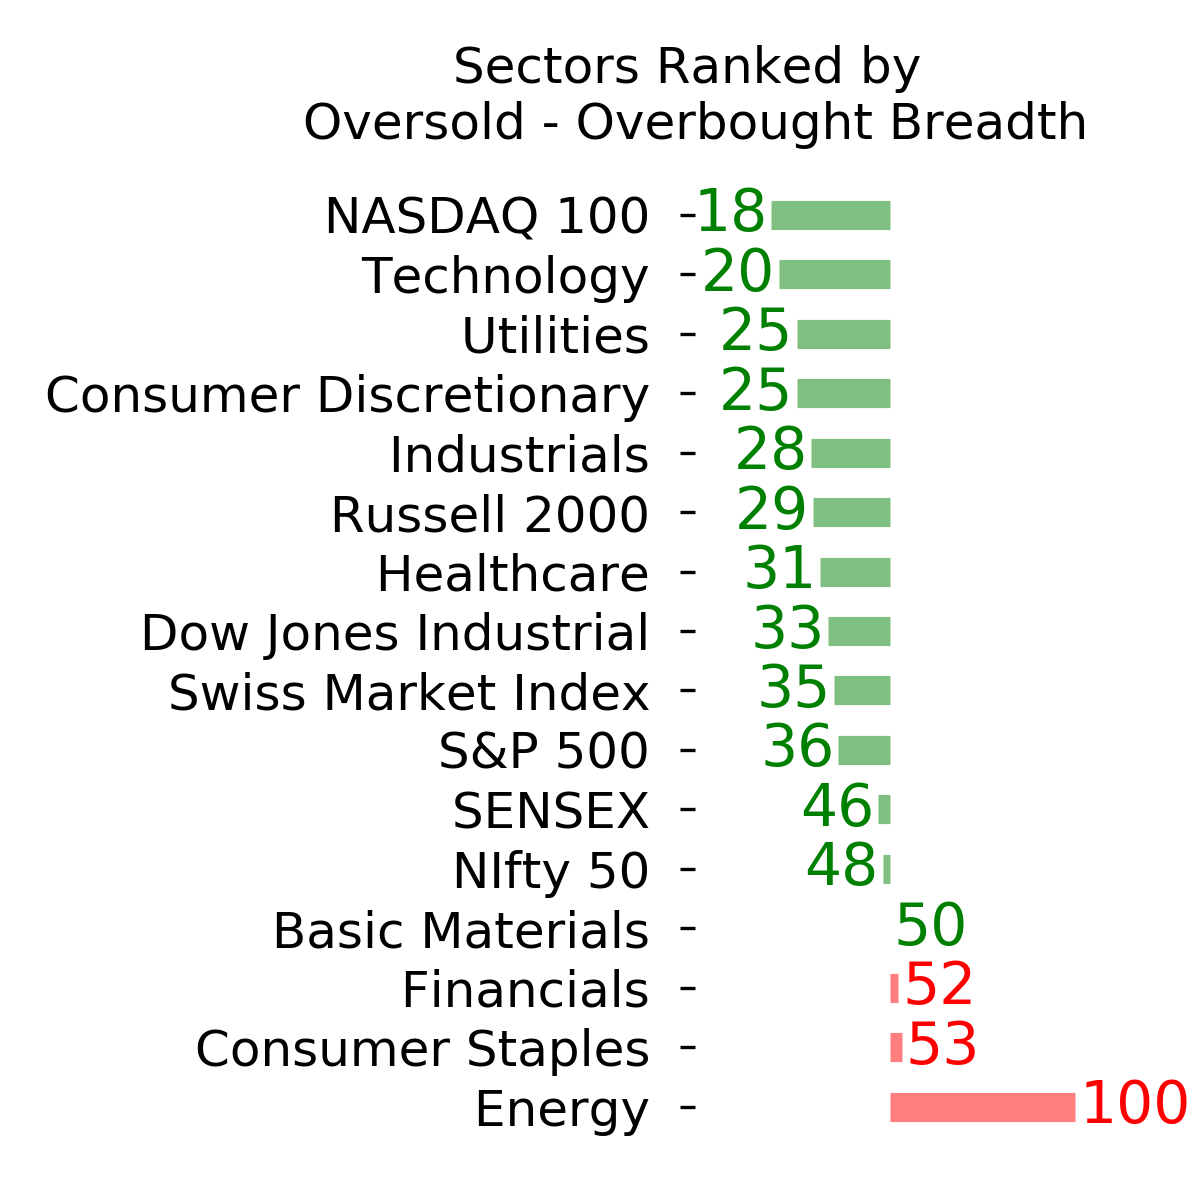
Ranks
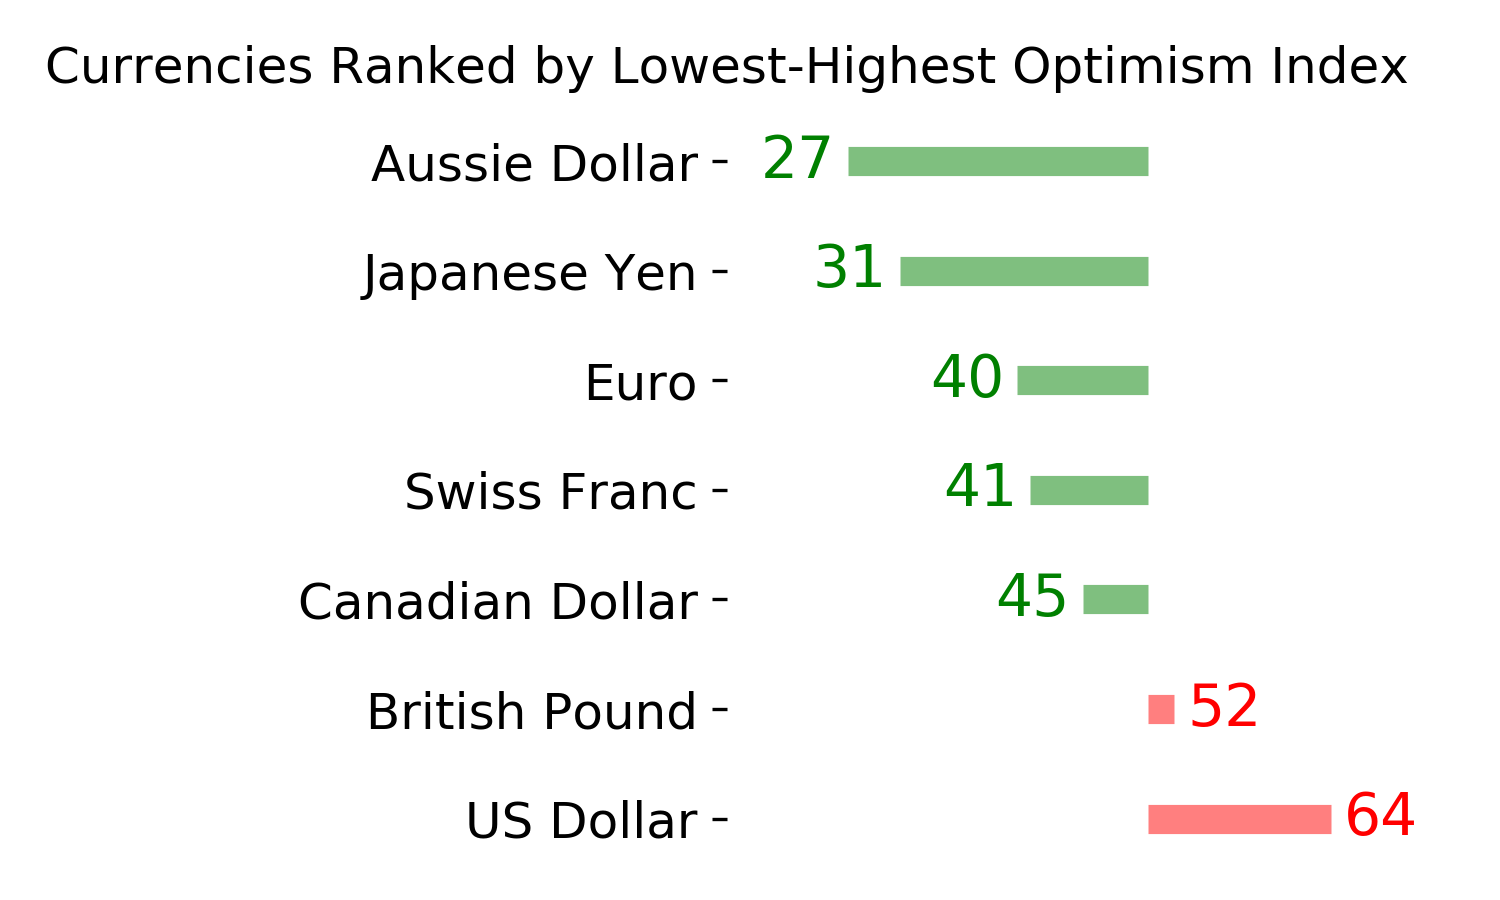
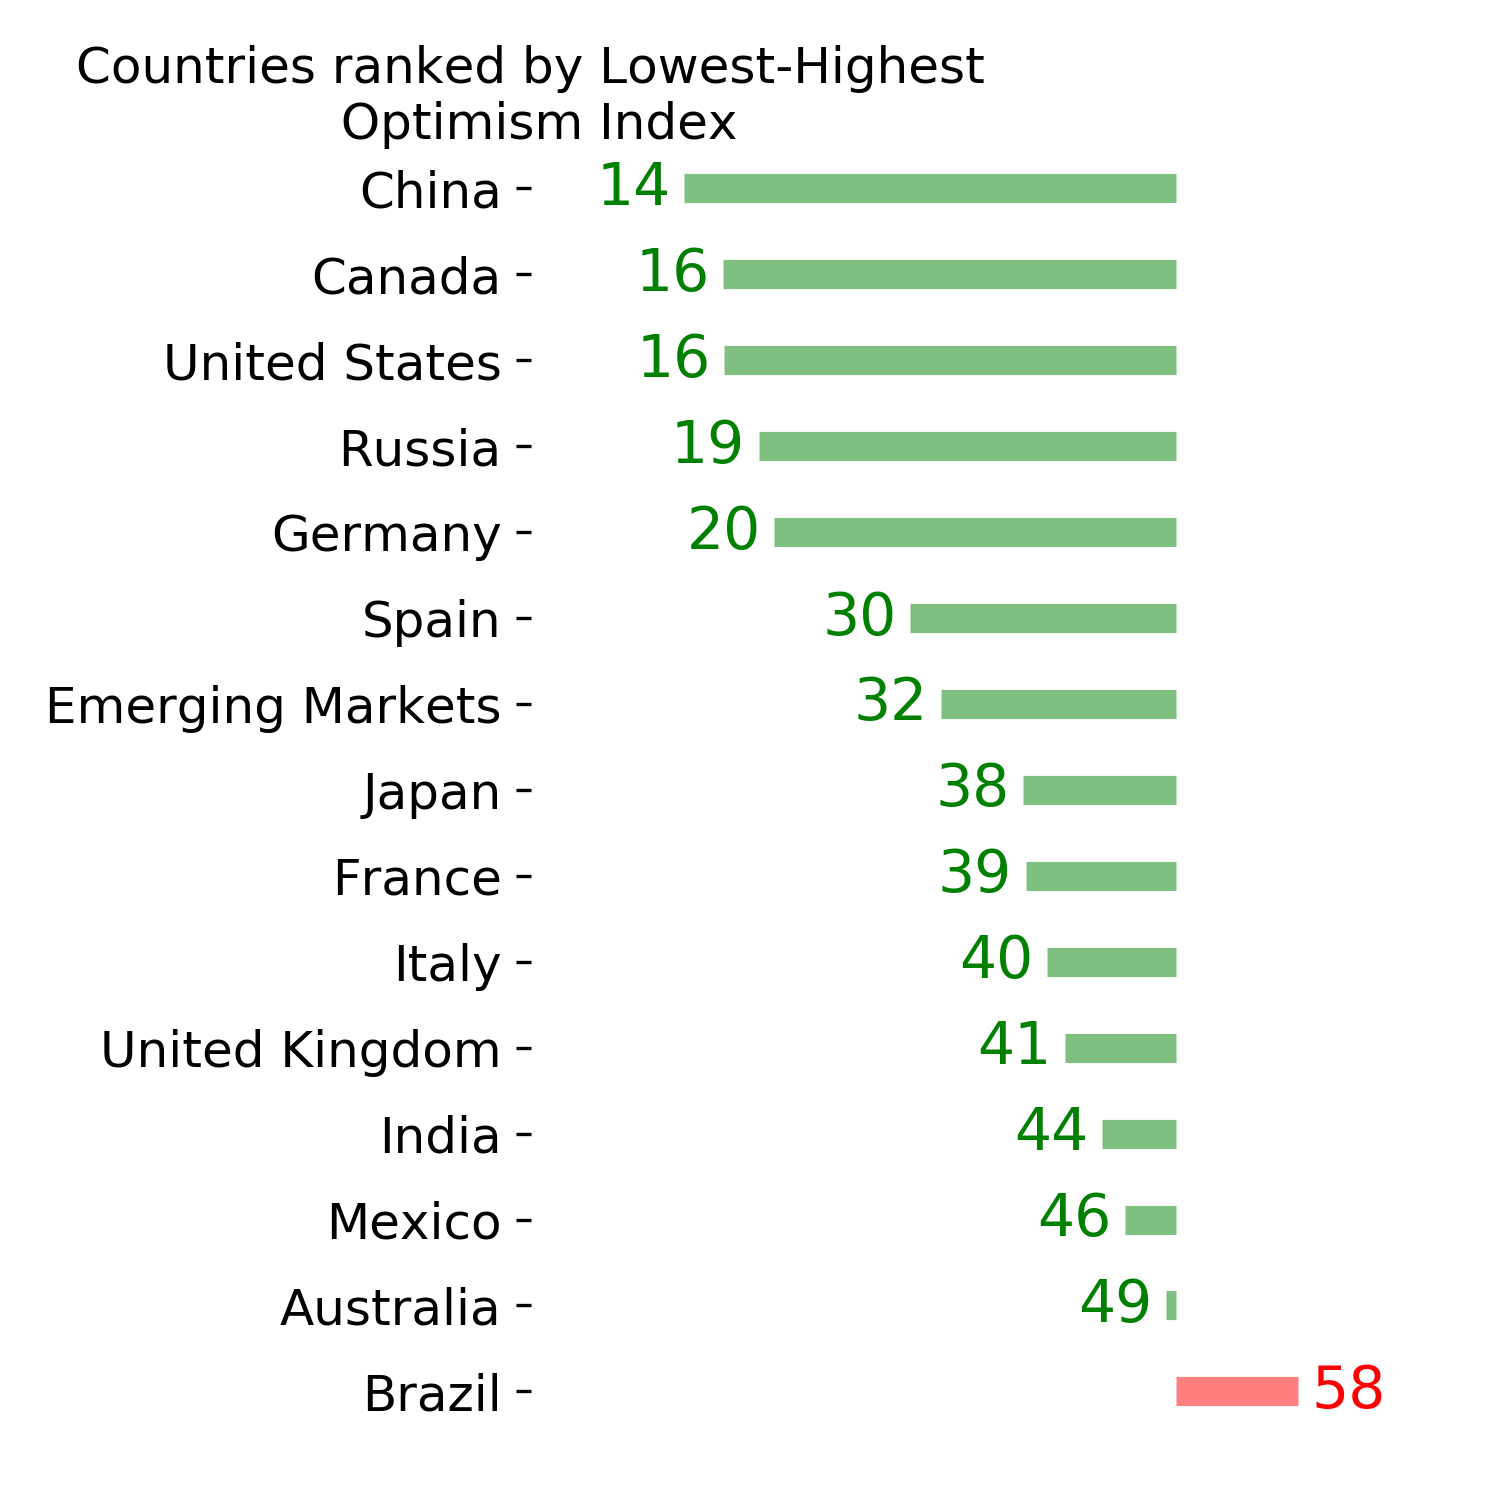
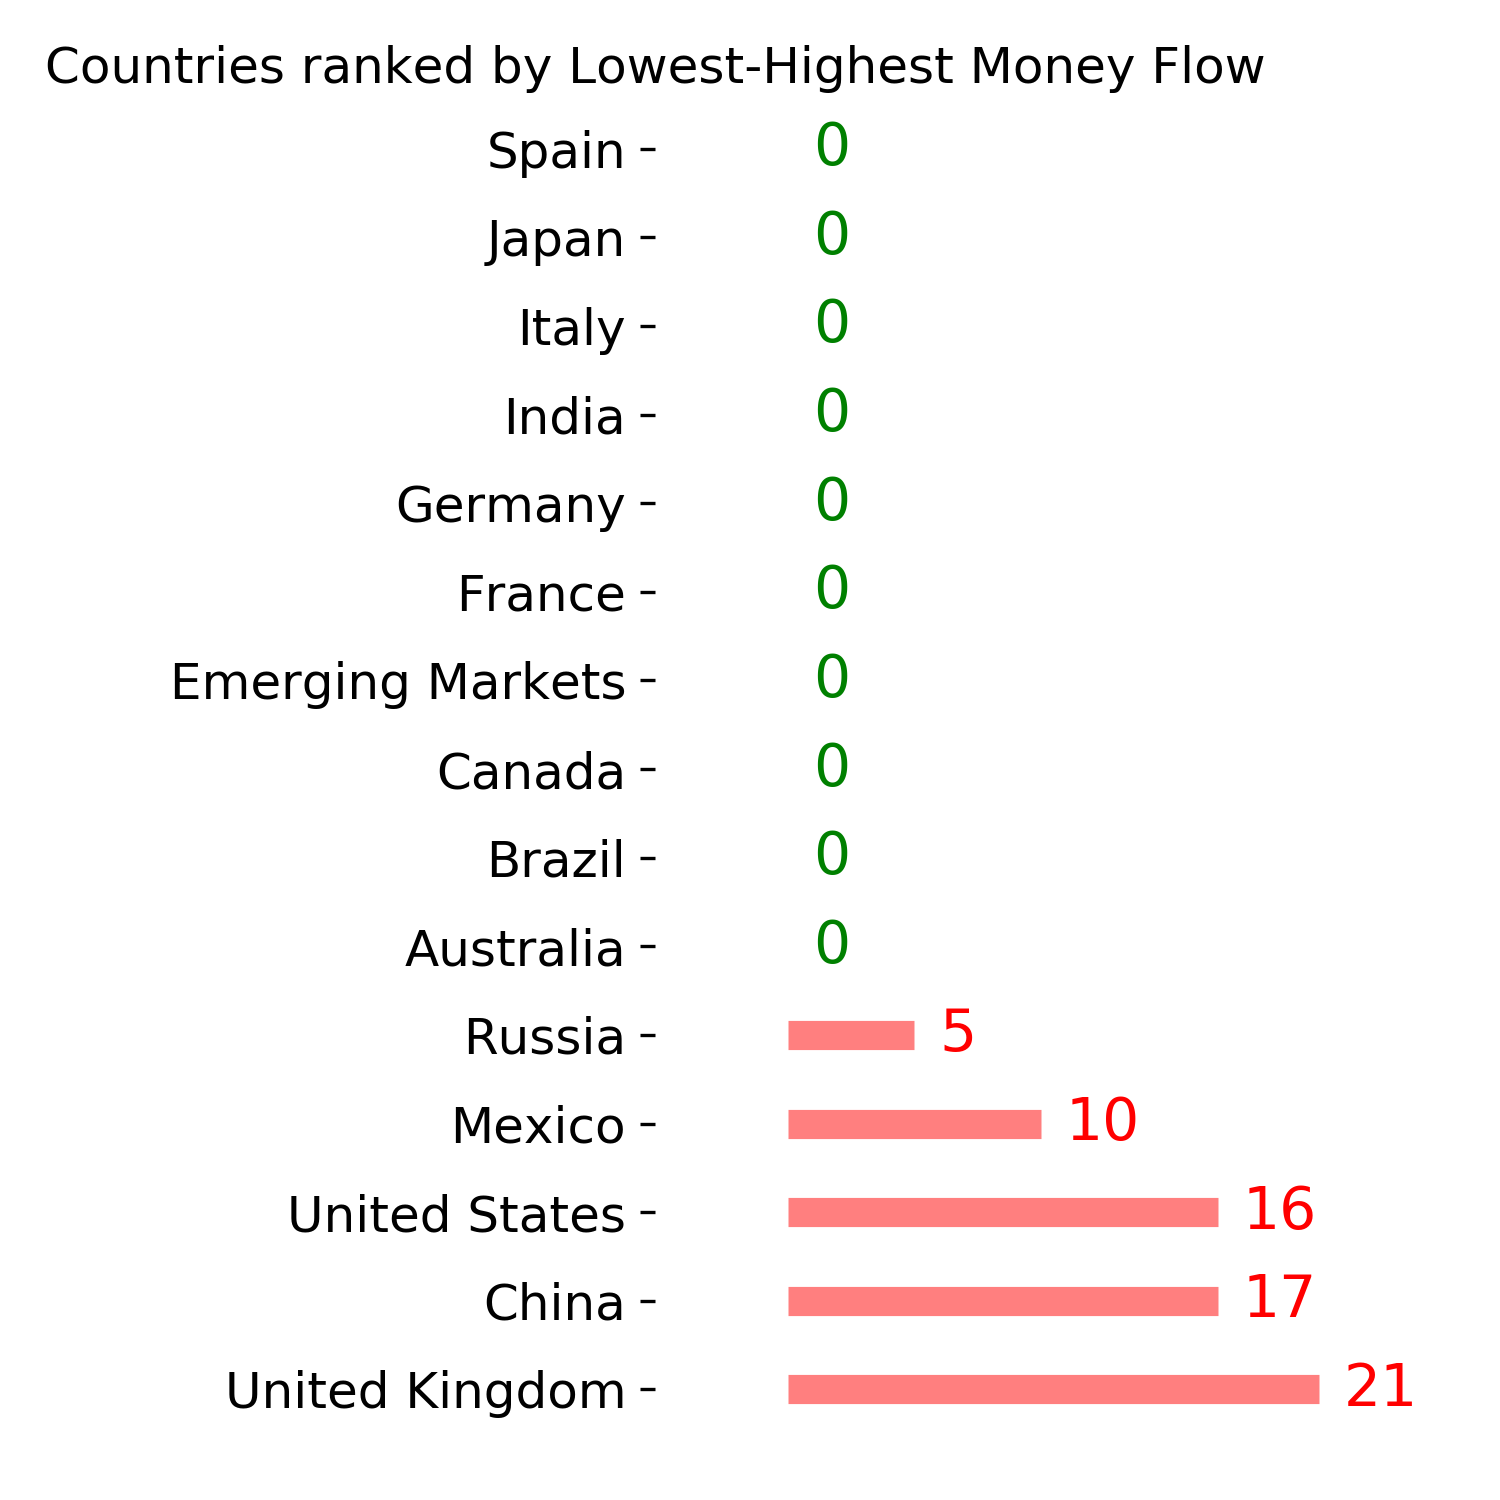
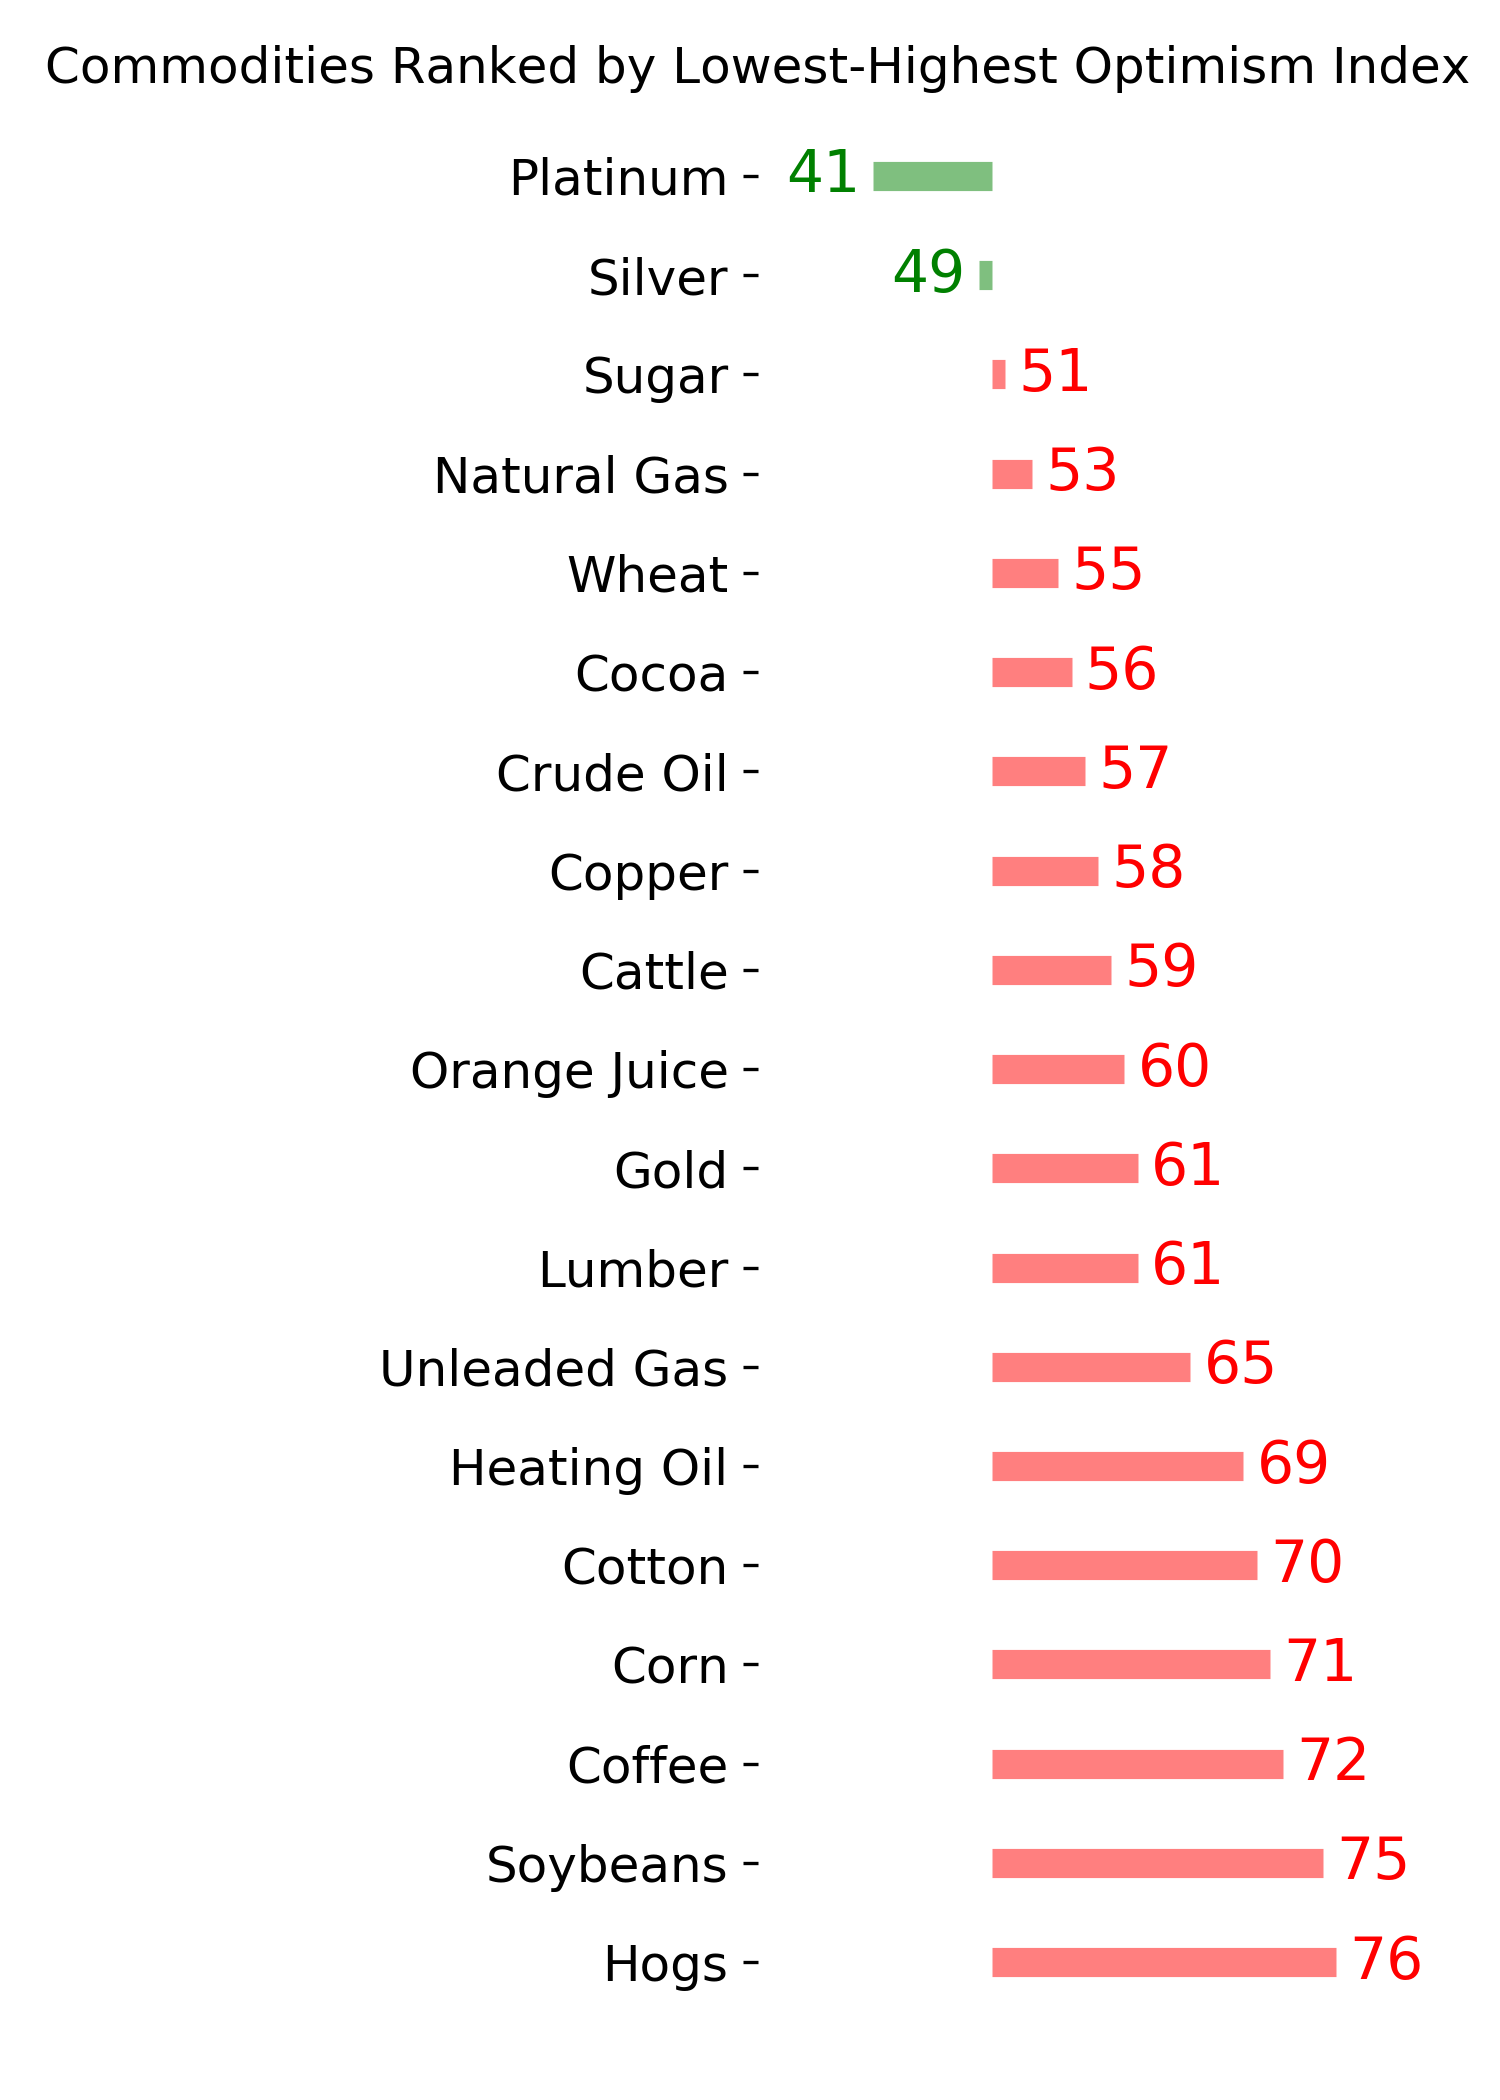
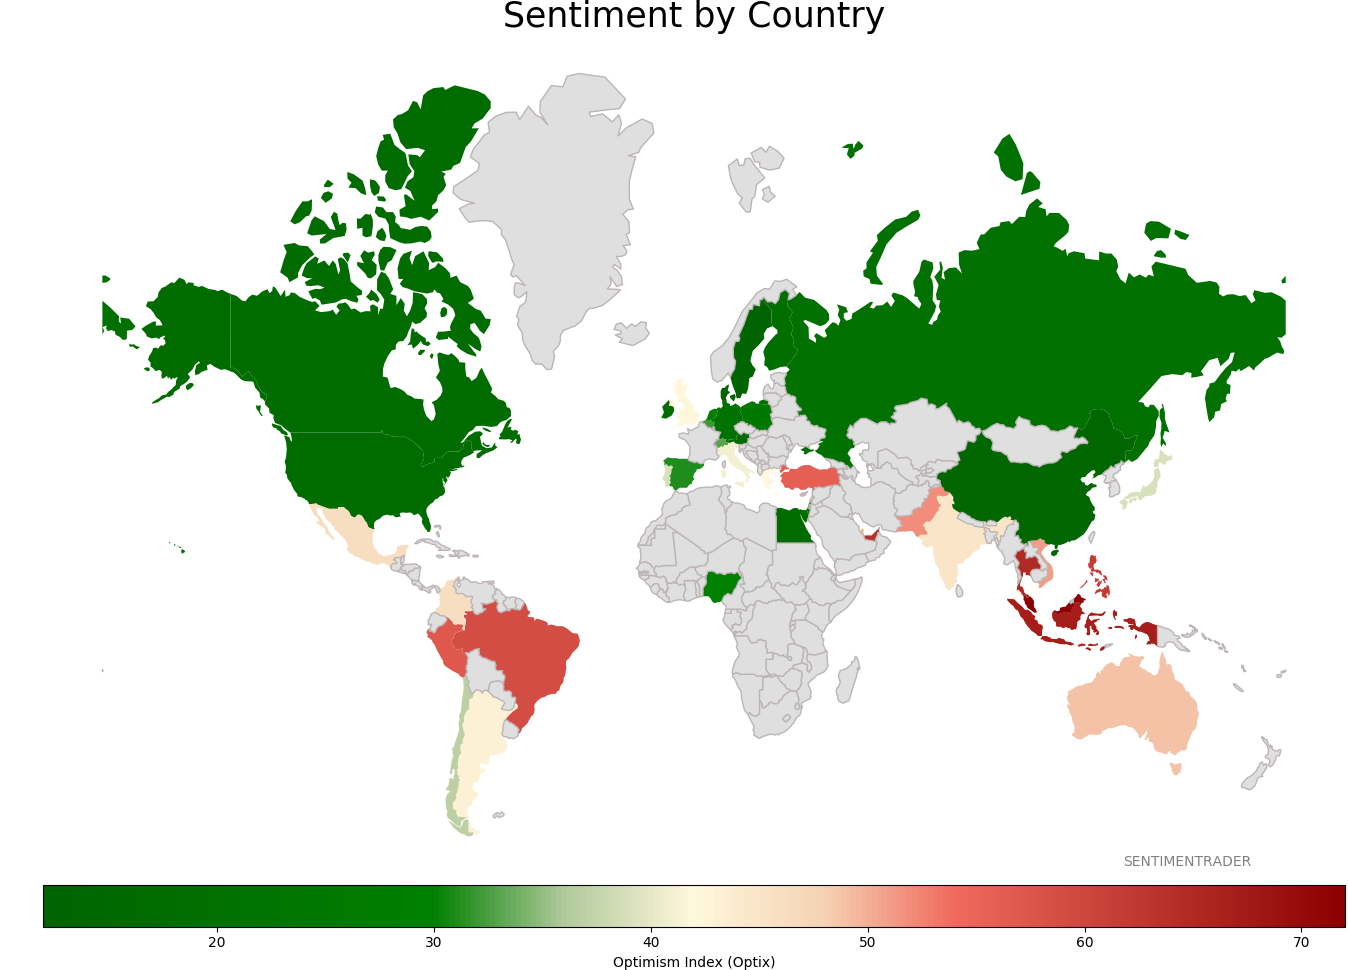
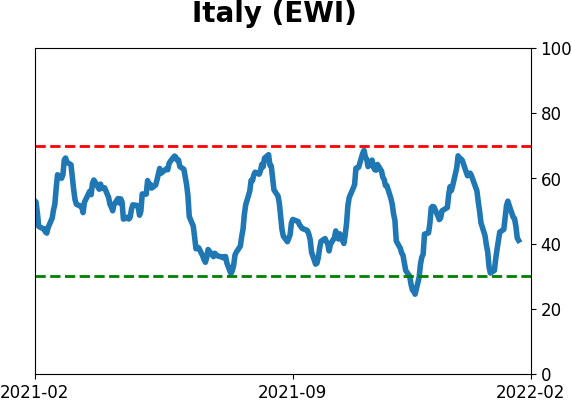
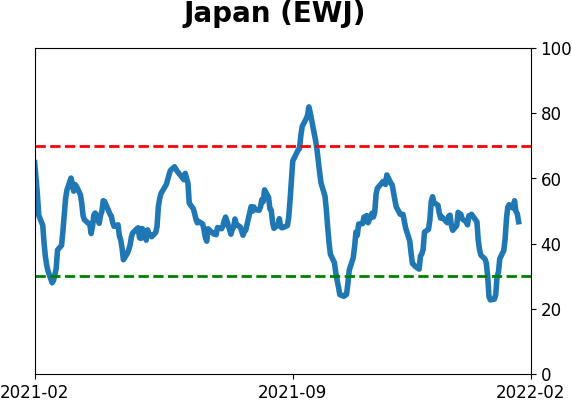
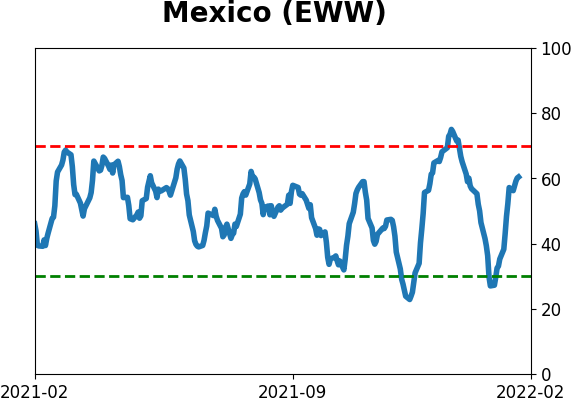
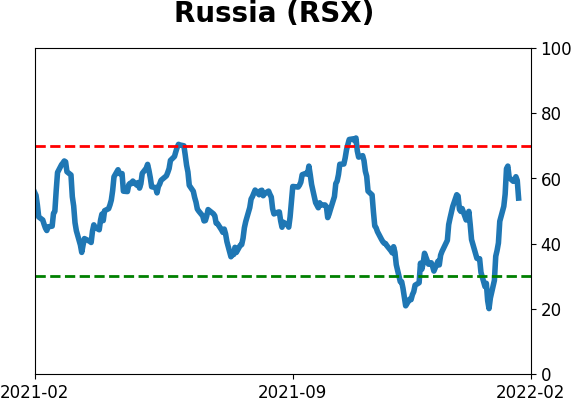
Sentiment Around The World
Optimism Index Thumbnails
|
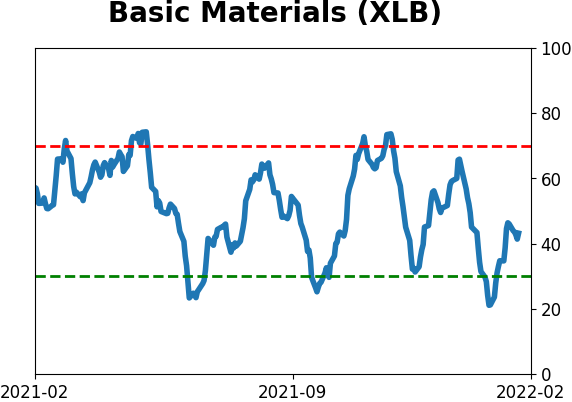
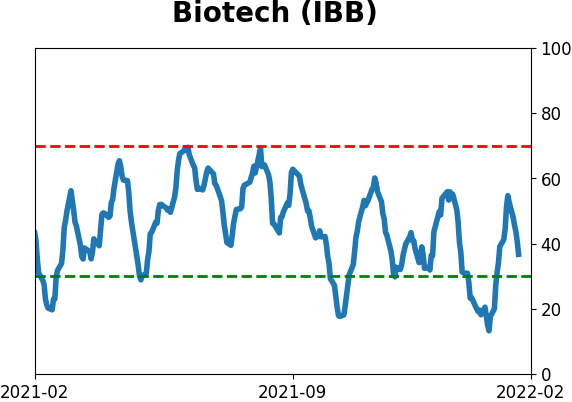
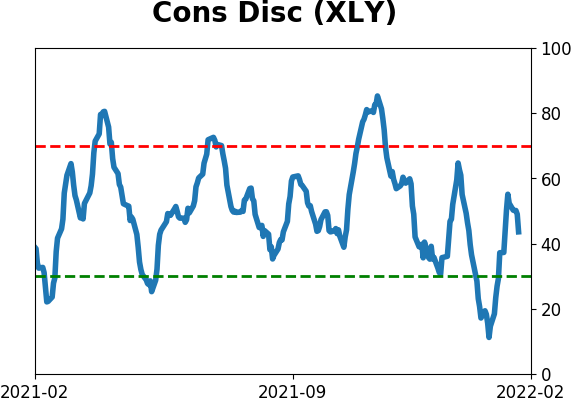
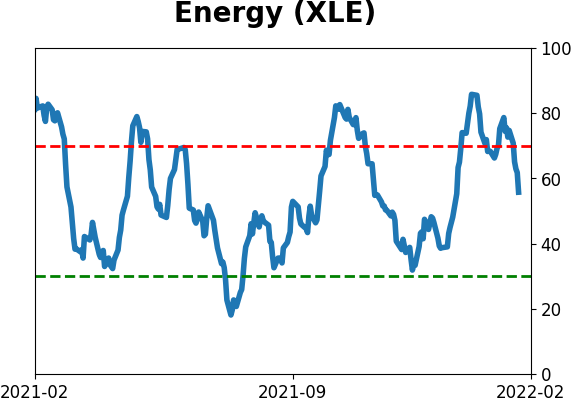
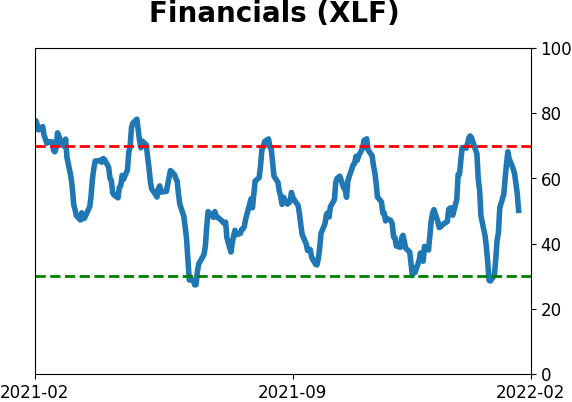
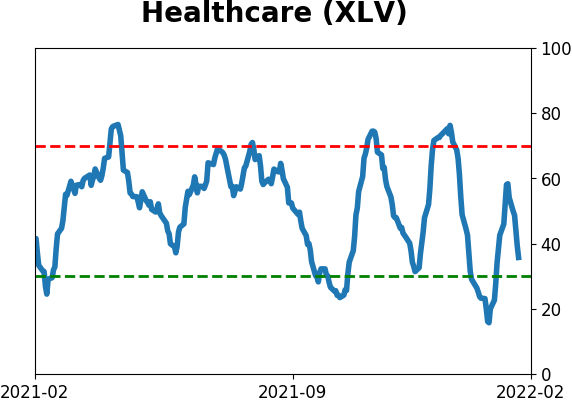
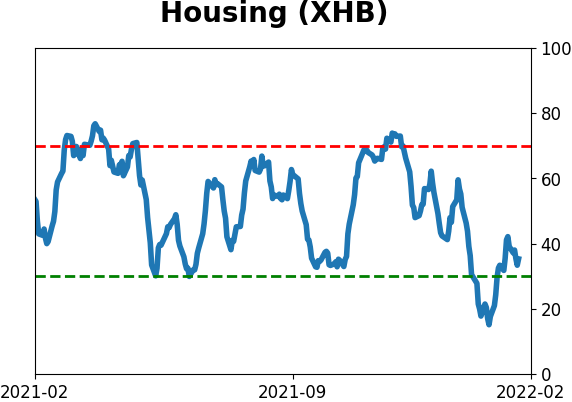
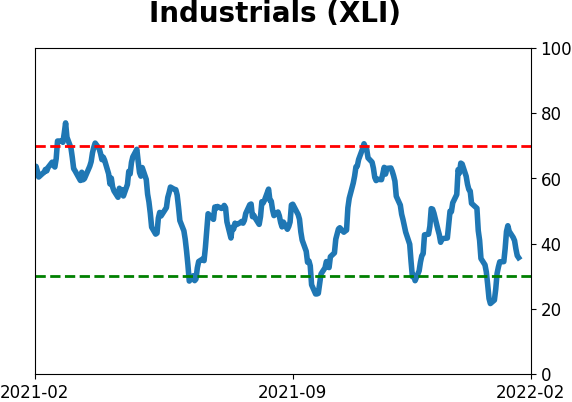
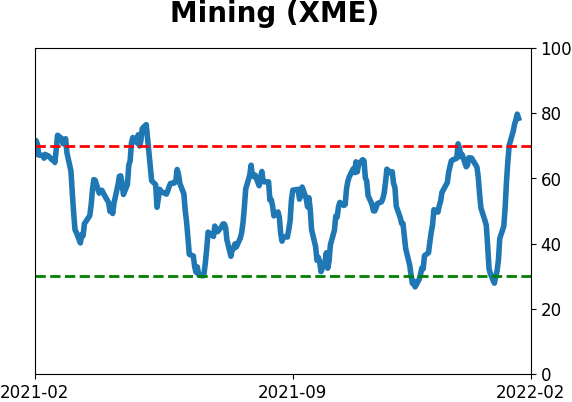
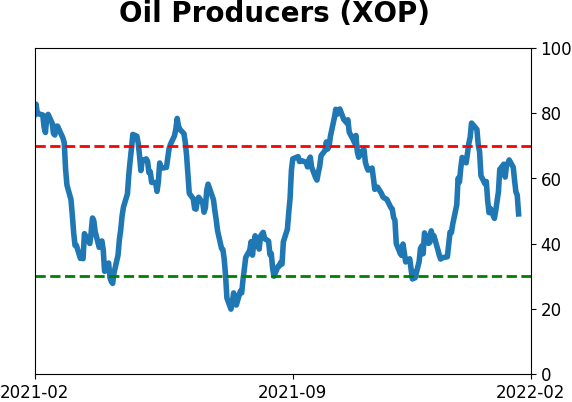
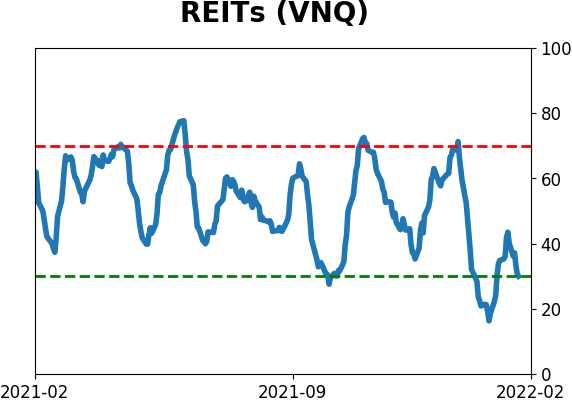
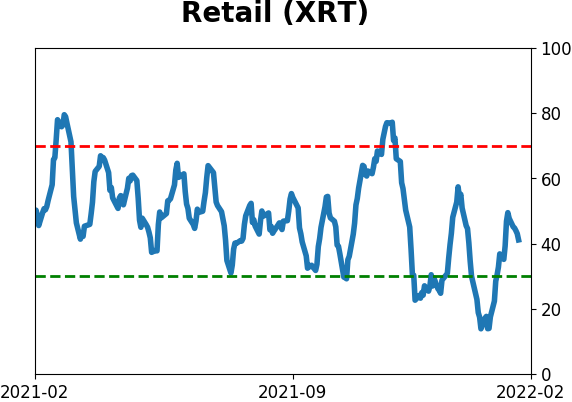
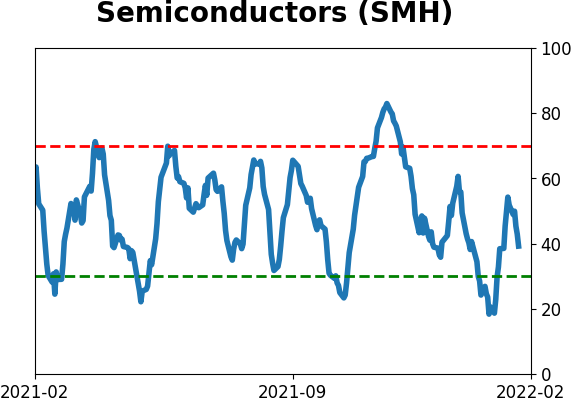
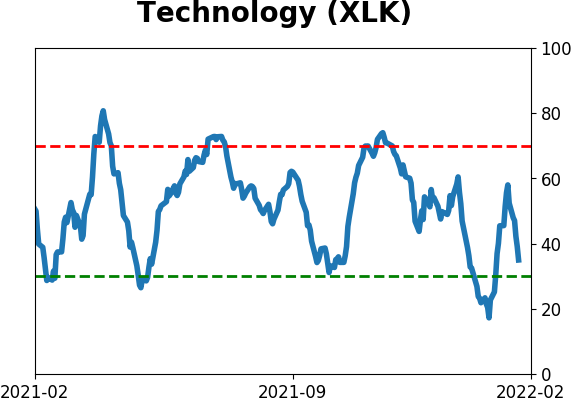
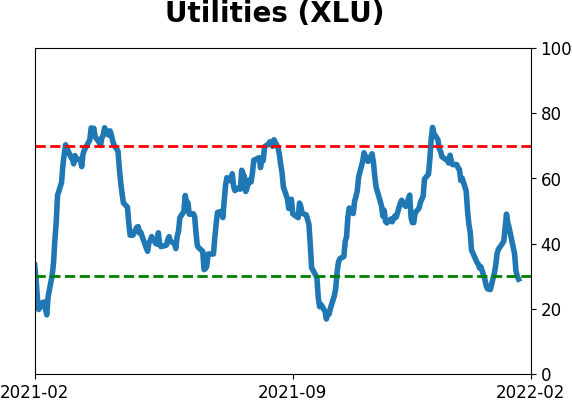
Sector ETF's - 10-Day Moving Average
|
|
|
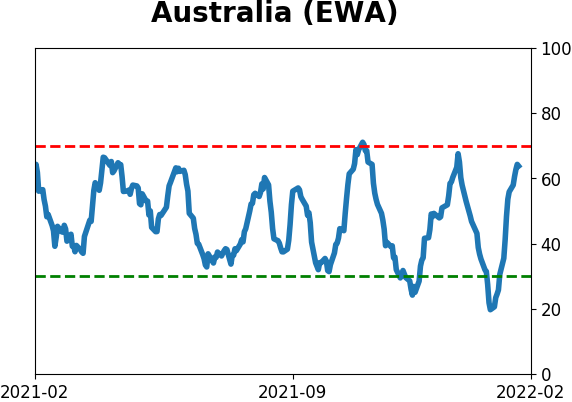
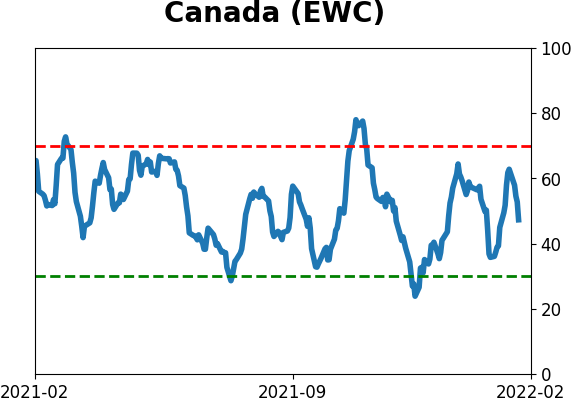
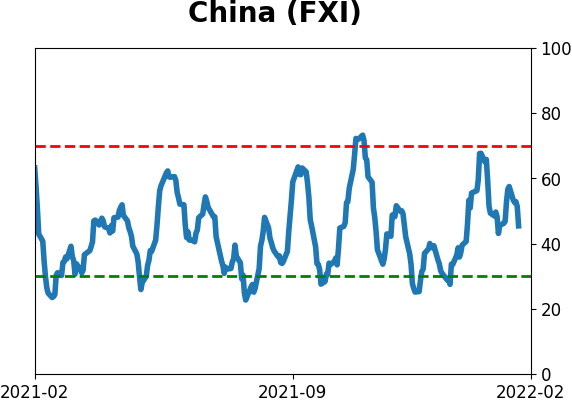
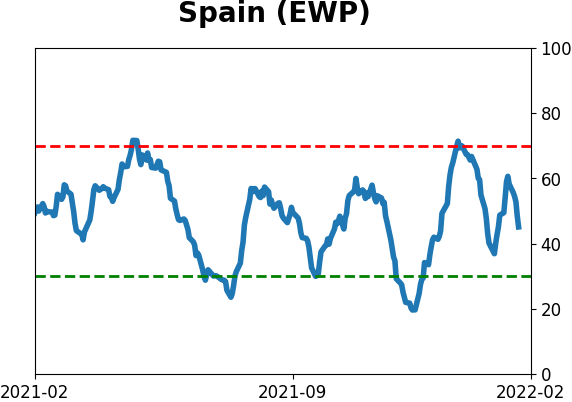
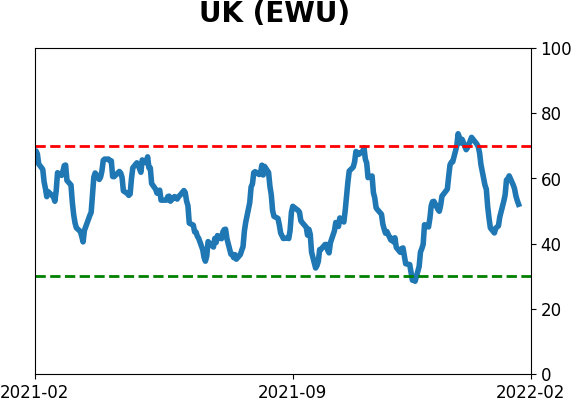
Country ETF's - 10-Day Moving Average
|
|
|
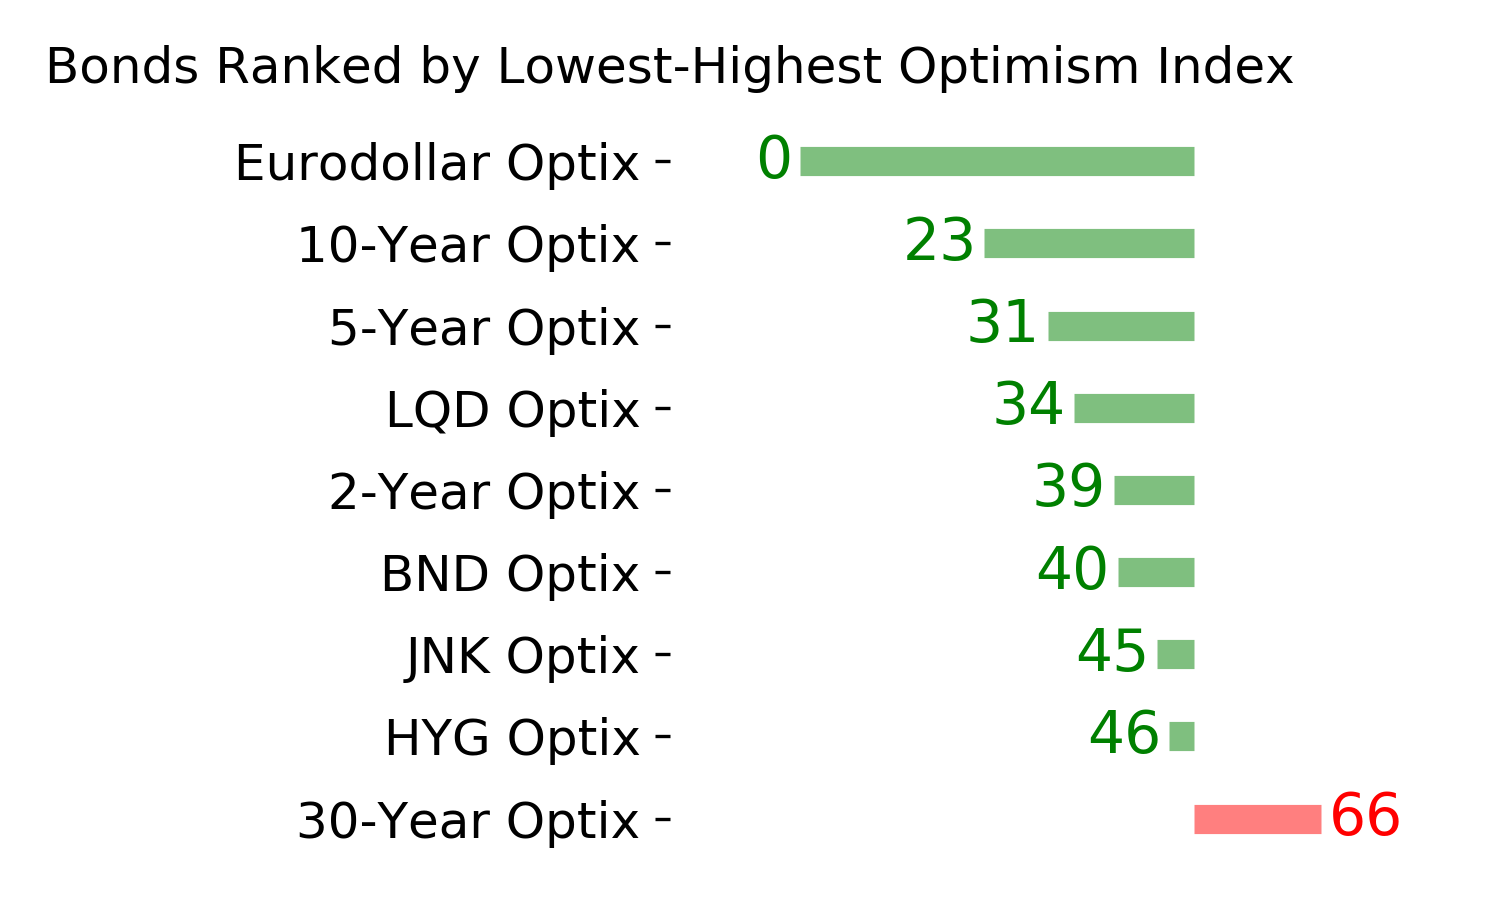
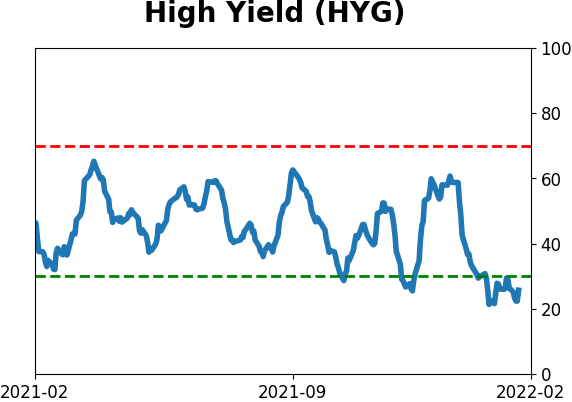
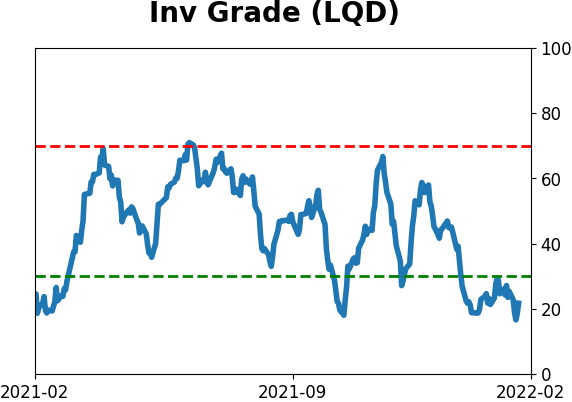
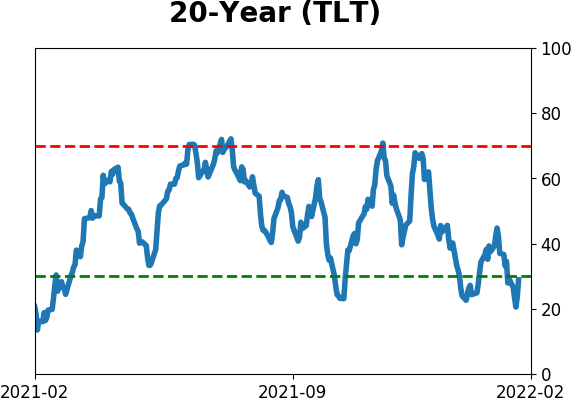
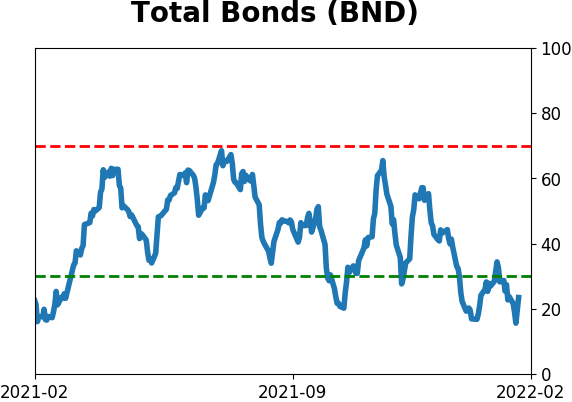
Bond ETF's - 10-Day Moving Average
|
|
|
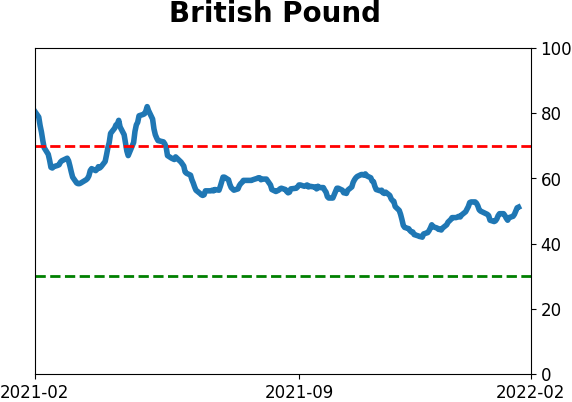
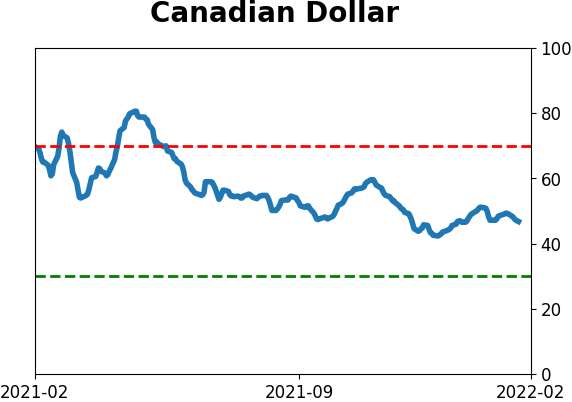
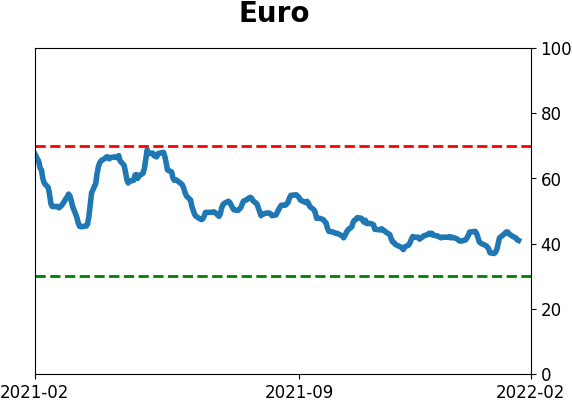
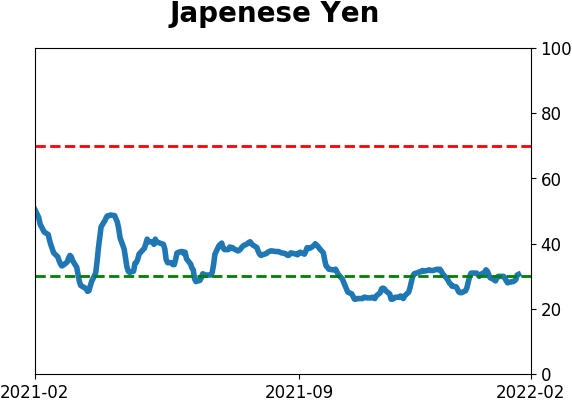
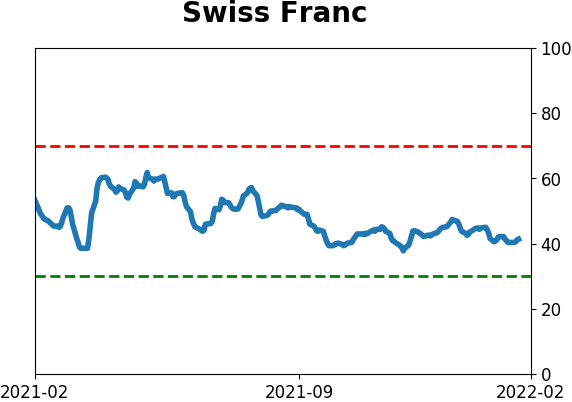
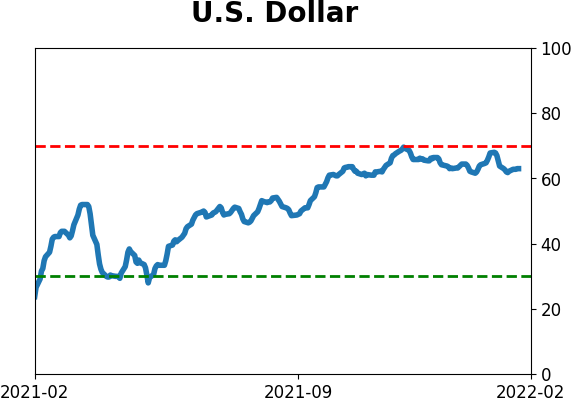
Currency ETF's - 5-Day Moving Average
|
|
|
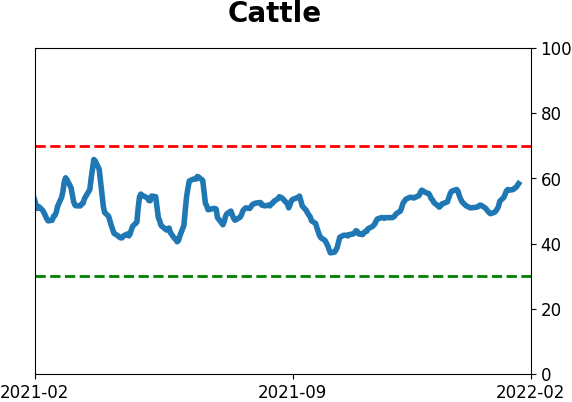
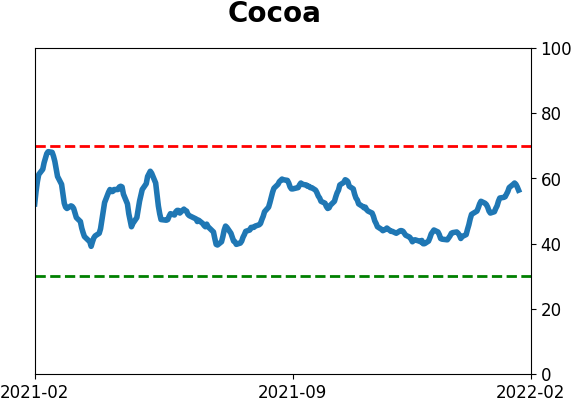
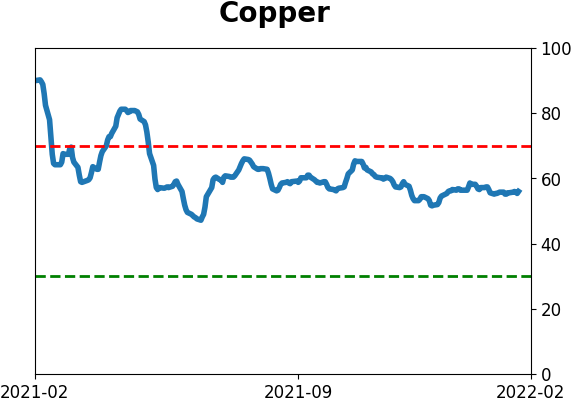
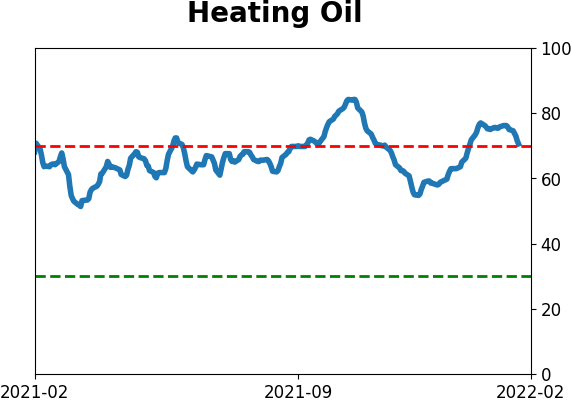
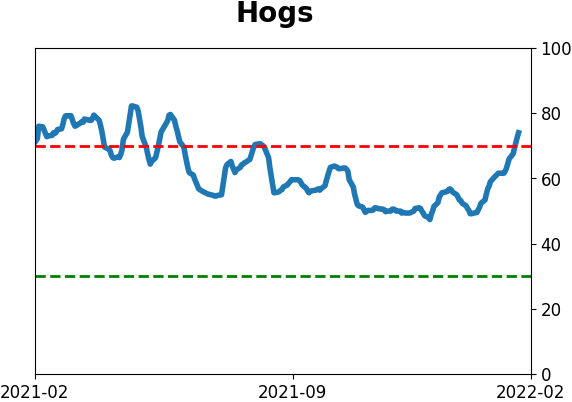
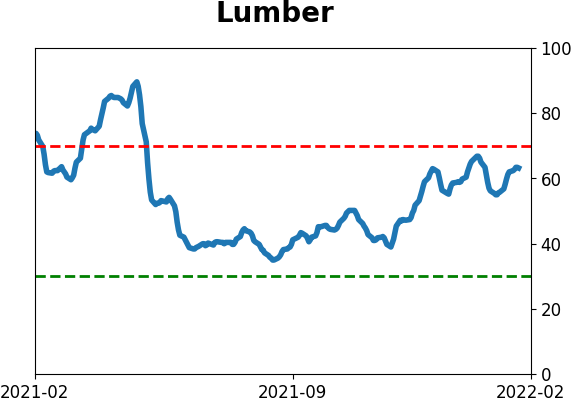
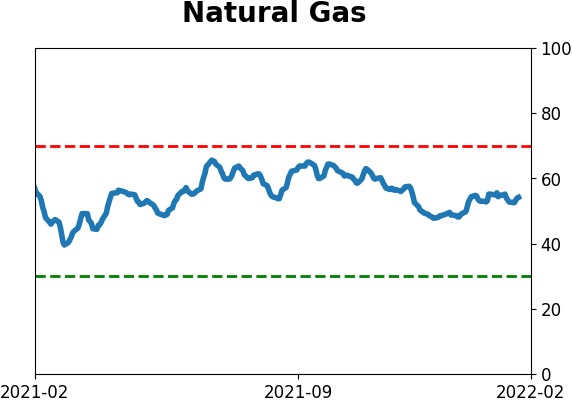
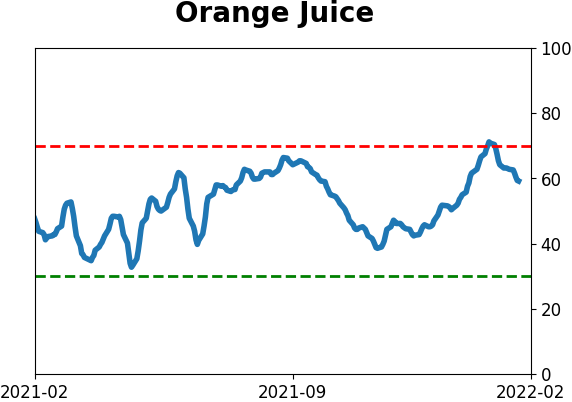
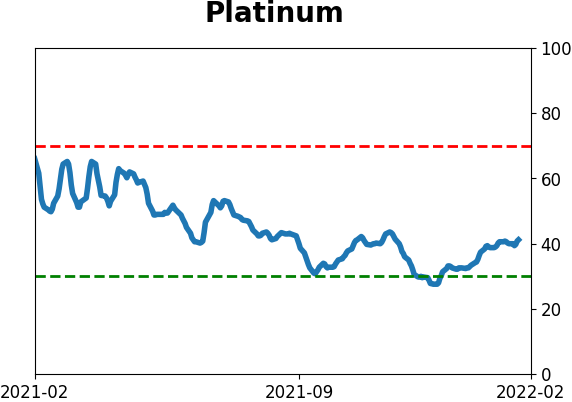
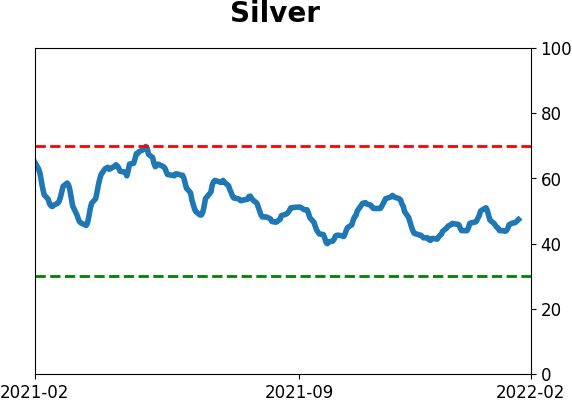
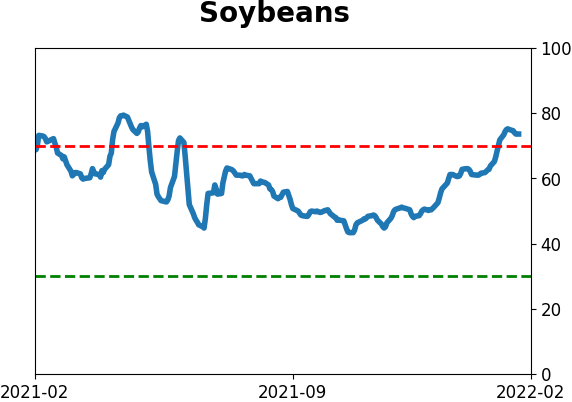
Commodity ETF's - 5-Day Moving Average
|
|