Daily Report : TradingEdge Weekly for Feb 17 - Bull market momentum, stock optimism, bond pessimism

| View/Print a PDF version of this Report |
Headlines
|
TradingEdge Weekly for Feb 17 - Bull market momentum, stock optimism, bond pessimism: This week, we saw that in the four months since the S&P 500 bottomed, there has been a historic number of days with overwhelming buying interest. That has helped reverse the long-term momentum in the index. A surge in the Nasdaq vs. the Dow has helped to increase investor optimism, but small traders are still buying put options. |
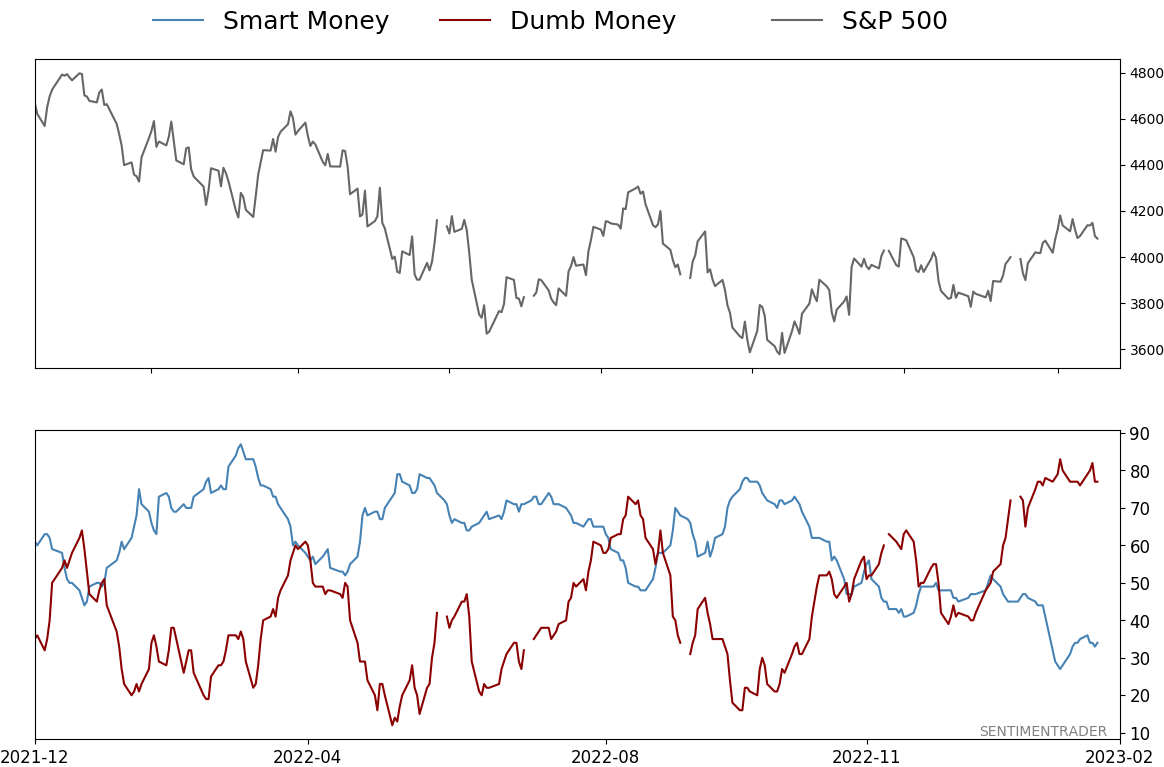
Smart / Dumb Money Confidence
|
|
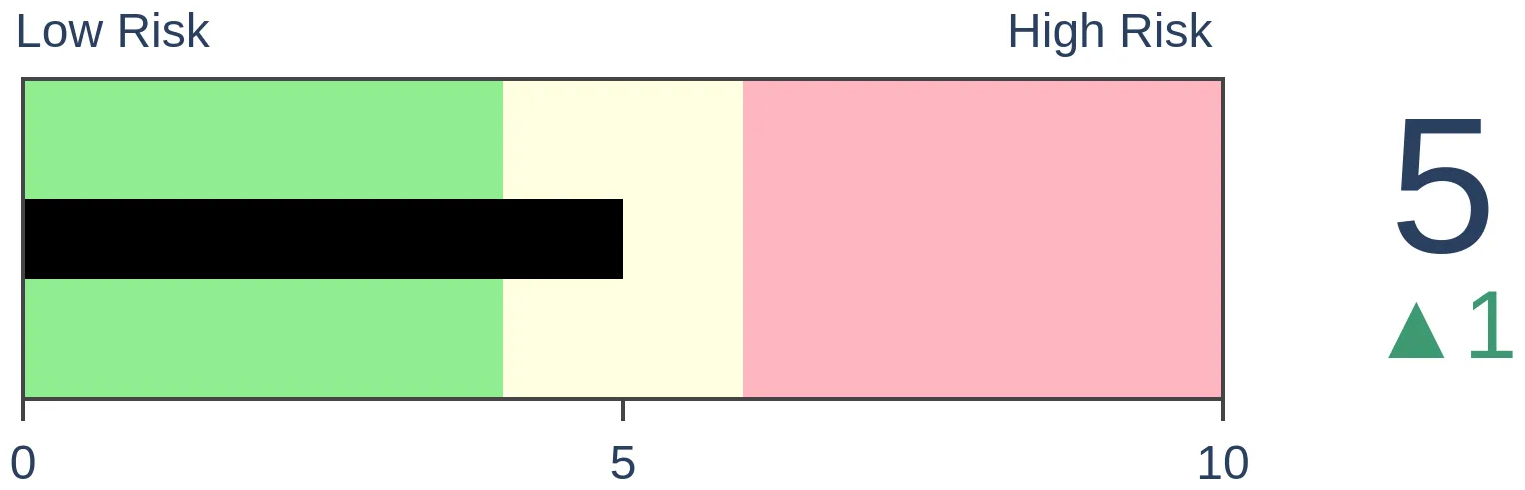
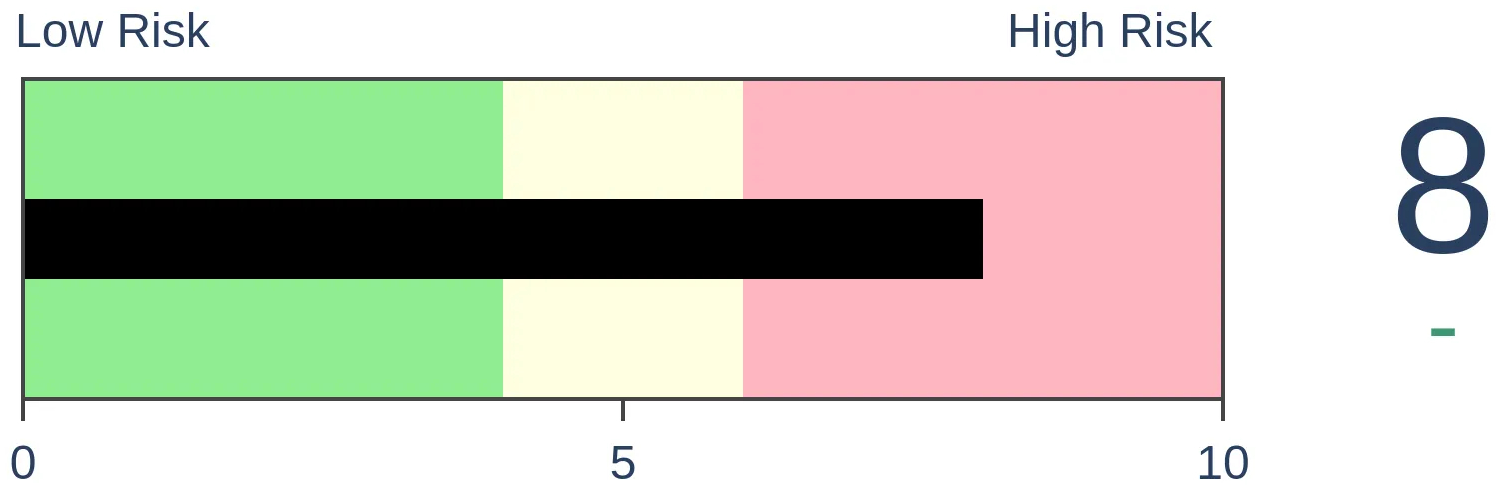
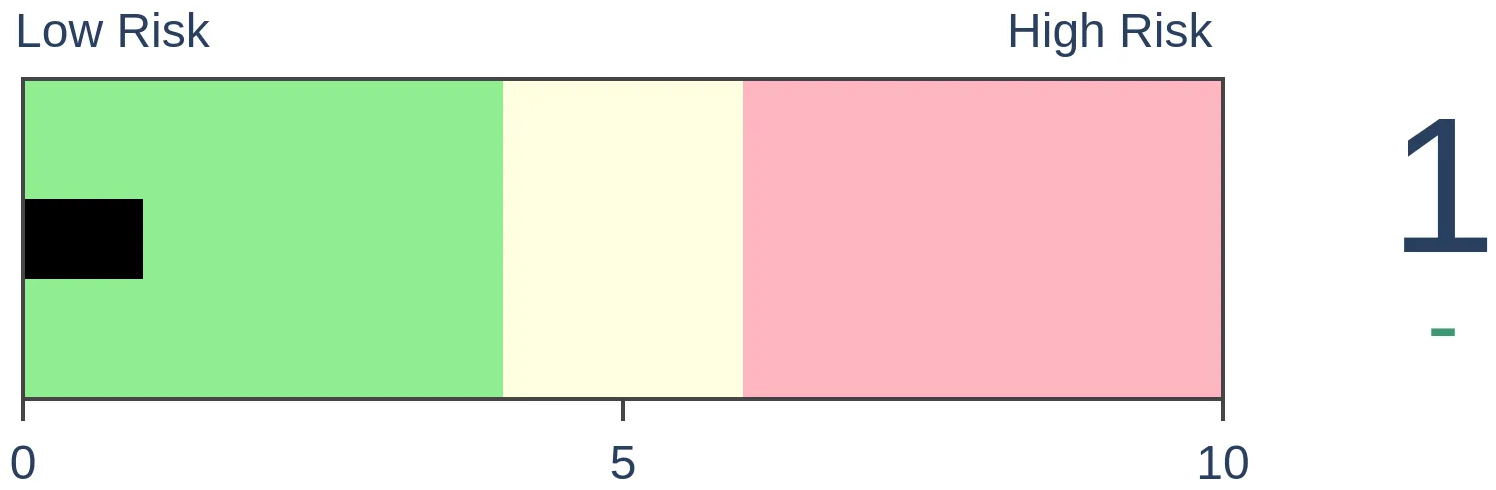
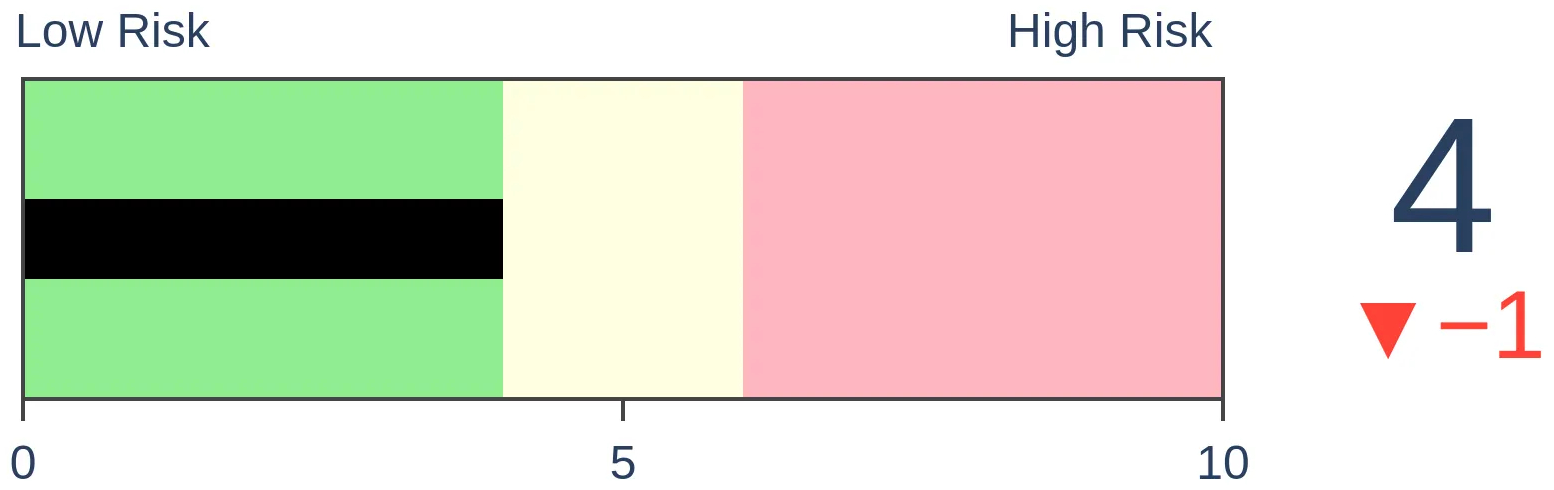
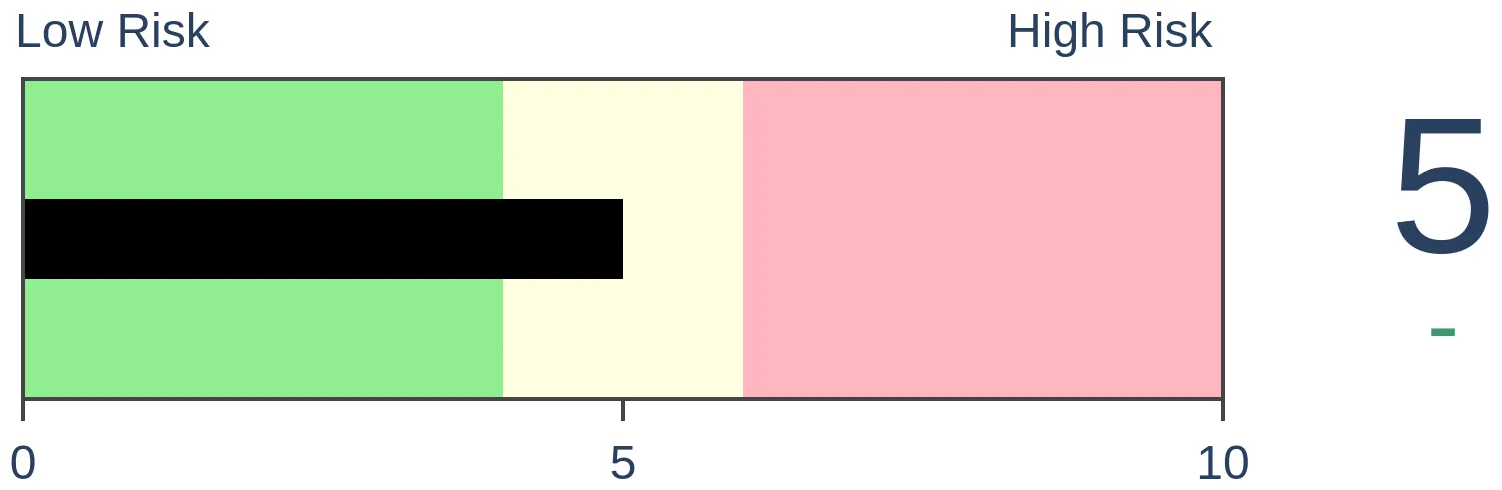
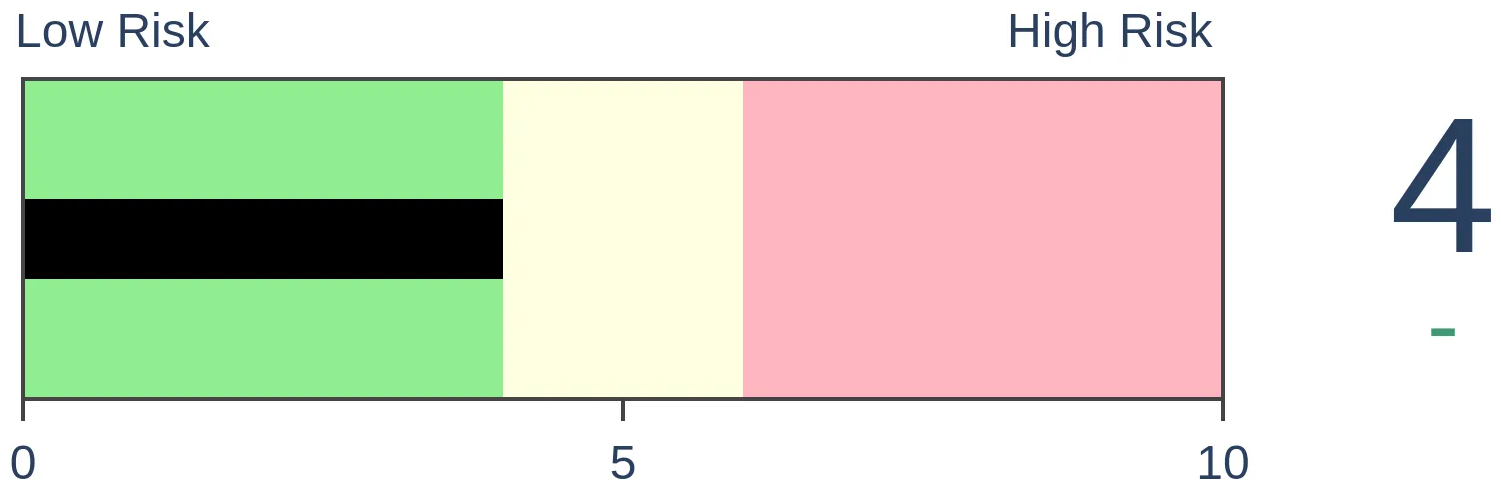
Risk Levels
|
|
|
Research
TradingEdge Weekly for Feb 17 - Bull market momentum, stock optimism, bond pessimismBy Jason GoepfertBOTTOM LINEThis week, we saw that in the four months since the S&P 500 bottomed, there has been a historic number of days with overwhelming buying interest. That has helped reverse the long-term momentum in the index. A surge in the Nasdaq vs. the Dow has helped to increase investor optimism, but small traders are still buying put options. FORECAST / TIMEFRAME |
Key points:
- In the four months since the S&P 500 bottom, there has been a historic number of 80% up days
- Long-term momentum in the index has reversed
- The Nasdaq Composite has surged relative to the Dow Industrials to start the year
- Optimism is increasing, but small options traders are still buying puts
- Sentiment surveys show rapidly rising optimism
- A trend composite in 10-year Treasury yields is giving a perfect score
- Bond pessimism is getting extreme
- Adjusting a bearish bond option trade that is currently showing a profit
- Commodities are entering a seasonally positive window
- Sugar, however, is facing the opposite seasonal tendency
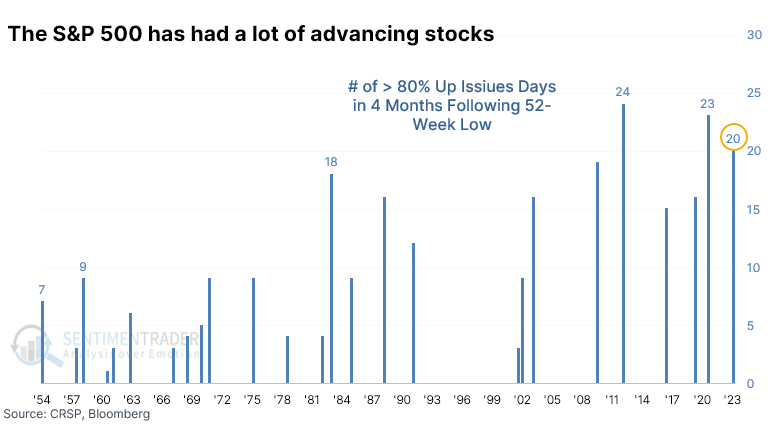
A historic cluster of buying demand
It's been one heckuva run for stocks over the past four months.
We use the historical average of 21 trading days in an average month. The S&P 500 bottomed on October 12, which was 84 trading days, or four months, ago. Since then, it has enjoyed a remarkable cluster of days with overwhelming buying interest.
Over these four months, there have been 20 days when more than 80% of stocks within the S&P 500 advanced. Dating back to 1950, this has been one of the largest-ever clusters of days with so many rising stocks during the four months following a 52-week low.
There has been a lot of oomph behind that buying interest, as well, since the number of days with 80% or more volume flowing into those rising stocks has spiked. The 18 days with such overwhelming volume flow is tied for the 4th-largest since 1950.
If we combine the two metrics, there were 38 instances of 80% or greater Up Issues and/or Up Volume in the four months following the low. Looking at the four-month stretches following all 52-week lows in the S&P since 1950, this ranks as the 4th-most ever. The bottoms that enjoyed the largest clusters of 80% days enjoyed pristine returns over the next 2-12 months with no losses.
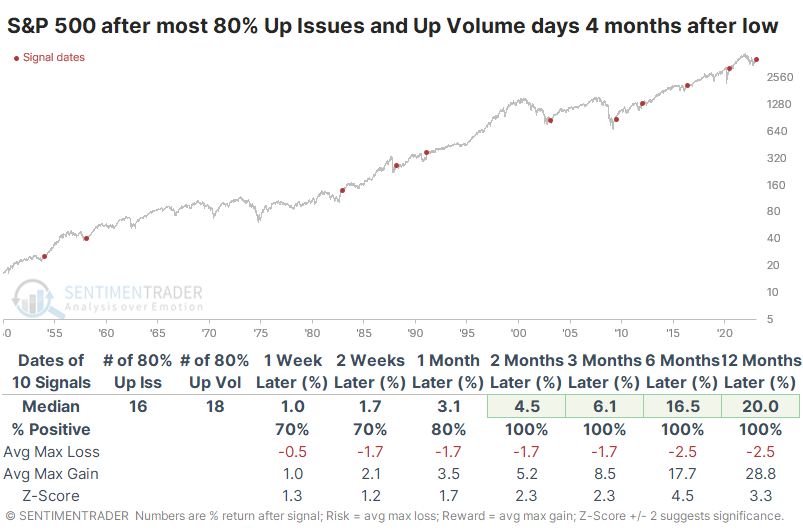
The risk versus reward following these "thrusty" bottoms was phenomenal. Within the next year, not a single precedent declined more than -5.5% at any point, while all of them enjoyed a rally of at least +12.9%, and on average, much more than that - nearly +29%.
We like to look at counterexamples when sample sizes are small. If the opposite scenarios tend to generate the opposite returns, then we can have a bit more confidence in the data. After the four-month bottoms with the fewest number of 80% up days, and the S&P 500's forward returns were significantly worse for it, with much higher risk and much lower reward.
Long-term momentum has reversed
Momentum can be a powerful force in the stock market. Jay showed that when S&P 500 momentum cycles from negative to positive, which just happened, it typically signals a new upleg.
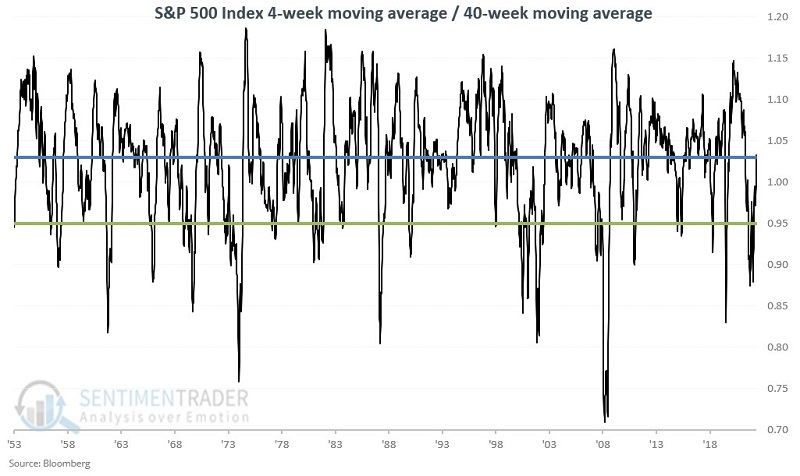
The SPX 4/40 Momentum indicator uses weekly closing prices for the S&P 500 Index and is extremely simple to follow. A bullish signal triggers when the 4-week moving average falls 5% or more below the 40-week moving average. Then it is a matter of waiting for the 4-week moving average to move back to 3% or more above the 40-week moving average (using weekly closing prices).
The black line in the chart below displays the 4-week/40-week ratio since 1953. The horizontal blue and green lines highlight the 1.03 and 0.95 levels.
A bullish signal lasts for 39 weeks after the initial cross above 1.03. The chart below displays the growth of $1 invested in the S&P 500 Index only during the 39 weeks after each signal (displayed on a logarithmic scale).
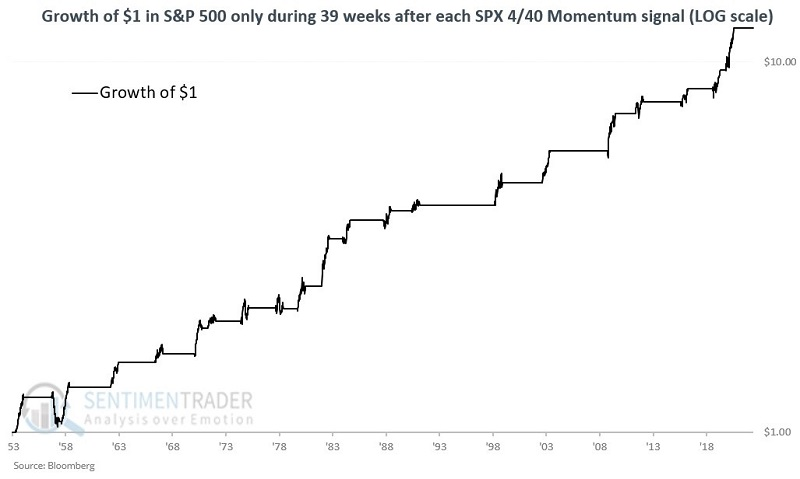
The S&P rallied after 90% of the signals, with 19 winners out of 21 trades. The average gain was more than twice as large as the average loss, and the index rose more than 10% on 12 occasions while suffering more than a -10% loss only once.
The new "live" page of Dean's TCTM model furthers this concept, and Dean studied the signals going back to 1928.
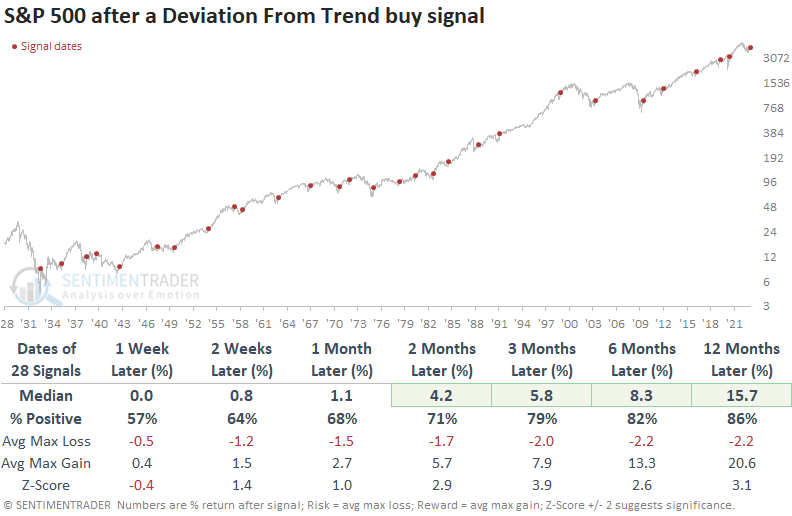
The deviation from trend model generated a signal 28 other times since 1932. After the others, returns, win rates, and z-scores were excellent across most time frames. In every case, the signal showed a gain at some point in the first year.
The Nasdaq has surged relative to the Dow - and that's a good thing
Even with a pullback last week, stocks have gotten off to a roaring start. Especially some of them that had been left for dead.
This is the 2nd-best start to a year for the Nasdaq relative to the Dow in the 50 years since the inception of the Composite index. The year 2000 certainly sticks out as a precedent, but so do 1991 and 1985. We don't hear about those in the media because they didn't lead to disaster.
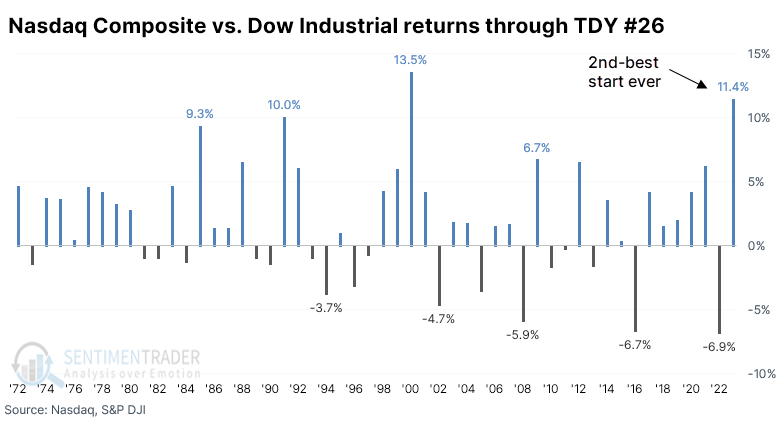
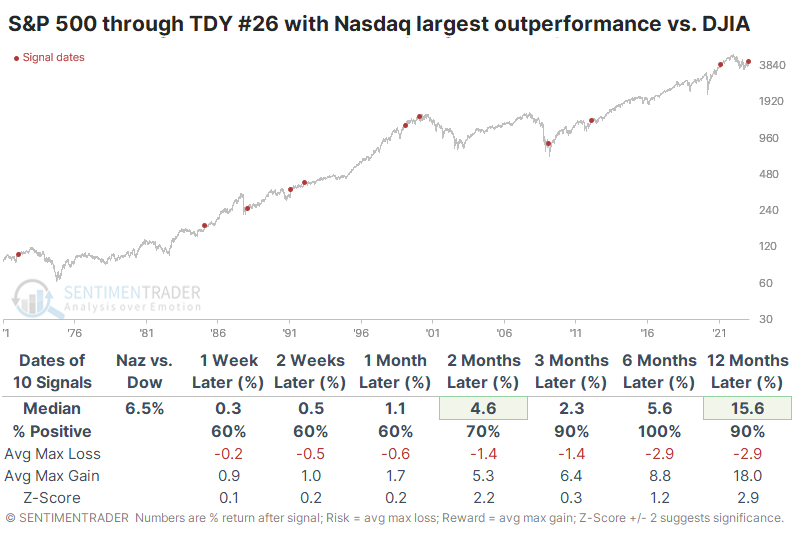
To see what kind of impact fast starts for the Nasdaq vs. Dow had for the broader market, the table below shows the S&P 500's future returns after the Nasdaq Composite showed its best returns relative to the Dow Jones Industrial Average through Trading Day of the Year (TDY) #26.
Even with the year 2000 included, the S&P 500 never showed a negative return over the next six months. It showed above-average gains across every time frame, with an excellent skew of maximum gains relative to maximum losses.
Compare those years to those with the worst starts for the Nasdaq vs. Dow. During these years, the S&P tended to show negative returns over the next 3-6 months, though there were a few significant gains. For the two indexes, fast starts for the Nasdaq tended to continue, but it wasn't a decisive edge.
Optimism is increasing, but small traders are still buying puts
A historically bad bear market, when essentially every major financial asset declines together, has caused investors to become supremely skeptical. While there are signs that optimism has returned in some respects, there is also a tendency to see a monster under every bed.
Because we witnessed a blowoff peak in options activity two years ago, everyone is looking for a repeat, with a similar repeat of the outcome. That's fighting the last war. Humans never change.
There has been a recent jump in call buying to open among small options traders but they also continue to buy massive numbers of put options as well. That means the ROBO Put/Call Ratio remains elevated. It's well above its average for when the S&P 500 has formed a significant peak.
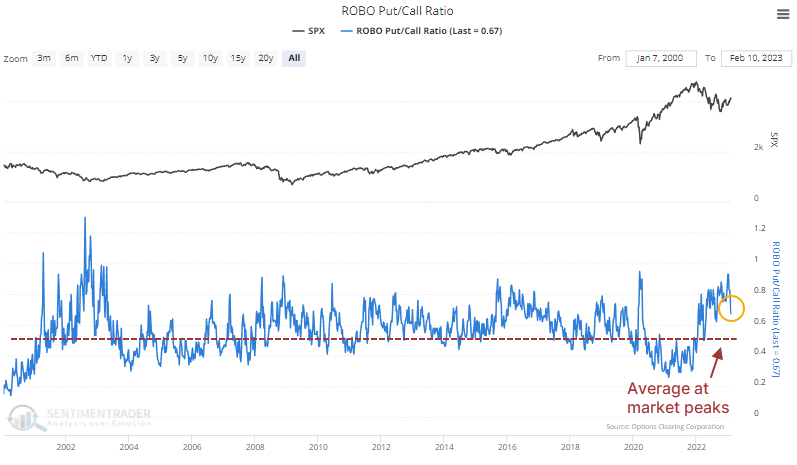
In fact, the ROBO Put/Call Ratio is above where it was at every single major peak in the S&P over the past 23 years. This means that if the S&P is peaking now, it wouldn't be because of excessive speculative activity among retail traders.
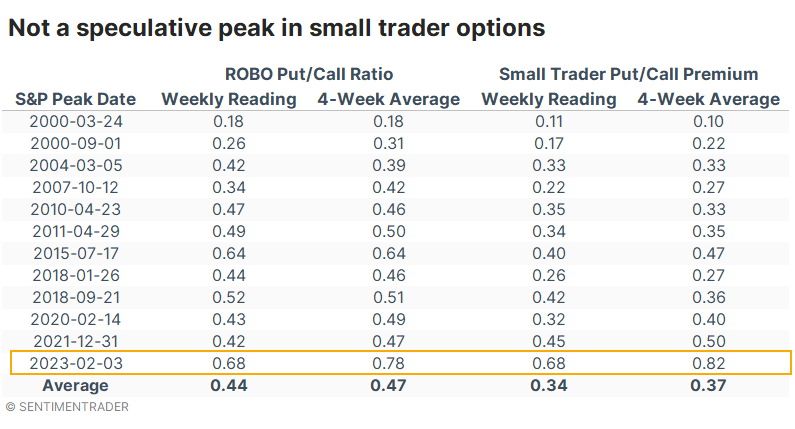
It's even more pronounced when we consider the premiums traders spent on those puts relative to calls.
If we look at every major peak in the S&P 500 over the past 23 years, along with the weekly and four-week average ROBO Put/Call Ratio reading at those times, the most recent peak is far away from any of the others. If the S&P peaked in February, it would be a total outlier, with much higher readings (more pessimism) in the options data than any other peak.
There seem to have been some games played in the options market among the largest of traders, but they also have picked up their call buying. Even so, put buying remains high, the LOBO Put/Call Ratio is elevated, and overall options premiums remain skewed to the put side.
Longer-term sentiment surveys are showing a drastic rise in optimism
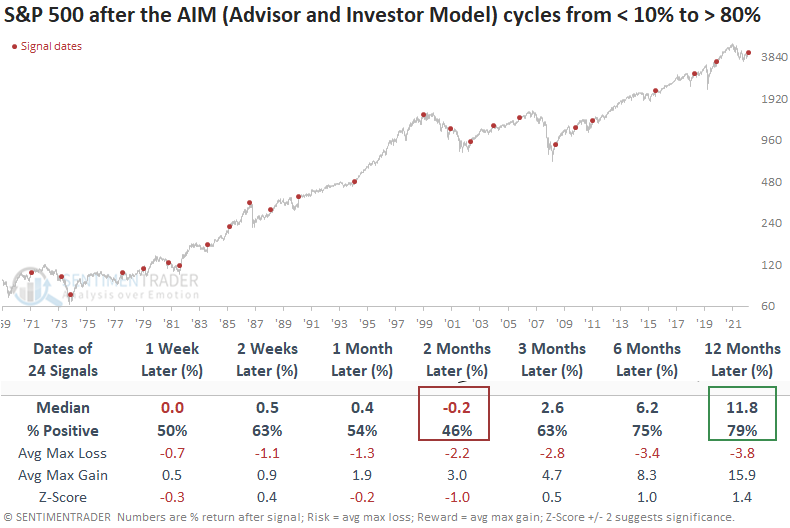
Dean showed that sentiment surveys reflect rapidly rising optimism. Our Advisor and Investor Model (AIM) cycled from < 10% to > 80% and after similar reversals in sentiment, the S&P 500 tends to consolidate over the next few months. With the latest update to the model this week, the AIM indicator recovered from near the bottom of its range to the upper 19% of it.
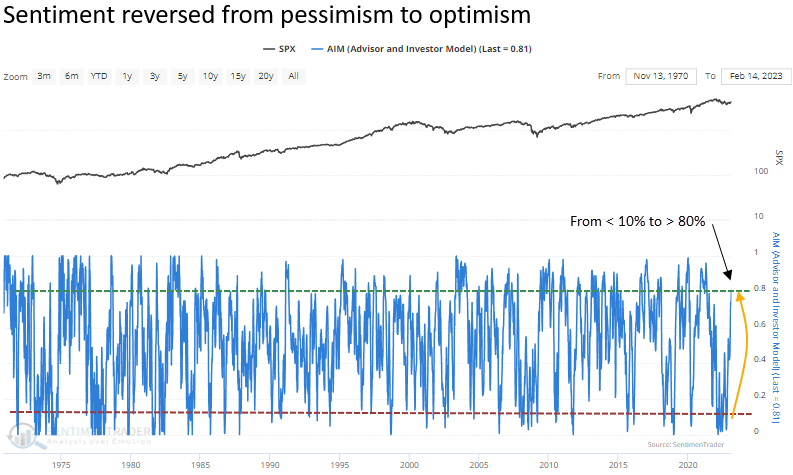
When the AIM indicator cycles from < 10% to > 80%, the S&P 500 struggles over the next few months. However, the setup is most likely a pause that refreshes. A year later, the index was higher 79% of the time, with only two untimely whipsaw signals during a countertrend move in a bear market.
Rising bond yields could rise even more
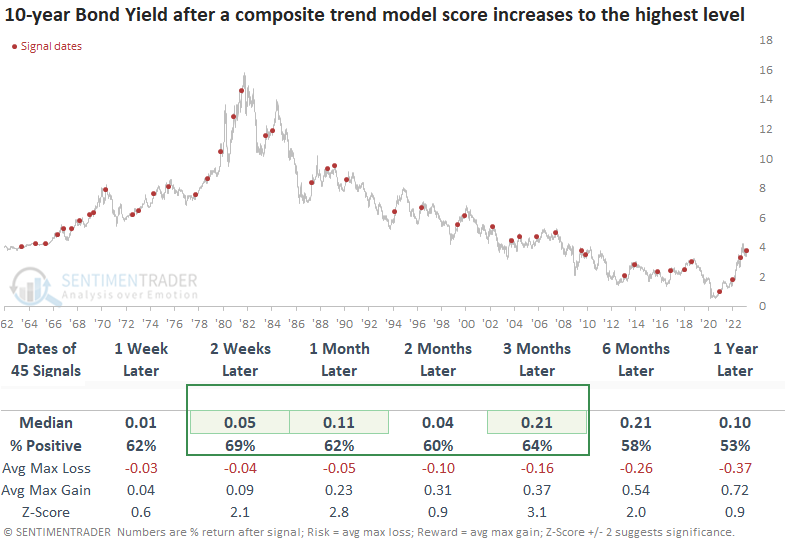
A composite Dean created that measures the trend strength for the 10-year yield surged to the highest level possible. After similar trend score changes, the 10-year yield was higher two weeks later 69% of the time.
A composite that measures the underlying trend for the 10-year bond yield cycled from a score of +2 to +10, reclaiming the highest score possible for a model that ranges from +10 to -10. So, every trend following indicator in the model is bullish.
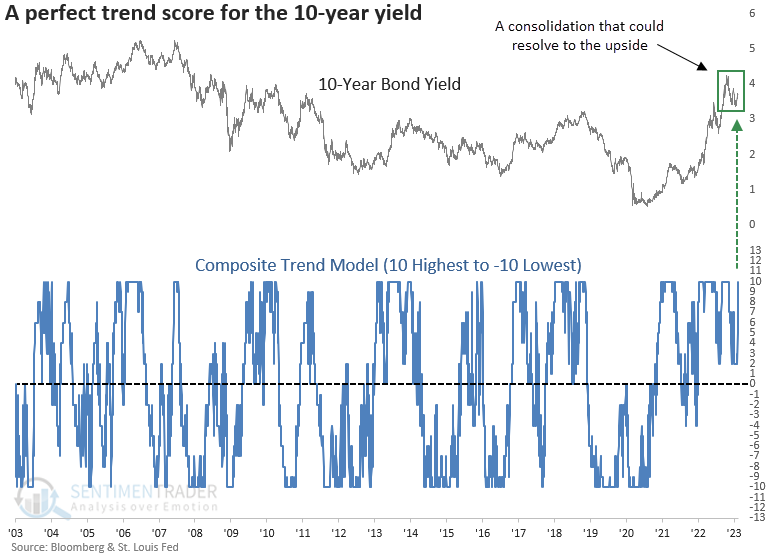
The composite trend model ranges from +10 highest to -10 lowest based on 10 trend-following criteria, such as whether yields close above the 50-day average or if the 200-day average is rising.
When the composite trend model cycles from +2 or less to +10, the 10-year yield tends to rise over the next three months. Consistency was solid, even though many signals occurred during a long secular decline in yields.
The most recent signal and the one from September 2022 occurred without a trend score reset below zero. i.e., the 10-year yield consolidated within an uptrend. Let's isolate signals when the composite score declines to a range of 0 to +2 and subsequently increases to +10.
When the composite trend score increases to +10 from a range between 0 and +2, the 10-year yield is significantly more likely to rise over short to medium-term time frames. The signal shows an increase in the 10-year at some point in the next three months in all but one case.
As we discovered last year, an uptrend in the 10-year yield could pose a problem for stocks on a short to medium-term basis.
Bond pessimism is getting extreme
Coinciding with the rise in yields, a drop in bond prices has pushed several sentiment indicators for that market to pessimistic levels. Our Risk Level reflects that, and Jay noted that the 5-day moving average of Bond Risk Levels recently fell to its lowest possible reading of 1.
Bond market sentiment behaves differently than stock market sentiment, and often it has been more effective to use this as an indicator for markets other than bonds. Over its history, low levels of bond risk have actually preceded poor returns for stocks.
High-yield bonds are much more closely correlated to the stock market than they are to interest rates of treasury bonds. The chart below displays the same signals used with SPX above, and the table shows a summary of HYG performance following previous signals.
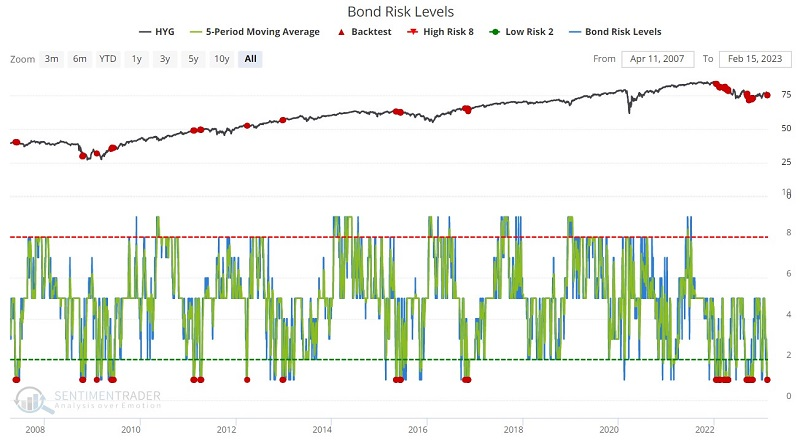
HYG managed to rally less than a third of the time over the next six months, with a very poor average return. This is a bit of a concern after what had been an impressive recovery off the 2022 lows.
Adjusting a bearish bond trade
Jay noted that Treasury bond prices have fallen hard in recent weeks. A previous article detailed a bearish example trade using options on TLT and now it's time to look at one way to adjust the original trade to lock in a profit.
On January 20, Jay highlighted the possibility that interest rates may have entered into a new long-term rising trend. The article also highlighted an example bearish trade using put options on the iShares 20+ Year Treasury Bond ETF (ticker TLT). The chart below (courtesy of Barchart.com) highlights the recent action for TLT and the aforementioned resistance level that it failed to penetrate.
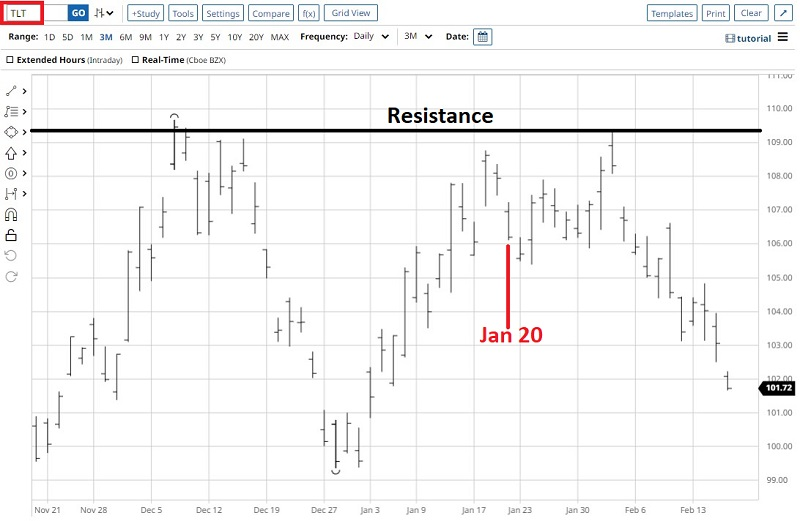
There remains reason to believe that bonds could continue to trade lower. However, given their current oversold status, a bounce is also possible.
Since this piece was written, TLT had fallen from $106.20 a share to $102.02. The TLT Mar17 2023 113 strike price put option had increased from $6.18 per contract to $11.05. At that point, the option trade showed an open profit of $487 per 1-lot, or 78.8% on capital.
Let's assume that a trader holding this open position thinks that bonds could fall further but is nervous about the prospect of watching a good winner potentially turn into a loss. In this case, adjusting the trade can make great sense. Let's consider one possibility.
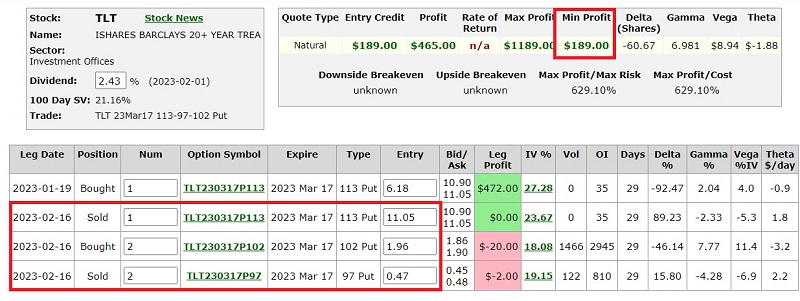
The adjustment involves:
- Selling 1 TLT Mar17 2023 113 put @ $11.05
- Buying 2 TLT Mar172 023 102 puts @ $1.96
- Selling 2 TLT Mar17 2023 97 puts @ $0.47
Selling the 113 put allows us to take a profit of $487 (11.05-6.18 x 100) on the initial cost of $618. Entering the March 17 102-97 bear put spread (in a 2-lot) allows us to accrue more profit if TLT continues to decline. Regardless of what happens to the price of TLT from here, the worst-case outcome is a profit of $189, or 31%, on the original $618 investment.
The screenshot below displays the particulars of the new trade, and the chart shows the risk curves (i.e., the expected P/L as of a given date based on the price of TLT shares at that time).
Commodities are getting a seasonal break
Jay noted that commodities rallied hard from April 2020 into July 2022 but have spent the last seven months consolidating. On the plus side, the CRB Index is entering a seasonally favorable period.
The chart below displays the annual seasonal trend for the CRB Index.
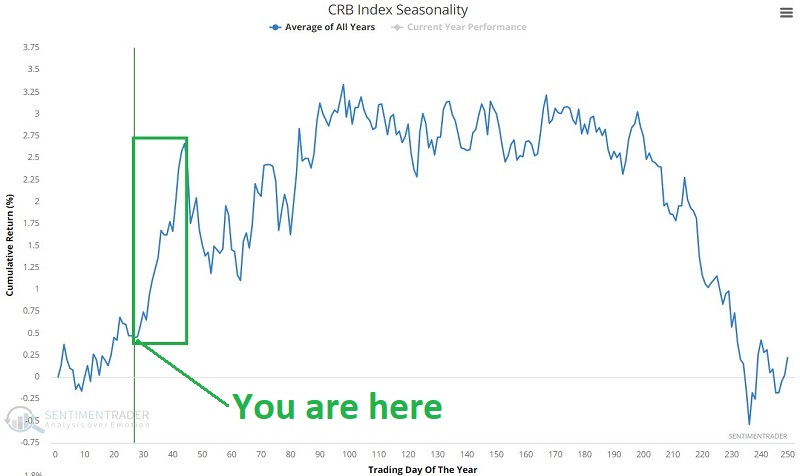
Note that the period from Trading Day of the Year #28 through TDY #44 has a tendency to witness strength. For 2023 this period extends from the close on 2023-02-10 through 2023-03-10. The chart below displays the hypothetical growth of $1 invested in the CRB Index only during this favorable period since 1994.
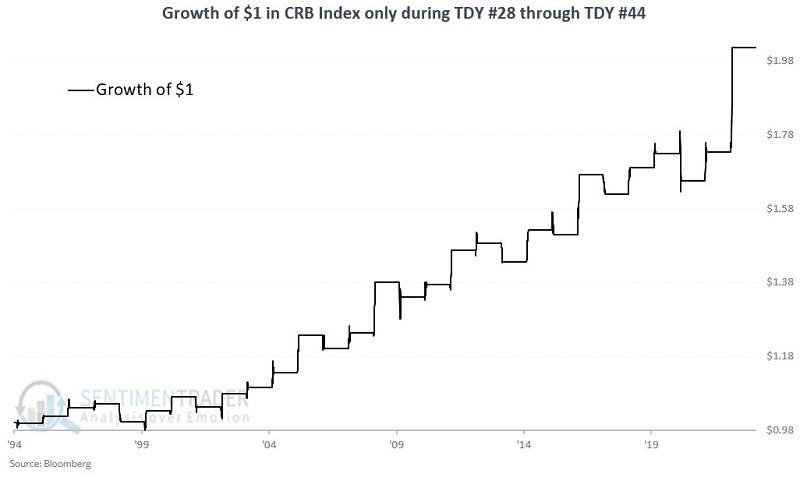
The index rose 69% of the time and sported an average gain about twice as large as the average loss. It rallied more than 5% six times while never losing more than -5%.
The CRB Index cannot be traded directly. However, numerous commodity-index-based ETFs are highly correlated to the CRB Index and can be used as a proxy for commodities as an asset class. One of the most heavily traded is the Invesco DB Commodity Index Tracking Fund (ticker DBC).
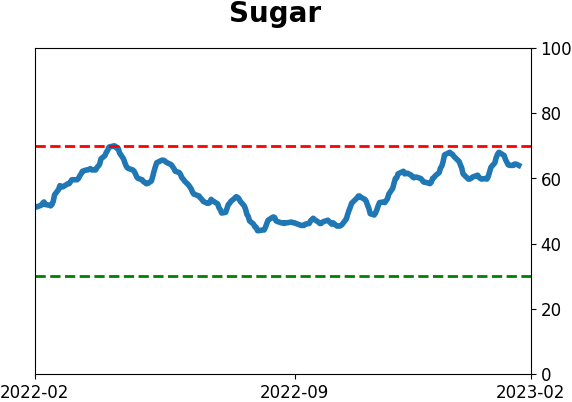
Sugar, however, is not
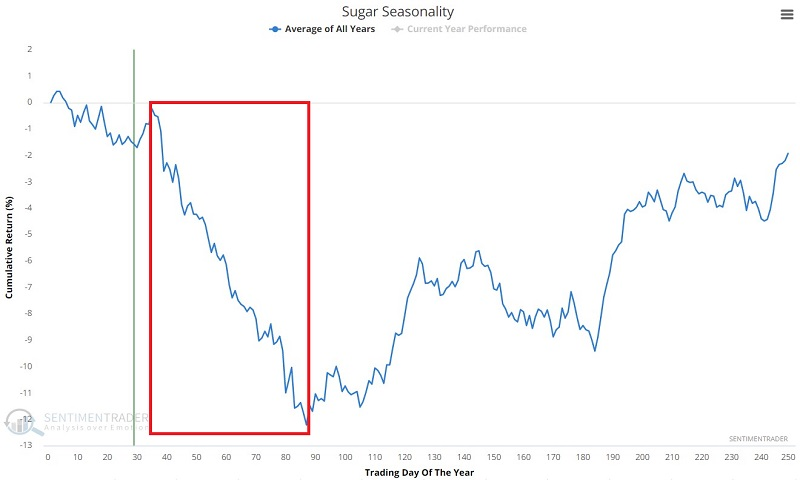
Sugar tends to be a highly cyclical market. Jay noted that it is nearing a typically unfavorable seasonal period.
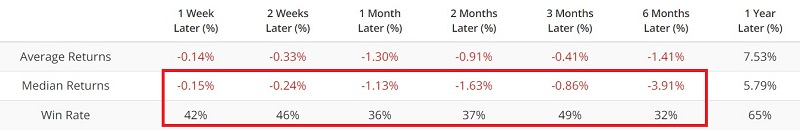
The chart below displays the annual seasonal trend for sugar futures. The unfavorable period marked by the red box in the chart extends from the close of TDY #35 through the close of TDY #87. For 2023, this period extends from the close on 2023-02-22 through 2023-05-08.
The chart below displays the cumulative hypothetical gain from holding one Sugar futures contract only during these windows since 1971.
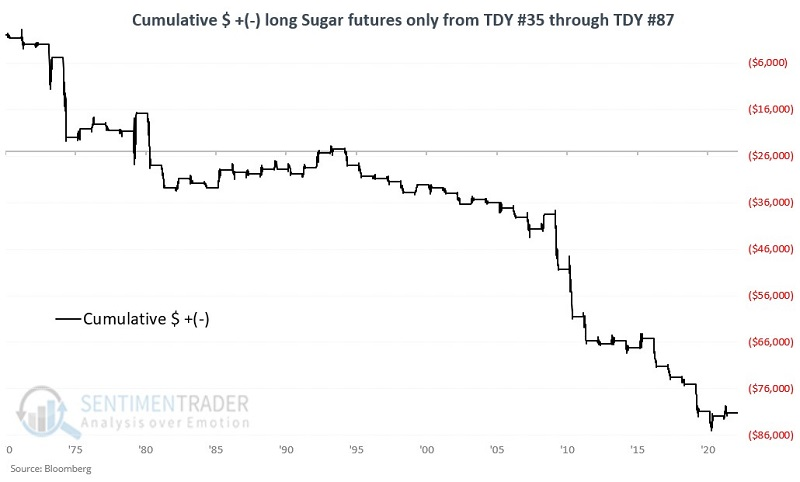
The contract showed a gain only 31% of the time, with an average gain of about half that of the average loss. It never gained more than $4,000 during these windows but lost more than -$4,000 during eight years.
The Teucrium Sugar Fund (CANE) is an exchange-traded security that is designed to track in percentage terms the movements of Sugar futures prices. CANE issues shares that may be bought and sold like shares of stock, and it has shown the same seasonal tendency as the futures contract.
About TradingEdge Weekly...
The goal of TradingEdge Weekly is to summarize some of the research published to SentimenTrader over the past week. Sometimes there is a lot to digest, and this summary highlights the highest conviction or most compelling ideas we discussed. This is NOT the published research; rather, it pulls out some of the most relevant parts. It includes links to the published research for convenience, and if you don't subscribe to those products, it will present the options for access.
Indicators at Extremes
|
|
|
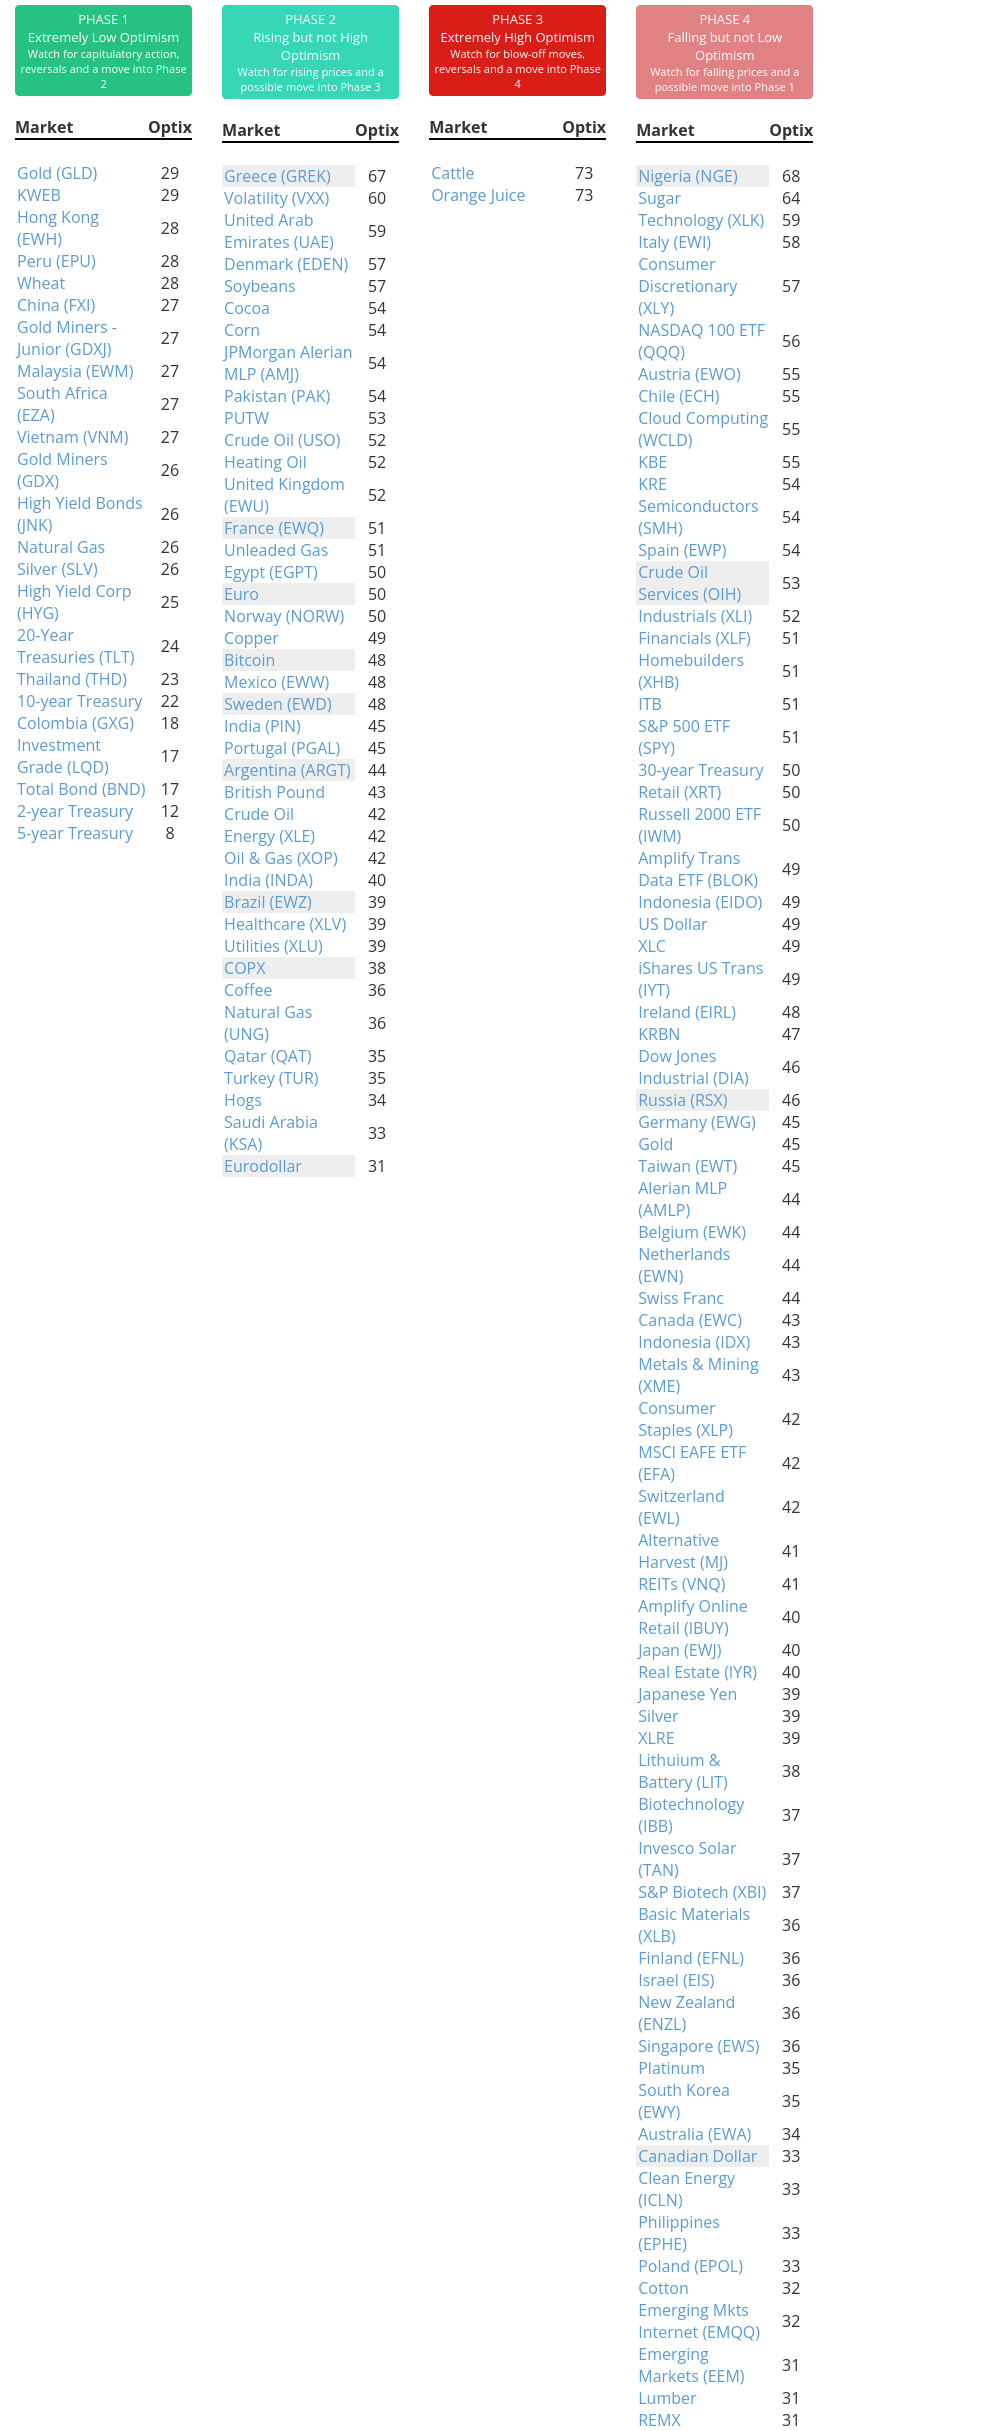
Phase Table
|
|
|
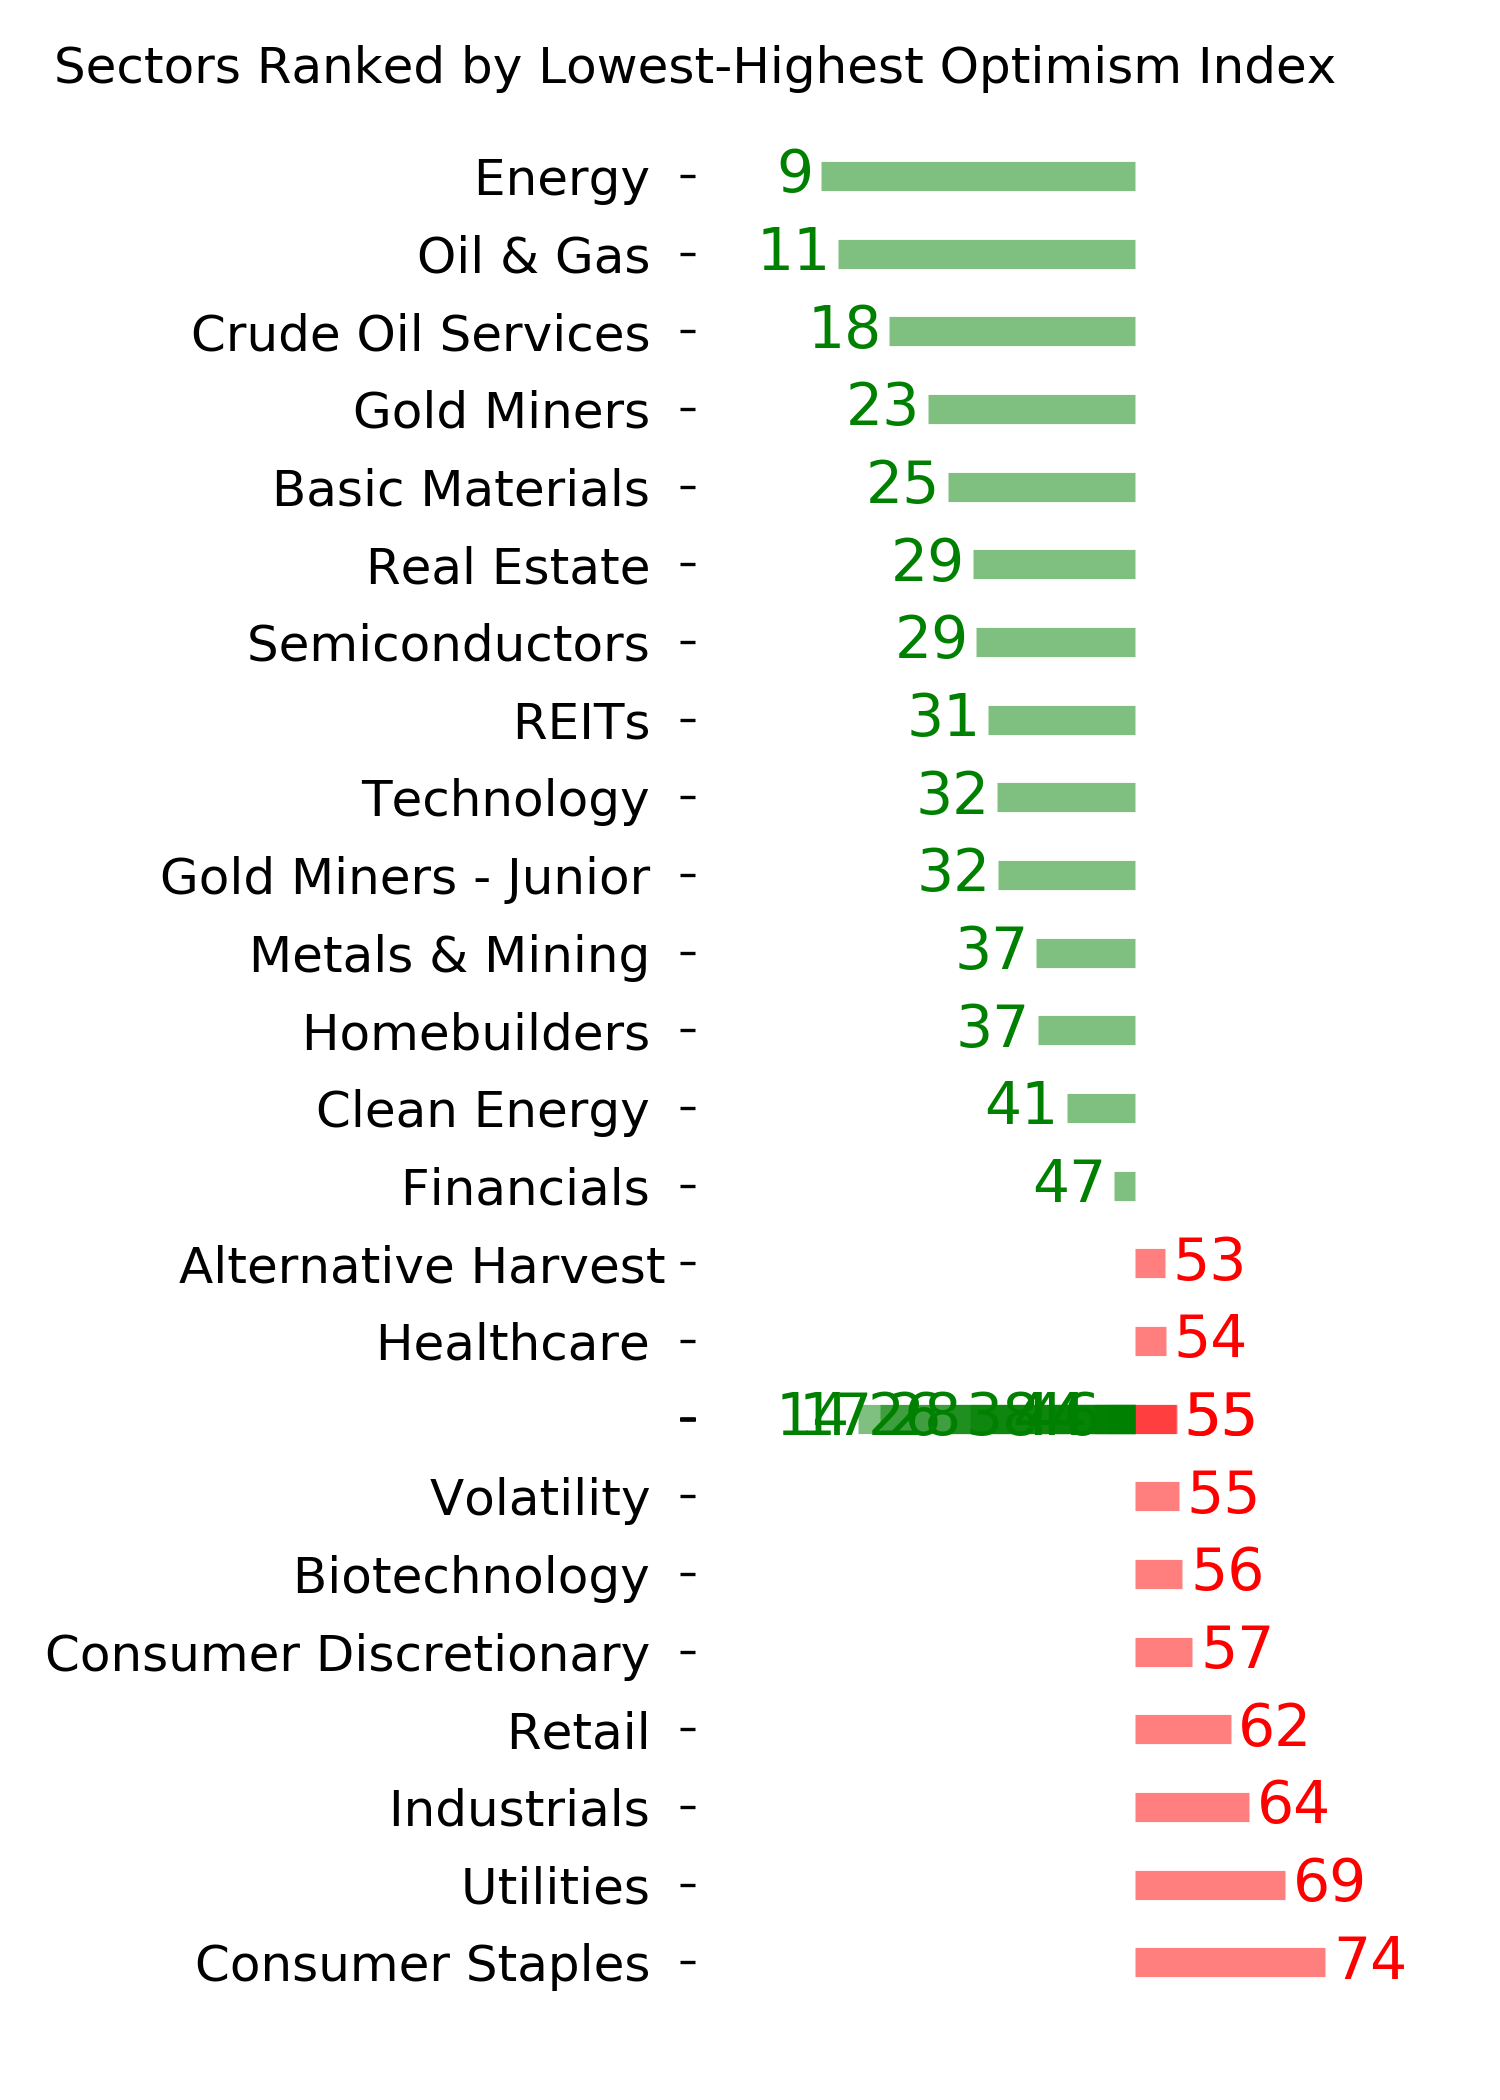
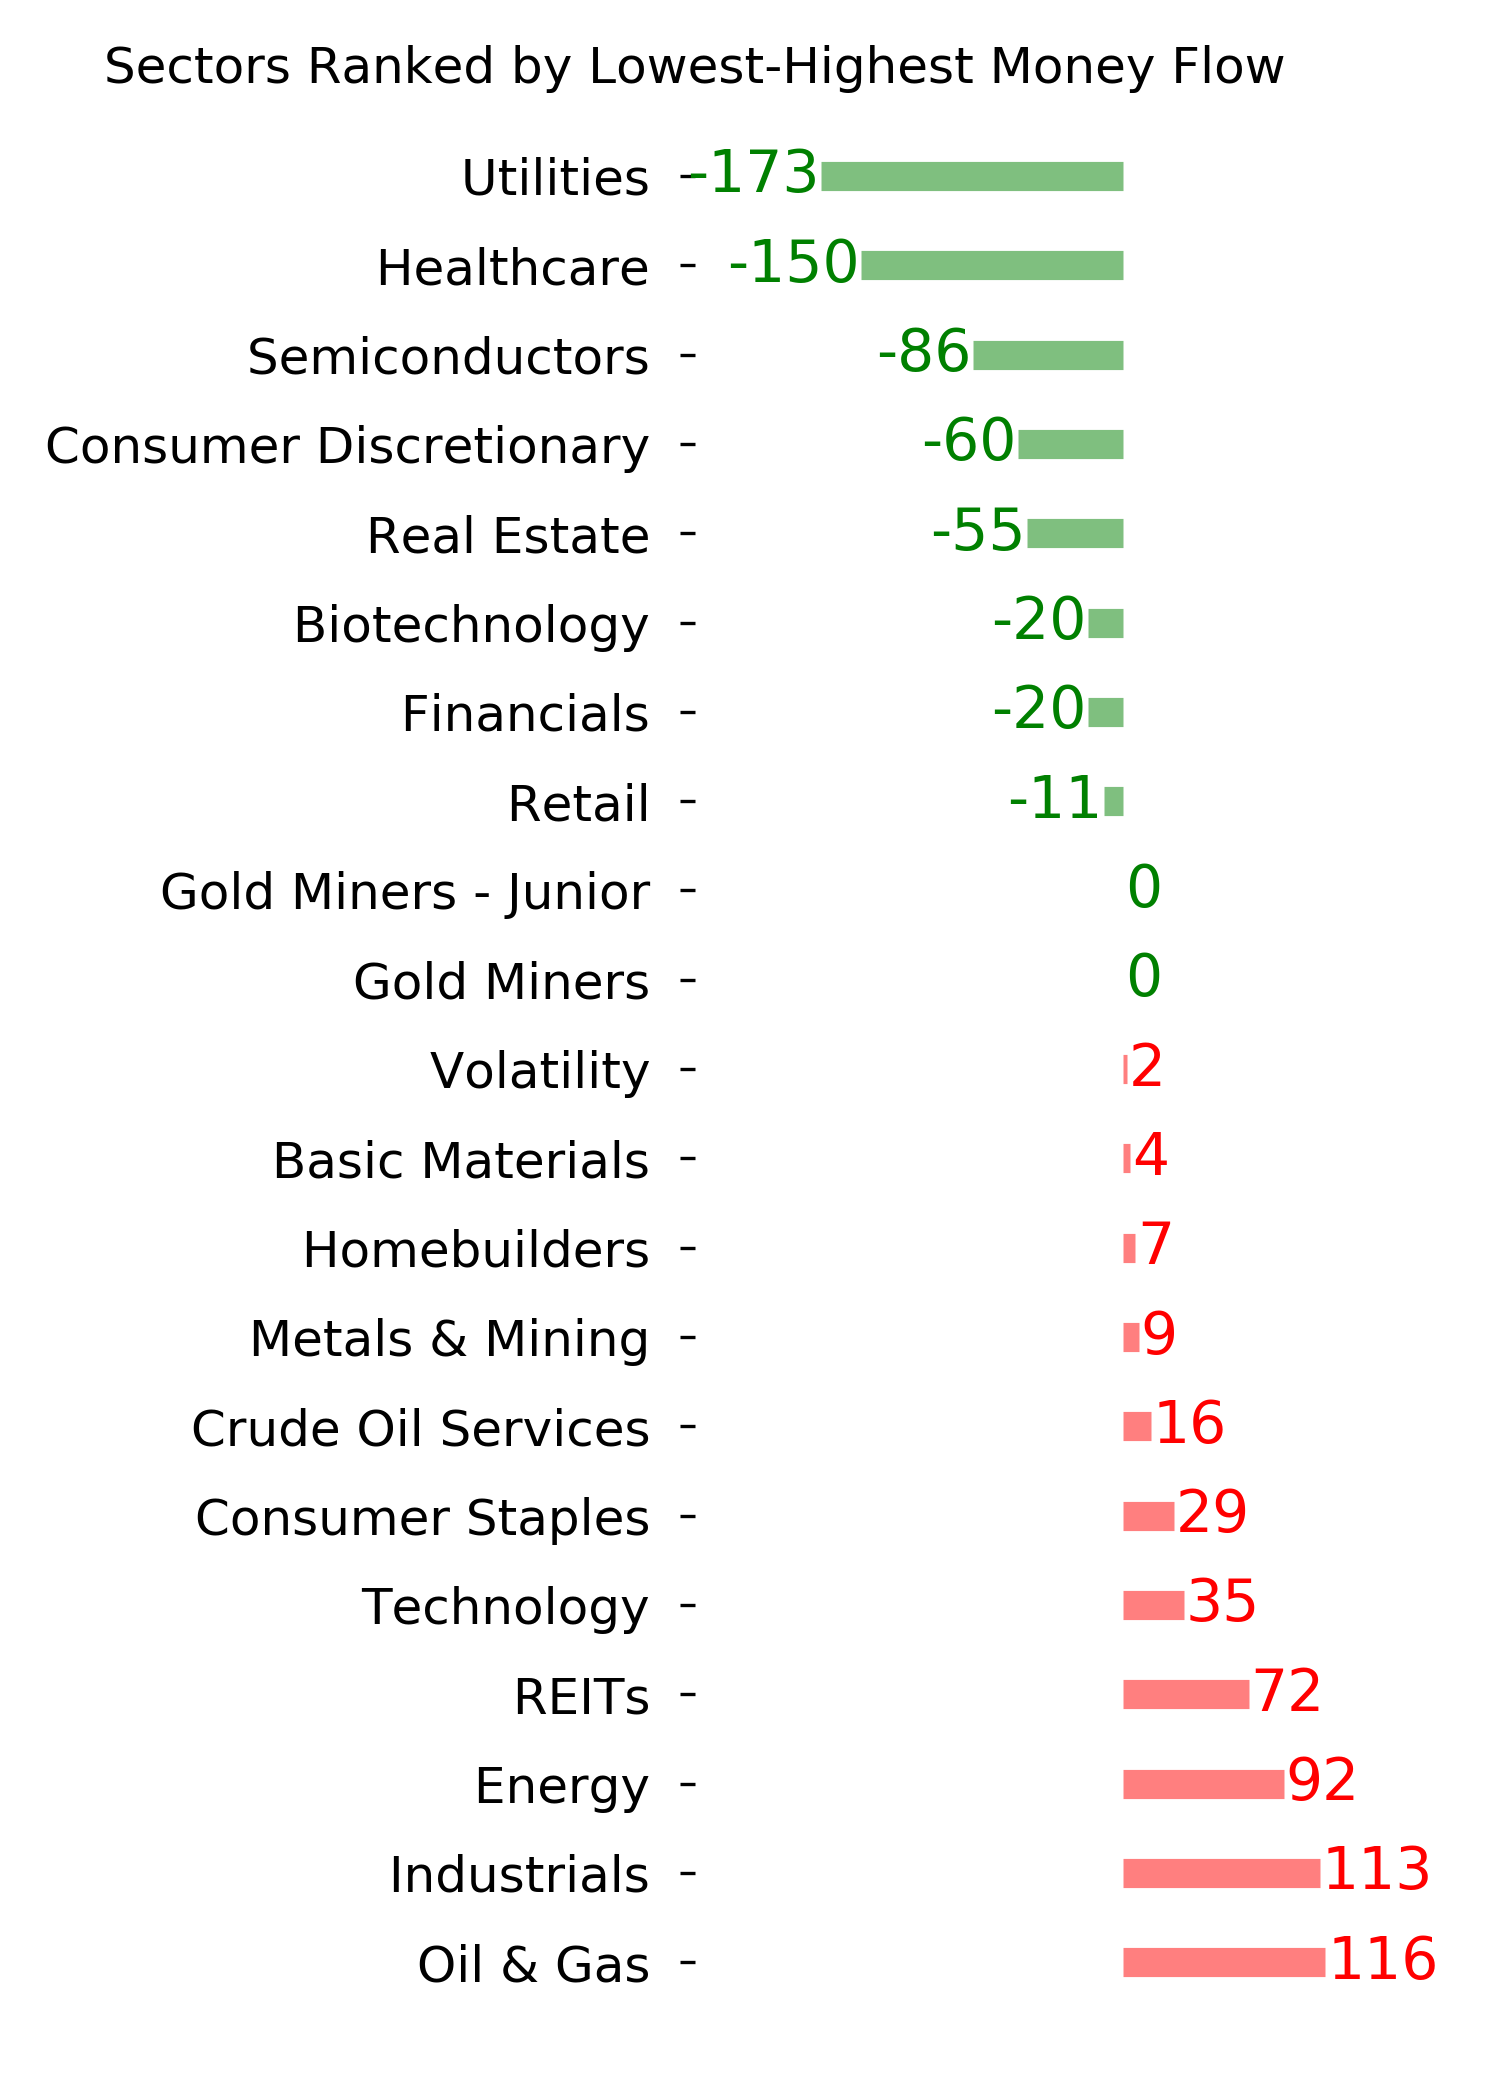
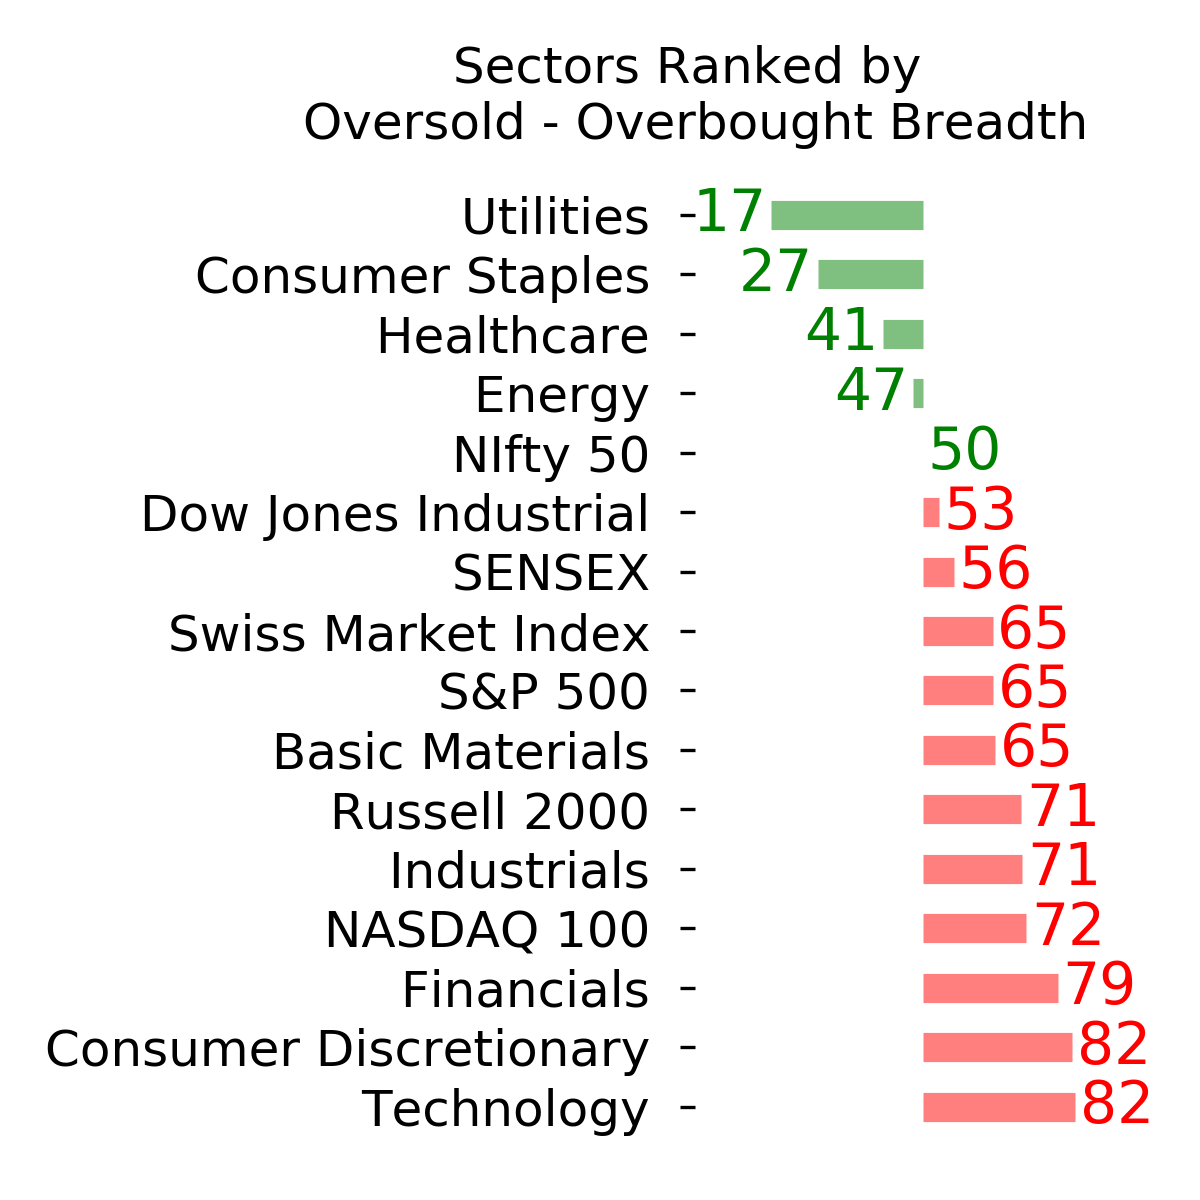
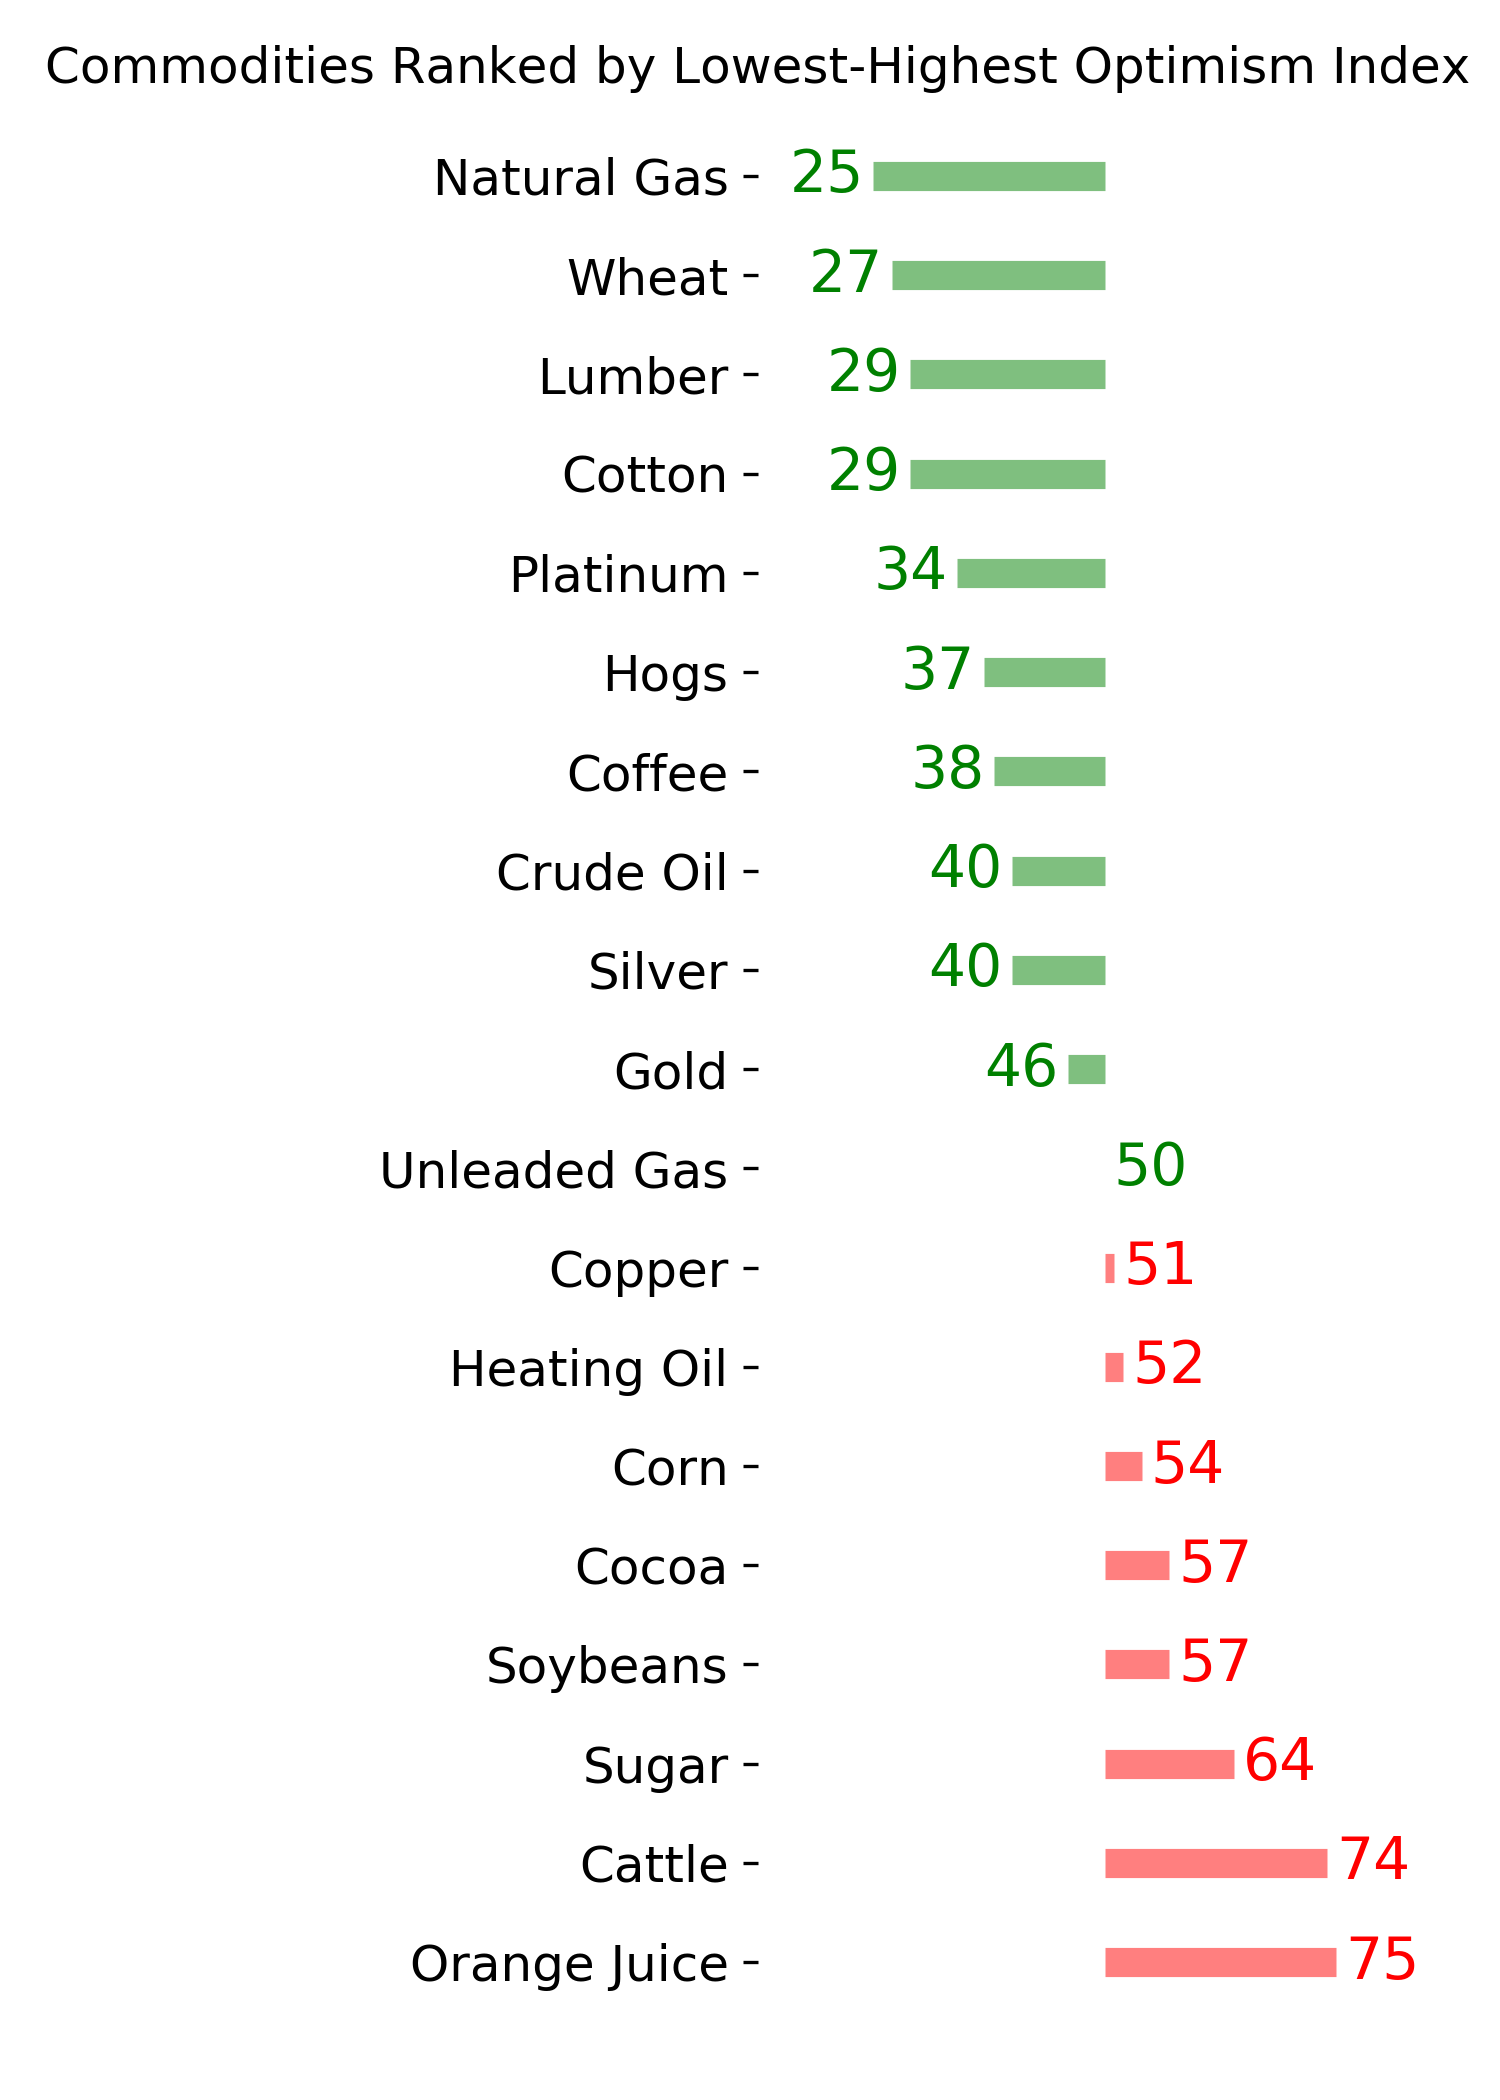
Ranks
|
|
|
|
|
|
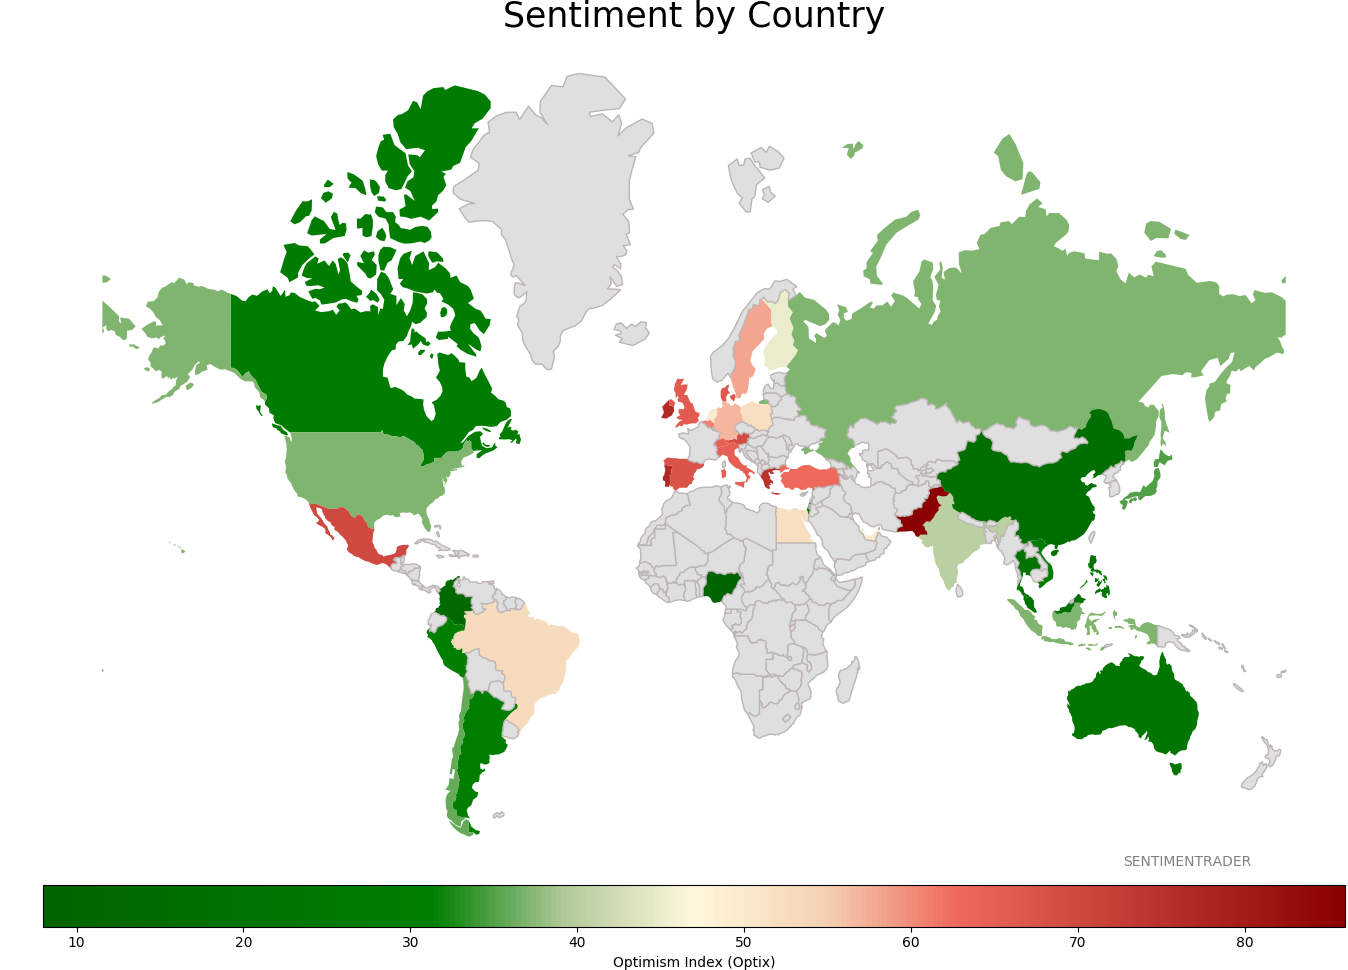
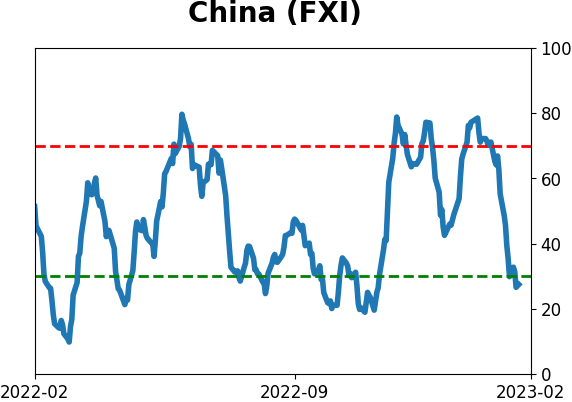
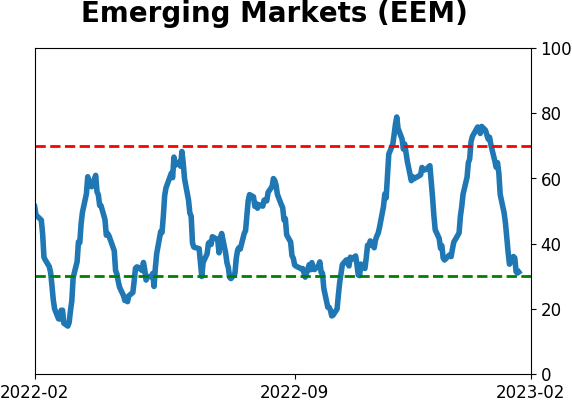
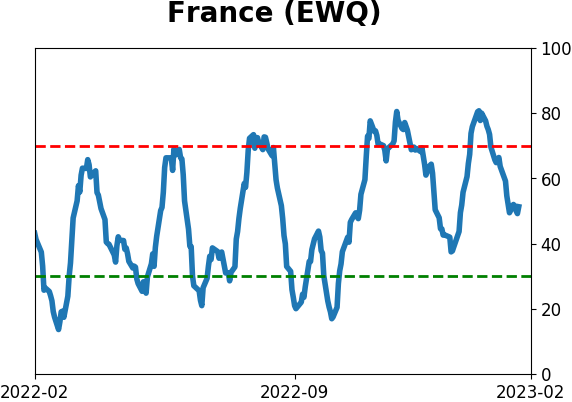
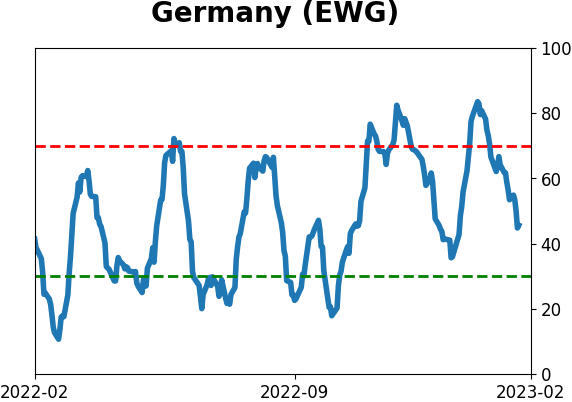
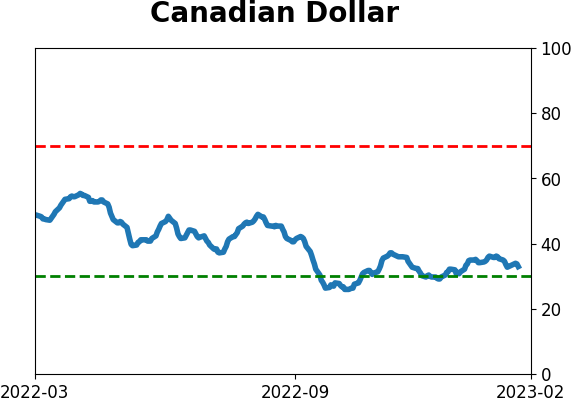
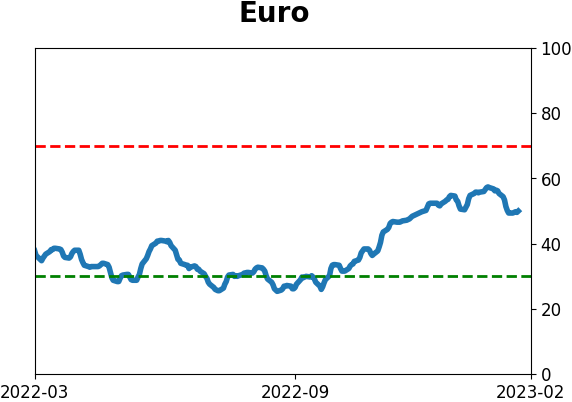
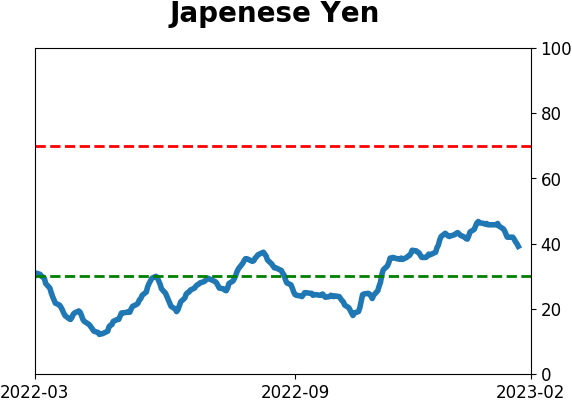
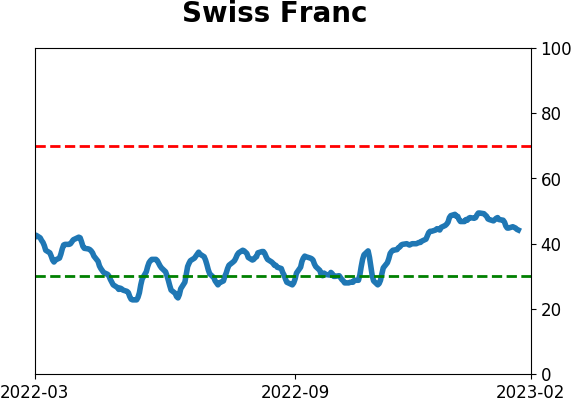
Sentiment Around The World
|
|
|
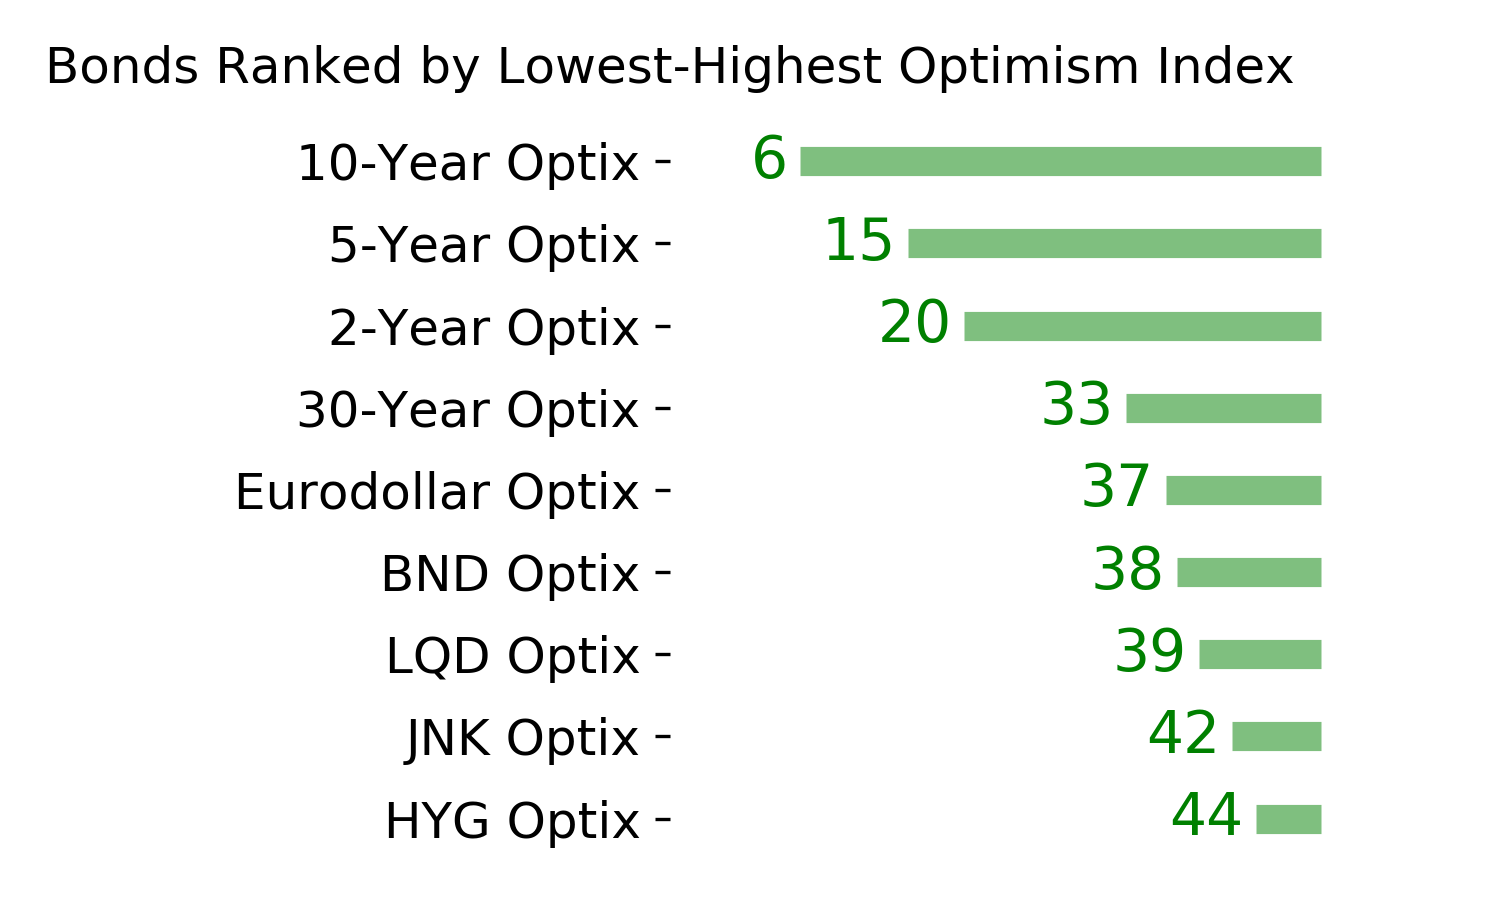
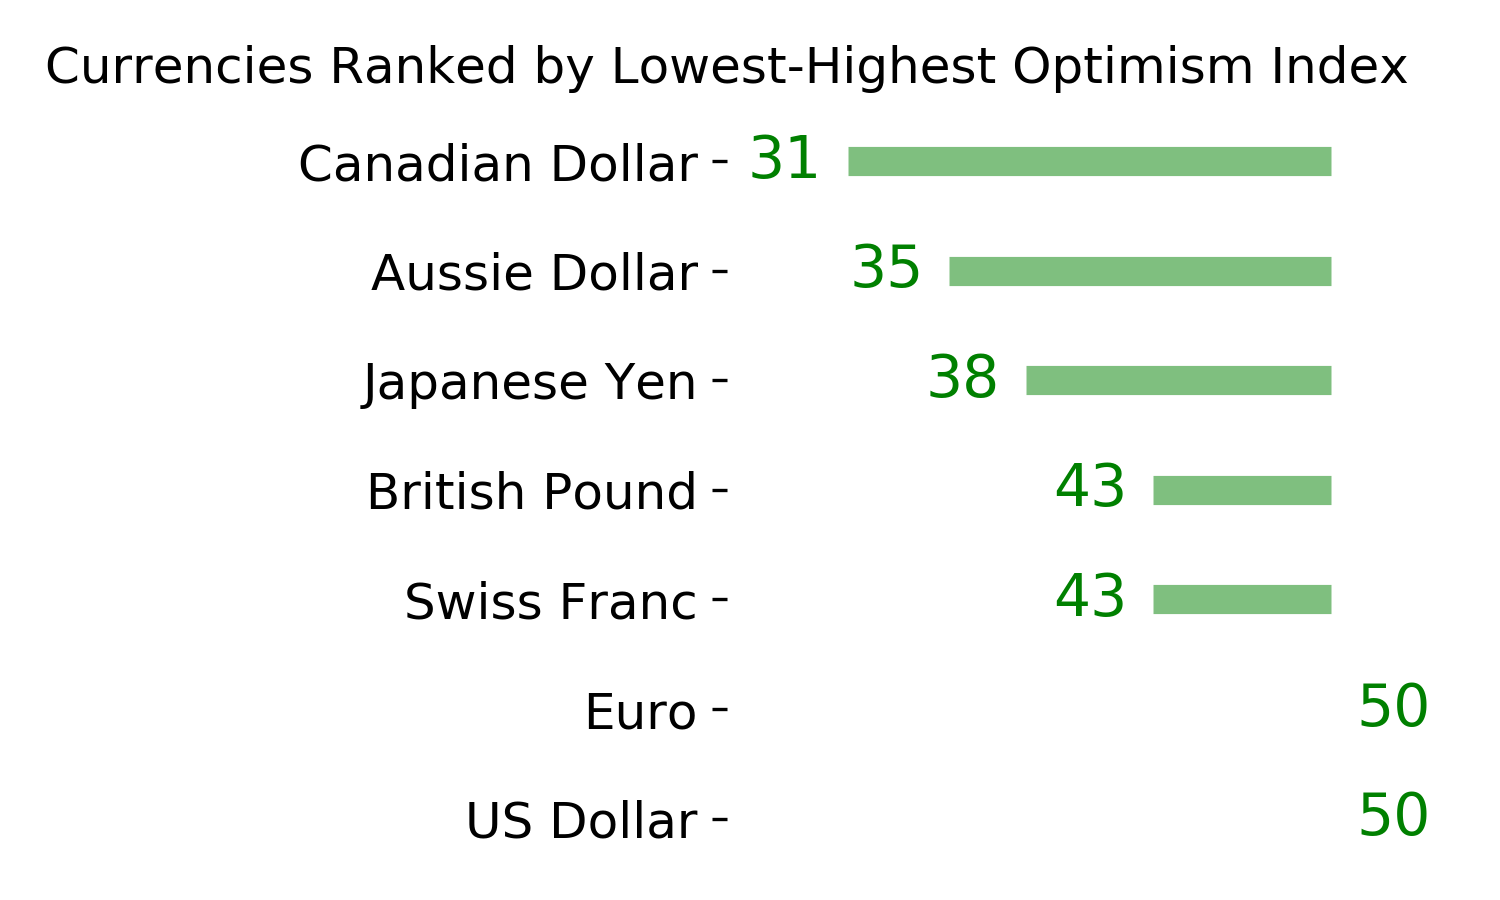
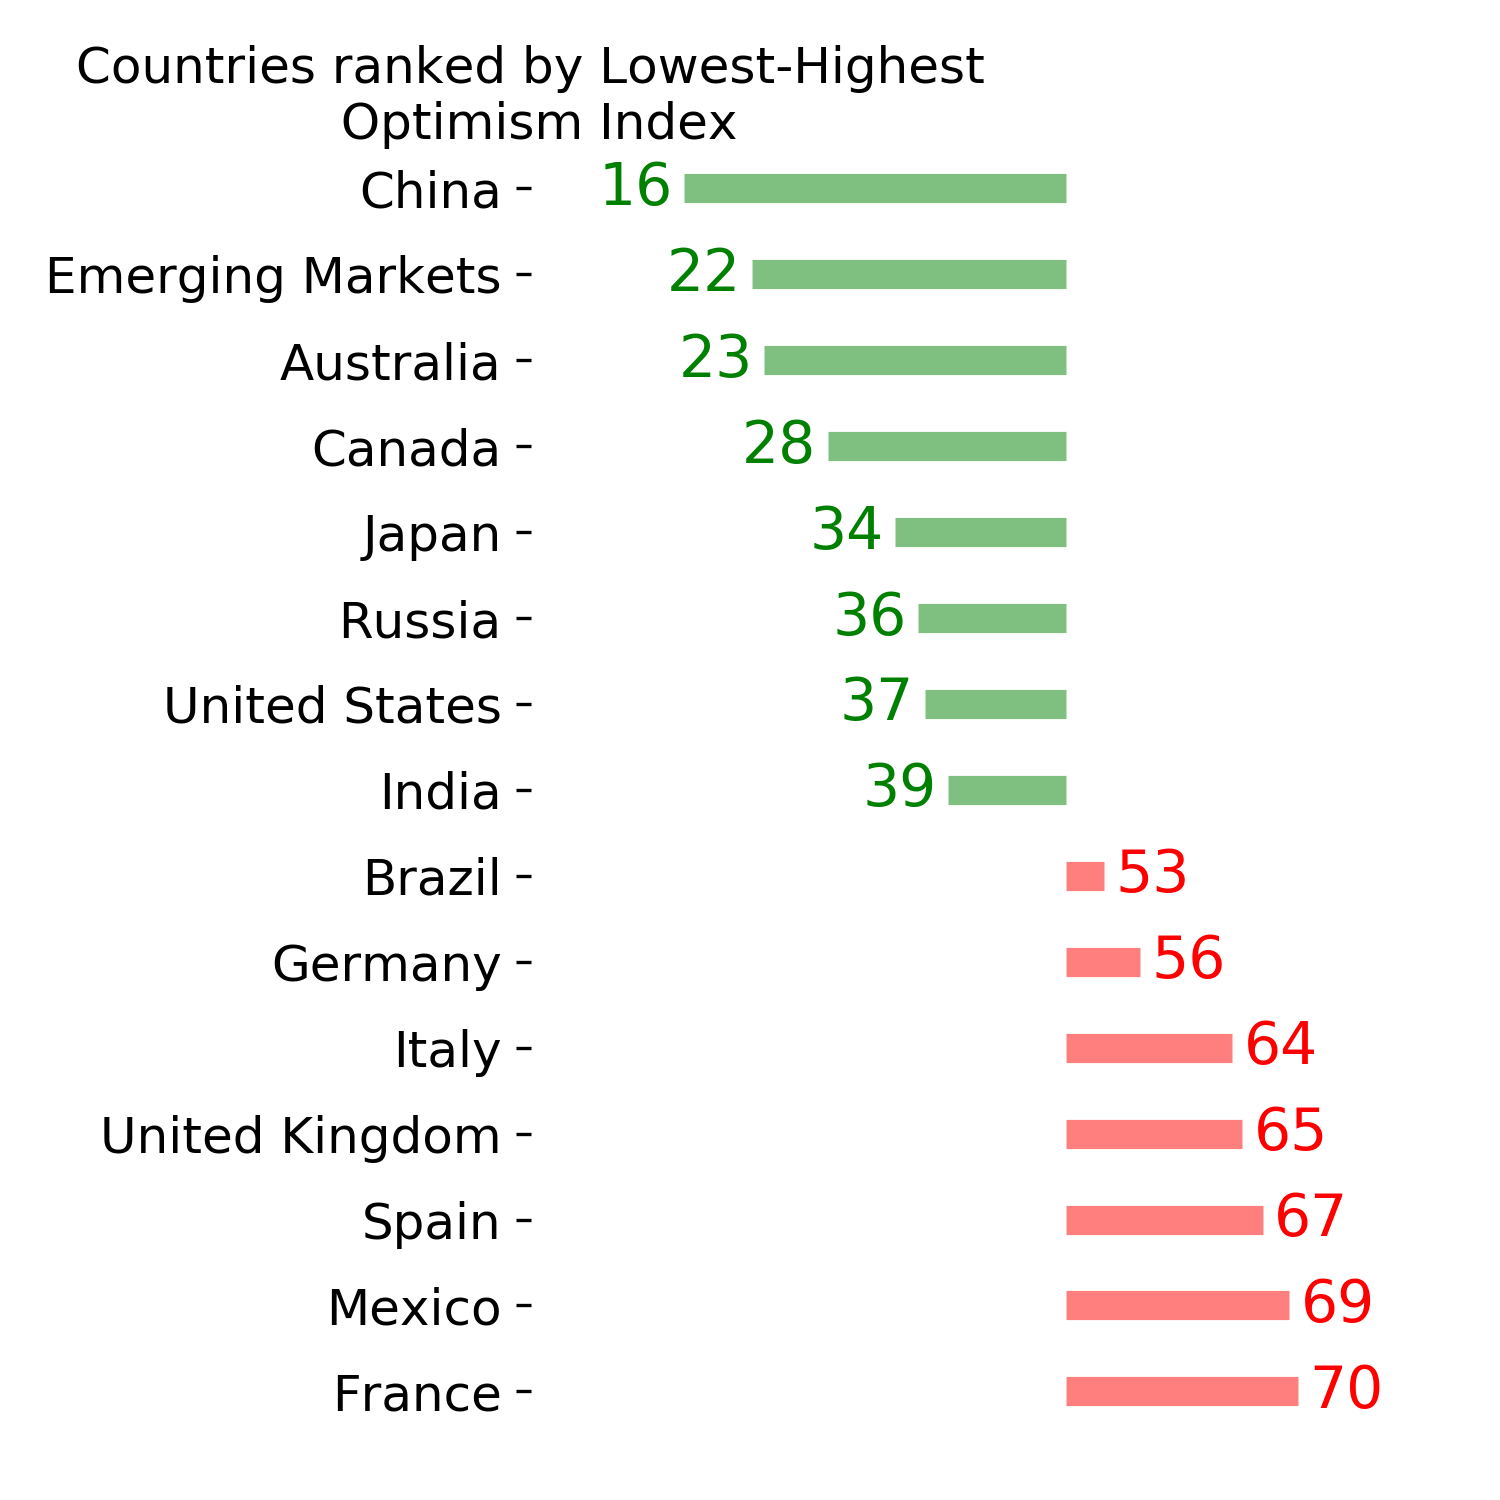
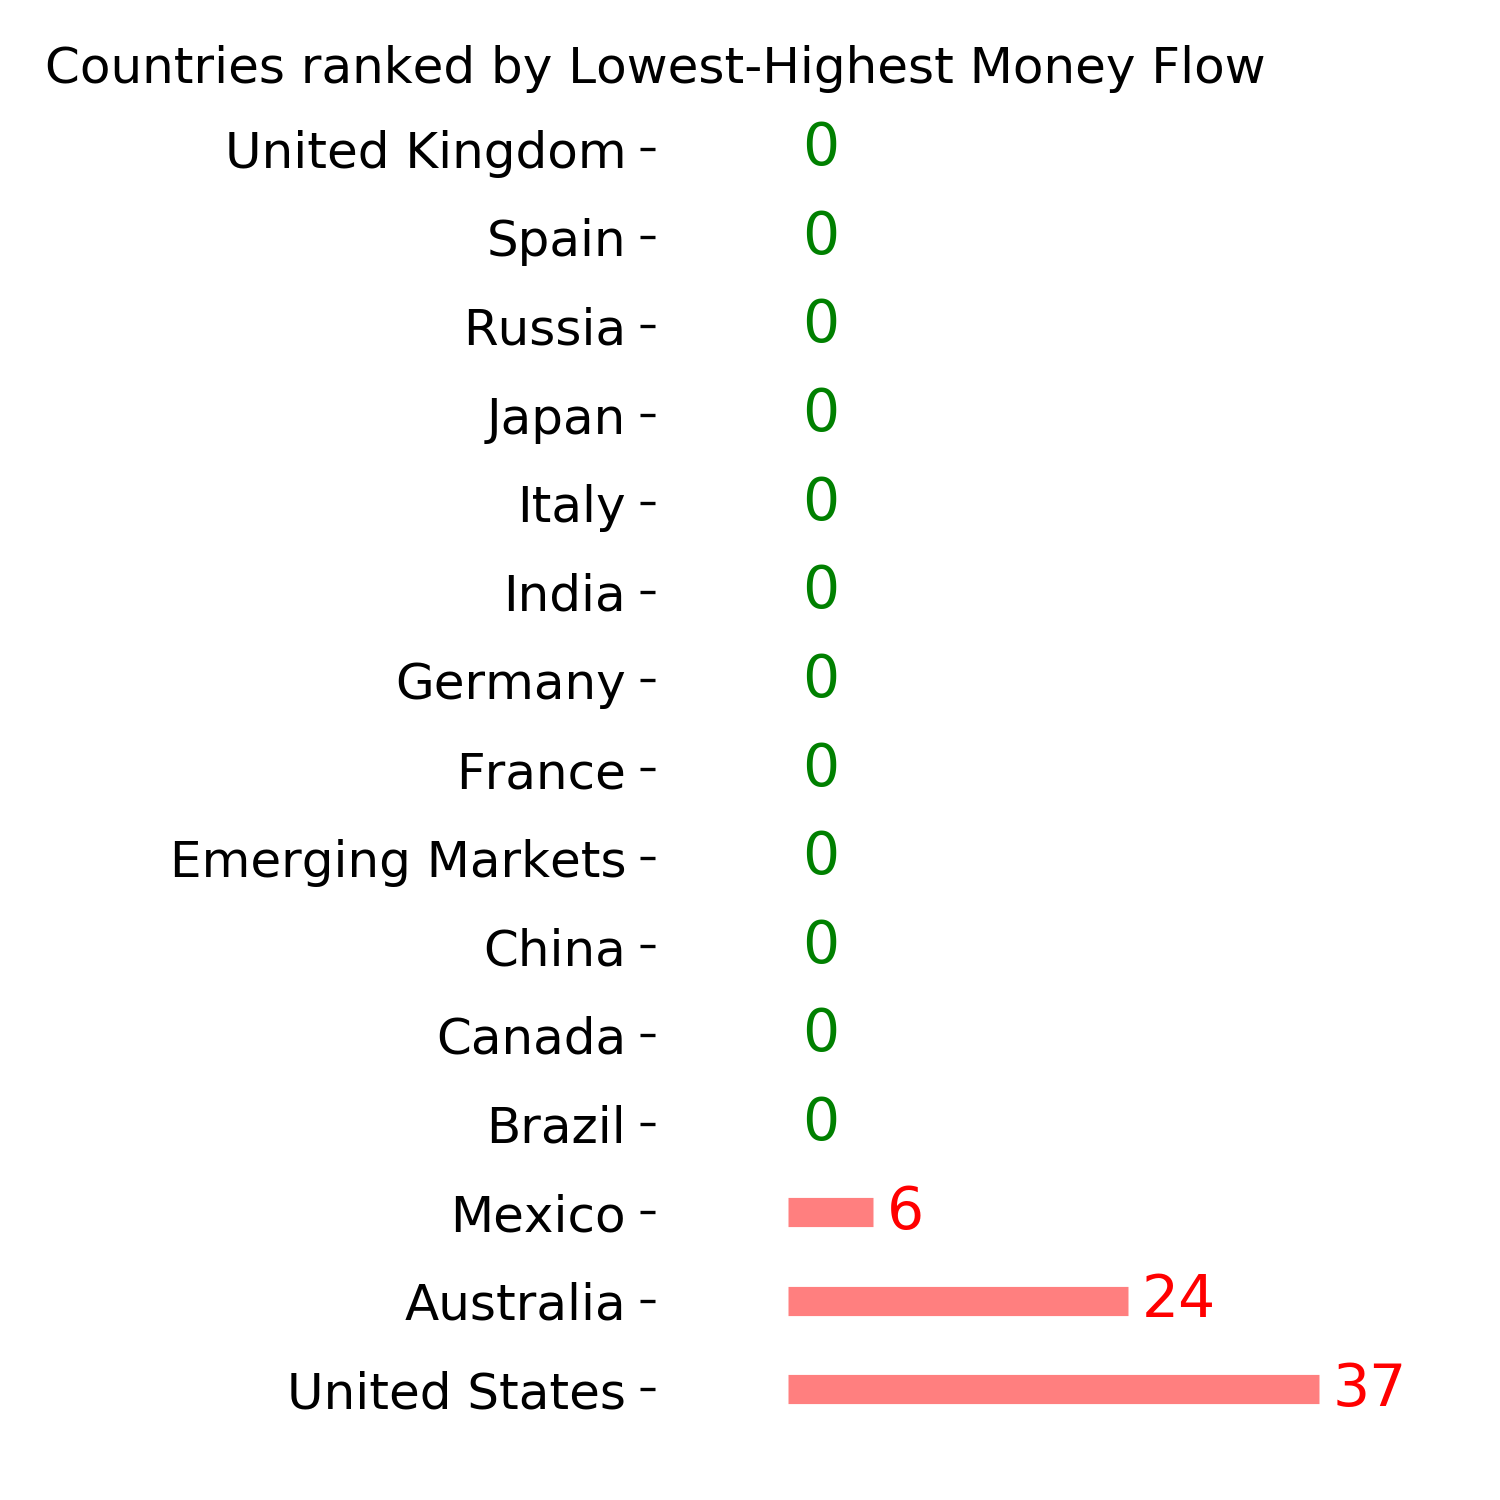
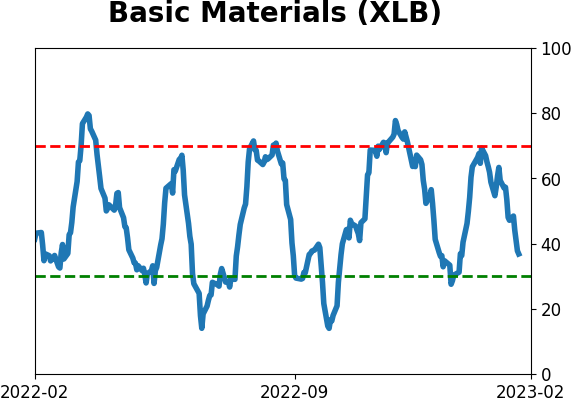
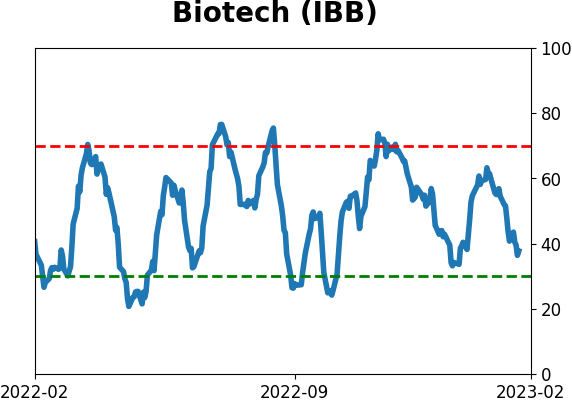
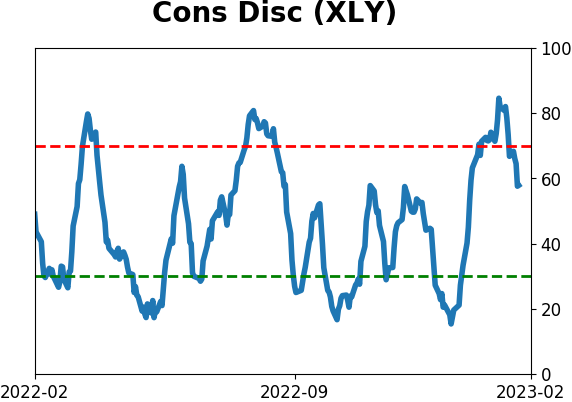
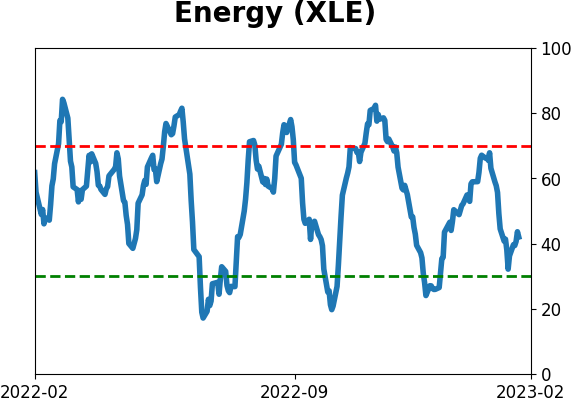
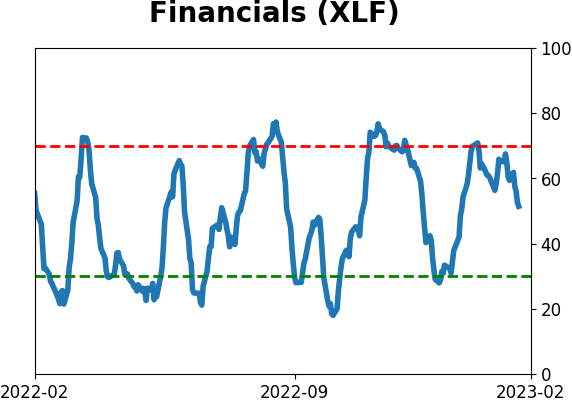
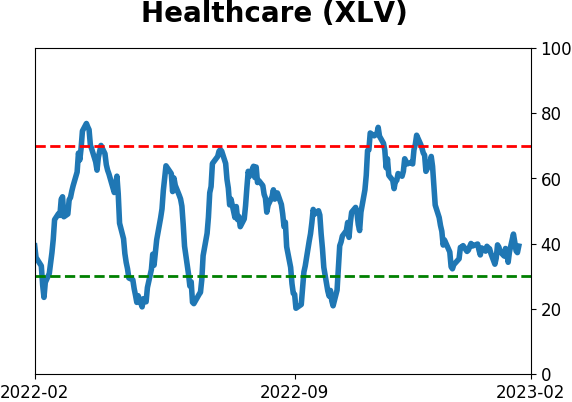
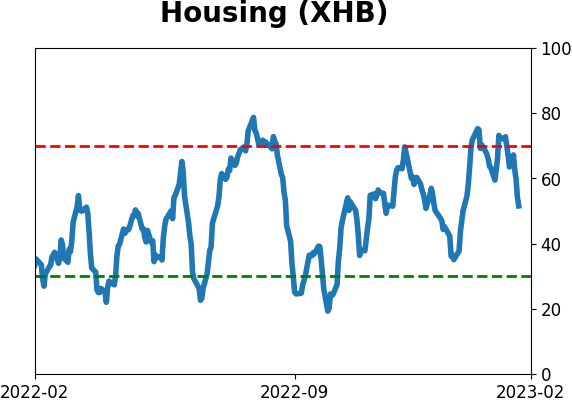
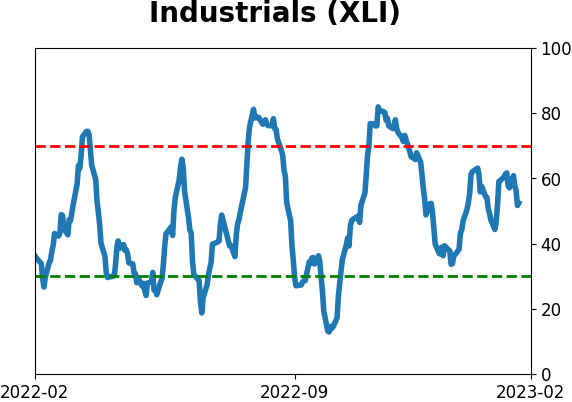
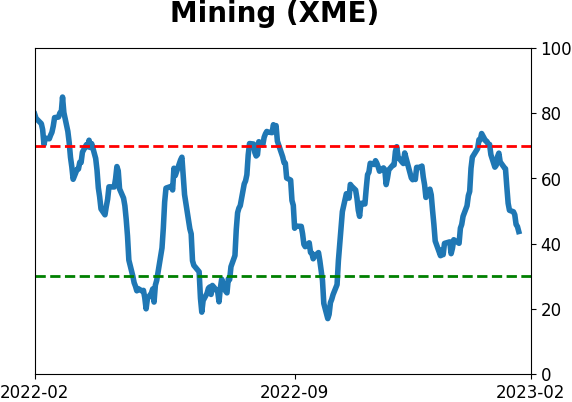
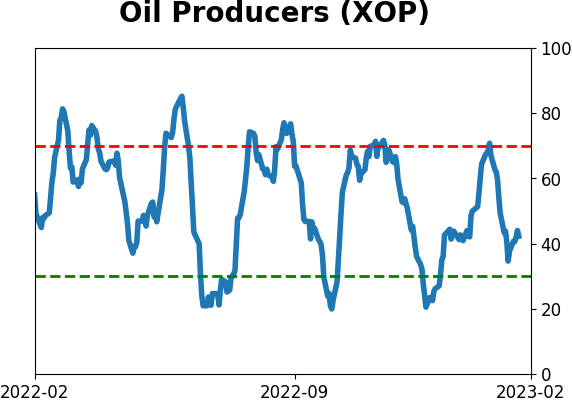
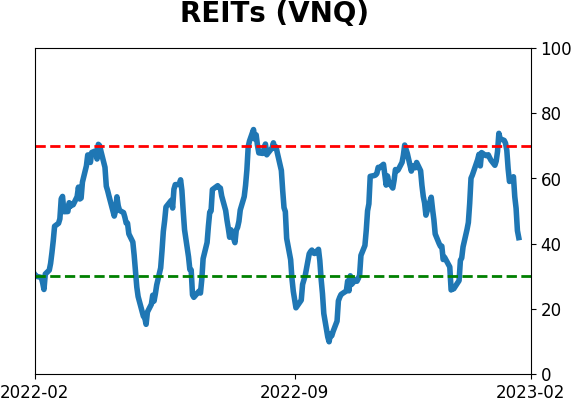
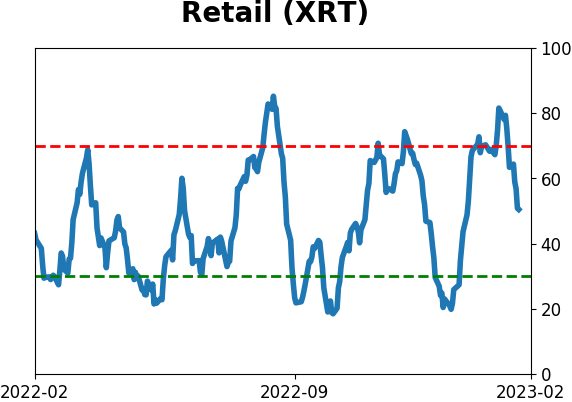
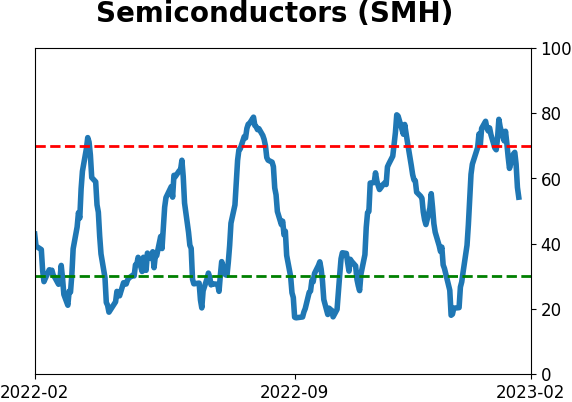
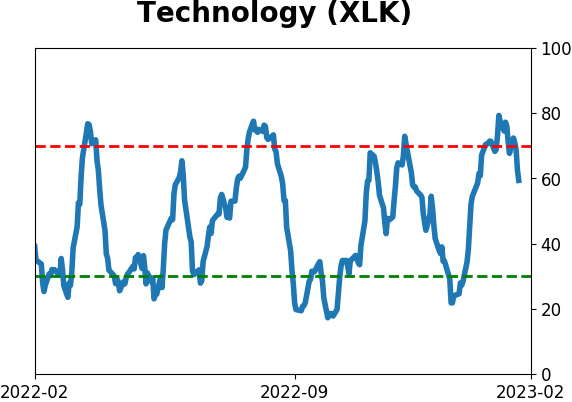
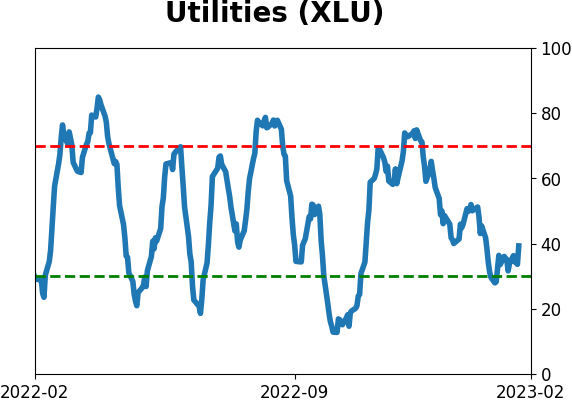
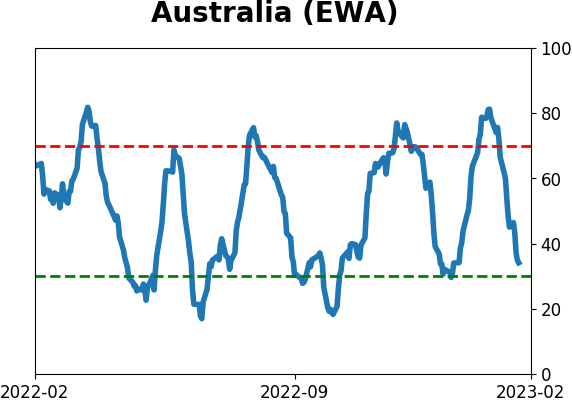
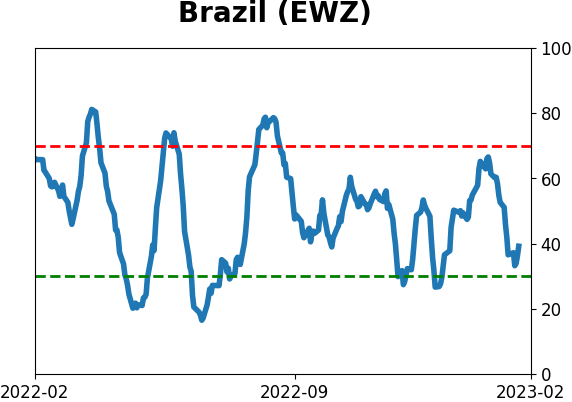
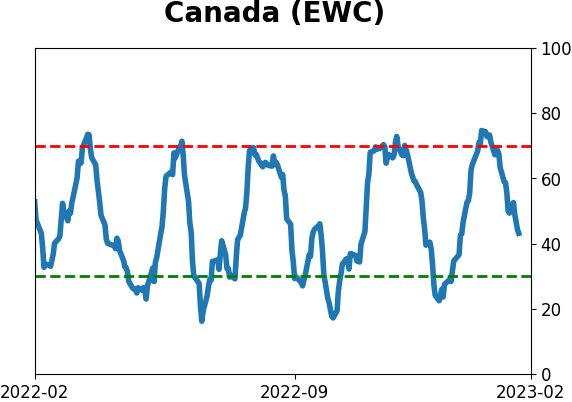
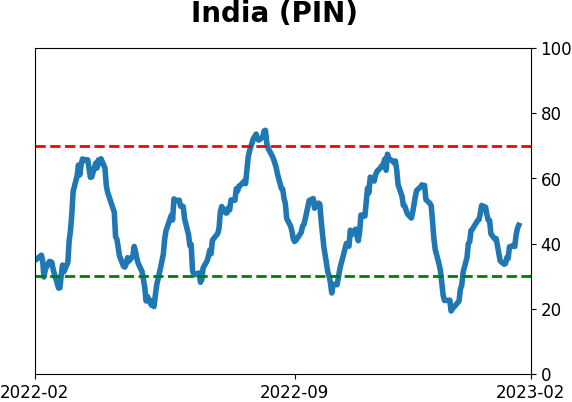
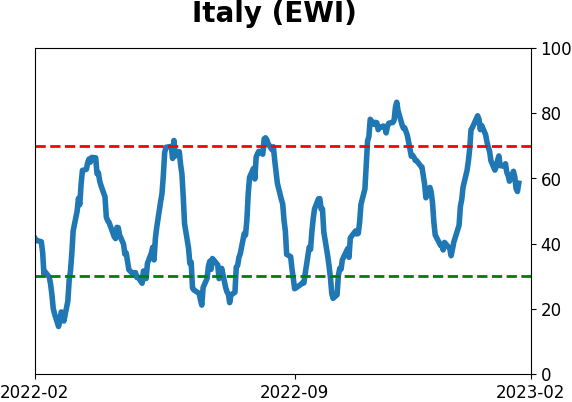
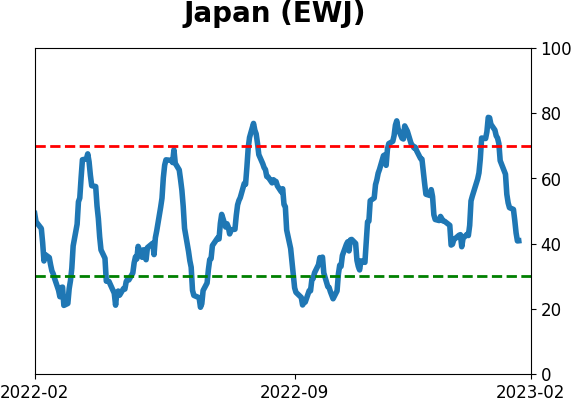
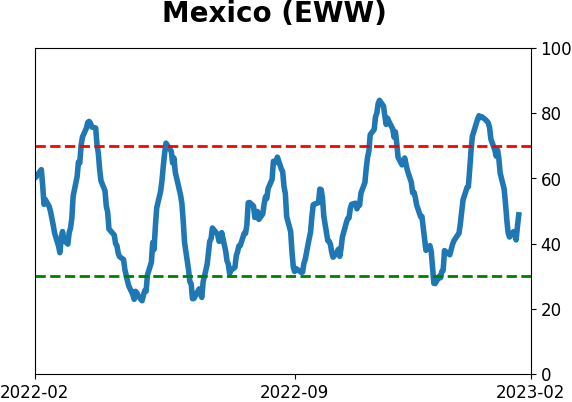
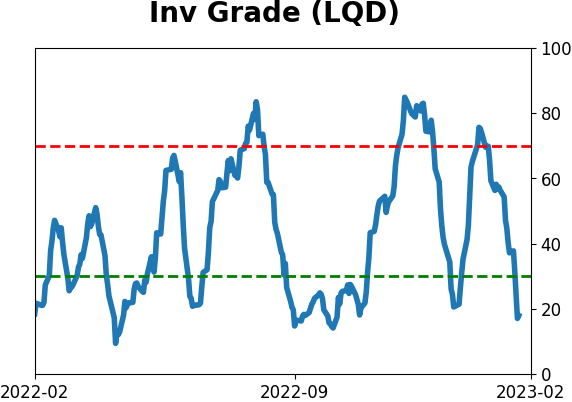
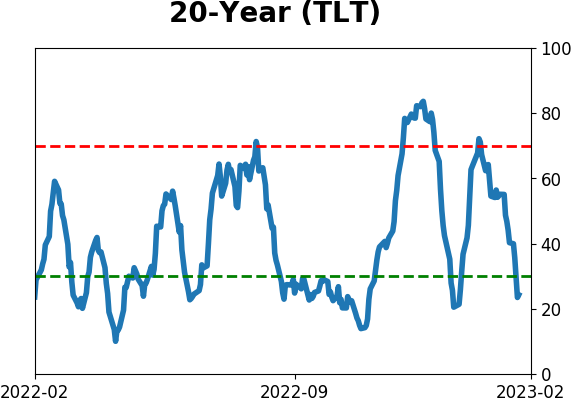
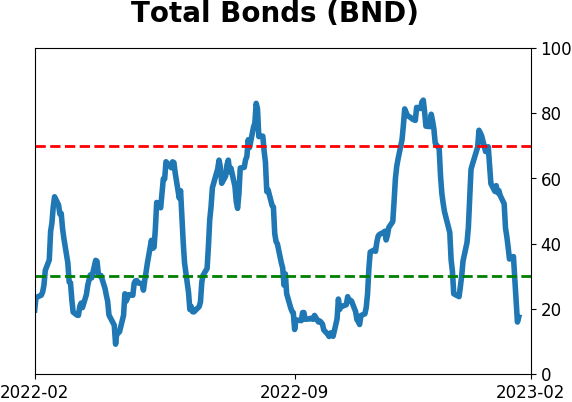
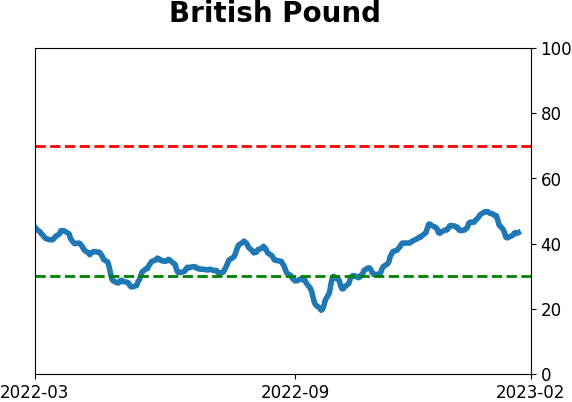
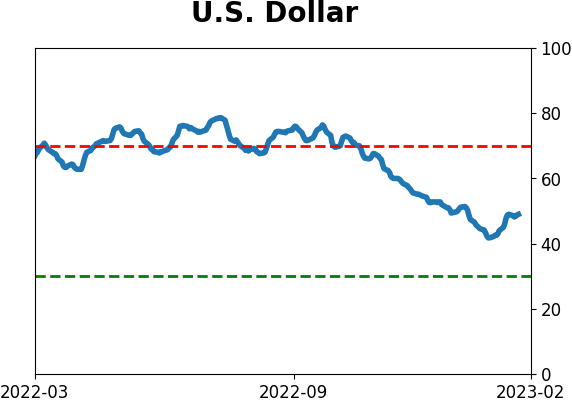
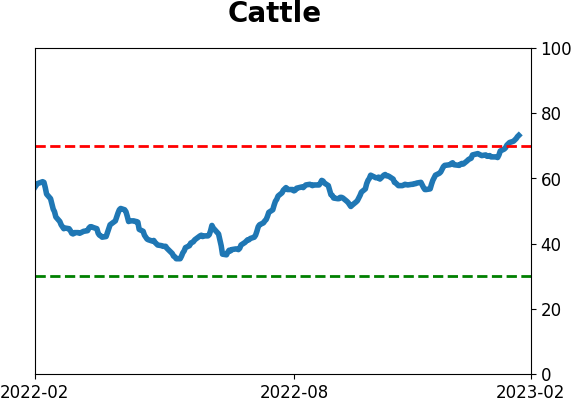
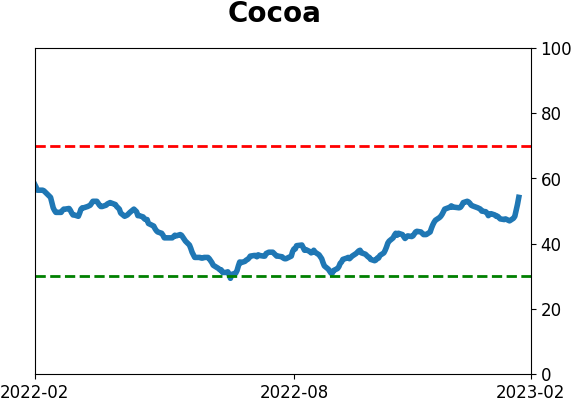
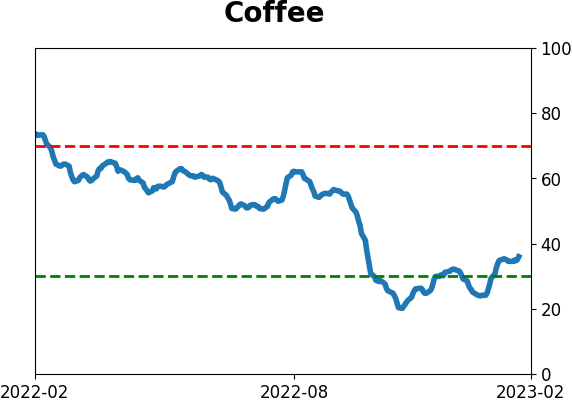
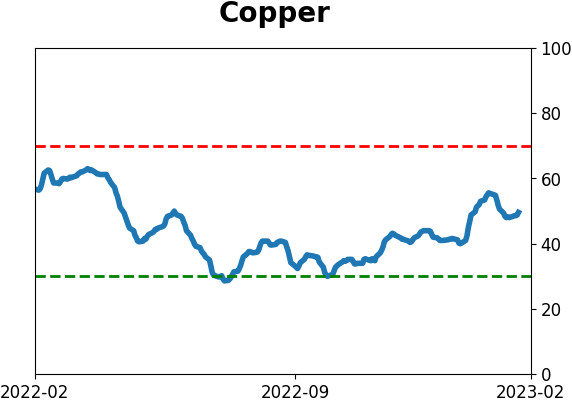
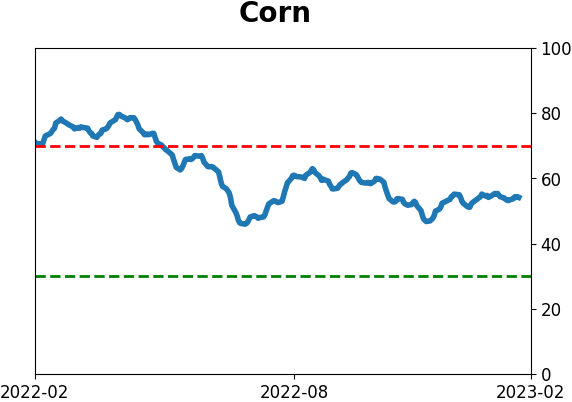
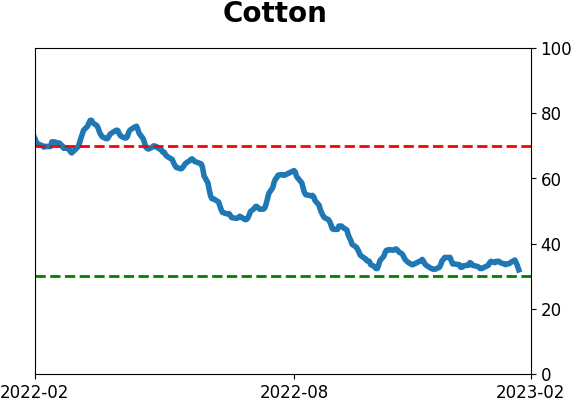
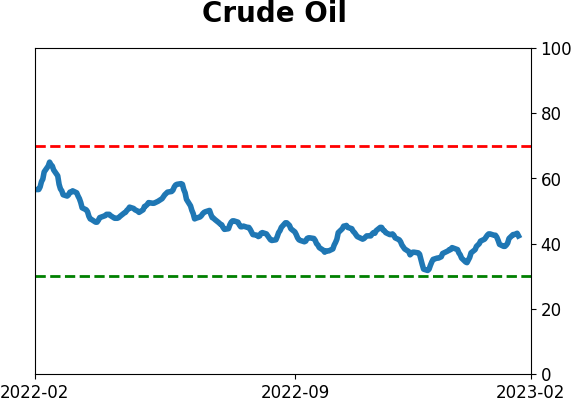
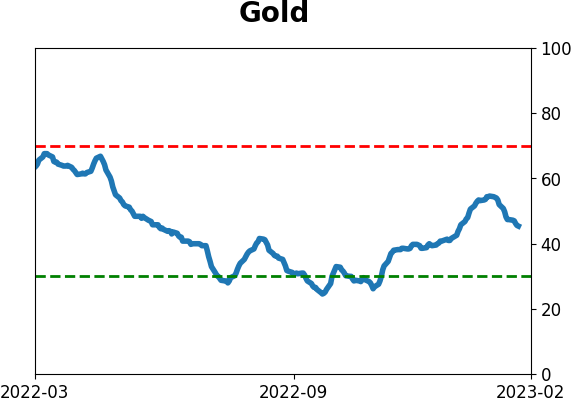
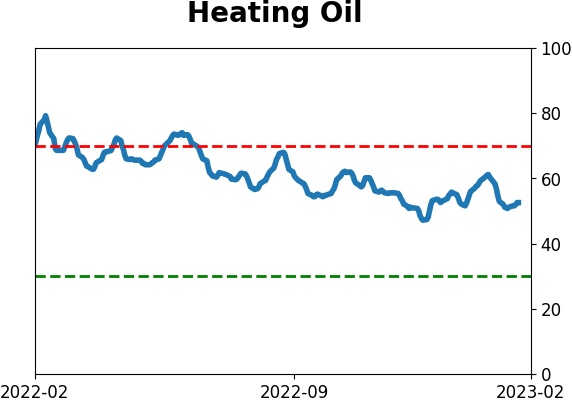
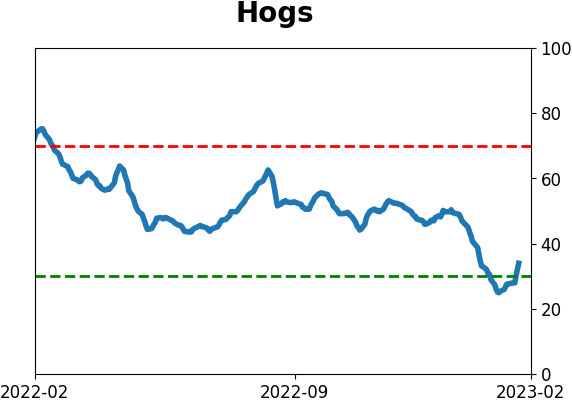
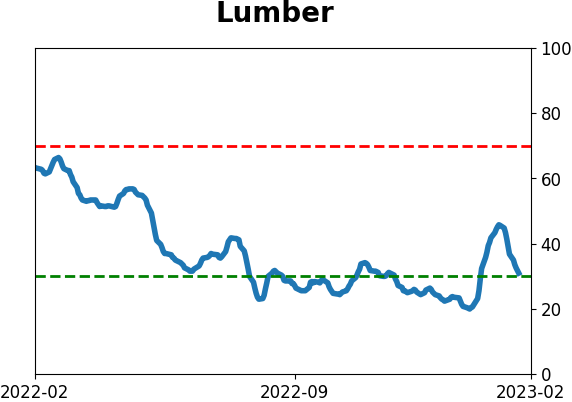
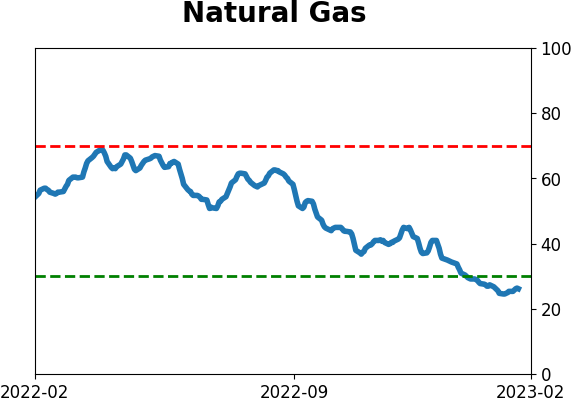
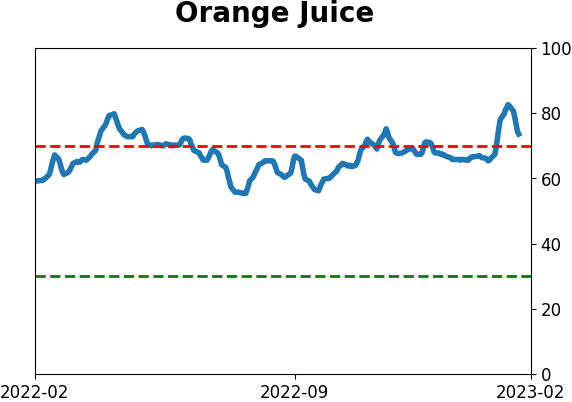
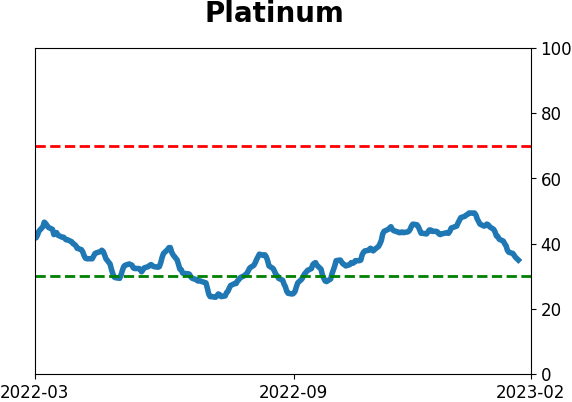
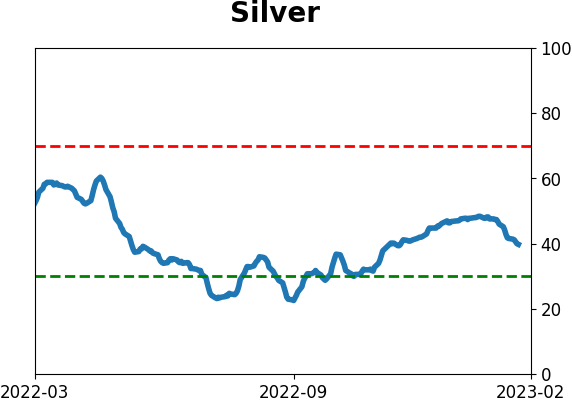
Optimism Index Thumbnails
|
|
|
|
|
|
|
|
|
|
|
|
|
|
|
|
|
|
|
|
|