Headlines
|
|
Brazilian stocks on cusp of long-term recovery:
The McClellan Summation Index for Brazil's Ibovespa Index is turning positive, ending a record-long streak in negative territory. Other times when internal momentum in the Ibovespa turned positive after 6 months in negative territory, it preceded remarkable long-term gains in the index.
|
Smart / Dumb Money Confidence
|
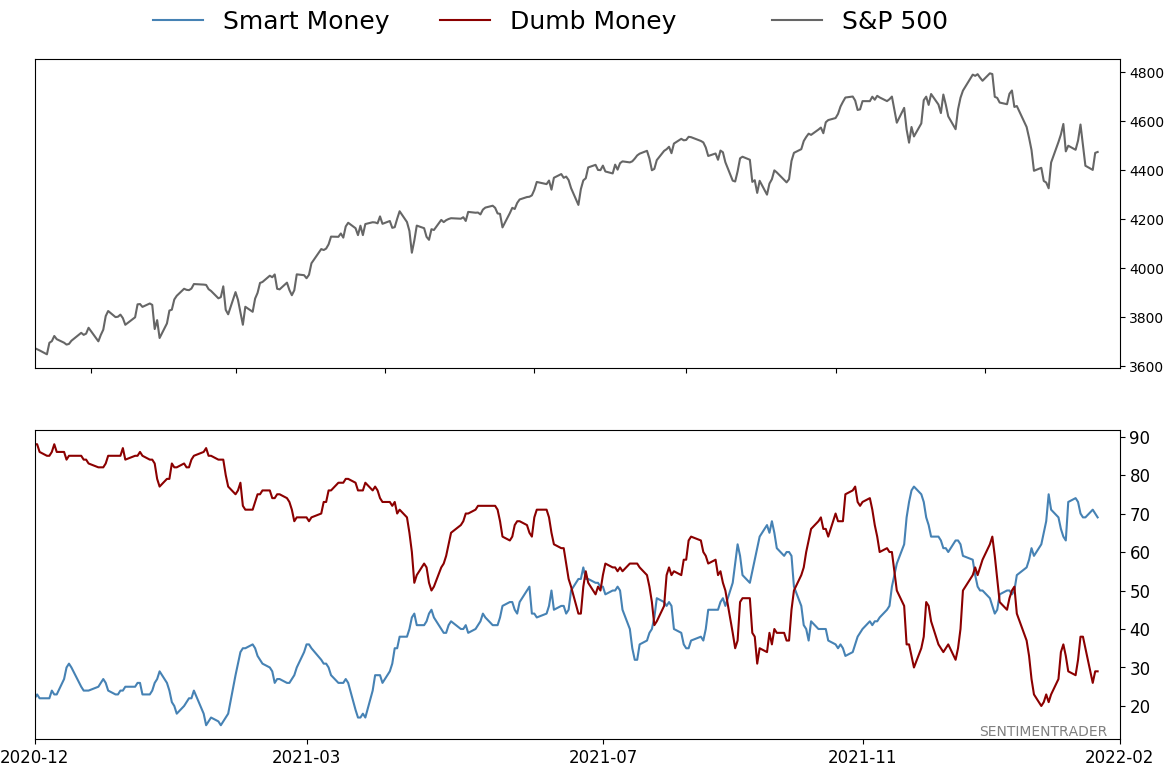
Smart Money Confidence: 69%
Dumb Money Confidence: 29%
|
|
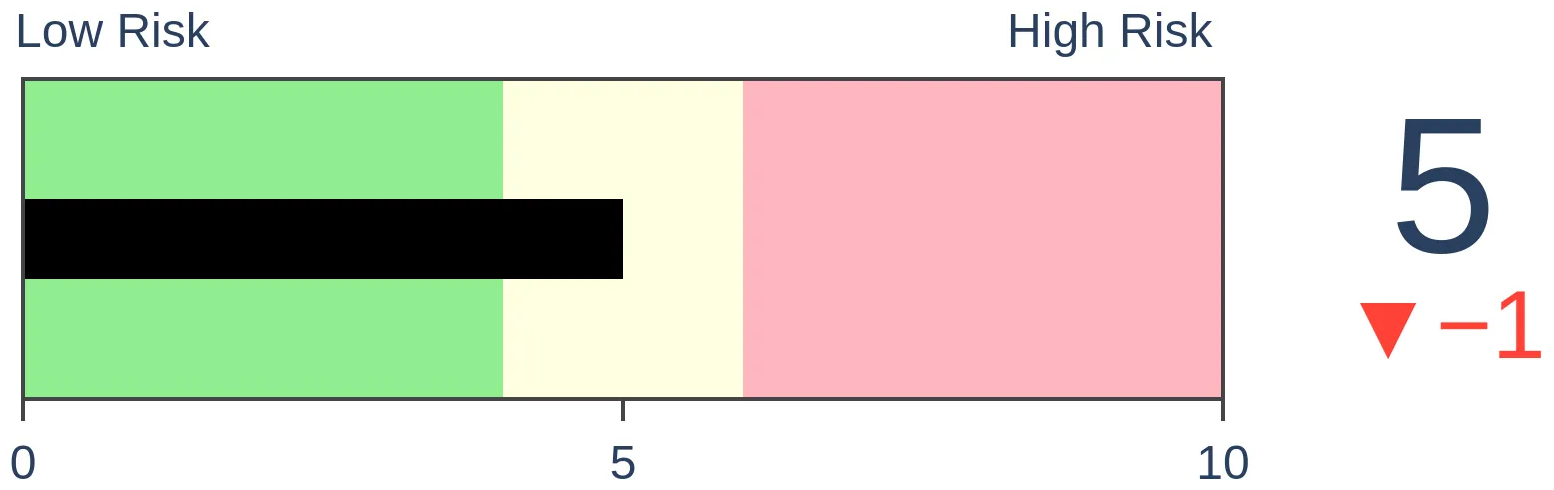
Risk Levels
Stocks Short-Term
|
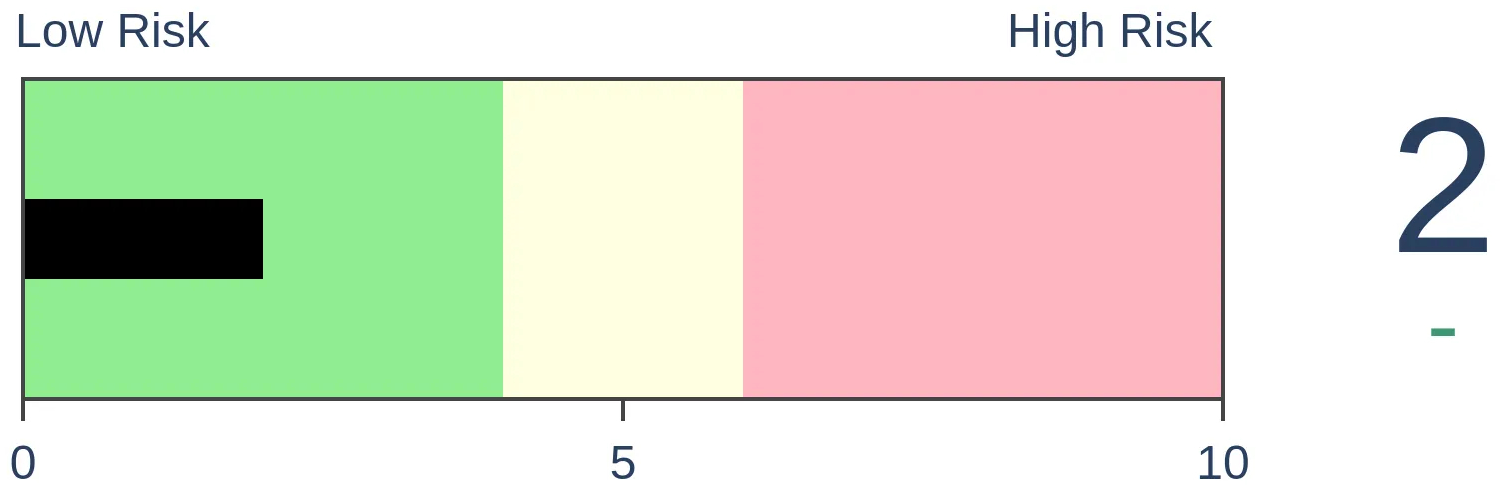
Stocks Medium-Term
|
|
Bonds
|
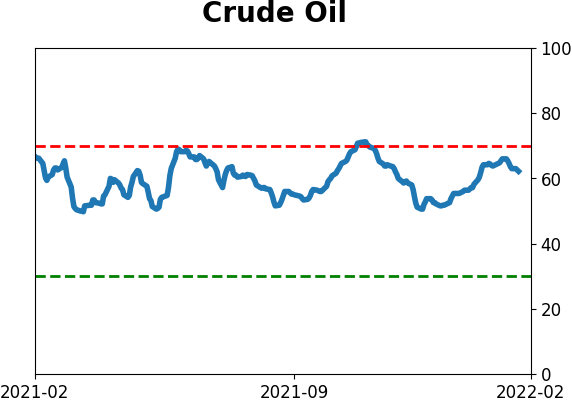
Crude Oil

|
|
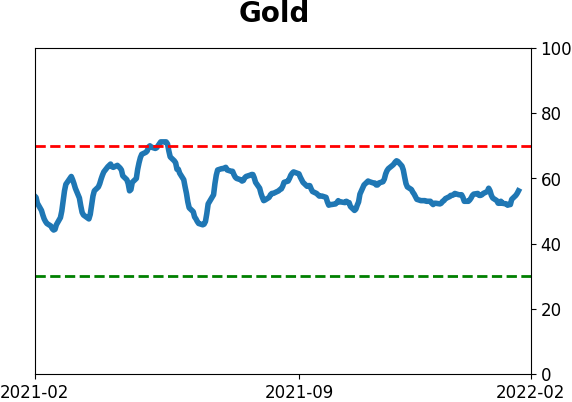
Gold

|
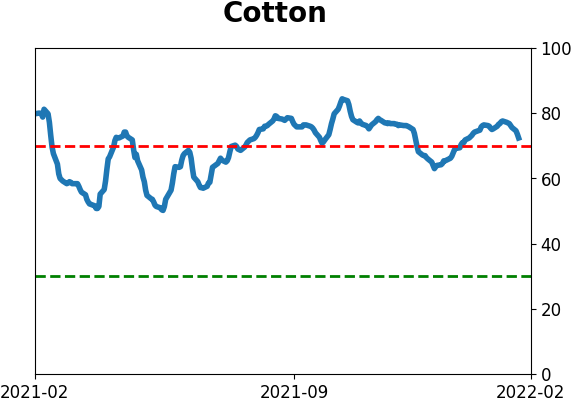
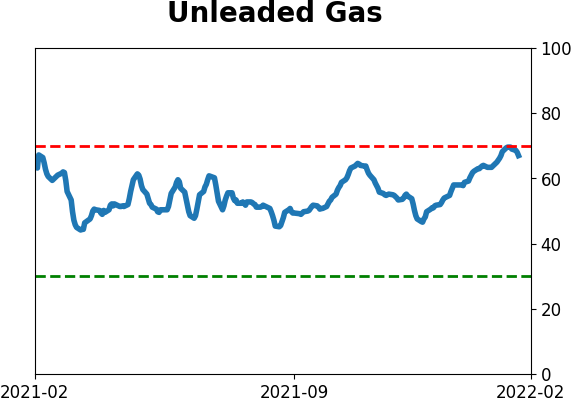
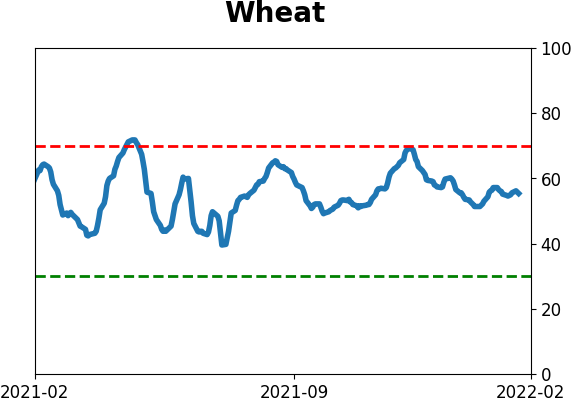
Agriculture
|
|
Research
By Jason Goepfert
BOTTOM LINE
The McClellan Summation Index for Brazil's Ibovespa Index is turning positive, ending a record-long streak in negative territory. Other times when internal momentum in the Ibovespa turned positive after 6 months in negative territory, it preceded remarkable long-term gains in the index.
FORECAST / TIMEFRAME
EWZ -- Up, Long-Term
|
Key points:
- The McClellan Summation Index for Brazil's Ibovespa Index is about to turn positive
- That will end a record-long streak in negative territory for the internal momentum indicator
- Similar recoveries preceded short-term pullbacks, but impressive long-term gains
Internal momentum in Brazilian stocks is turning positive
The long-suffering investors in Brazil have finally gotten a reprieve, and it may last a while.
Last October, we showed how sellers were piling on Brazil. Stocks in the Ibovespa index were suffering a historic avalanche of selling pressure that subsided soon after. The Ibovespa chopped around until about a month ago and has been on a steady march higher ever since.
One of the guides we looked at was the McClellan Summation Index. It had been persistently and heavily negative for months. According to the Backtest Engine, the test we ran in October triggered a buy signal on January 21. It's now on the cusp of turning positive for the first time in more than 6 months.
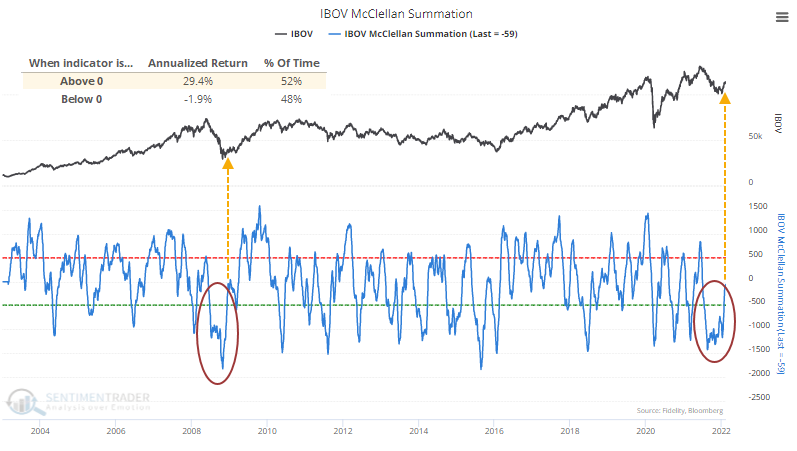
The Ibovespa has shown an extreme difference in performance depending on the position of the Summation Index. When it was above zero, the Ibovespa showed an annualized return of +29.4% since 1997. When the Summation Index was below zero, its annualized return plummeted to -1.9%.
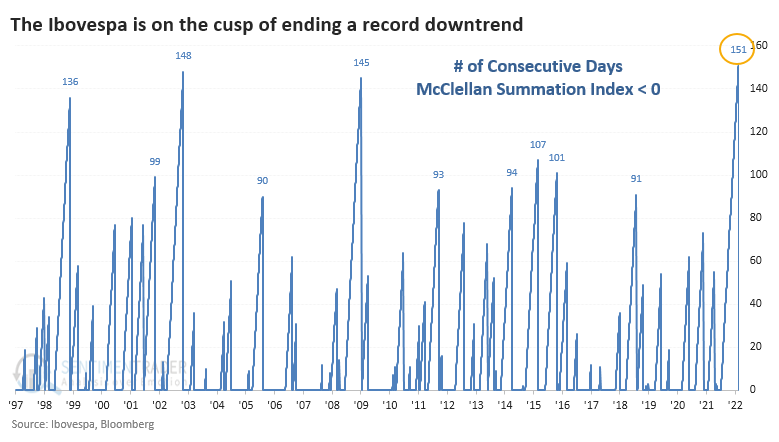
The recovery above zero will end the longest-ever streak in negative territory dating back to at least 1997.
Similar recoveries preceded remarkable long-term gains
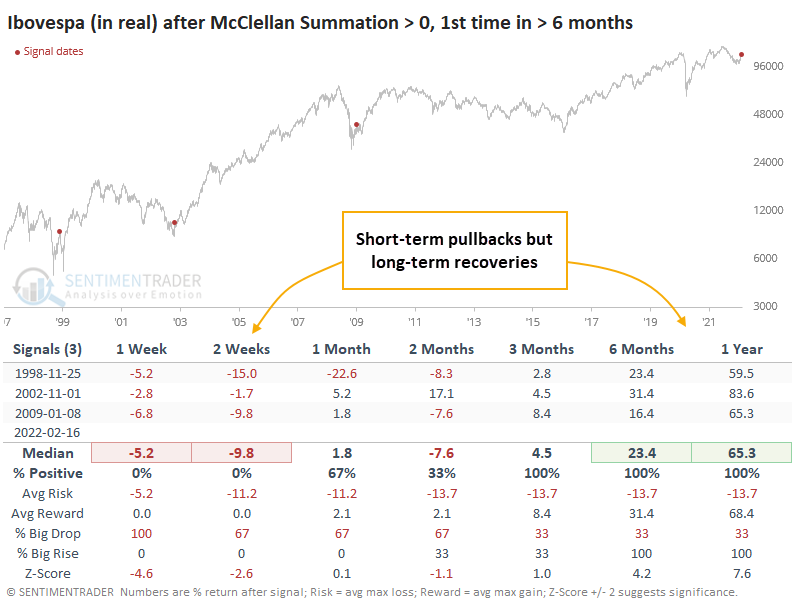
There were only a few other times when the Summation Index rose above zero for the first time in at least 6 months. Priced in reals, the Ibovespa showed a consistent tendency to settle back in the short-term (well, as much as we can determine consistency from a sample size of 3).
But all 3 also marked important long-term turning points in Brazilian stocks; the index sported double-digit gains over the next 6 months each time. A year later, the Ibovespa showed a remarkable average gain of more than 65%. I'm making the semi-safe assumption that the Summation Index is going to turn positive today, which it should.
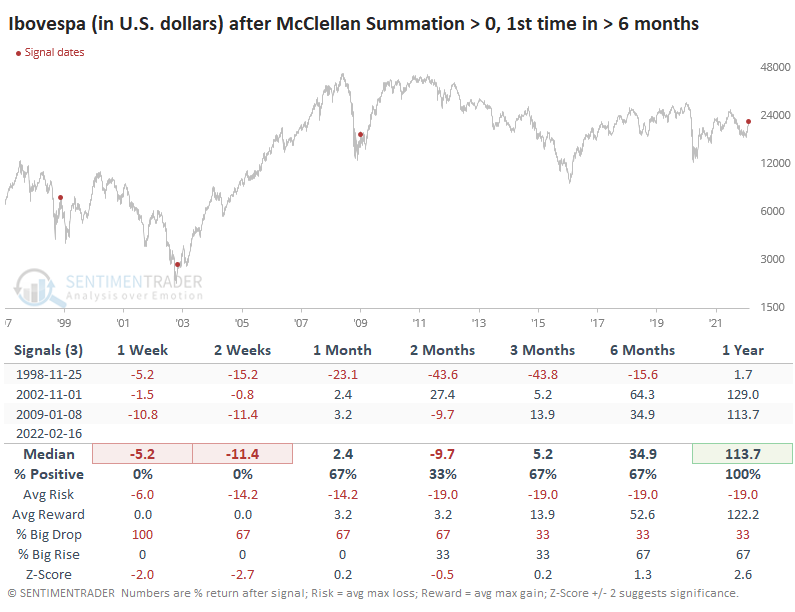
Thanks to periods of runaway inflation, the real has lost consistent ground against the U.S. dollar. When we price the Ibovespa in dollars, the McClellan Summation Index recoveries were less impressive but still positive over the next year.
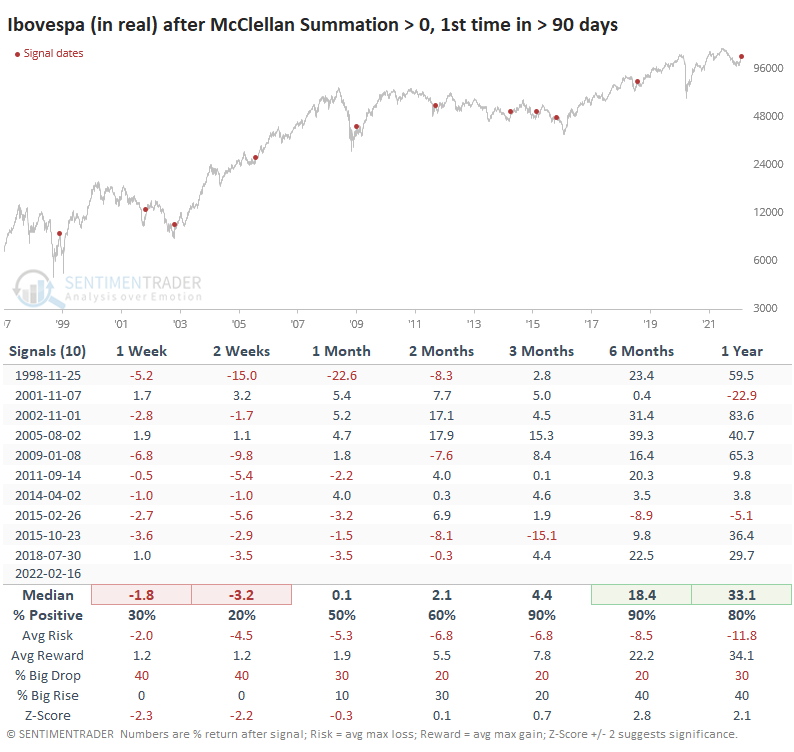
Let's look at times when the Summation Index spent at least 90 days below zero (instead of at least 6 months) to get a larger sample size. After these, the Ibovespa still showed consistent short-term weakness, but returns over the next 3+ months were impressive.
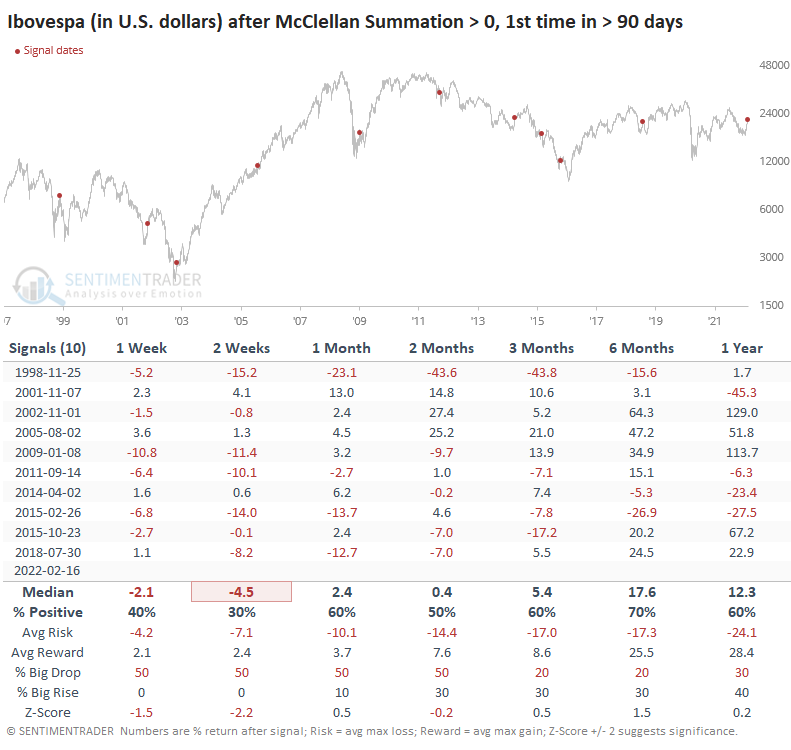
The Ibovespa's returns were understandably less positive when priced in dollars but still had a long-term positive tone.
What the research tells us...
The historic level of selling pressure in Brazil's Ibovespa index last fall preceded a two-month consolidation phase. That has since resolved to the upside, and buying interest has been impressive. Long-term internal momentum indicators are now turning positive. While there are few precedents for comparison, the ones we have were consistent in hinting that we might see some short-term pullbacks as buyers take a breath, but it should indicate a much more positive long-term environment for those stocks.
Active Studies
| Time Frame | Bullish | Bearish | | Short-Term | 3 | 0 | | Medium-Term | 18 | 2 | | Long-Term | 15 | 5 |
|
Indicators at Extremes
Portfolio
| Position | Description | Weight % | Added / Reduced | Date | | Stocks | RSP | 21.4 | Added 10.2% | 2022-01-28 | | Bonds | 32.7% BND, 7.1% SCHP | 40.1 | Added 8.3% | 2021-10-26 | | Commodities | GCC | 2.4 | Reduced 2.1%
| 2020-09-04 | | Precious Metals | GDX | 4.6 | Reduced 4.2% | 2021-05-19 | | Special Situations | 8.1% KWEB, 3.6% XLE, 1.7% PSCE | 13.4 | Reduced 3.9% | 2022-01-18 | | Cash | | 17.9 | | |
|
Updates (Changes made today are underlined)
With a typical time frame of several months in this account, I normally don't make changes so quickly. I've added back part of the stock exposure I took off earlier in January due to the washed-out conditions and extreme pessimism we're seeing across a wide array of metrics. The biggest issue is that the environment is unhealthy and we could be in the throes of a protracted bear market. Even so, the readings we've seen recently have a good record at preceding relief rallies, so we'll have to see how that pans out. Bond sentiment is trying to recover from a recent bout of pessimism, and gold stocks are doing their thing which is not much at all. They've been flat for six months. Chinese tech stocks were doing exactly what they're supposed to do, then did *not* by plunging to new lows. This is troubling on a shorter-term time frame, but this was never meant for a trade, rather a multi-year investment. Recent behavior is troubling and I will not be adding any exposure as long as that's the case. RETURN YTD: +0.2% 2021: +8.7%, 2020: +8.1%, 2019: +12.6%, 2018: +0.6%, 2017: +3.8%, 2016: +17.1%, 2015: +9.2%, 2014: +14.5%, 2013: +2.2%, 2012: +10.8%, 2011: +16.5%, 2010: +15.3%, 2009: +23.9%, 2008: +16.2%, 2007: +7.8%
|
|
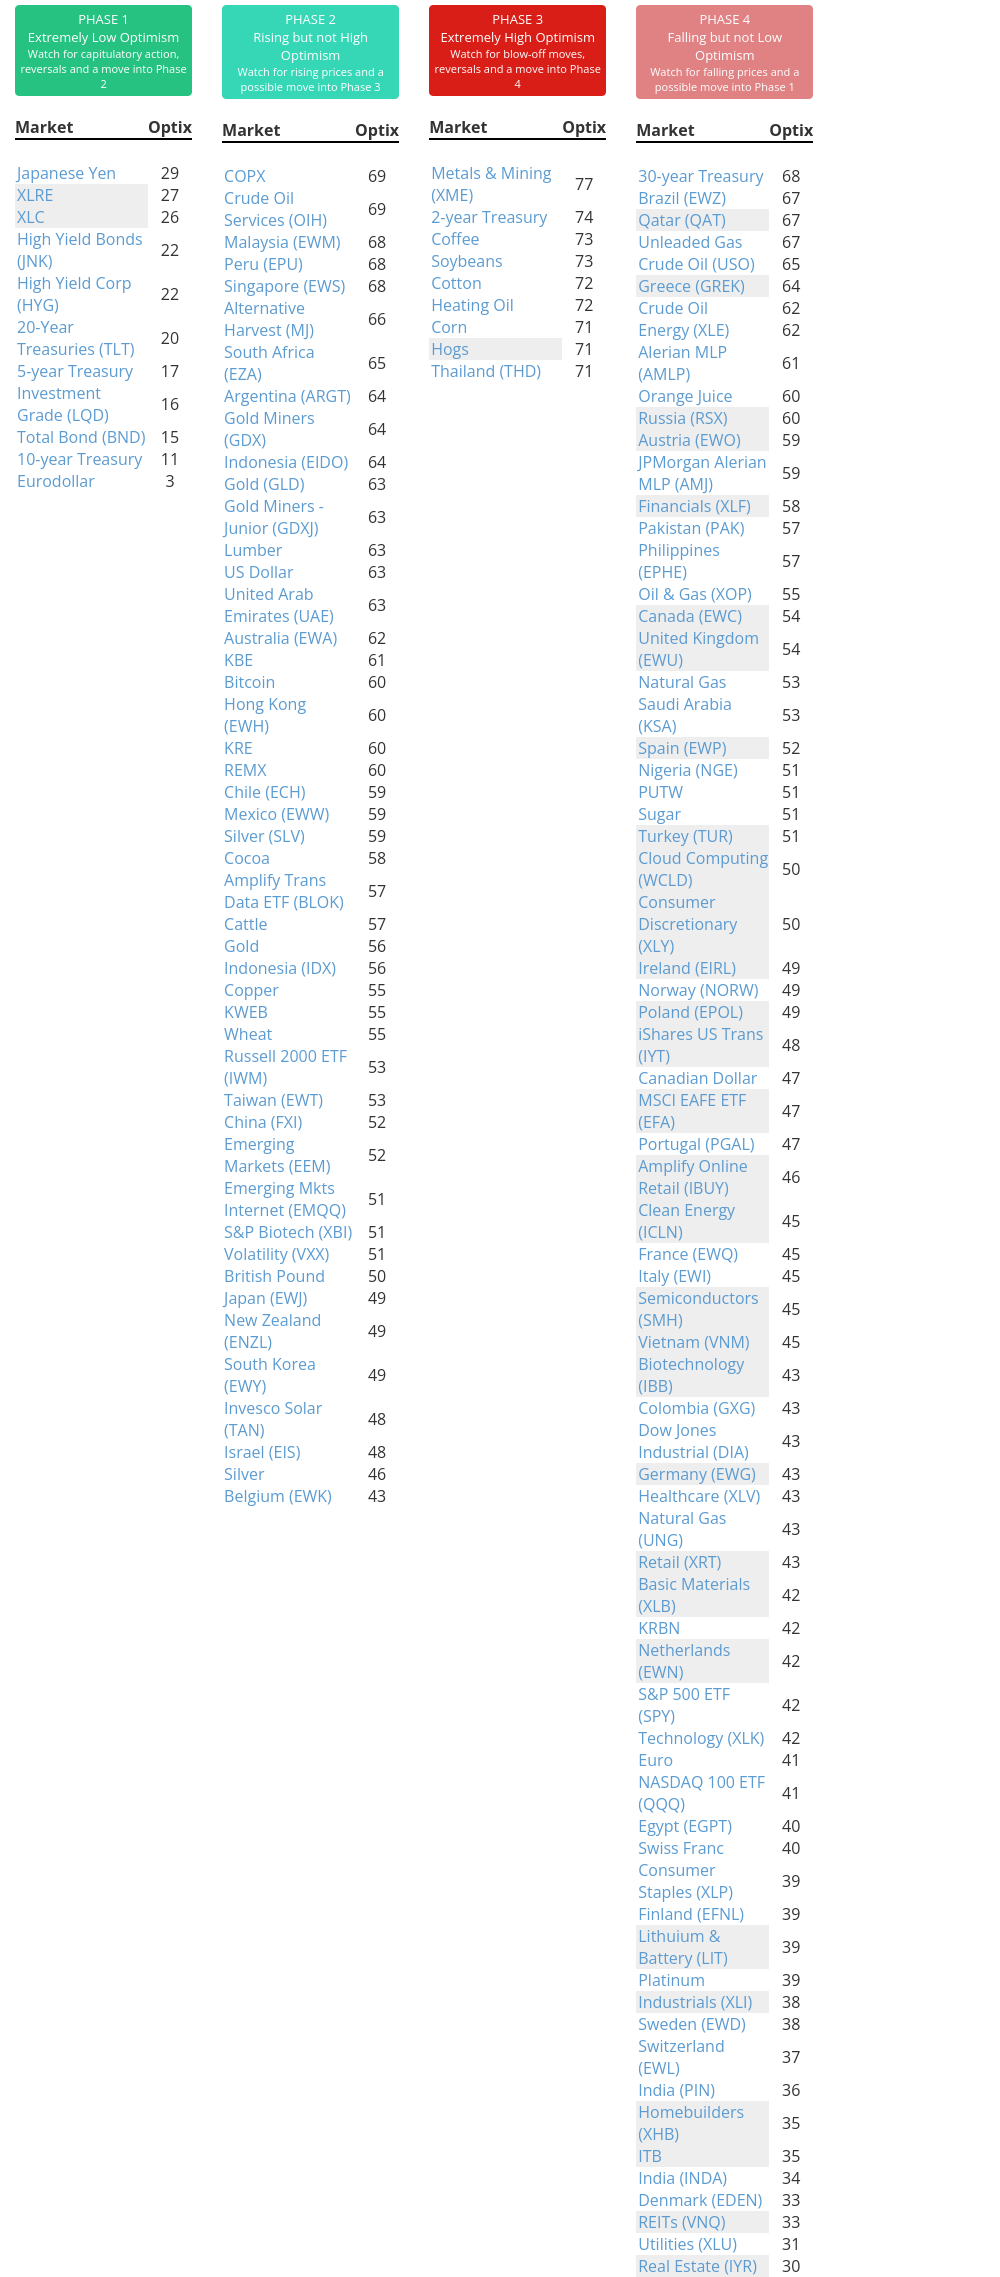
Phase Table
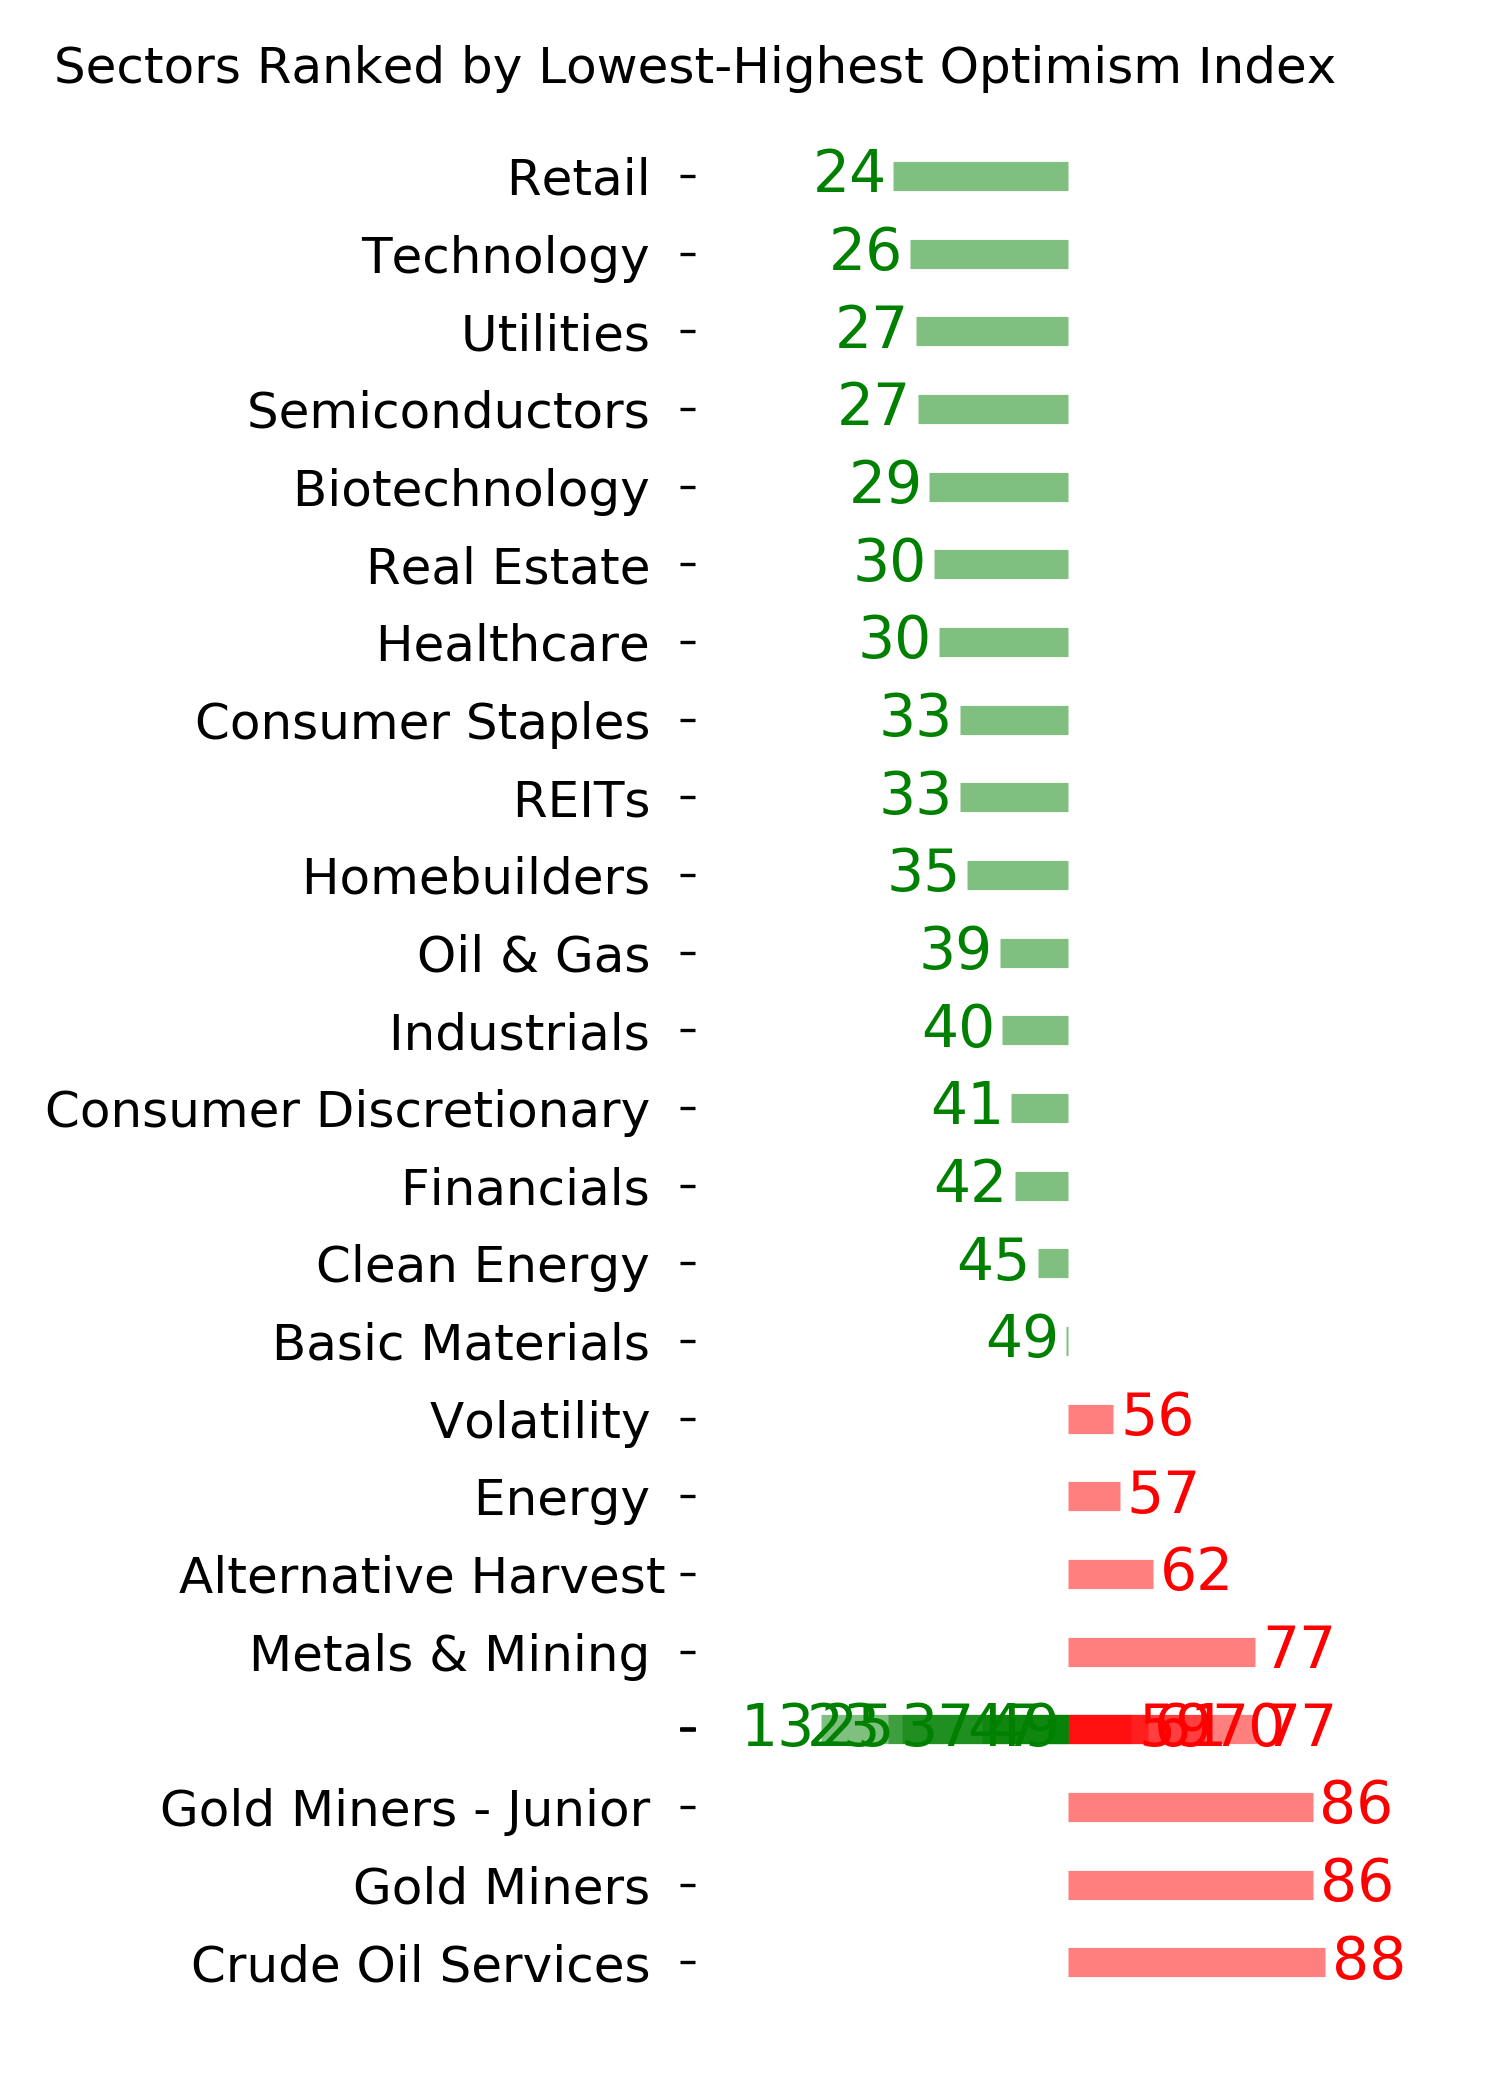
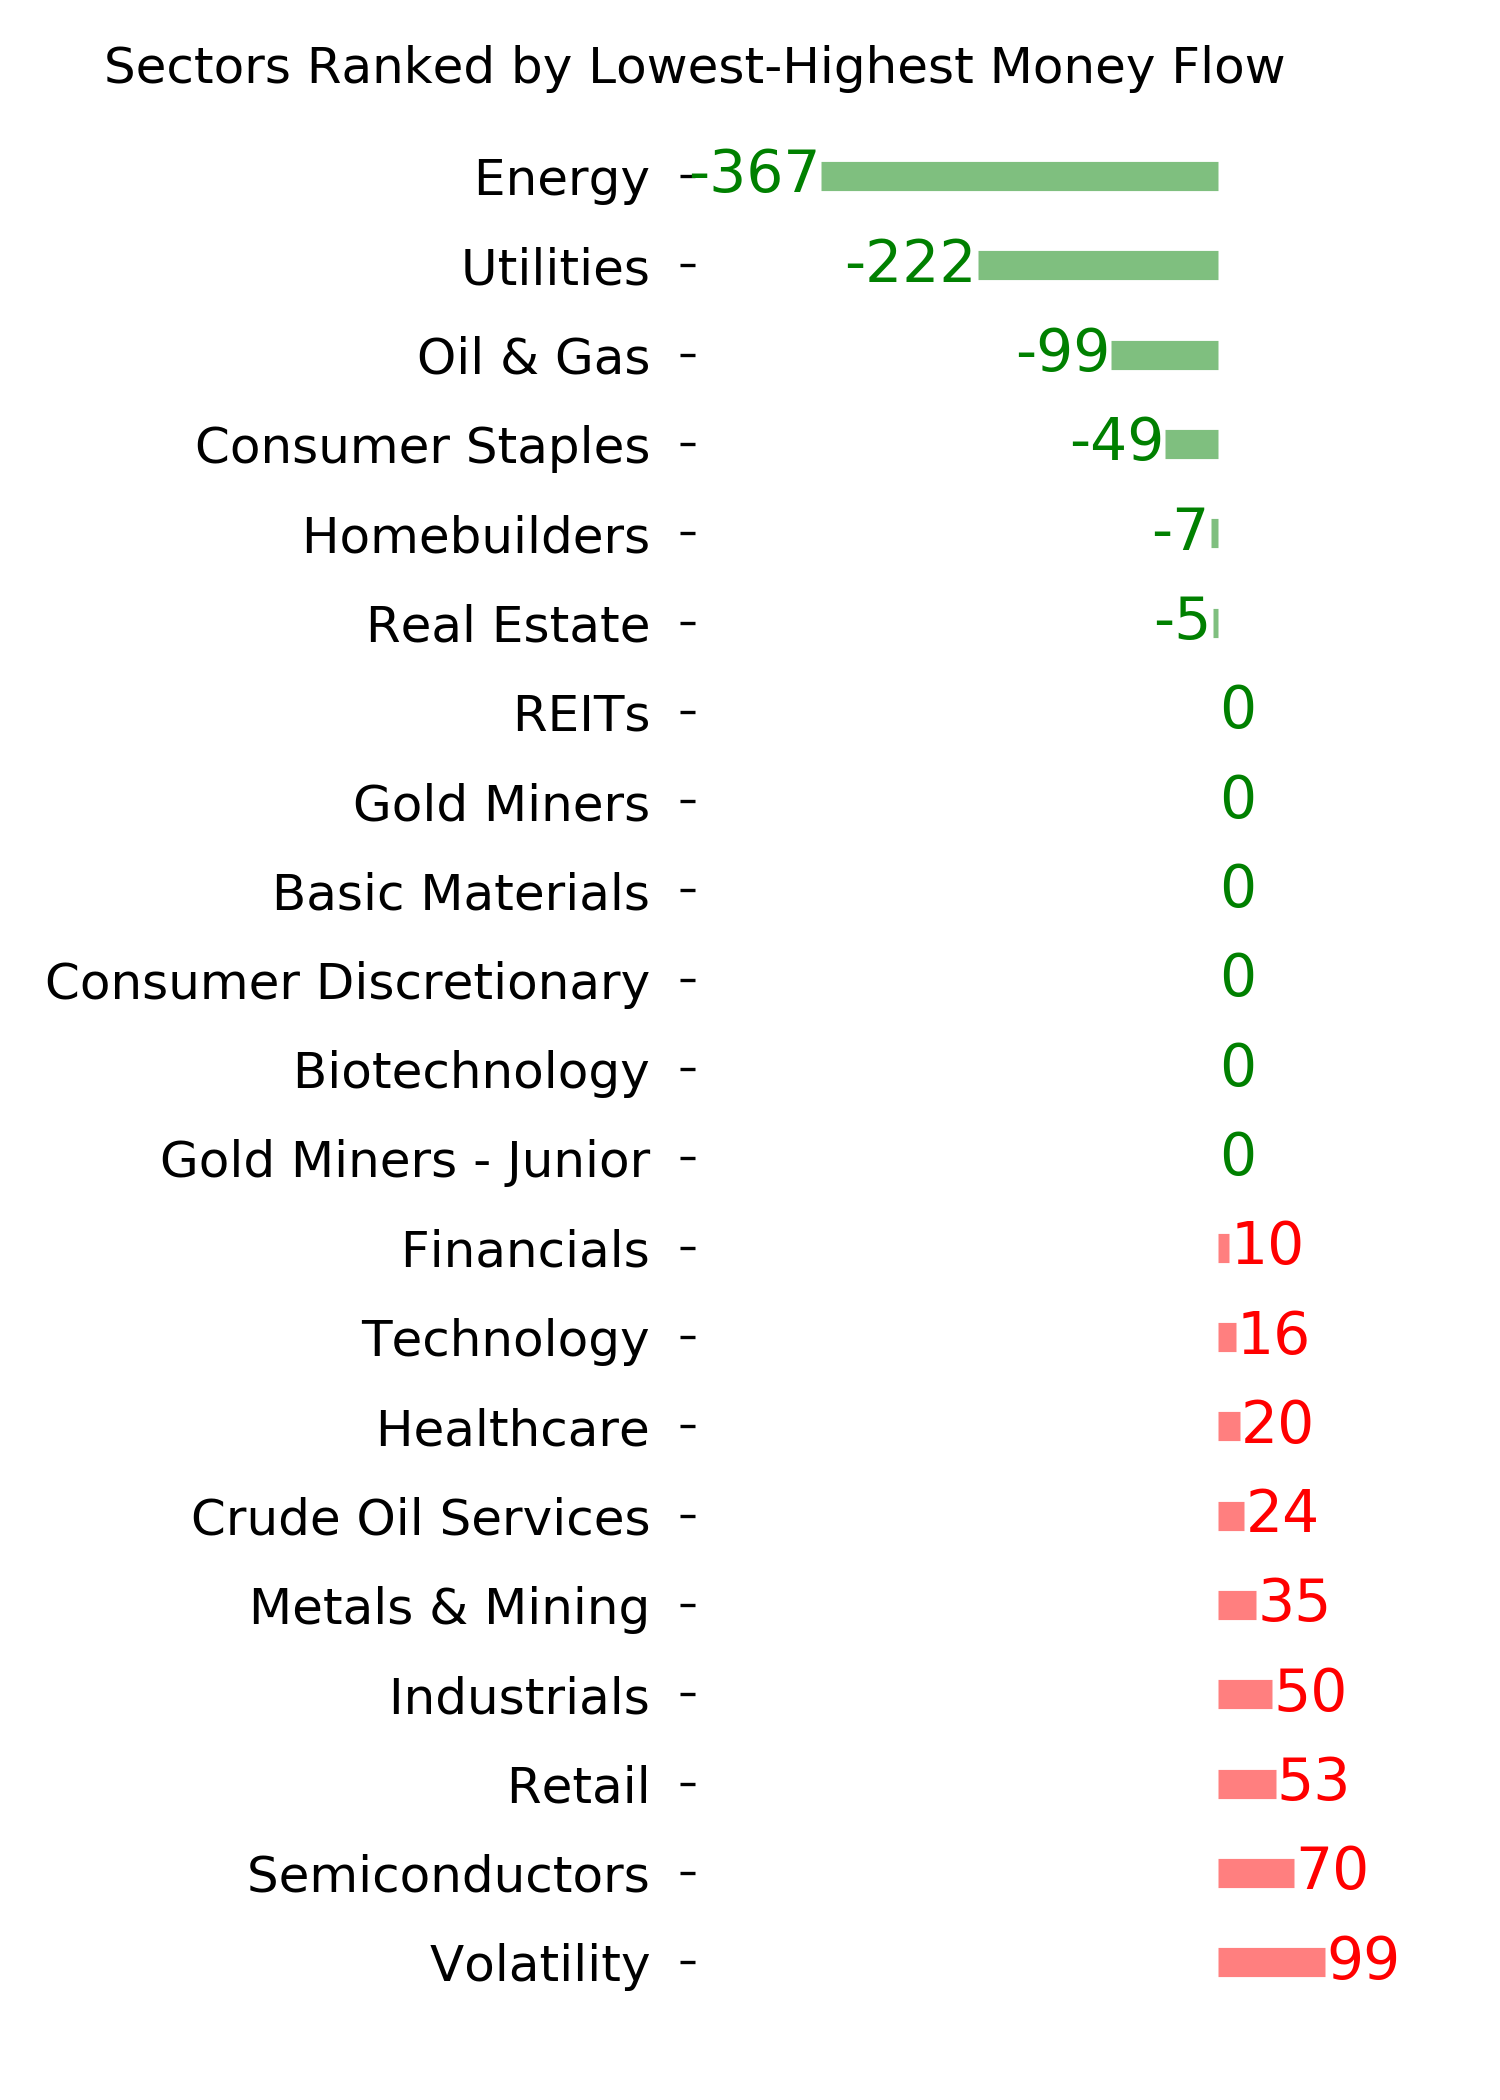
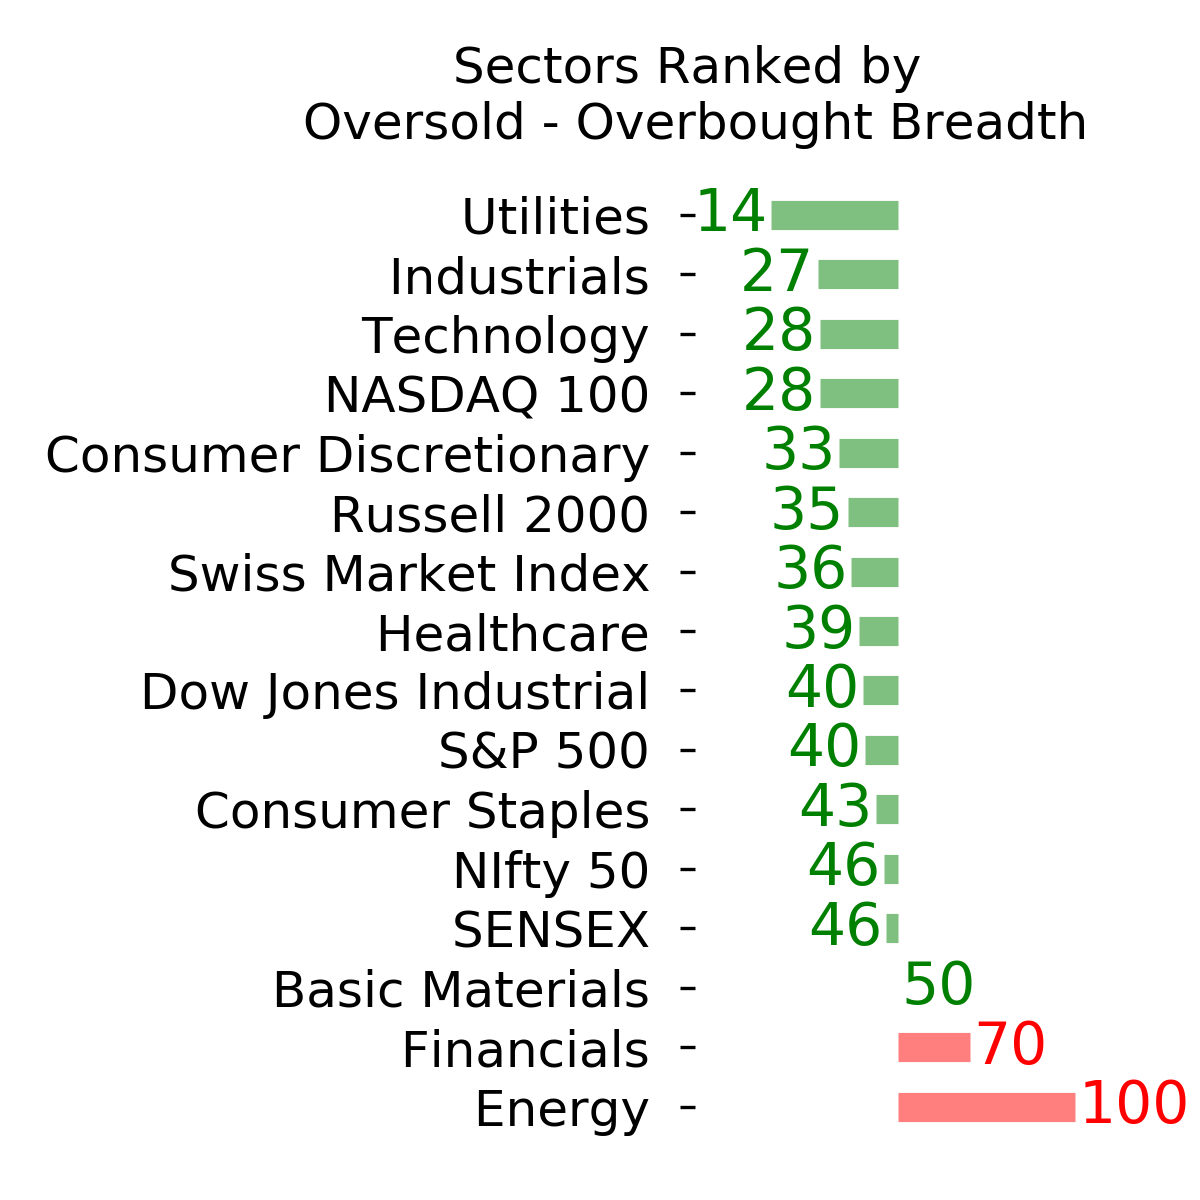
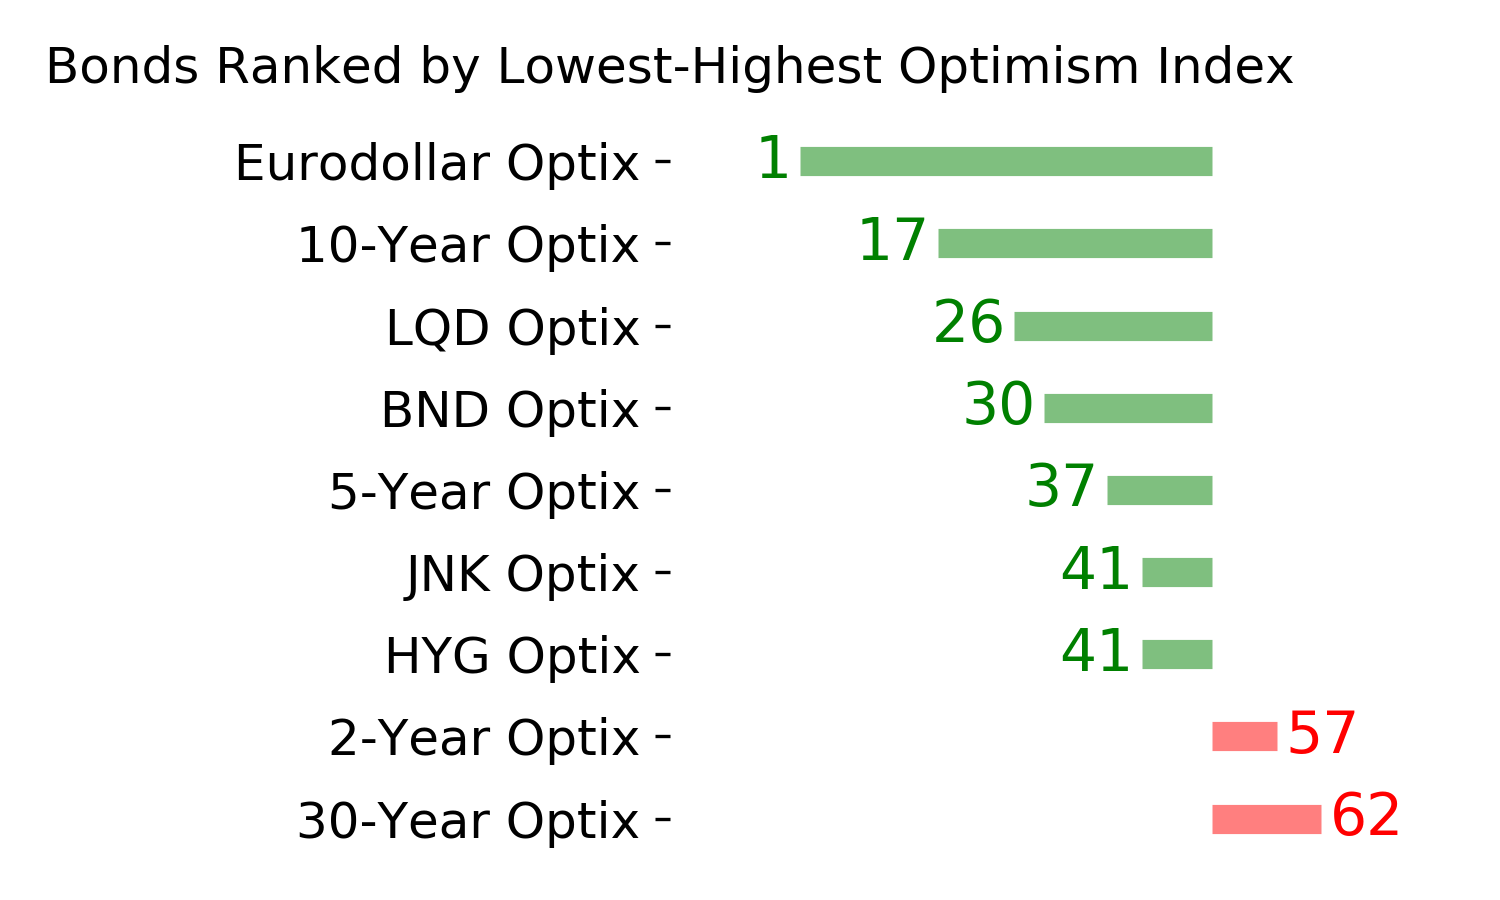
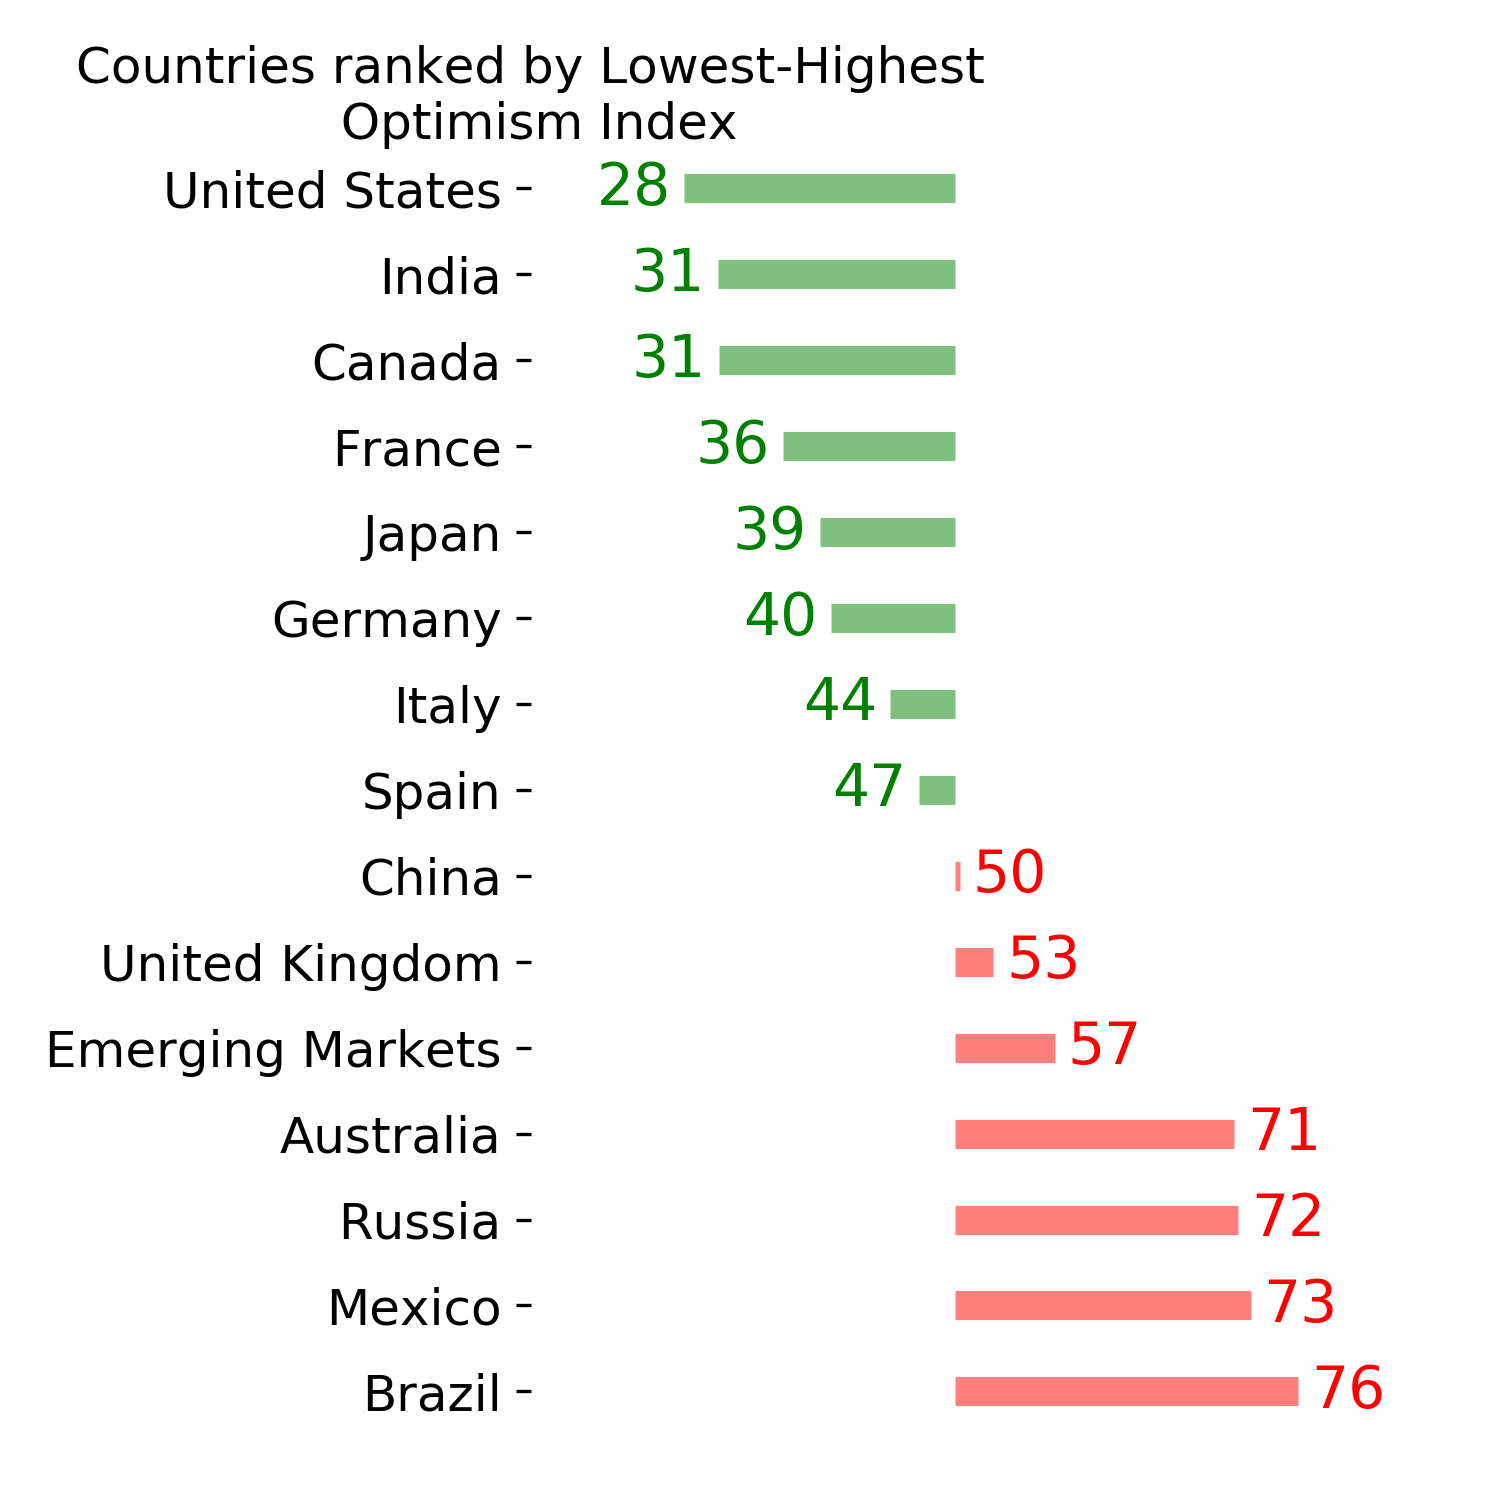
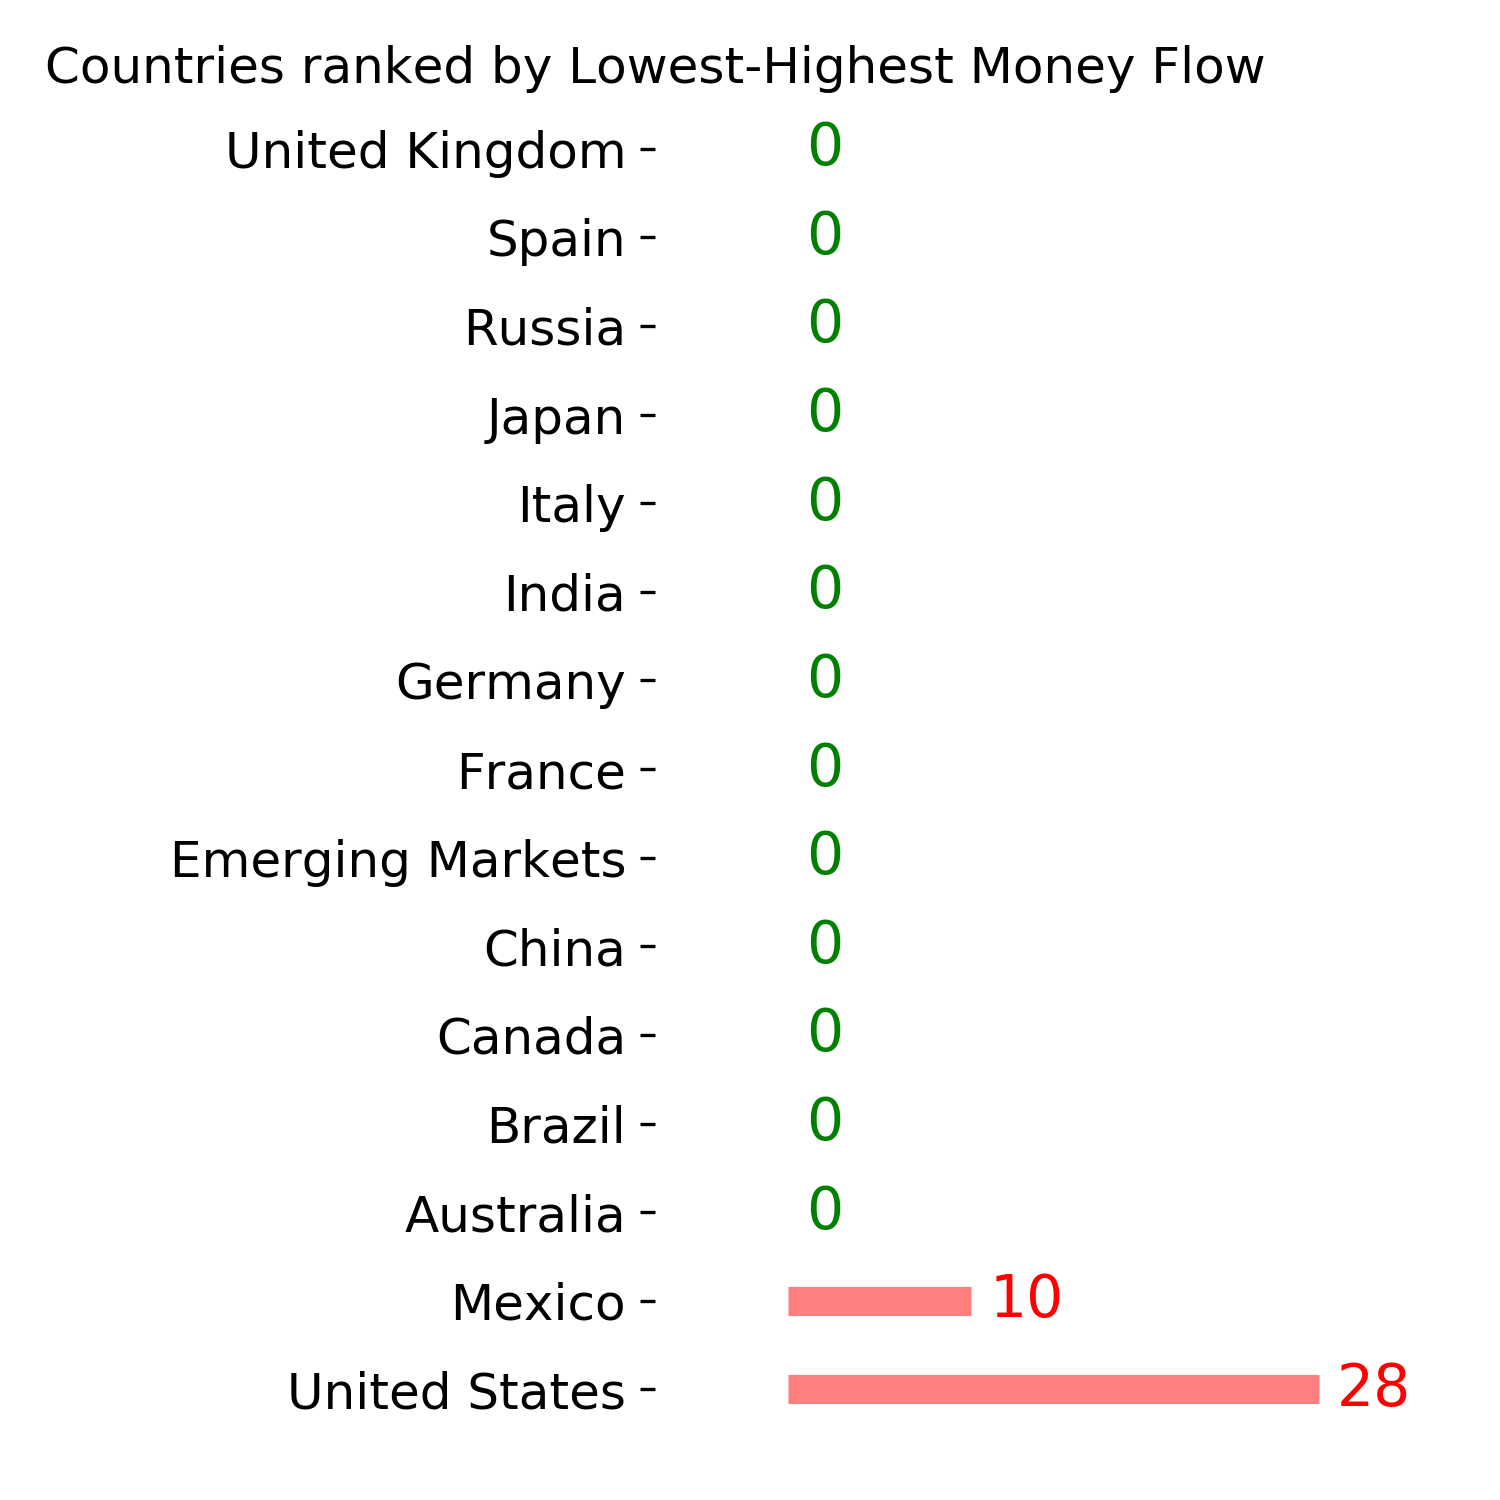
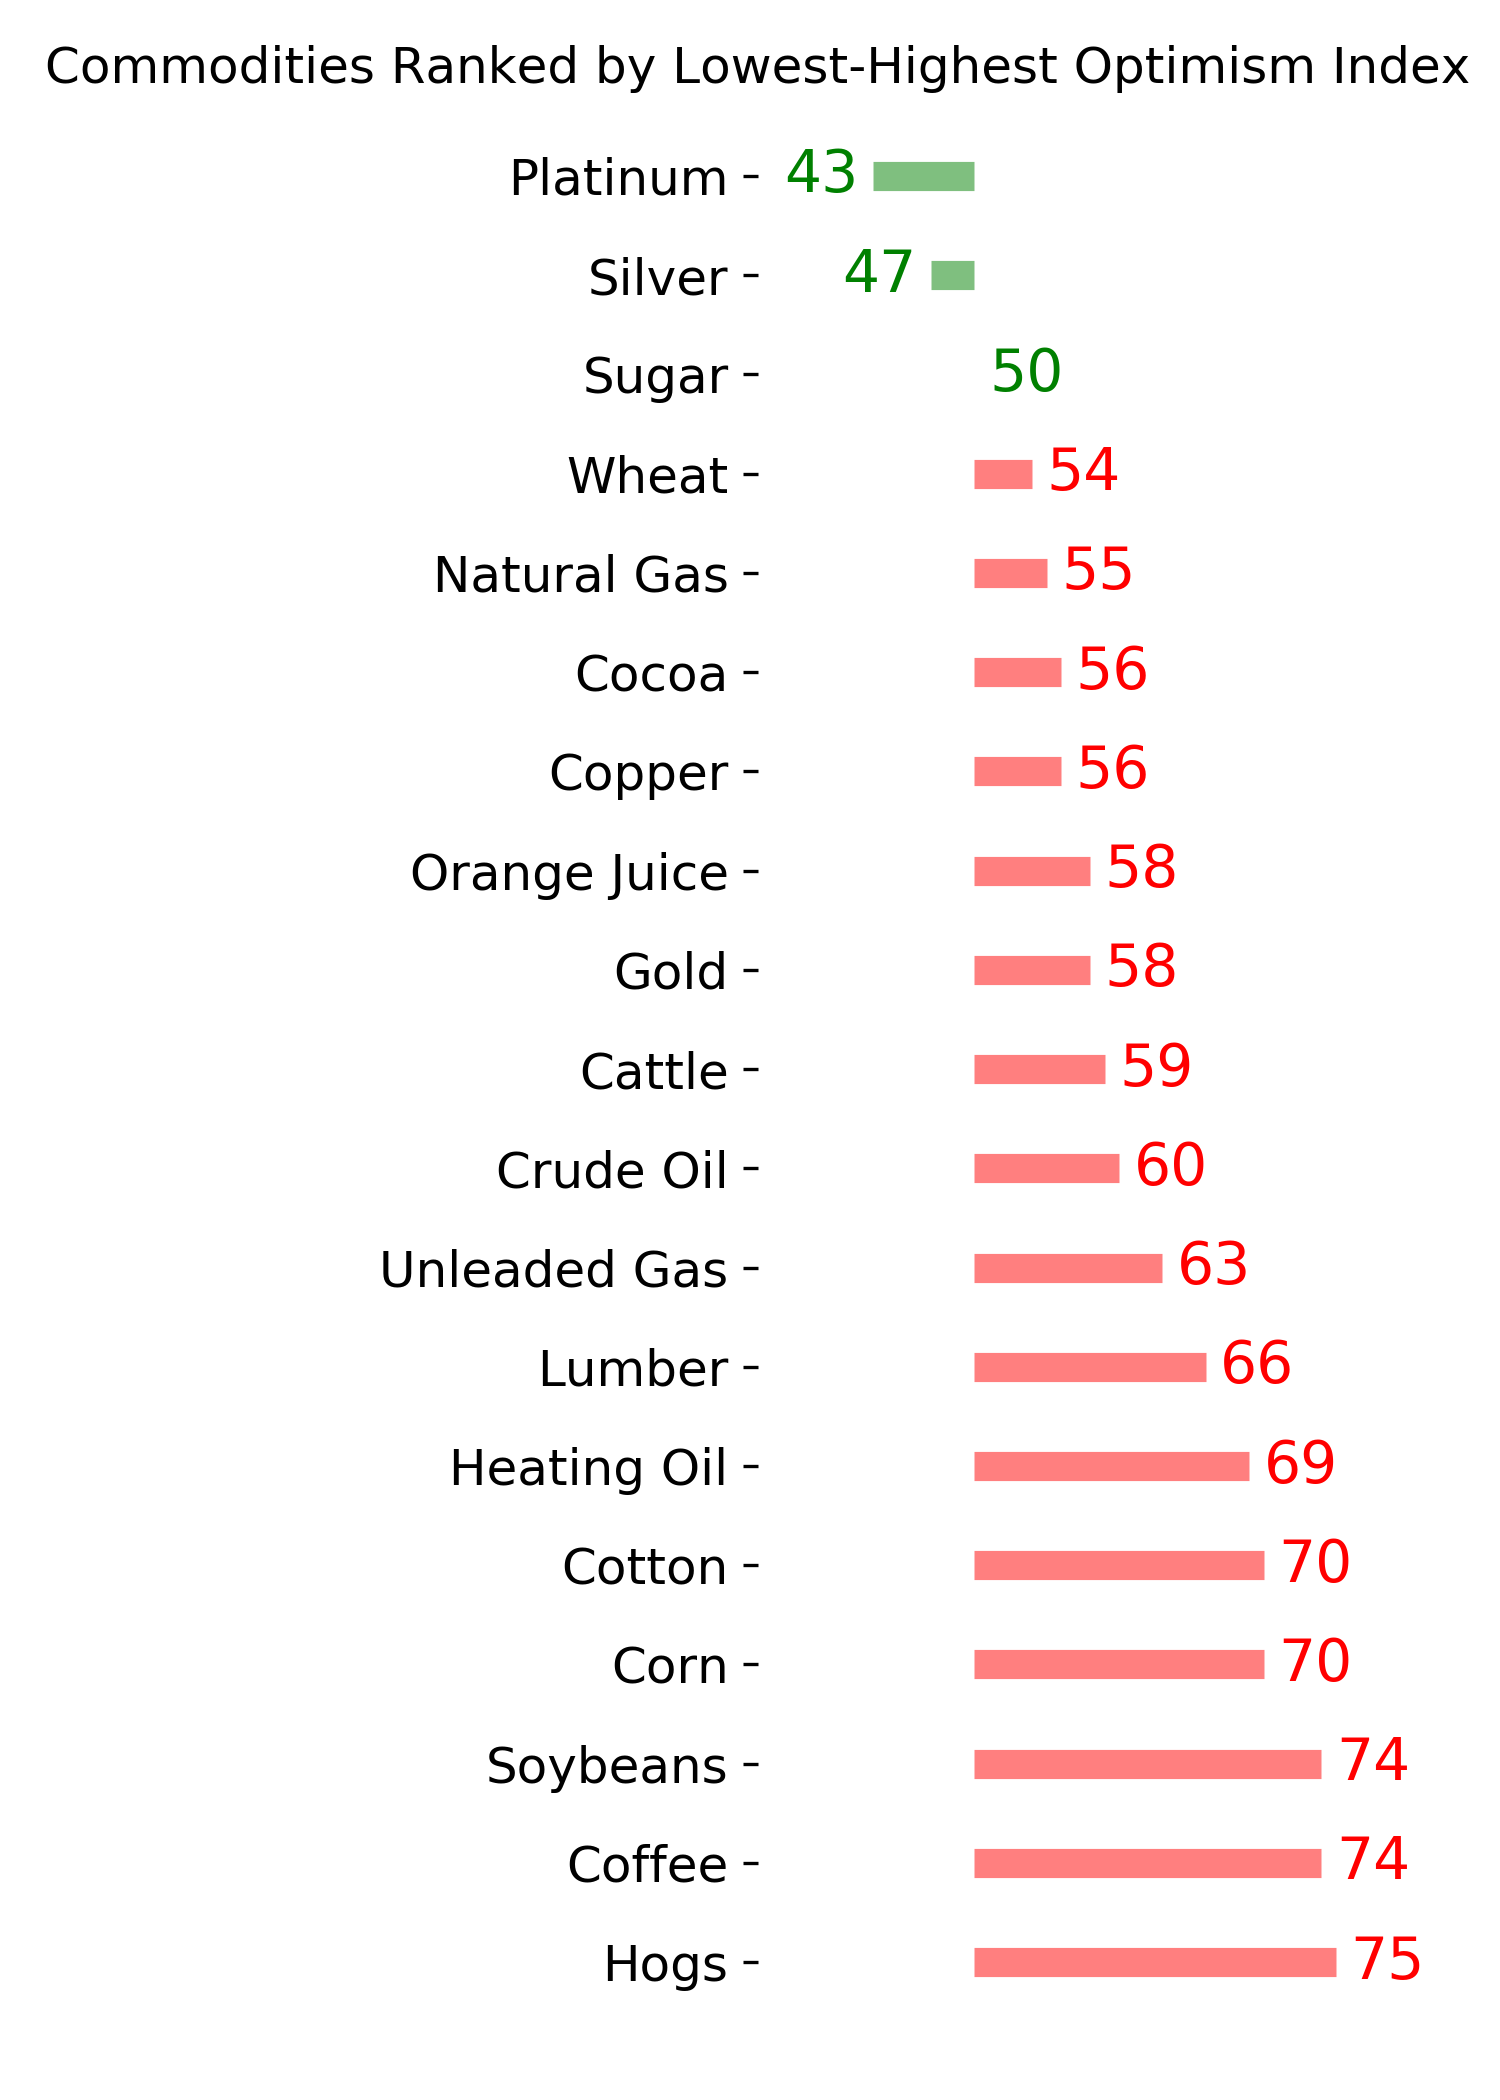
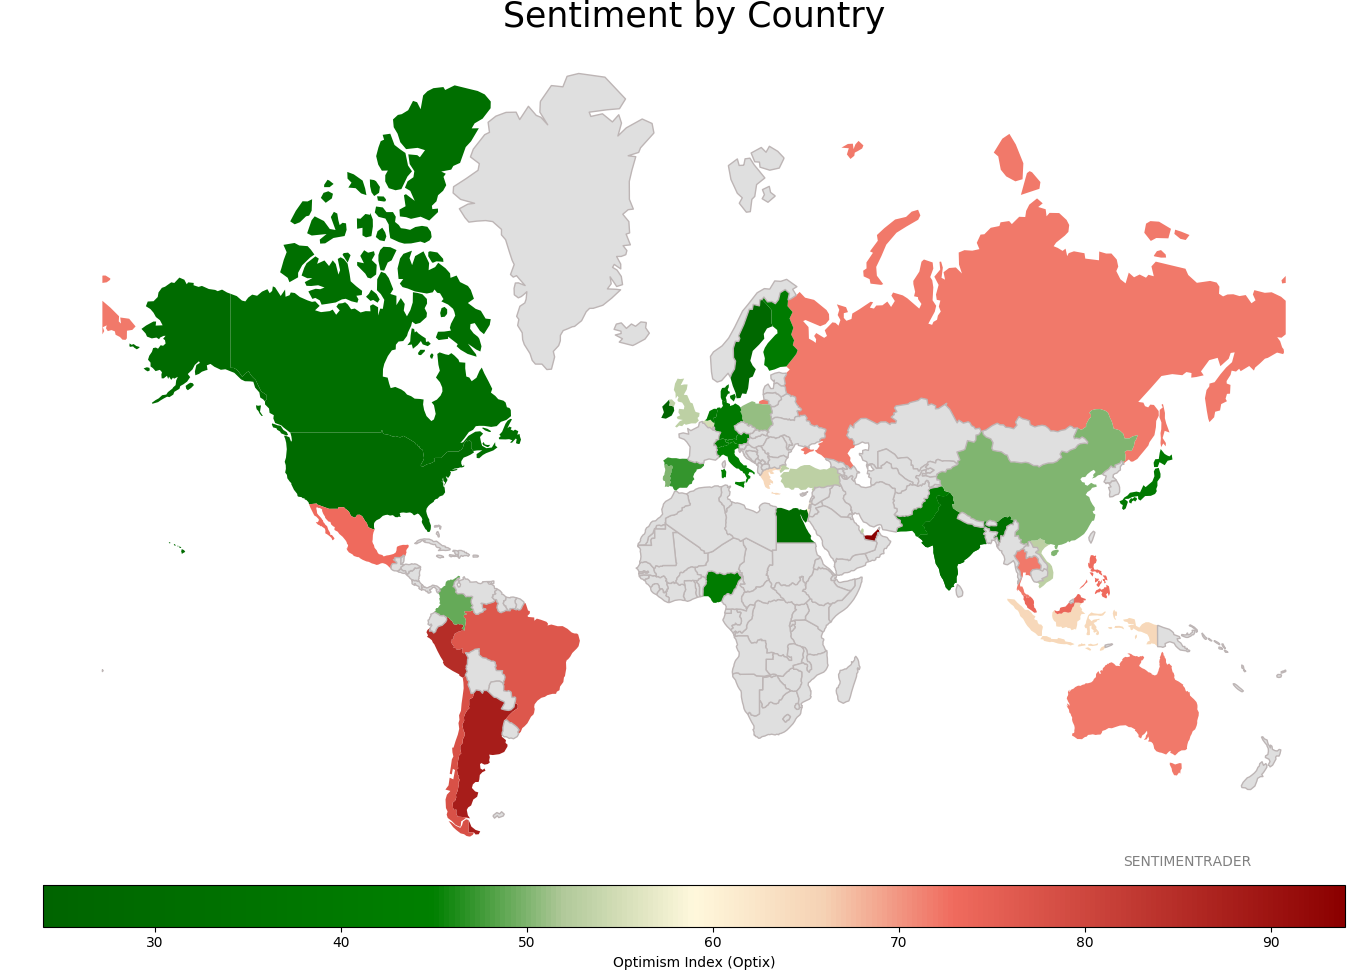
Ranks
Sentiment Around The World
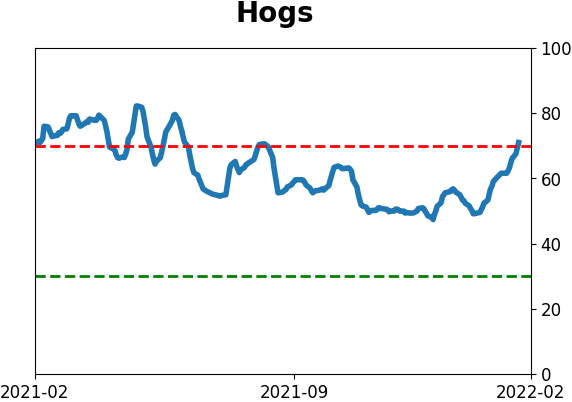
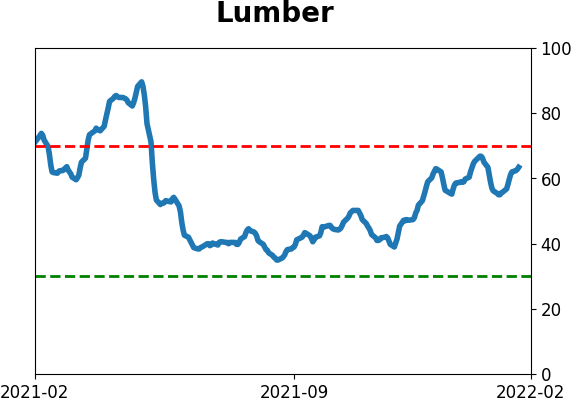
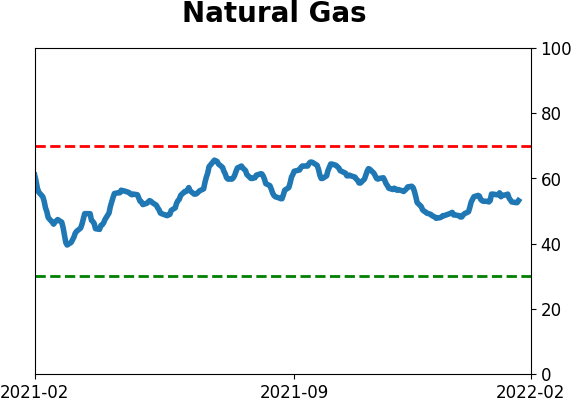
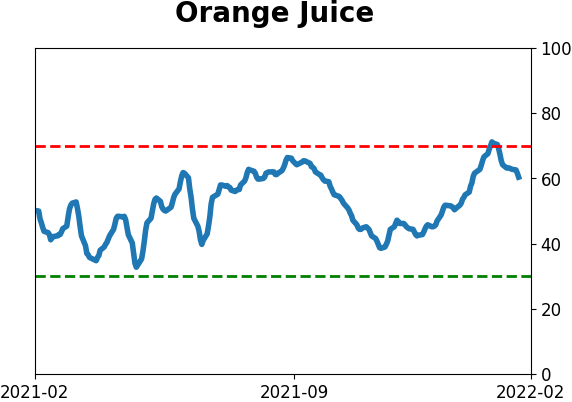
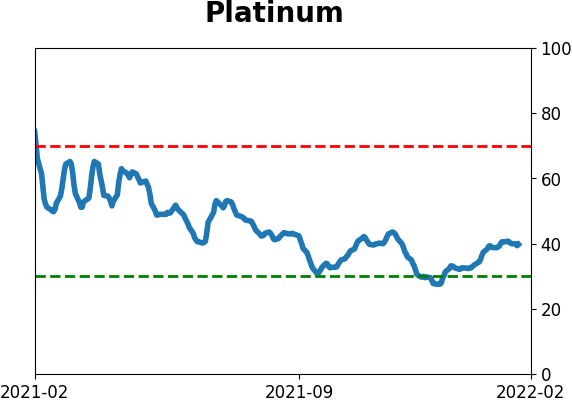
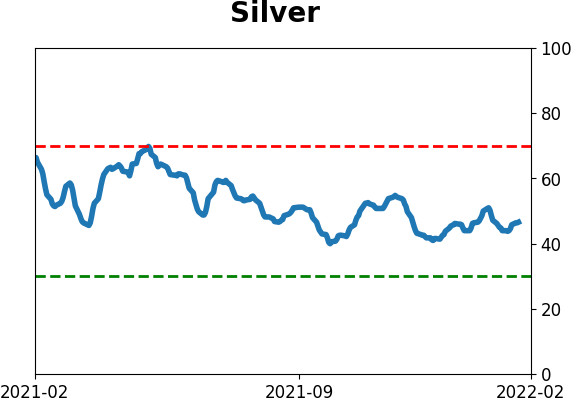
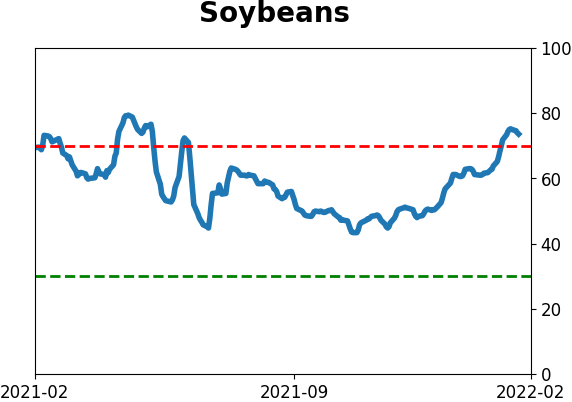
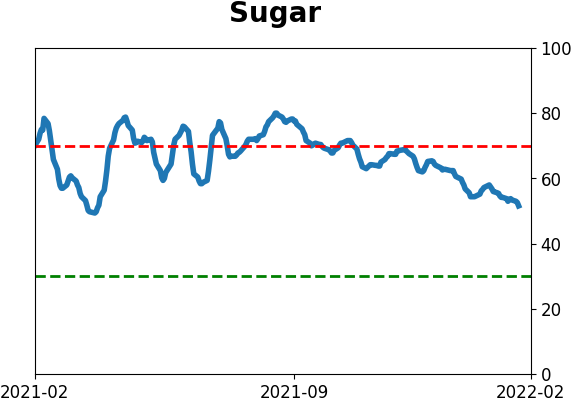
Optimism Index Thumbnails
|
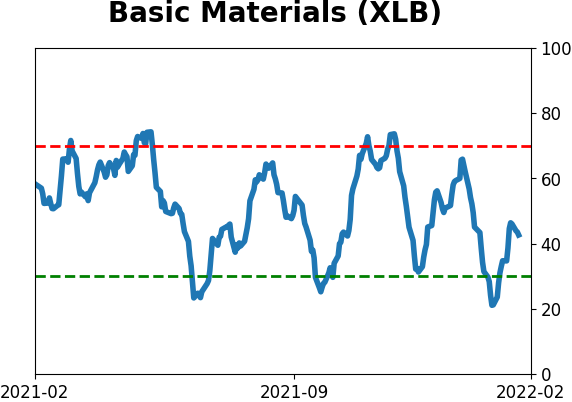
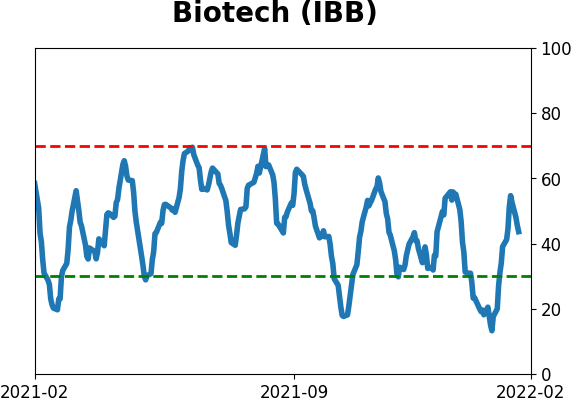
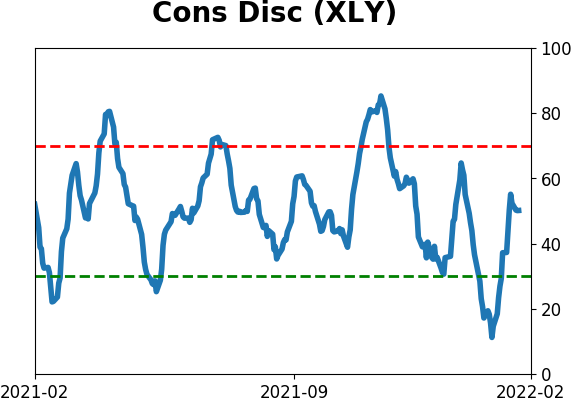
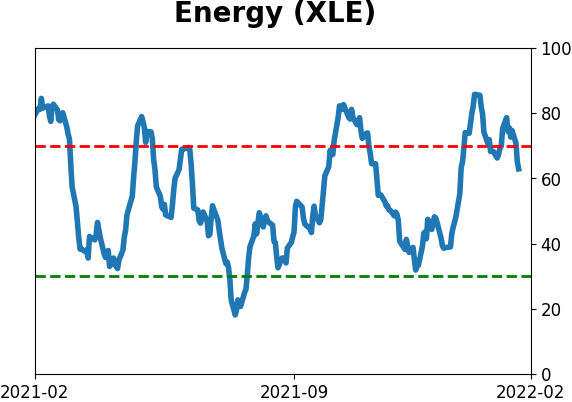
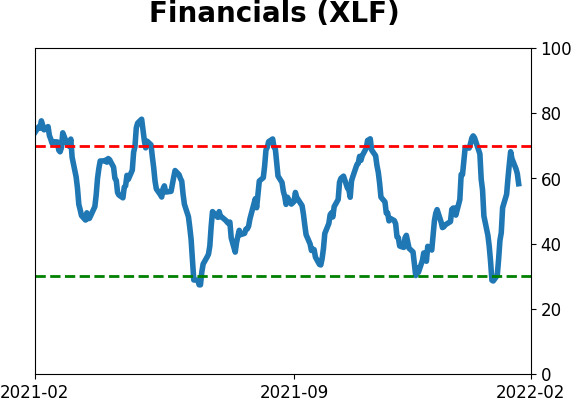
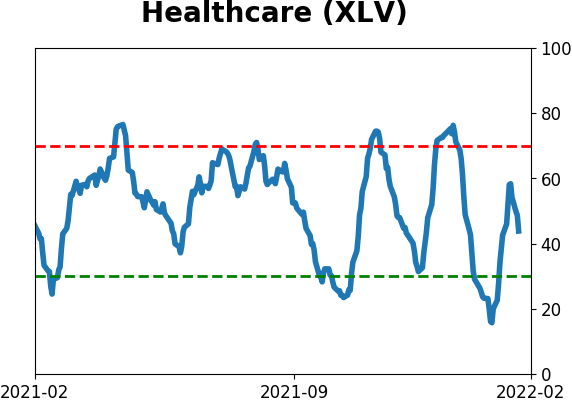
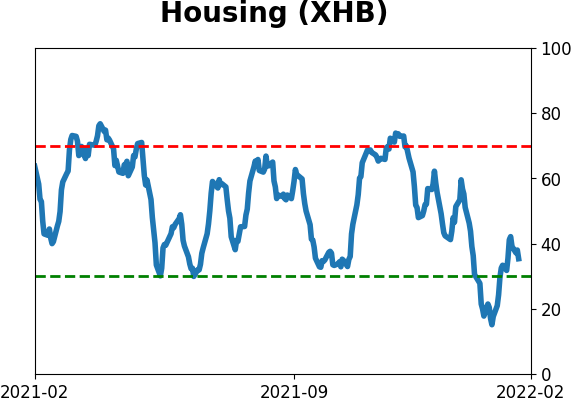
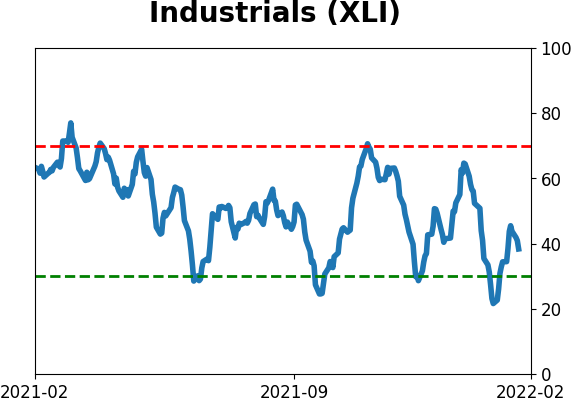
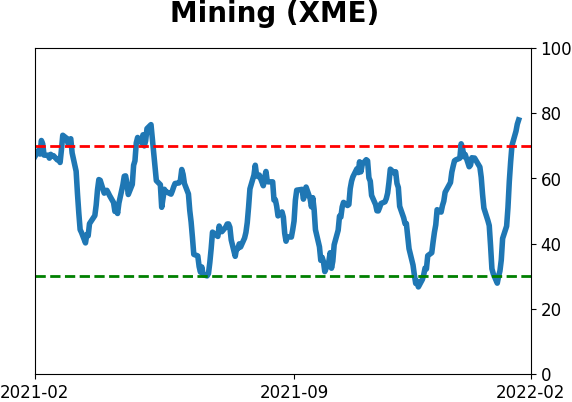
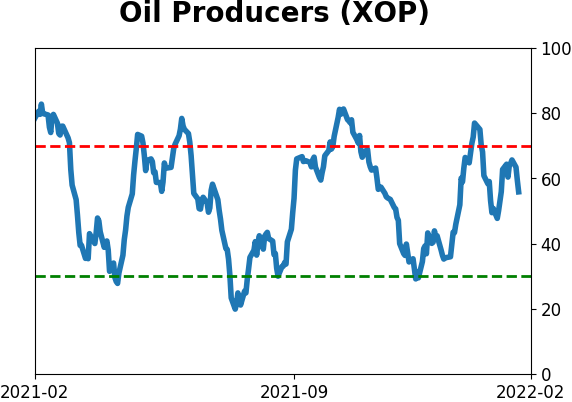
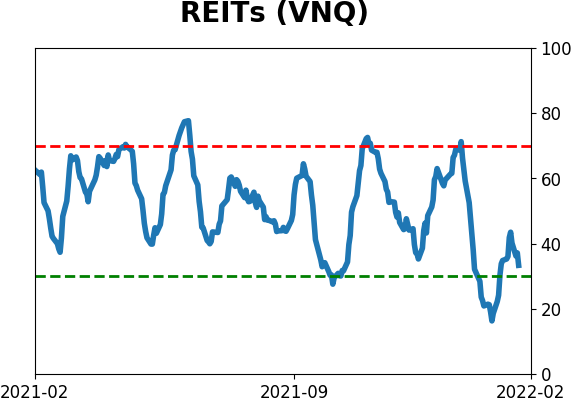
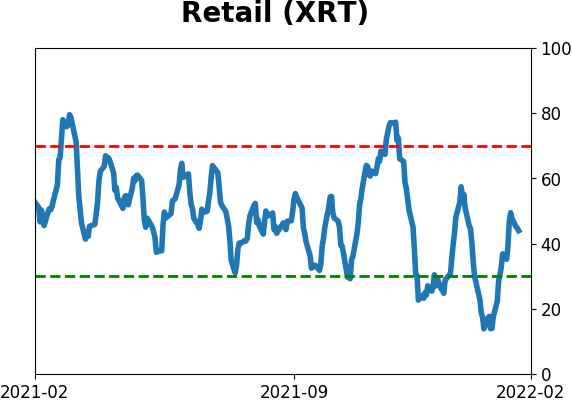
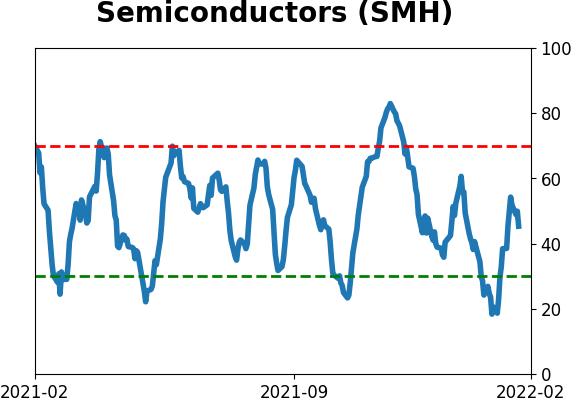
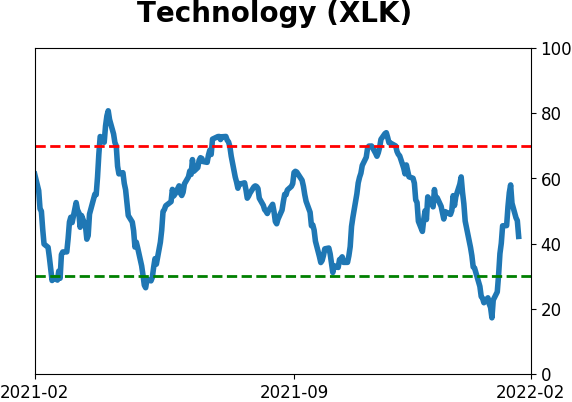
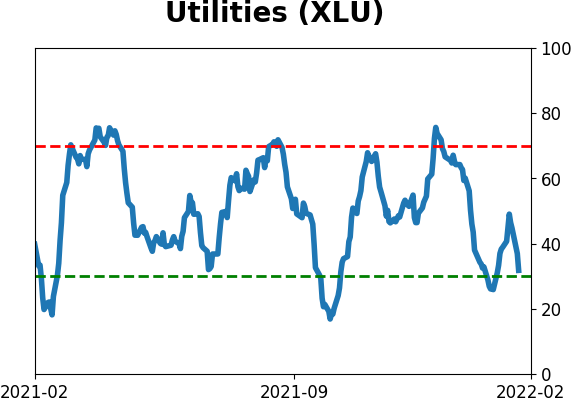
Sector ETF's - 10-Day Moving Average
|
|
|
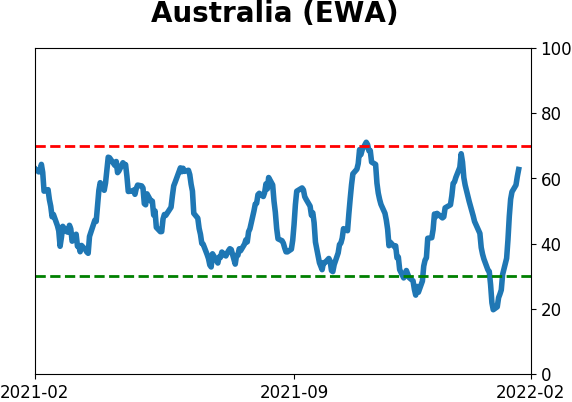
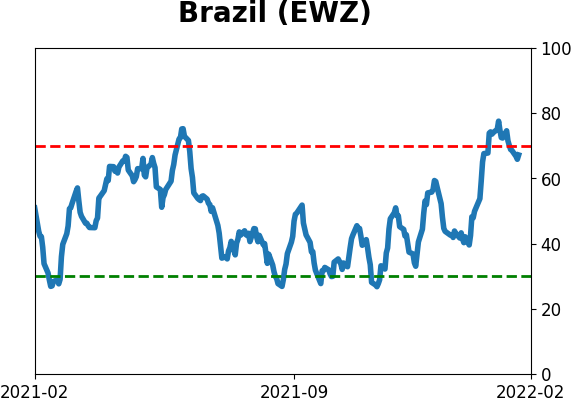
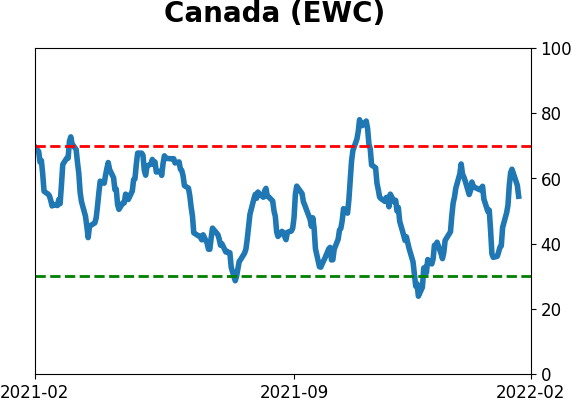
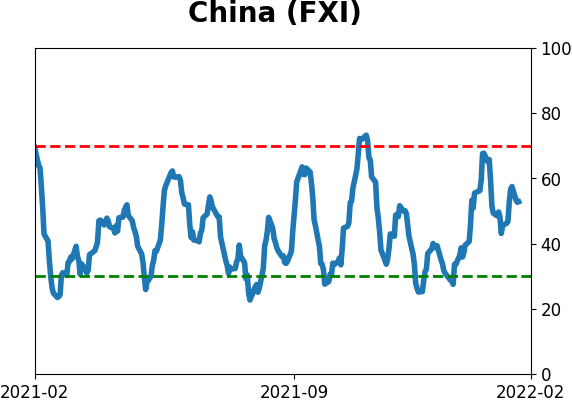
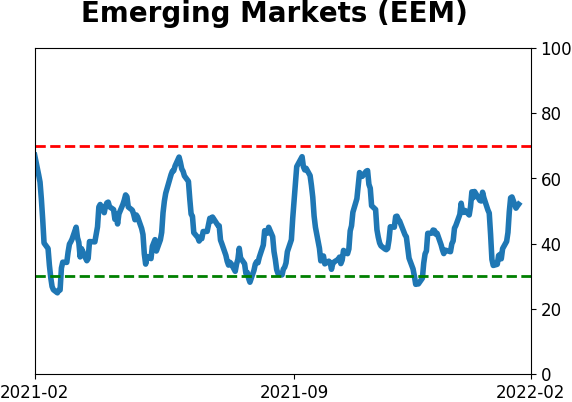
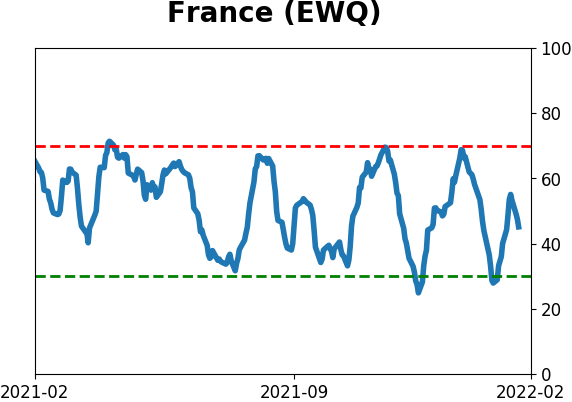
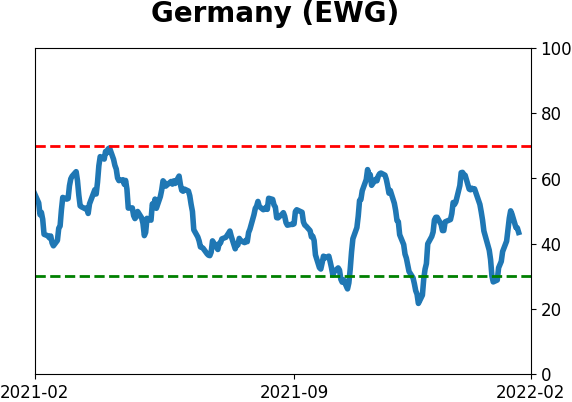
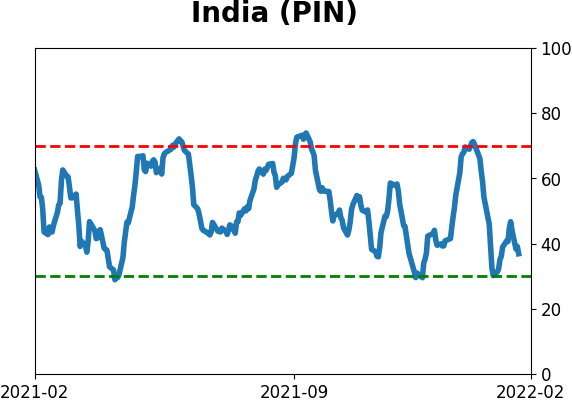
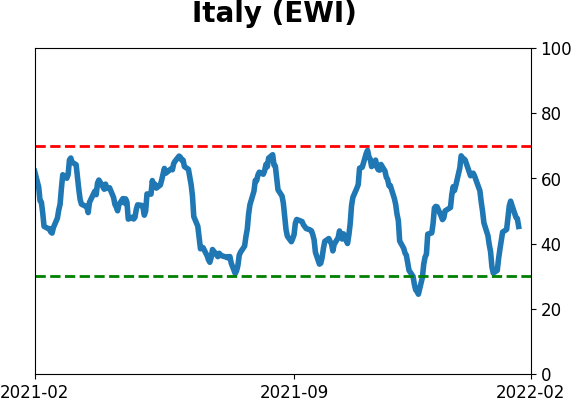
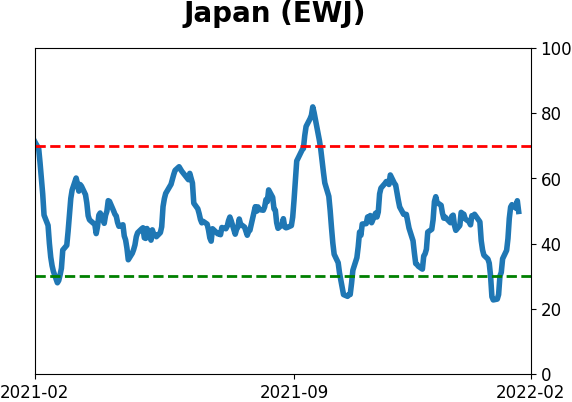
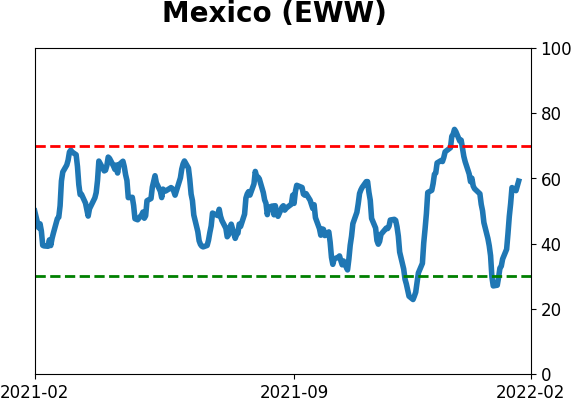
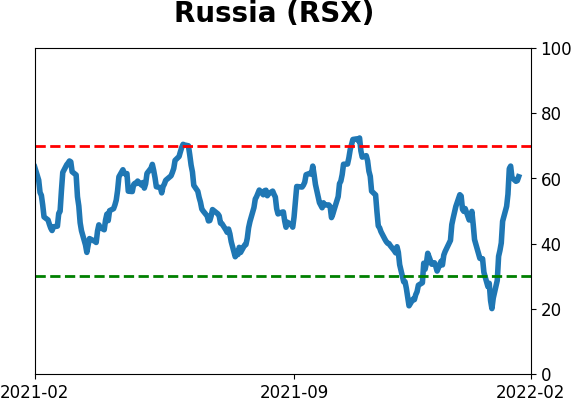
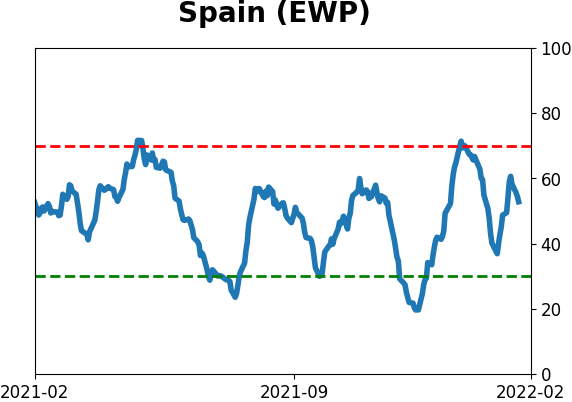
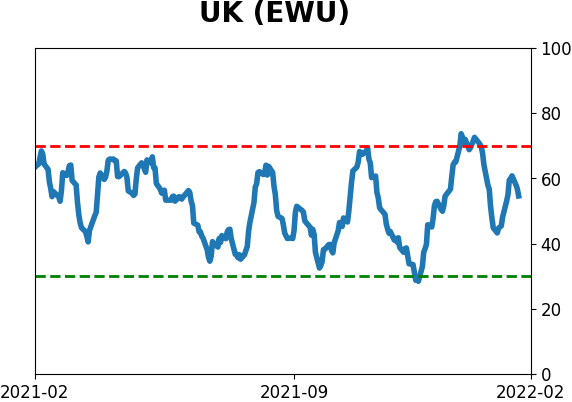
Country ETF's - 10-Day Moving Average
|
|
|
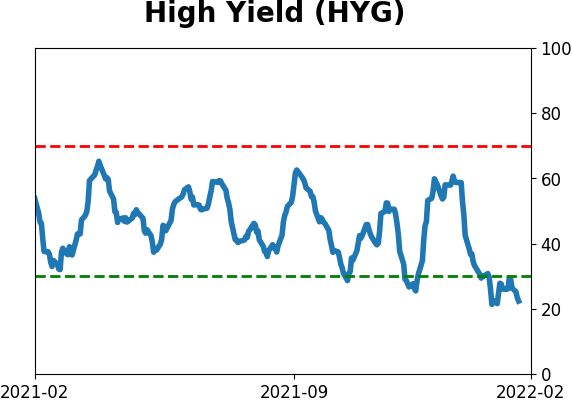
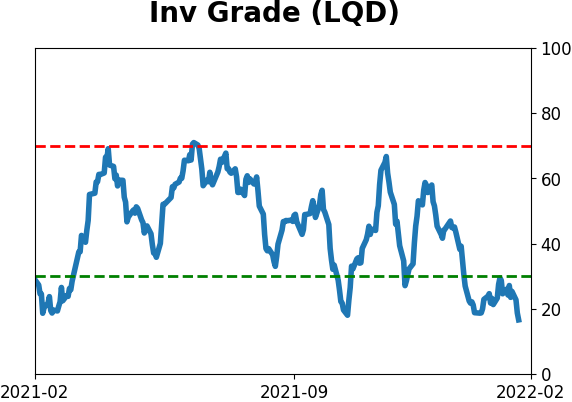
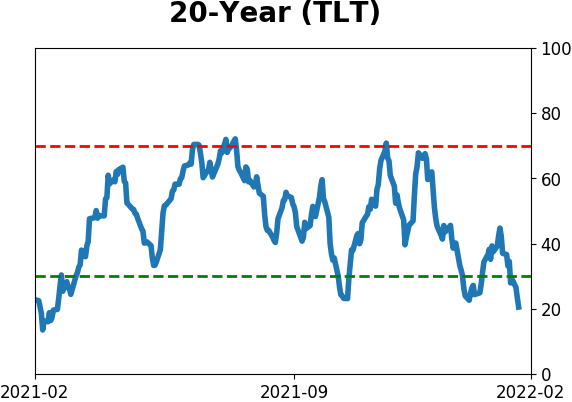
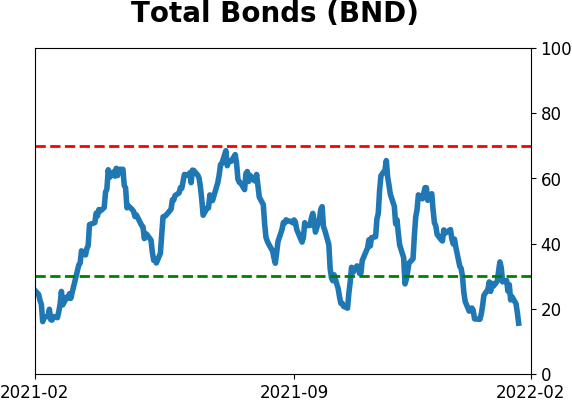
Bond ETF's - 10-Day Moving Average
|
|
|
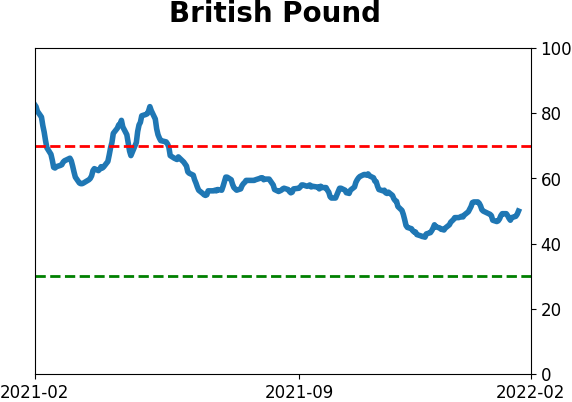
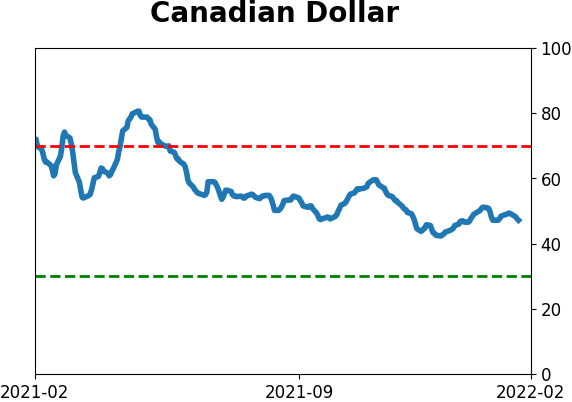
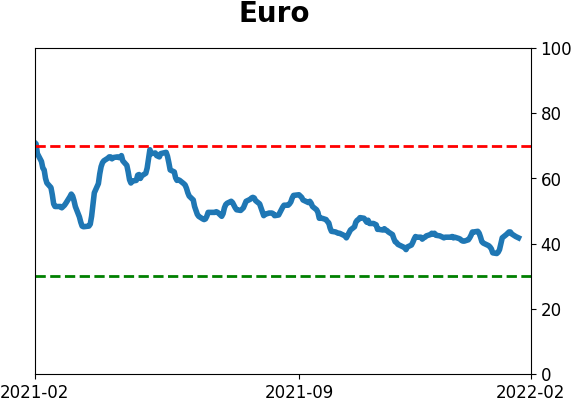
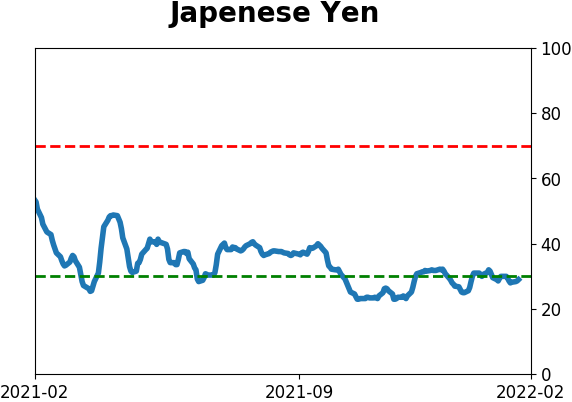
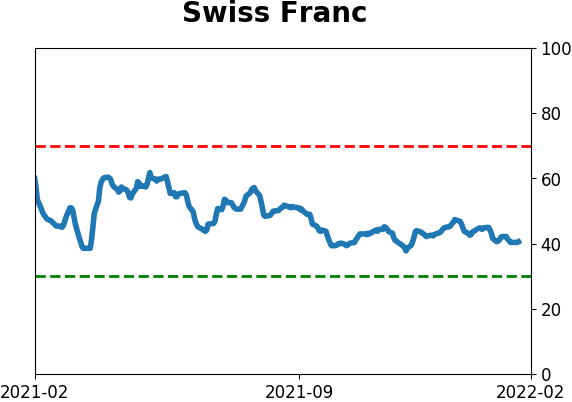
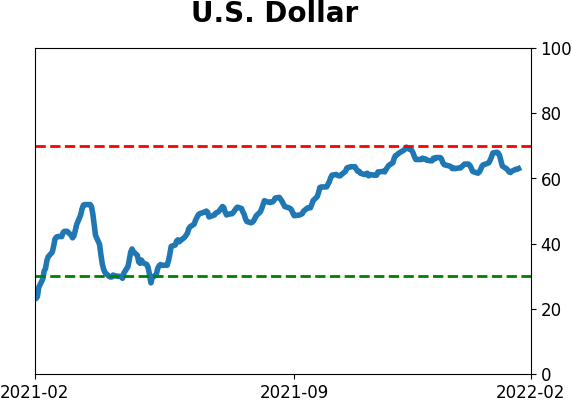
Currency ETF's - 5-Day Moving Average
|
|
|
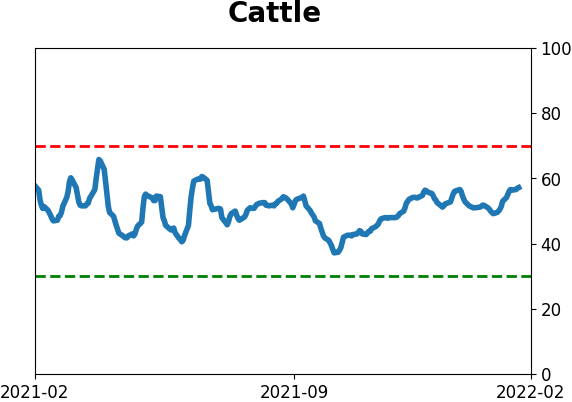
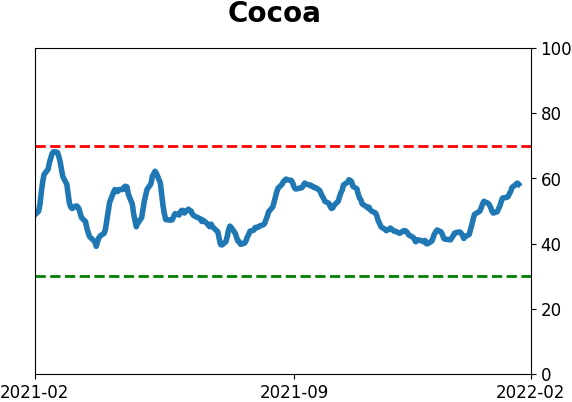
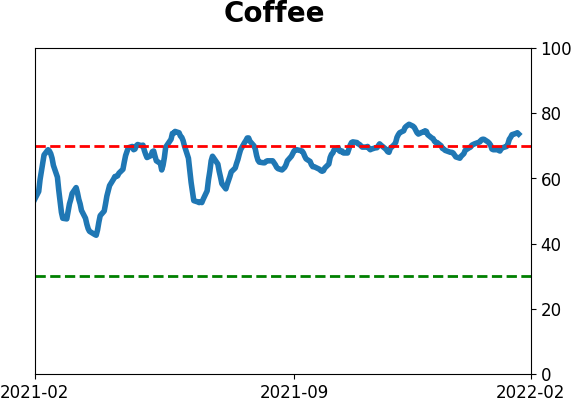
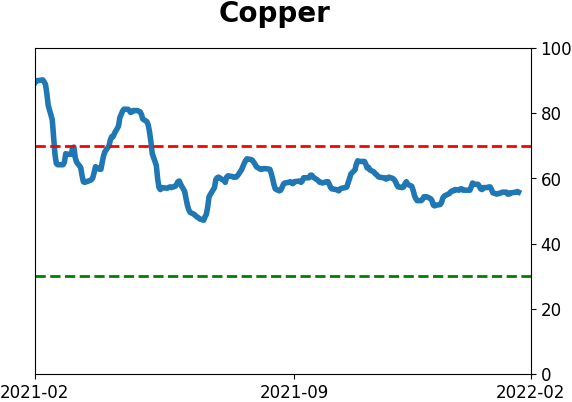
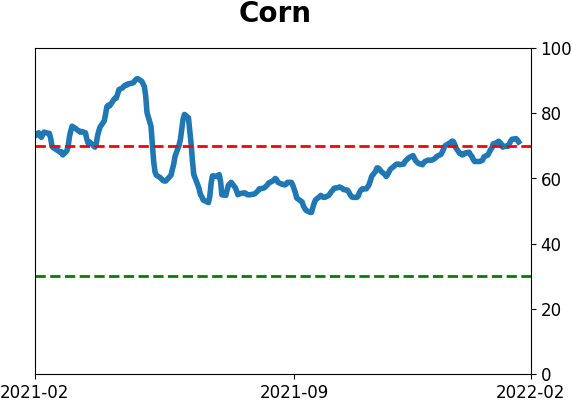
Commodity ETF's - 5-Day Moving Average
|
|