Headlines
|
|
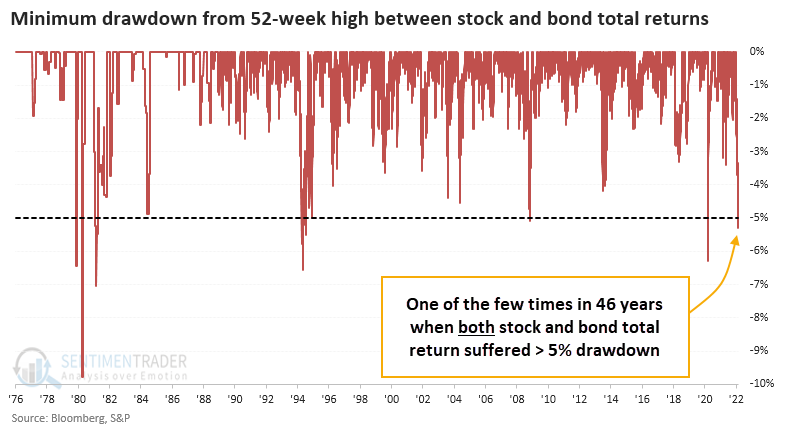
The rare case of a dual pullback in stock and bond total returns:
Both stocks and bonds have pulled back more than 5% from their 52-week highs. This is extremely unusual, happening only 6 other times in 46 years. After similar dual pullbacks, both markets rebounded strongly, with bonds showing the better risk / reward profile.
|
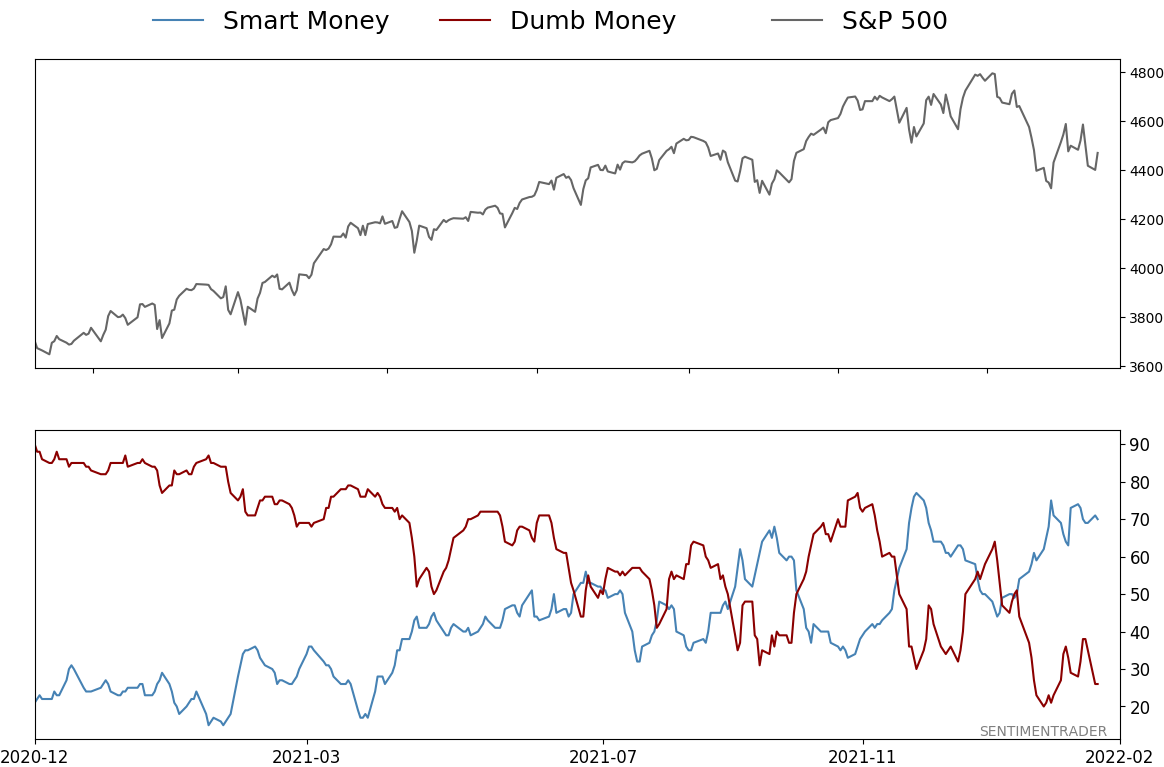
Smart / Dumb Money Confidence
|
Smart Money Confidence: 70%
Dumb Money Confidence: 26%
|
|
Risk Levels
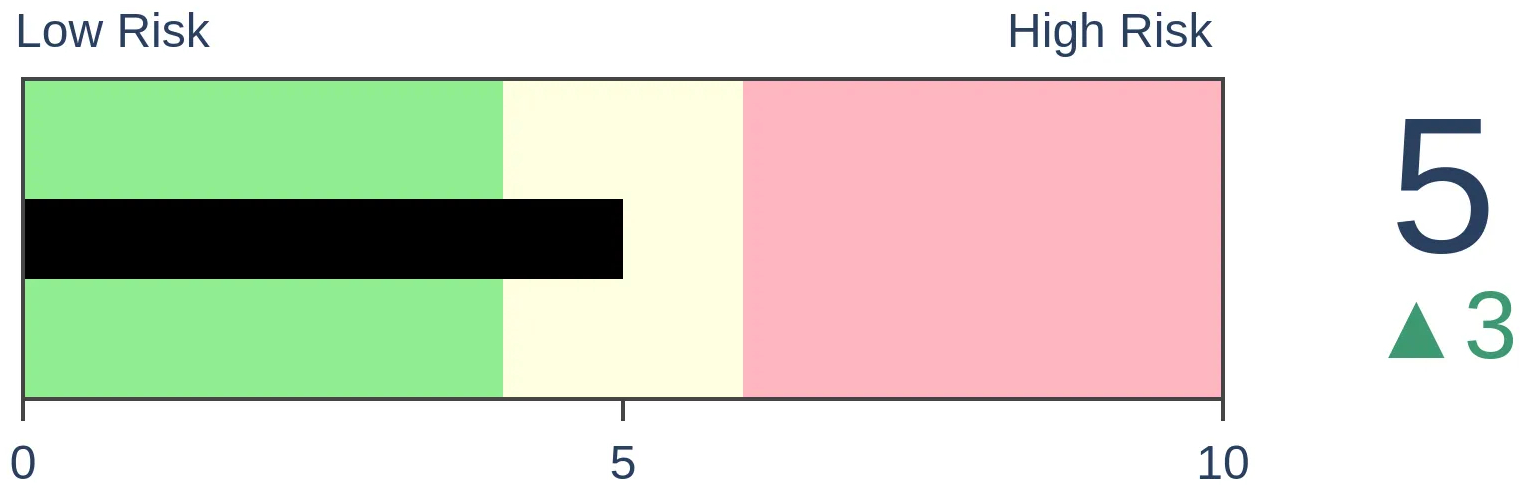
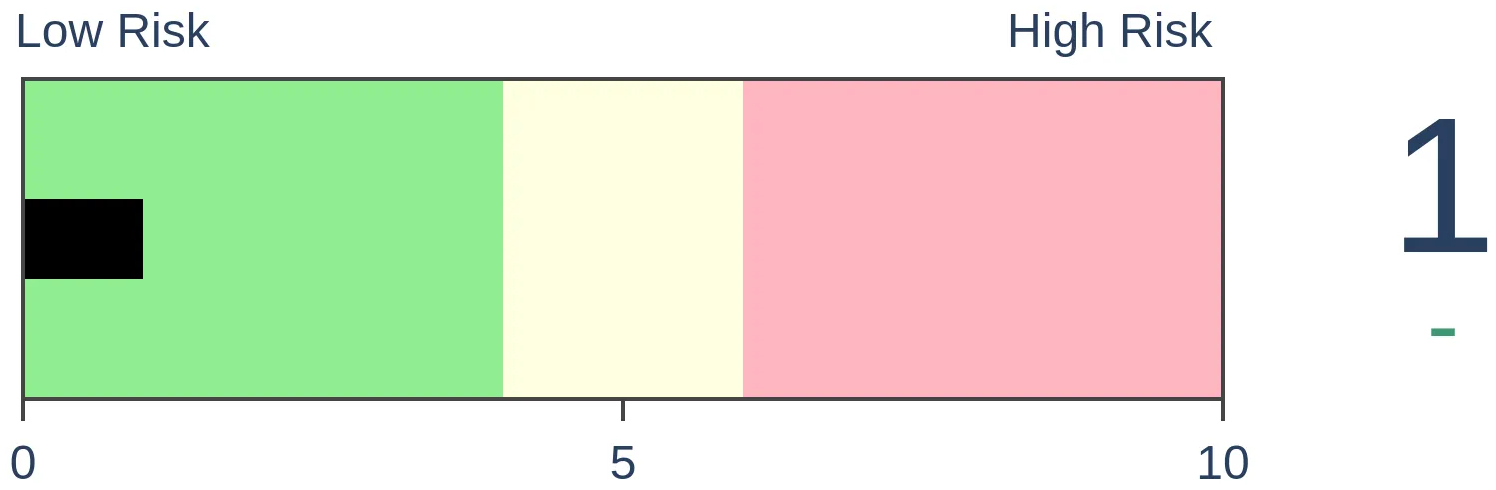
Stocks Short-Term
|
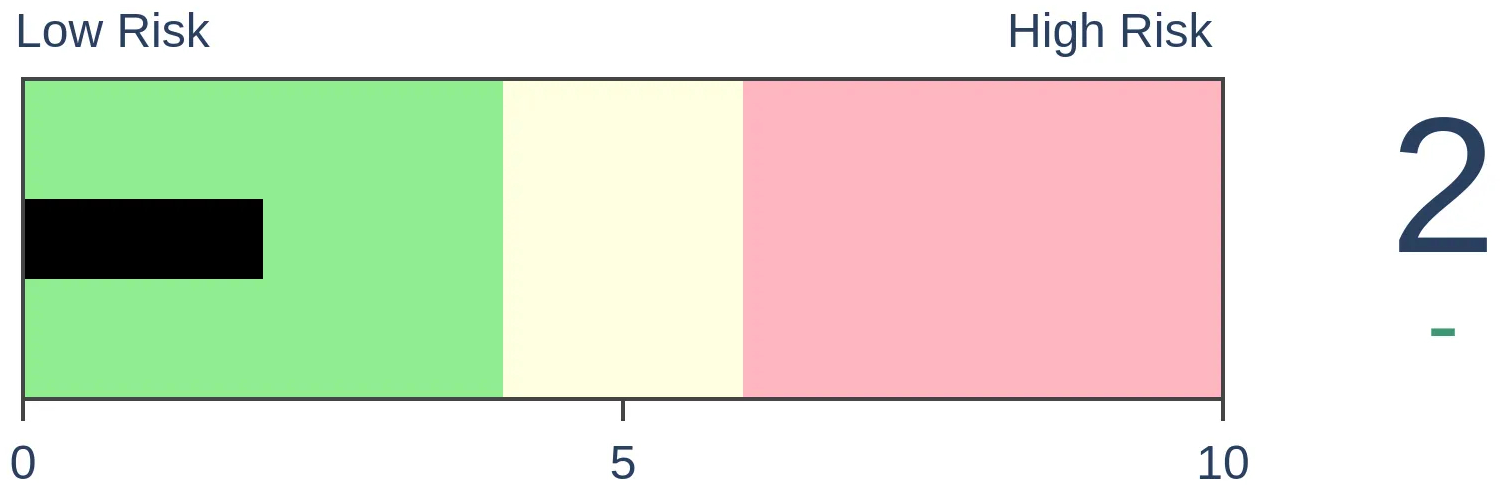
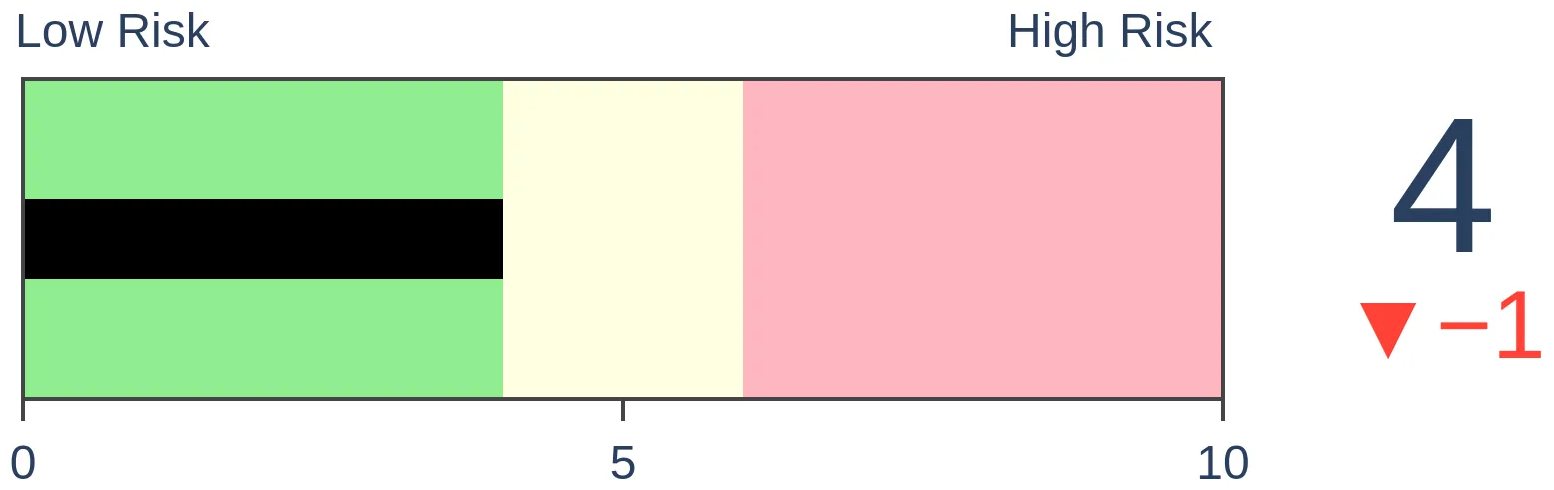
Stocks Medium-Term
|
|
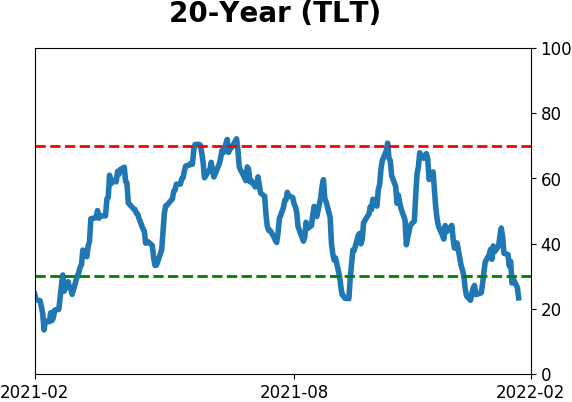
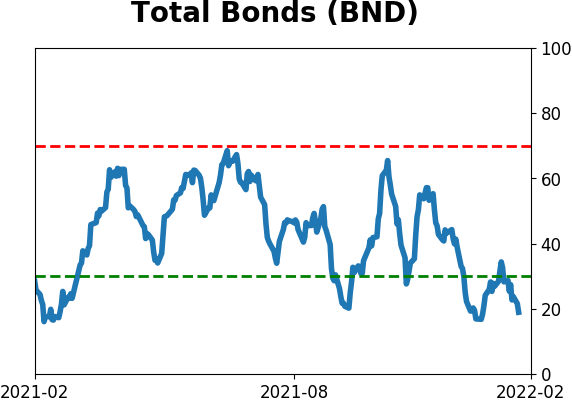
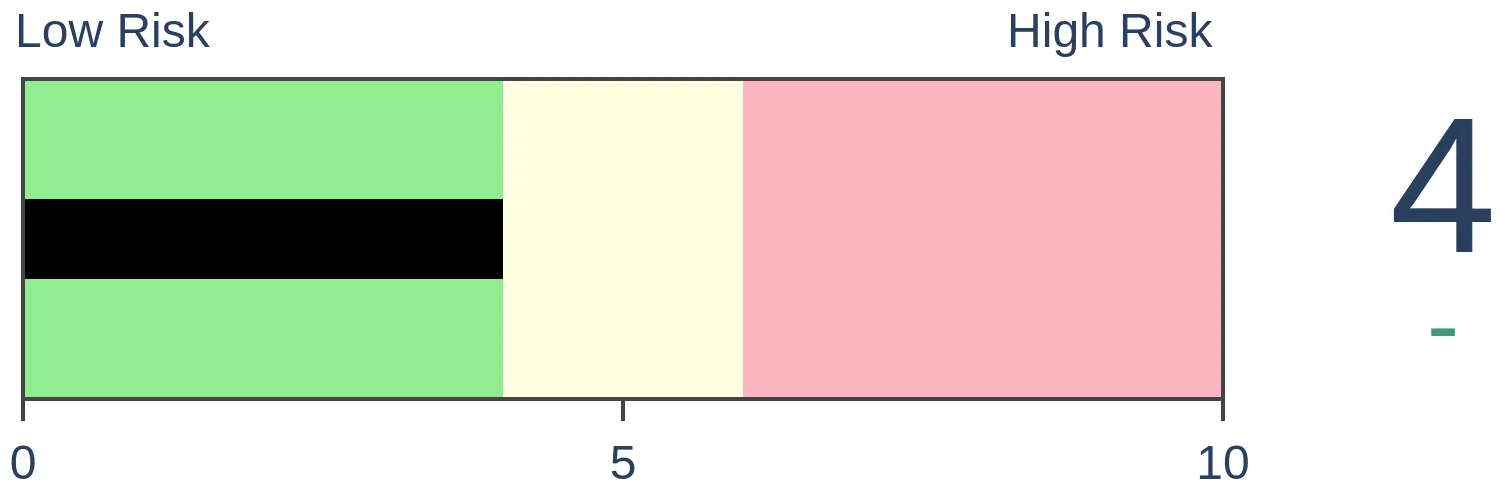
Bonds
|
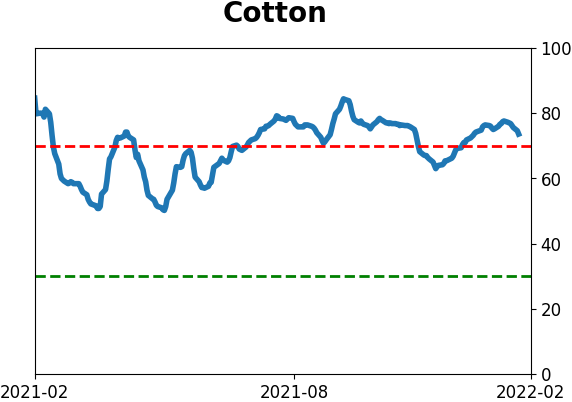
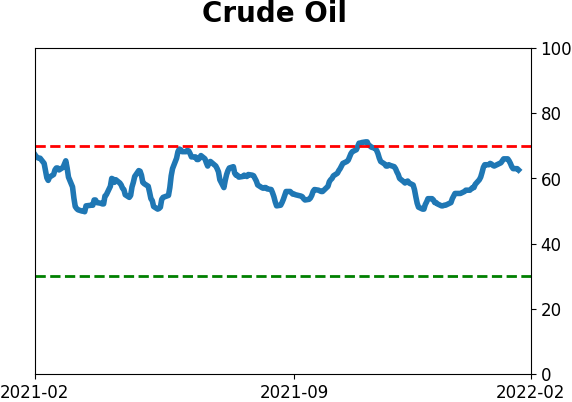
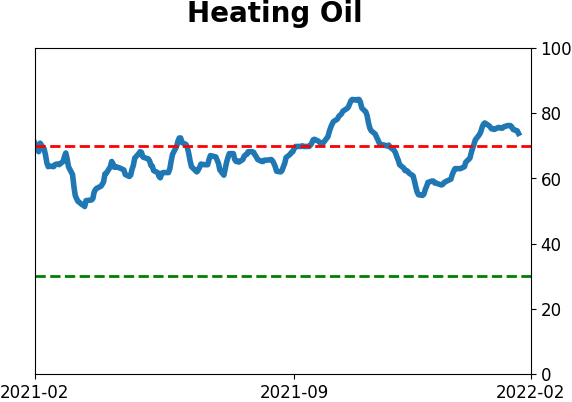
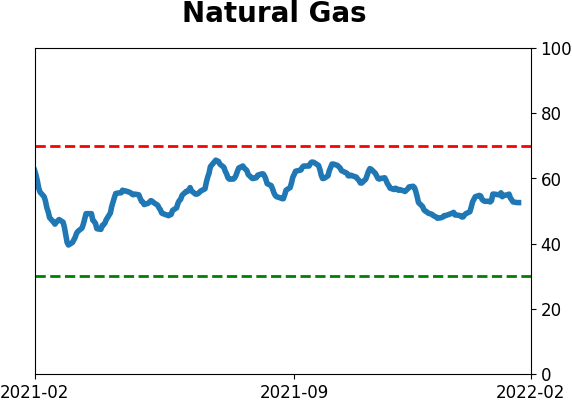
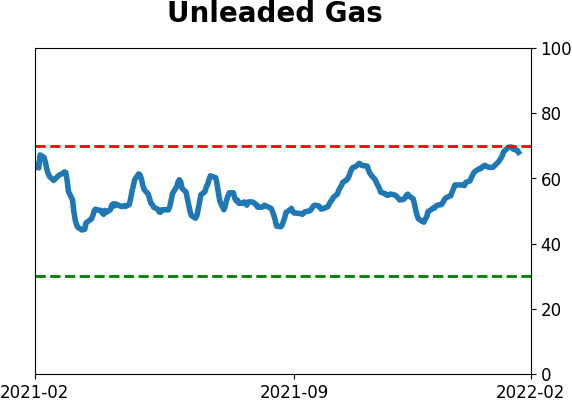
Crude Oil
|
|
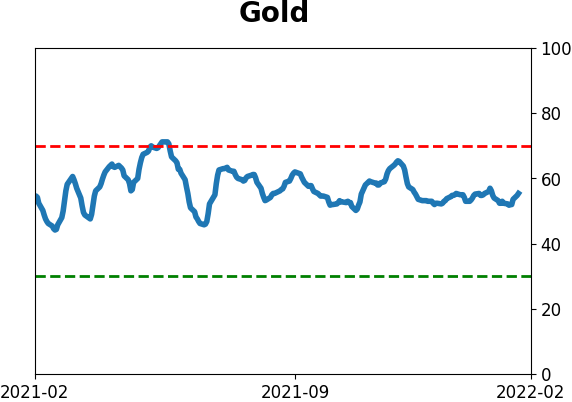
Gold

|
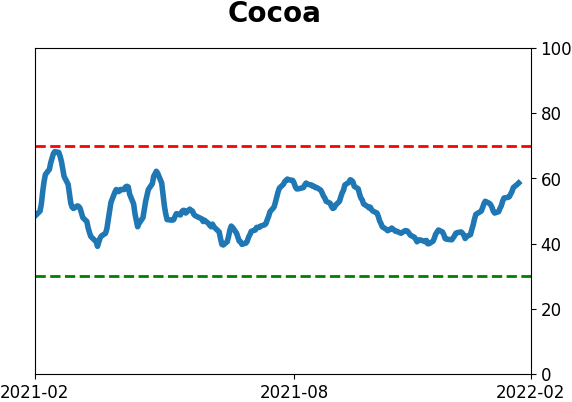
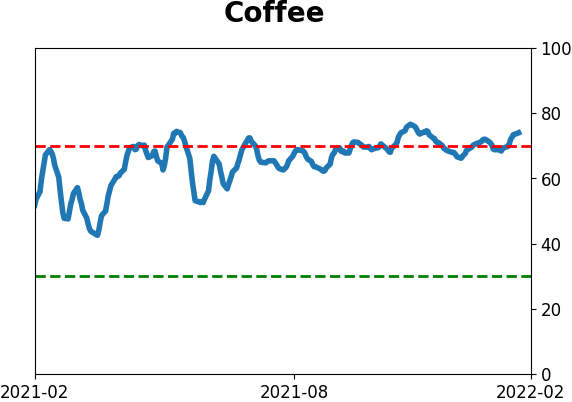
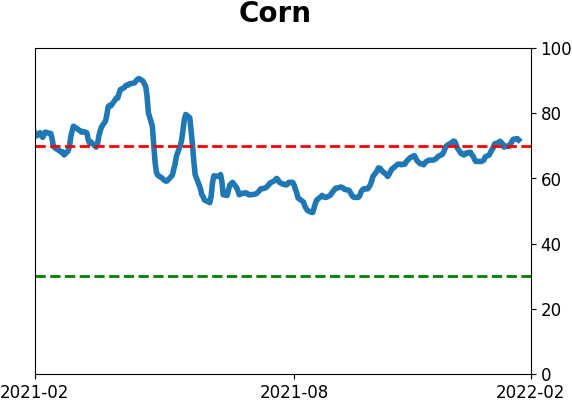
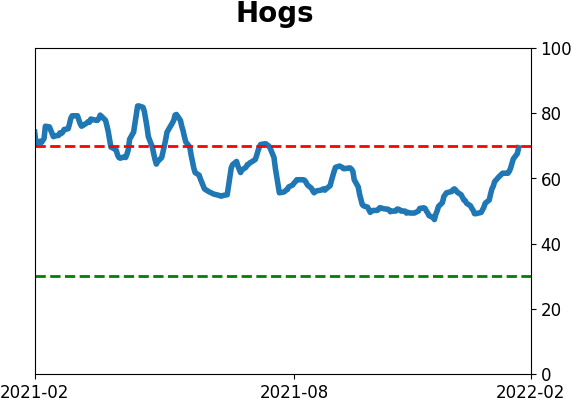
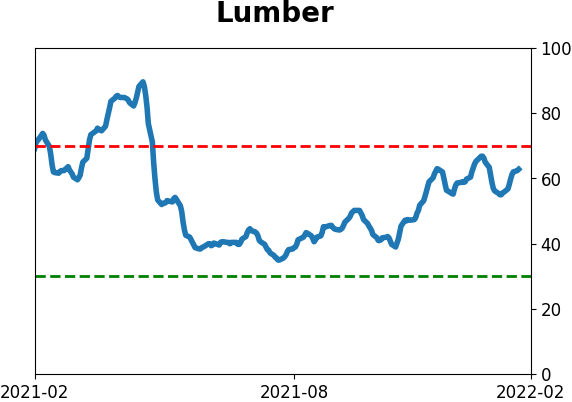
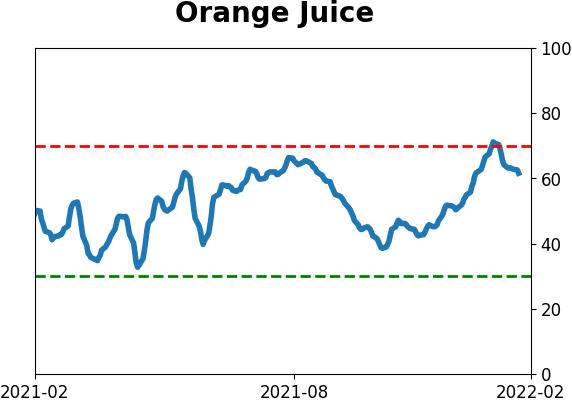
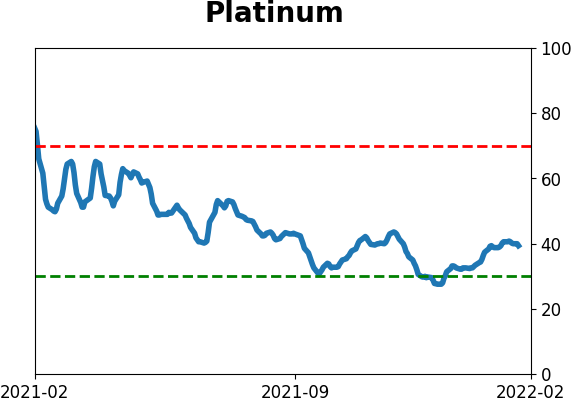
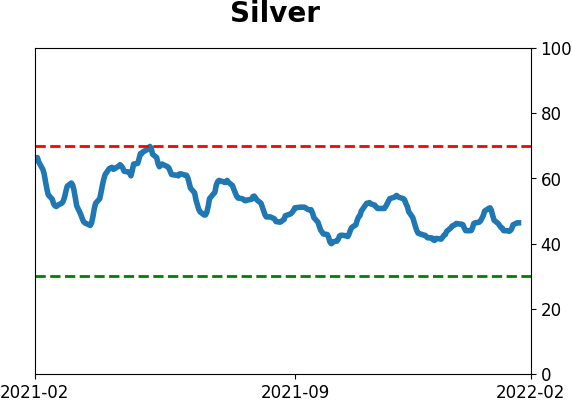
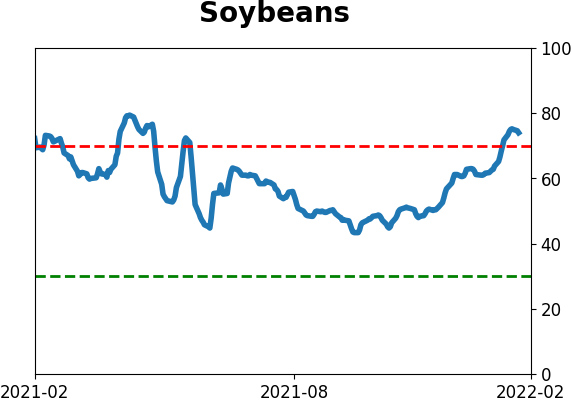
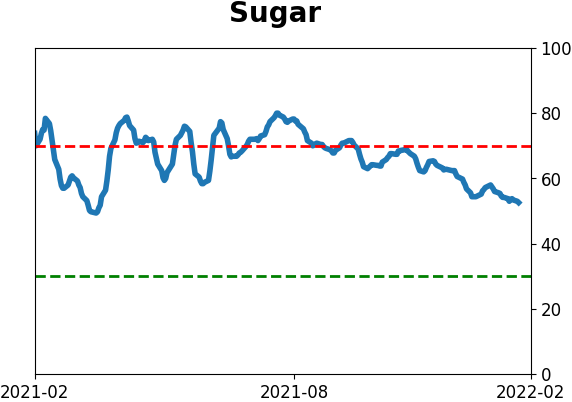
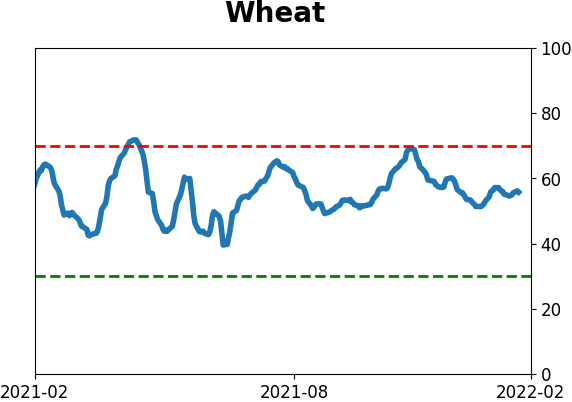
Agriculture
|
|
Research
By Jason Goepfert
BOTTOM LINE
Both stocks and bonds have pulled back more than 5% from their 52-week highs. This is extremely unusual, happening only 6 other times in 46 years. After similar dual pullbacks, both markets rebounded strongly, with bonds showing the better risk / reward profile.
FORECAST / TIMEFRAME
BND -- Up, Long-Term
|
Key points:
- Stock and bond total returns have pulled back at least 5% from their highs
- This is only the 7th time since 1976 that both markets pulled back at the same time
- After other dual pullbacks, both markets rebounded, bonds more strongly
A dual pullback in stocks and bonds
It's been a heckuva year for investors, and not in a good way. The overwhelming majority of investment wealth in the U.S. is tied to stocks and bonds, and both have been broadly hit. Neither asset class has provided ballast to the other.
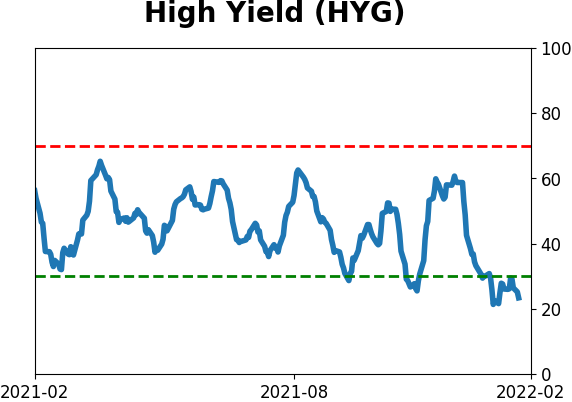
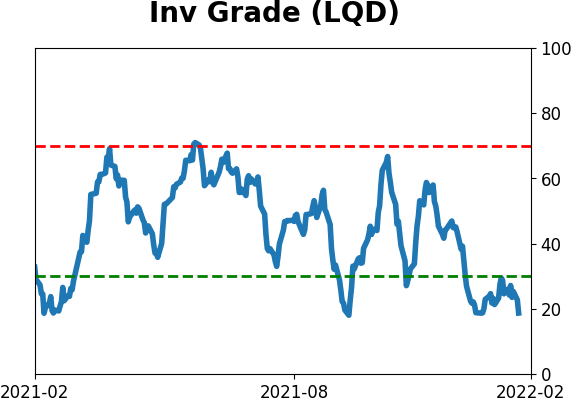
We saw on Monday that high-yield bonds have suffered heavy selling over the past month, on par with some of the worst declines in 15 years. It's not just junk bonds that investors are selling, though. Investment-grade bonds, municipals, Treasuries - all have suffered.
This sell-everything mentality has created an unusual situation where both stocks and bonds are losing ground simultaneously.
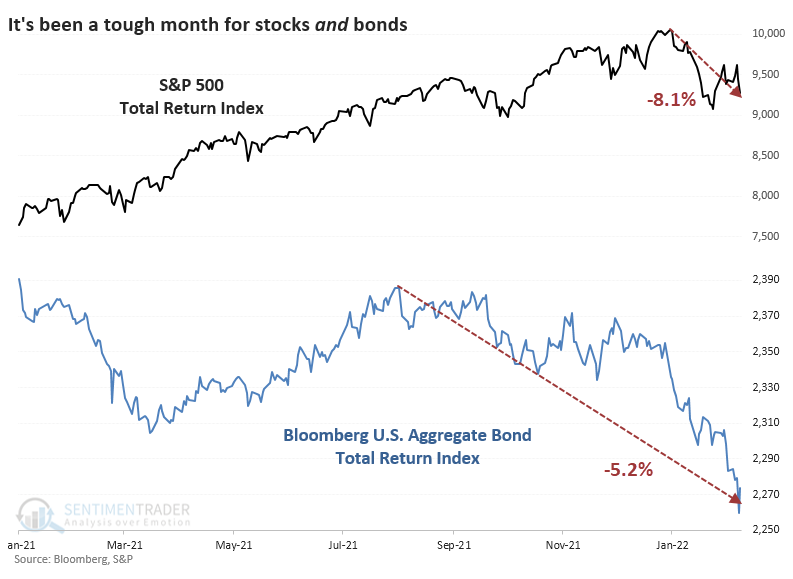
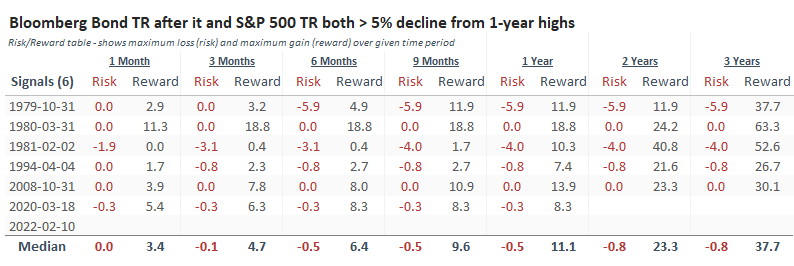
It's extremely rare to see both stocks and bonds in a pullback at the same time, defined as a 5% decline from a 52-week high. Starting late last week, the total return in the S&P 500 and Bloomberg U.S. Aggregate Bond Index were both more than 5% off their highs. Investors have endured a dual pullback only a handful of times in the past 46 years.
Dual pullbacks led to consistent rebounds, especially in bonds
These dual pullbacks were a good sign that whatever macro concerns were driving the selling was mostly overdone. The S&P did suffer some losses in the months ahead, especially in 2008 as the final bout of panic hit markets. But over the next year, there was only a single small loss, which was quickly and dramatically reversed.
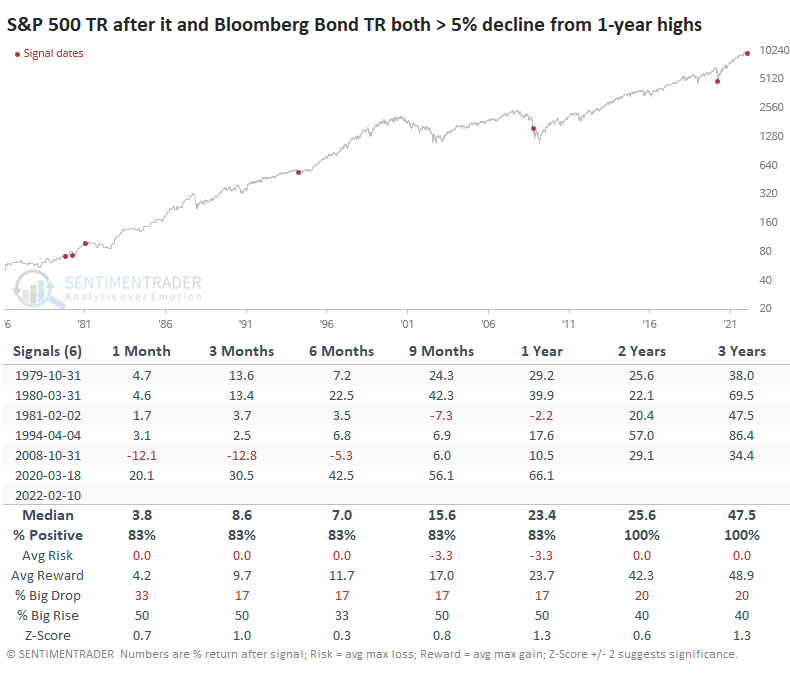
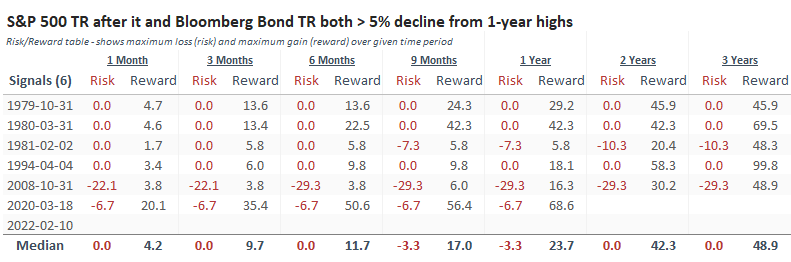
The Risk/Reward Table shows that except for 2008, the "risk" side of the equation was relatively limited, while "reward" was especially impressive after a year and beyond.
It's been mostly a tailwind for the bond market over the past 40+ years, so it's not a big surprise that the total return on the Bloomberg U.S. Bond Aggregate was mouth-watering. From 9 months and beyond, the Bloomberg Aggregate showed gains every time, well above random returns.
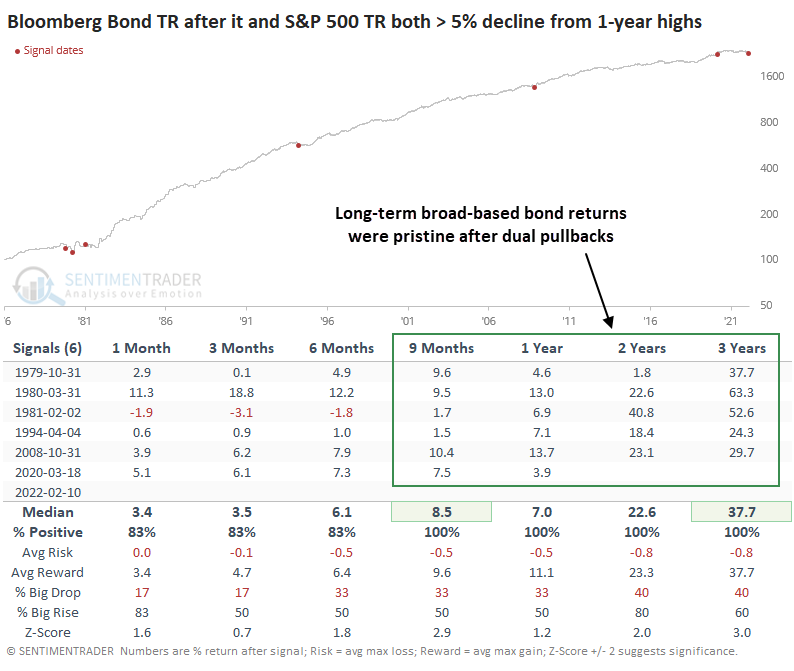
The Risk/Reward Table shows very little of the former and a whole lot of the latter. The sample size is tiny, but it's rare to see such a skewed ratio between losses and gains in any market.
What the research tells us...
The secular bull market in bonds will end at some point, and investors will have to deal with a multi-year, or multi-decade, rise in interest rates. It makes sense that we're on the cusp of that now, but there were convincing arguments that we were on the brink in 2010, and here we are more than a decade later. This is where reliance on history shows its shortcomings, but generally, we rely on investors to behave more or less in line with how they have in the past. In that sense, the dual pullback in stocks and bonds smacks of wholesale selling pressure that is due in part o emotional anxiety. After similar behavior, assets had a strong tendency to rebound, bonds most of all.
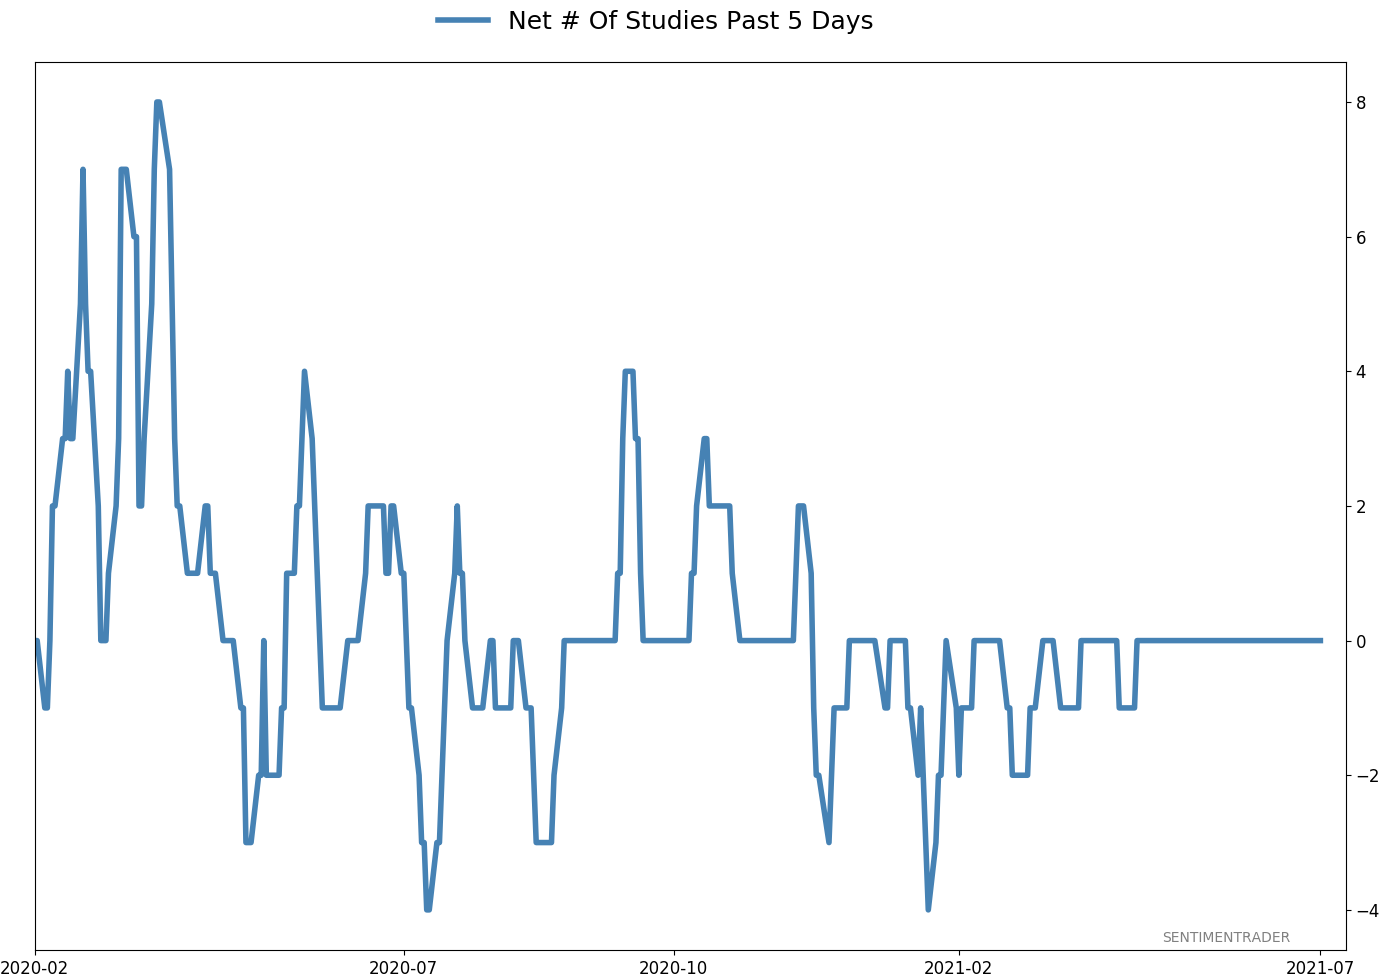
Active Studies
| Time Frame | Bullish | Bearish | | Short-Term | 3 | 0 | | Medium-Term | 18 | 2 | | Long-Term | 15 | 5 |
|
Indicators at Extremes
Portfolio
| Position | Description | Weight % | Added / Reduced | Date | | Stocks | RSP | 21.4 | Added 10.2% | 2022-01-28 | | Bonds | 32.7% BND, 7.1% SCHP | 40.1 | Added 8.3% | 2021-10-26 | | Commodities | GCC | 2.4 | Reduced 2.1%
| 2020-09-04 | | Precious Metals | GDX | 4.6 | Reduced 4.2% | 2021-05-19 | | Special Situations | 8.1% KWEB, 3.6% XLE, 1.7% PSCE | 13.4 | Reduced 3.9% | 2022-01-18 | | Cash | | 17.9 | | |
|
Updates (Changes made today are underlined)
With a typical time frame of several months in this account, I normally don't make changes so quickly. I've added back part of the stock exposure I took off earlier in January due to the washed-out conditions and extreme pessimism we're seeing across a wide array of metrics. The biggest issue is that the environment is unhealthy and we could be in the throes of a protracted bear market. Even so, the readings we've seen recently have a good record at preceding relief rallies, so we'll have to see how that pans out. Bond sentiment is trying to recover from a recent bout of pessimism, and gold stocks are doing their thing which is not much at all. They've been flat for six months. Chinese tech stocks were doing exactly what they're supposed to do, then did *not* by plunging to new lows. This is troubling on a shorter-term time frame, but this was never meant for a trade, rather a multi-year investment. Recent behavior is troubling and I will not be adding any exposure as long as that's the case. RETURN YTD: -0.1% 2021: +8.7%, 2020: +8.1%, 2019: +12.6%, 2018: +0.6%, 2017: +3.8%, 2016: +17.1%, 2015: +9.2%, 2014: +14.5%, 2013: +2.2%, 2012: +10.8%, 2011: +16.5%, 2010: +15.3%, 2009: +23.9%, 2008: +16.2%, 2007: +7.8%
|
|
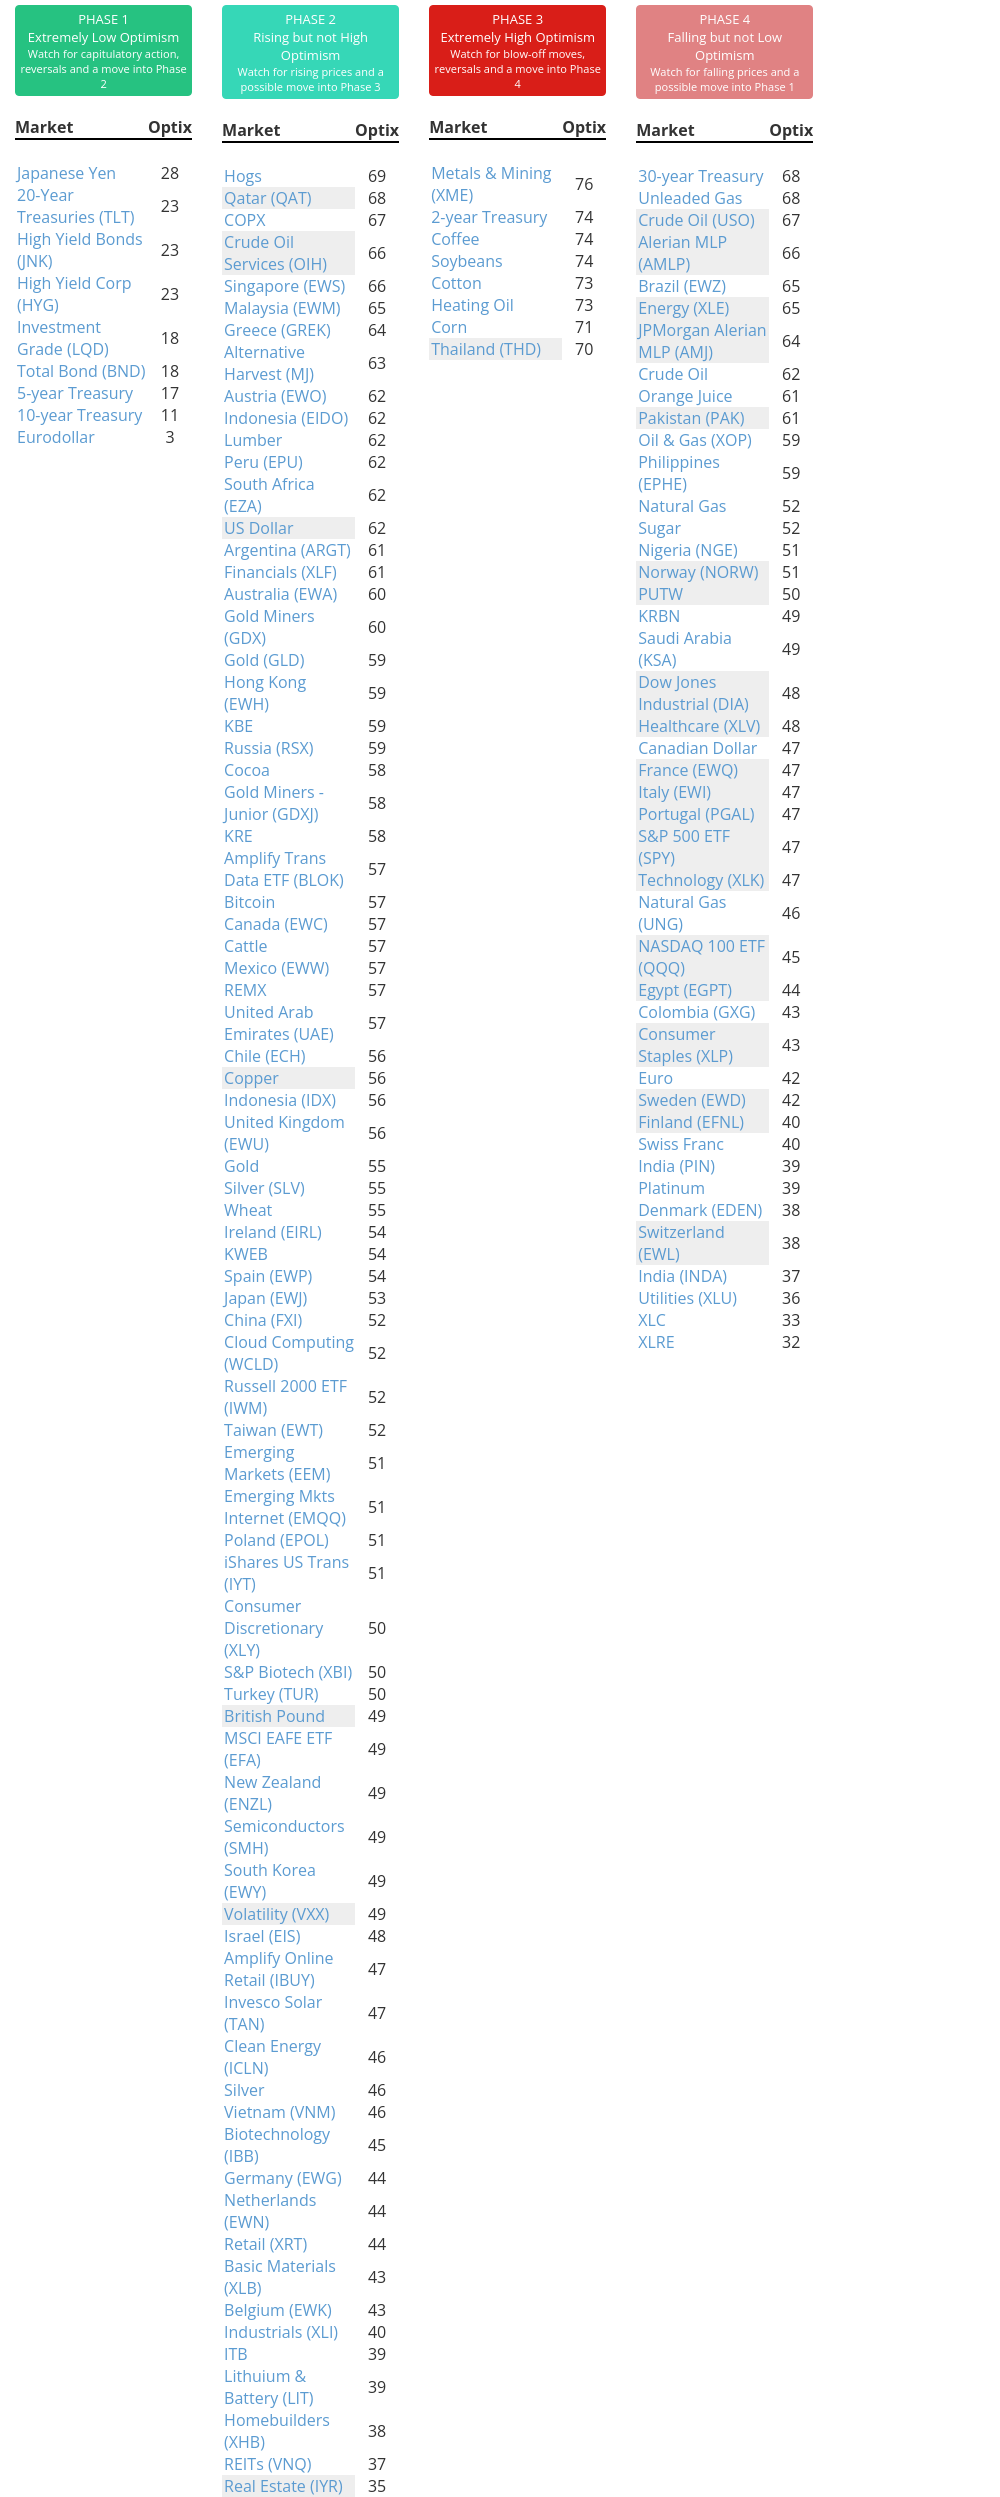
Phase Table
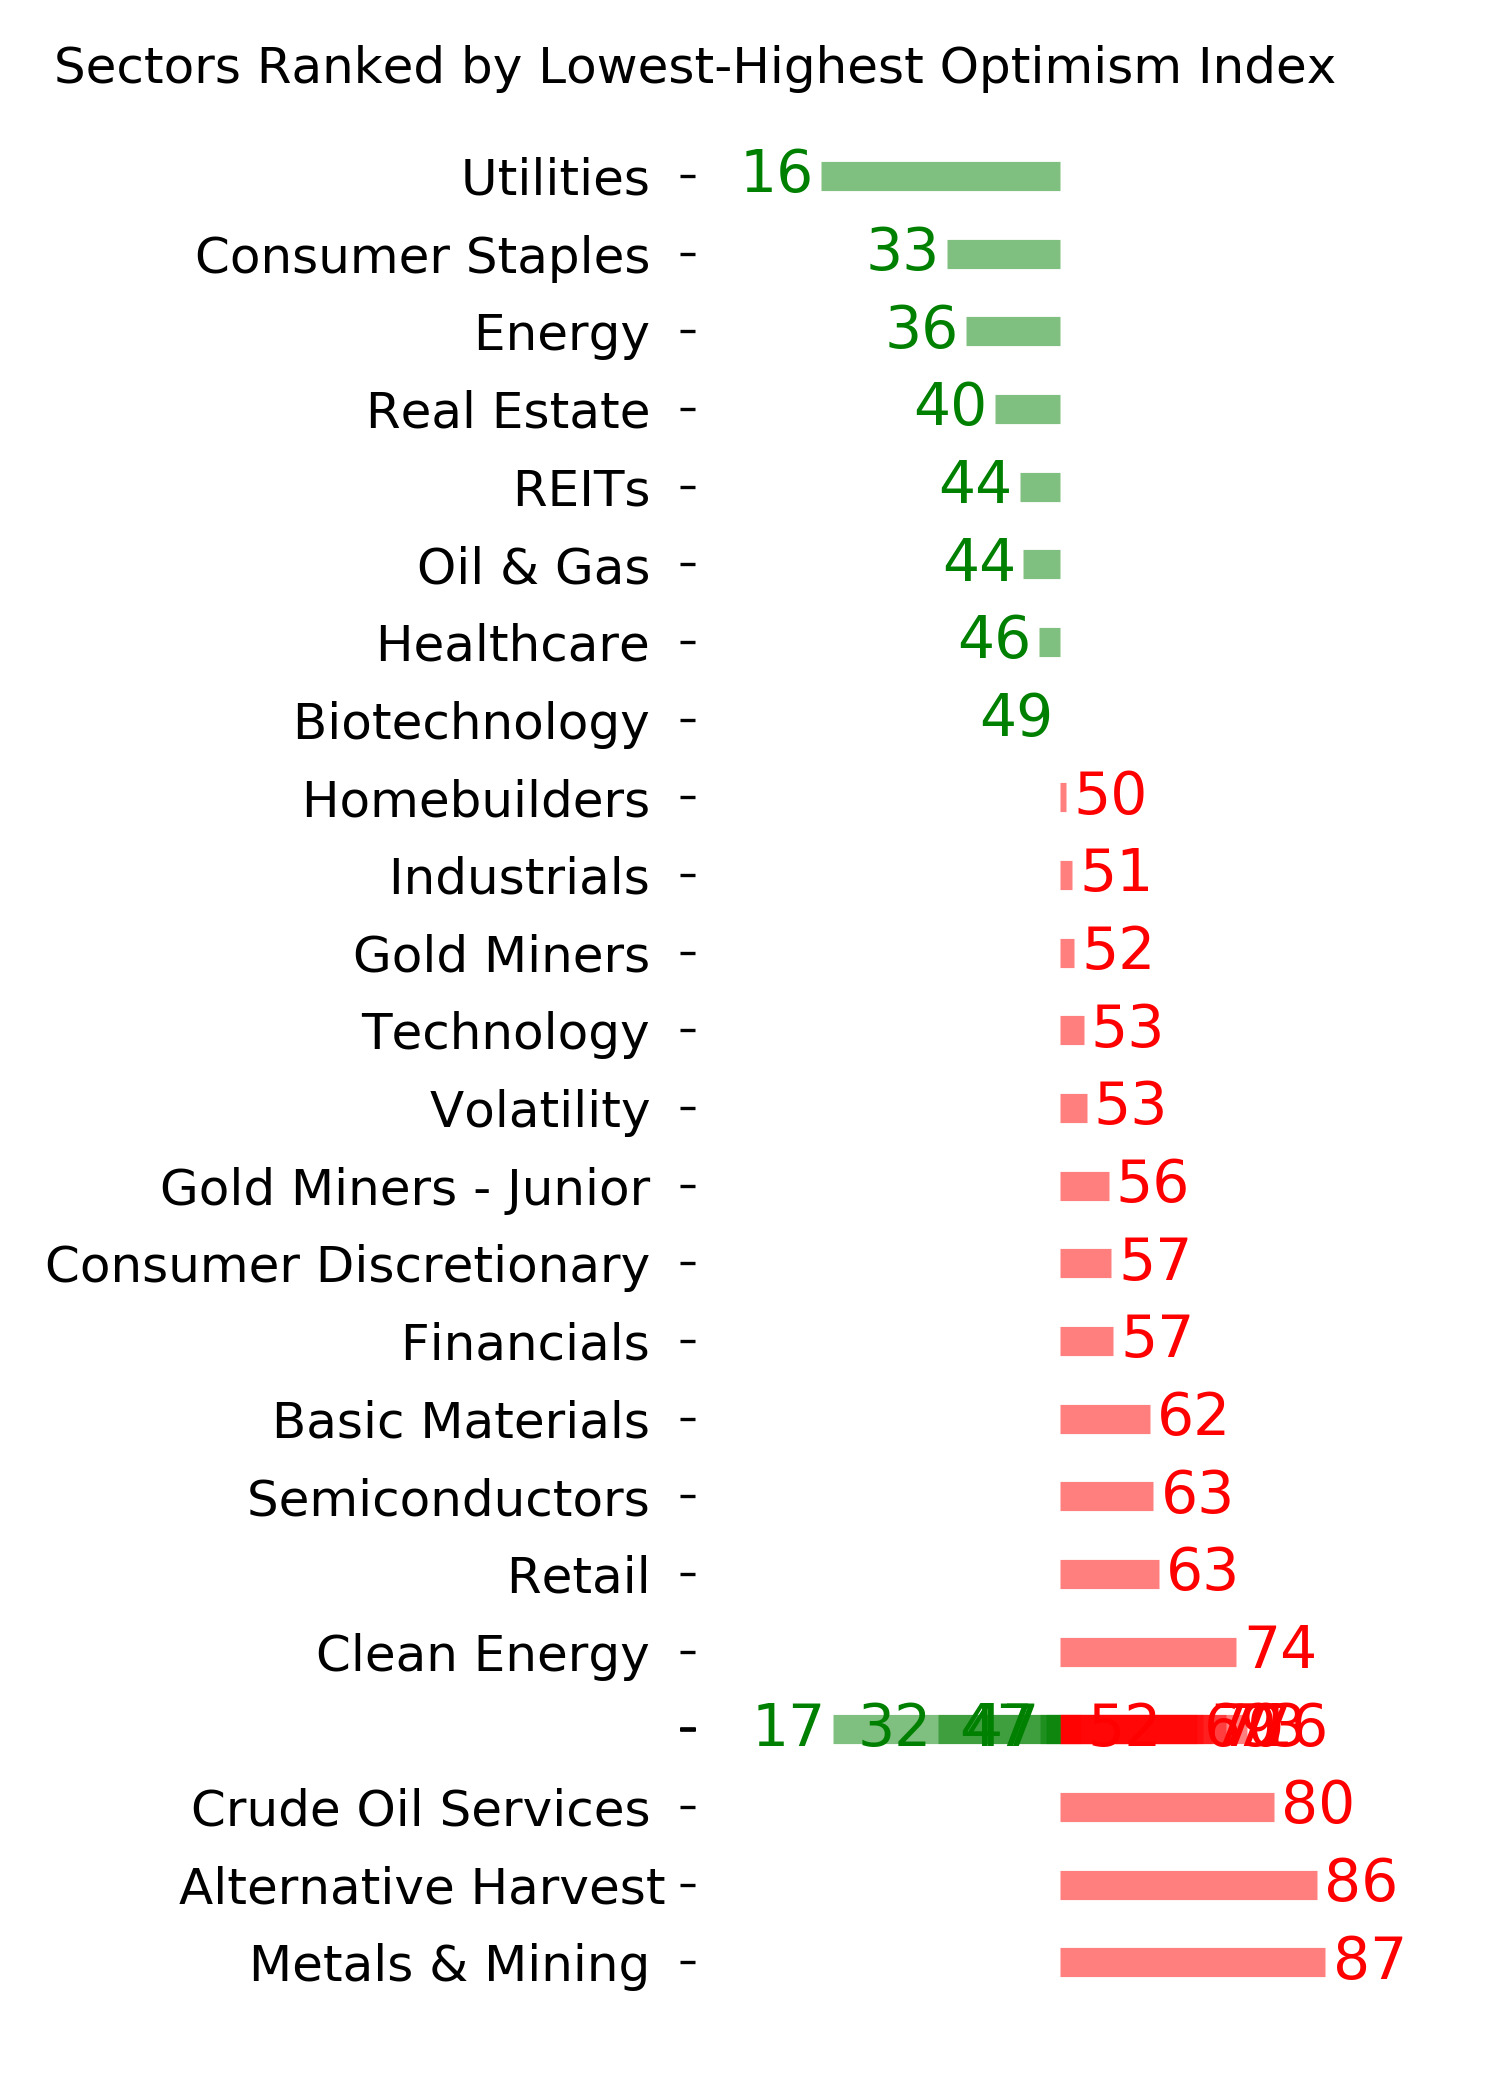
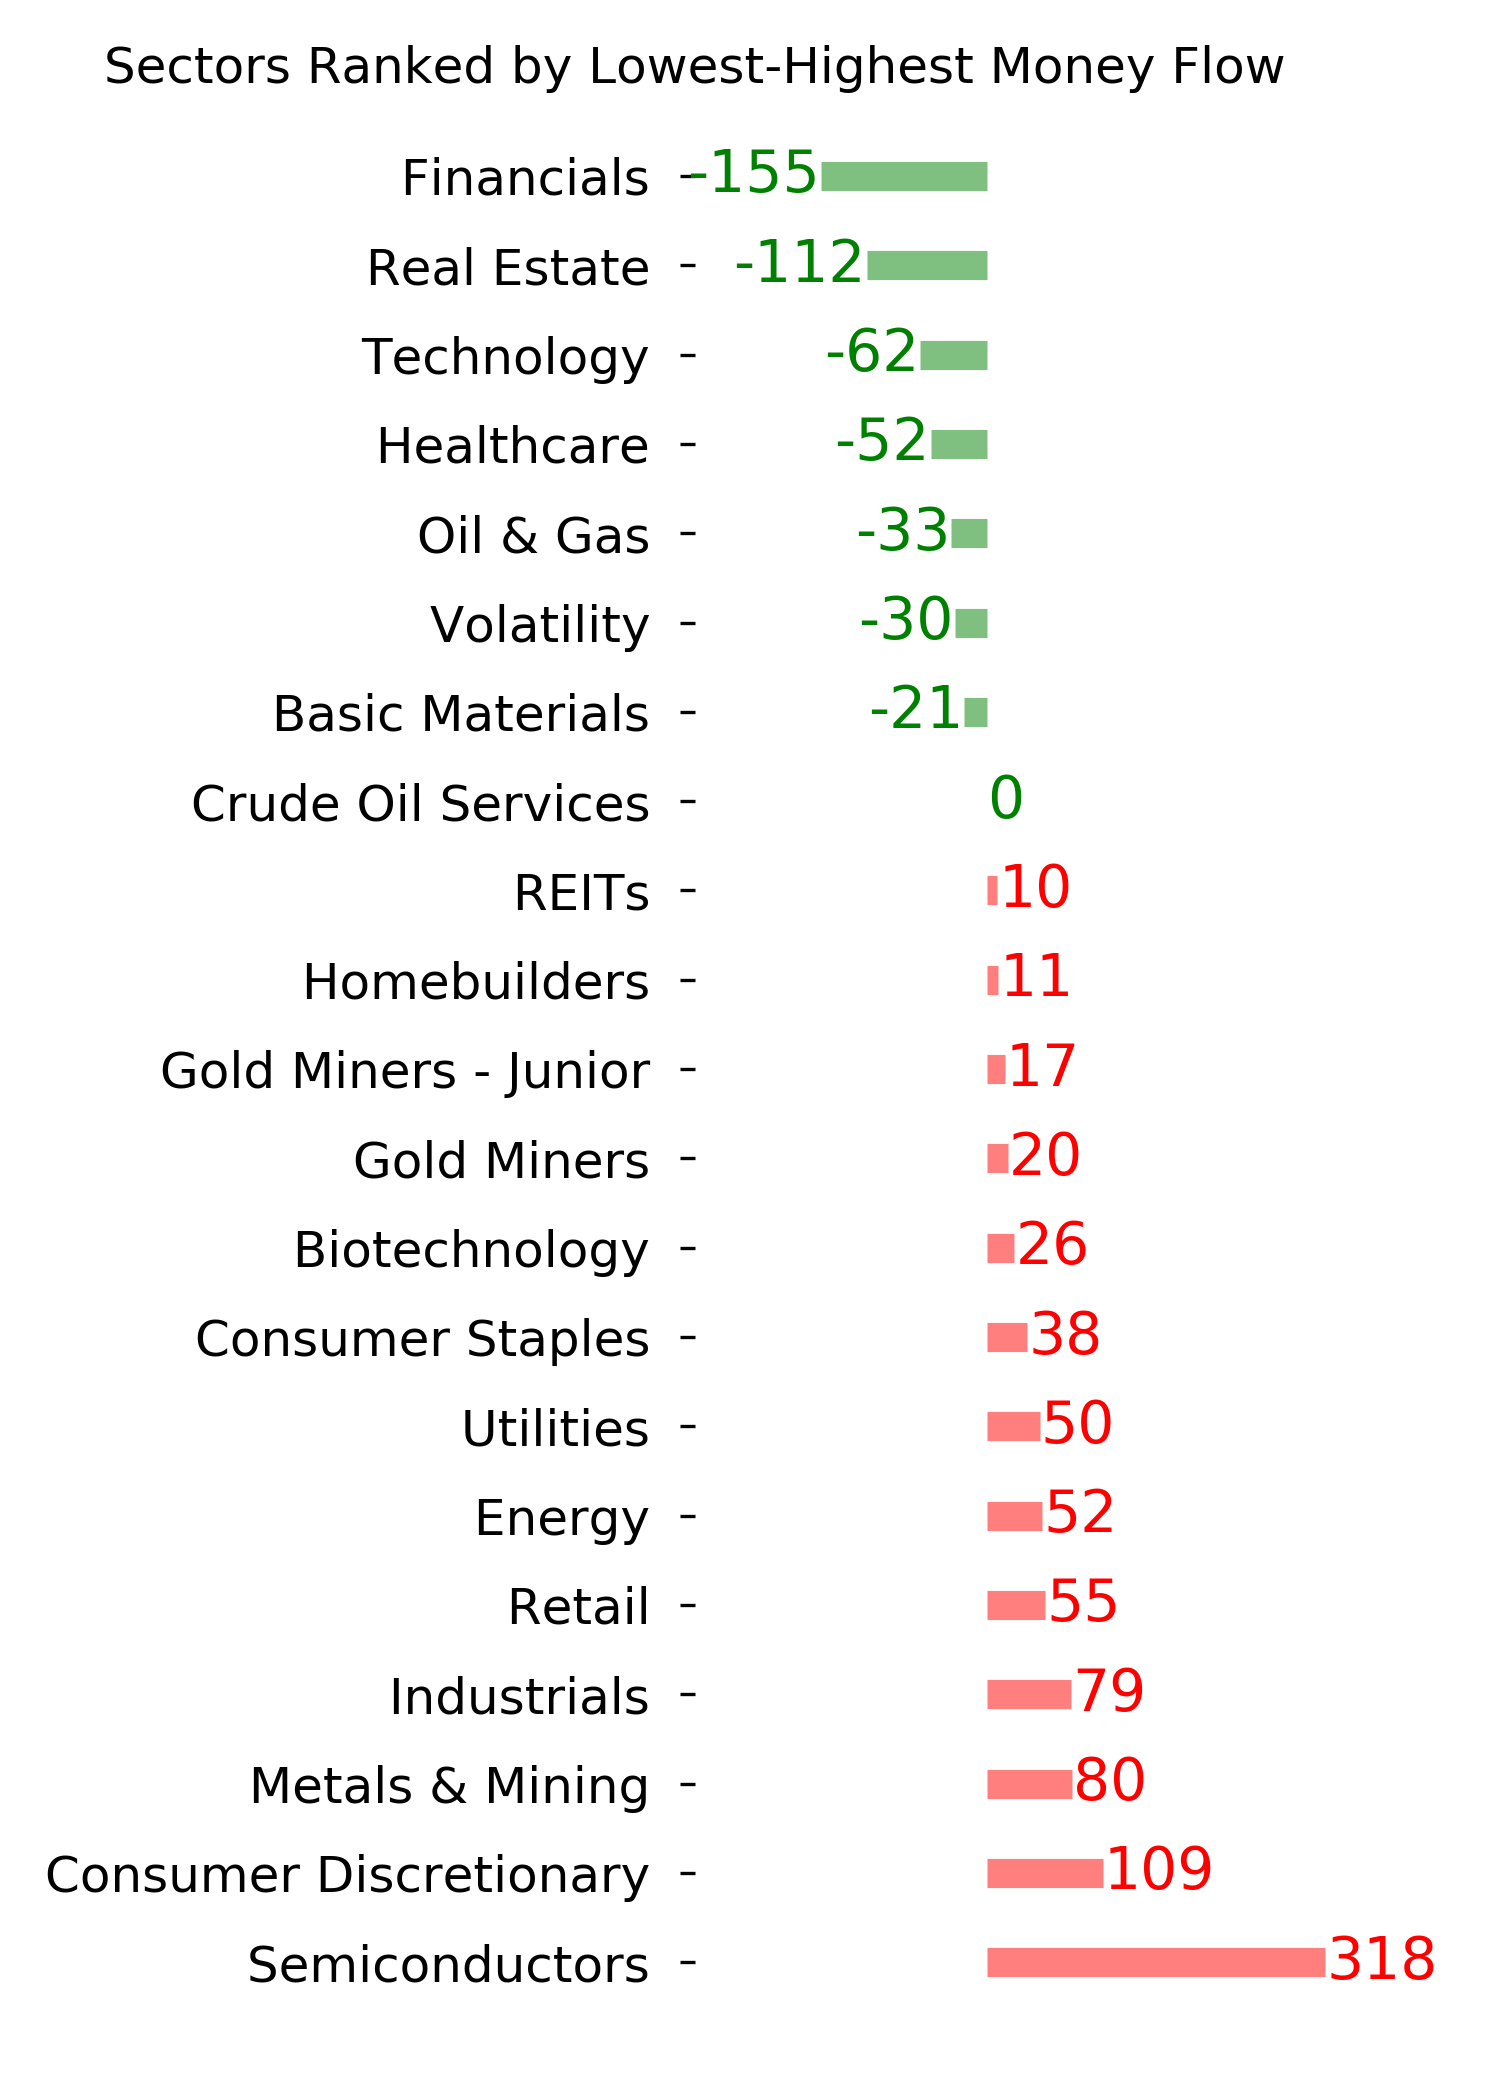
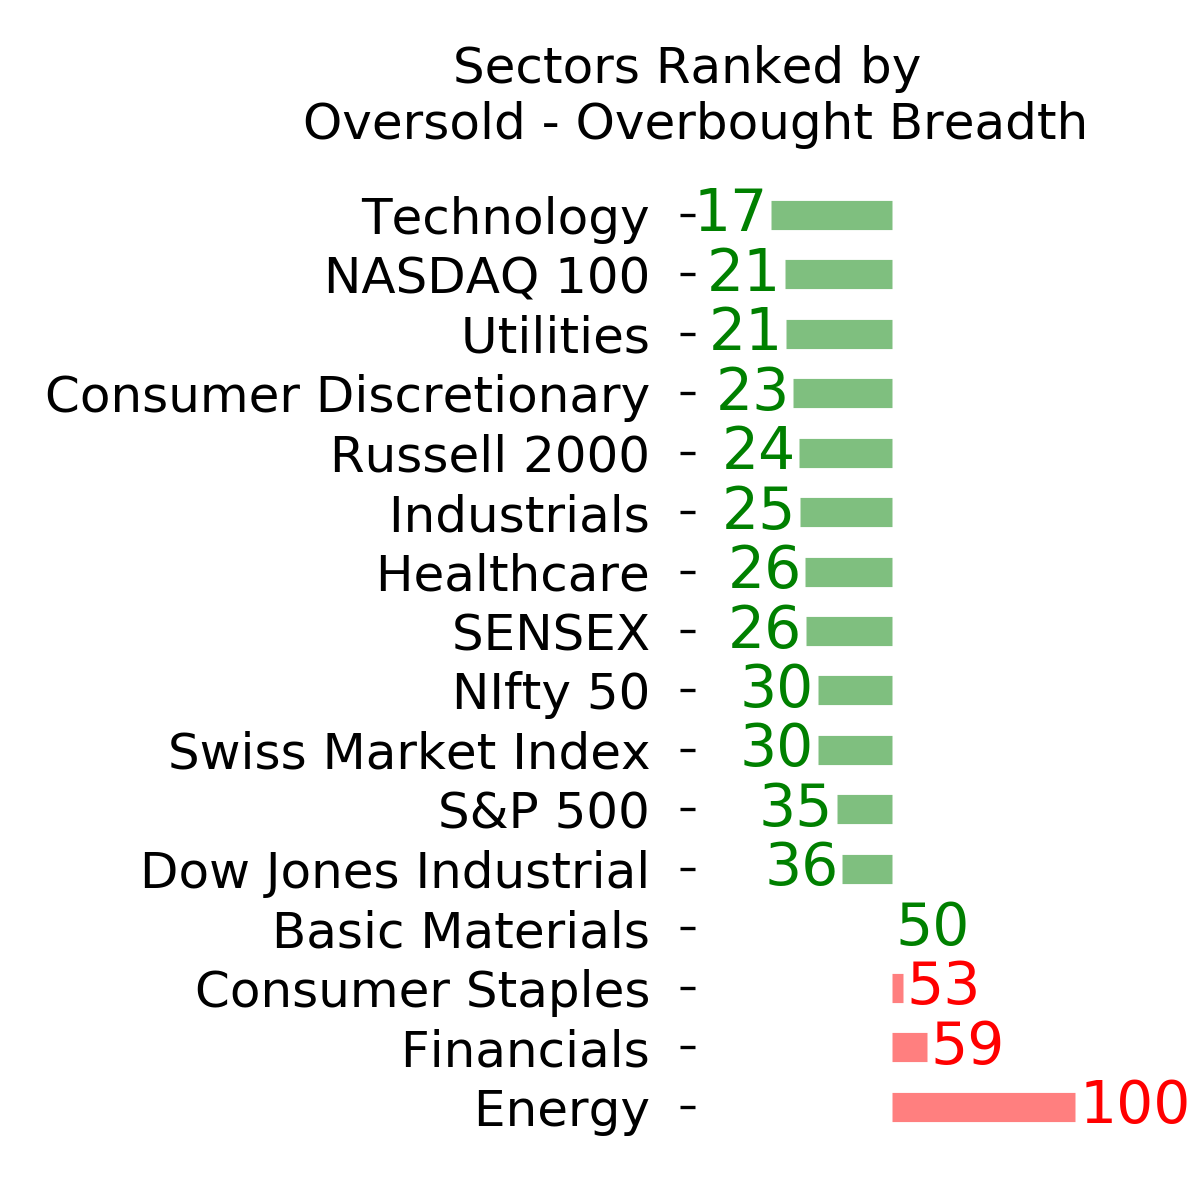
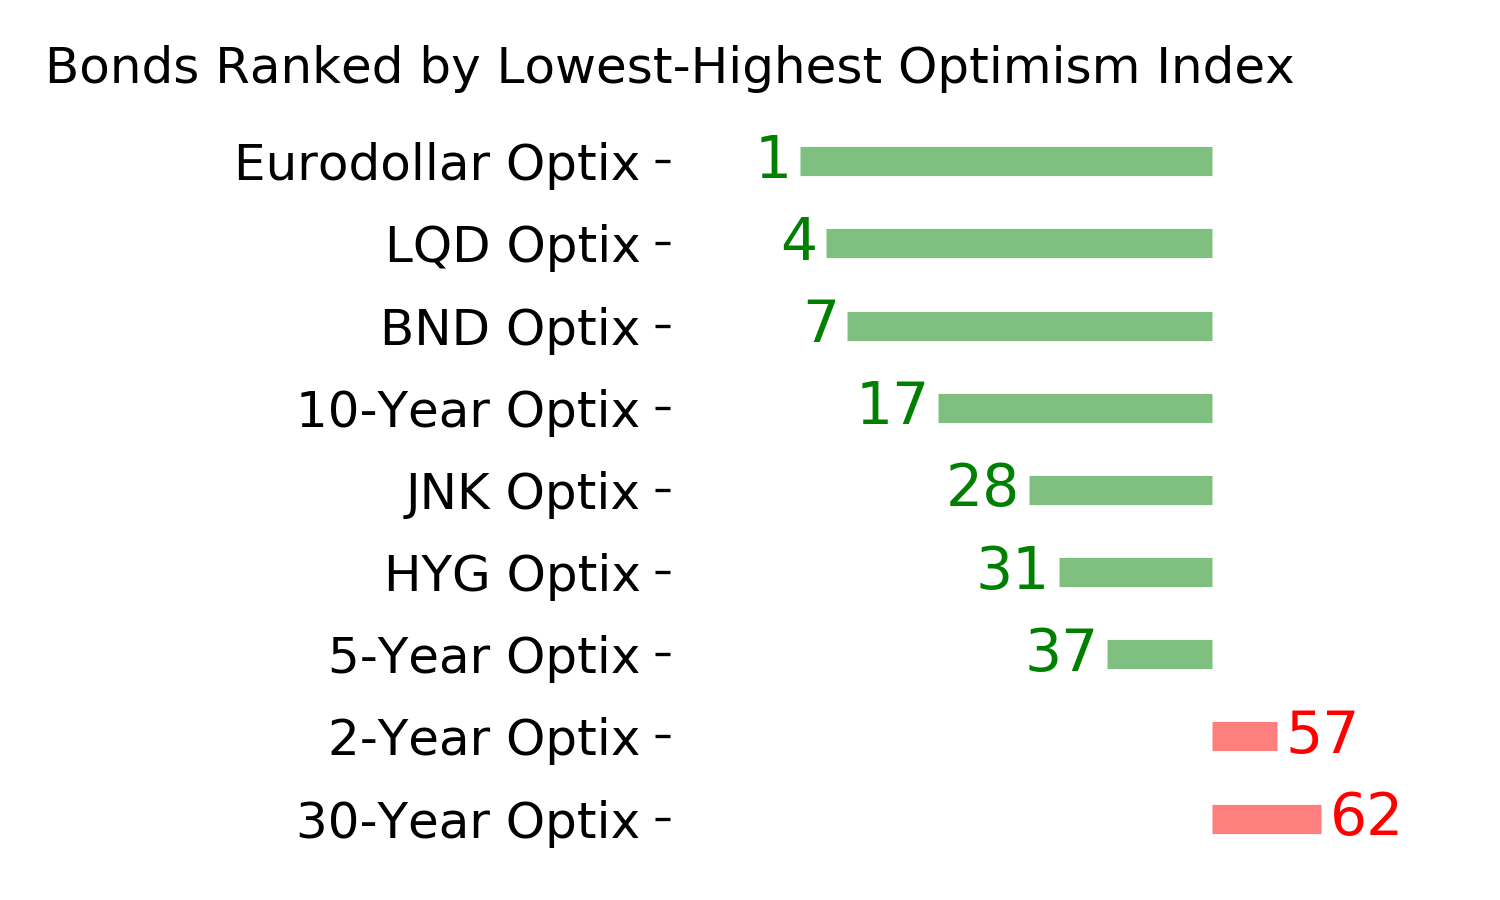
Ranks
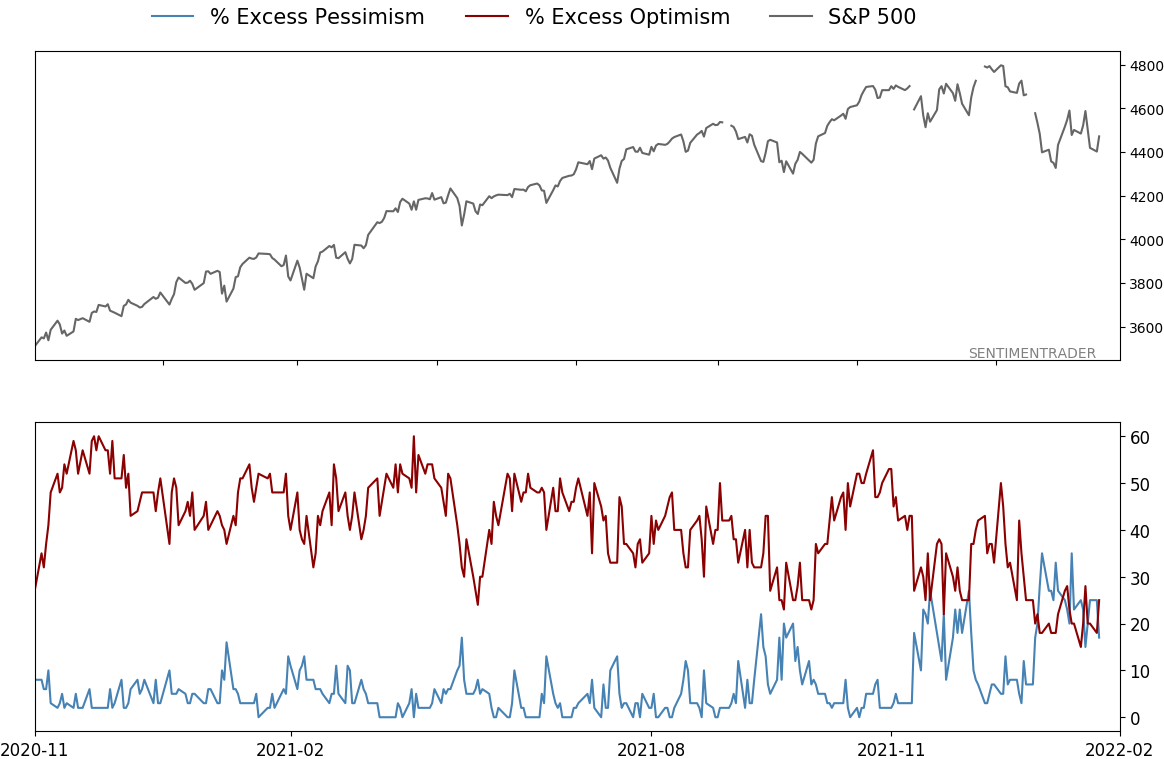
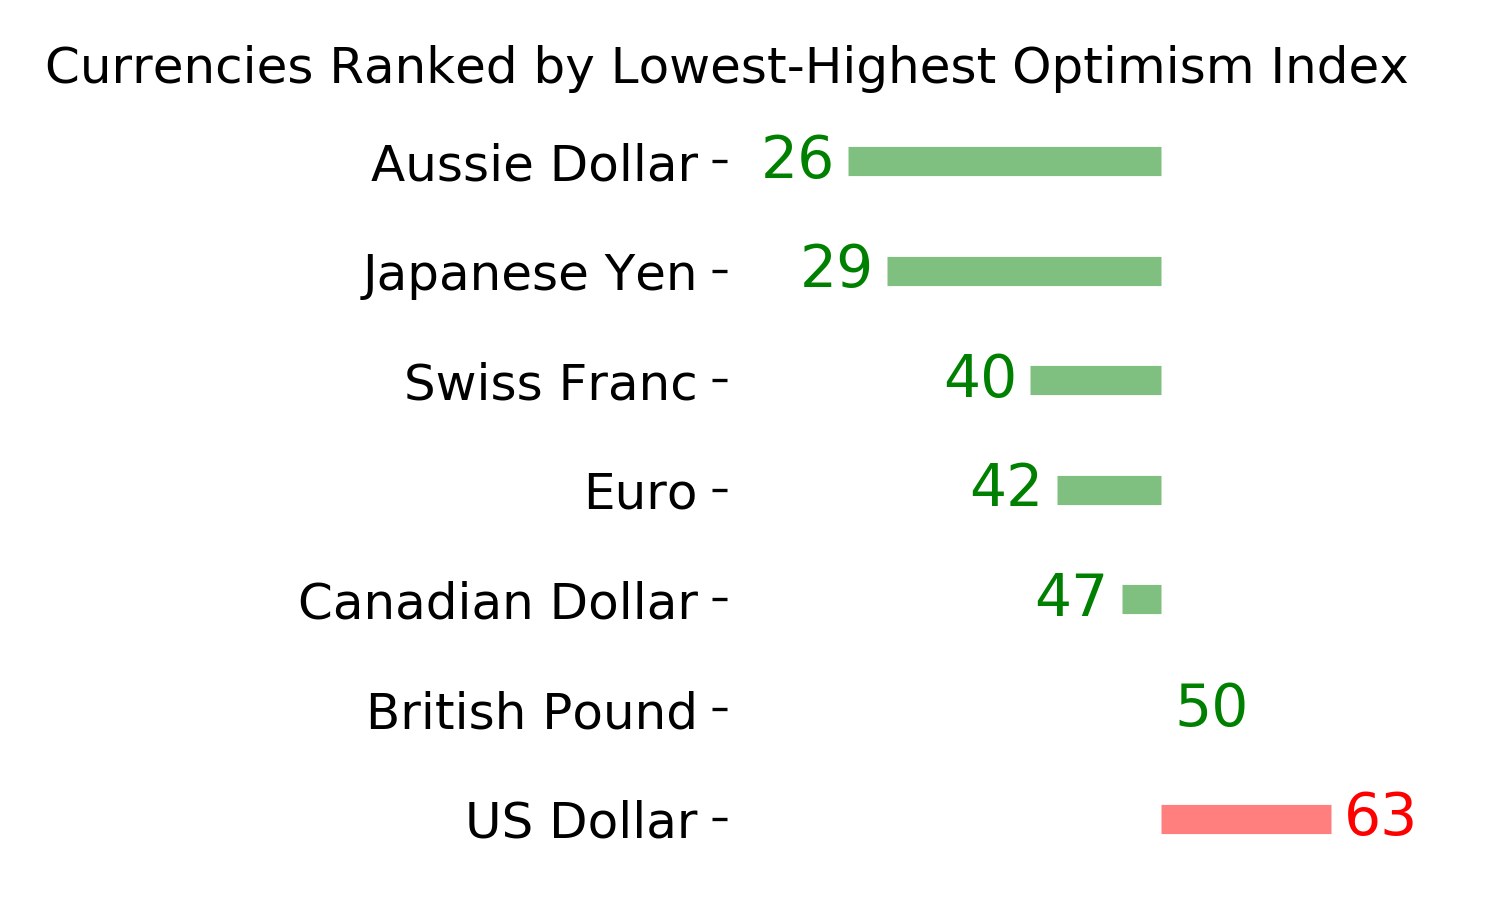
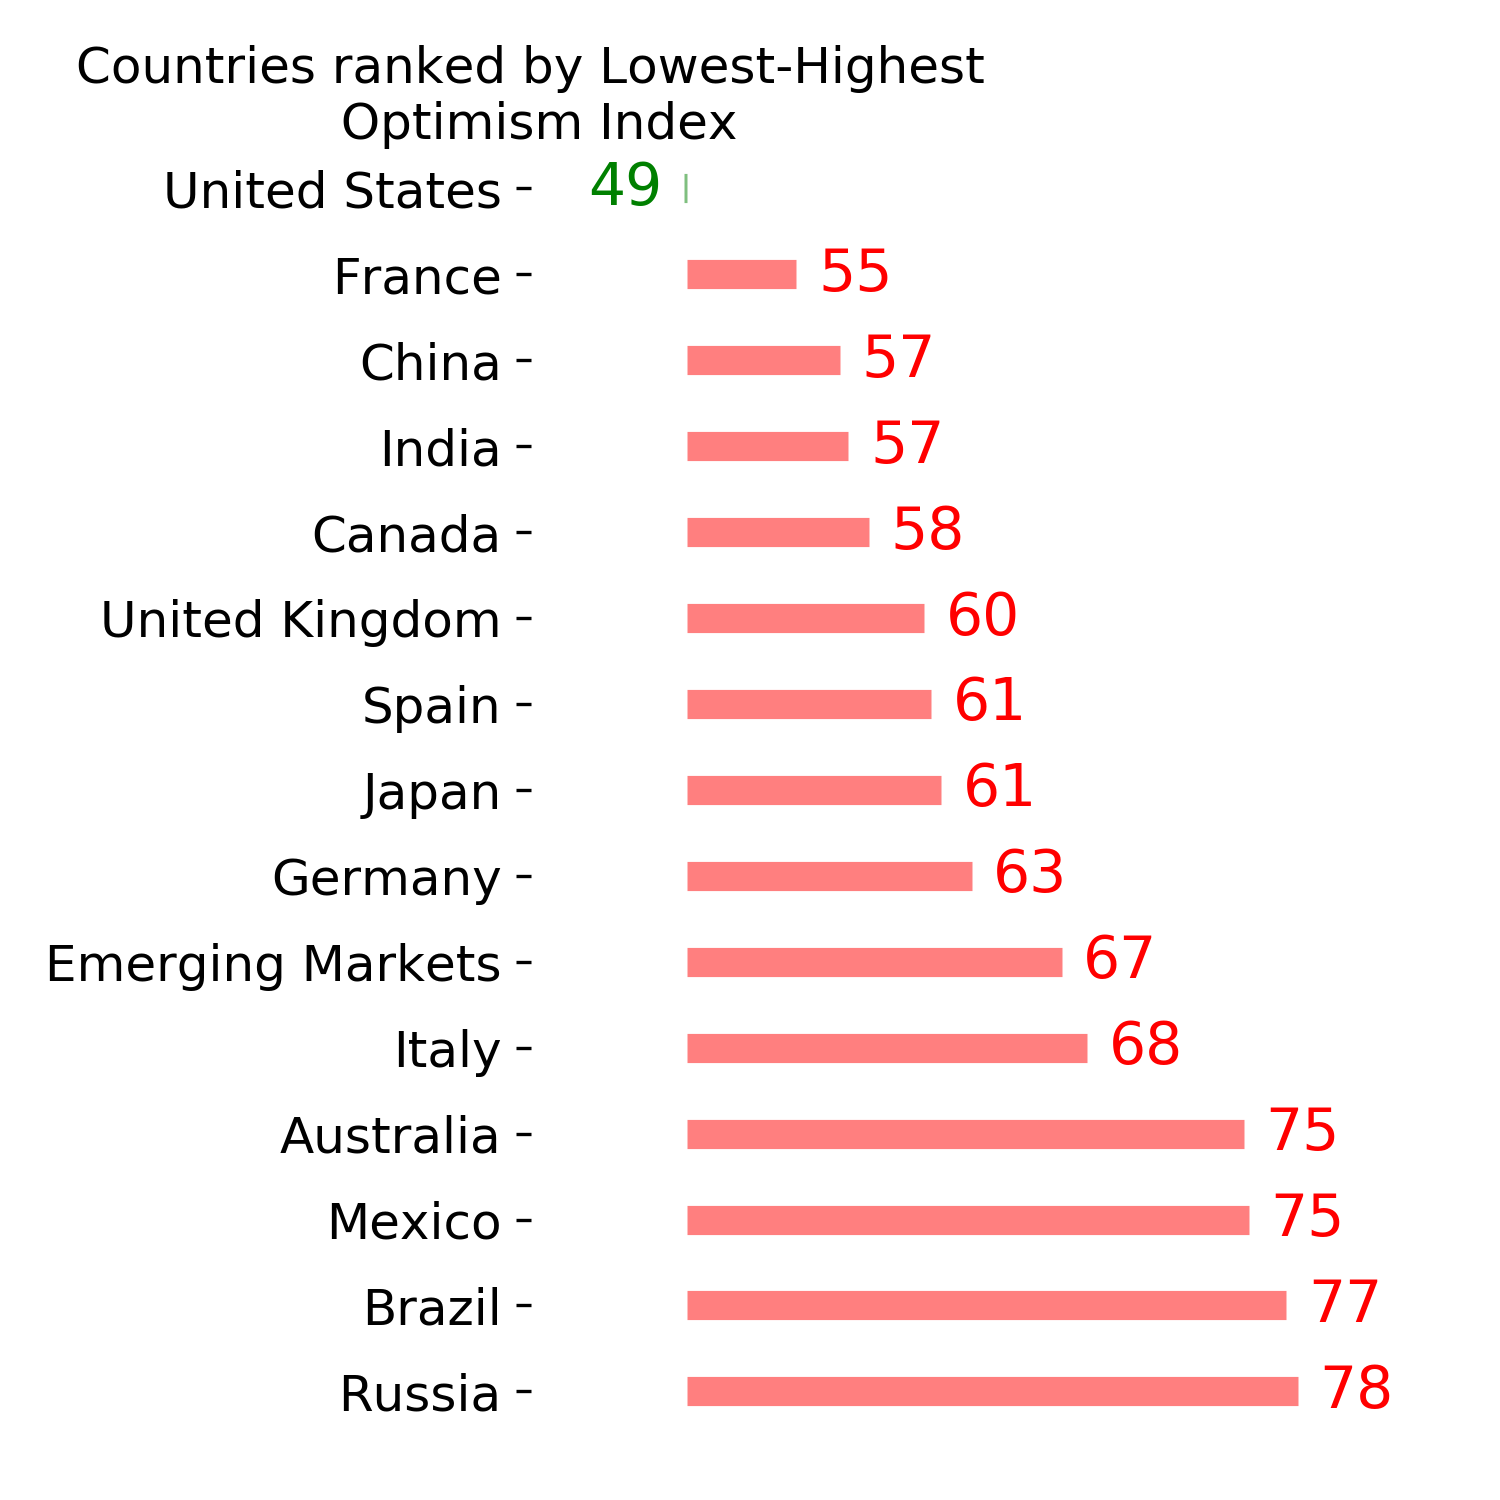
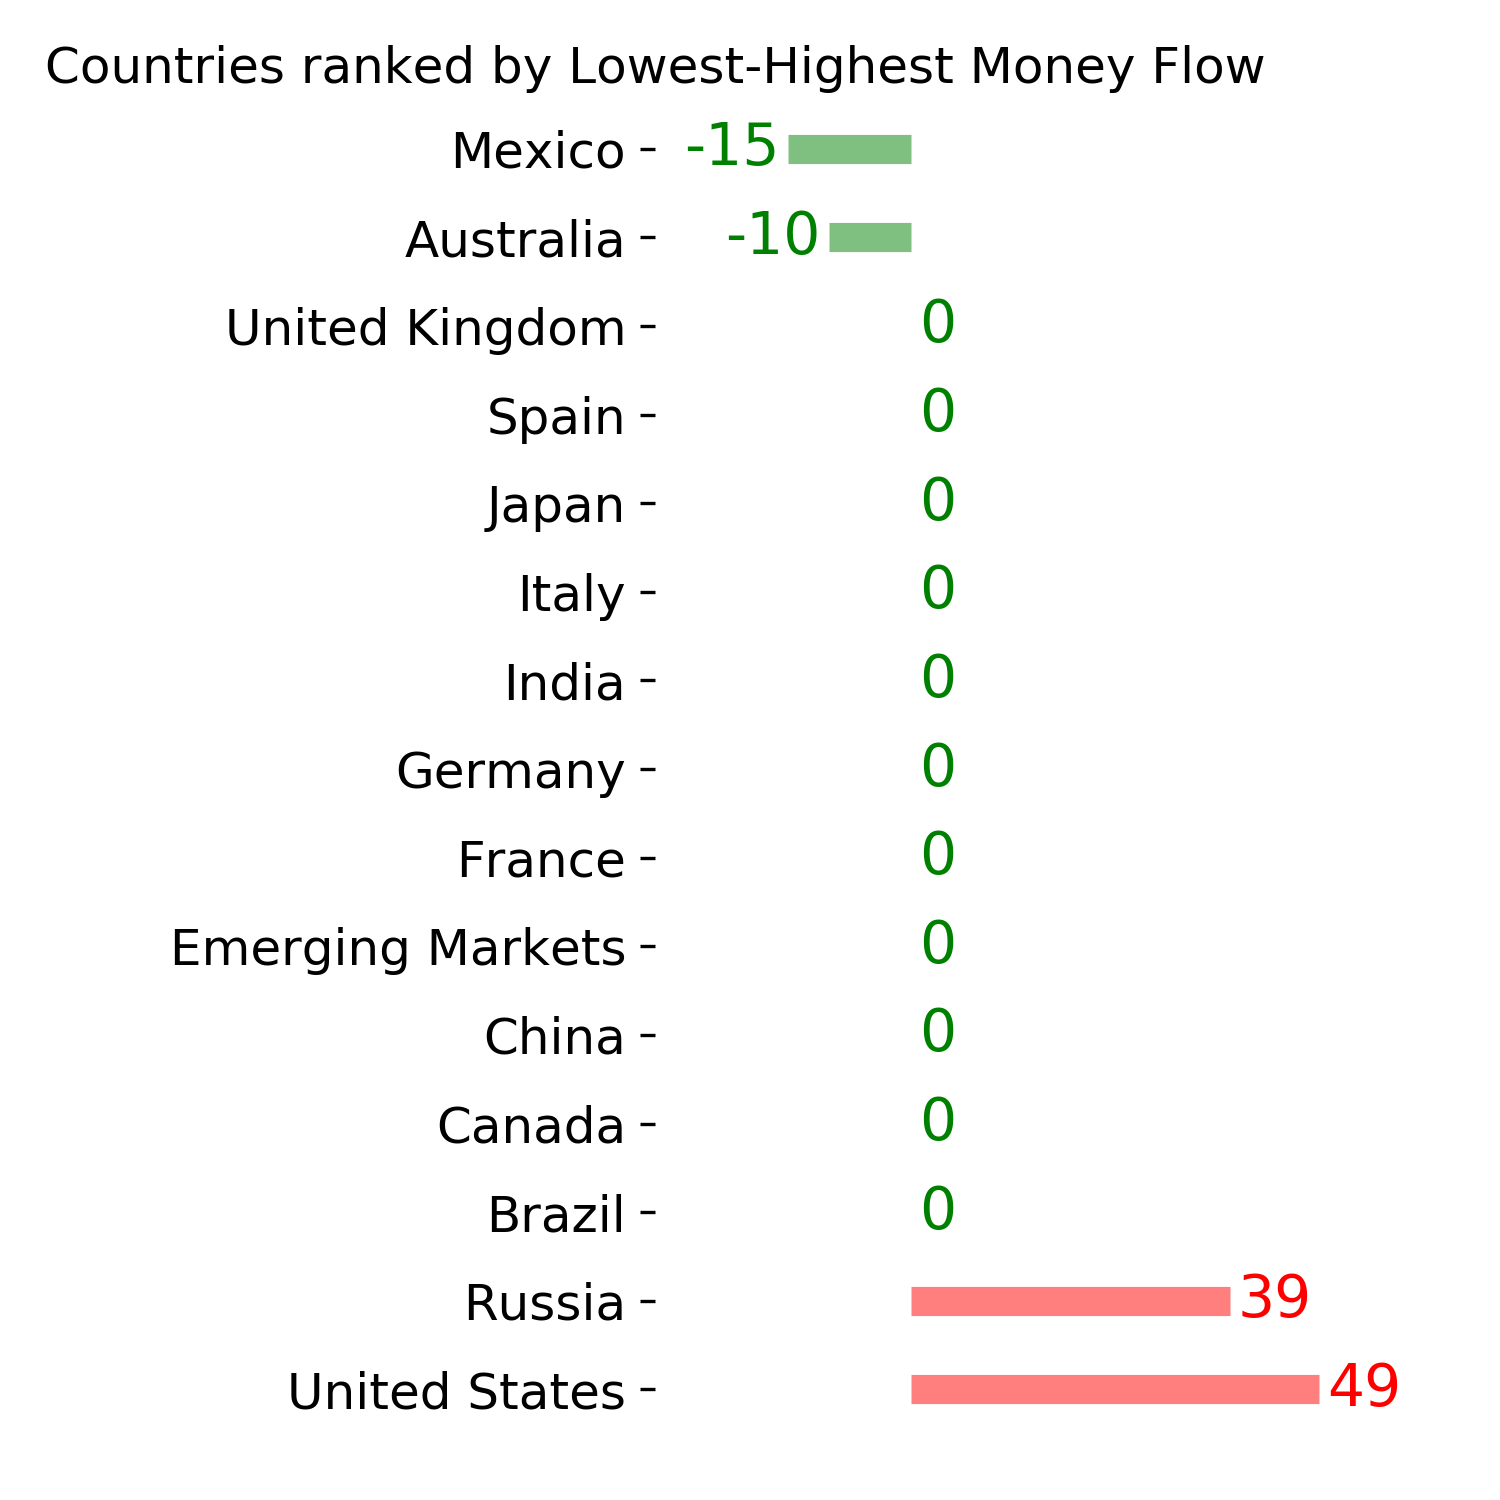
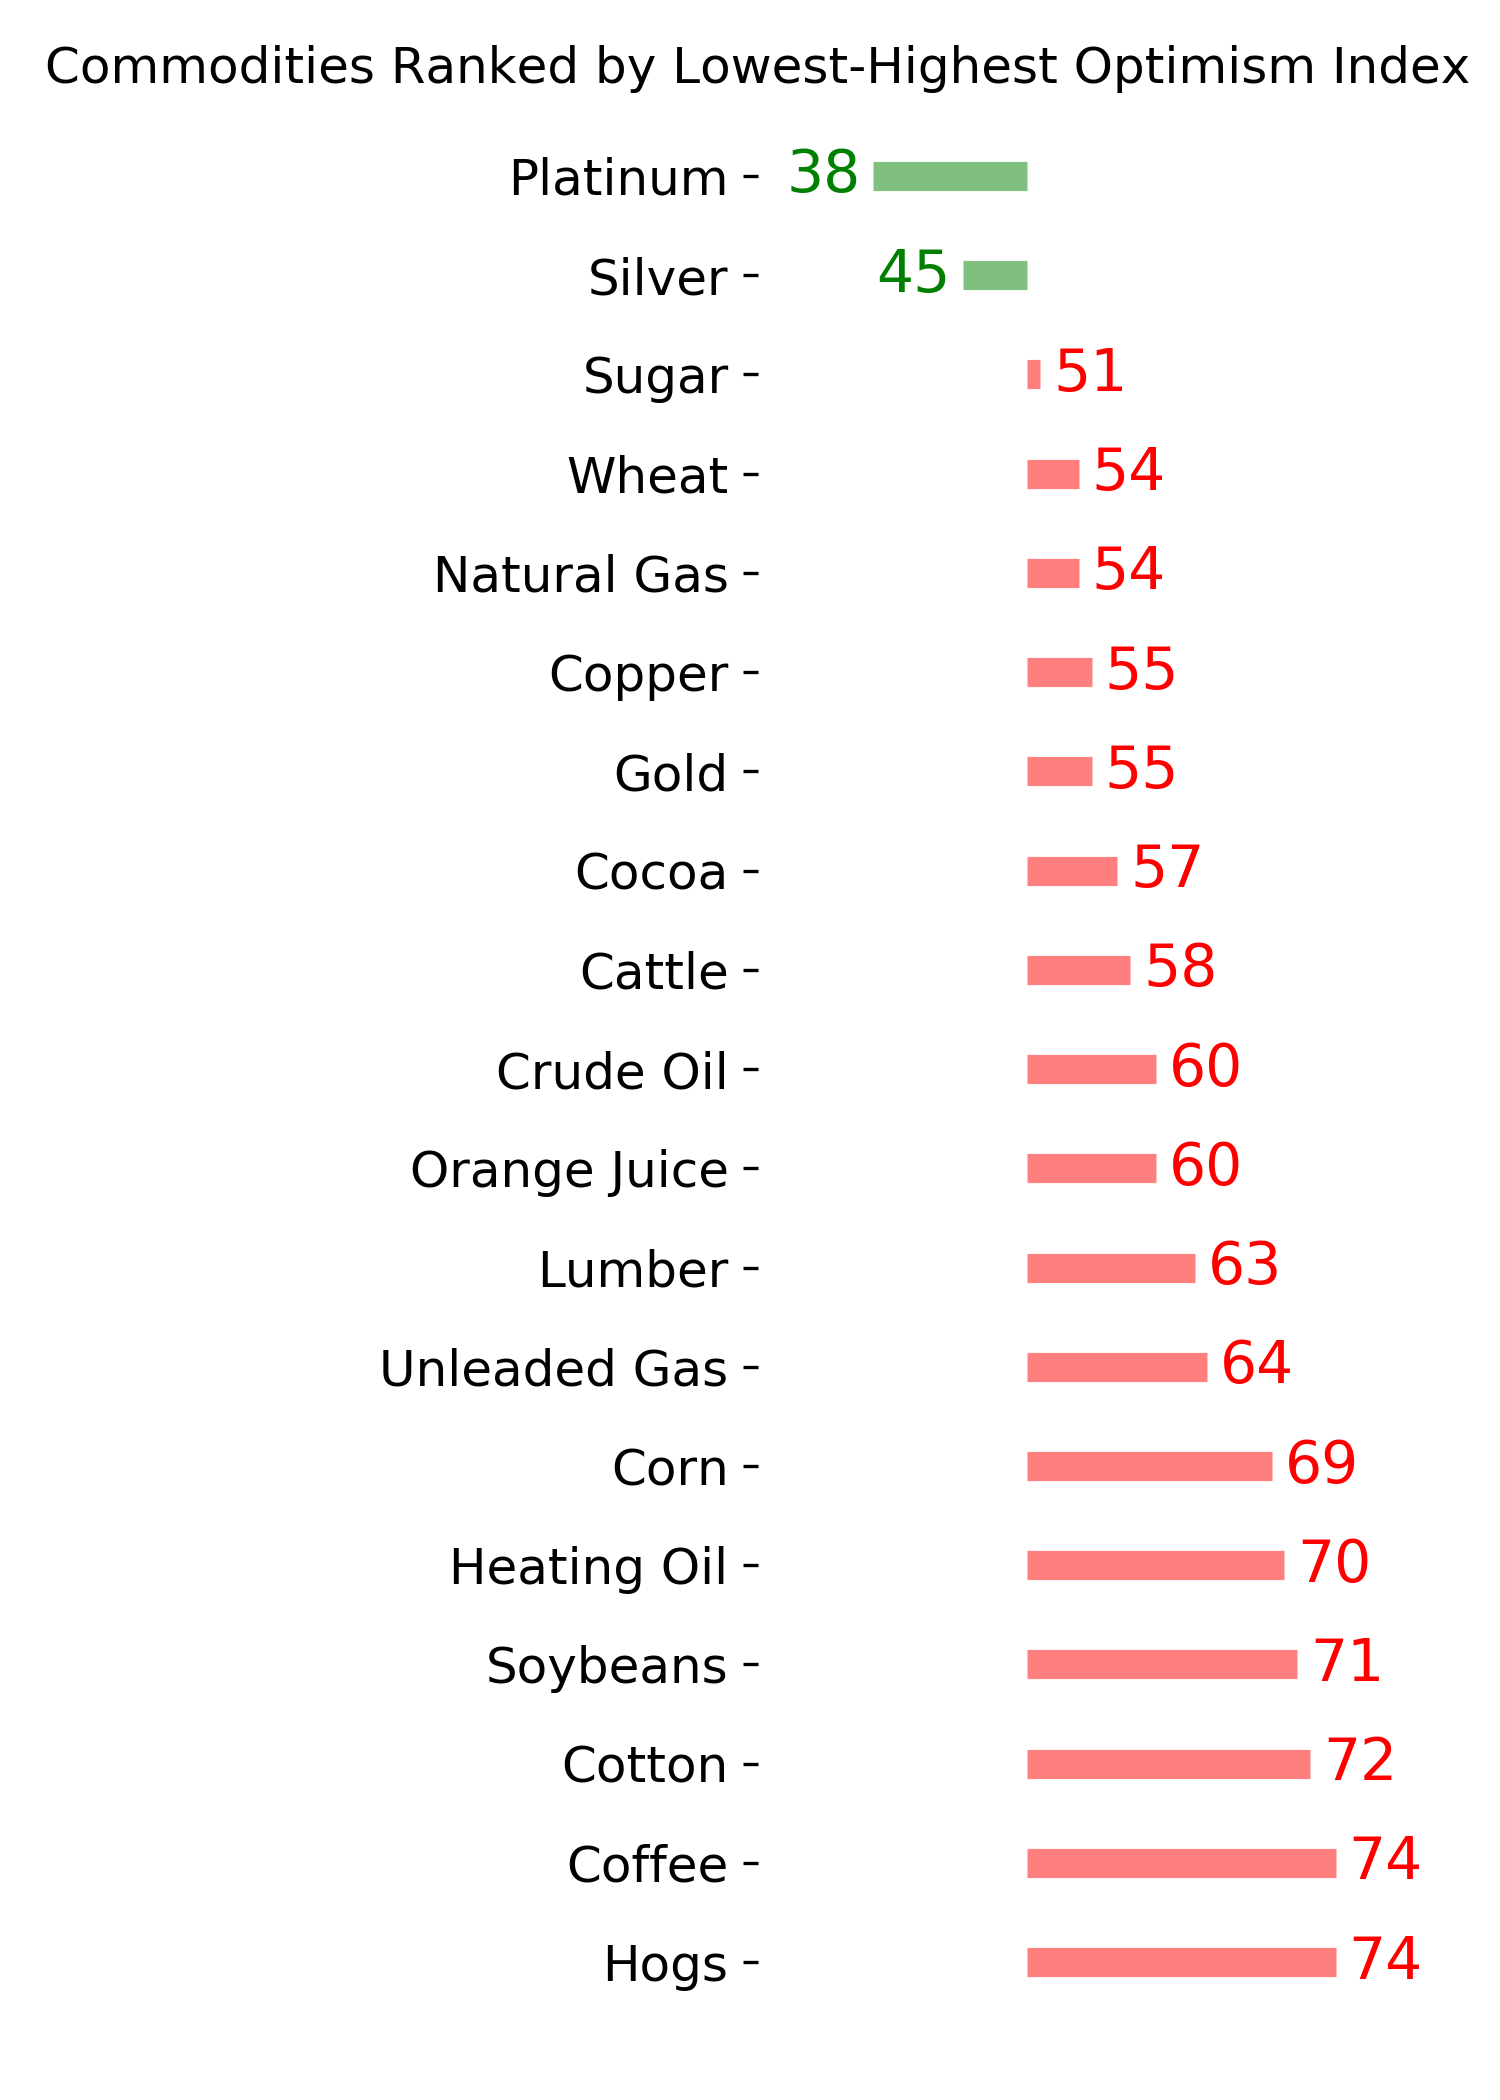
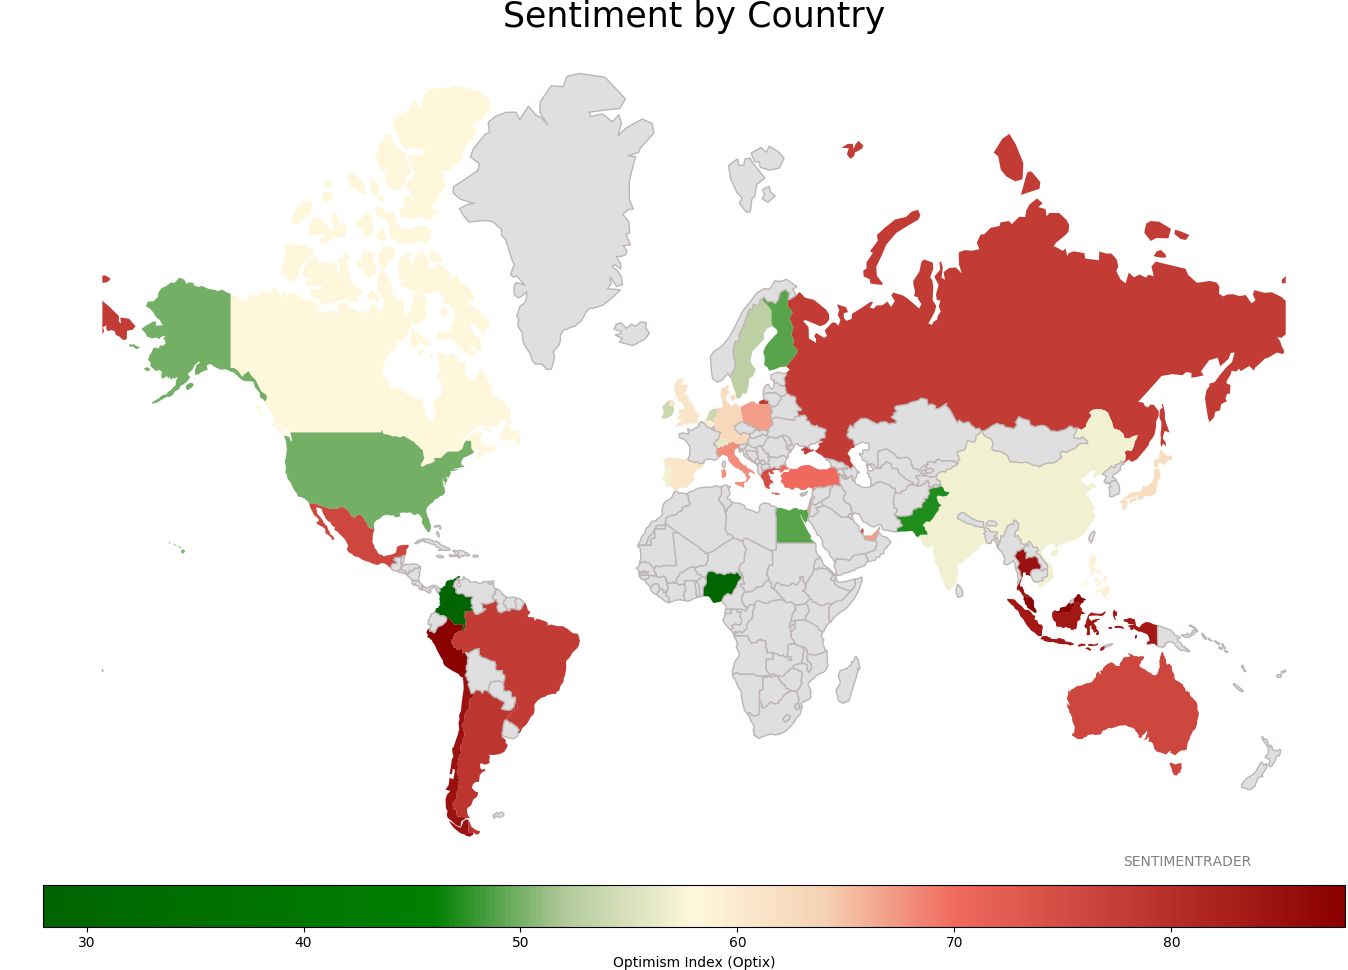
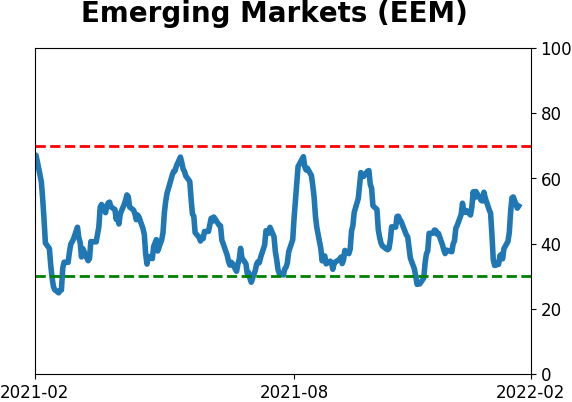
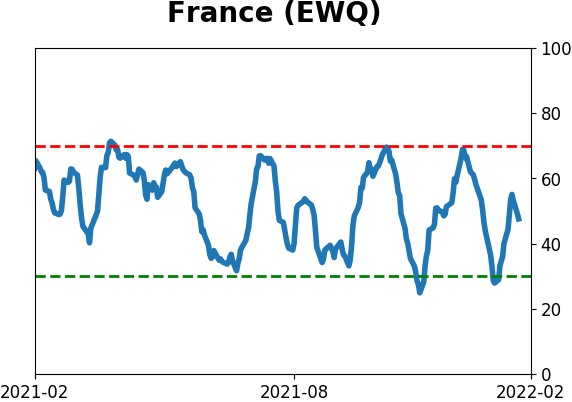
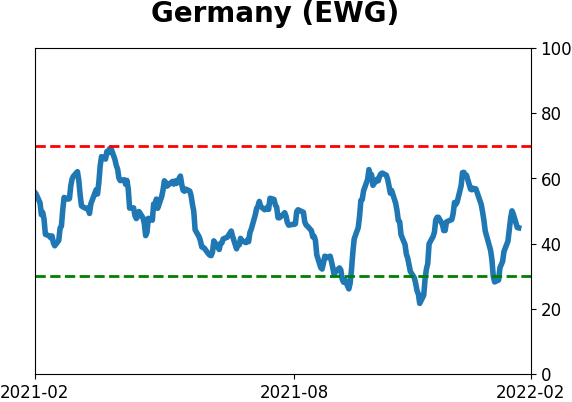
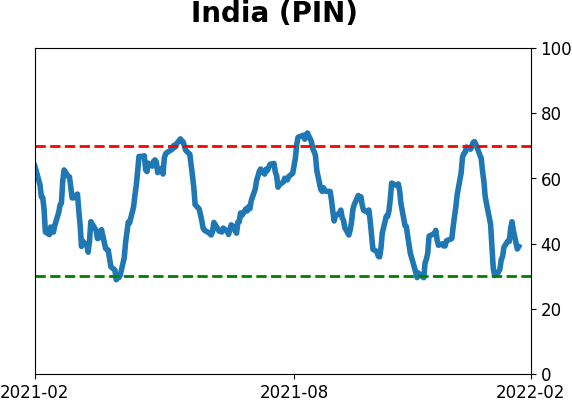
Sentiment Around The World
Optimism Index Thumbnails
|
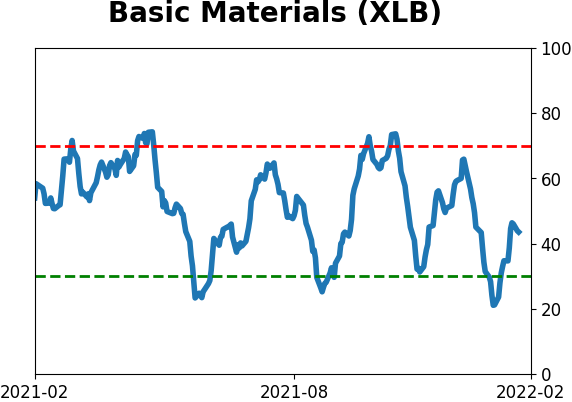
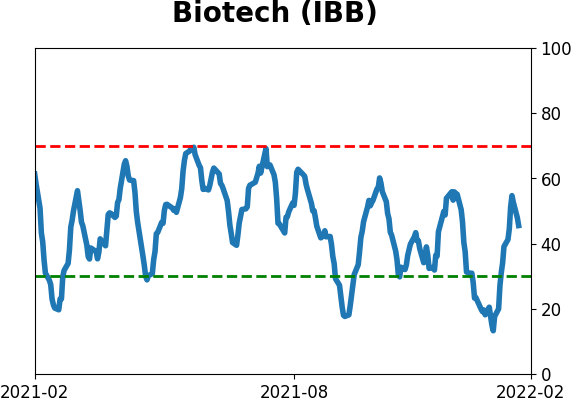
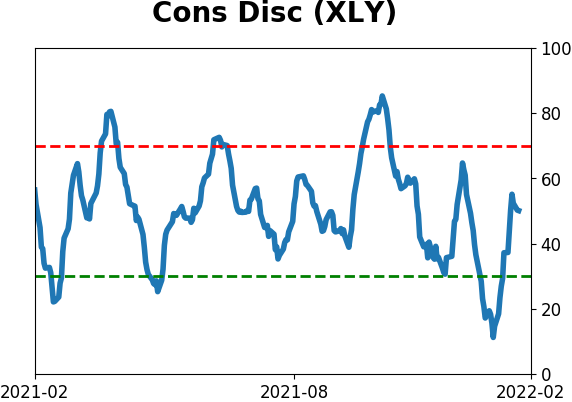
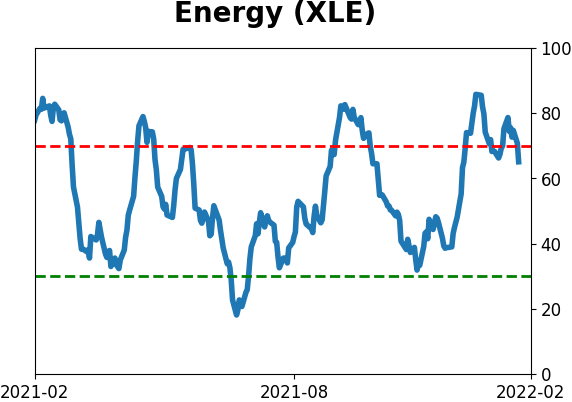
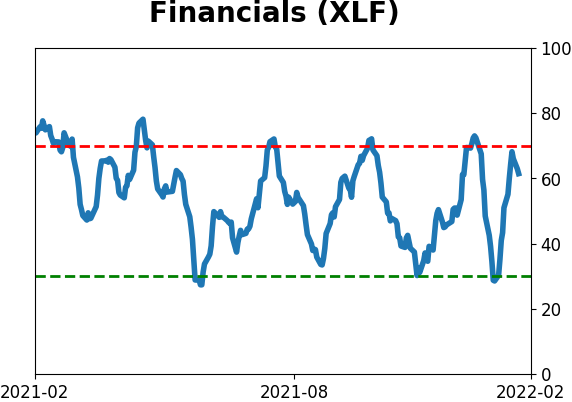
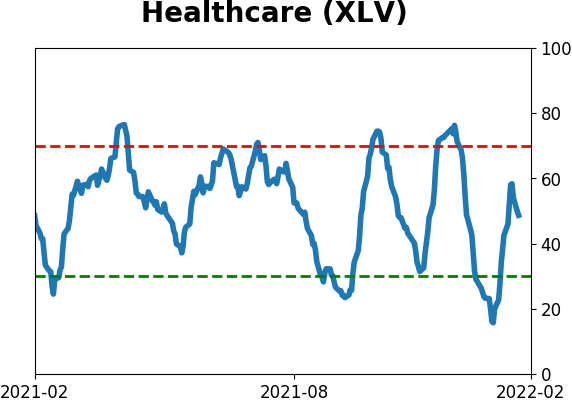
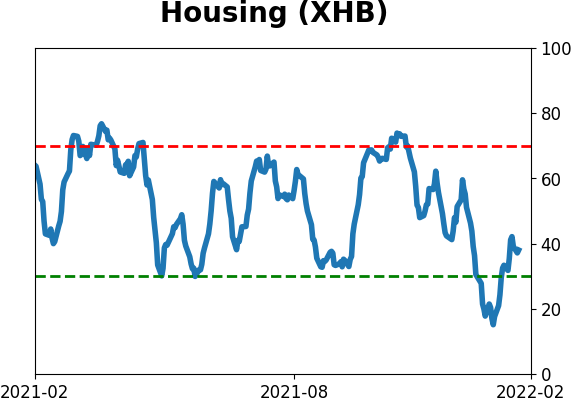
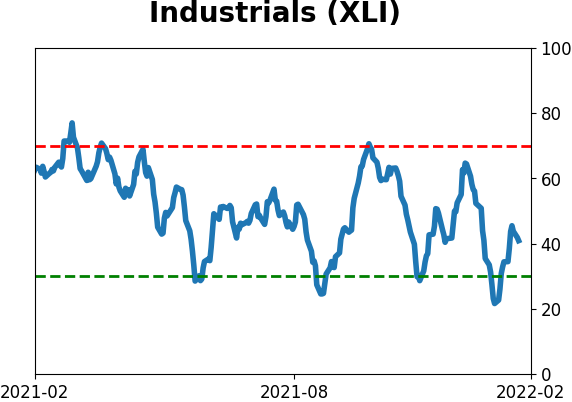
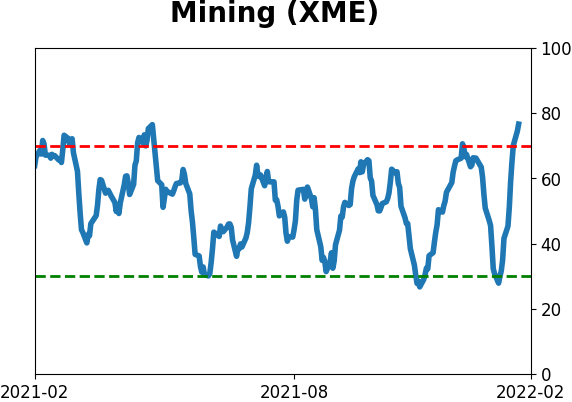
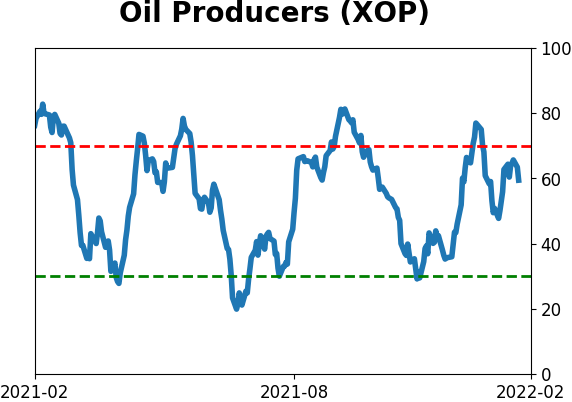
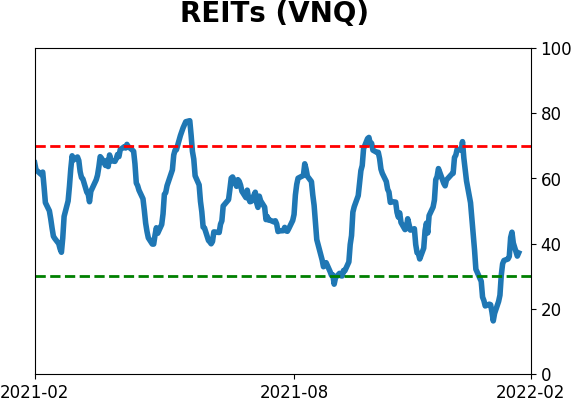
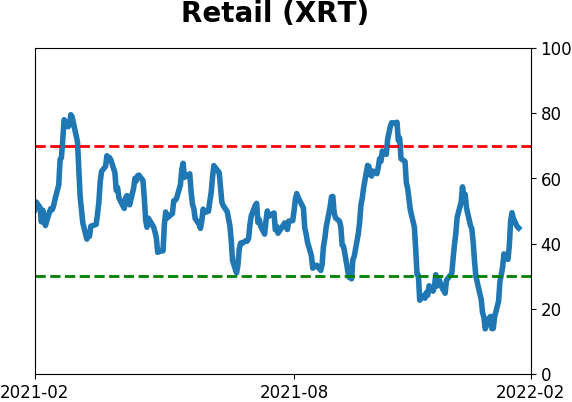
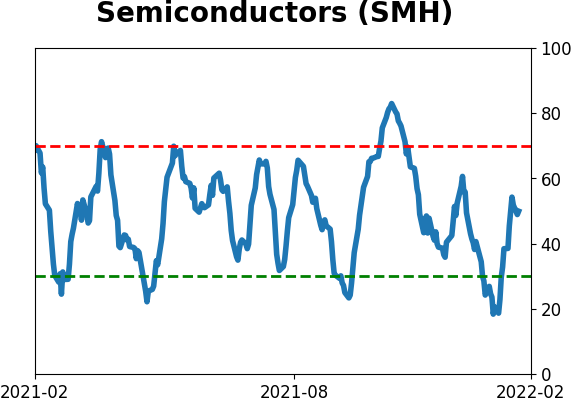
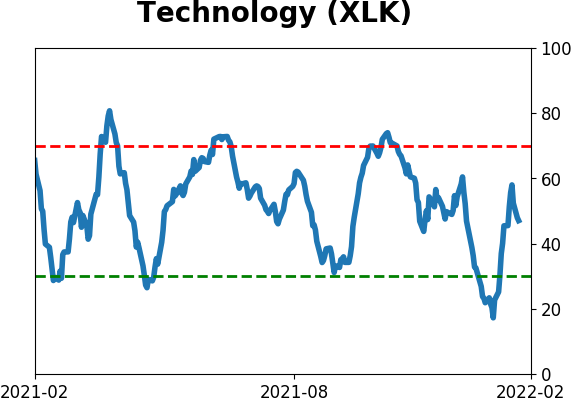
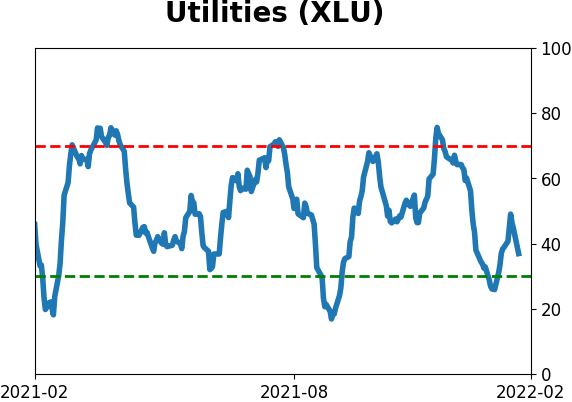
Sector ETF's - 10-Day Moving Average
|
|
|
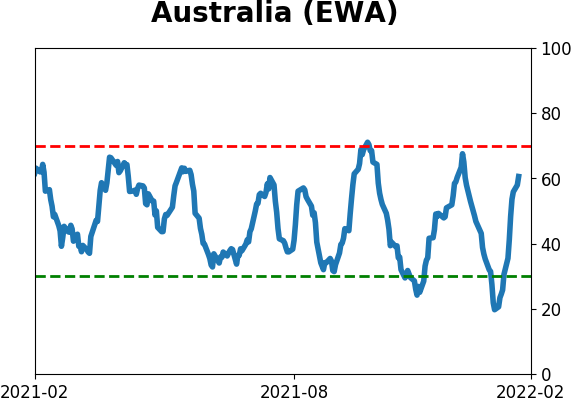
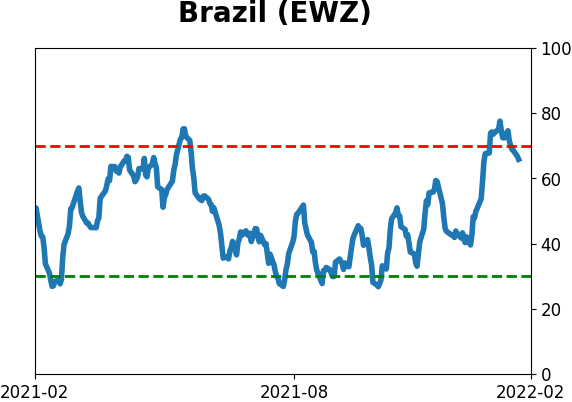
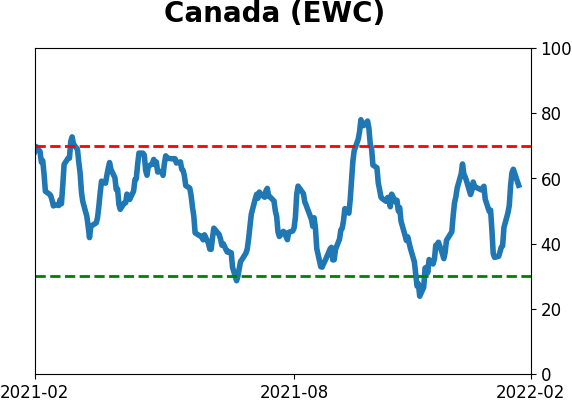
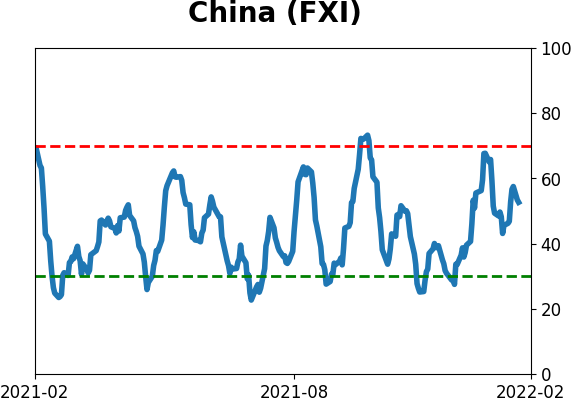
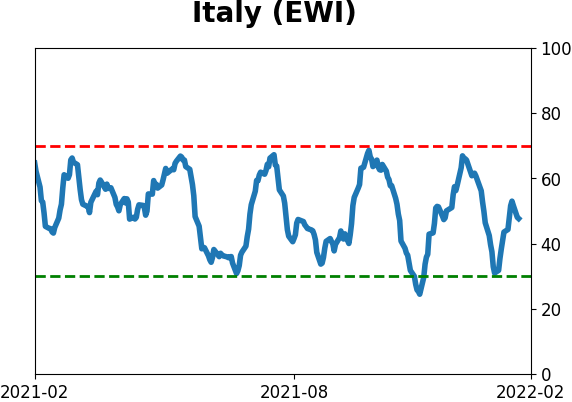
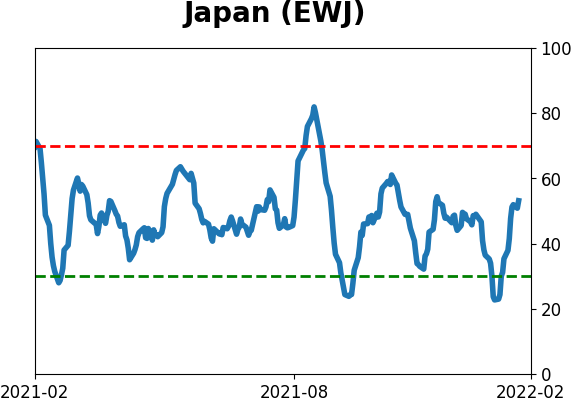
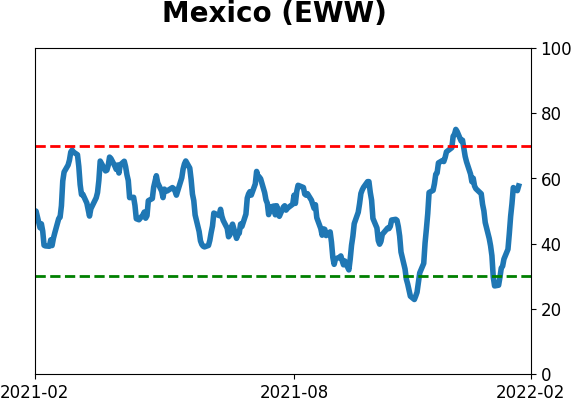
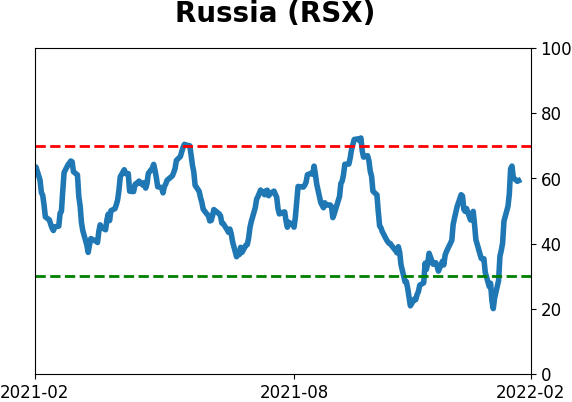
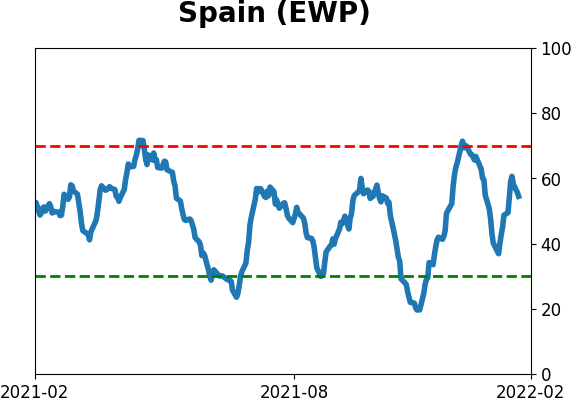
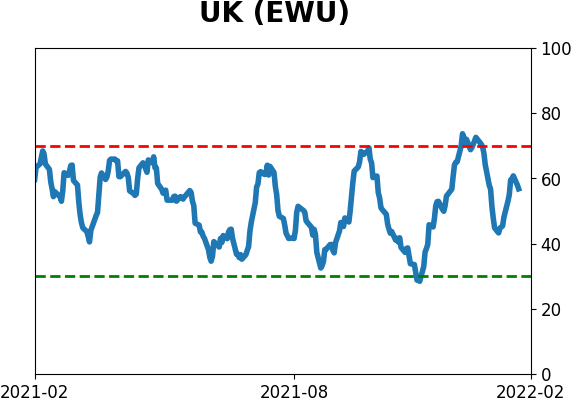
Country ETF's - 10-Day Moving Average
|
|
|
Bond ETF's - 10-Day Moving Average
|
|
|
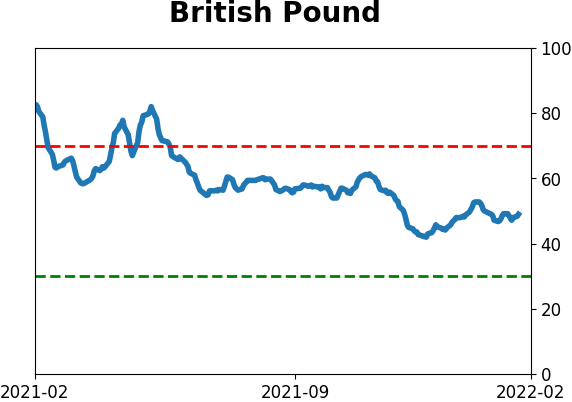
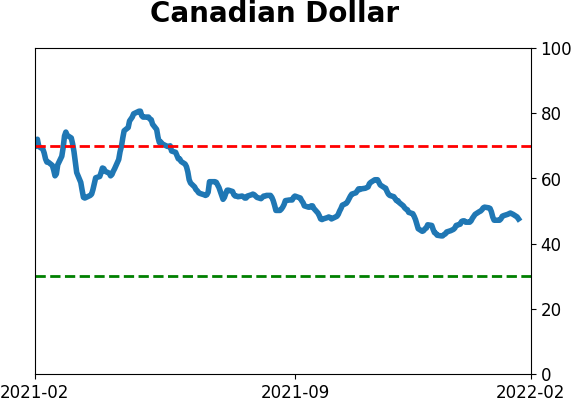
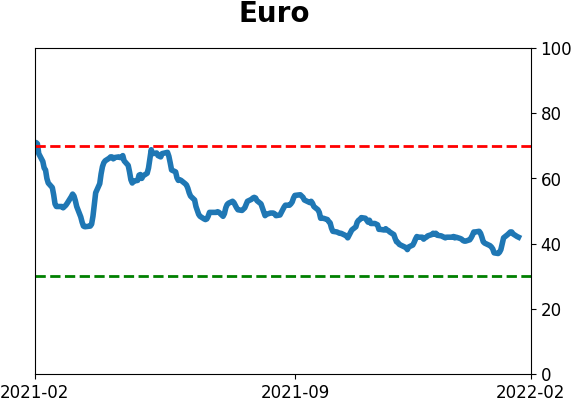
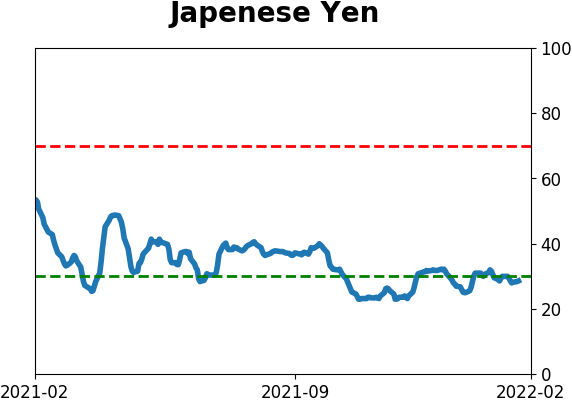
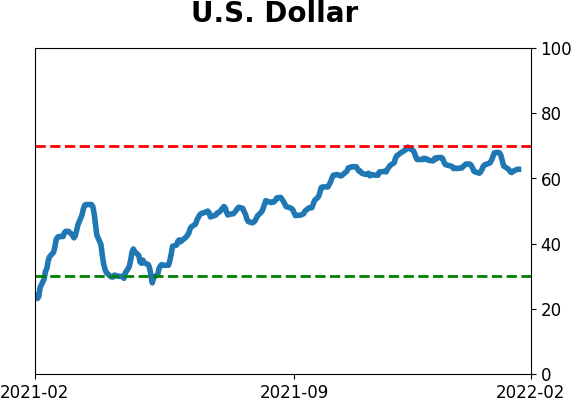
Currency ETF's - 5-Day Moving Average
|
|
|
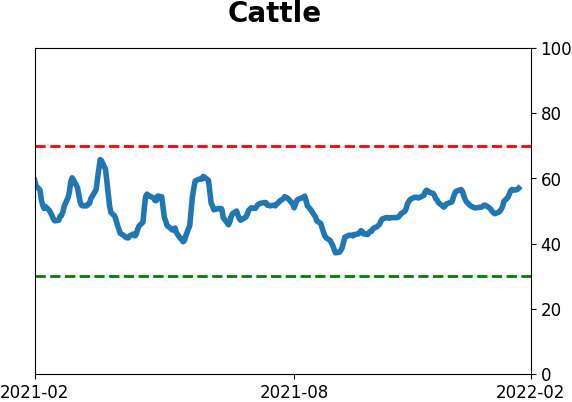
Commodity ETF's - 5-Day Moving Average
|
|