Headlines
|
|
China returns to its place as the world's most hated market:
Investors in Chinese stocks have become numb to periodic crashes. But the latest one is different in that the damage was so widespread. A Panic Breadth Composite surged to the highest level ever, with the only comparable readings preceding relief rallies. Also, a major regulatory change has tended to precede multi-month rallies.
|
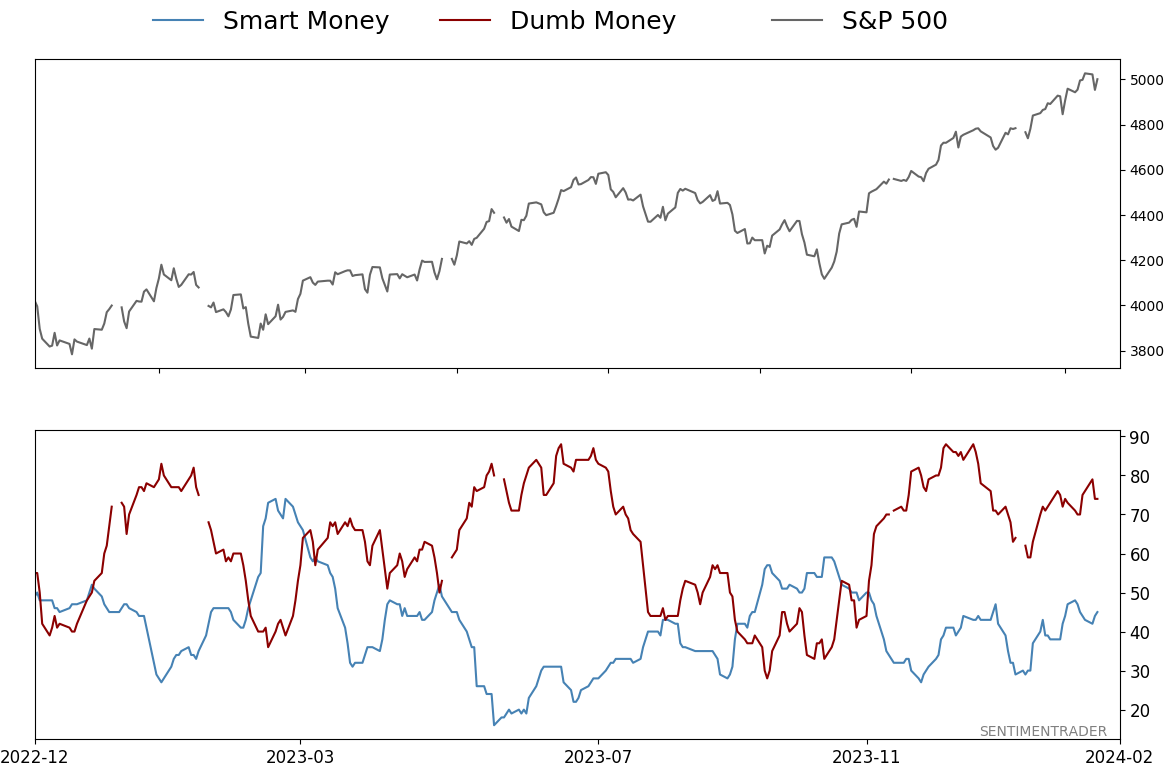
Smart / Dumb Money Confidence
|
Smart Money Confidence: 45%
Dumb Money Confidence: 74%
|
|
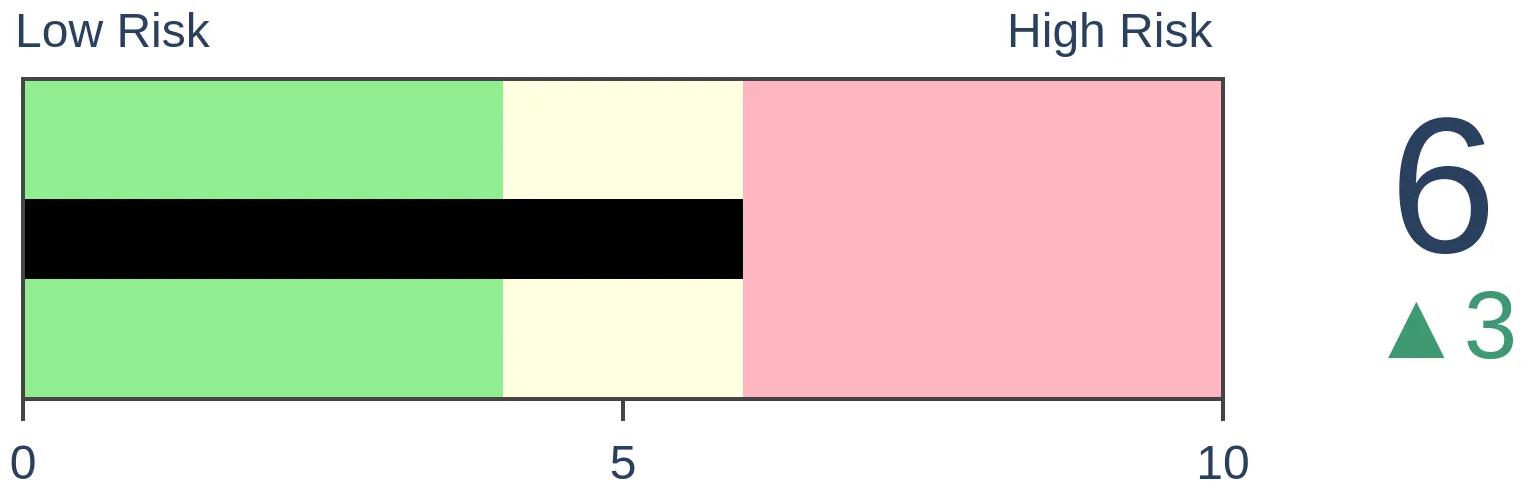
Risk Levels
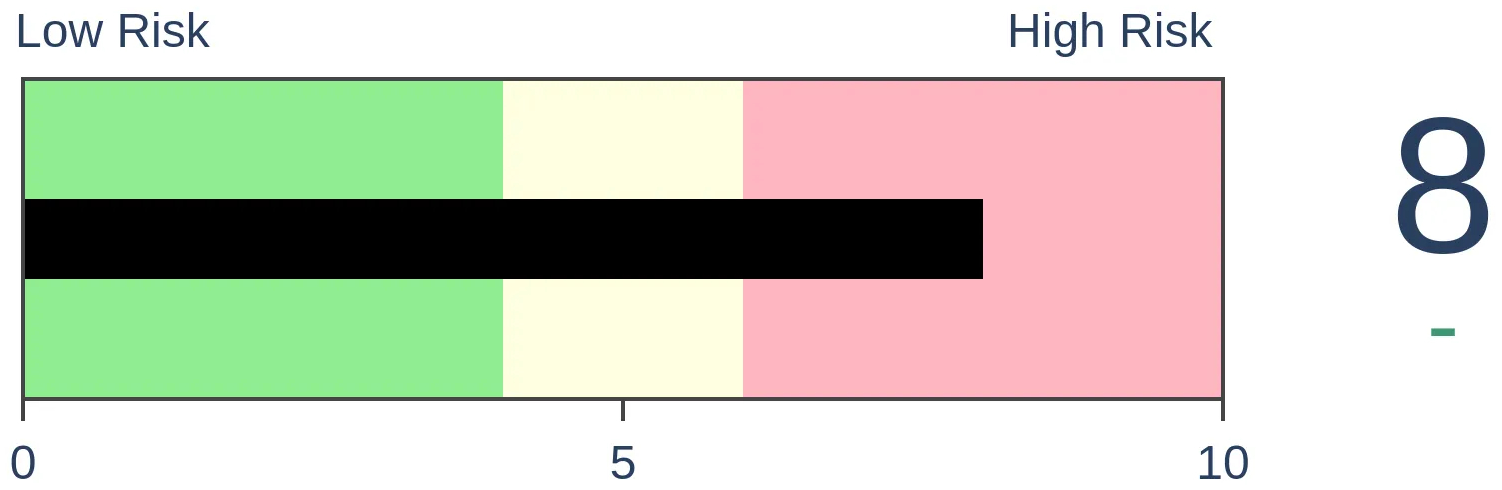
Stocks Short-Term
|
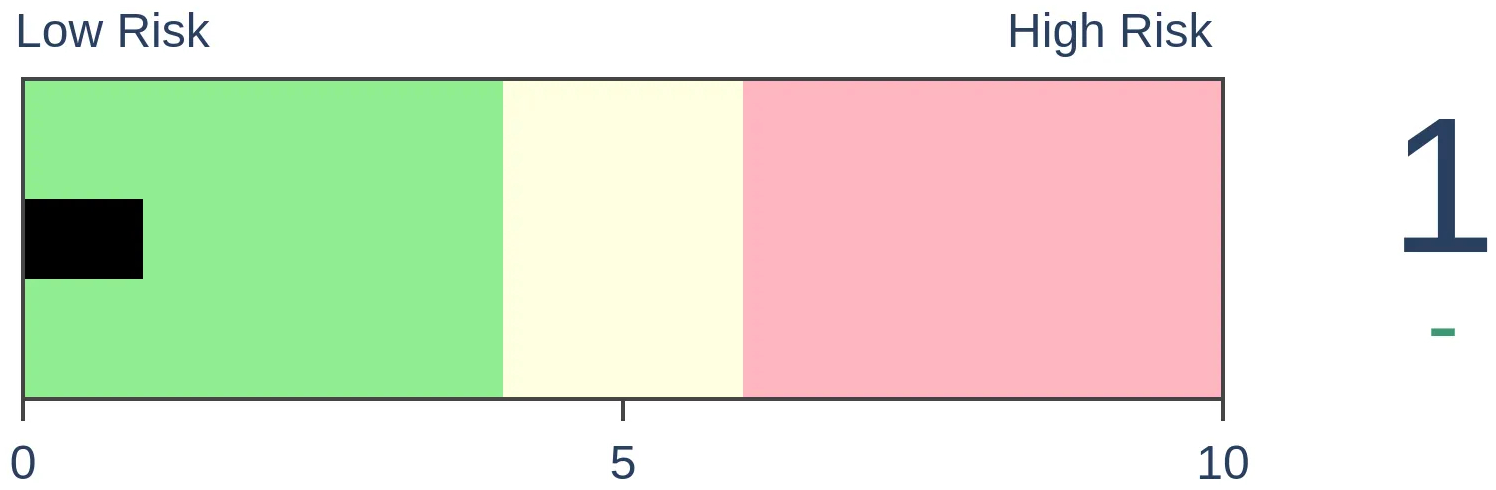
Stocks Medium-Term
|
|
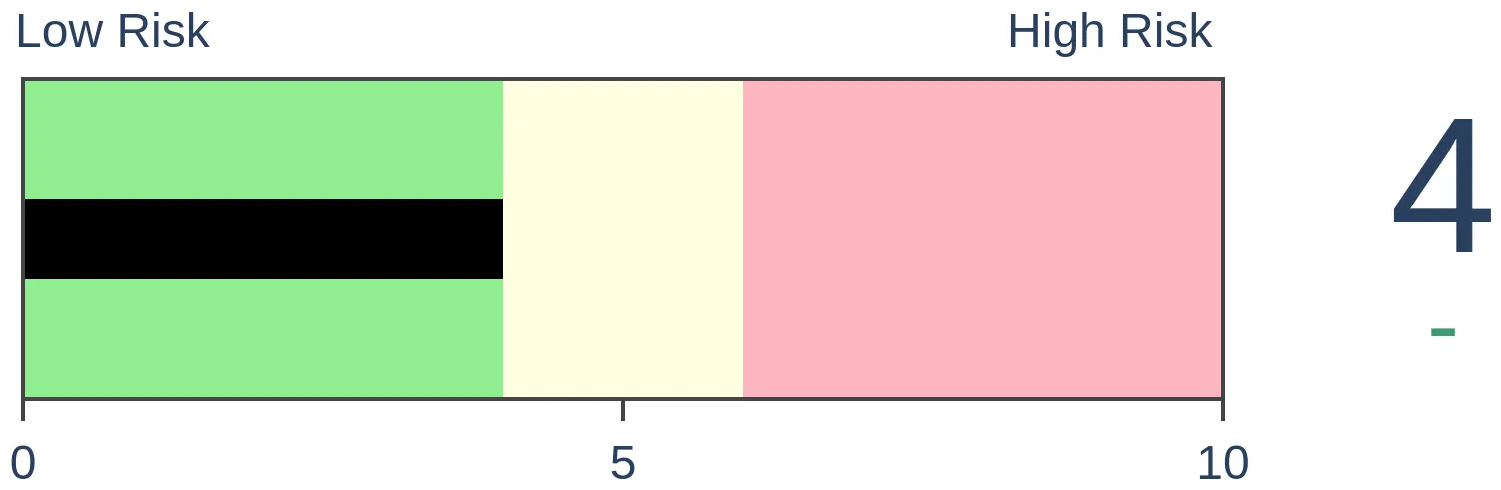
Bonds
|
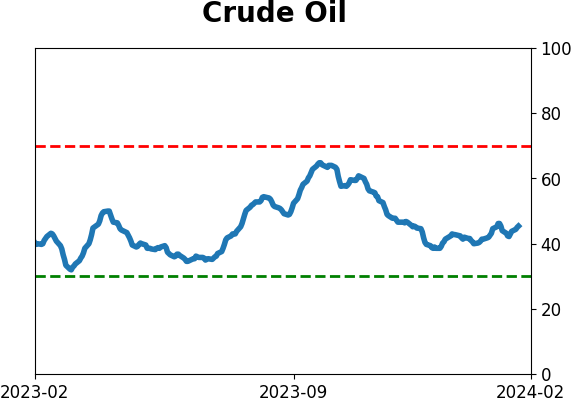
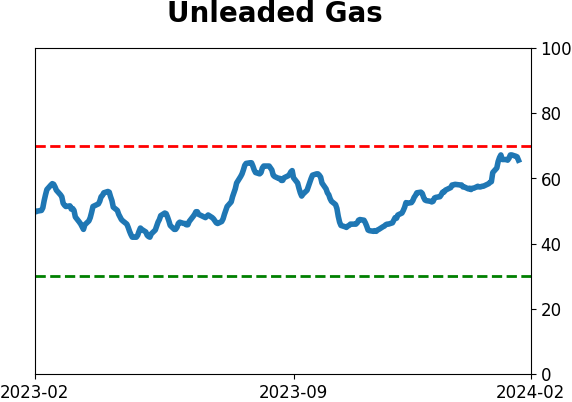
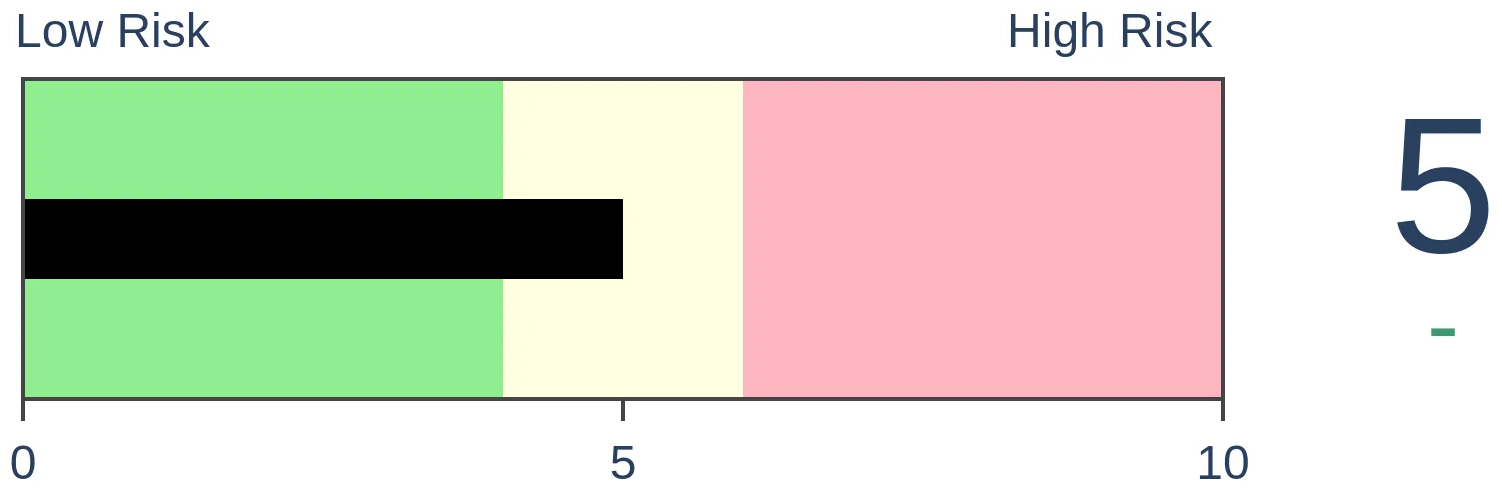
Crude Oil
|
|
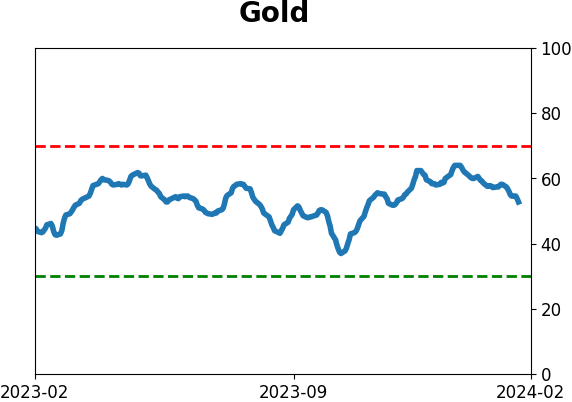
Gold

|
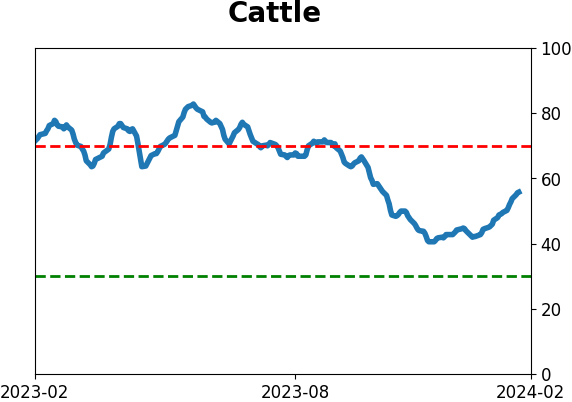
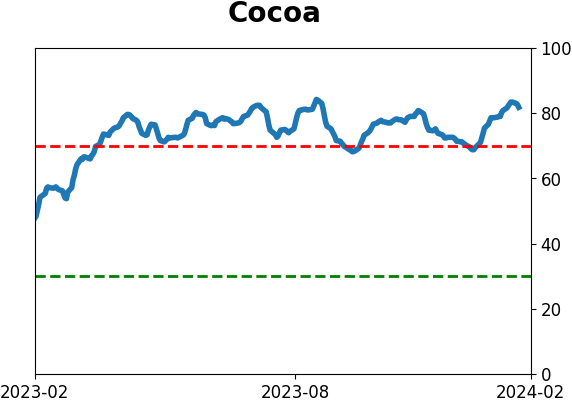
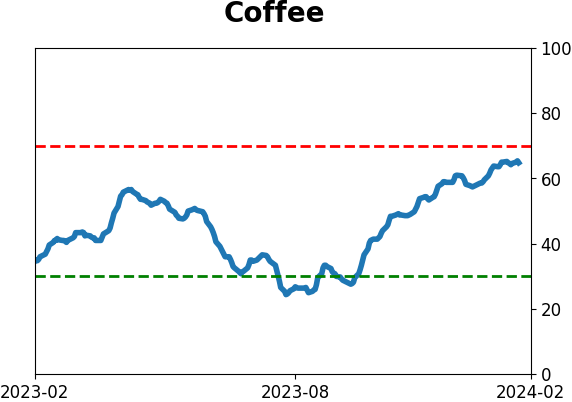
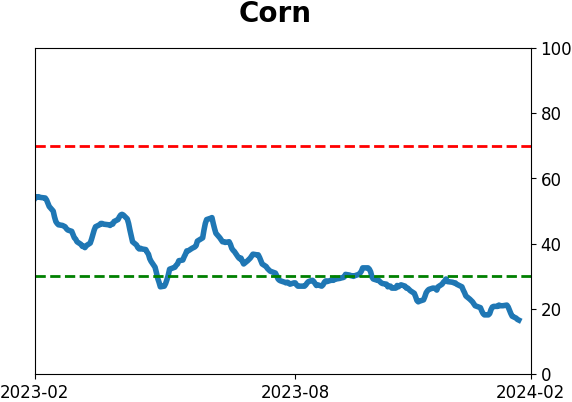
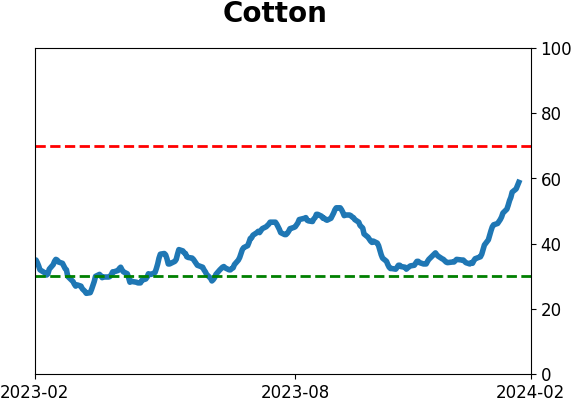
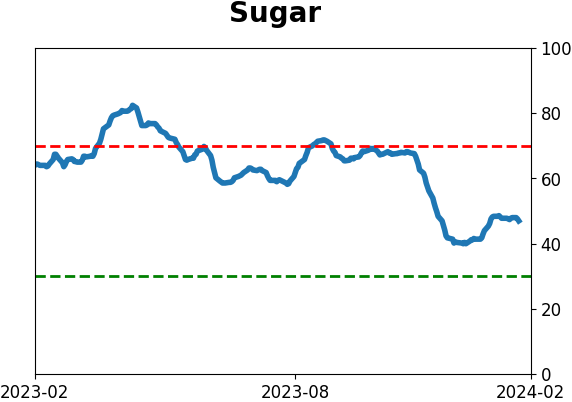
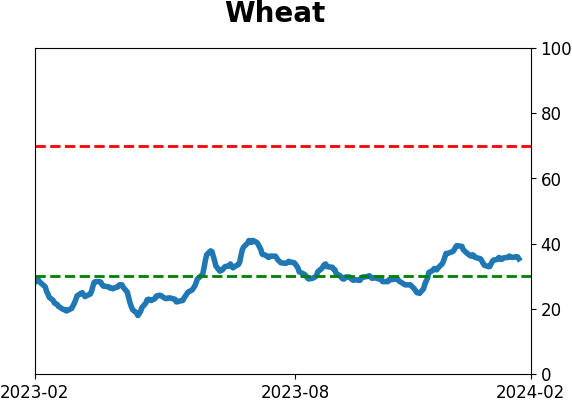
Agriculture
|
|
Research
By Jason Goepfert
BOTTOM LINE
Investors in Chinese stocks have become numb to periodic crashes. But the latest one is different in that the damage was so widespread. A Panic Breadth Composite surged to the highest level ever, with the only comparable readings preceding relief rallies. Also, a major regulatory change has tended to precede multi-month rallies.
FORECAST / TIMEFRAME
None
|
Key points:
- Over the past couple of years, Chinese stocks have periodically suffered mini-crashes
- The latest one triggered a Panic Breadth reading that exceeds all others
- Based on those readings and a significant regulatory change, investors have a tenuous reason to expect a post-holiday rebound
Chinese stocks trigger panic readings once again
Yet again, it has been a kind of torture for investors in Chinese stocks. At least now, they have a few days without new lows in many stocks and a weeklong holiday to take their minds off the losses.
And those losses have been widespread. Last week, three out of every four stocks in the Shanghai Composite index fell to at least a 52-week low. That's an insanely large number that has been matched only twice, both during the financial crisis meltdown.
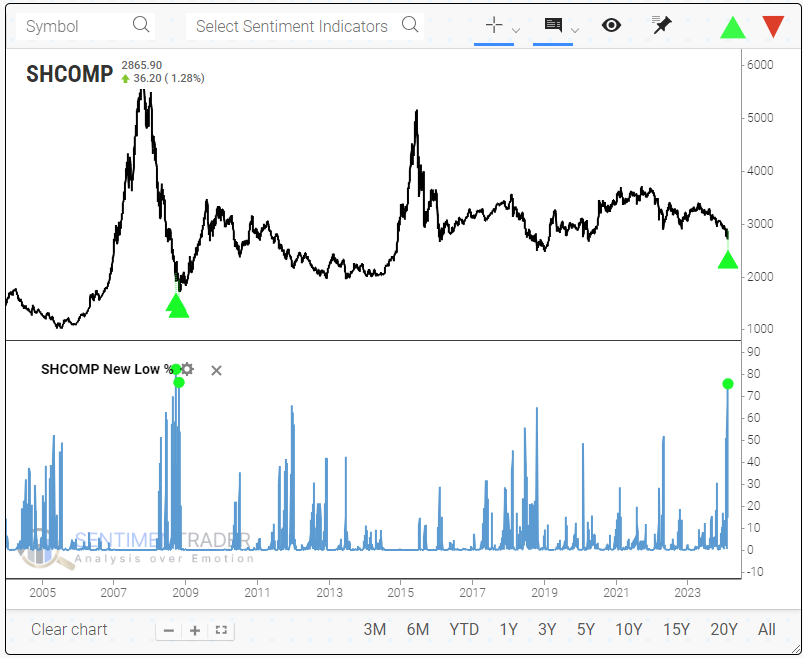
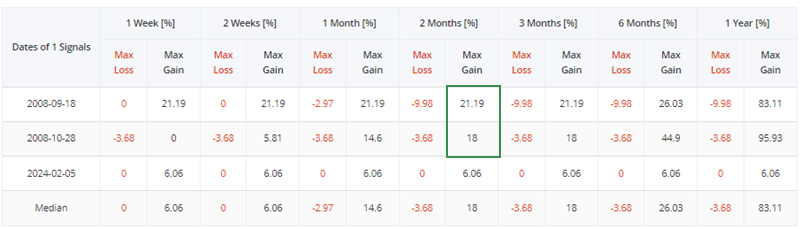
In the few days since the extreme was reached, the Shanghai rebounded a litte more than 6%. But the new Backtest Engine shows that the maximum gain after the other two signals was at least +18% within the next two months.
The number of stocks falling to 52-week lows is a good but incomplete picture of the selling pressure underlying an exchange or index. Let's revisit the Panic Breadth Composite we've discussed many times over the year to get a more complete view. It aggregates breadth measures to determine the level of selling pressure across time frames.
For the Shanghai, this Panic Breadth Composite just hit a record high.
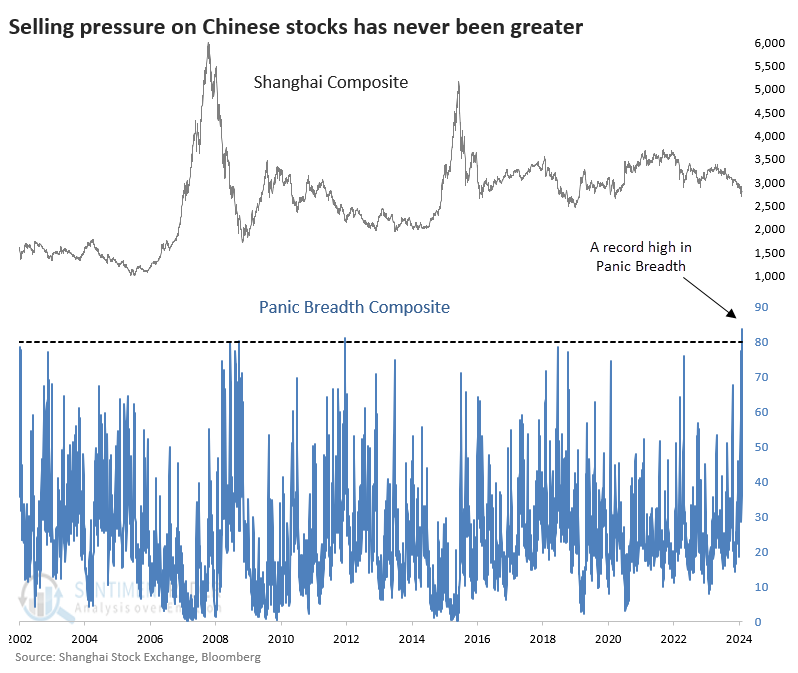
True panic has rewarded brave (?) investors
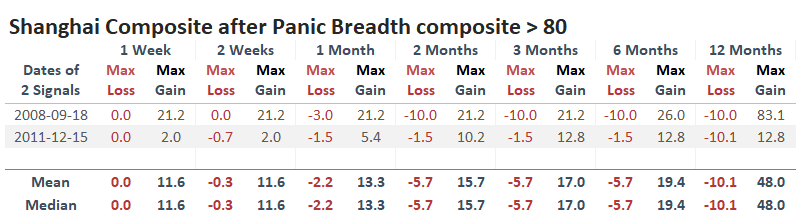
The table below shows the only two other times it exceeded 80. Both preceded highly volatile conditions and limited risk relative to the reward of gains across most time frames.
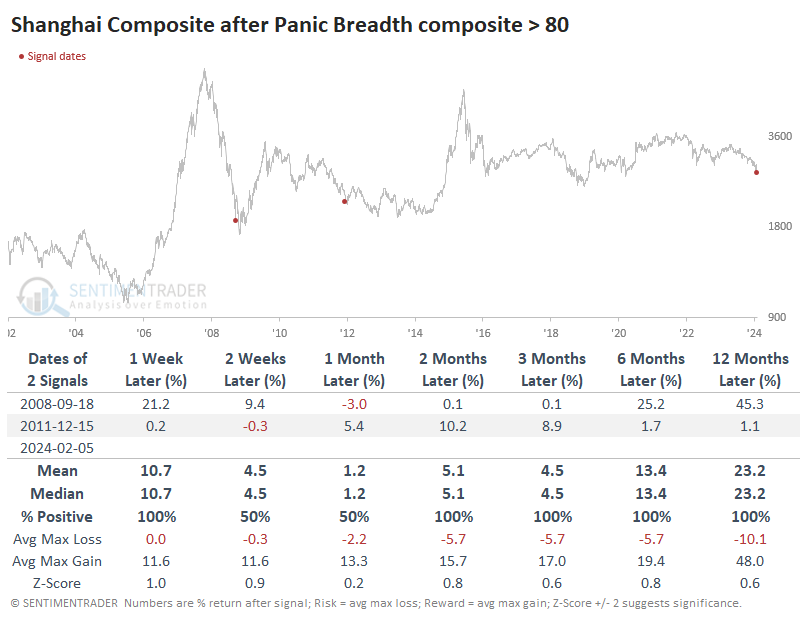
The table of maximum gains and losses shows that neither signal saw losses much beyond -10% at any point within the next year, while the maximum gains tended to exceed the losses by a wide margin.
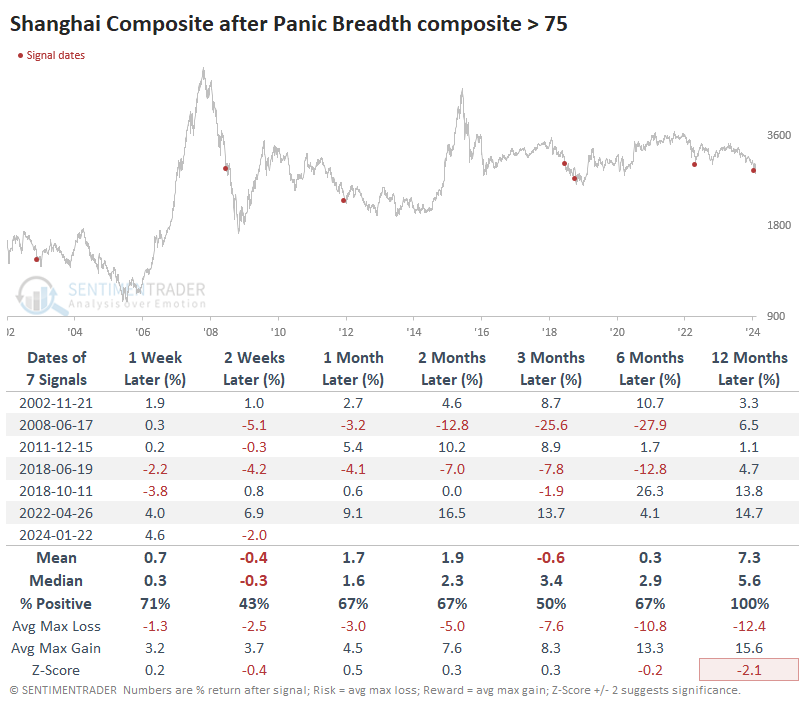
We still don't see many precedents if we relax the parameters to get a larger sample size. There were seven times when Panic Breadth exceeded 75, and returns following those were unimpressive, primarily thanks to a couple of them triggering about halfway through major declines. But we already know those are less applicable than the current scenario given the above.
Regulatory changes and potential flow impact
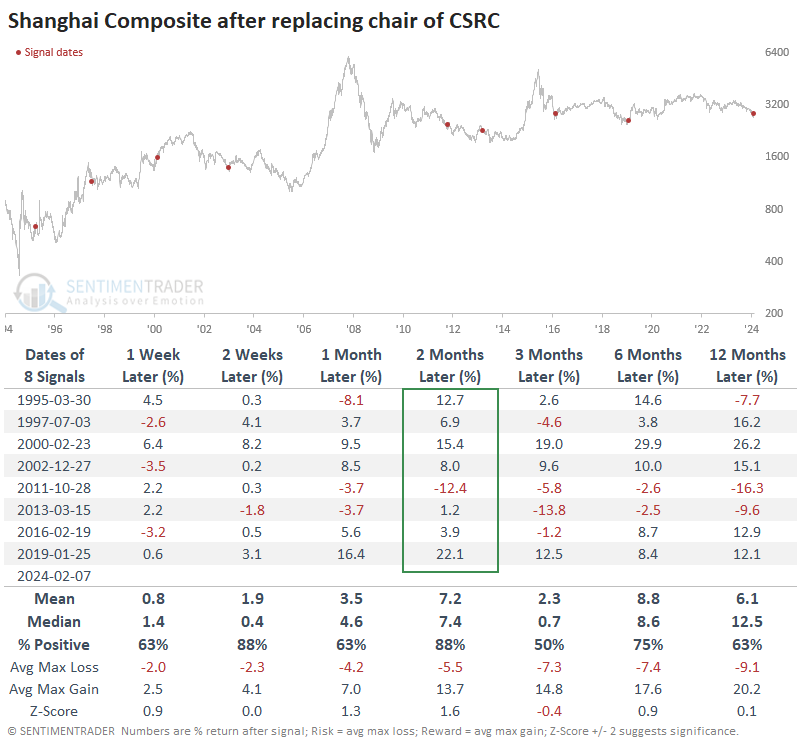
Another wrinkle is that the China Securities Regulatory Commission chairman was replaced just before the Lunar New Year holiday. While changes in the heads of regulatory commissions rarely get much broad-market attention in other markets, in China, they have tended to occur after major declines and before rallies.
The table below shows returns in the Shanghai Composite after the end of the terms of the chairmen of the CSRC. There was only one loss over the next two months, as the Shanghai showed a consistent tendency to rally in the belief of changes more favorable to investors.
To top off the worries, MSCI is removing many Chinese stocks from their indexes, which can potentially add even more selling pressure to Chinese shares. Per Bloomberg:
MSCI Inc. is cutting dozens of Chinese companies from its global benchmarks following a market rout that's erased trillions of dollars in value from the nation's stocks.
The index provider is removing 66 companies from its MSCI China Index in its latest quarterly review, the highest tally in at least two years. The changes, effective as of the close on Feb. 29, also apply to the MSCI All Country World Index. Stocks to be cut include property developers Gemdale Corp. and Greentown China Holdings Ltd., as well as China Southern Airlines Co. and Ping An Healthcare and Technology Co.
The removals add to risks for China's already beaten-down market as index-hugging funds will have to purge these stocks from their portfolios.
What the article doesn't state is the performance of Chinese shares after other major changes in MSCI indexes. The only other time there was a net deletion of stocks was in the May 2022 rebalancing. The Shanghai Composite rallied 7.4% from then to the next rebalancing.
The dates following the top five net additions to MSCI indexes preceded losses four times, averaging -3.5%.
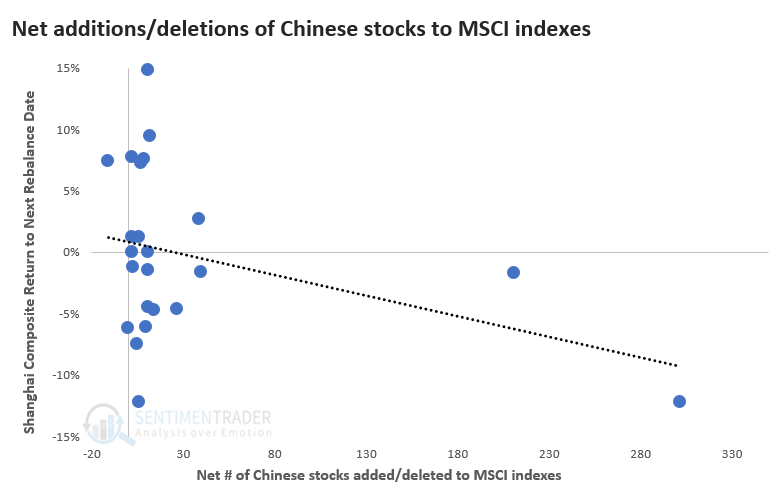
The latest announced deletion of stocks is the largest since MSCI added A shares in May 2018. There has been a modest negative correlation between how many net stocks MSCI adds/deletes from their indexes and the performance of the Shanghai Composite to the next rebalance date.
Indexers tend to be trend followers like most other investors.
What the research tells us...
We've said before that the Chinese stock market rivals that of gold miners for the ability to disappoint investors. The recent stretch has been no different, and sentiment towards the market is as bad as any market I've seen in nearly 25 years. Whether a regulatory change will make any long-term difference is debatable. What isn't up for debate is the devastation wreaked on these stocks over just about any time frame. By the time it has gotten this bad in the past, which is really only twice before, the stocks staged significant rallies over weeks or months. It will be interesting to see the reaction this time as markets reopen next week.
Indicators at Extremes
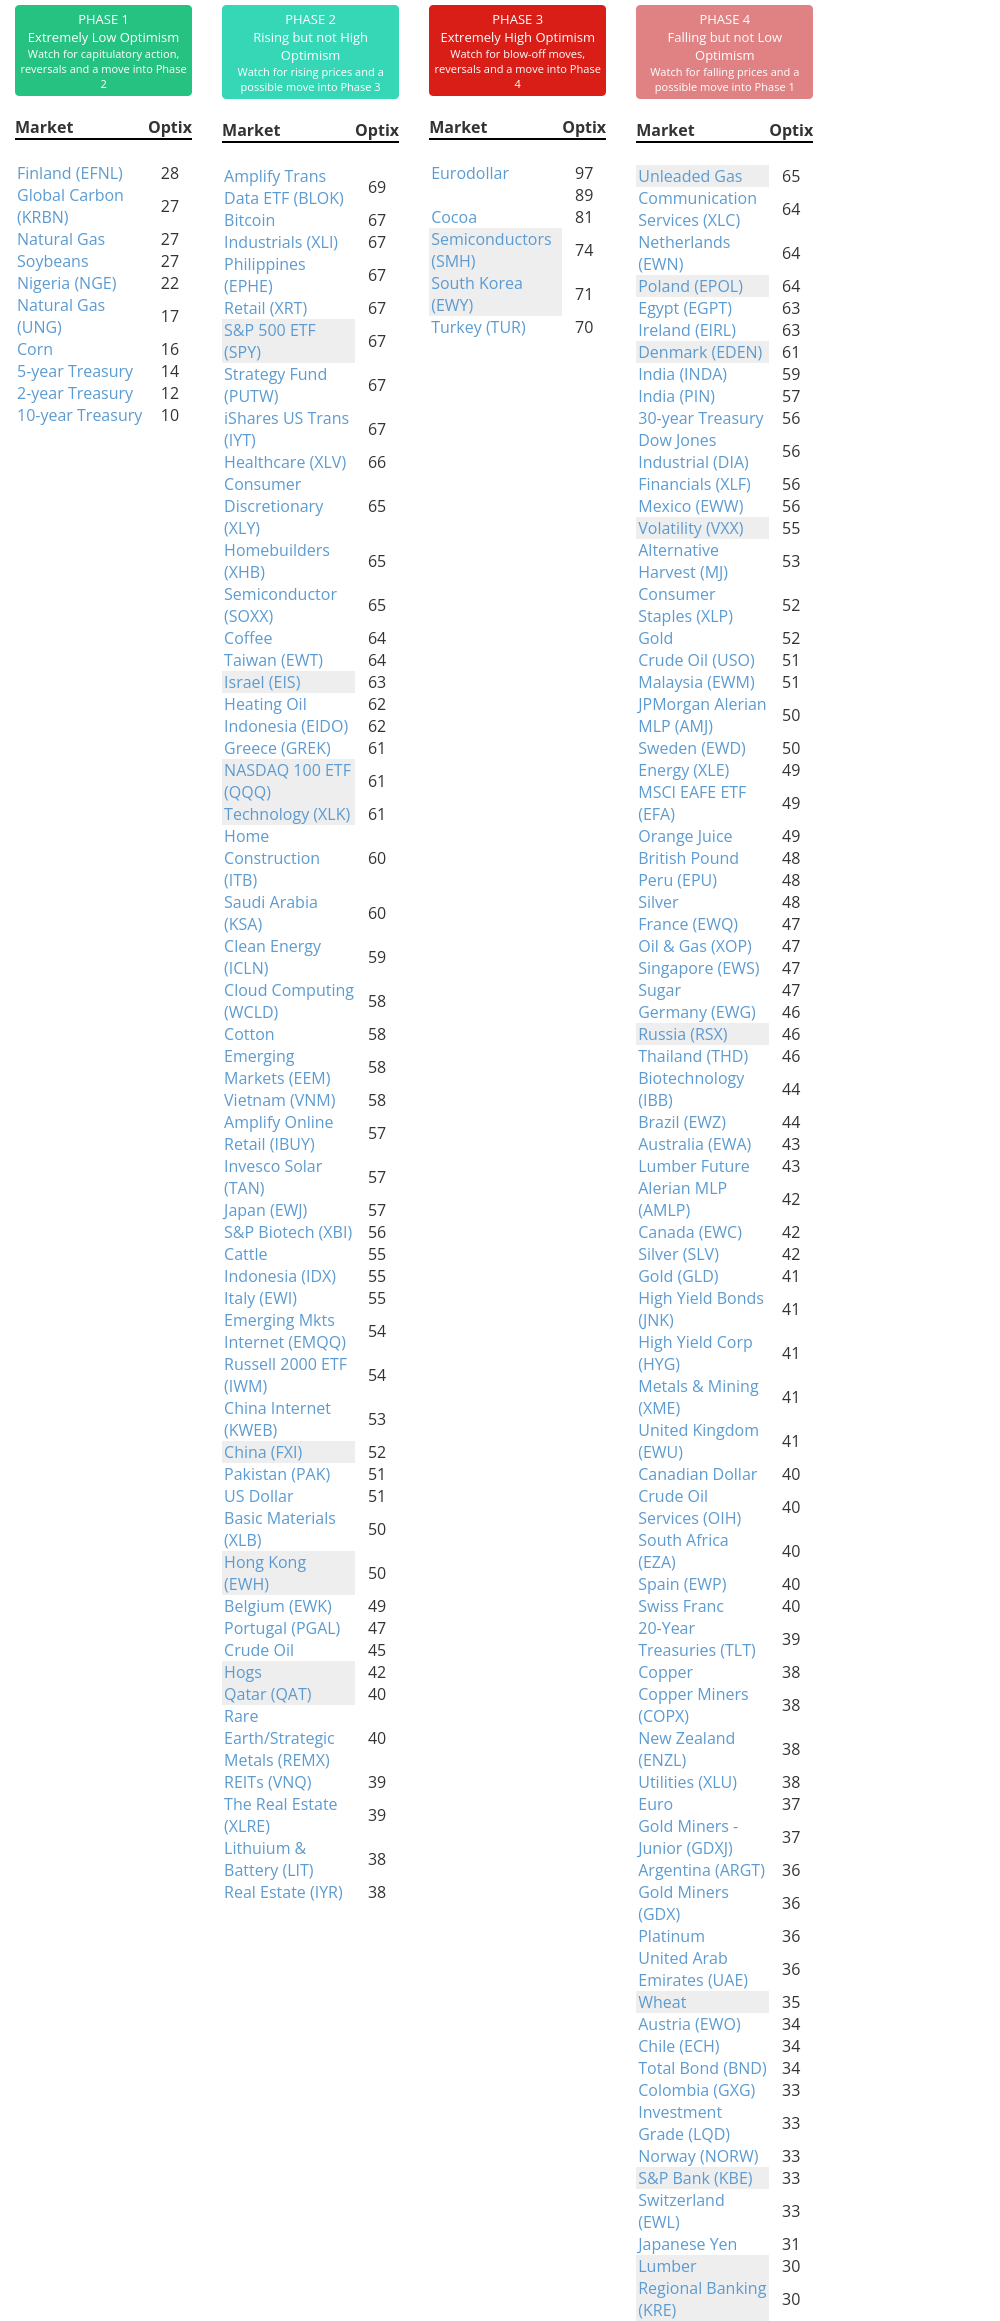
Phase Table
Ranks
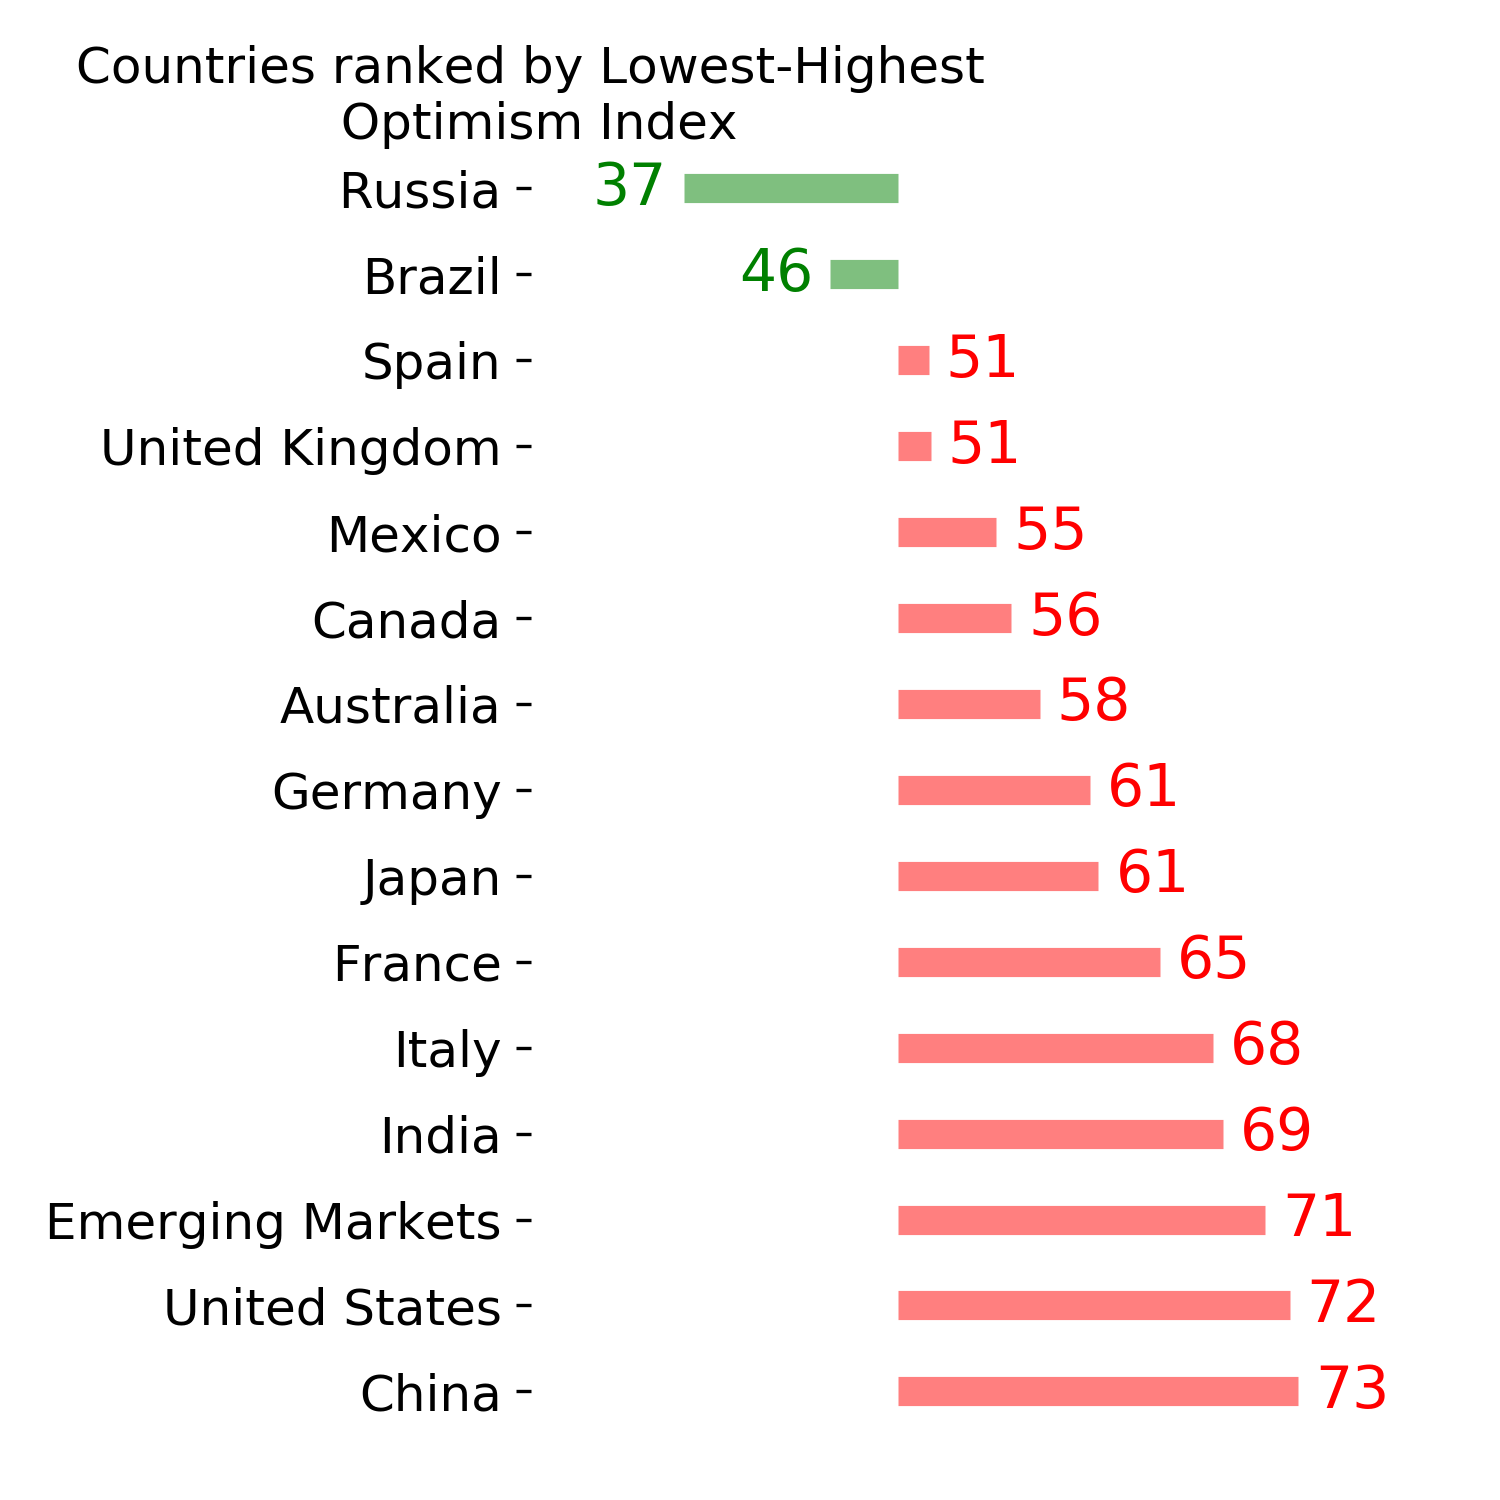
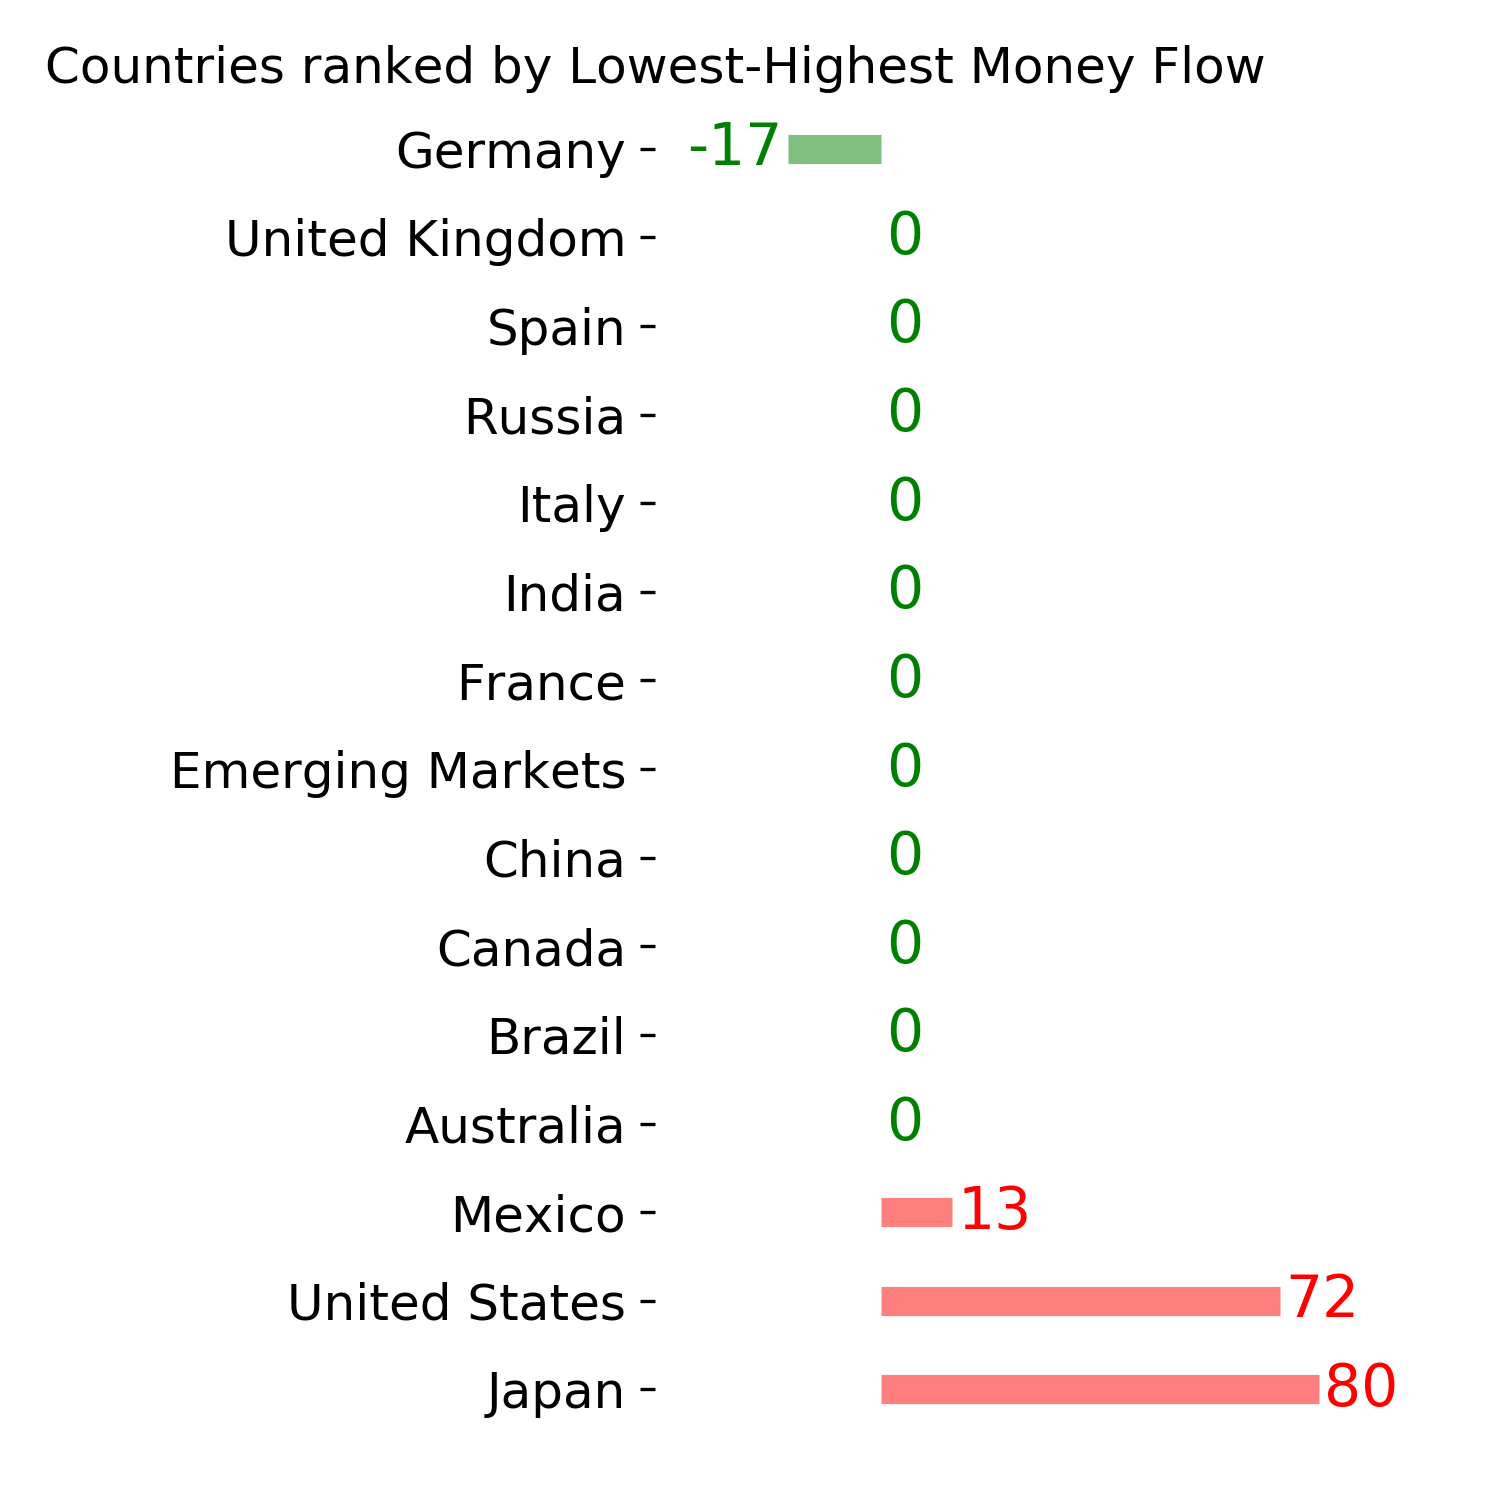
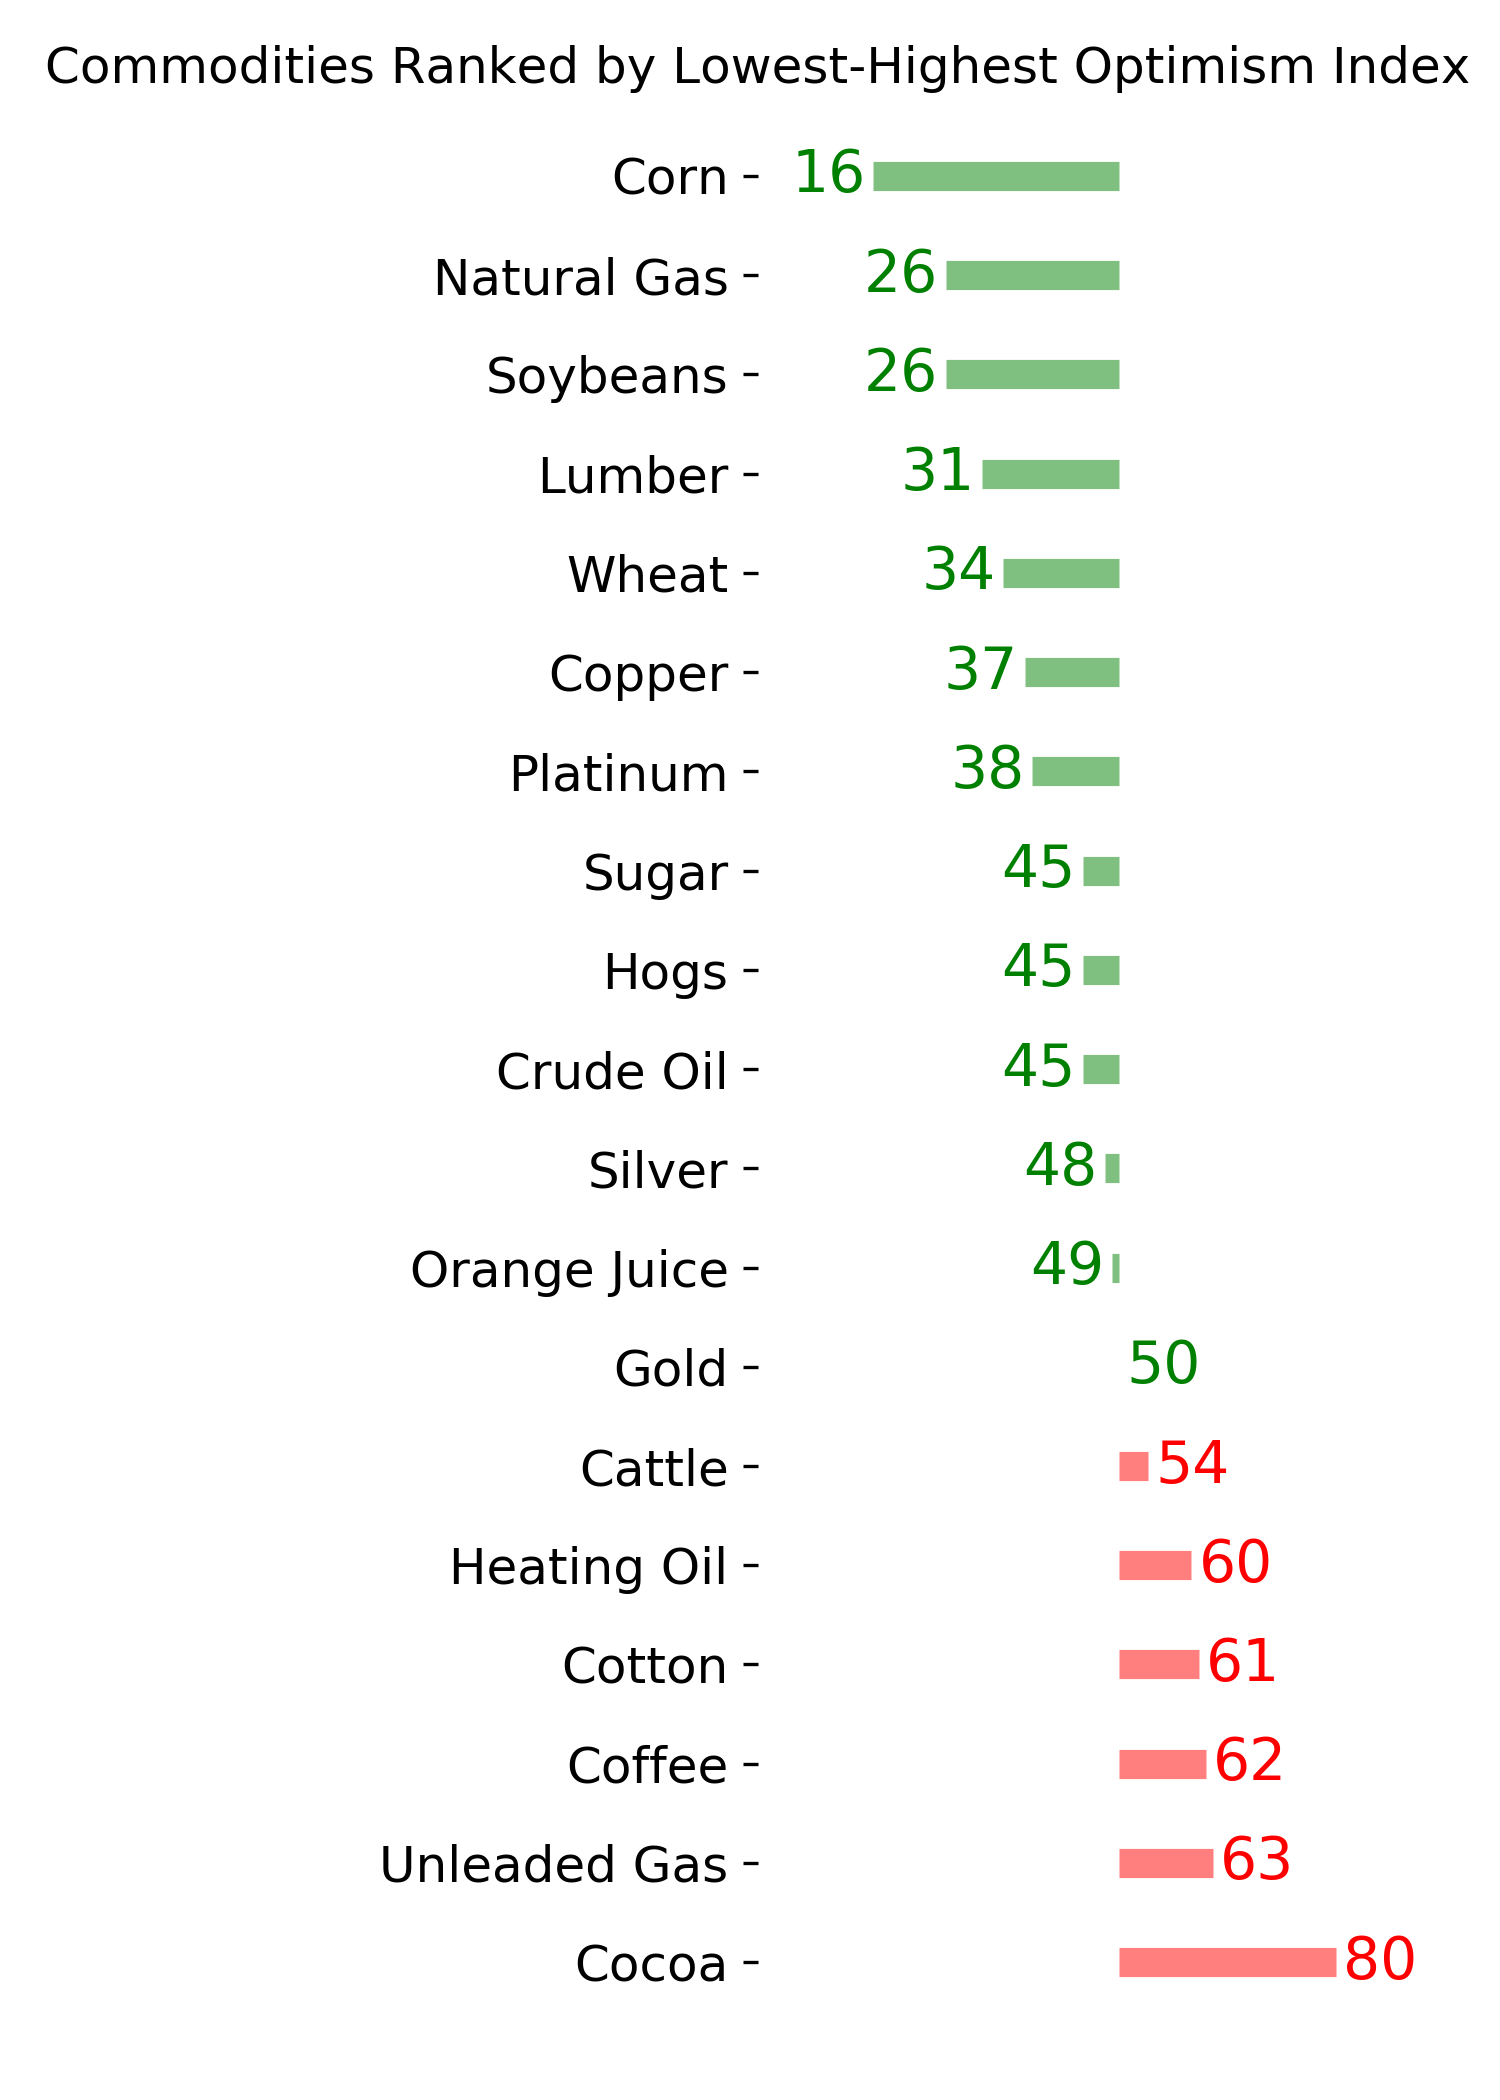
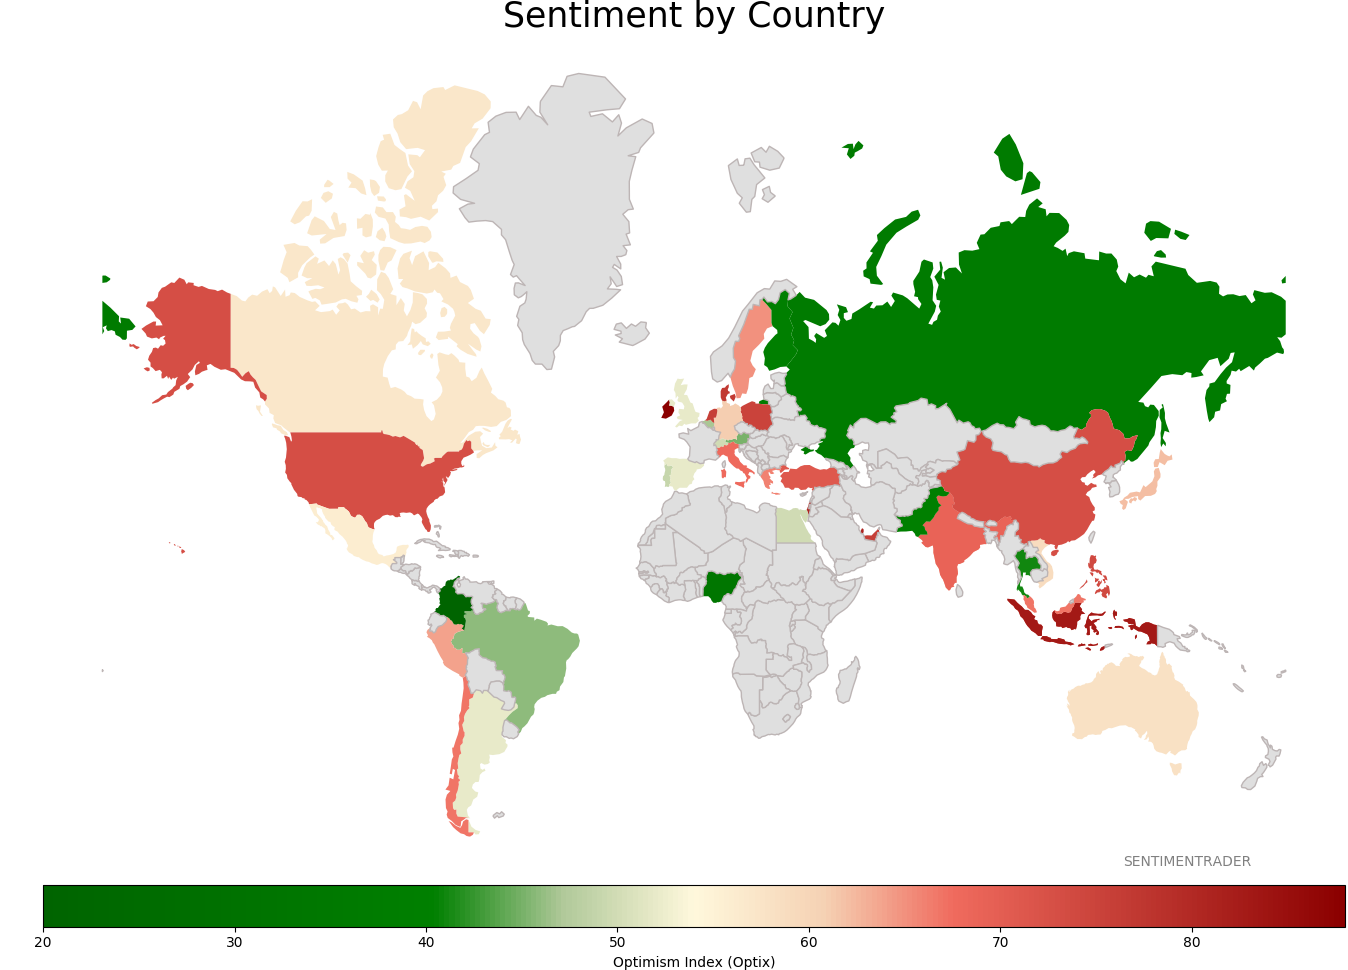
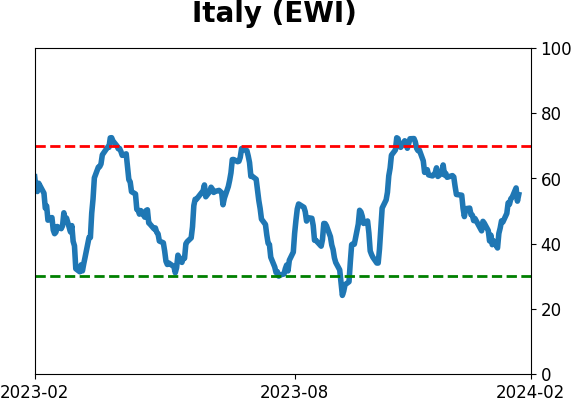
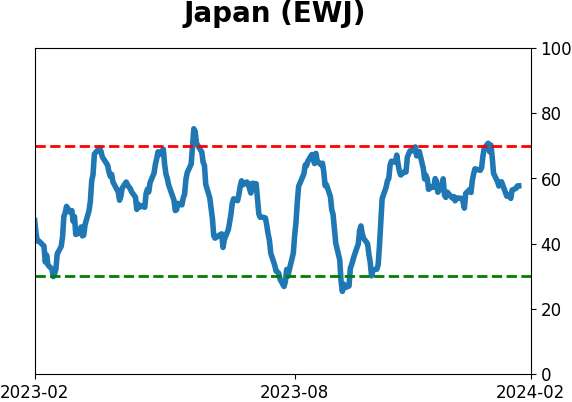
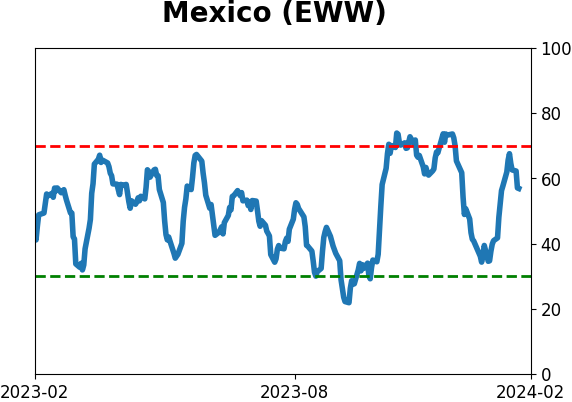
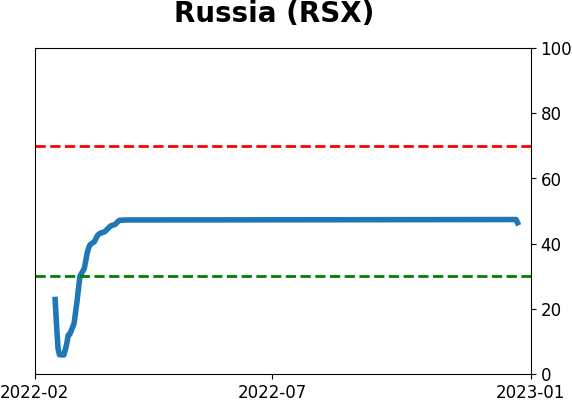
Sentiment Around The World
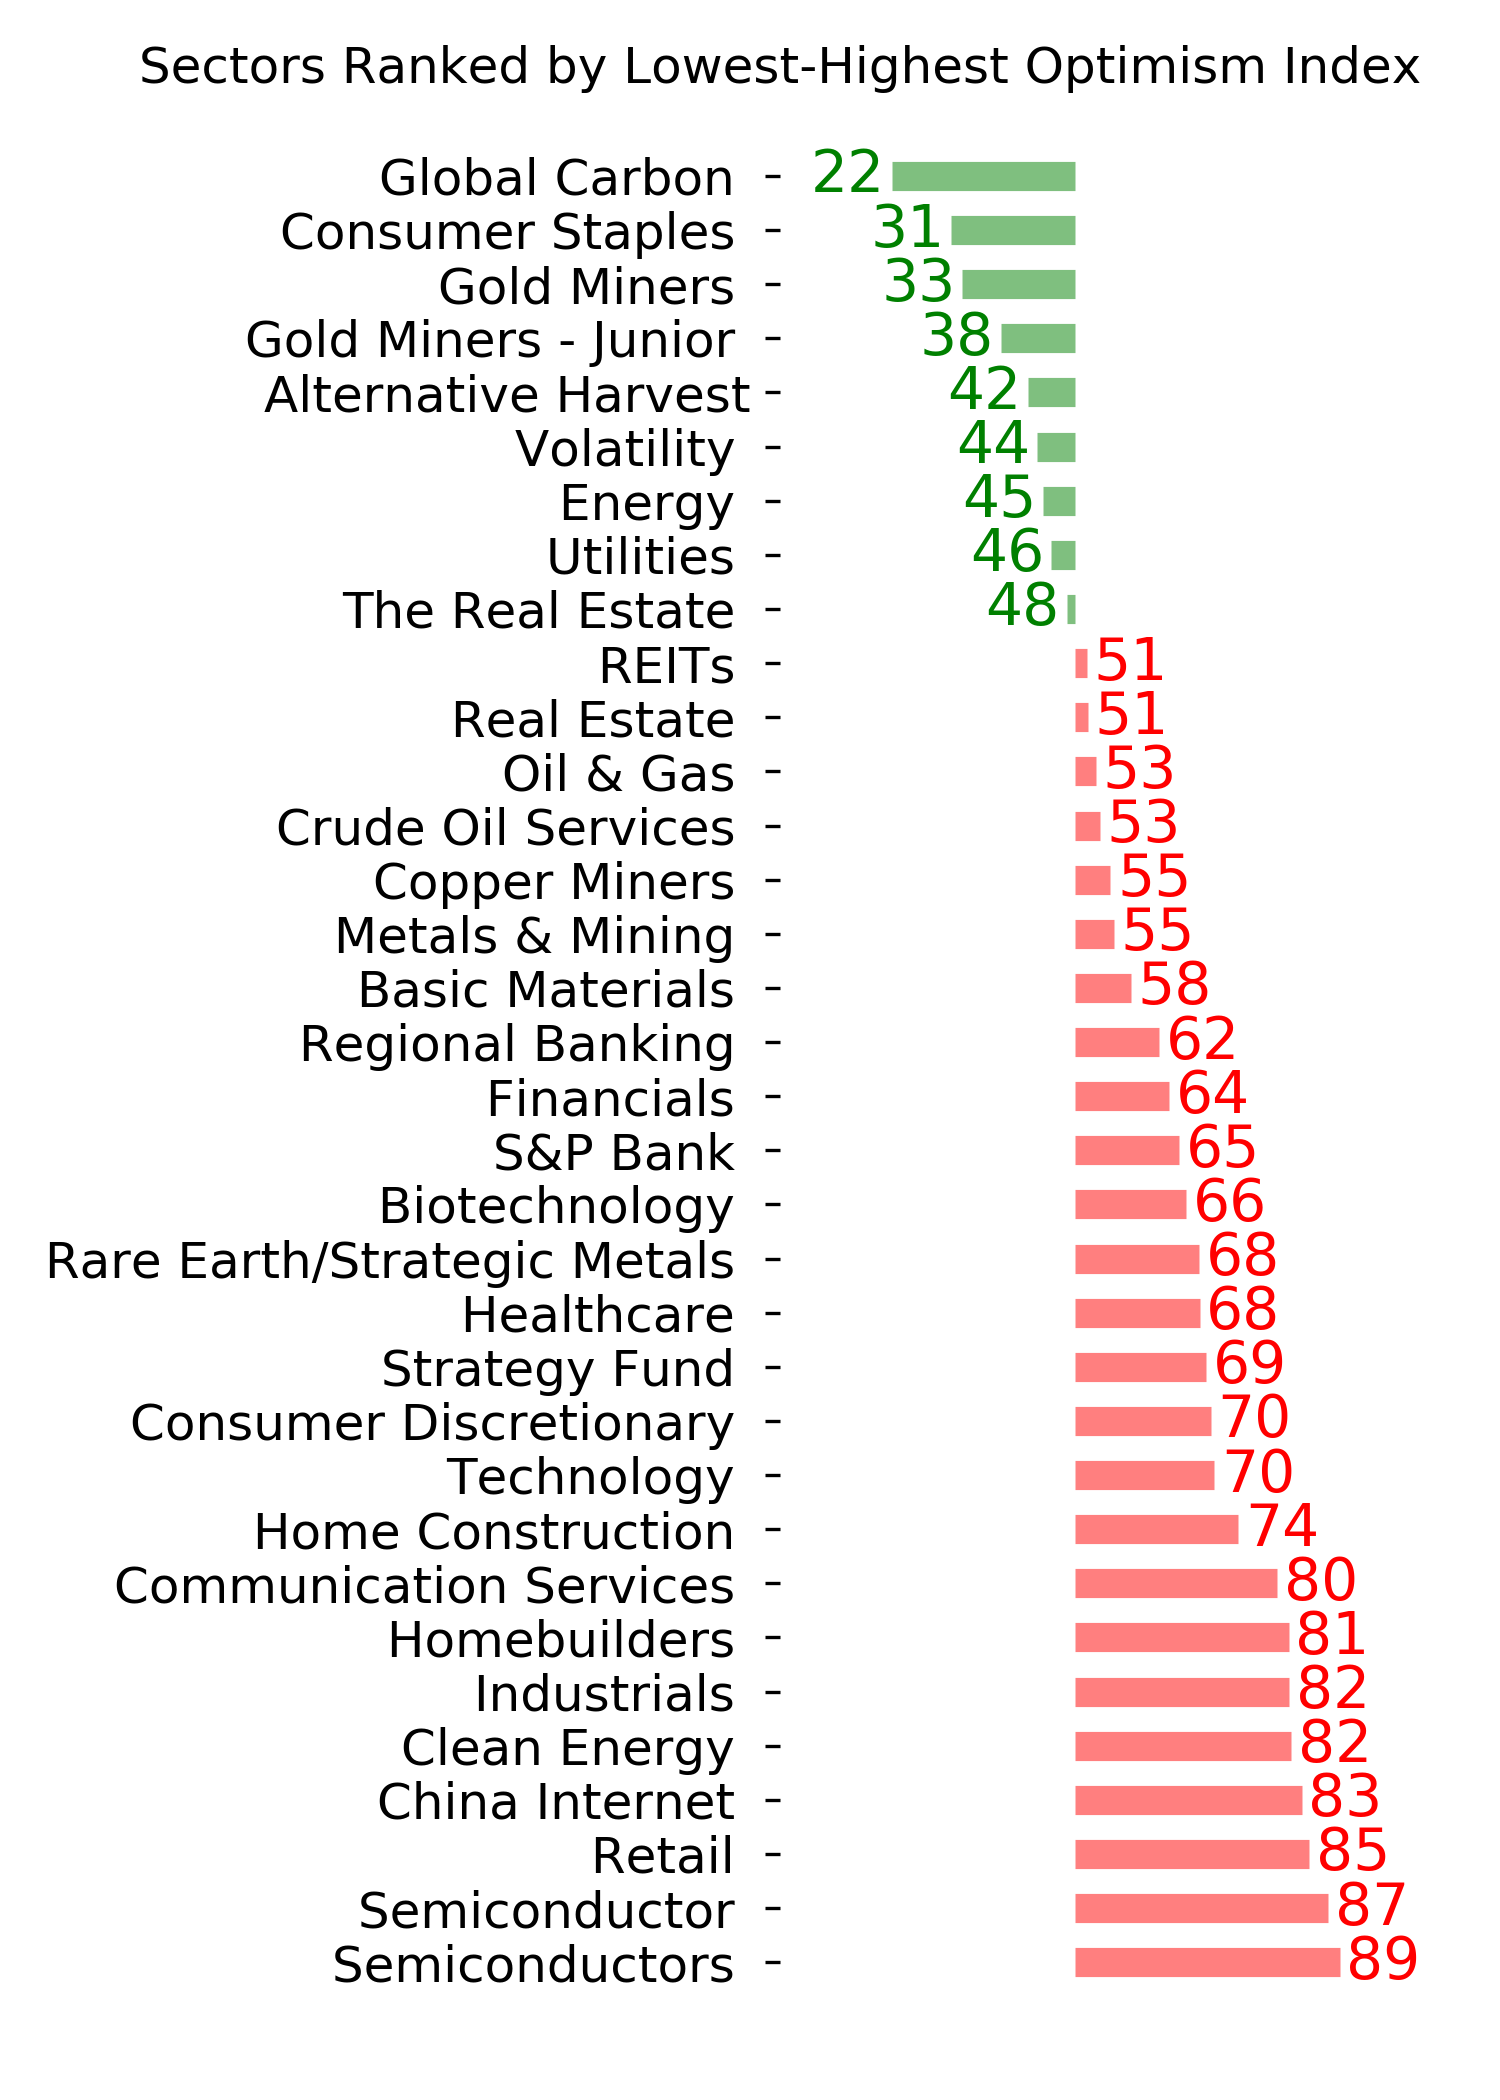
Optimism Index Thumbnails
|
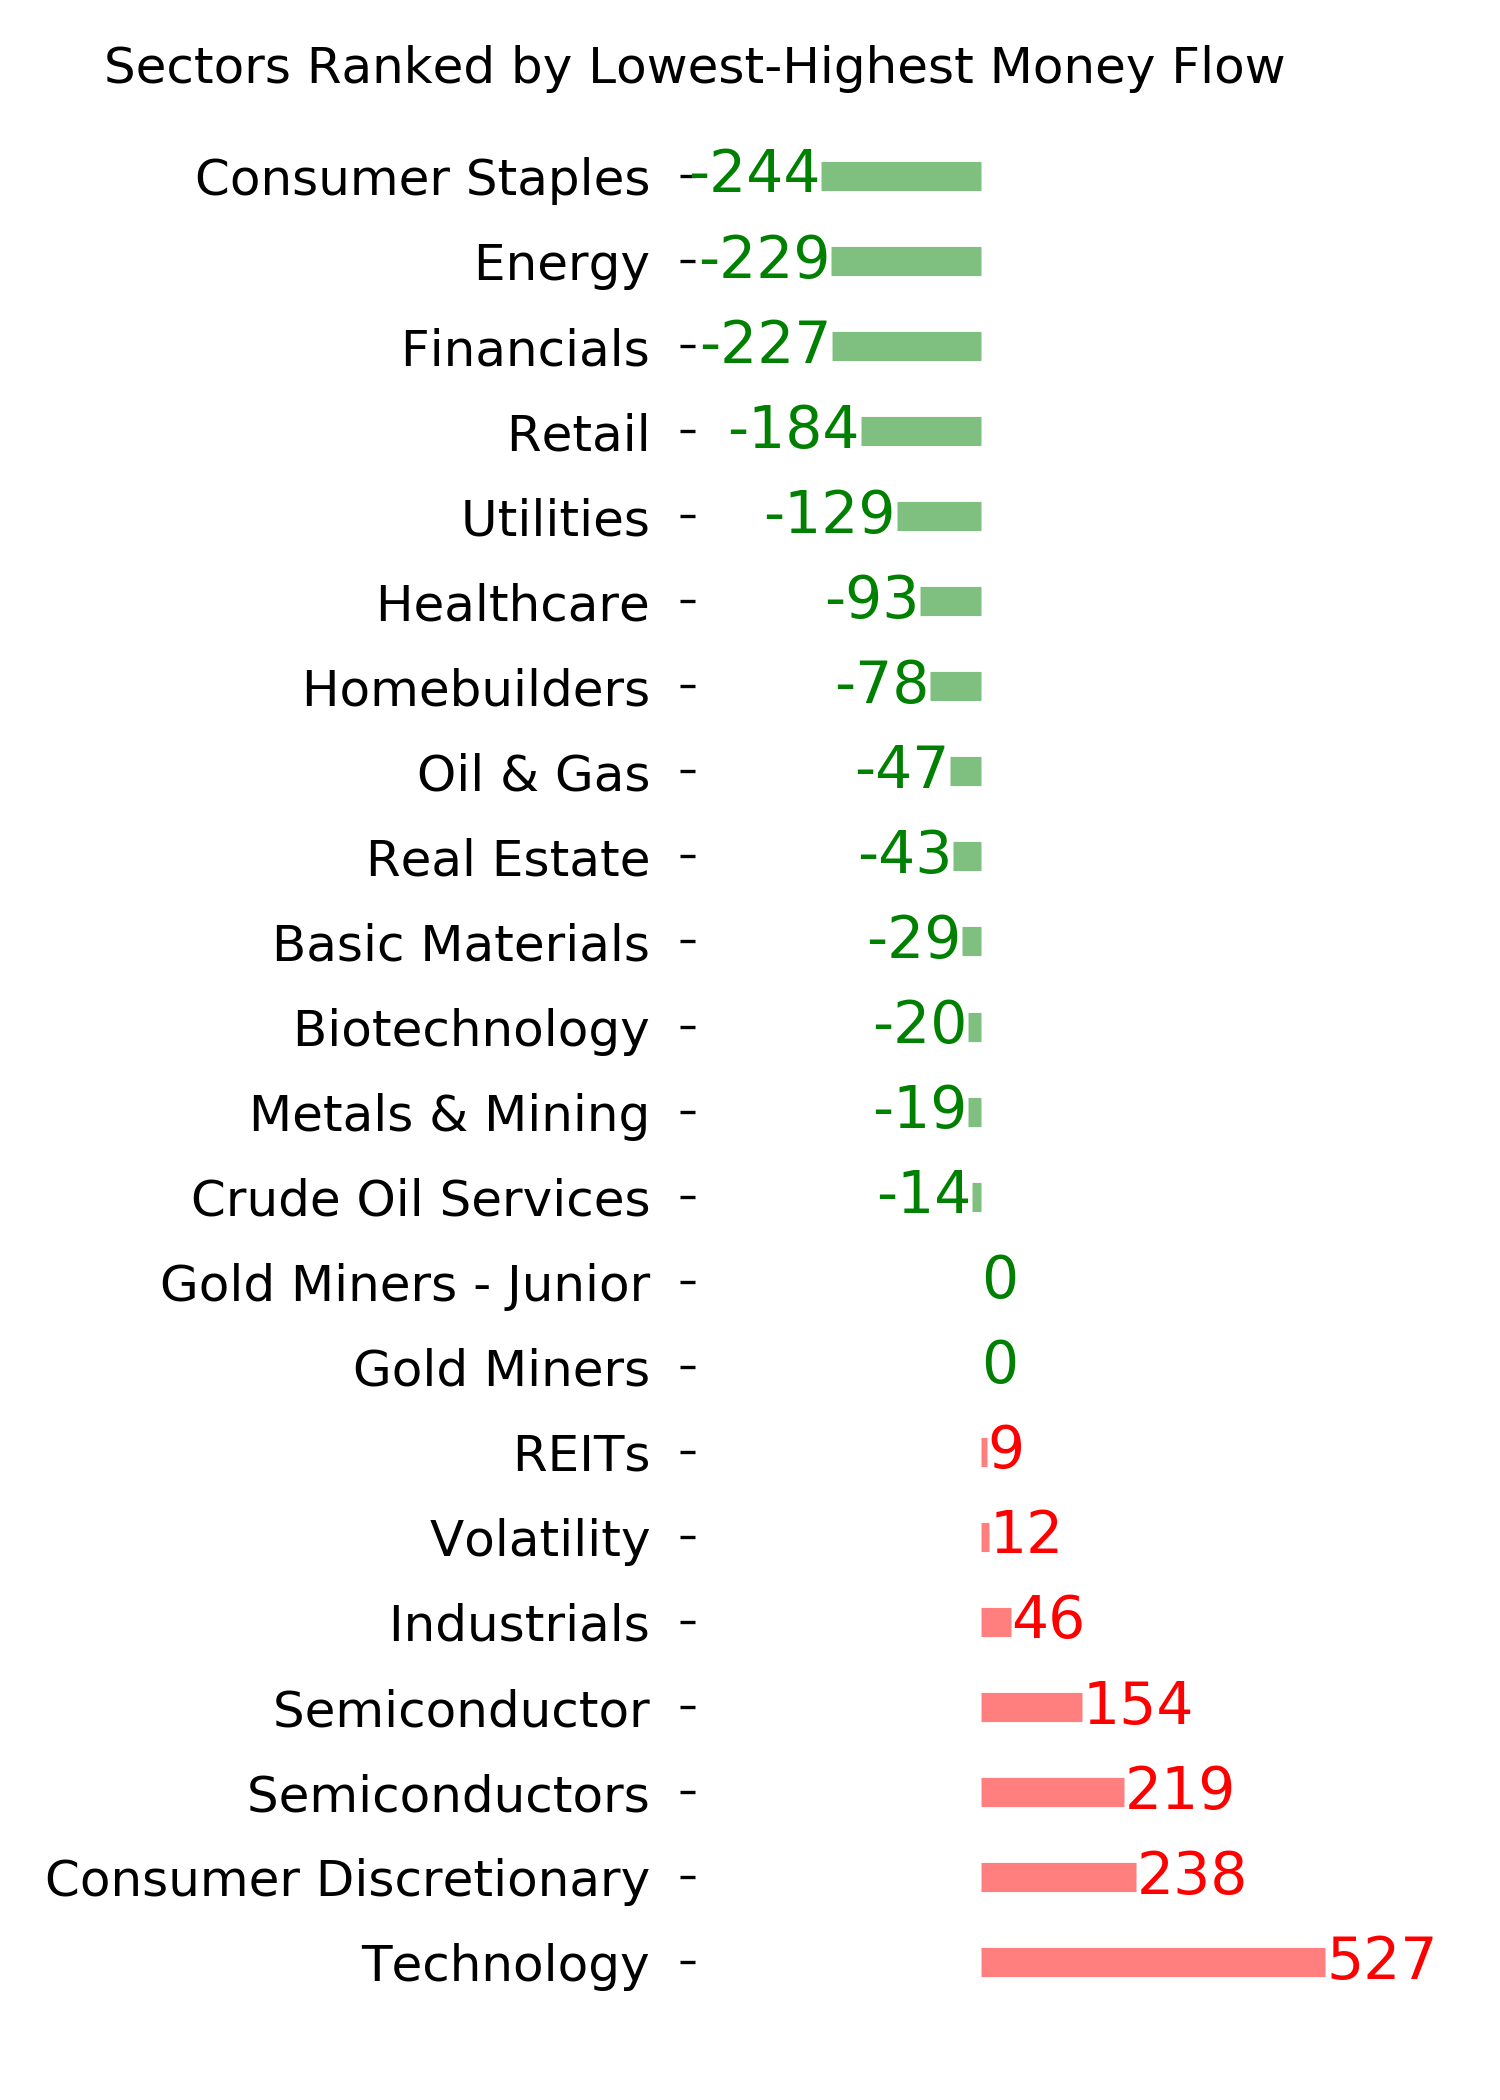
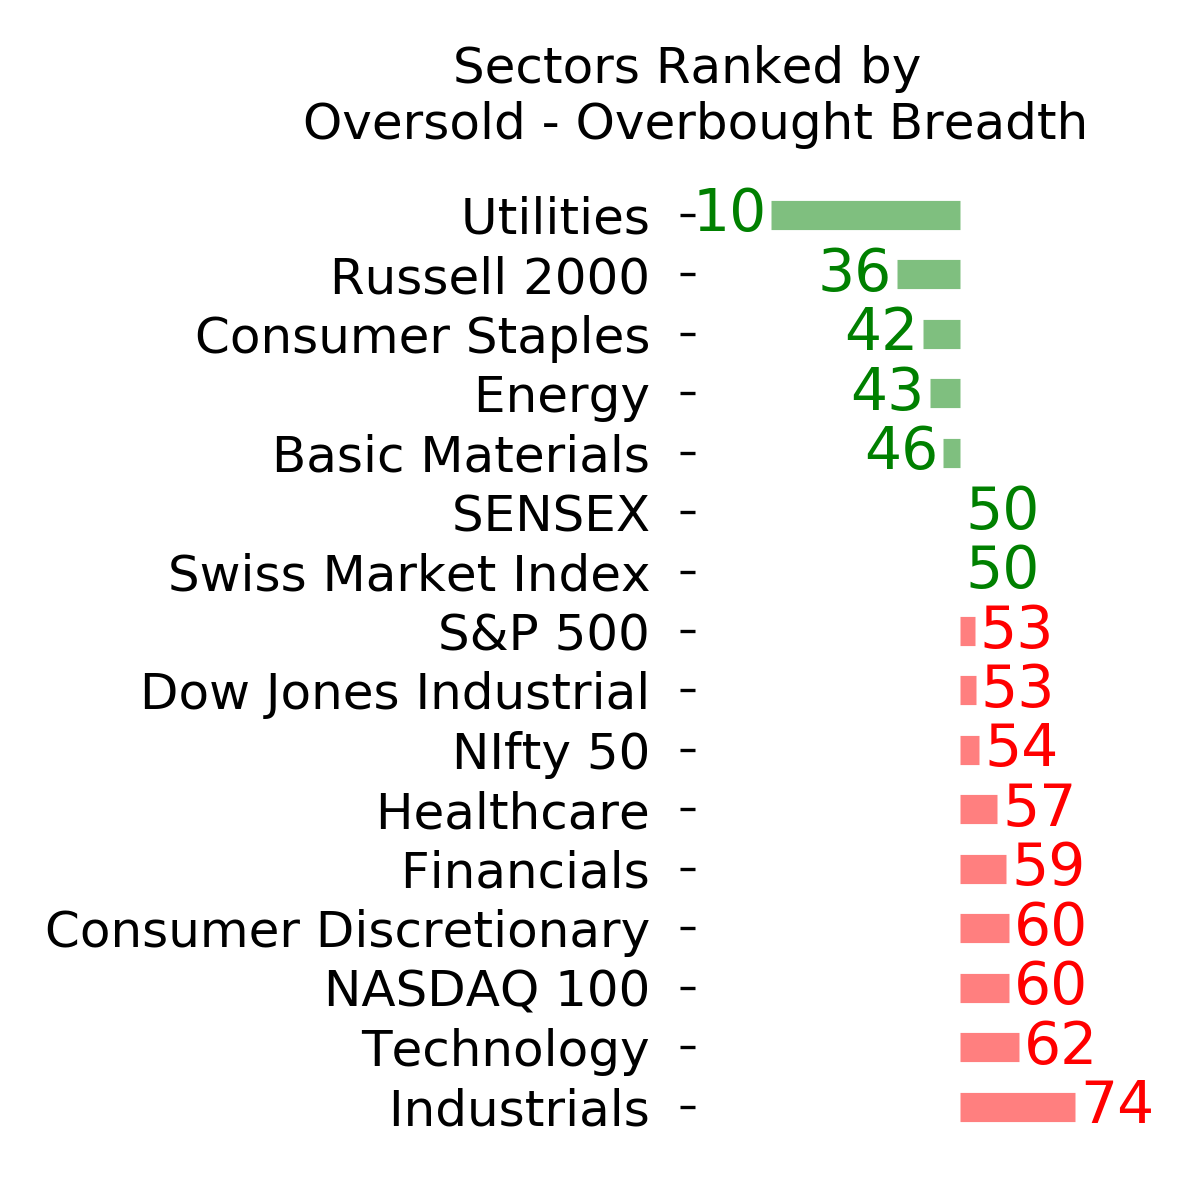
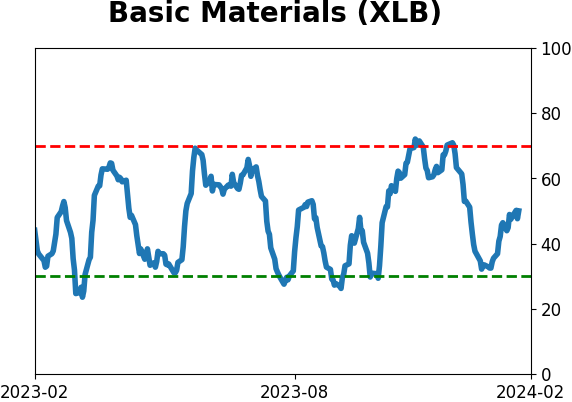
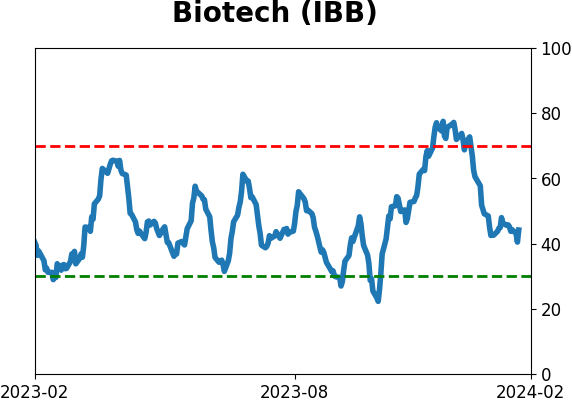
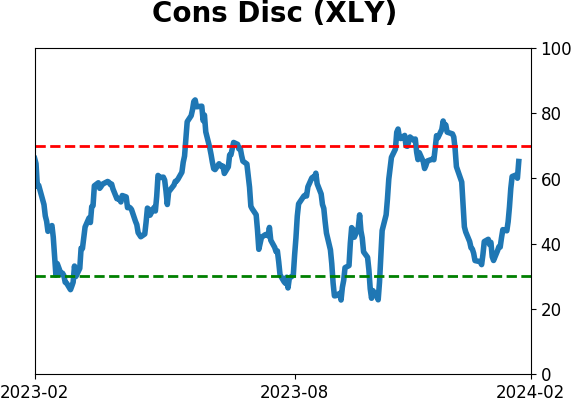
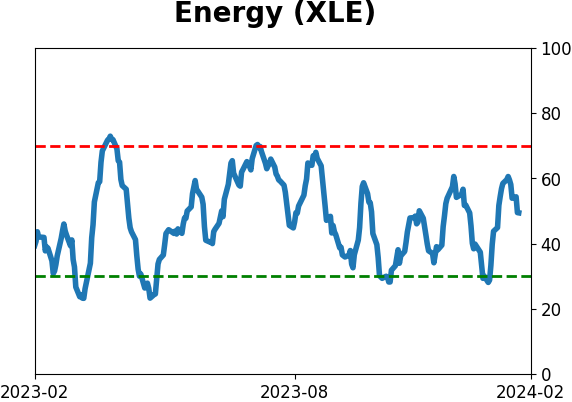
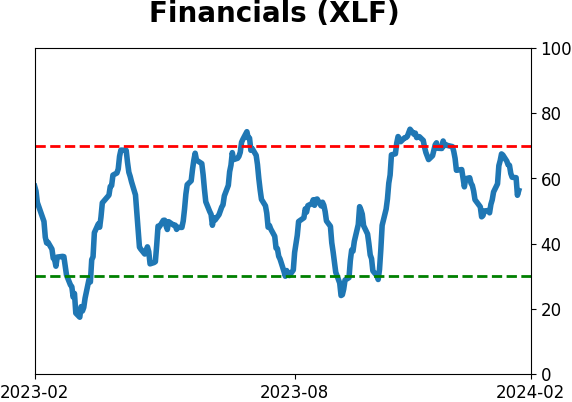
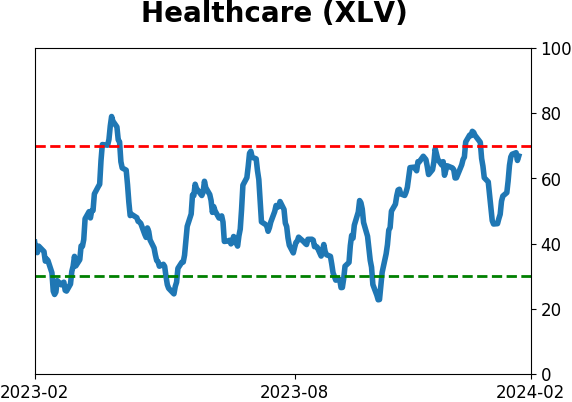
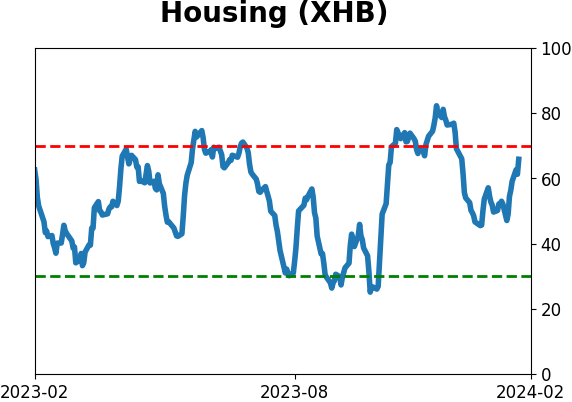
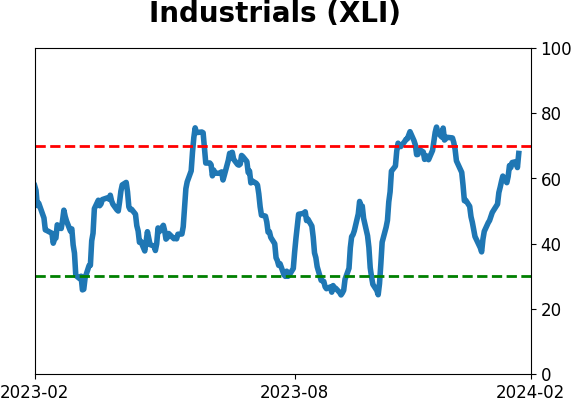
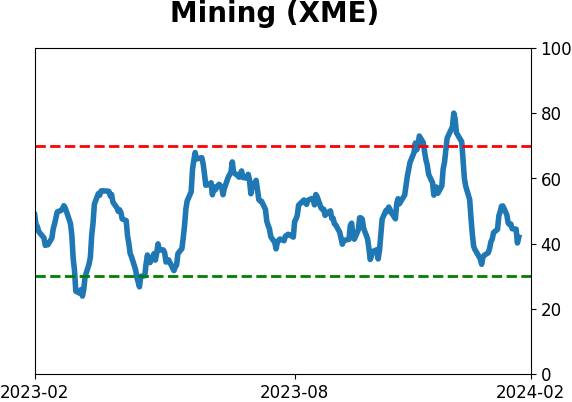
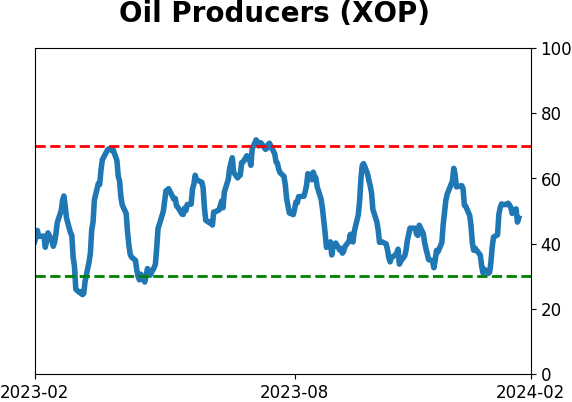
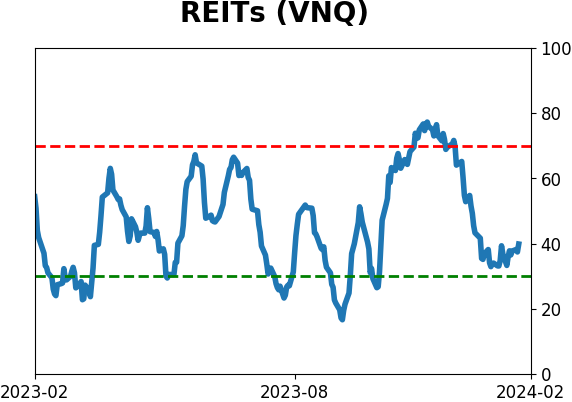
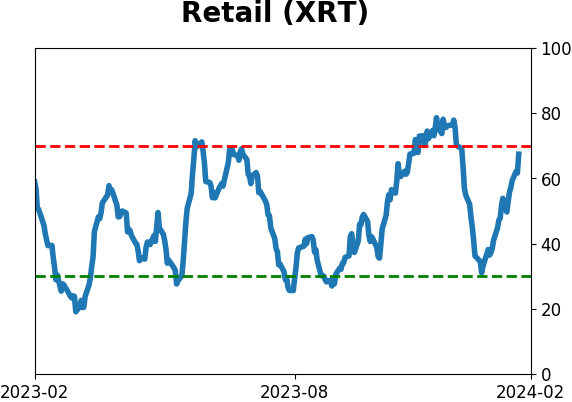
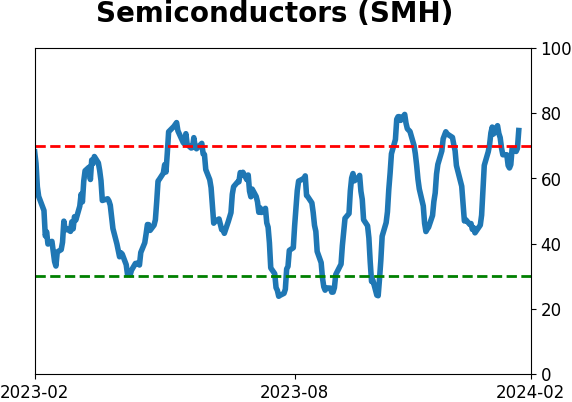
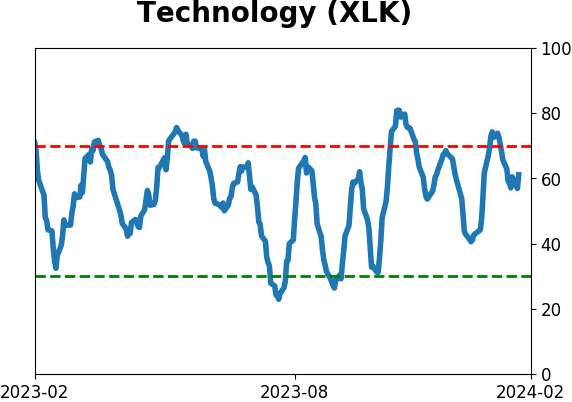
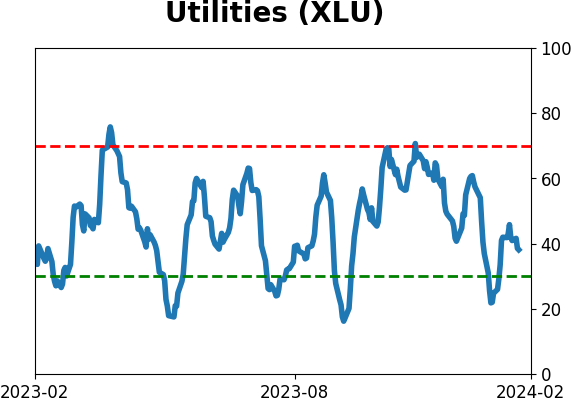
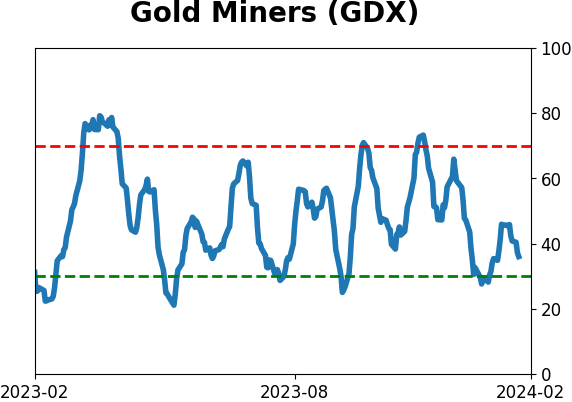
Sector ETF's - 10-Day Moving Average
|
|
|
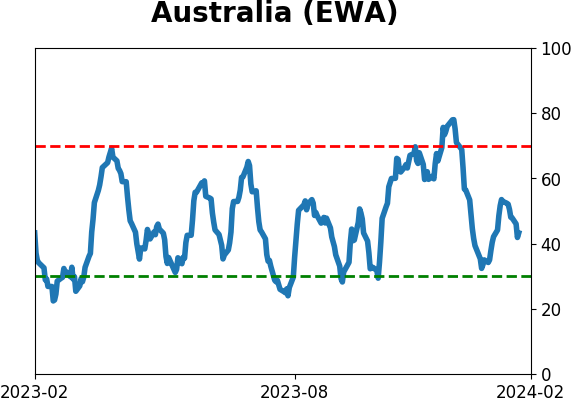
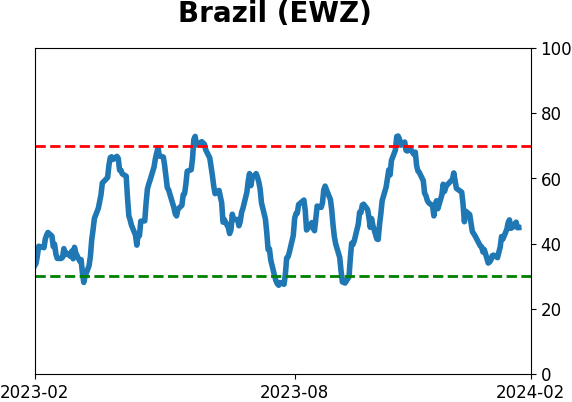
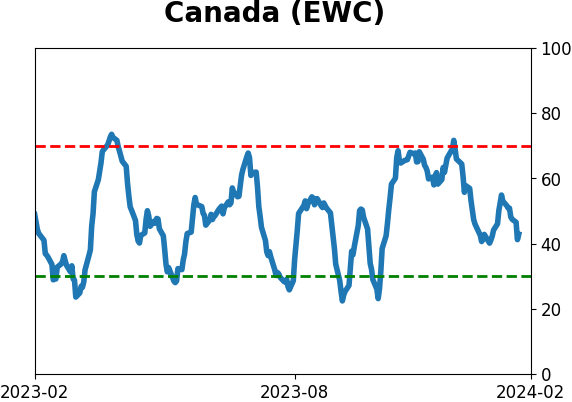
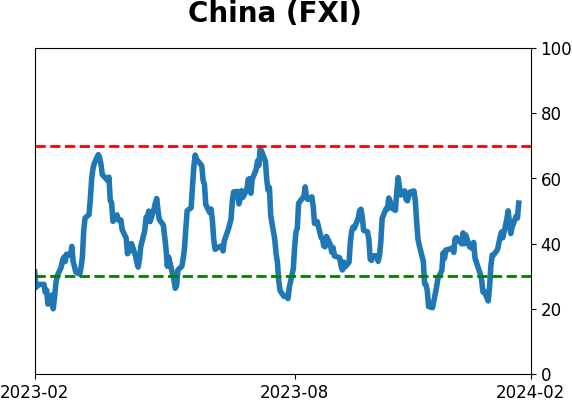
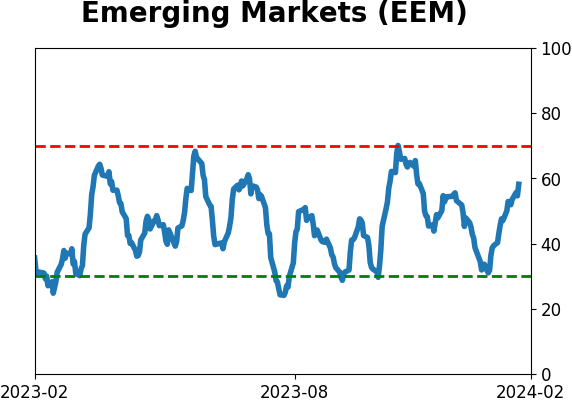
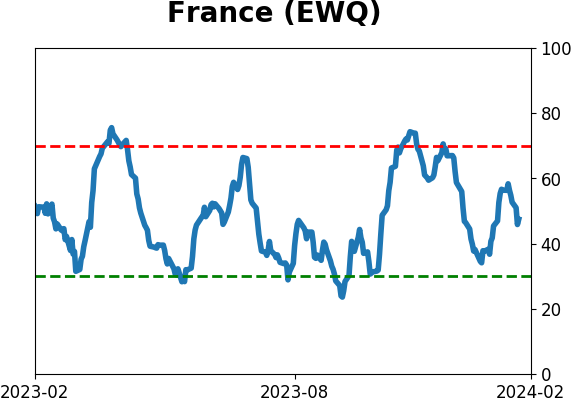
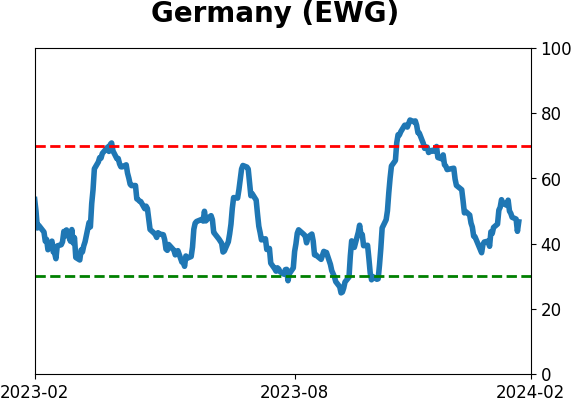
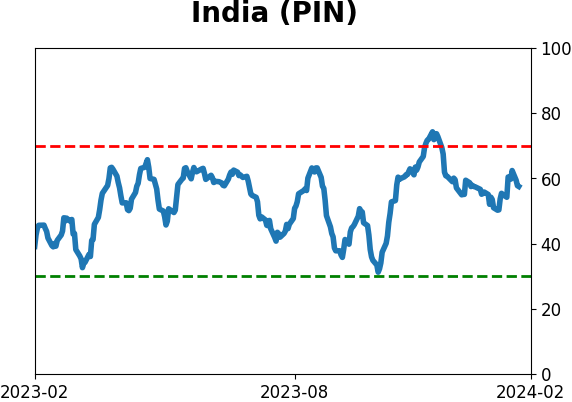
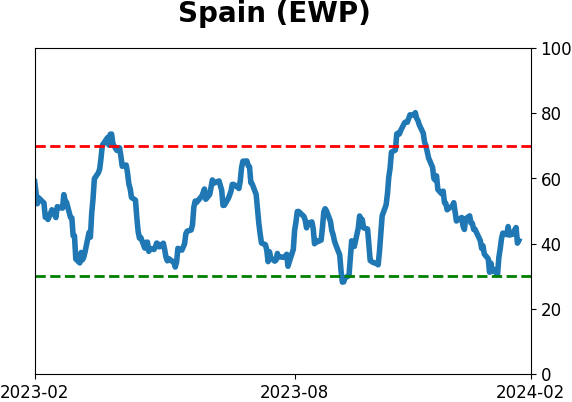
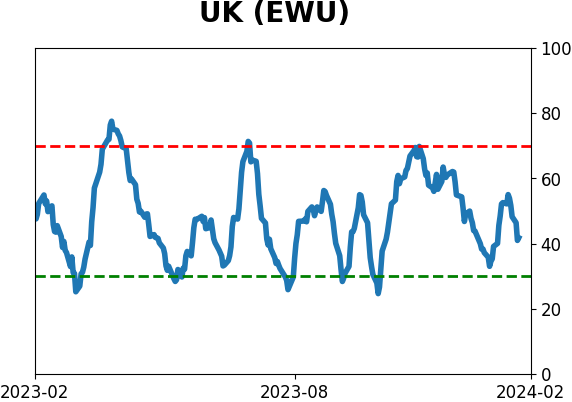
Country ETF's - 10-Day Moving Average
|
|
|
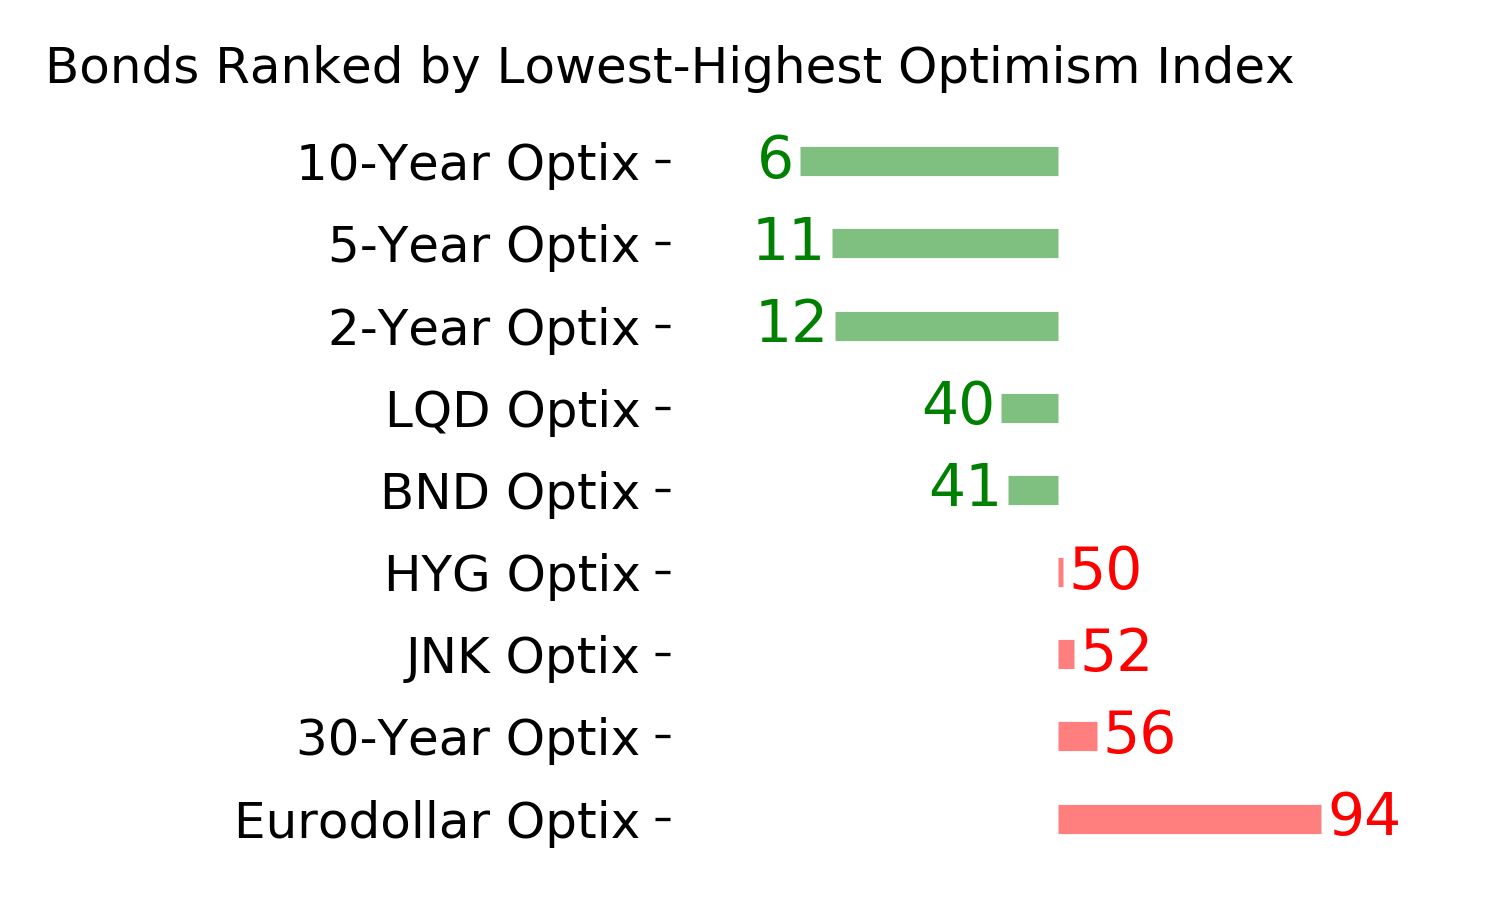
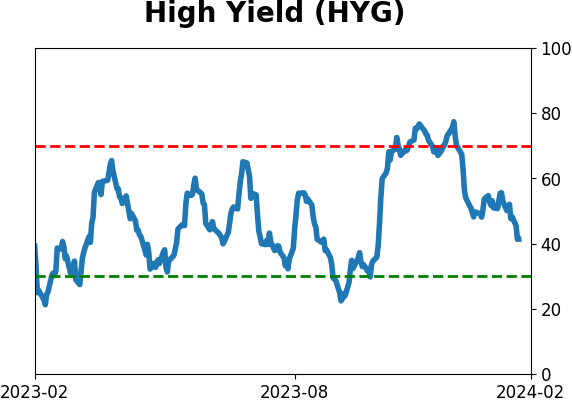
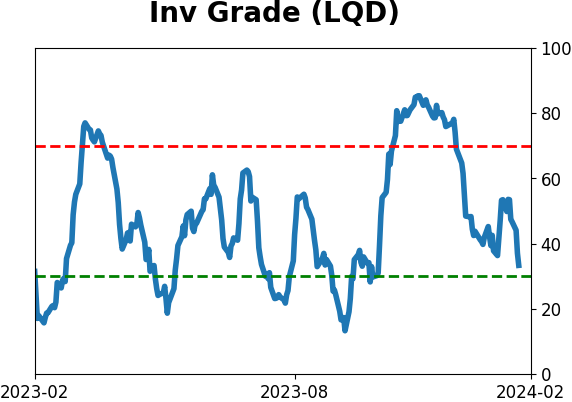
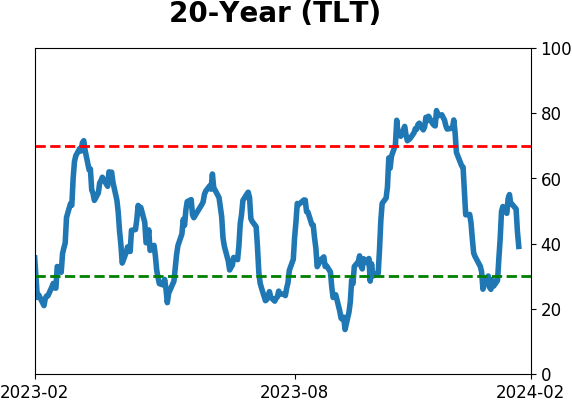
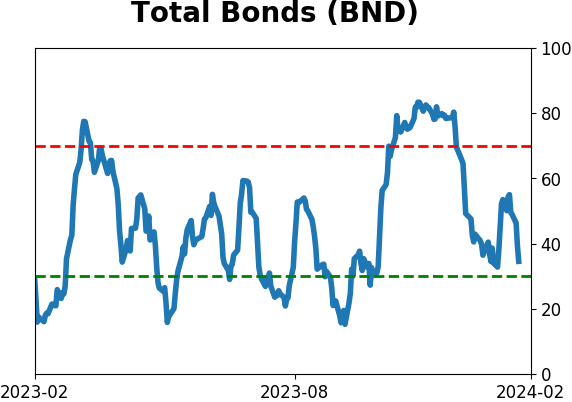
Bond ETF's - 10-Day Moving Average
|
|
|
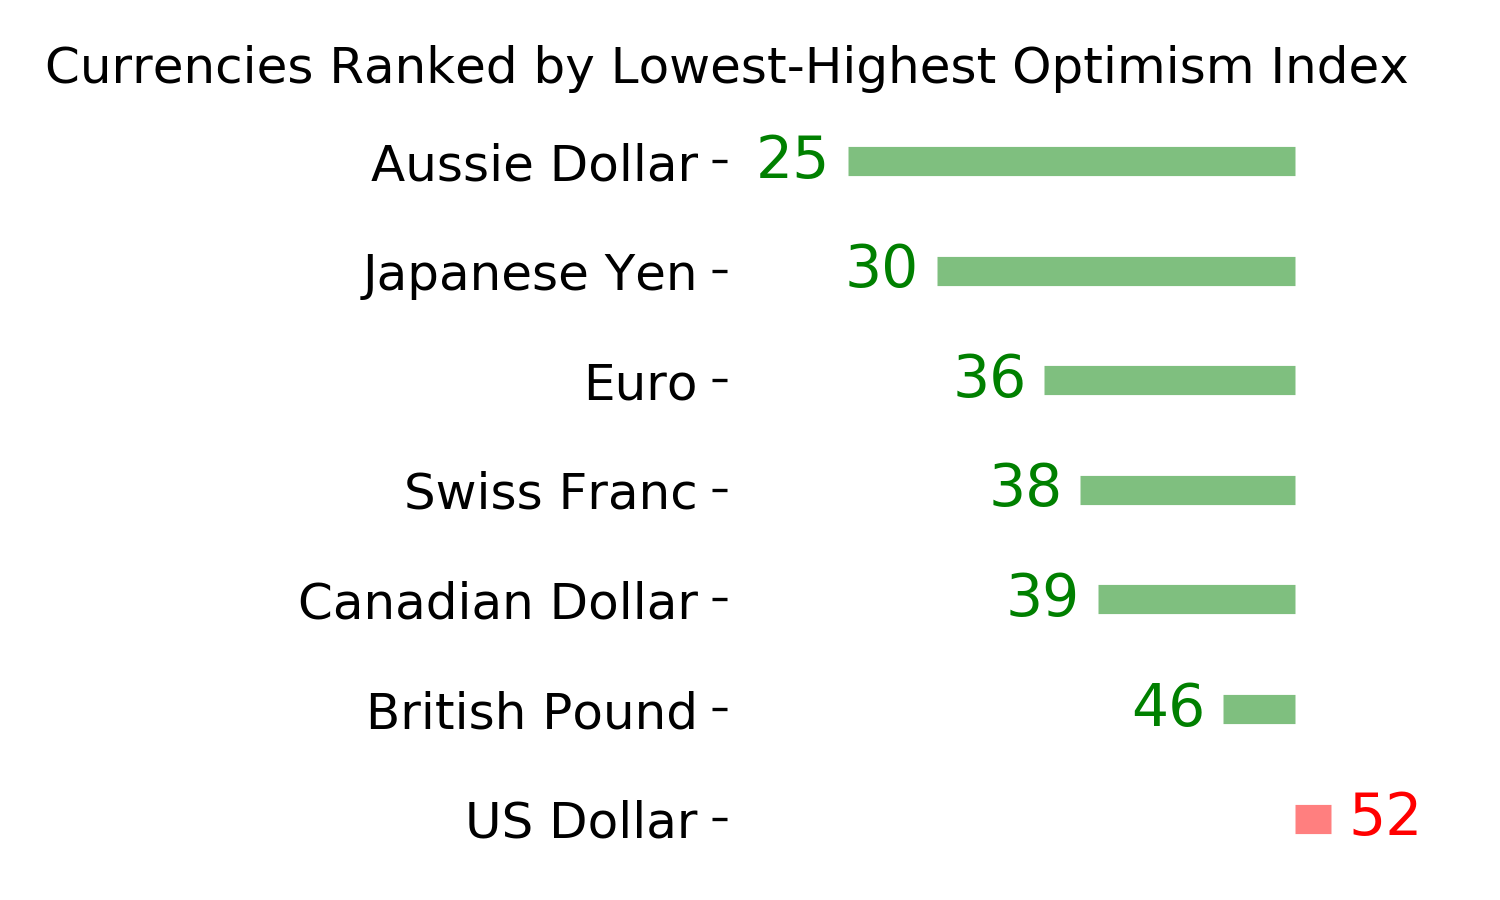
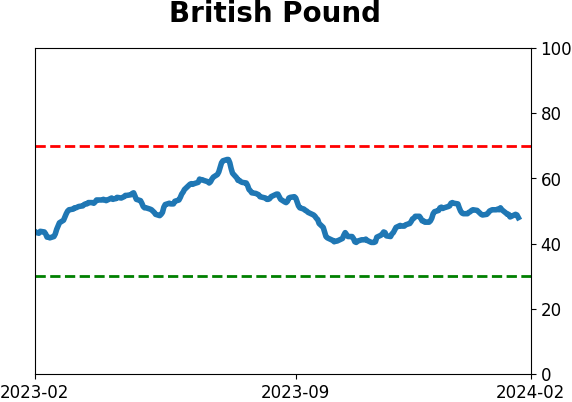
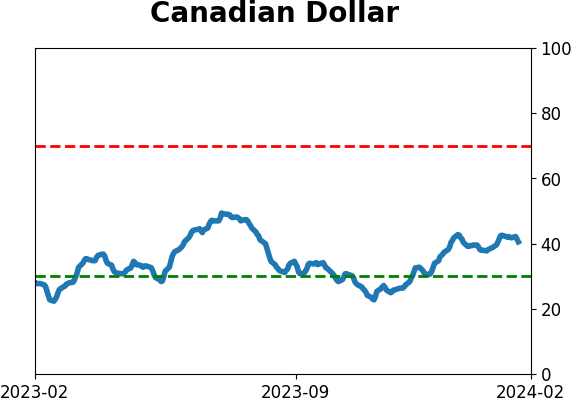
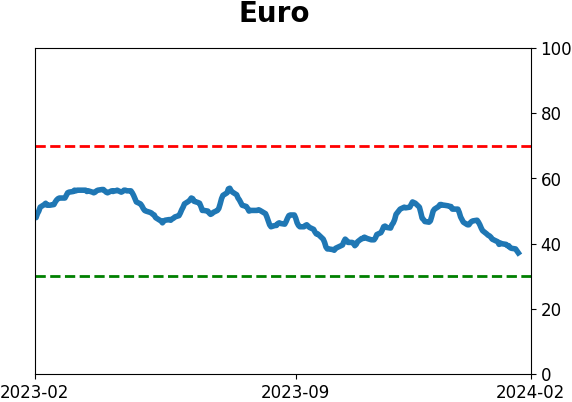
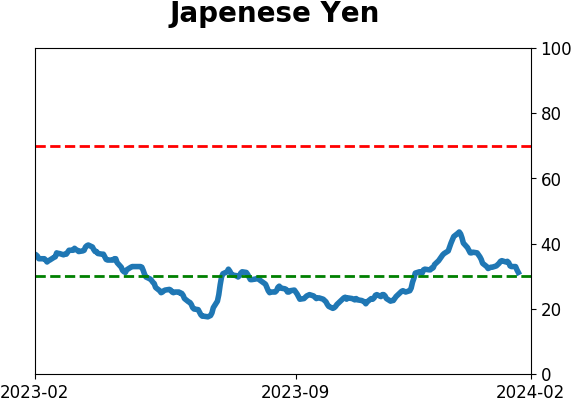
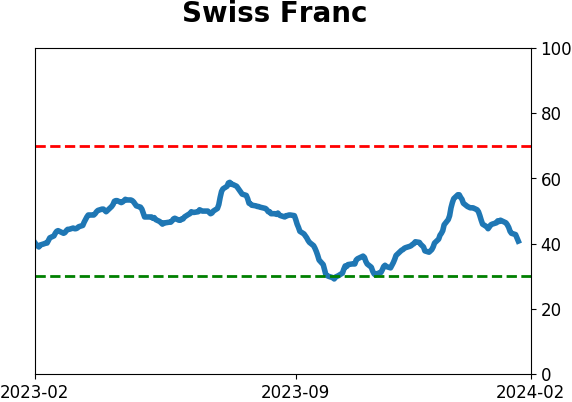
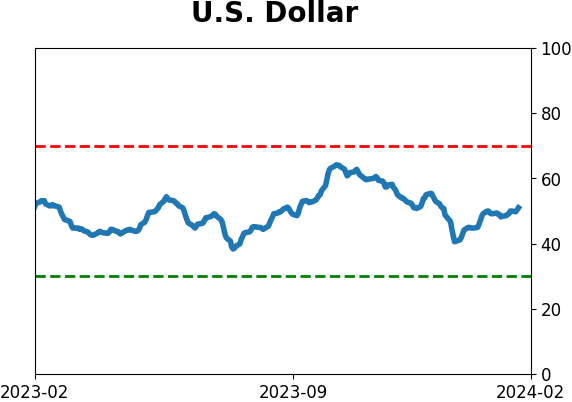
Currency ETF's - 5-Day Moving Average
|
|
|
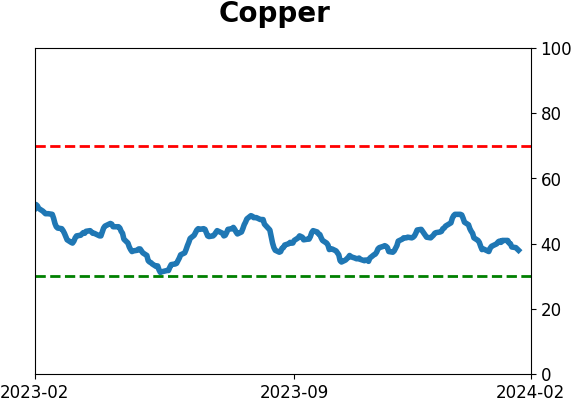
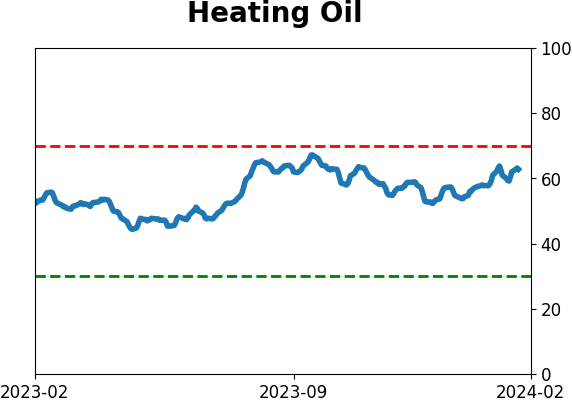
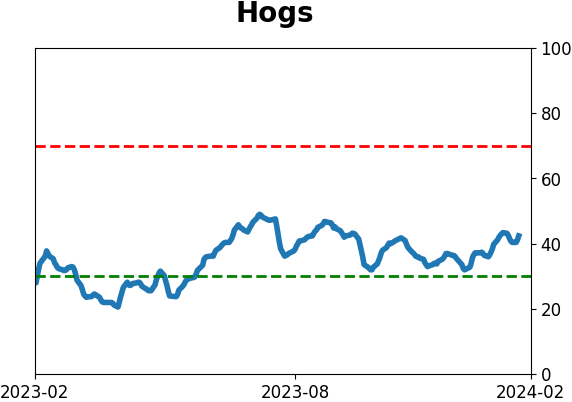
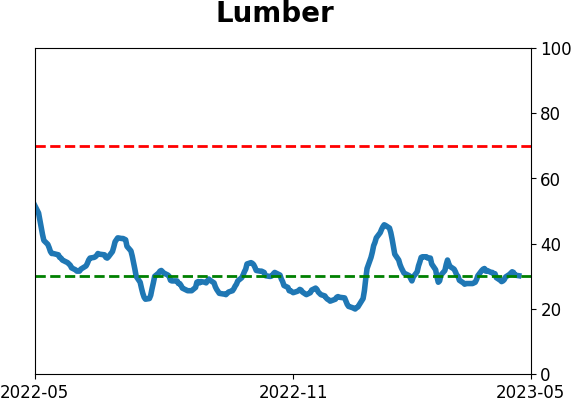
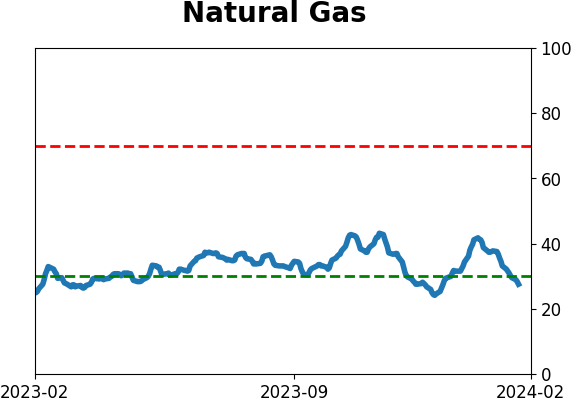
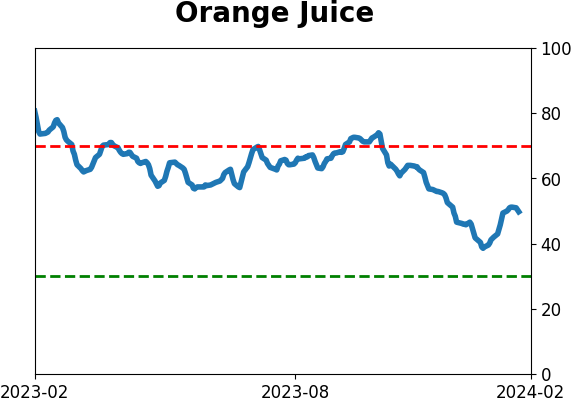
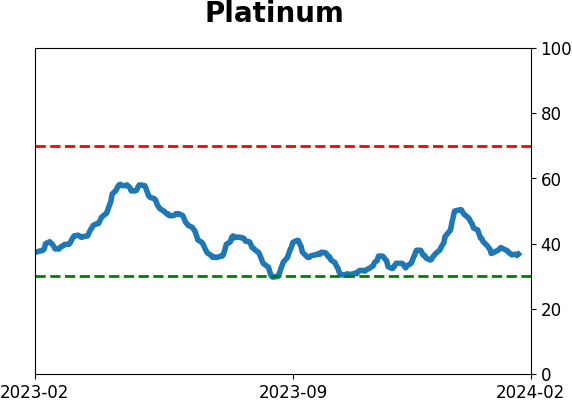
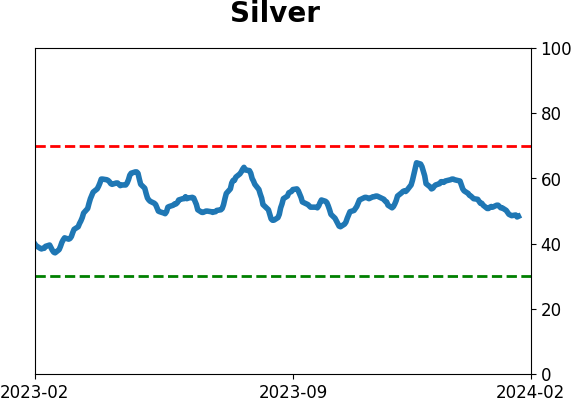
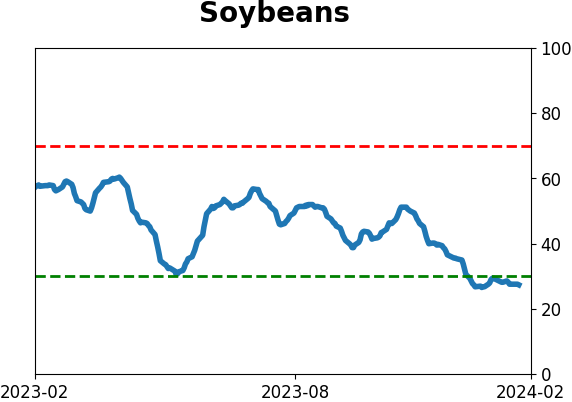
Commodity ETF's - 5-Day Moving Average
|
|