Headlines
|
|
High-yield bond market nears historic extreme:
Selling pressure has been extreme in high-yield bonds over the past month. Most of the indicators we follow show breadth that is historically bad, on par with some of the worst selling pressure in 2008 and 2020.
|
Smart / Dumb Money Confidence
|
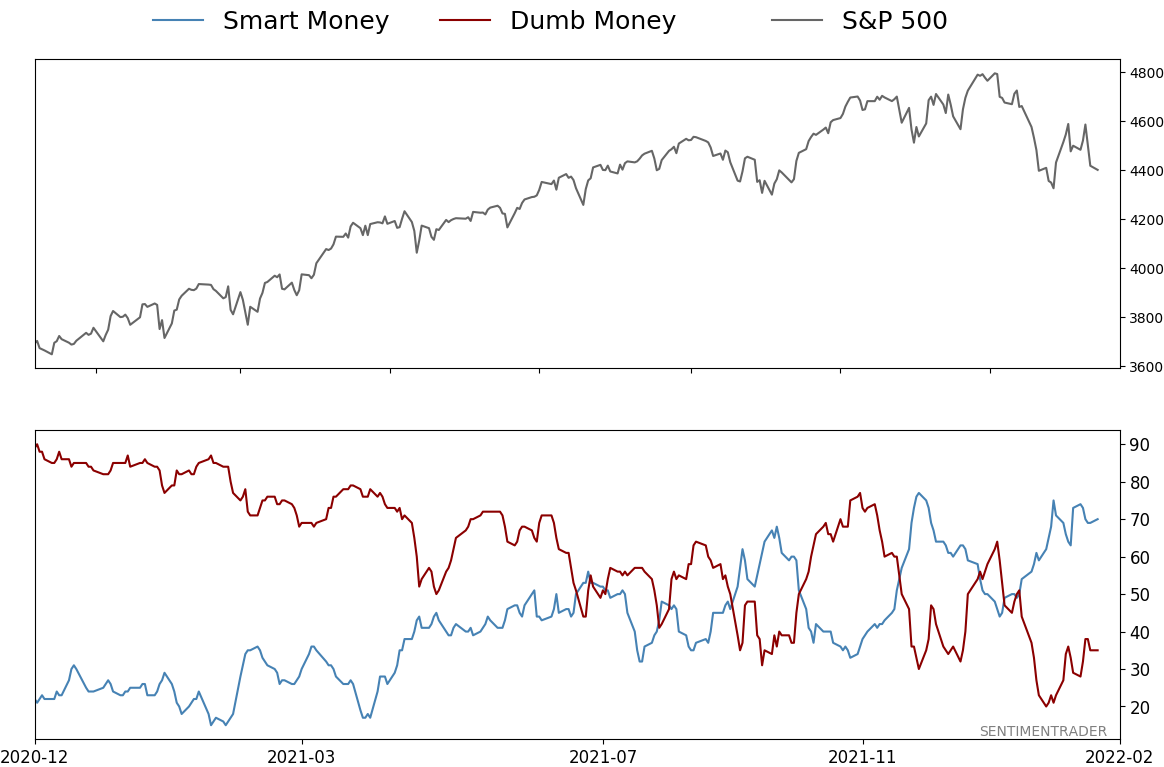
Smart Money Confidence: 70%
Dumb Money Confidence: 35%
|
|
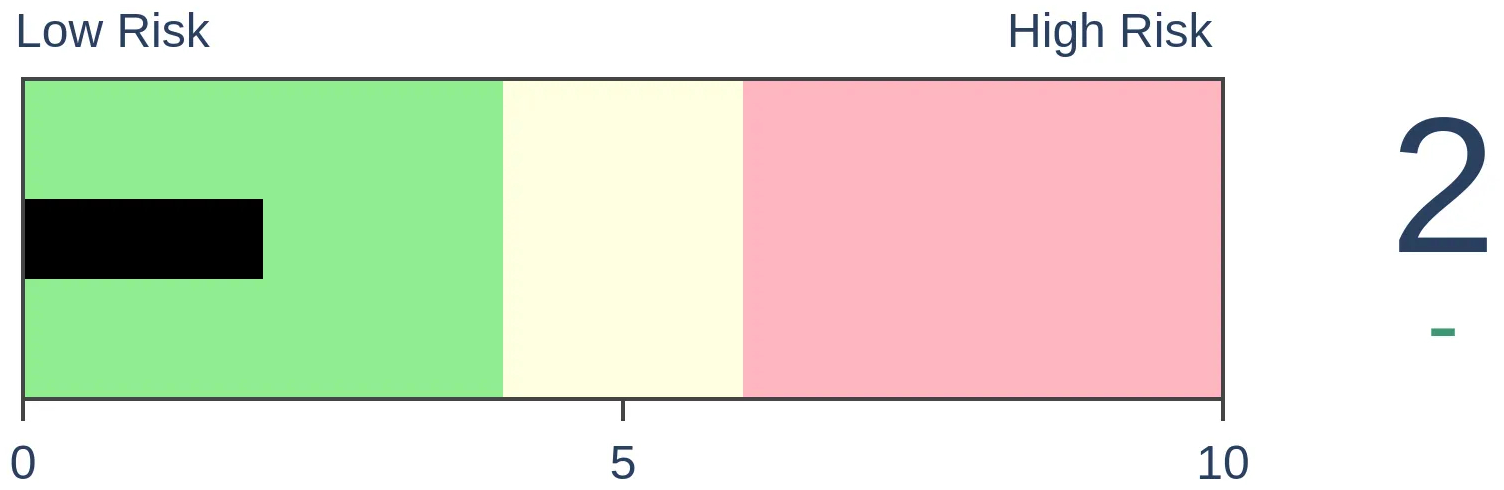
Risk Levels
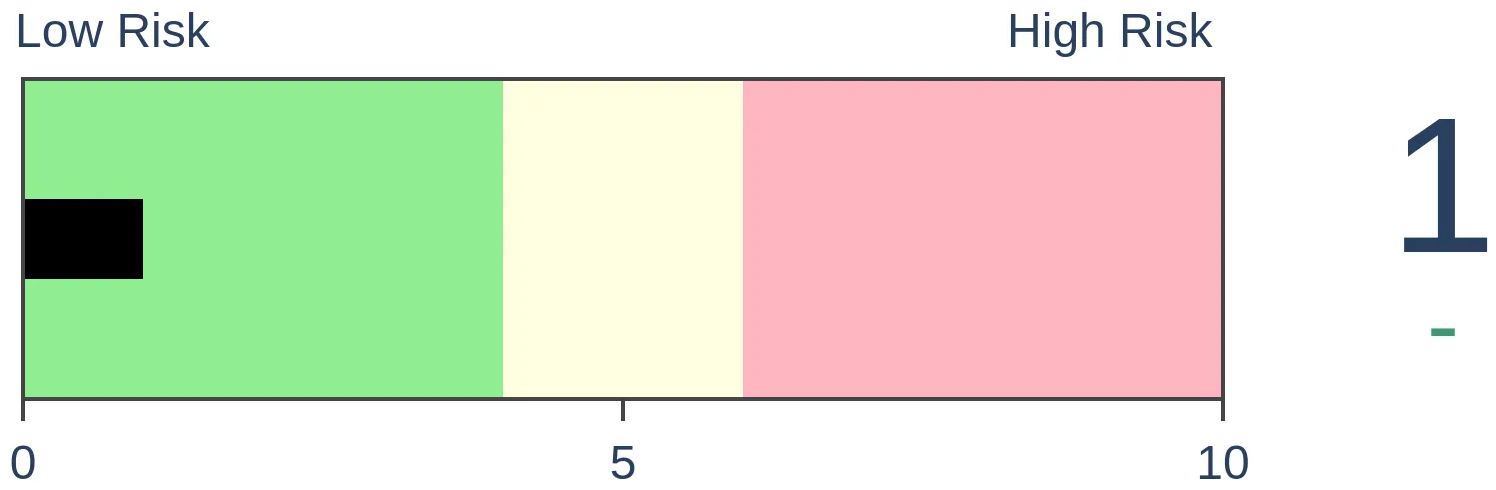
Stocks Short-Term
|
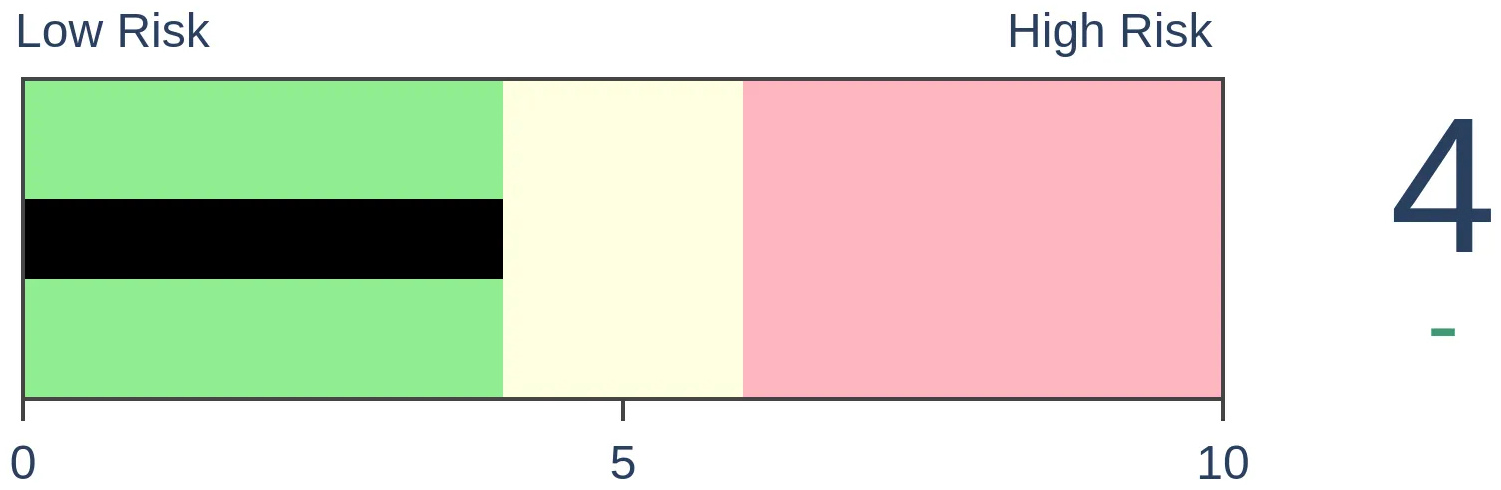
Stocks Medium-Term
|
|
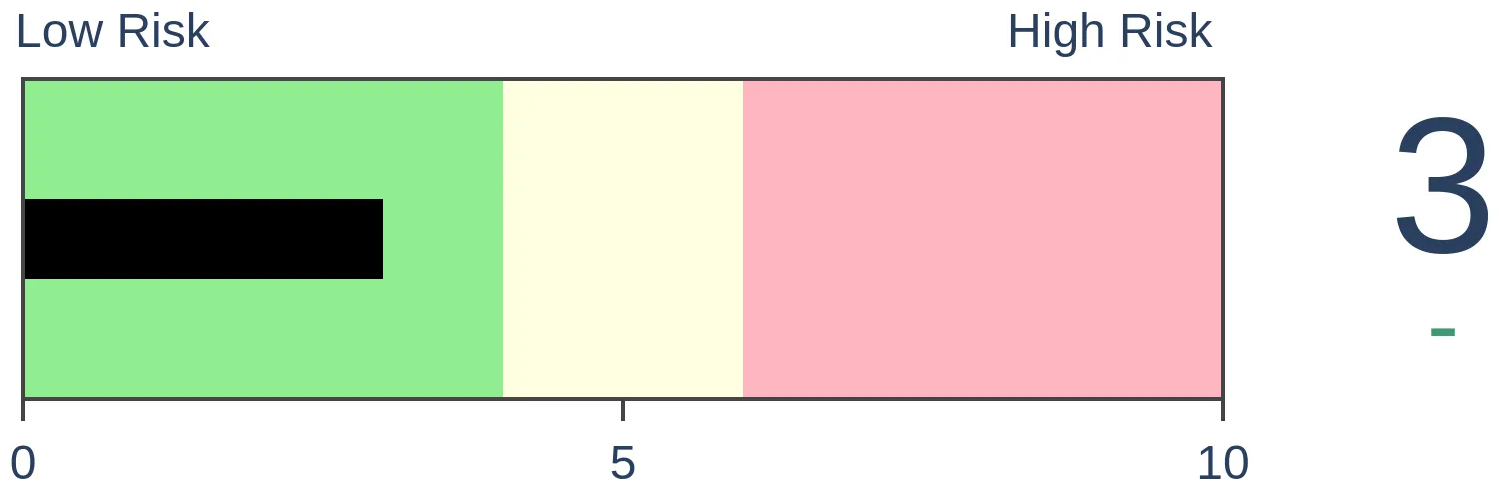
Bonds
|
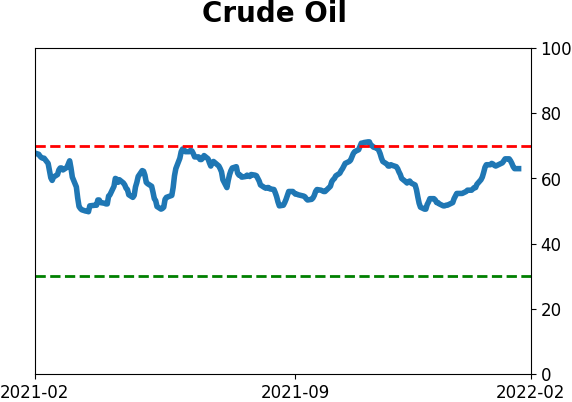
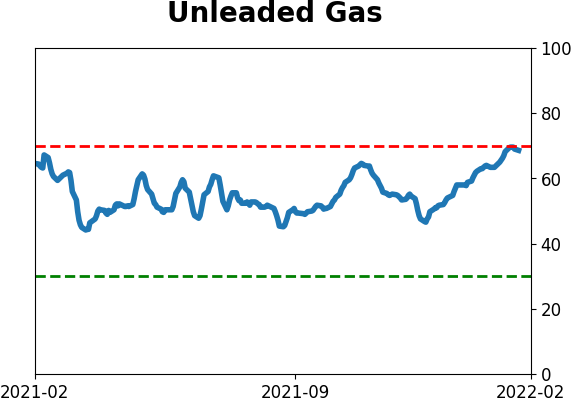
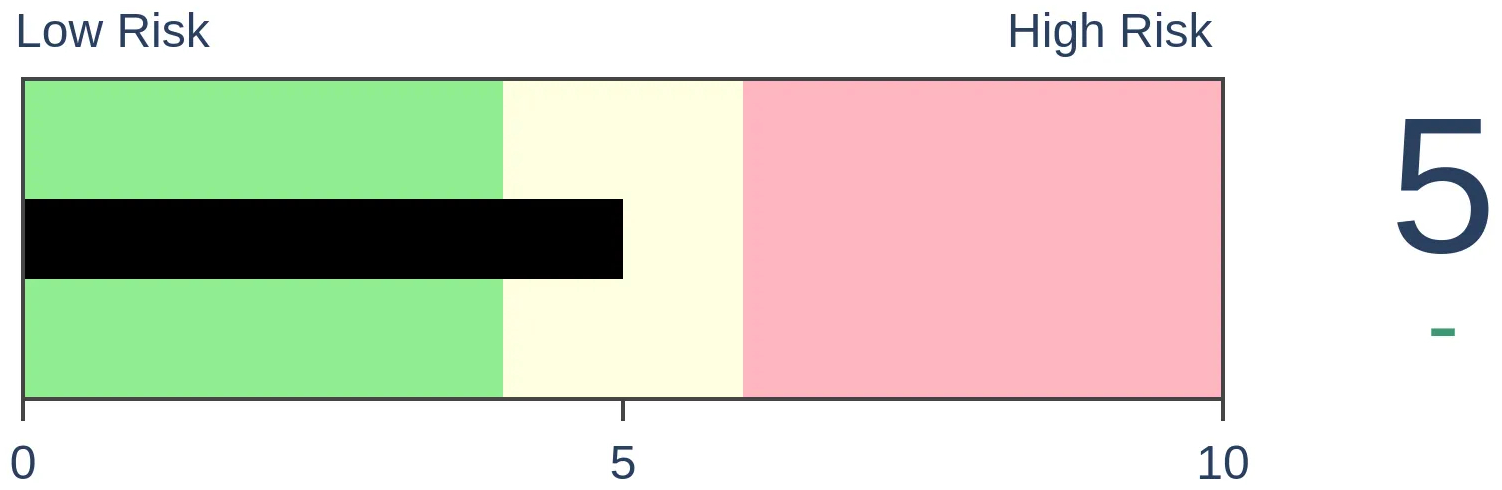
Crude Oil
|
|
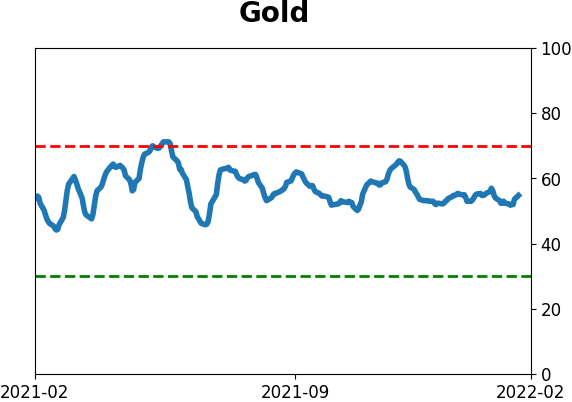
Gold

|
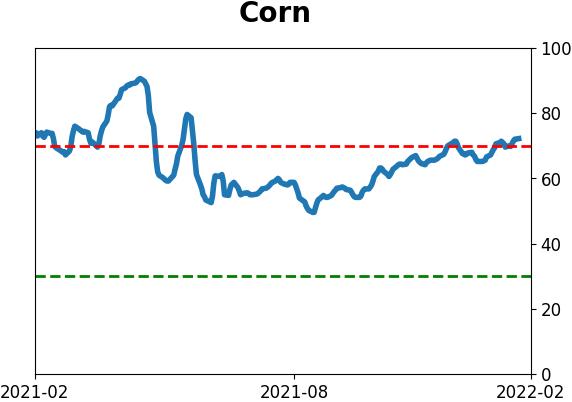
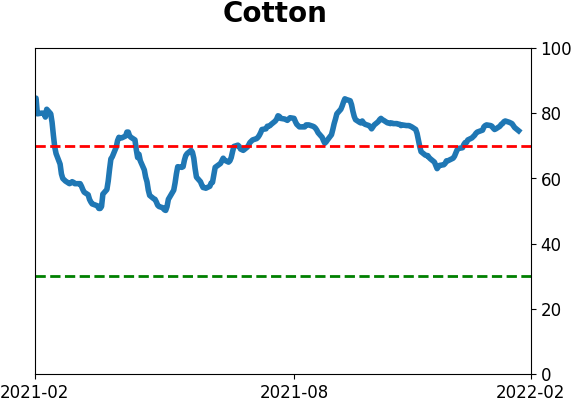
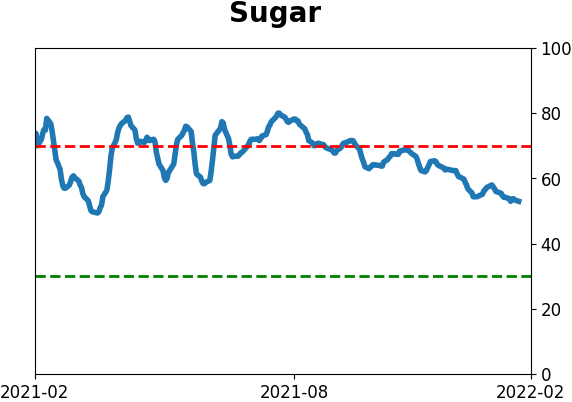
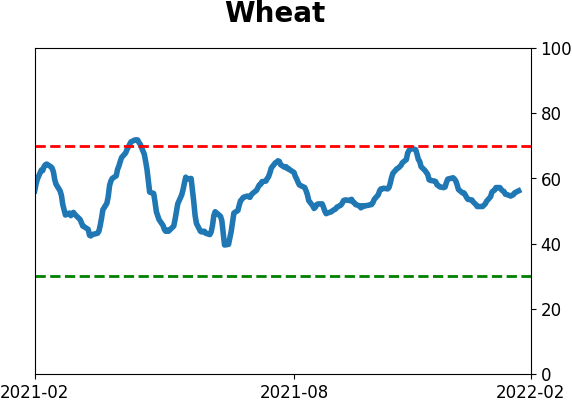
Agriculture
|
|
Research
By Jason Goepfert
BOTTOM LINE
Selling pressure has been extreme in high-yield bonds over the past month. Most of the indicators we follow show breadth that is historically bad, on par with some of the worst selling pressure in 2008 and 2020.
FORECAST / TIMEFRAME
None
|
Key points:
- Investors have been selling high-yield bonds aggressively over the past month
- Most breadth measures are showing extremes on par with 2008 and 2020
- Though history is short, the market has shown resilience after similar extremes
High-yield bonds have seen consistent selling pressure
Starting in November, we looked at suspect performance in high-yield bonds as a worrying sign. The Cumulative Advance/Decline Line was diverging as more and more bonds were declining even as stocks hit new highs.
Bonds were trying to recover from mild oversold conditions, but there were concerns about its sustainability. It's gotten worse since then.

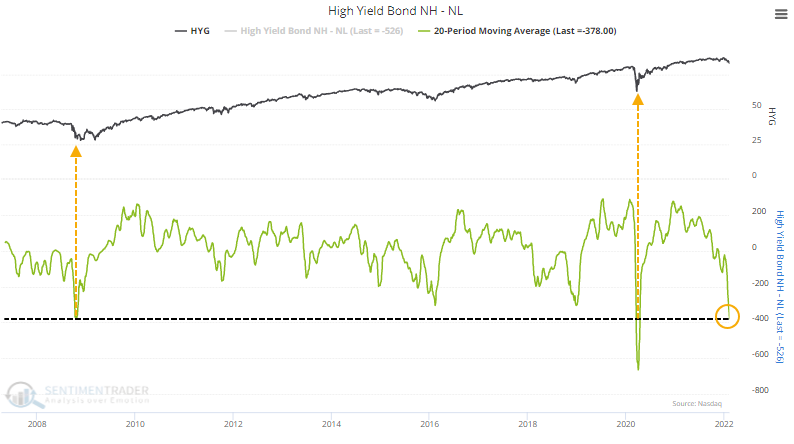
High-yield bonds made a comeback at the end of the year, but soon after, more bonds were falling to 52-week lows than rising to 52-week highs, a clear sign of risk-off behavior among some of the most sensitive and forward-looking investors.
About the only bright spot is that selling pressure has been so focused over the past month that we're nearing some historic extremes. Over the past 20 sessions, an average day has had nearly 400 more bonds hitting 52-week lows than 52-week highs. That's on par with the 2 worst bear markets in the past 15 years.
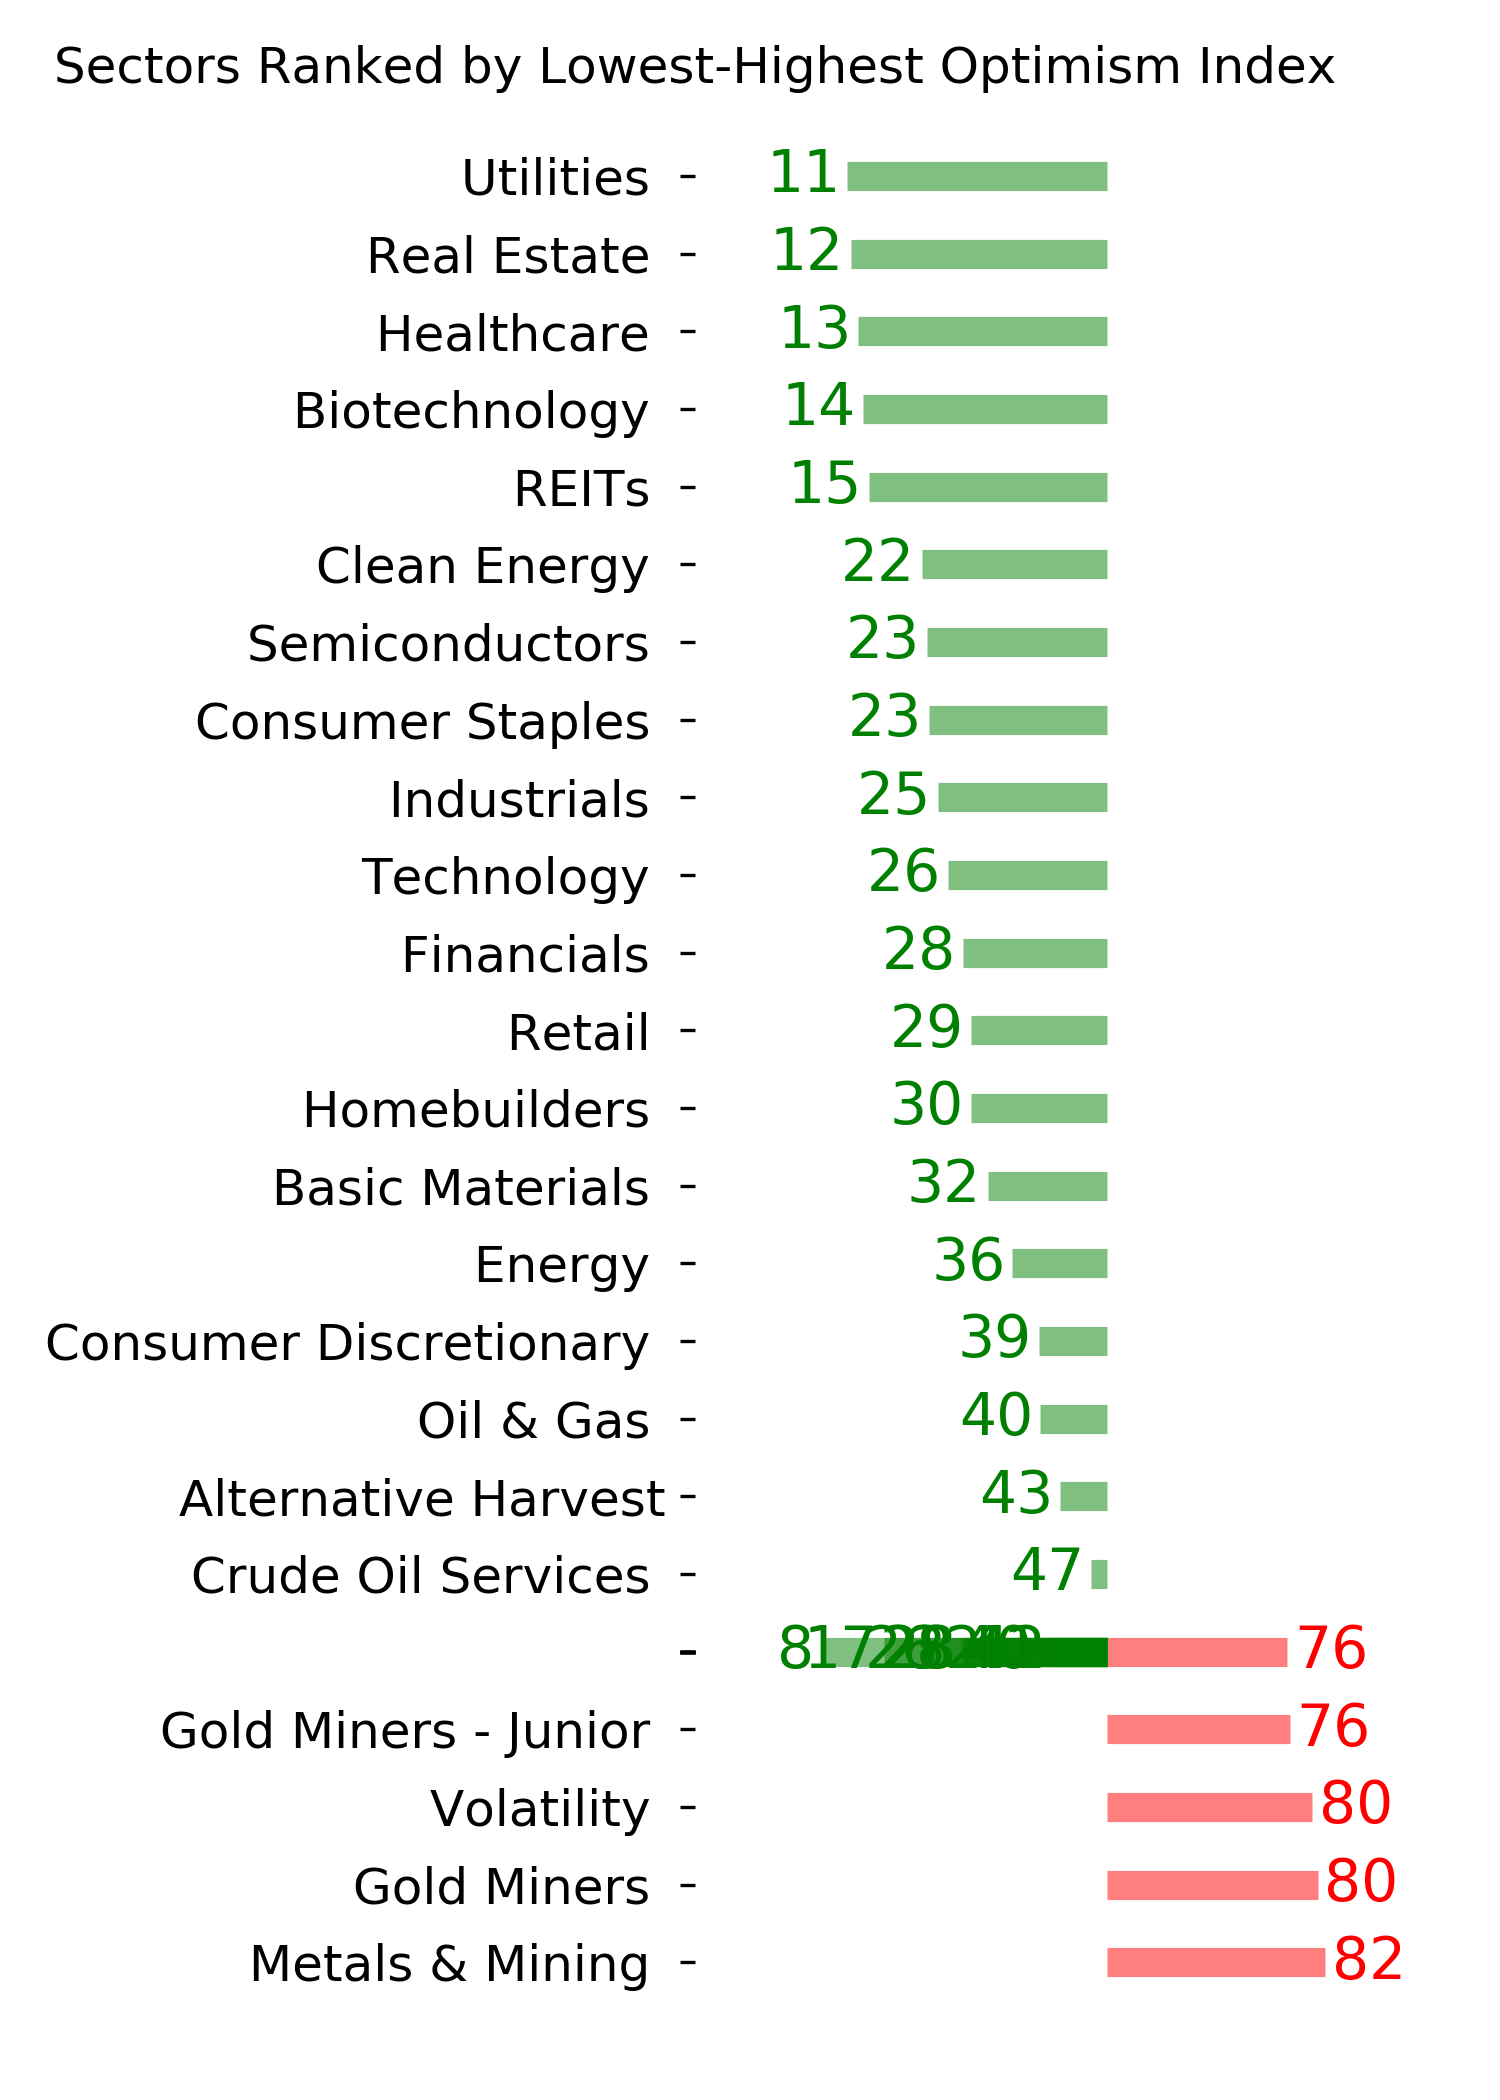
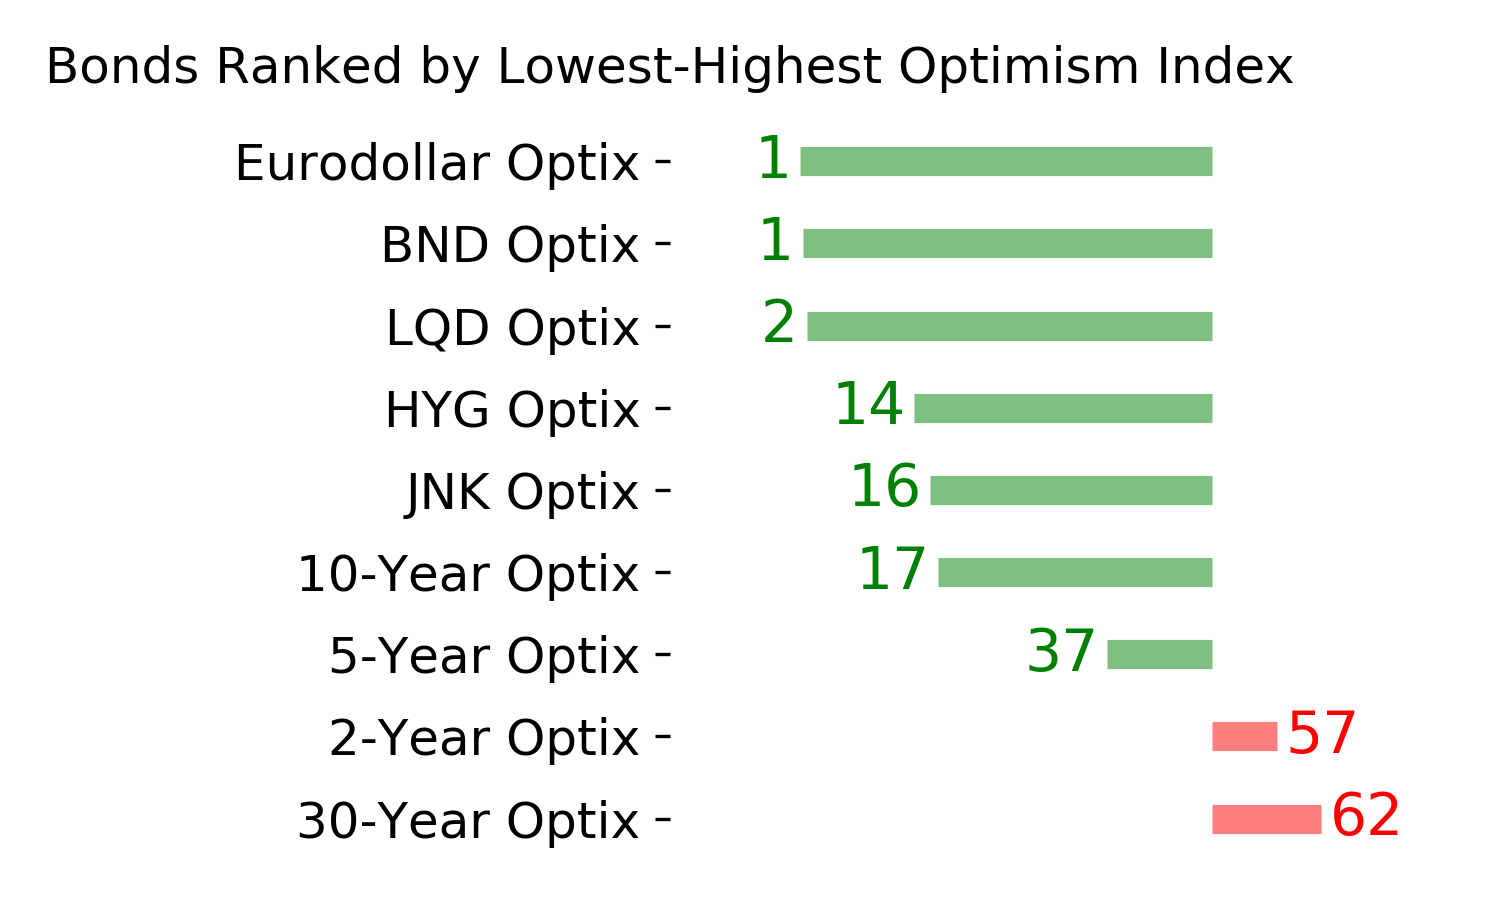
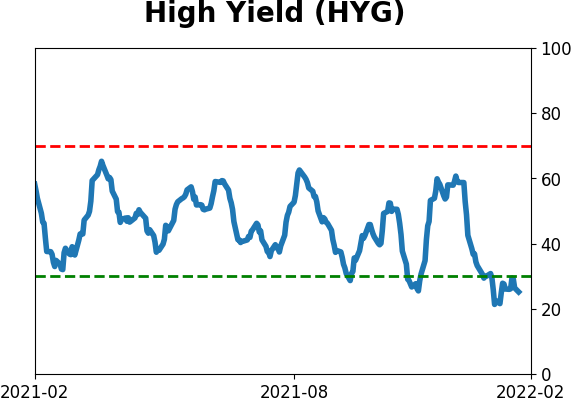
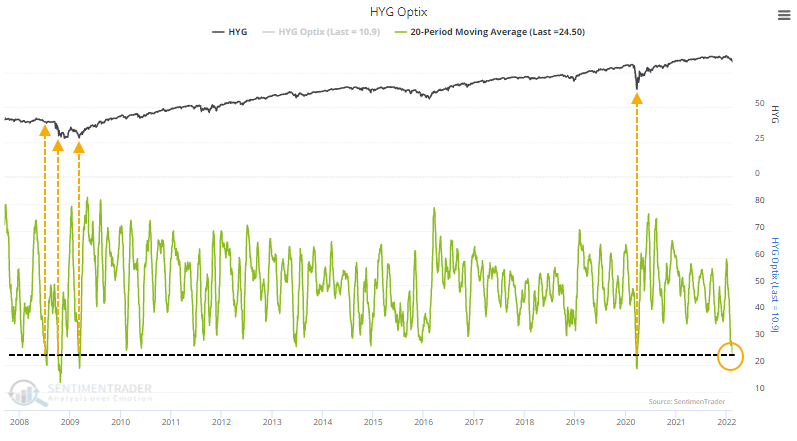
It's been enough to push the 20-day Optimism Index for the iShares iBoxx High Yield Corporate Bond ETF (HYG) to one of its lowest levels since inception.
Investors are fleeing junk bond funds
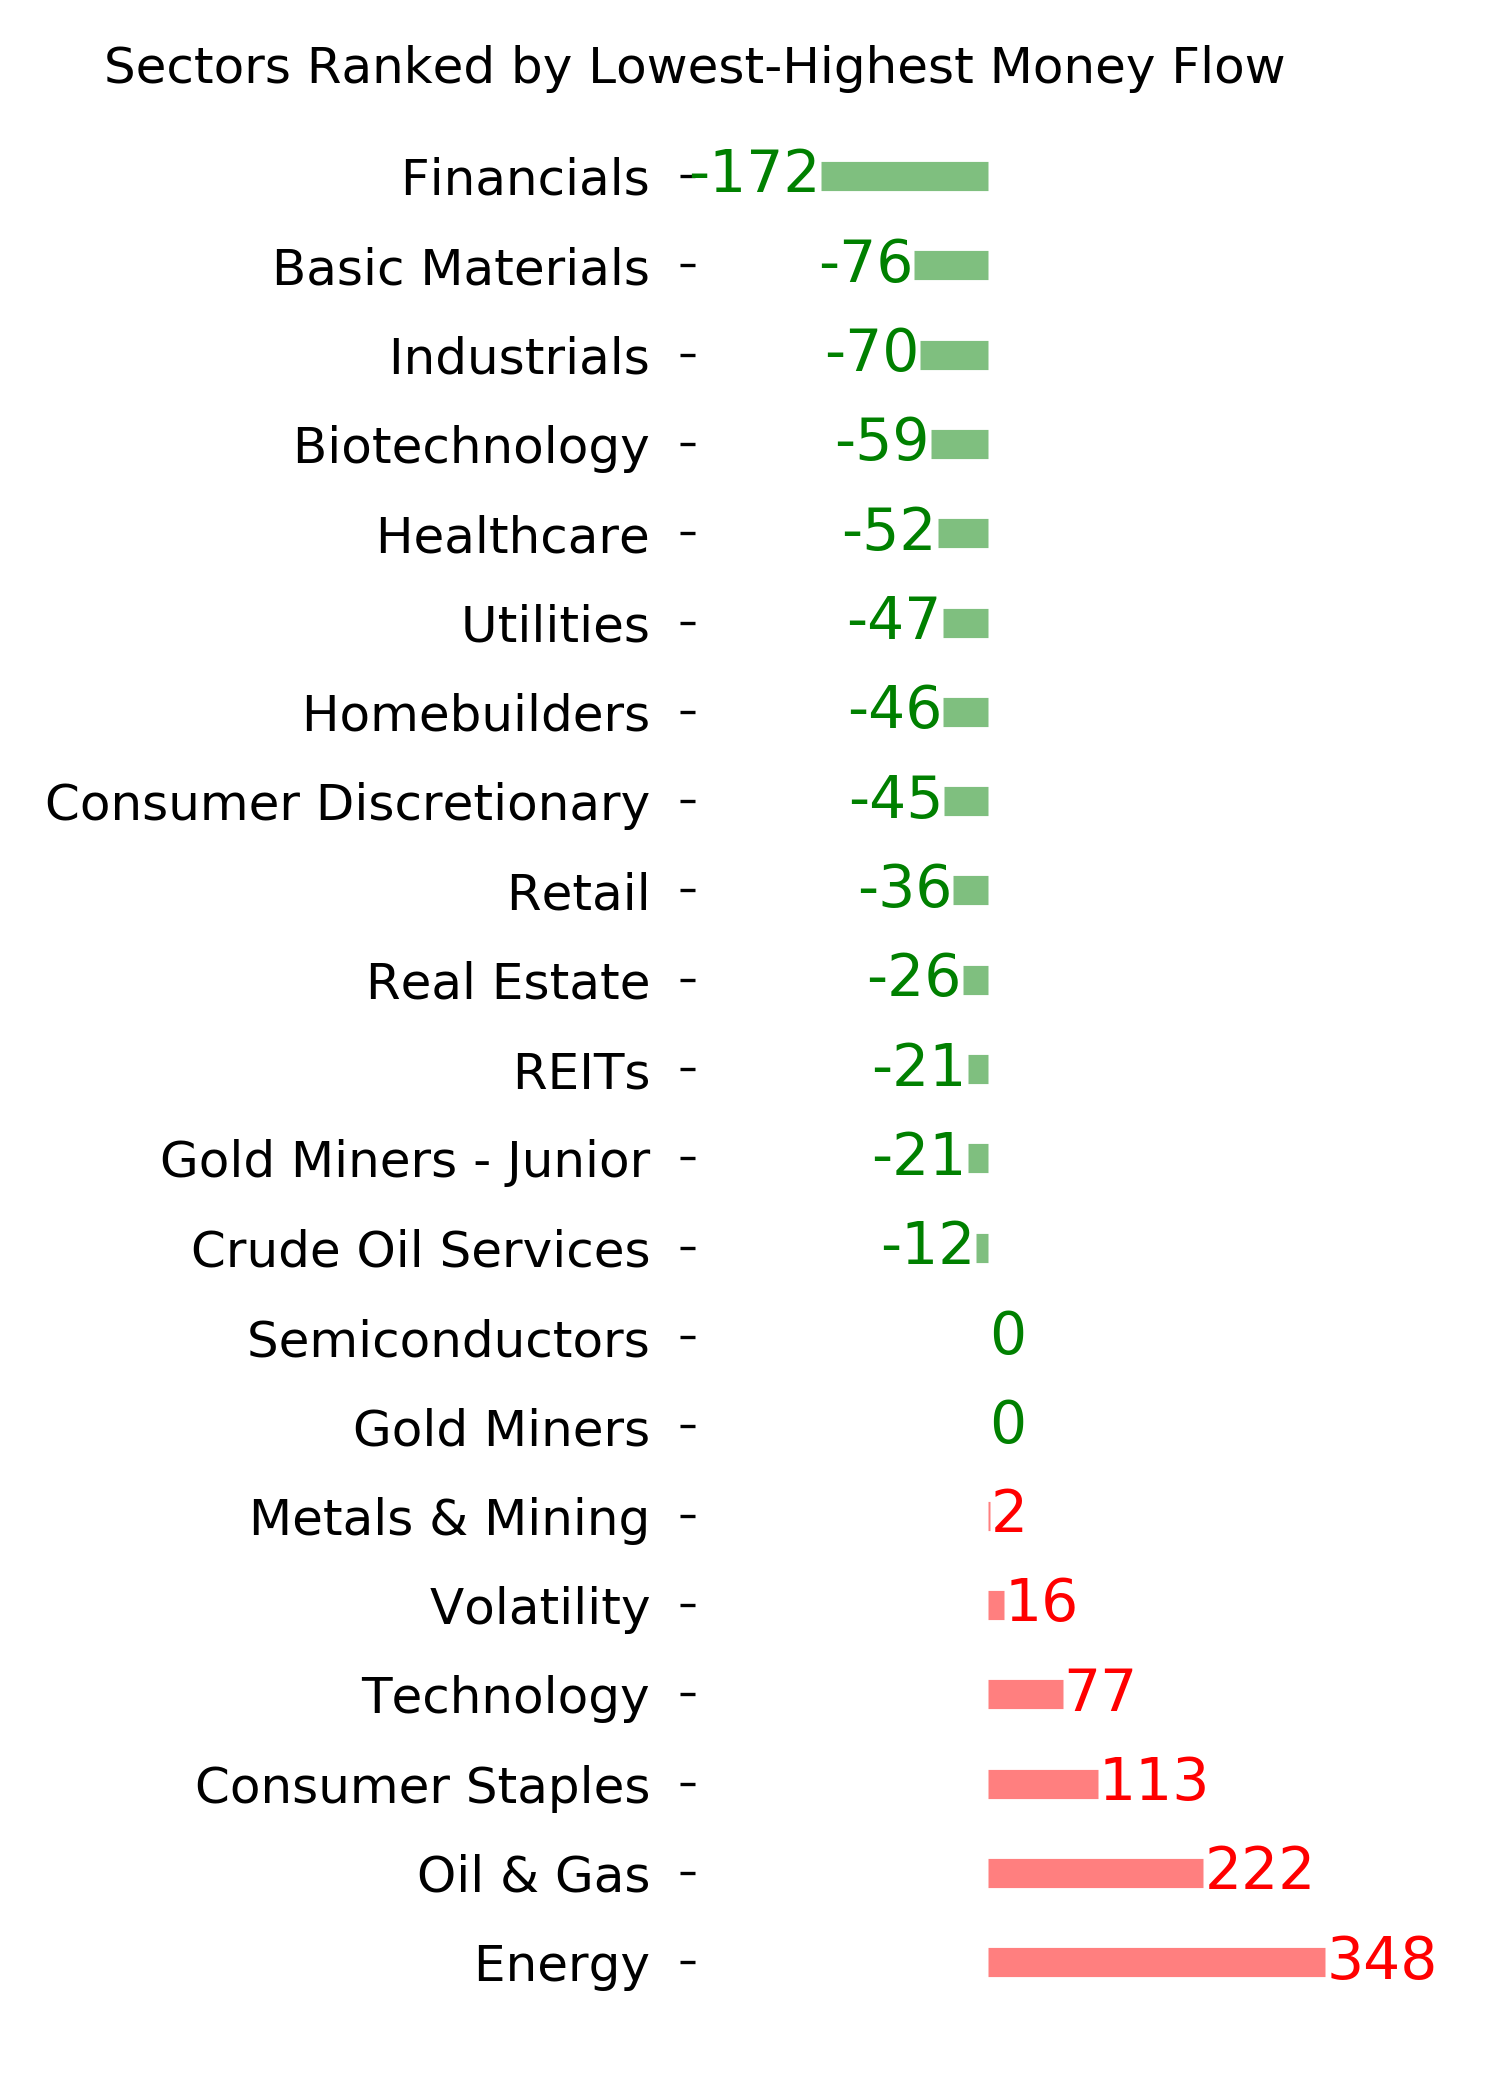
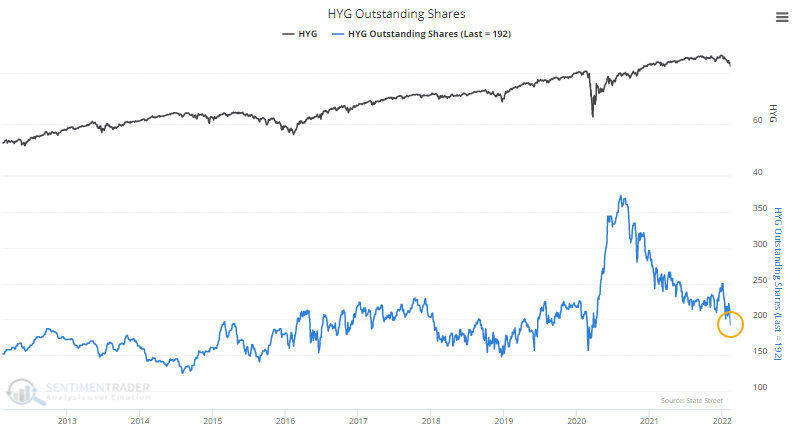
The low optimism is evident by the amount of money fleeing the fund lately. The 20-day fund flow has been hovering below a $100 million/day outflow for weeks.

The persistent outflows have shrunk the shares outstanding in HYG to the lowest in almost 2 years. The number of shares outstanding in an ETF is a very rough proxy for the level investor interest in a sector or asset.
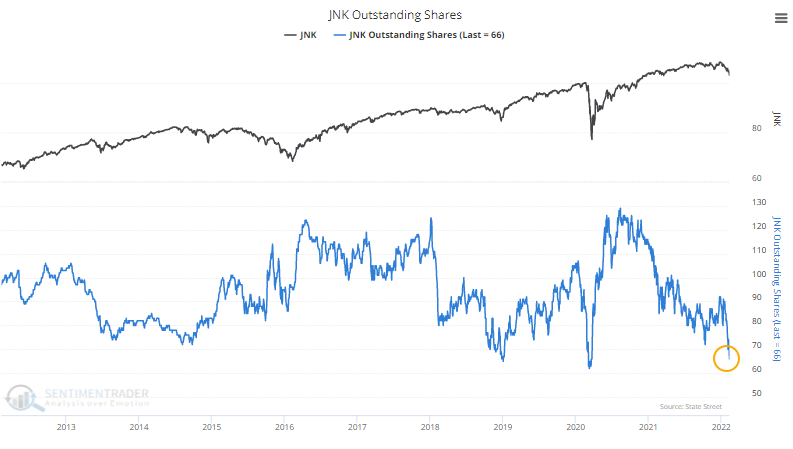
It's been the same story in the fund flow for the SPDR Bloomberg High Yield Bond ETF (JNK), which is nearing its worst-ever 20-day outflow.

The shares outstanding in JNK have plunged and are nearing the lowest level in a decade.
High-yield selling pressure is widespread
Selling pressure has been so widespread that the 20-day difference between advancing and declining bonds neared one of the most extreme readings in 15 years, with an average day seeing nearly 400 more declining than advancing issues.

This behavior pushed the McClellan Oscillator to an extreme oversold reading, which tried to reverse last week. The Backtest Engine shows failures during the Great Financial Crisis but otherwise mostly positive medium-term returns.

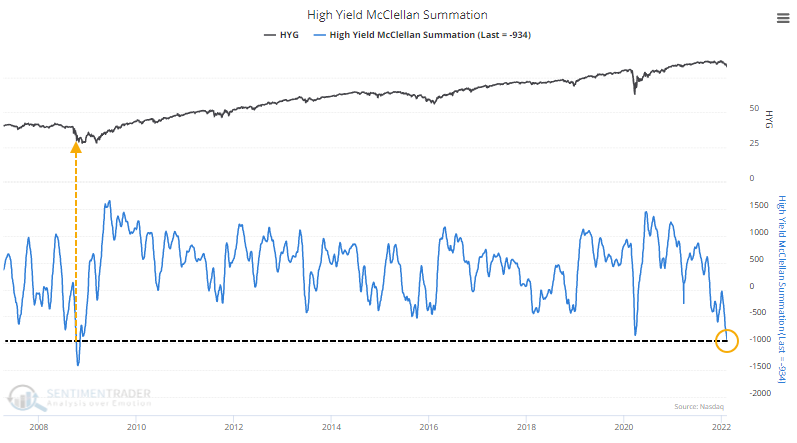
Most damning of all, the McClellan Summation Index for the high-yield bond market has been below zero and declining for weeks. We've repeatedly seen that when the Summation Index is below zero and declining, it's the worst possible environment for any sector or index.
Again, though, the selling pressure has been so severe and persistent that the indicator has surpassed its extreme from the pandemic. It is as stretched to the downside as it was during the height of the financial crisis panic.
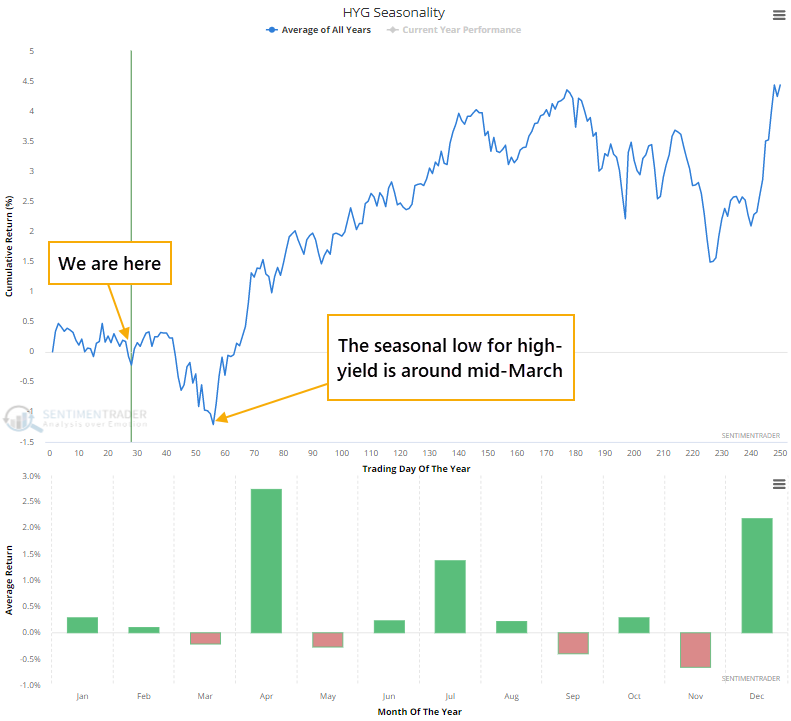
Historically, high-yield funds have bounced about this time of the year but had some difficulty through March. The seasonal window for HYG then turns positive during the summer months.
What the research tells us...
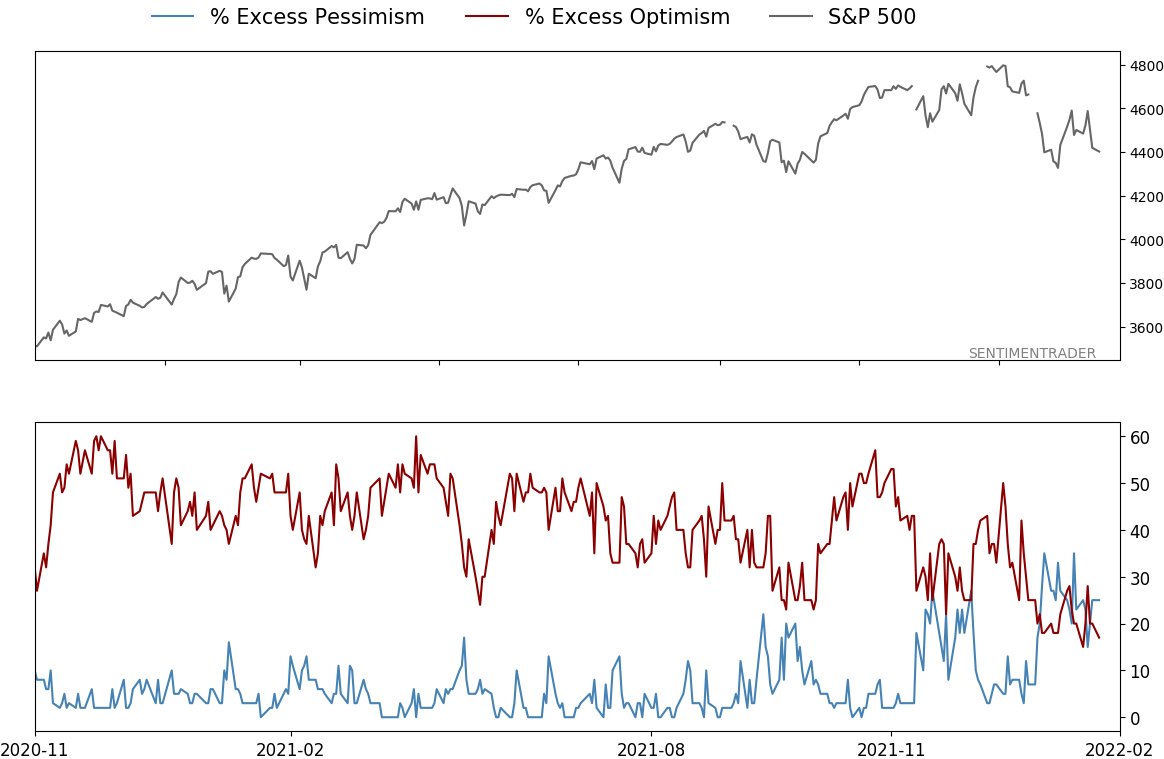
We all know that extreme readings can always get more extreme. It's a trade-off for investors whether to try to buy at a reasonable price and risk further declines or wait for a recovery. There is no guarantee that recoveries won't fail, either, but it gives some comfort that the worst may be behind us. With a universally negative market environment, it usually takes historically extreme pessimism for a market to bottom, and even then it's often a testing process. In high-yield bonds, we seem to be quickly nearing one of those extremes. Aggressive investors can be well-served by adding exposure in pieces over time, while more conservative and risk-averse ones would be better served waiting for a more stable environment.
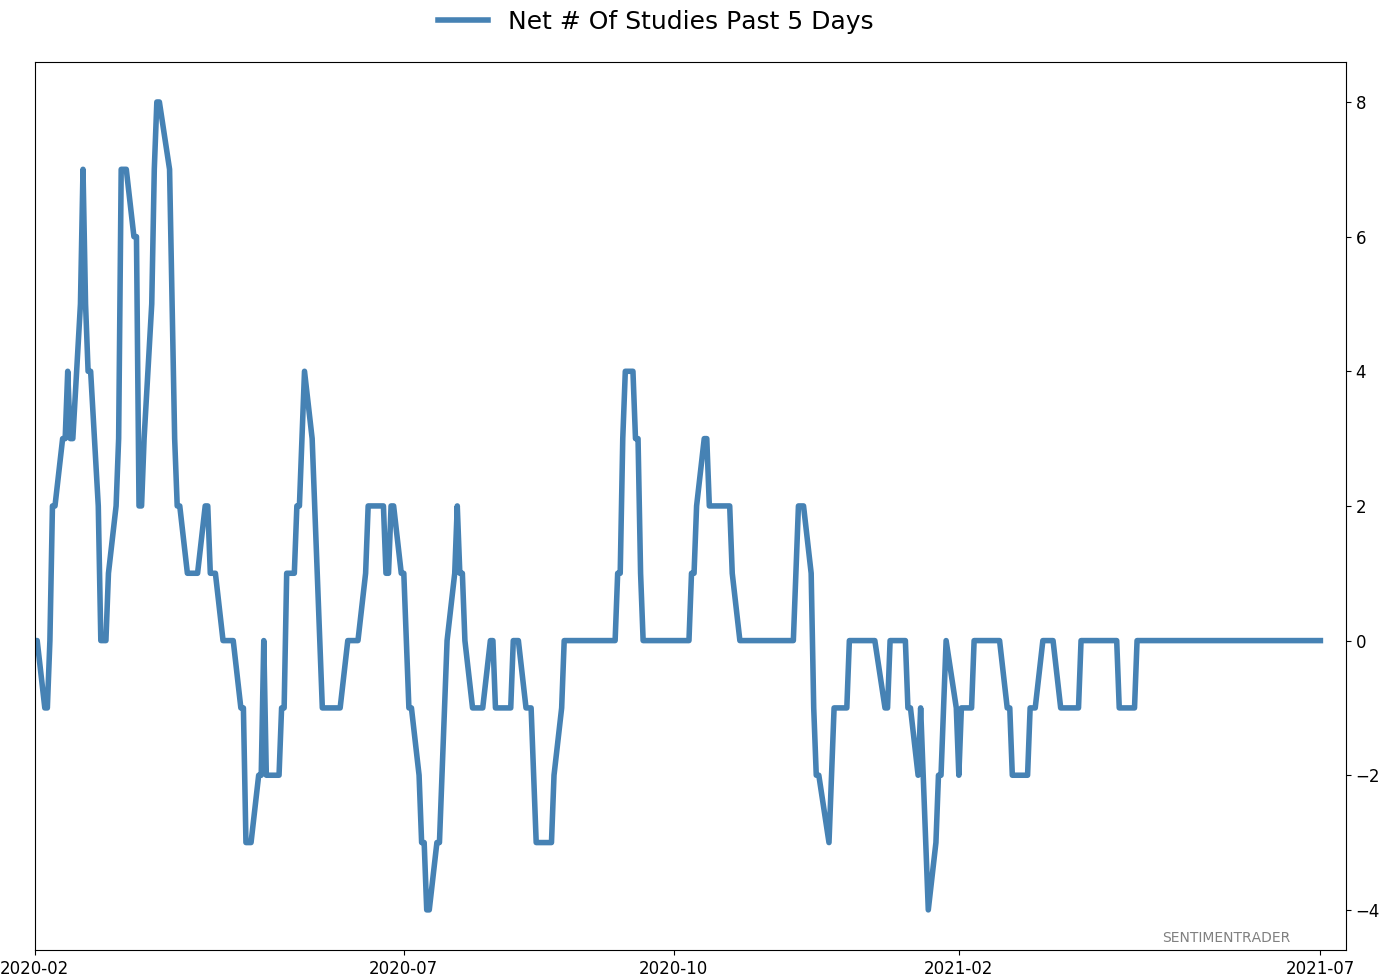
Active Studies
| Time Frame | Bullish | Bearish | | Short-Term | 3 | 0 | | Medium-Term | 17 | 2 | | Long-Term | 15 | 5 |
|
Indicators at Extremes
Portfolio
| Position | Description | Weight % | Added / Reduced | Date | | Stocks | RSP | 21.4 | Added 10.2% | 2022-01-28 | | Bonds | 32.7% BND, 7.1% SCHP | 40.1 | Added 8.3% | 2021-10-26 | | Commodities | GCC | 2.4 | Reduced 2.1%
| 2020-09-04 | | Precious Metals | GDX | 4.6 | Reduced 4.2% | 2021-05-19 | | Special Situations | 8.1% KWEB, 3.6% XLE, 1.7% PSCE | 13.4 | Reduced 3.9% | 2022-01-18 | | Cash | | 17.9 | | |
|
Updates (Changes made today are underlined)
With a typical time frame of several months in this account, I normally don't make changes so quickly. I've added back part of the stock exposure I took off earlier in January due to the washed-out conditions and extreme pessimism we're seeing across a wide array of metrics. The biggest issue is that the environment is unhealthy and we could be in the throes of a protracted bear market. Even so, the readings we've seen recently have a good record at preceding relief rallies, so we'll have to see how that pans out. Bond sentiment is trying to recover from a recent bout of pessimism, and gold stocks are doing their thing which is not much at all. They've been flat for six months. Chinese tech stocks were doing exactly what they're supposed to do, then did *not* by plunging to new lows. This is troubling on a shorter-term time frame, but this was never meant for a trade, rather a multi-year investment. Recent behavior is troubling and I will not be adding any exposure as long as that's the case. RETURN YTD: -0.5% 2021: +8.7%, 2020: +8.1%, 2019: +12.6%, 2018: +0.6%, 2017: +3.8%, 2016: +17.1%, 2015: +9.2%, 2014: +14.5%, 2013: +2.2%, 2012: +10.8%, 2011: +16.5%, 2010: +15.3%, 2009: +23.9%, 2008: +16.2%, 2007: +7.8%
|
|
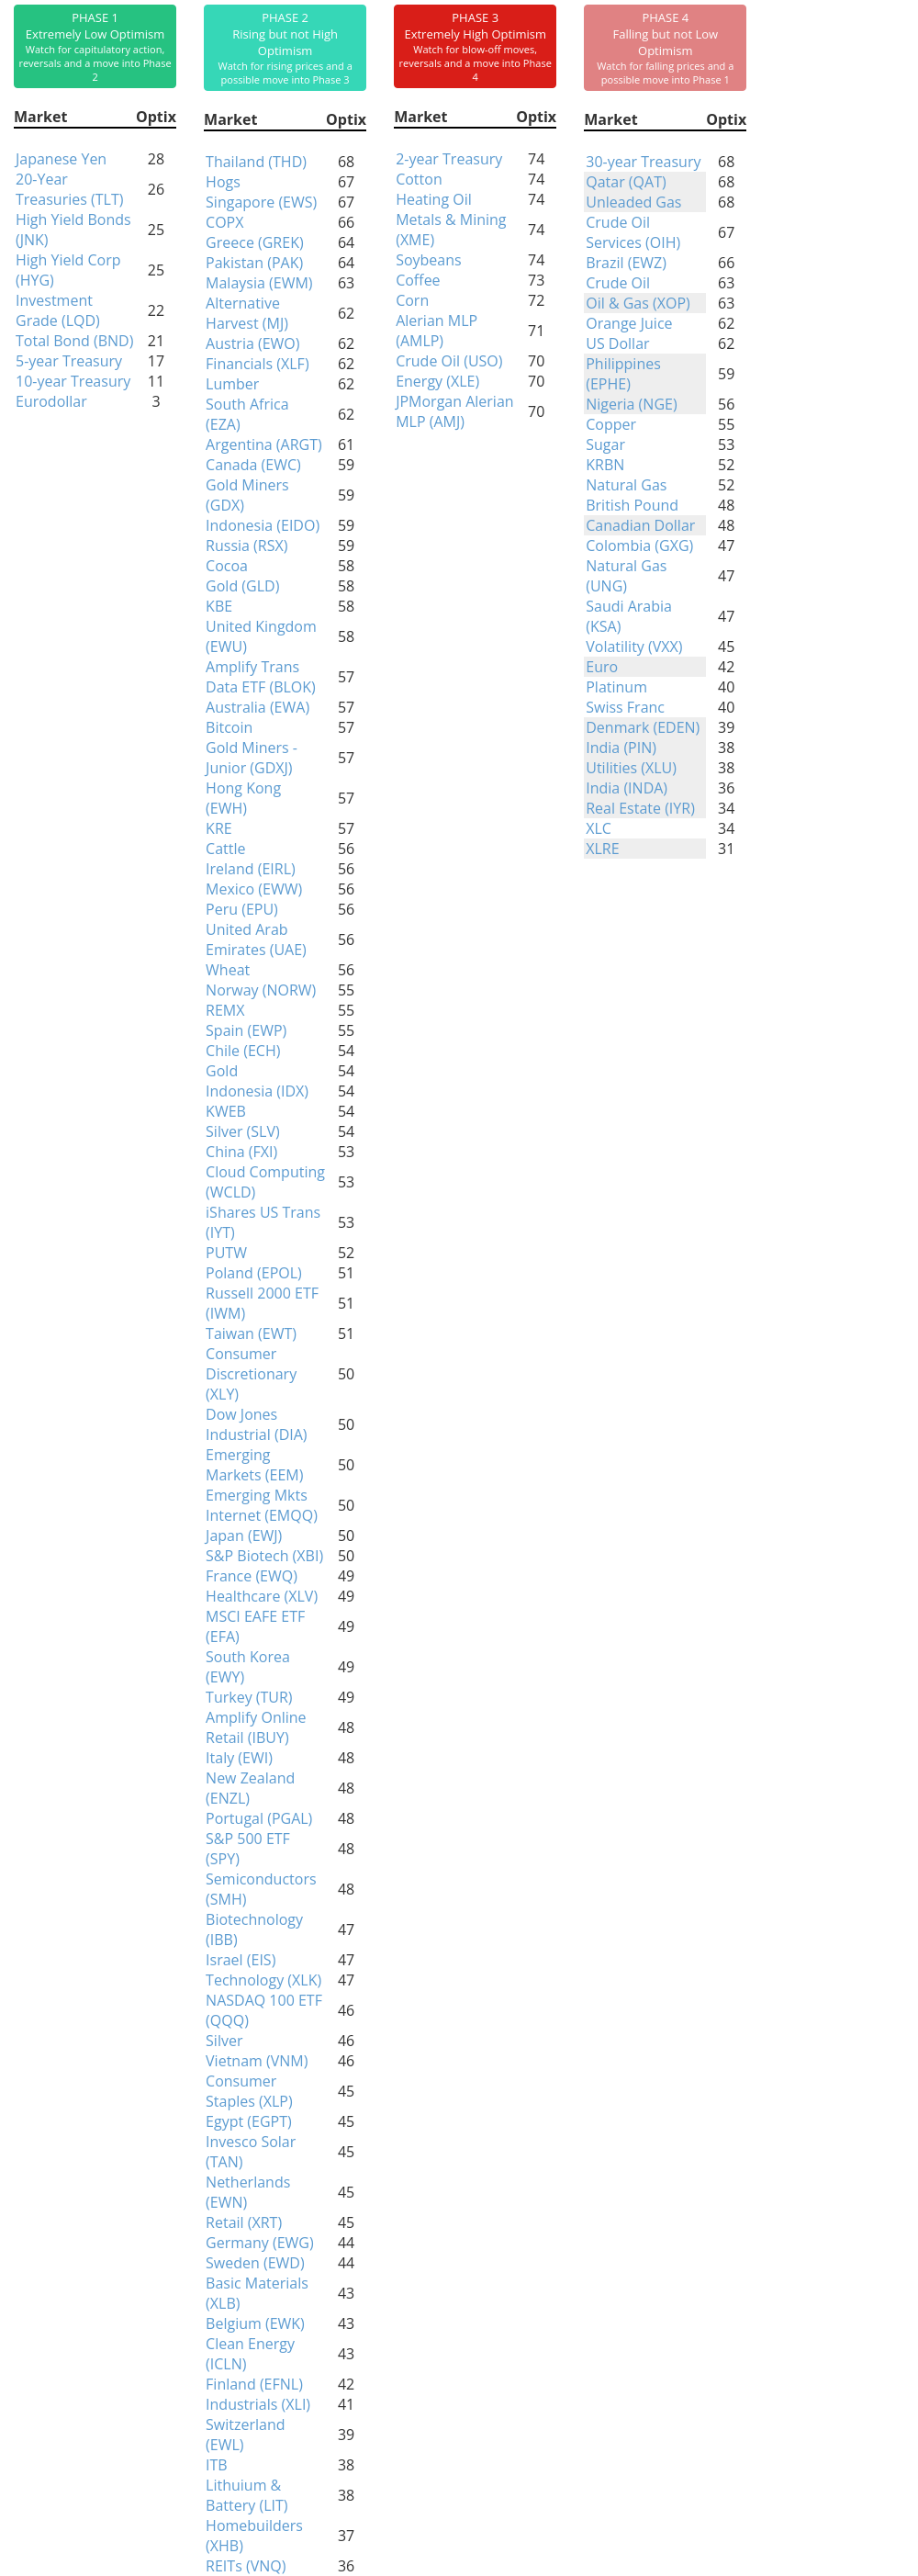
Phase Table
Ranks
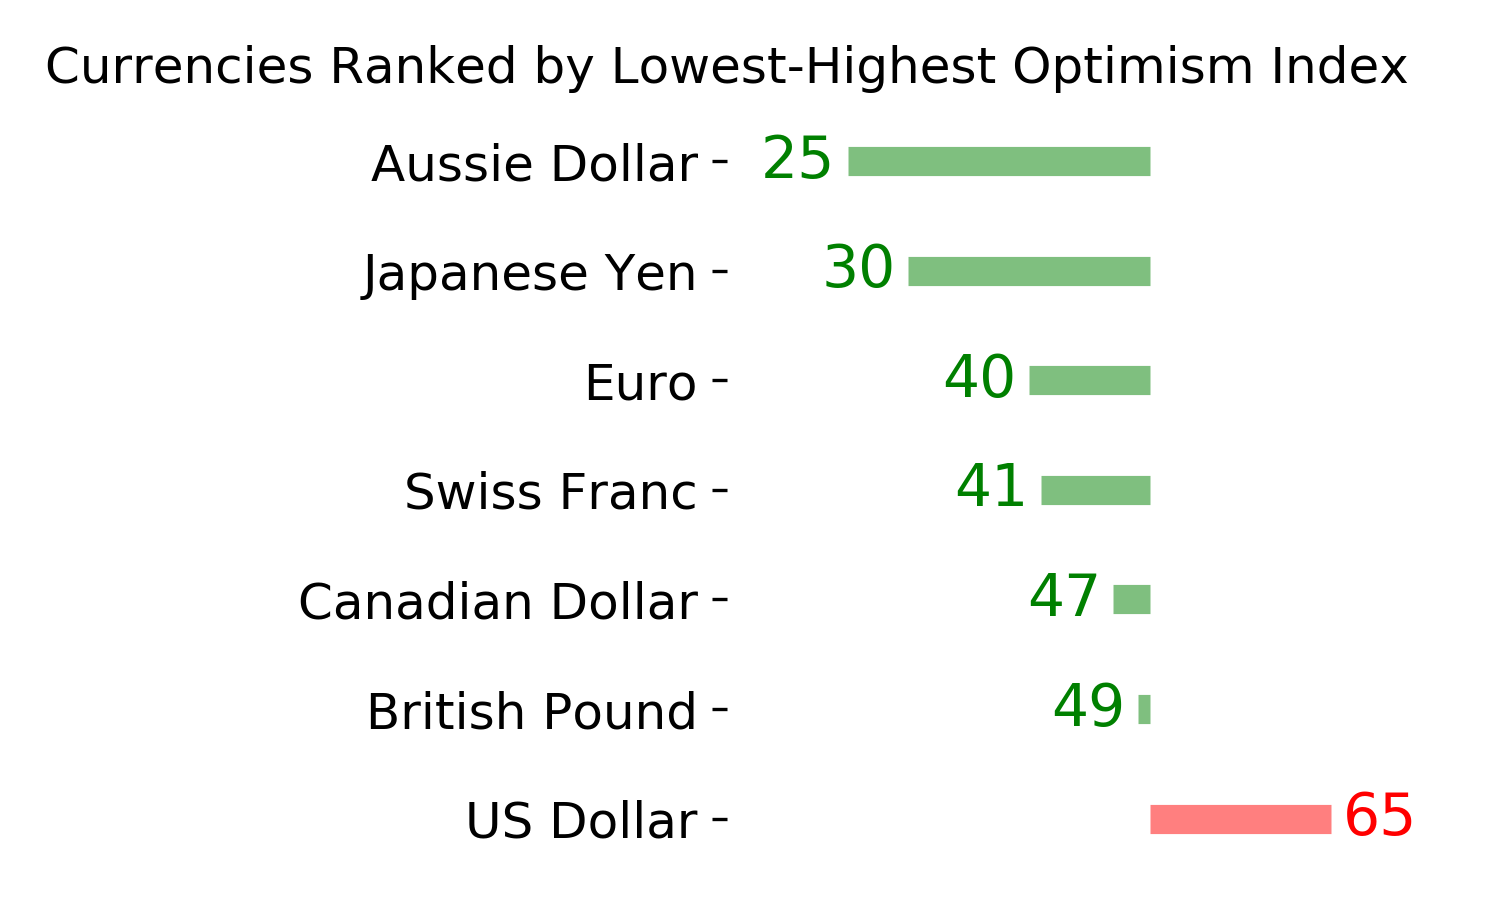
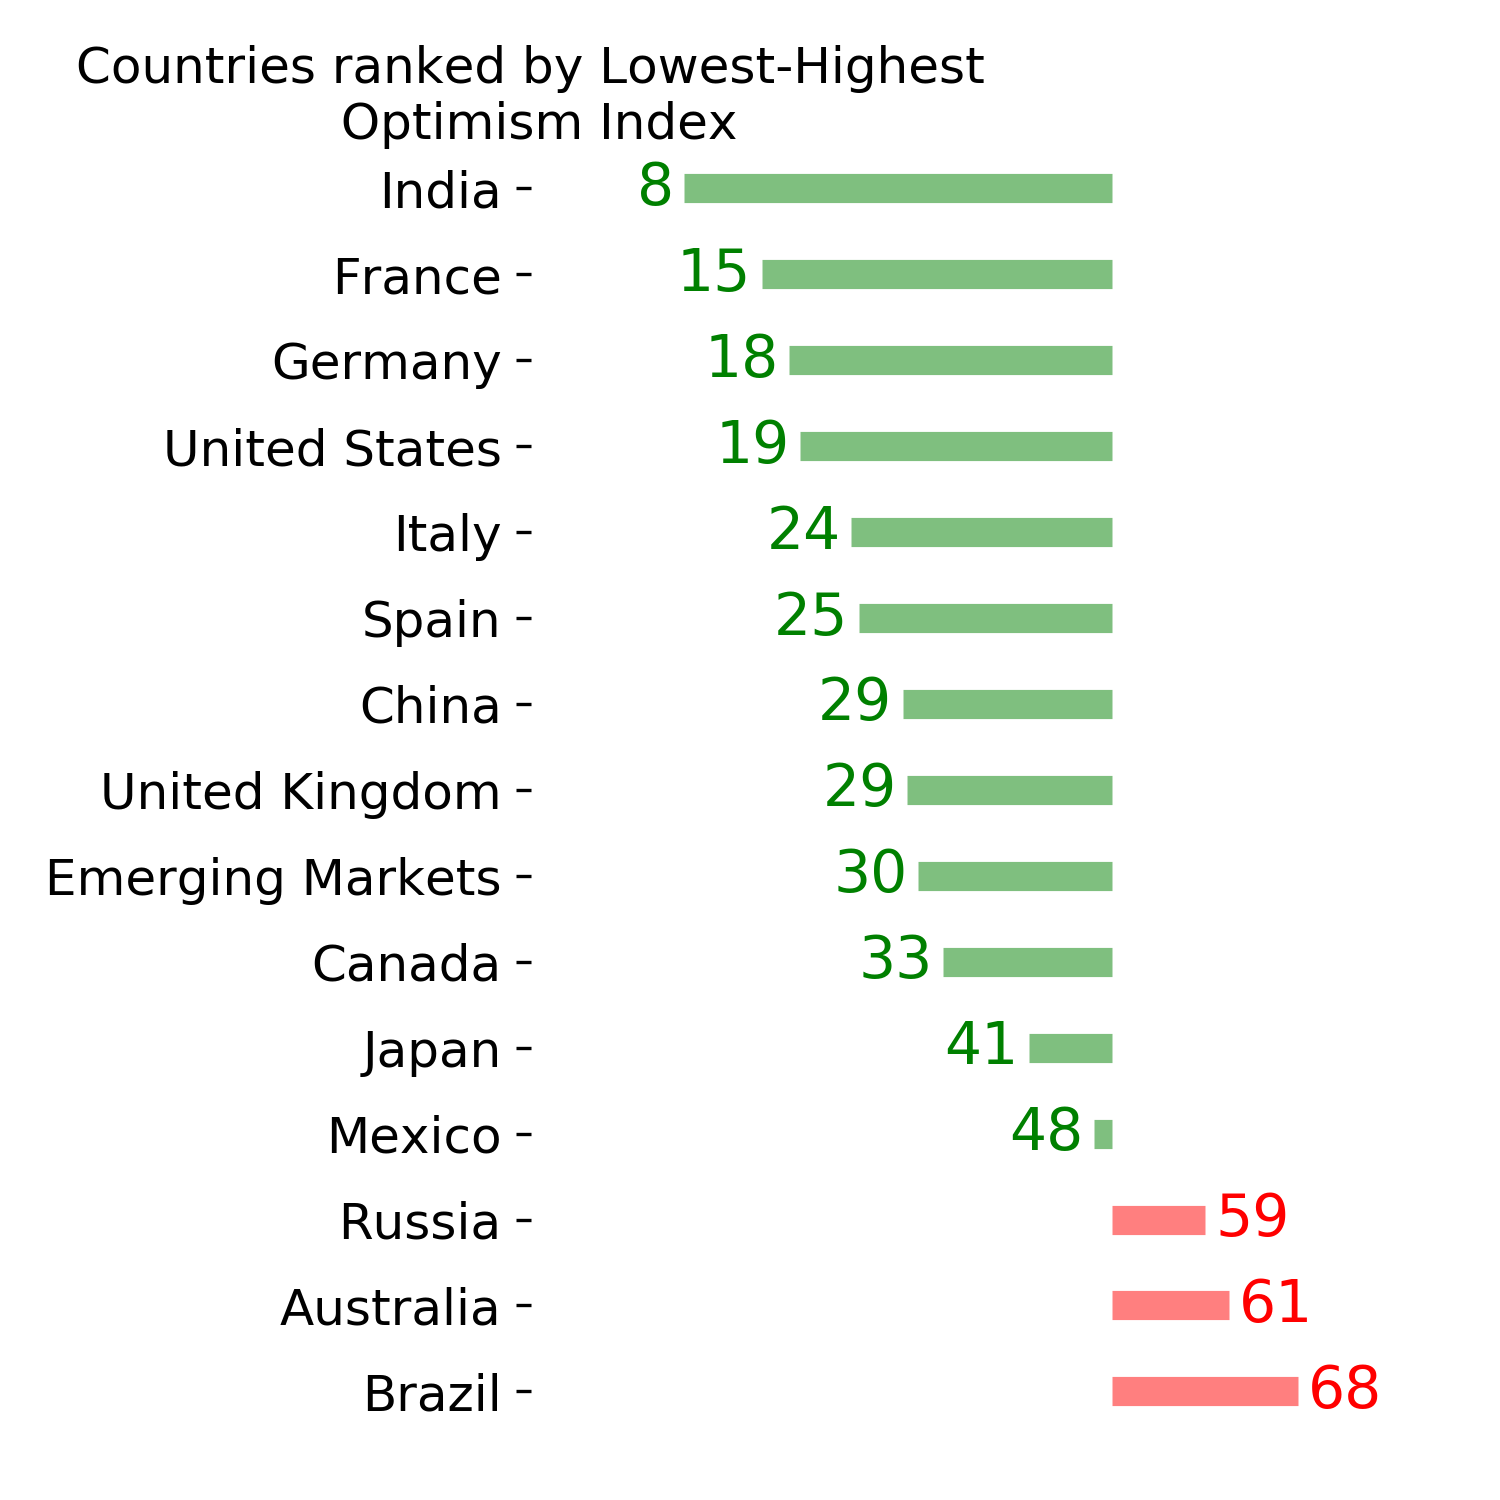
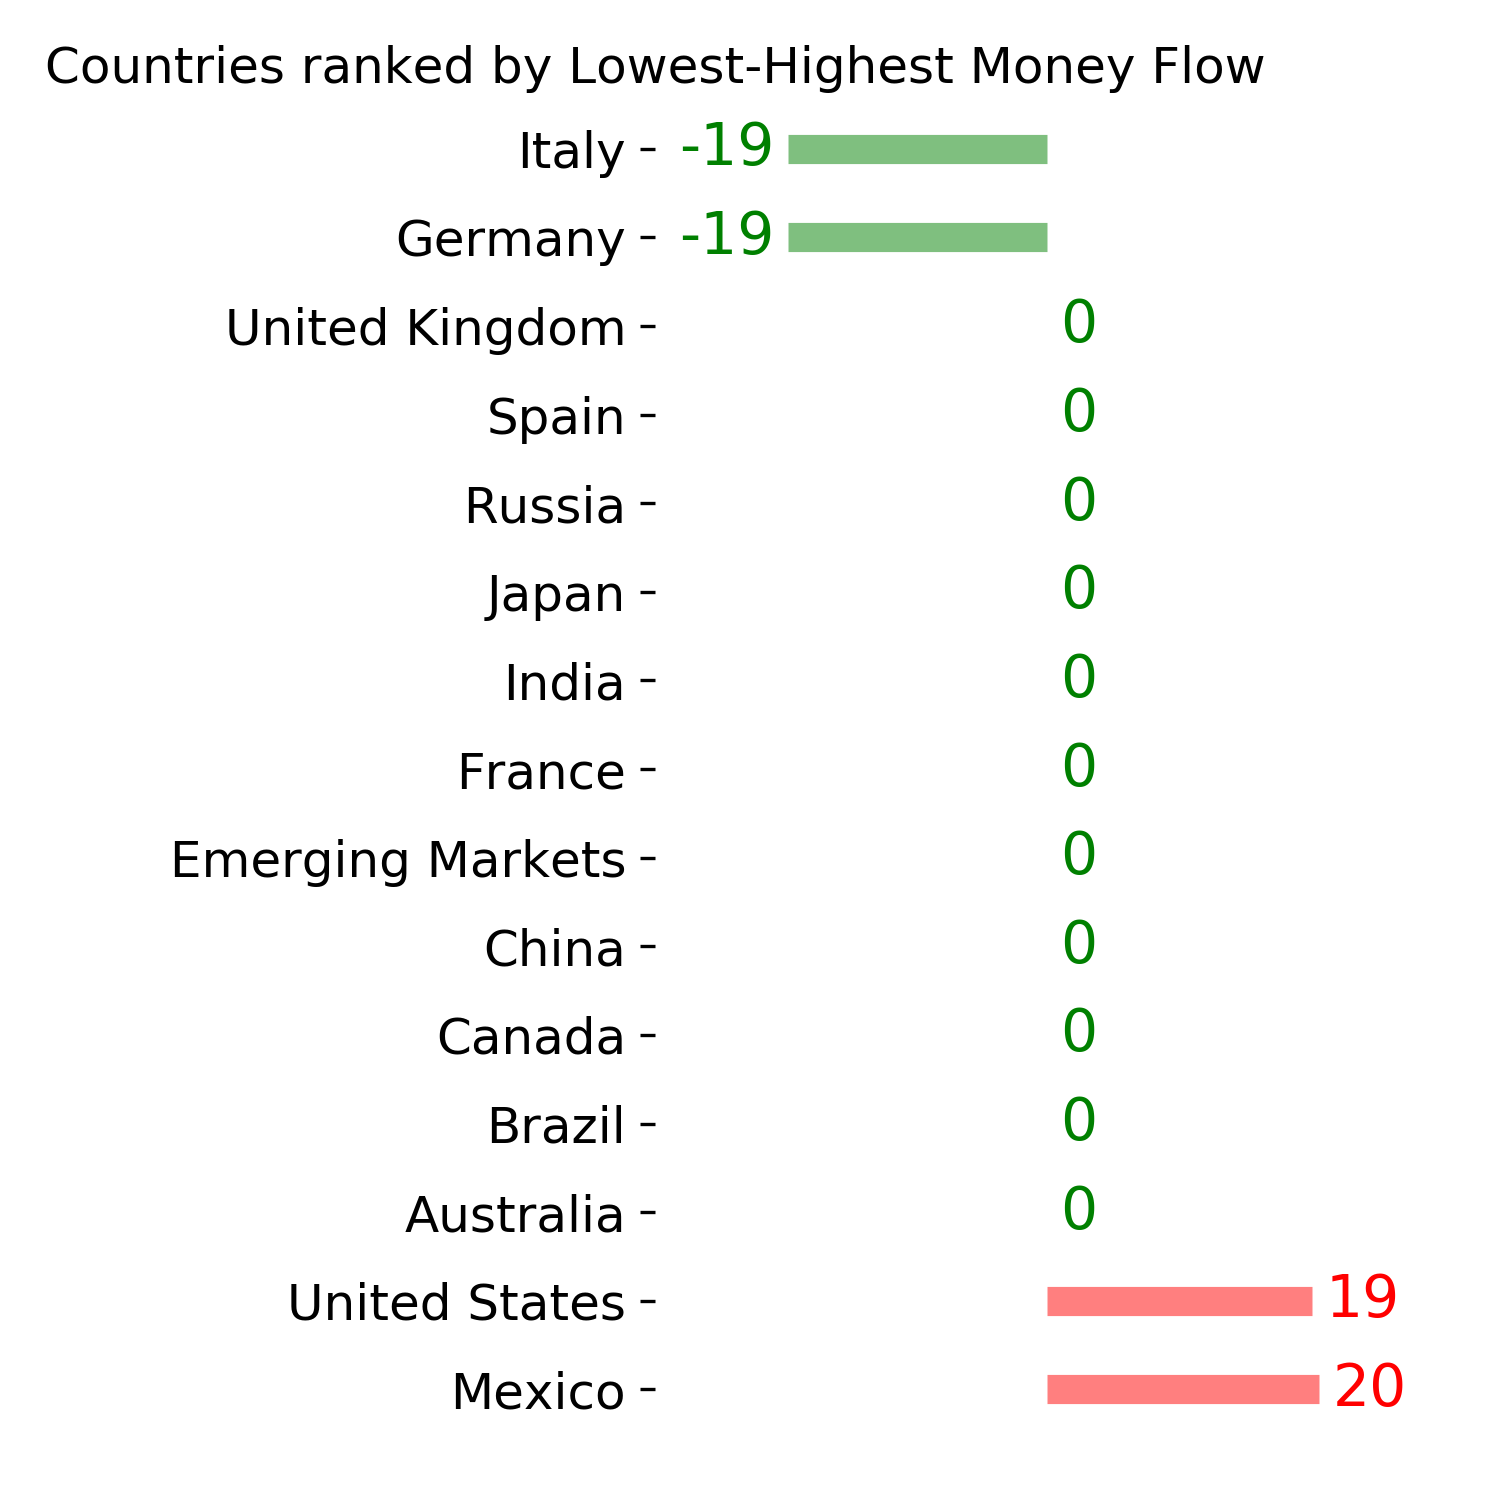
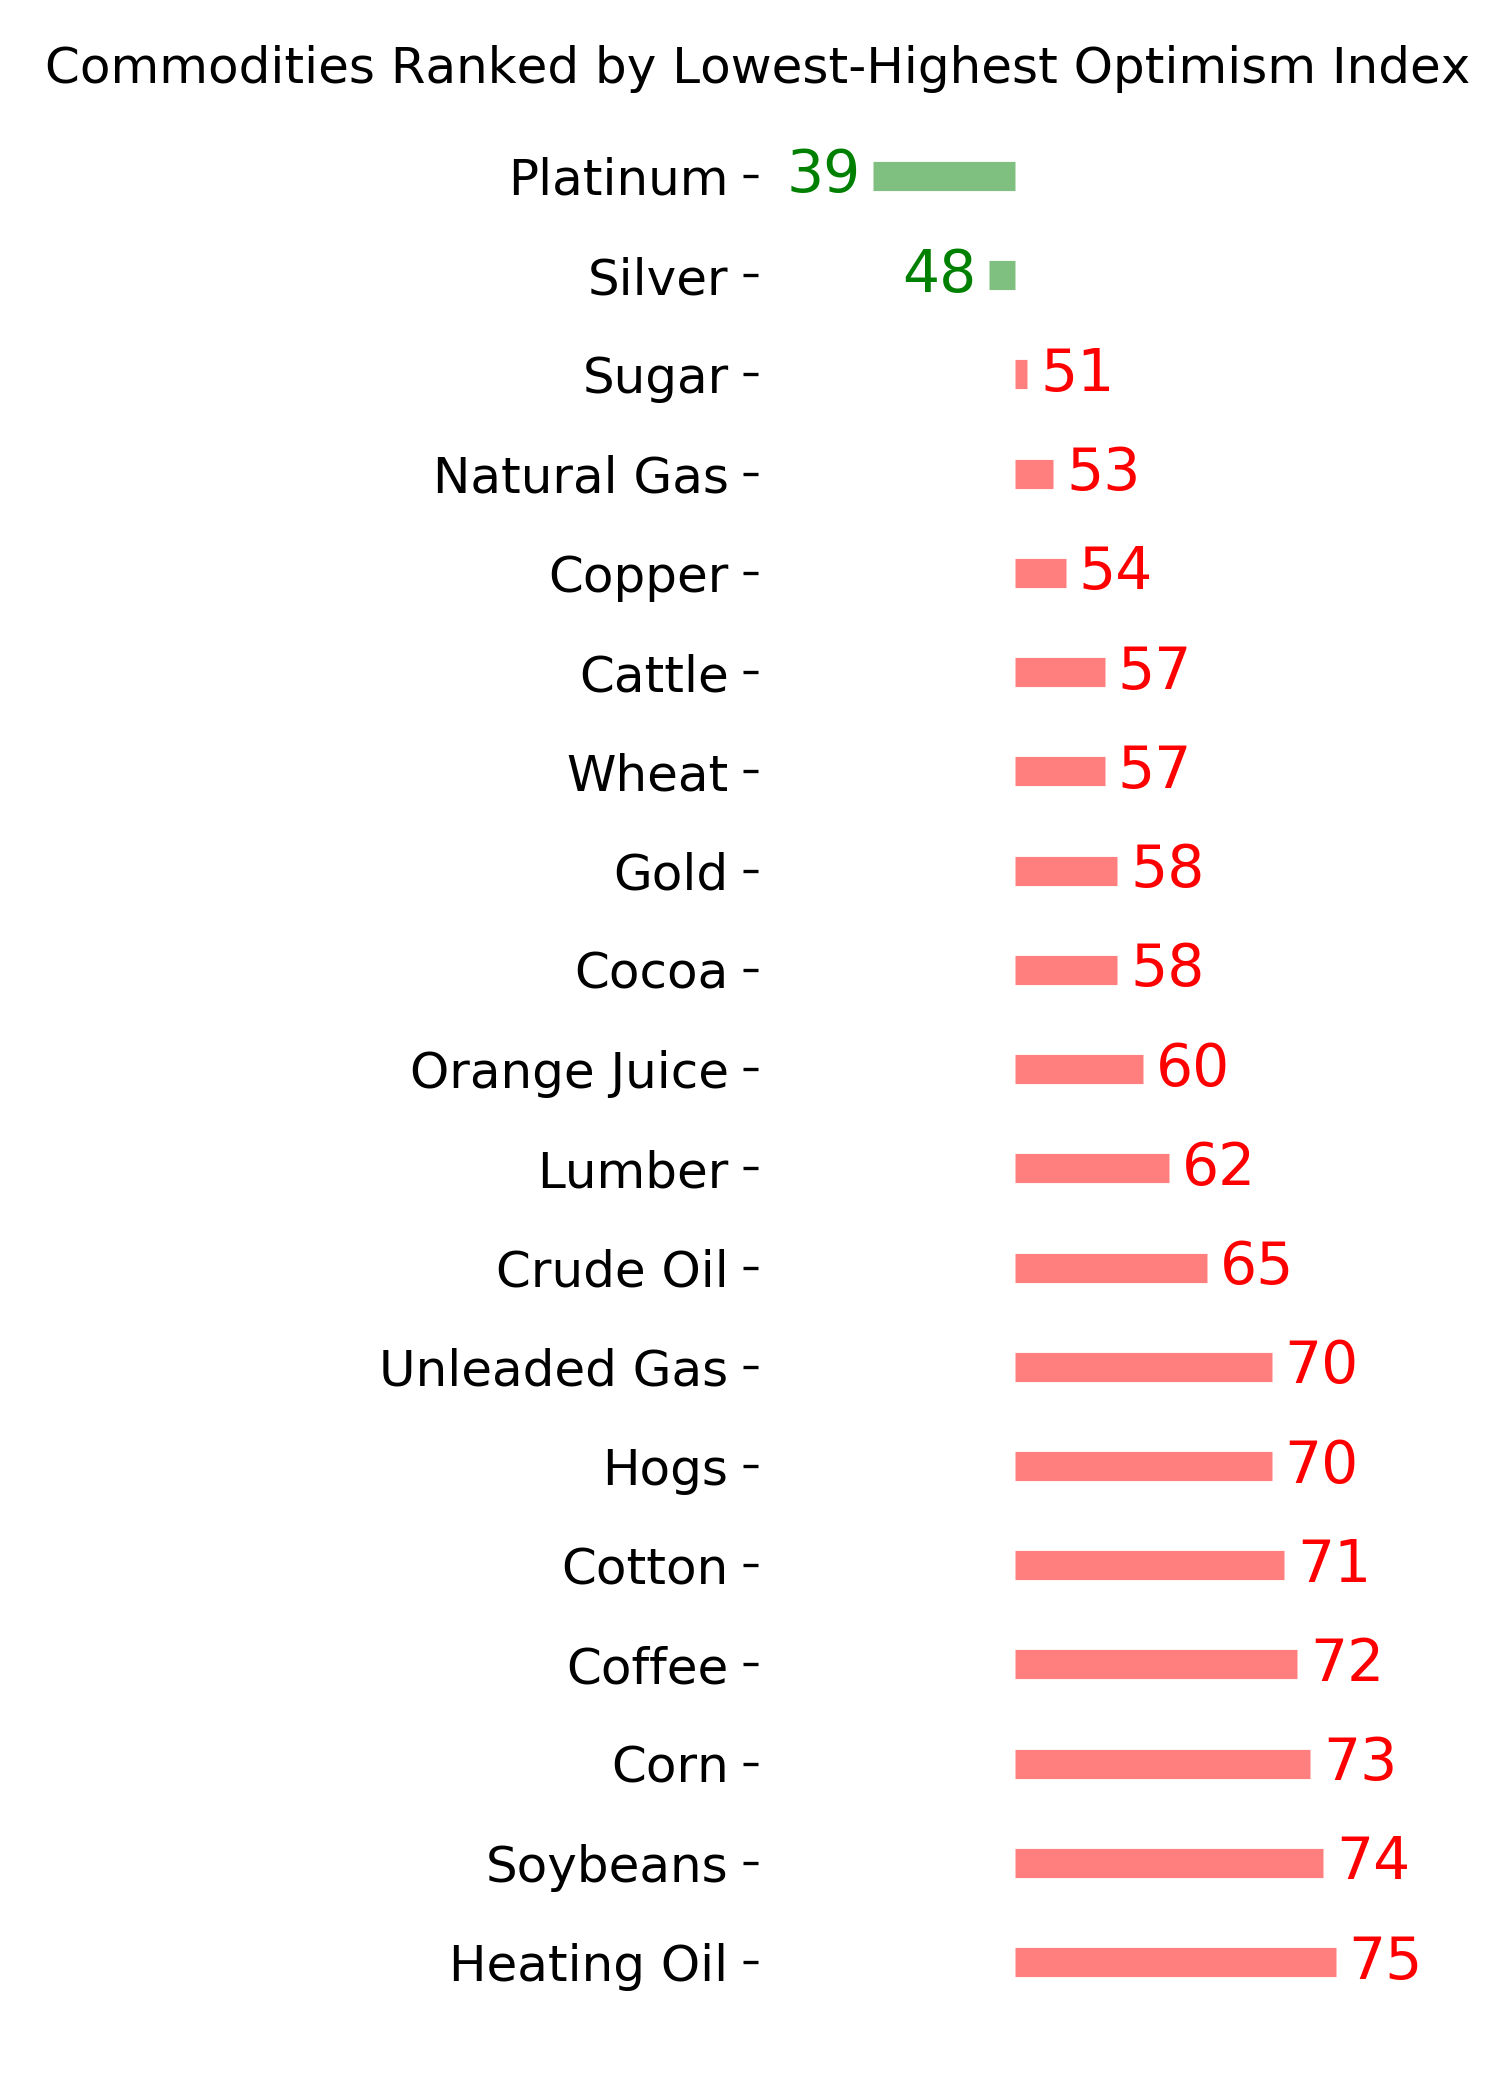
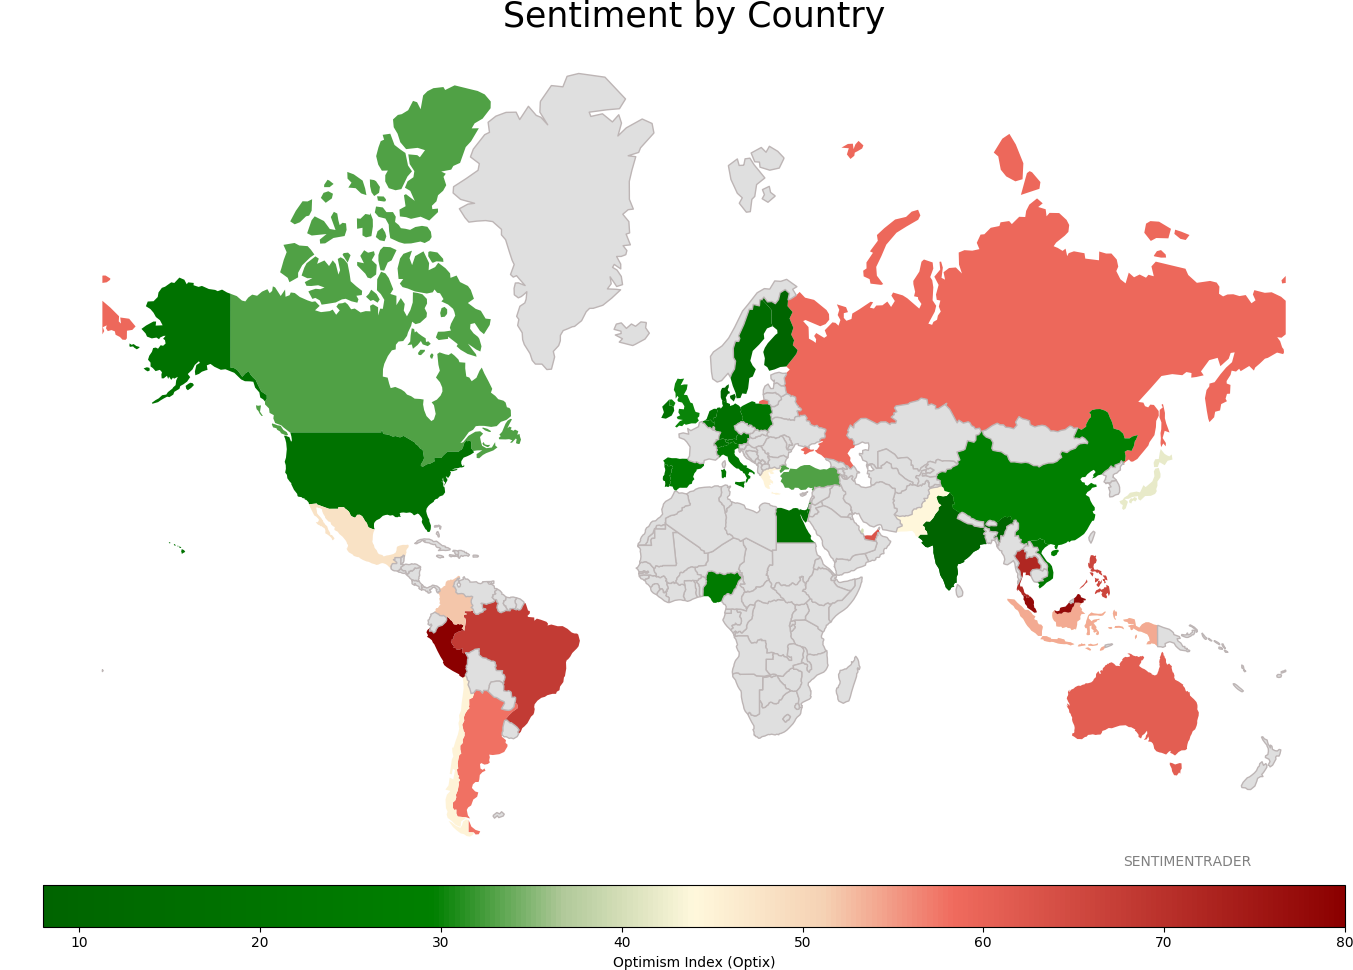
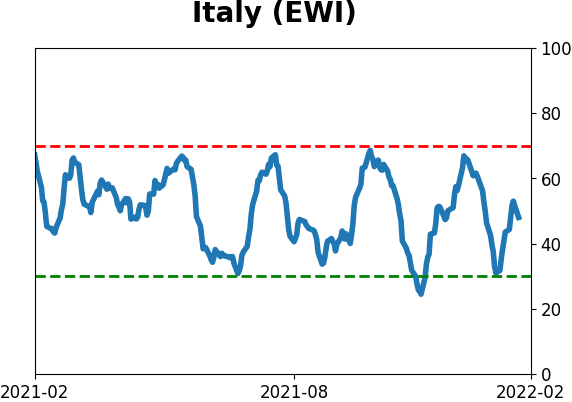
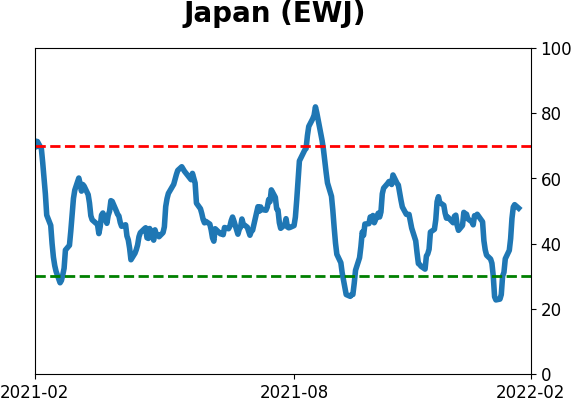
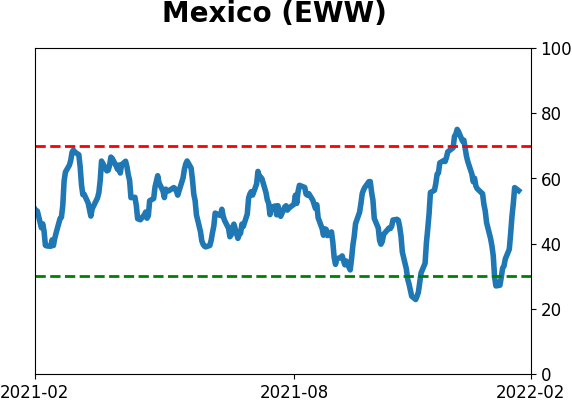
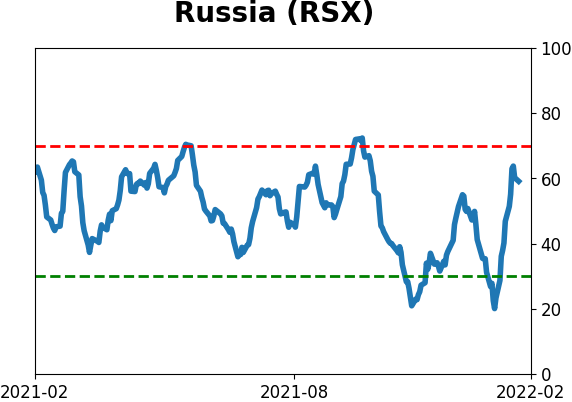
Sentiment Around The World
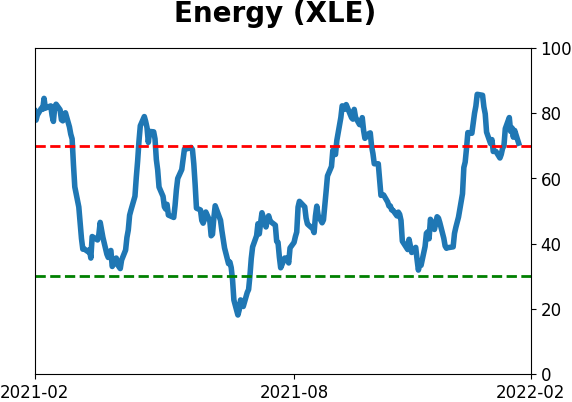
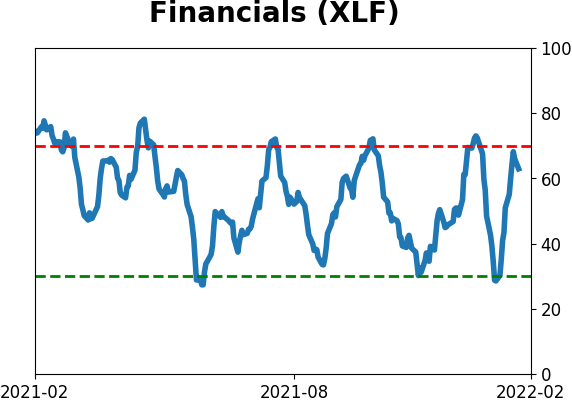
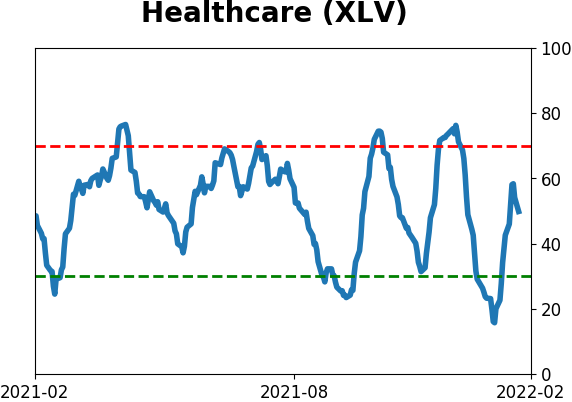
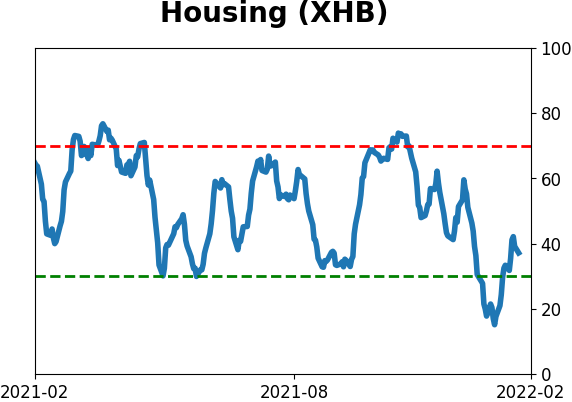
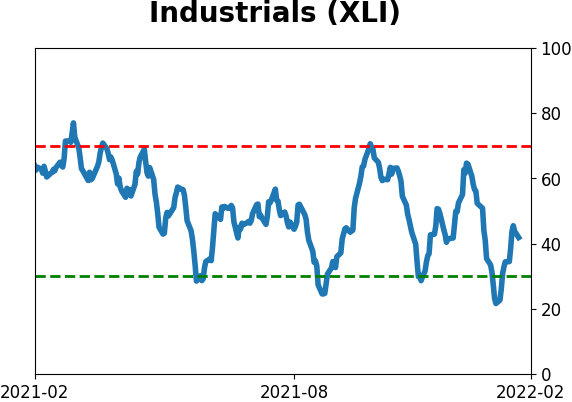
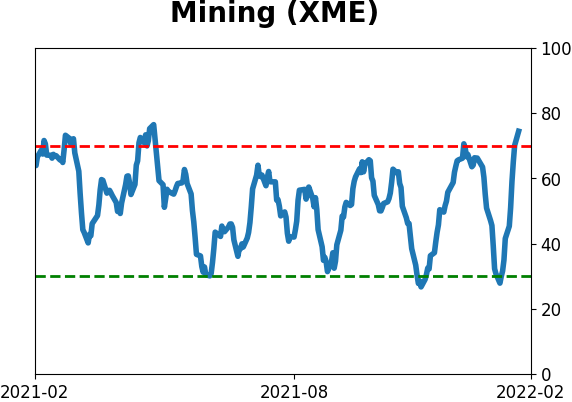
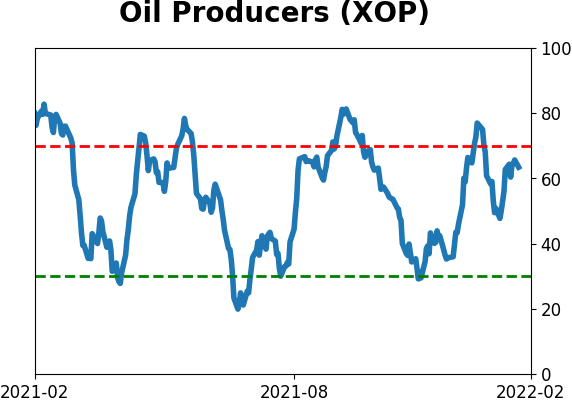
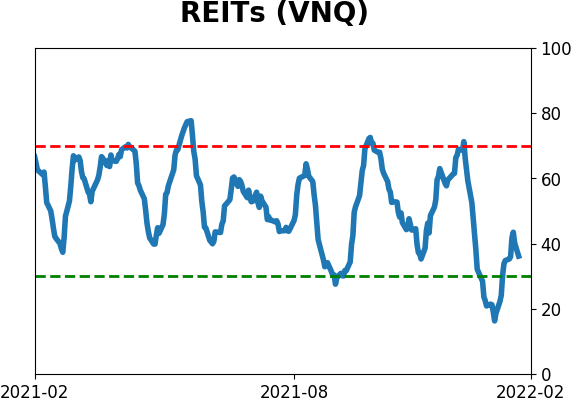
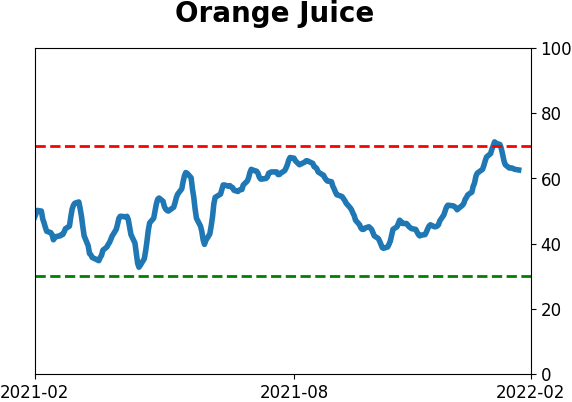
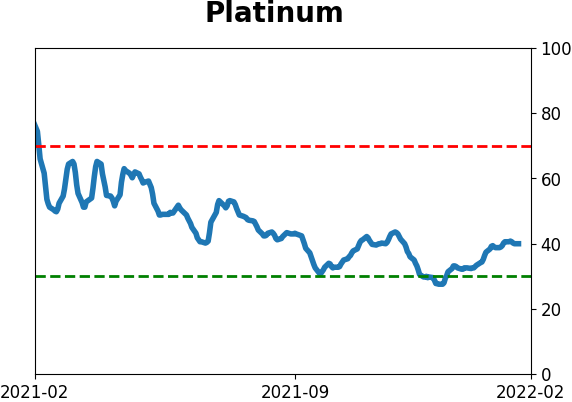
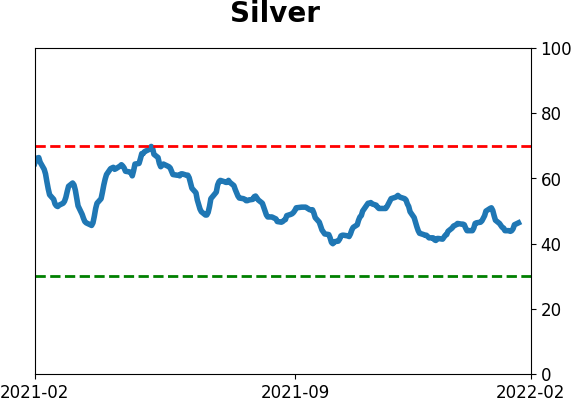
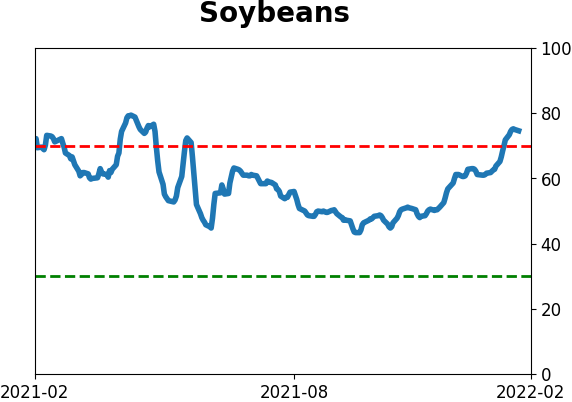
Optimism Index Thumbnails
|
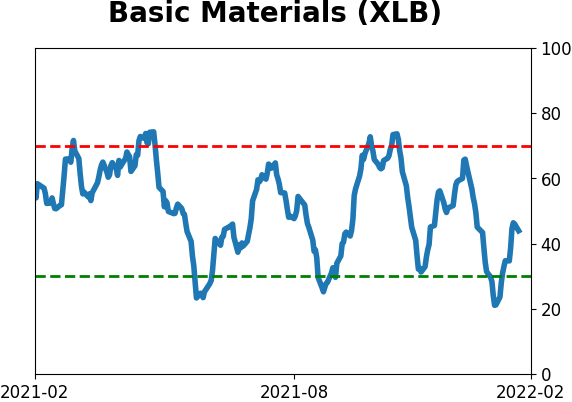
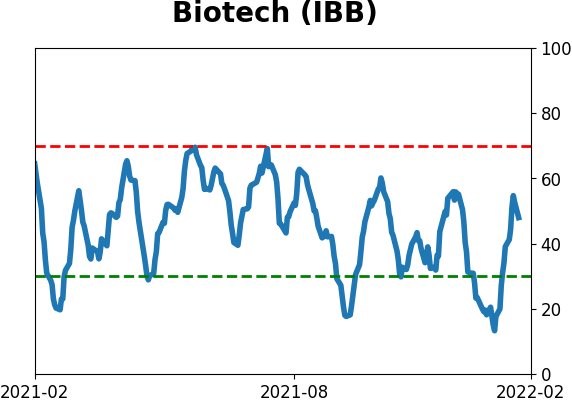
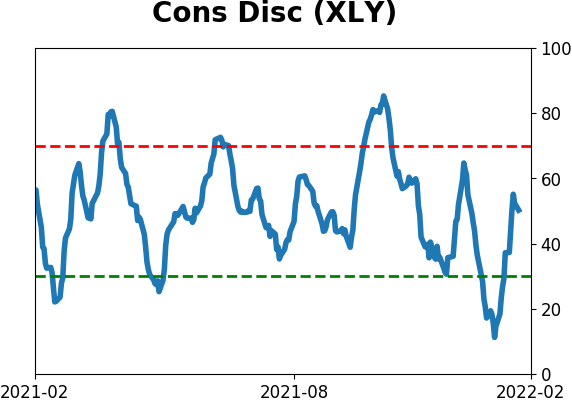
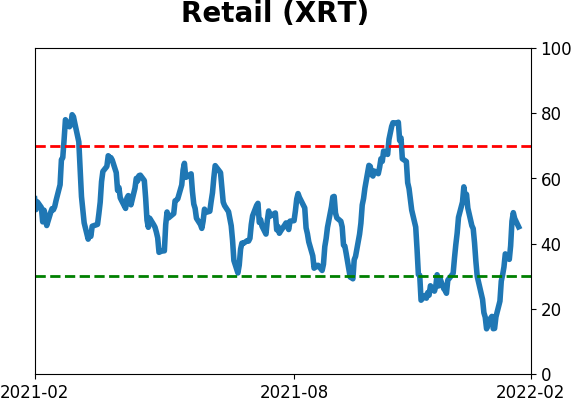
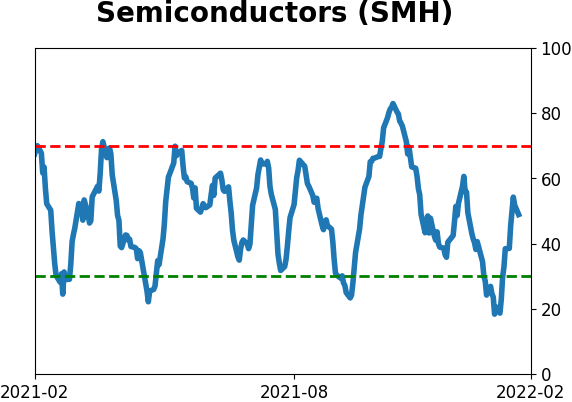
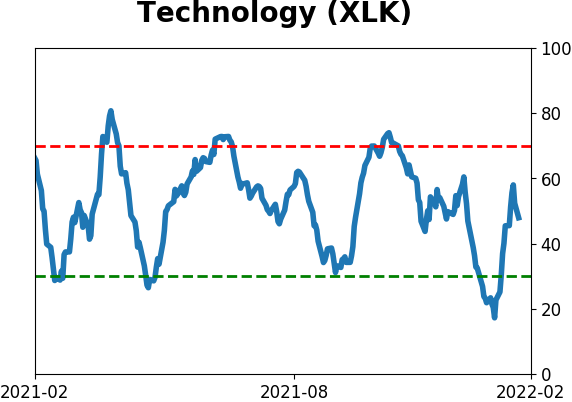
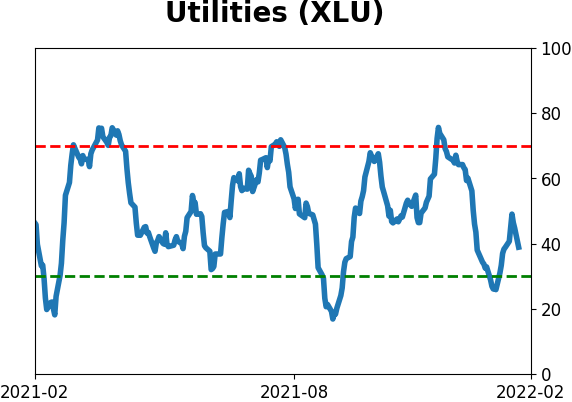
Sector ETF's - 10-Day Moving Average
|
|
|
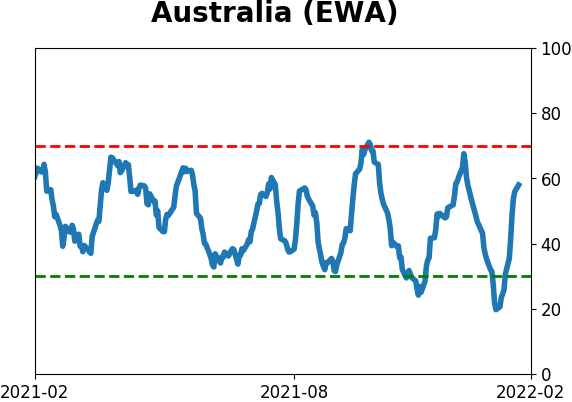
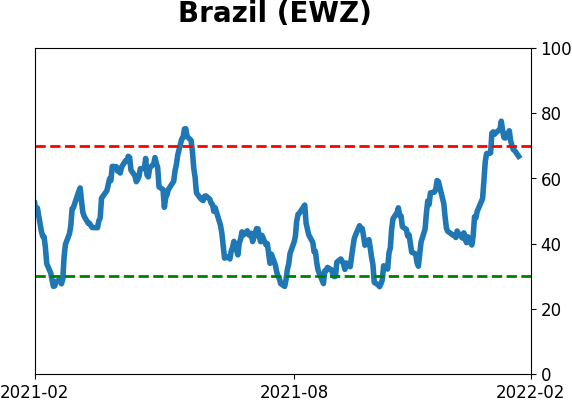
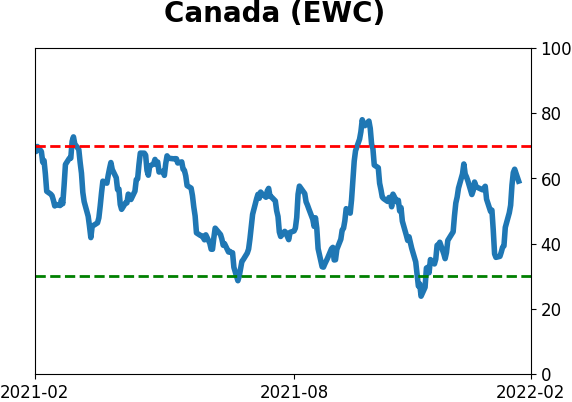
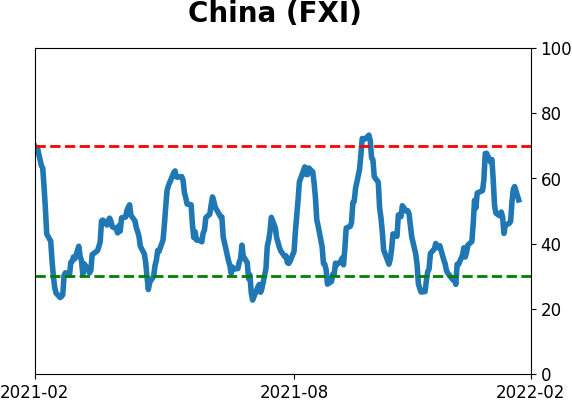
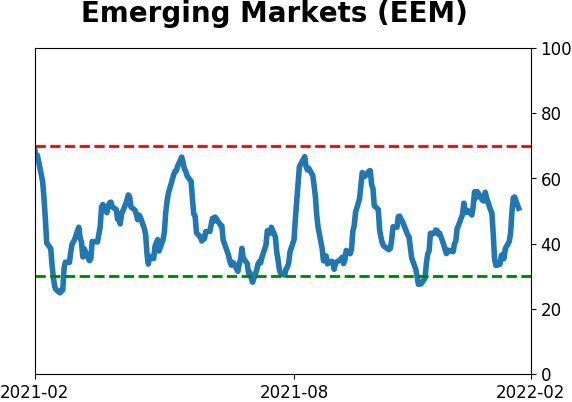
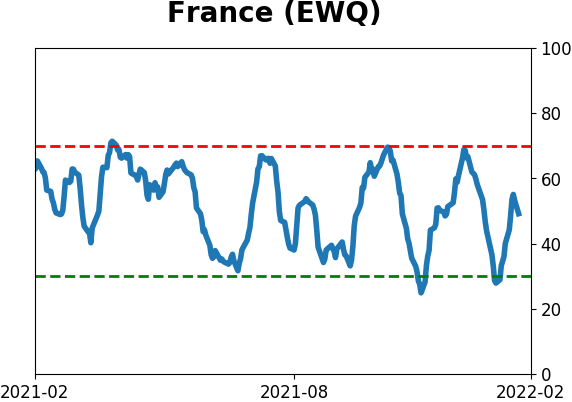
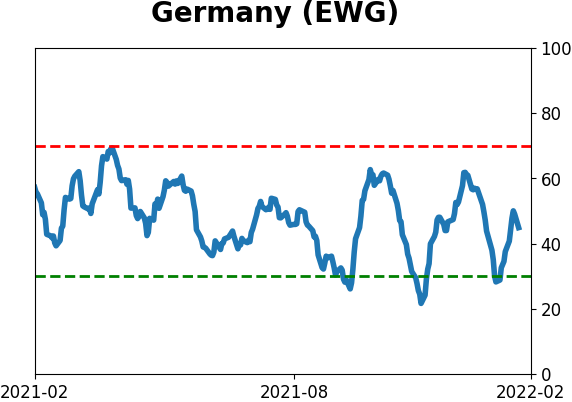
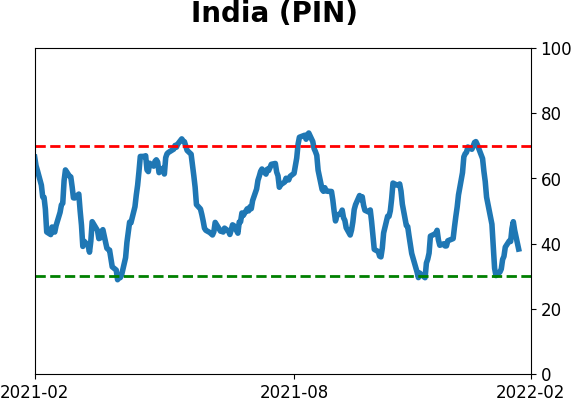
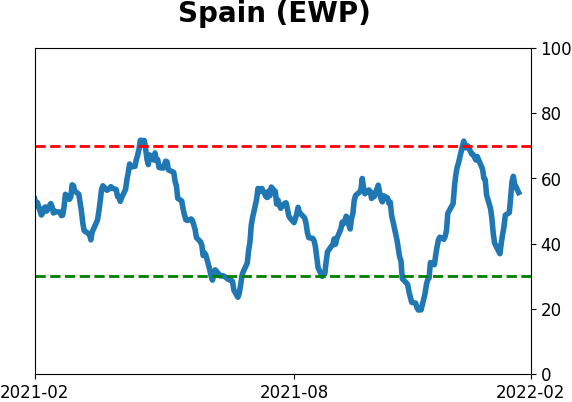
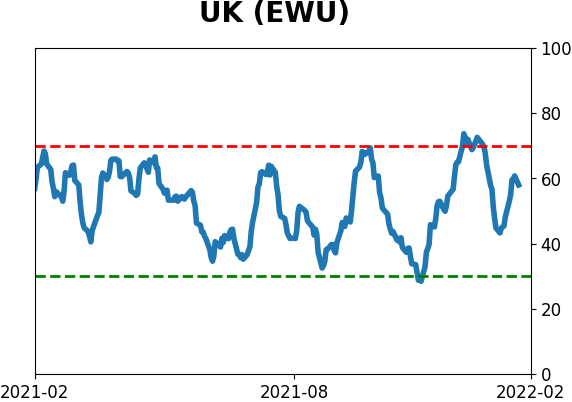
Country ETF's - 10-Day Moving Average
|
|
|
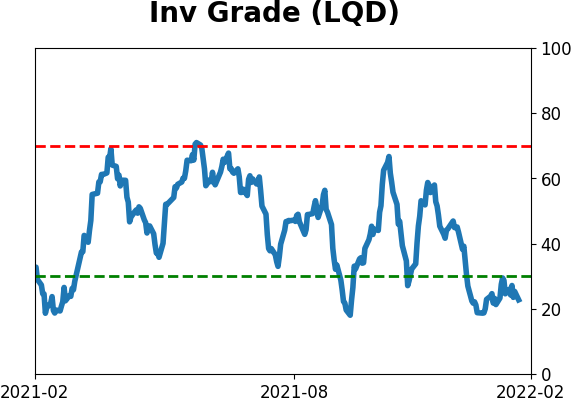
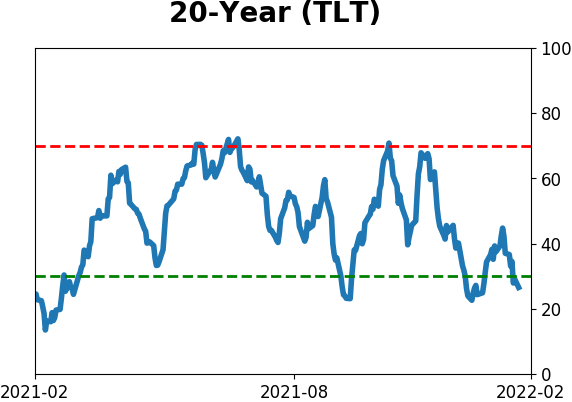
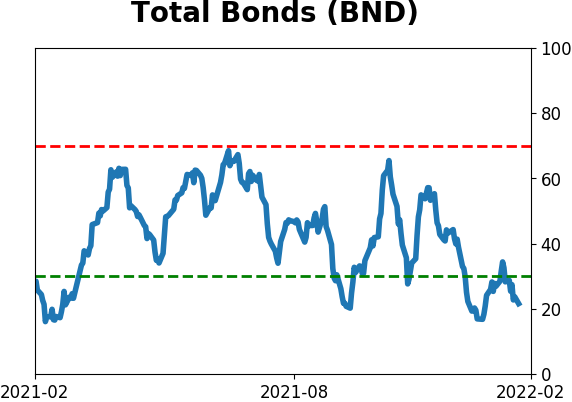
Bond ETF's - 10-Day Moving Average
|
|
|
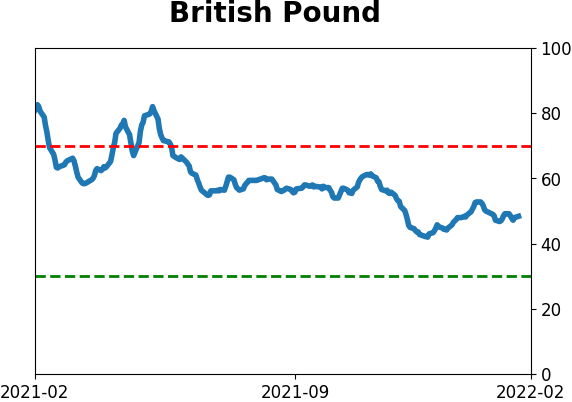
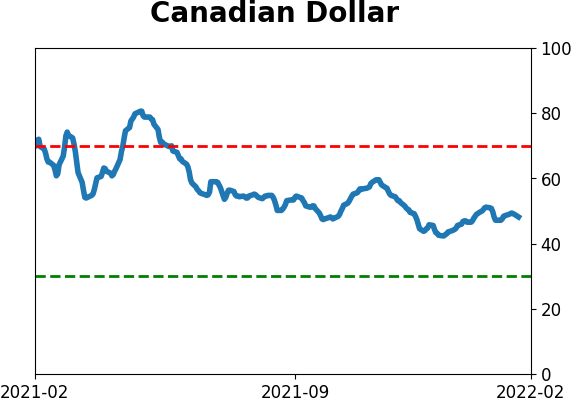
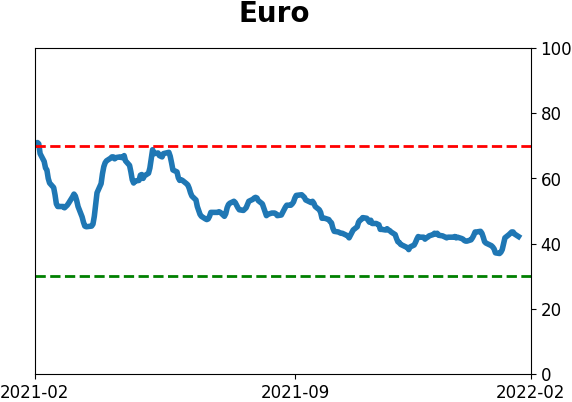
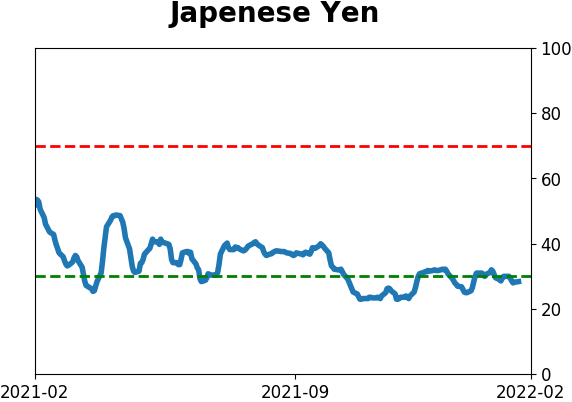
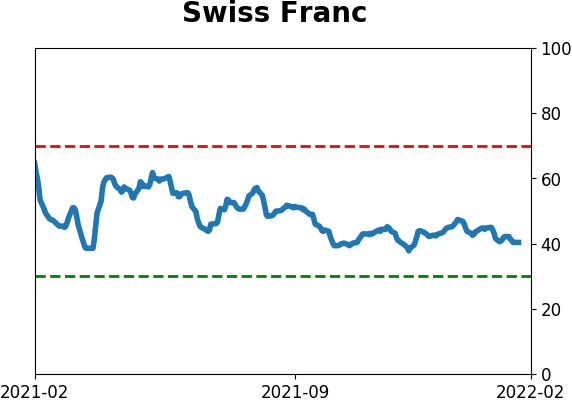
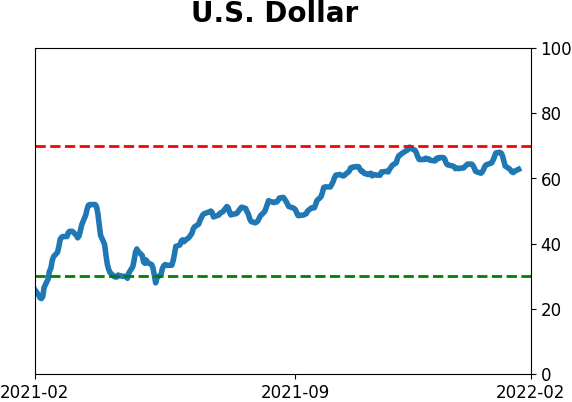
Currency ETF's - 5-Day Moving Average
|
|
|
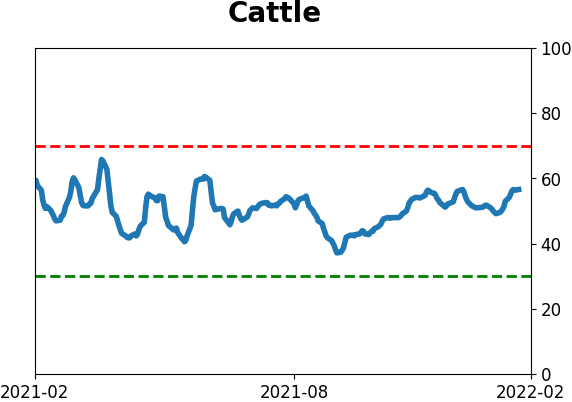
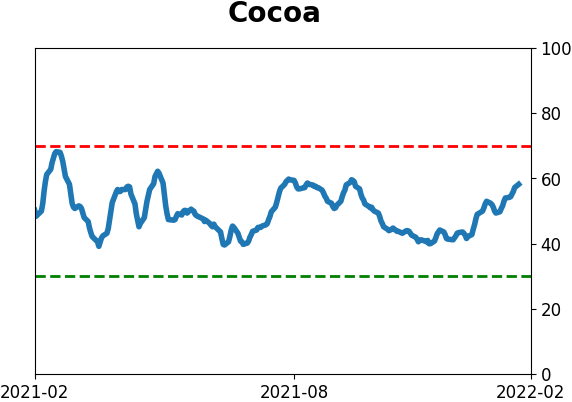
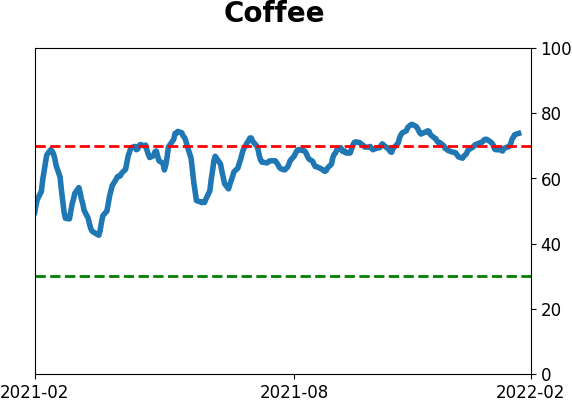
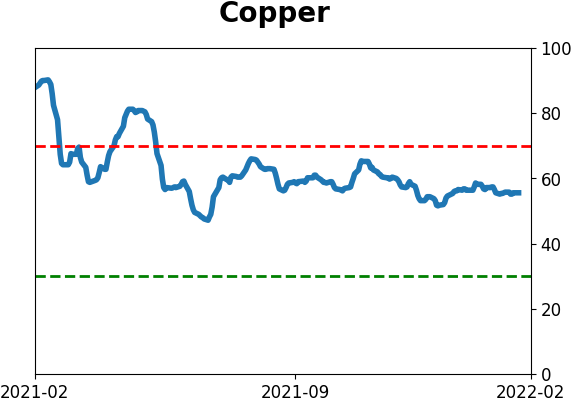
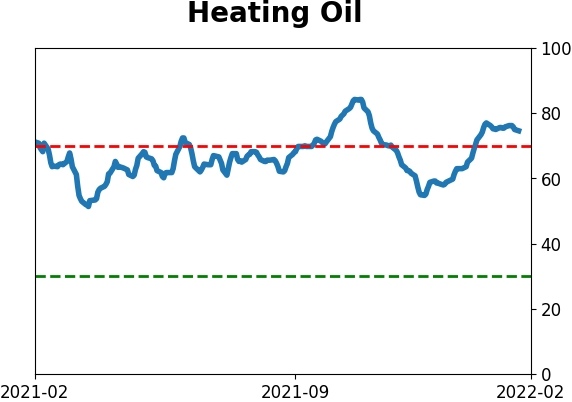
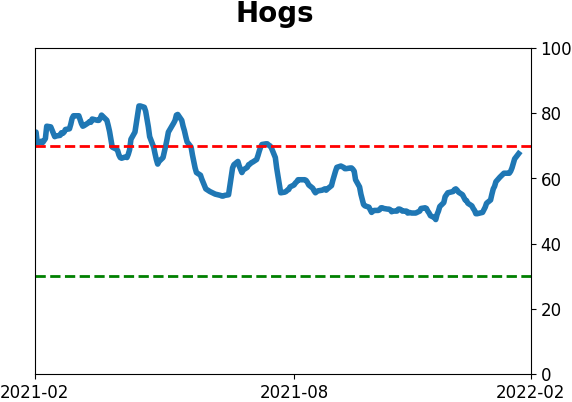
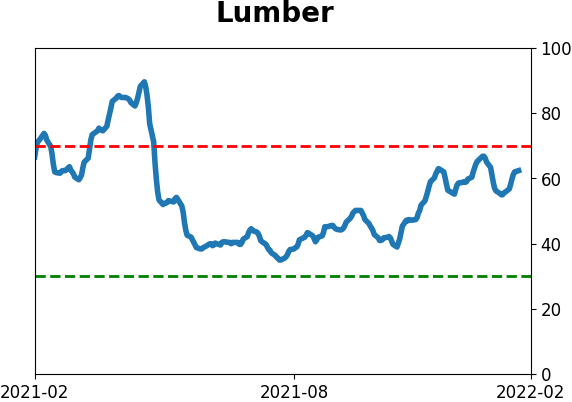
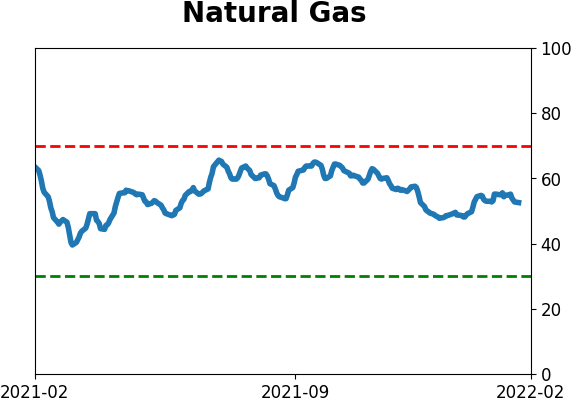
Commodity ETF's - 5-Day Moving Average
|
|