Headlines
|
|
The S&P enjoys a near record-breaking stretch of calm momentum:
The most important stock index in the world has neared a record stretch of calm momentum. The S&P 500 has gone more than 70 days without a 2% pullback and rallied more than 20% during that stretch, exceeding all but two time periods since 1928. Similar calm momentum led to short-term losses and long-term gains.
|
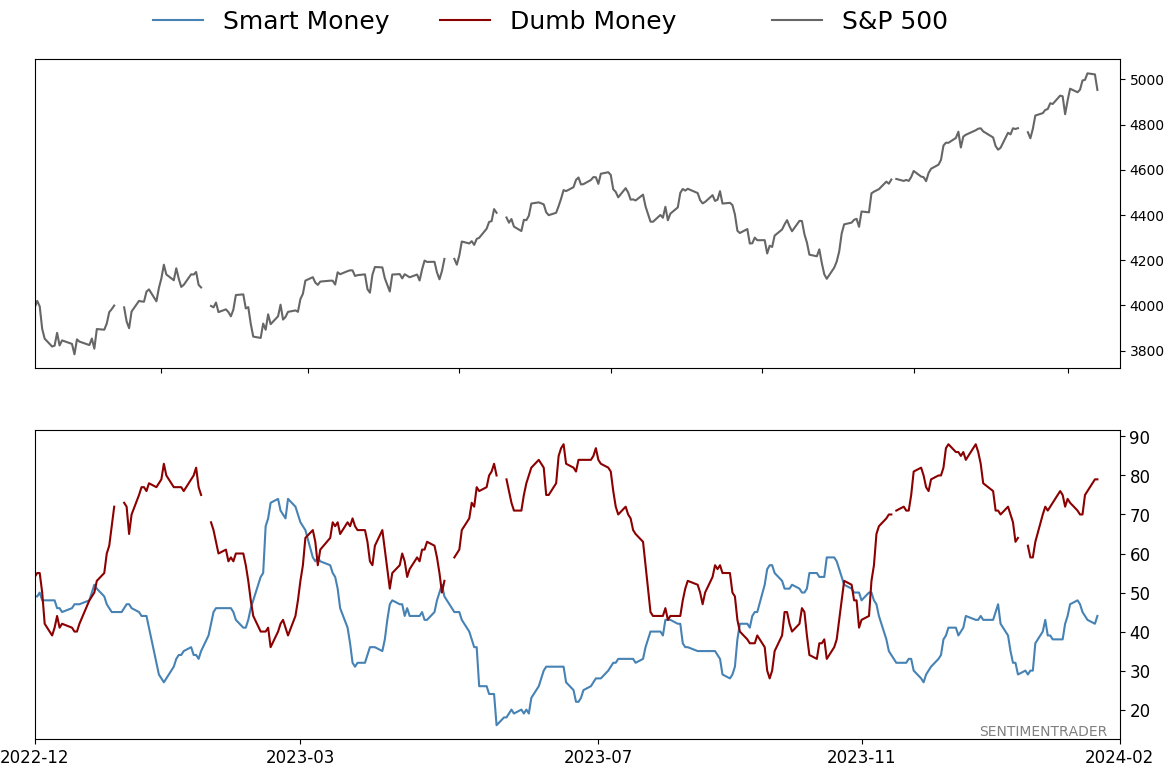
Smart / Dumb Money Confidence
|
Smart Money Confidence: 44%
Dumb Money Confidence: 79%
|
|
Risk Levels
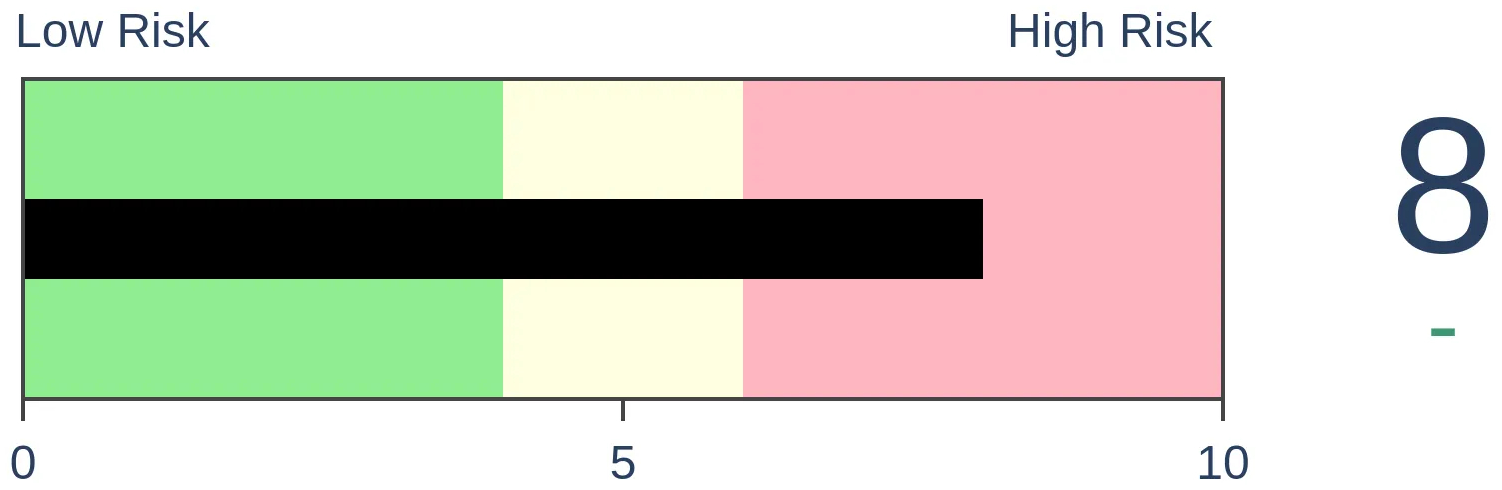
Stocks Short-Term
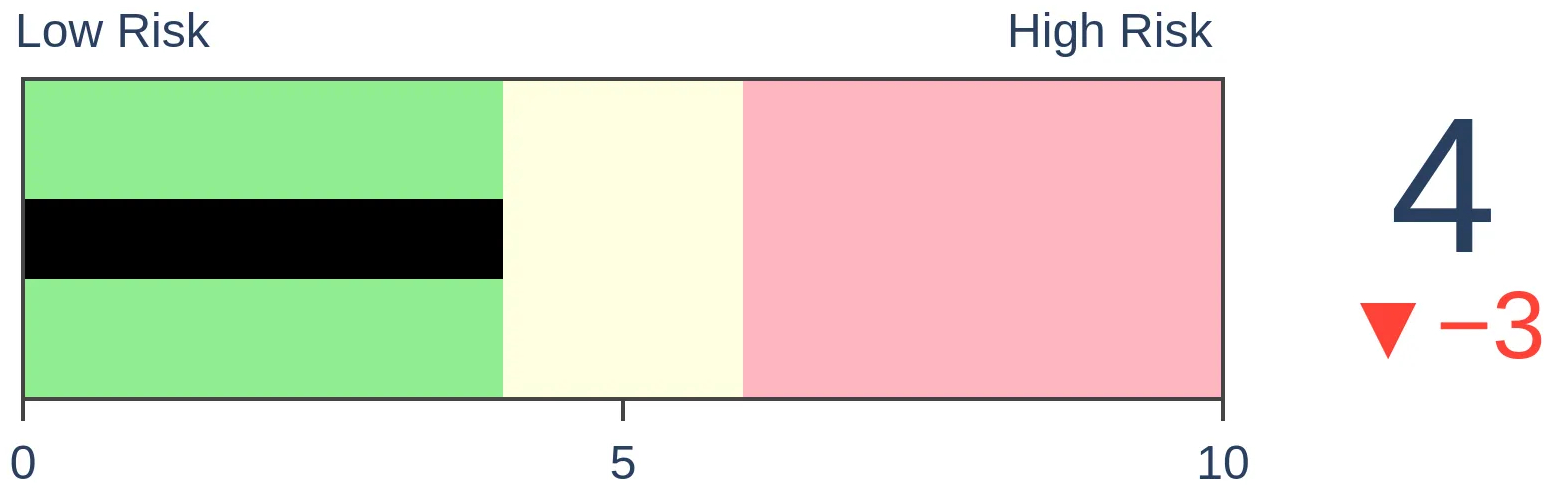
|
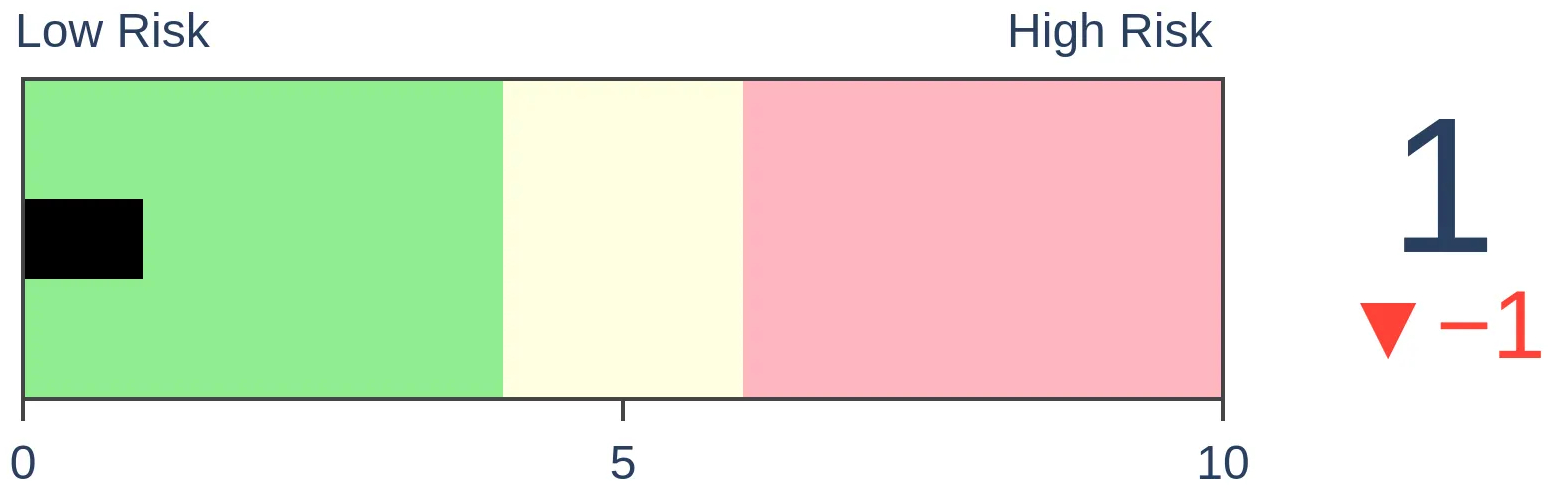
Stocks Medium-Term
|
|
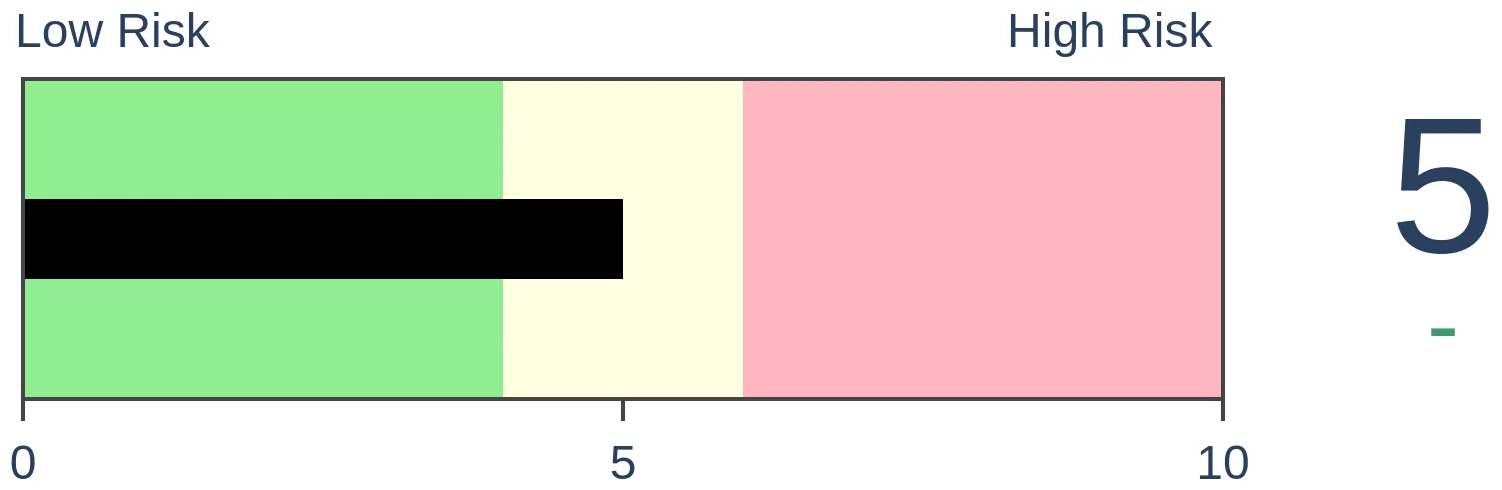
Bonds
|
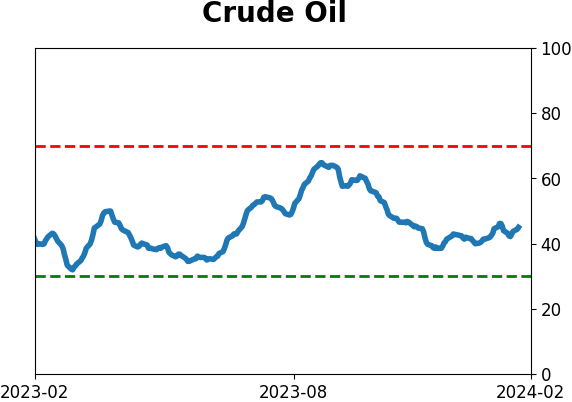
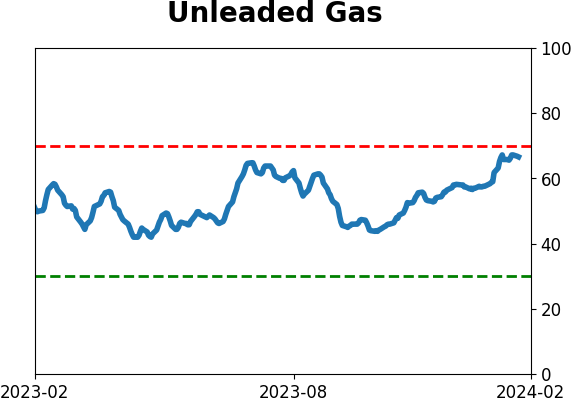
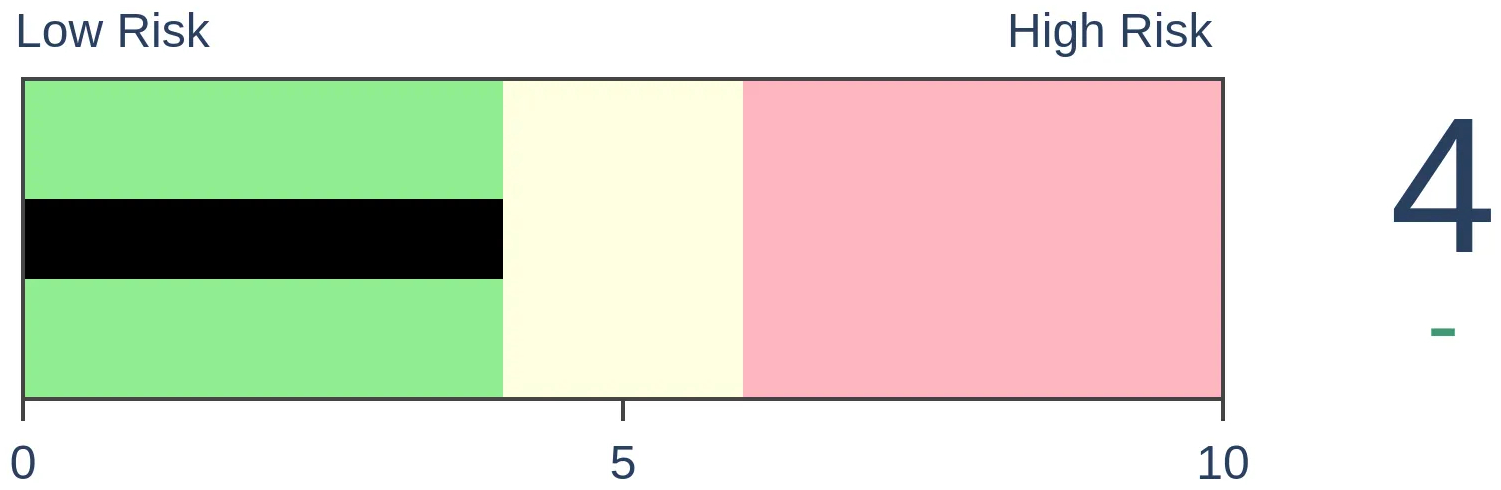
Crude Oil
|
|
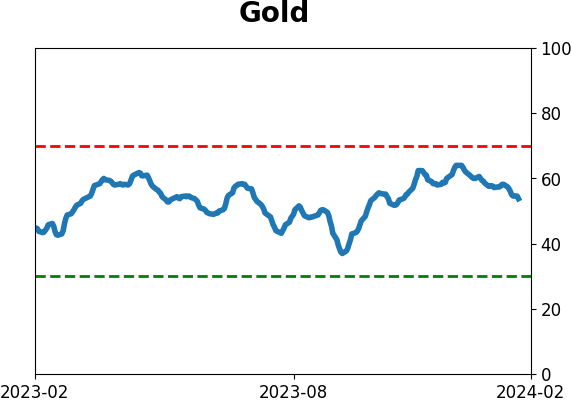
Gold
|
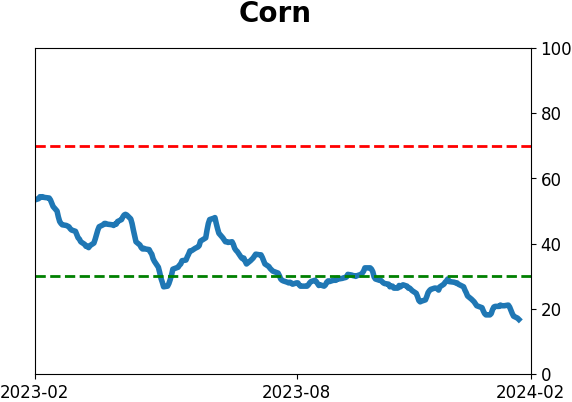
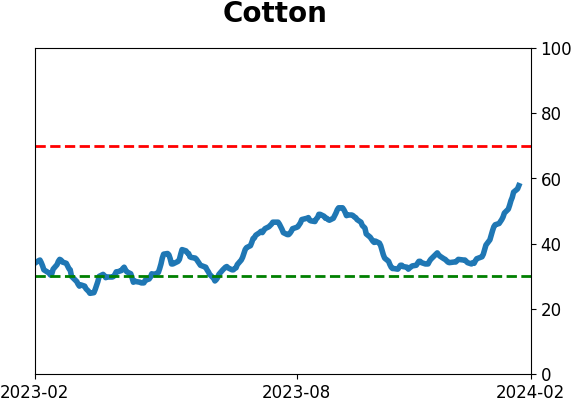
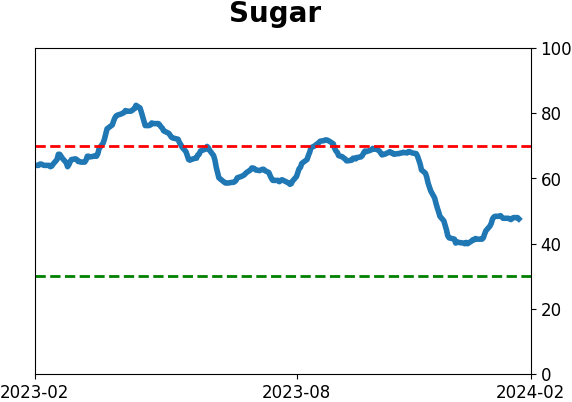
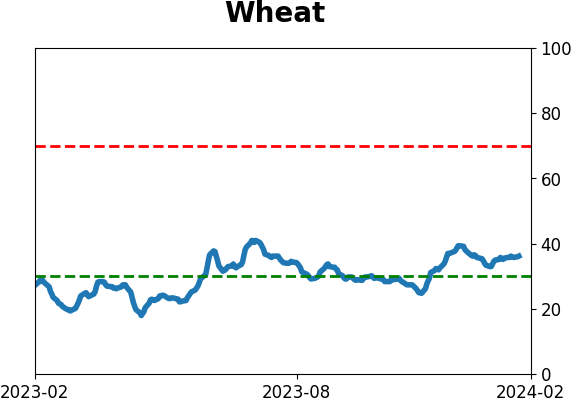
Agriculture

|
|
Research
By Jason Goepfert
BOTTOM LINE
The most important stock index in the world has neared a record stretch of calm momentum. The S&P 500 has gone more than 70 days without a 2% pullback and rallied more than 20% during that stretch, exceeding all but two time periods since 1928. Similar calm momentum led to short-term losses and long-term gains.
FORECAST / TIMEFRAME
None
|
Key points:
- The S&P 500 has gone more than 70 days without a 2% pullback
- During that stretch, it rallied more than 20%, exceeding all but two time periods since 1928
- Similar bouts of calm momentum led to short-term losses and mostly long-term gains
Nearing a record stretch of large, calm gains
It's been months since the most benchmarked index in the world stumbled even slightly. That's enough to set contrarians on edge because markets aren't in the habit of making things too easy for investors.
If the losses indicated on Tuesday hold and build a bit, we might finally see the first 2% pullback in the S&P 500 since the rally kicked off last October. This is long enough to rank the current streak in the top 25 all-time.
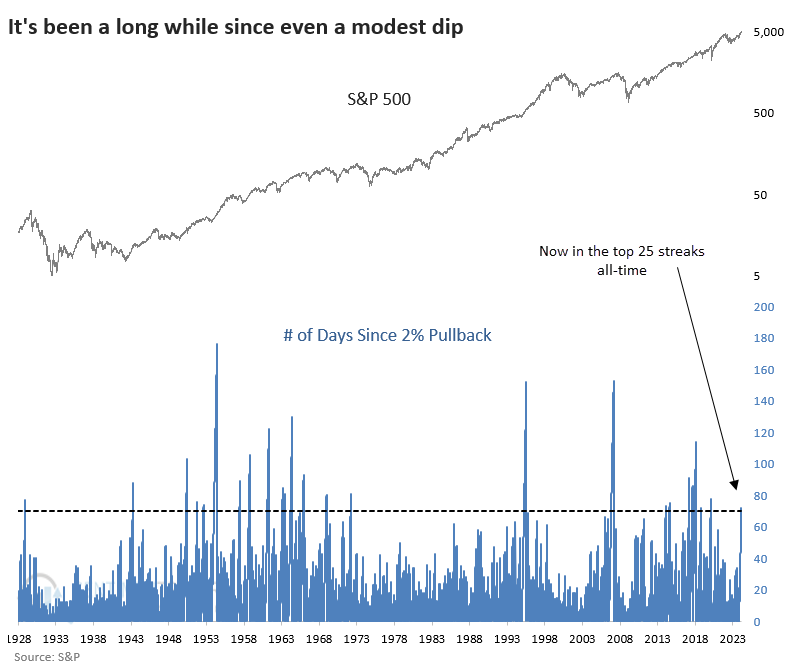
Not only has this streak been among the longest the S&P 500 has enjoyed since 1928, but it ranks among the very best in magnitude as well. With a 22% rally during the streak, only two other time periods beat it.
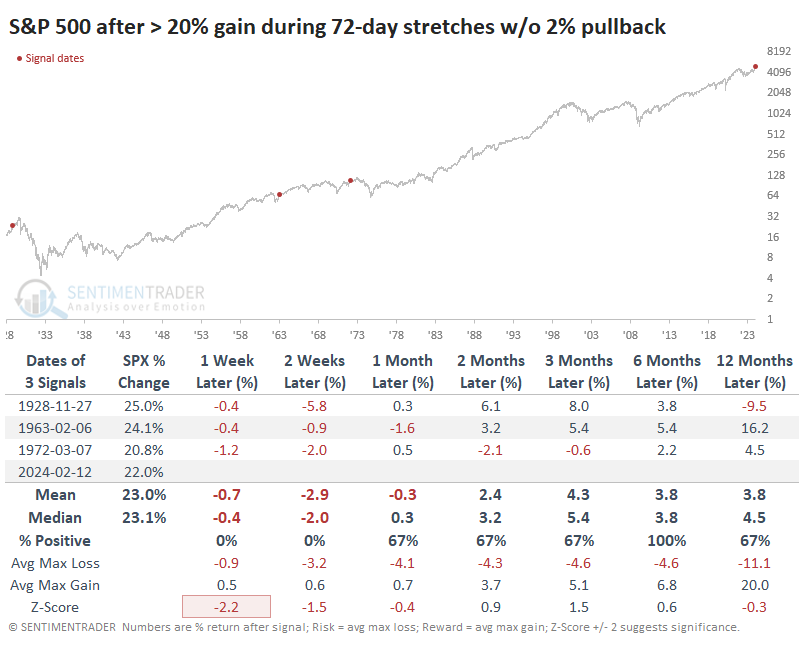
Granted, there isn't much we can glean from a sample size of three, but the few times the S&P enjoyed such a run, its risk outweighed its reward each time over the next two months.
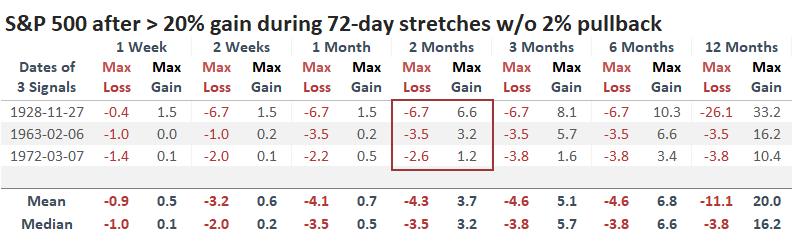
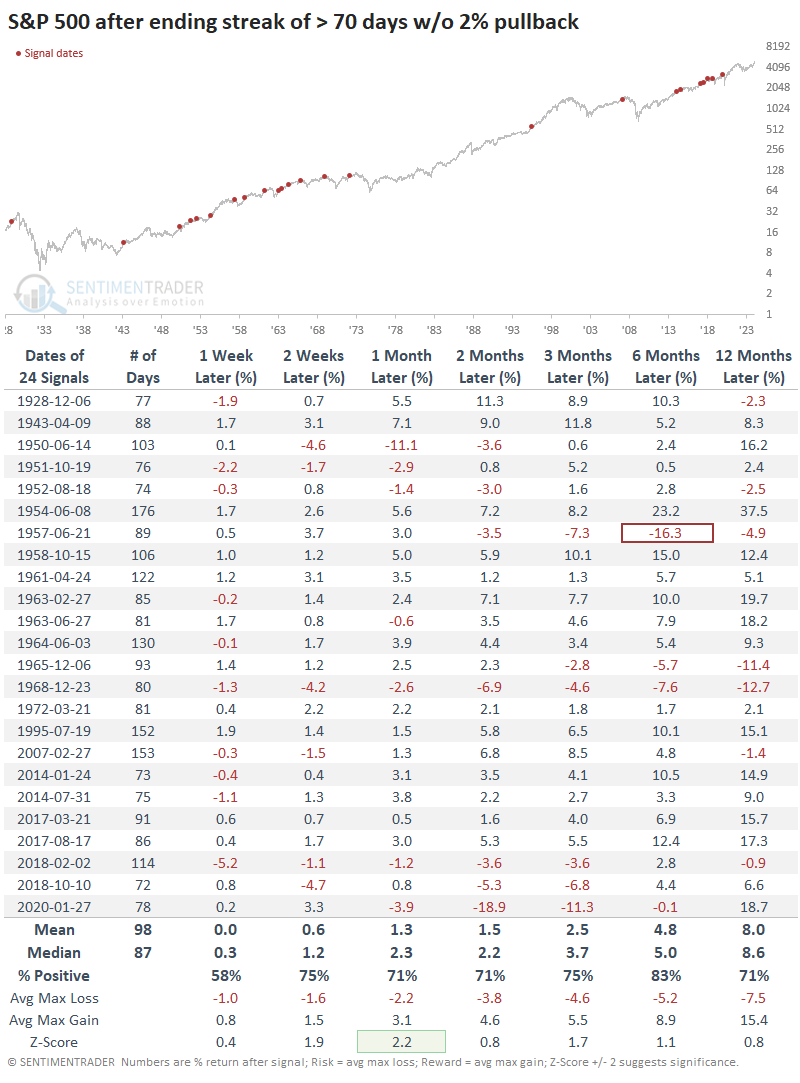
If we broaden the sample by looking at the most significant rallies during 72-day streaks without a 2% pullback, the implication of short-term weakness continues. Up to two months later, the S&P still showed a negative mean return. The best part for the bulls is that those short-term pullbacks served as setups for resuming long-term upward momentum.
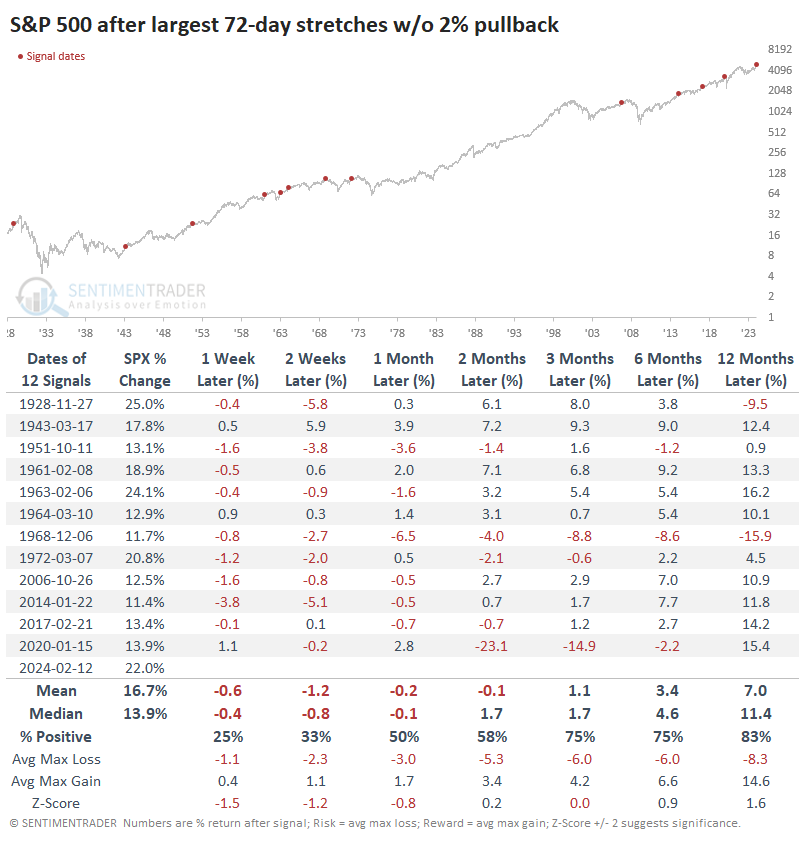
If traders start to ease back on their risk-taking here and we finally end the streak without a 2% pullback, it wasn't the worst of times for bulls.
The table below shows the ends of every streak since 1928, and forward returns were pretty good. Over the next six months, there was only a single double-digit loss, which proved to be about the end of that correction.
What the research tells us...
Investors have been battling between overbought/overloved extremes and some negative divergences versus a historic level of positive momentum. Those forces are always in opposition, and momentum usually wins or persists for longer than contrarians care to stick around.
We've seen an increasing number of technical warnings over the past few weeks, and even some momentum studies indicate that investors have likely reached a point where they tend to take a temporary break. But if the momentum shows us anything, it's that even if and when that break comes, there is a high likelihood that the resulting pullback should be temporary as those who missed their opportunity to get in finally sense an opening.
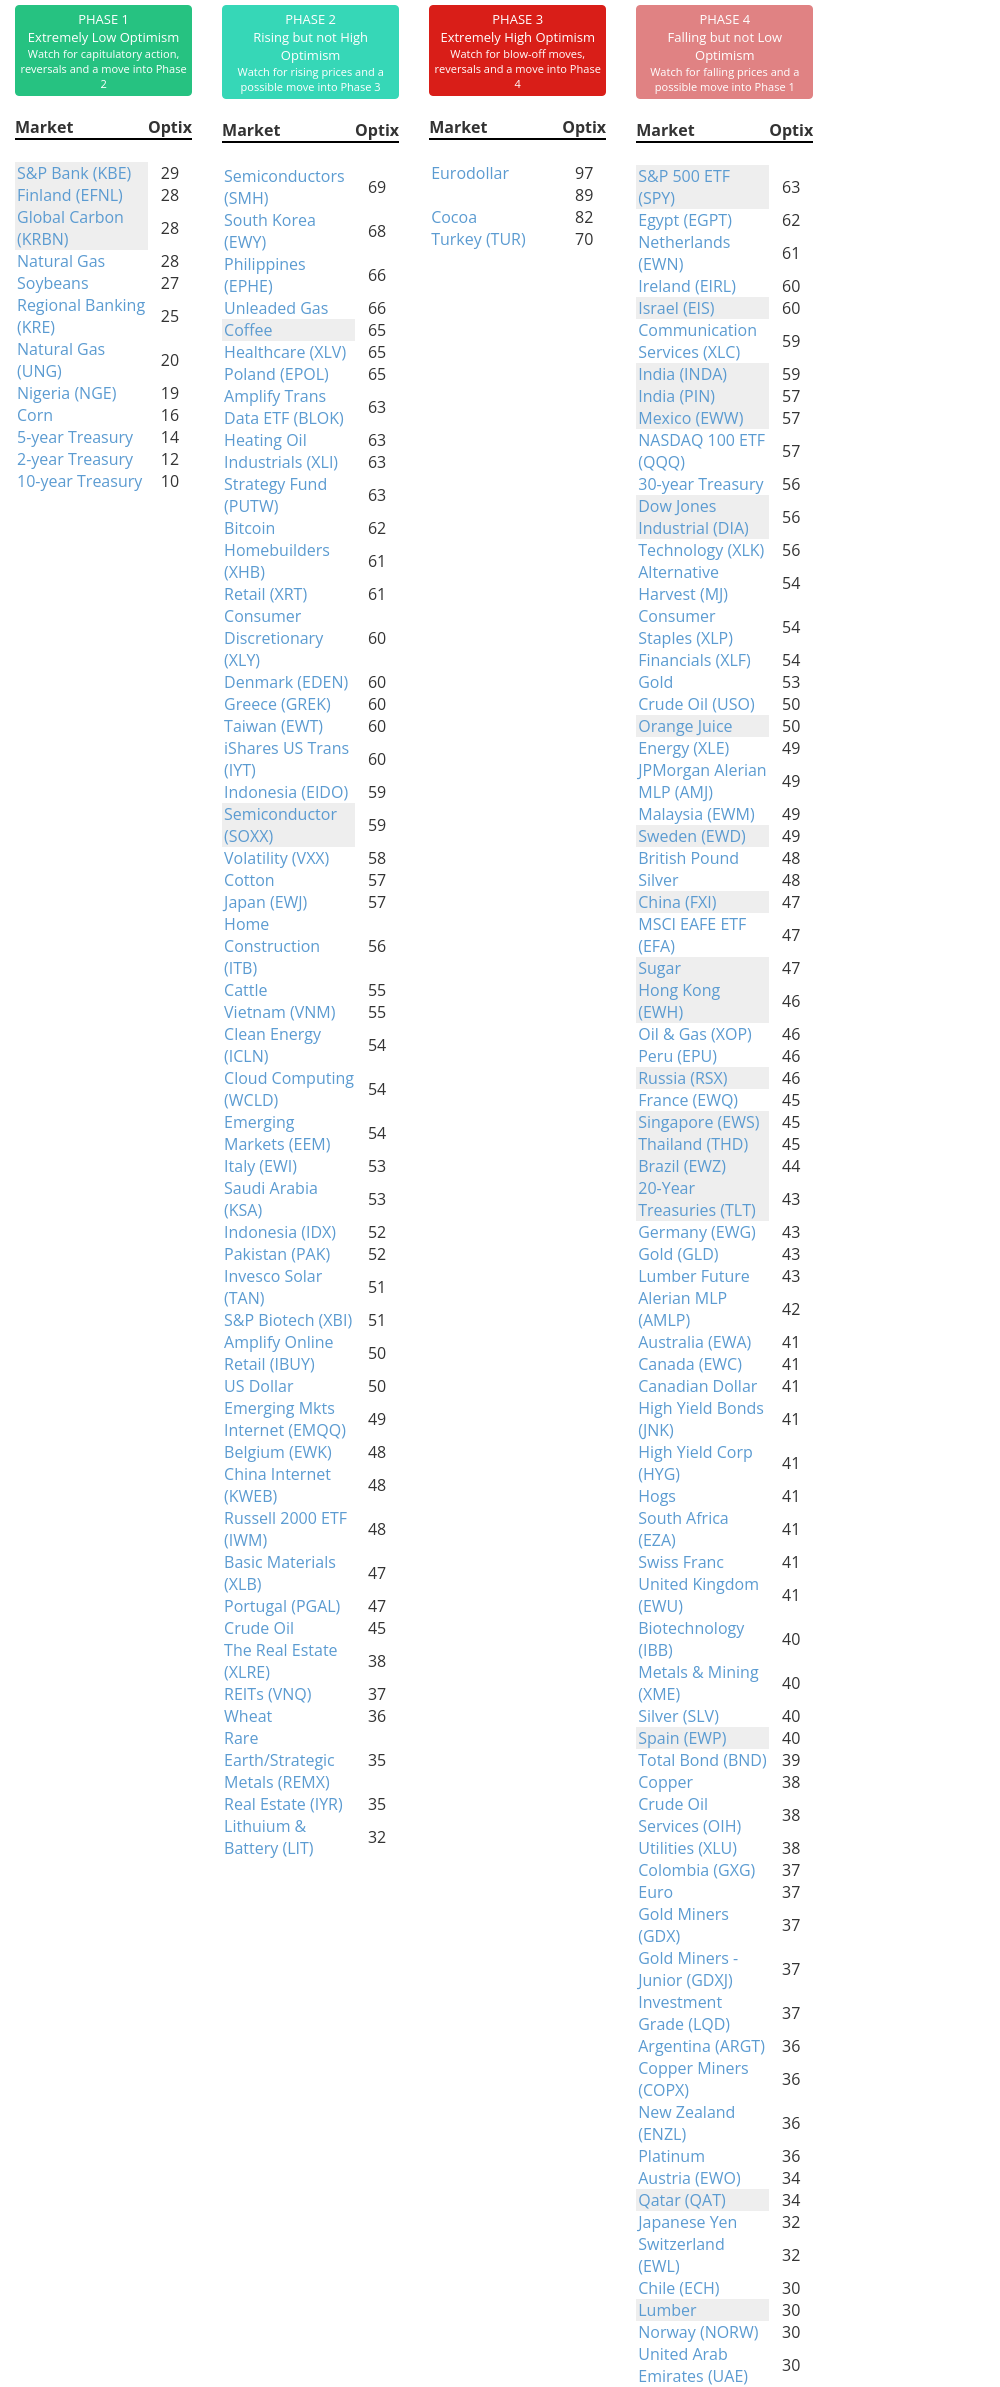
Indicators at Extremes
Phase Table
Ranks
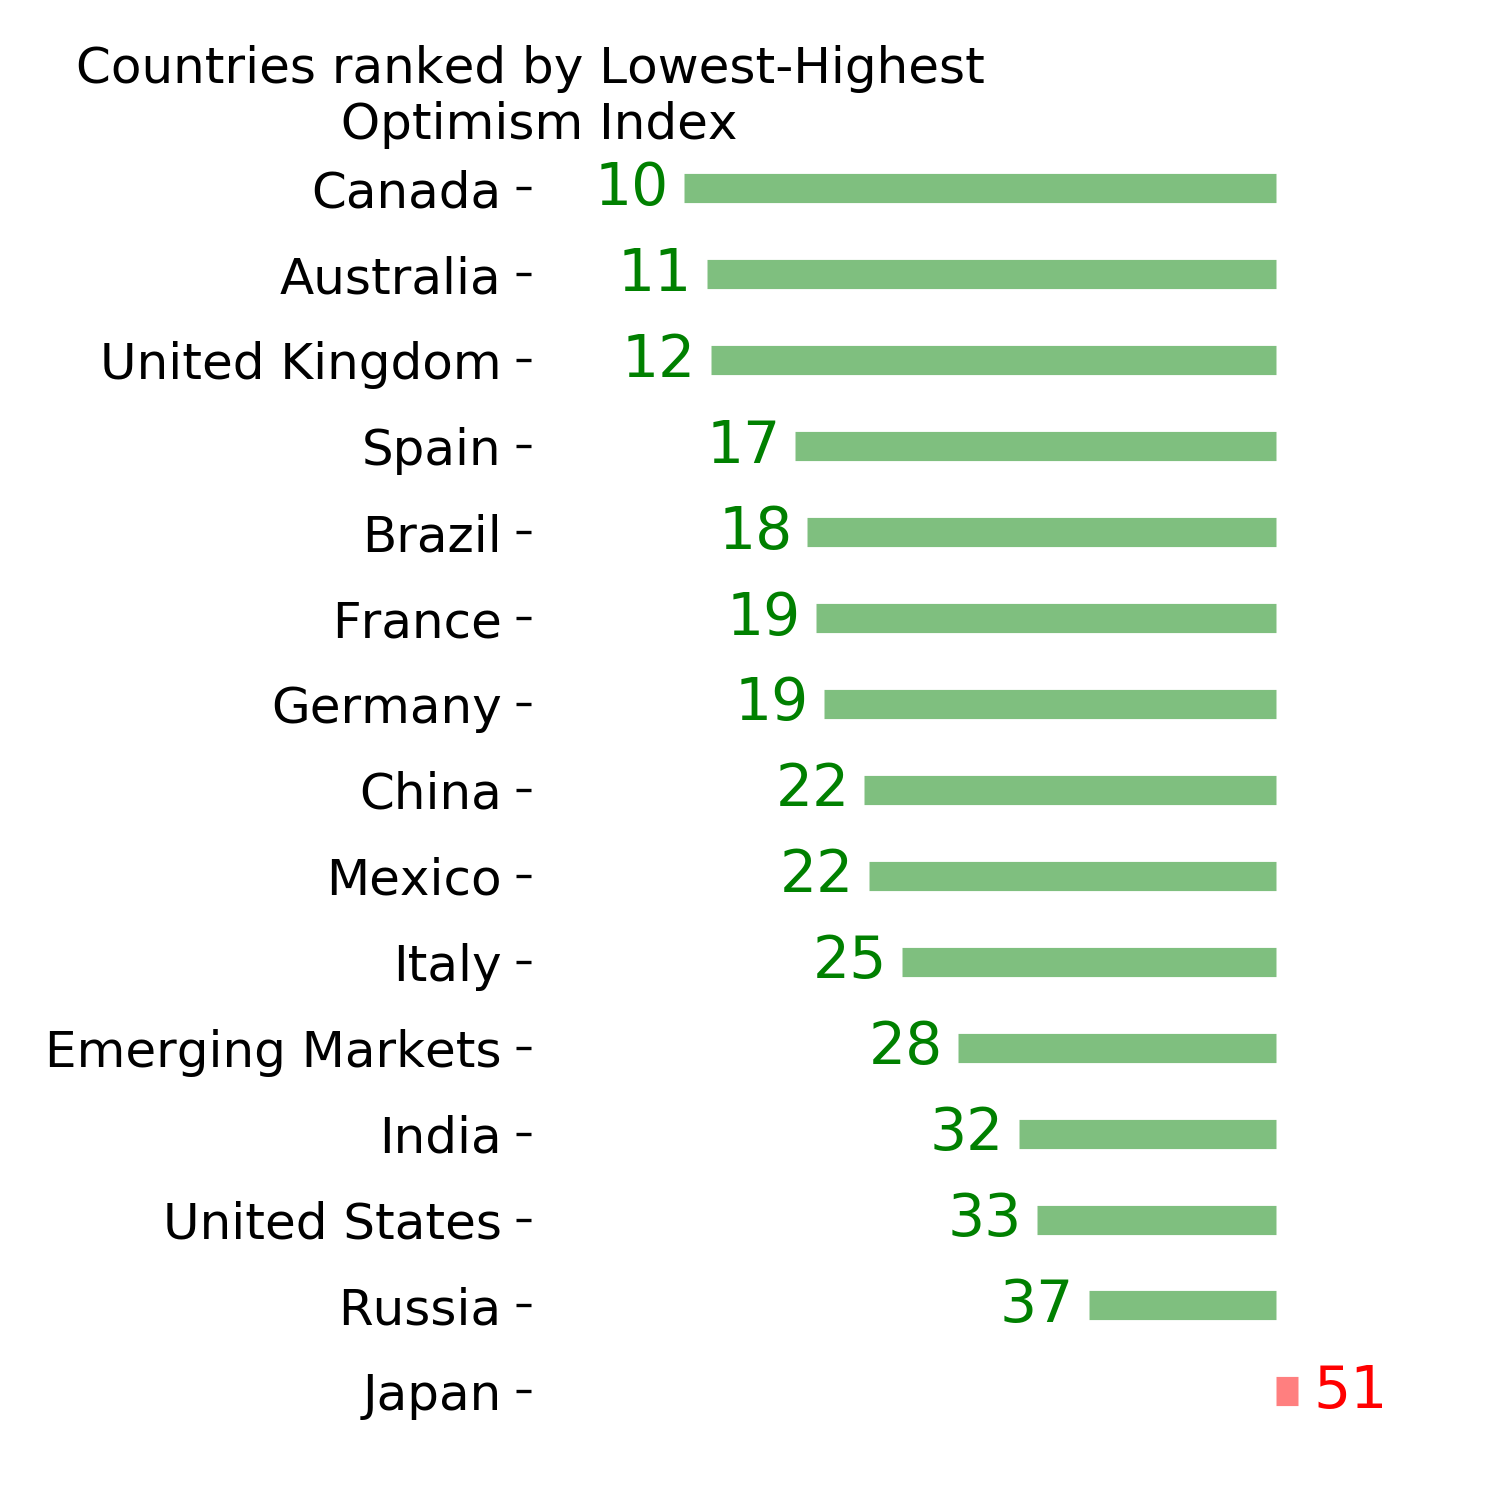
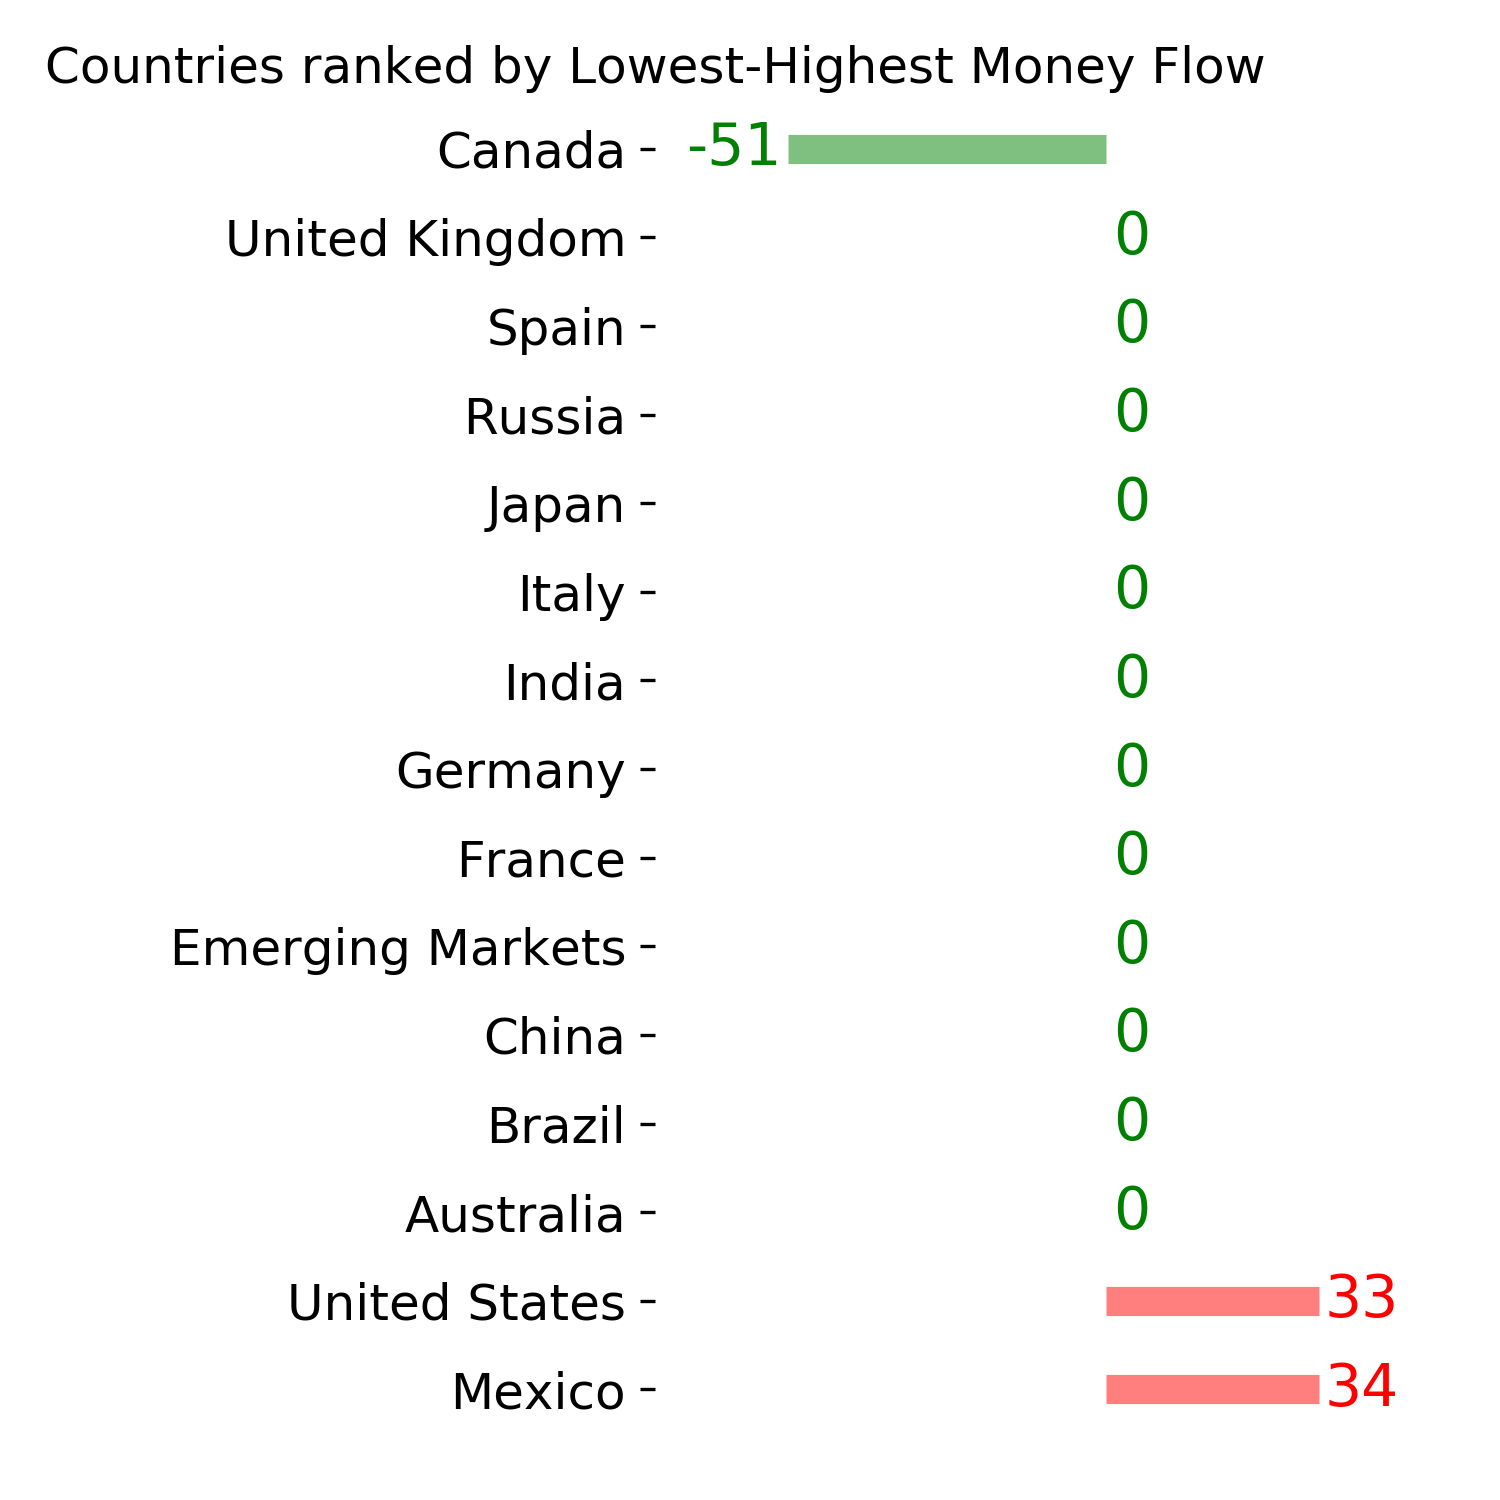
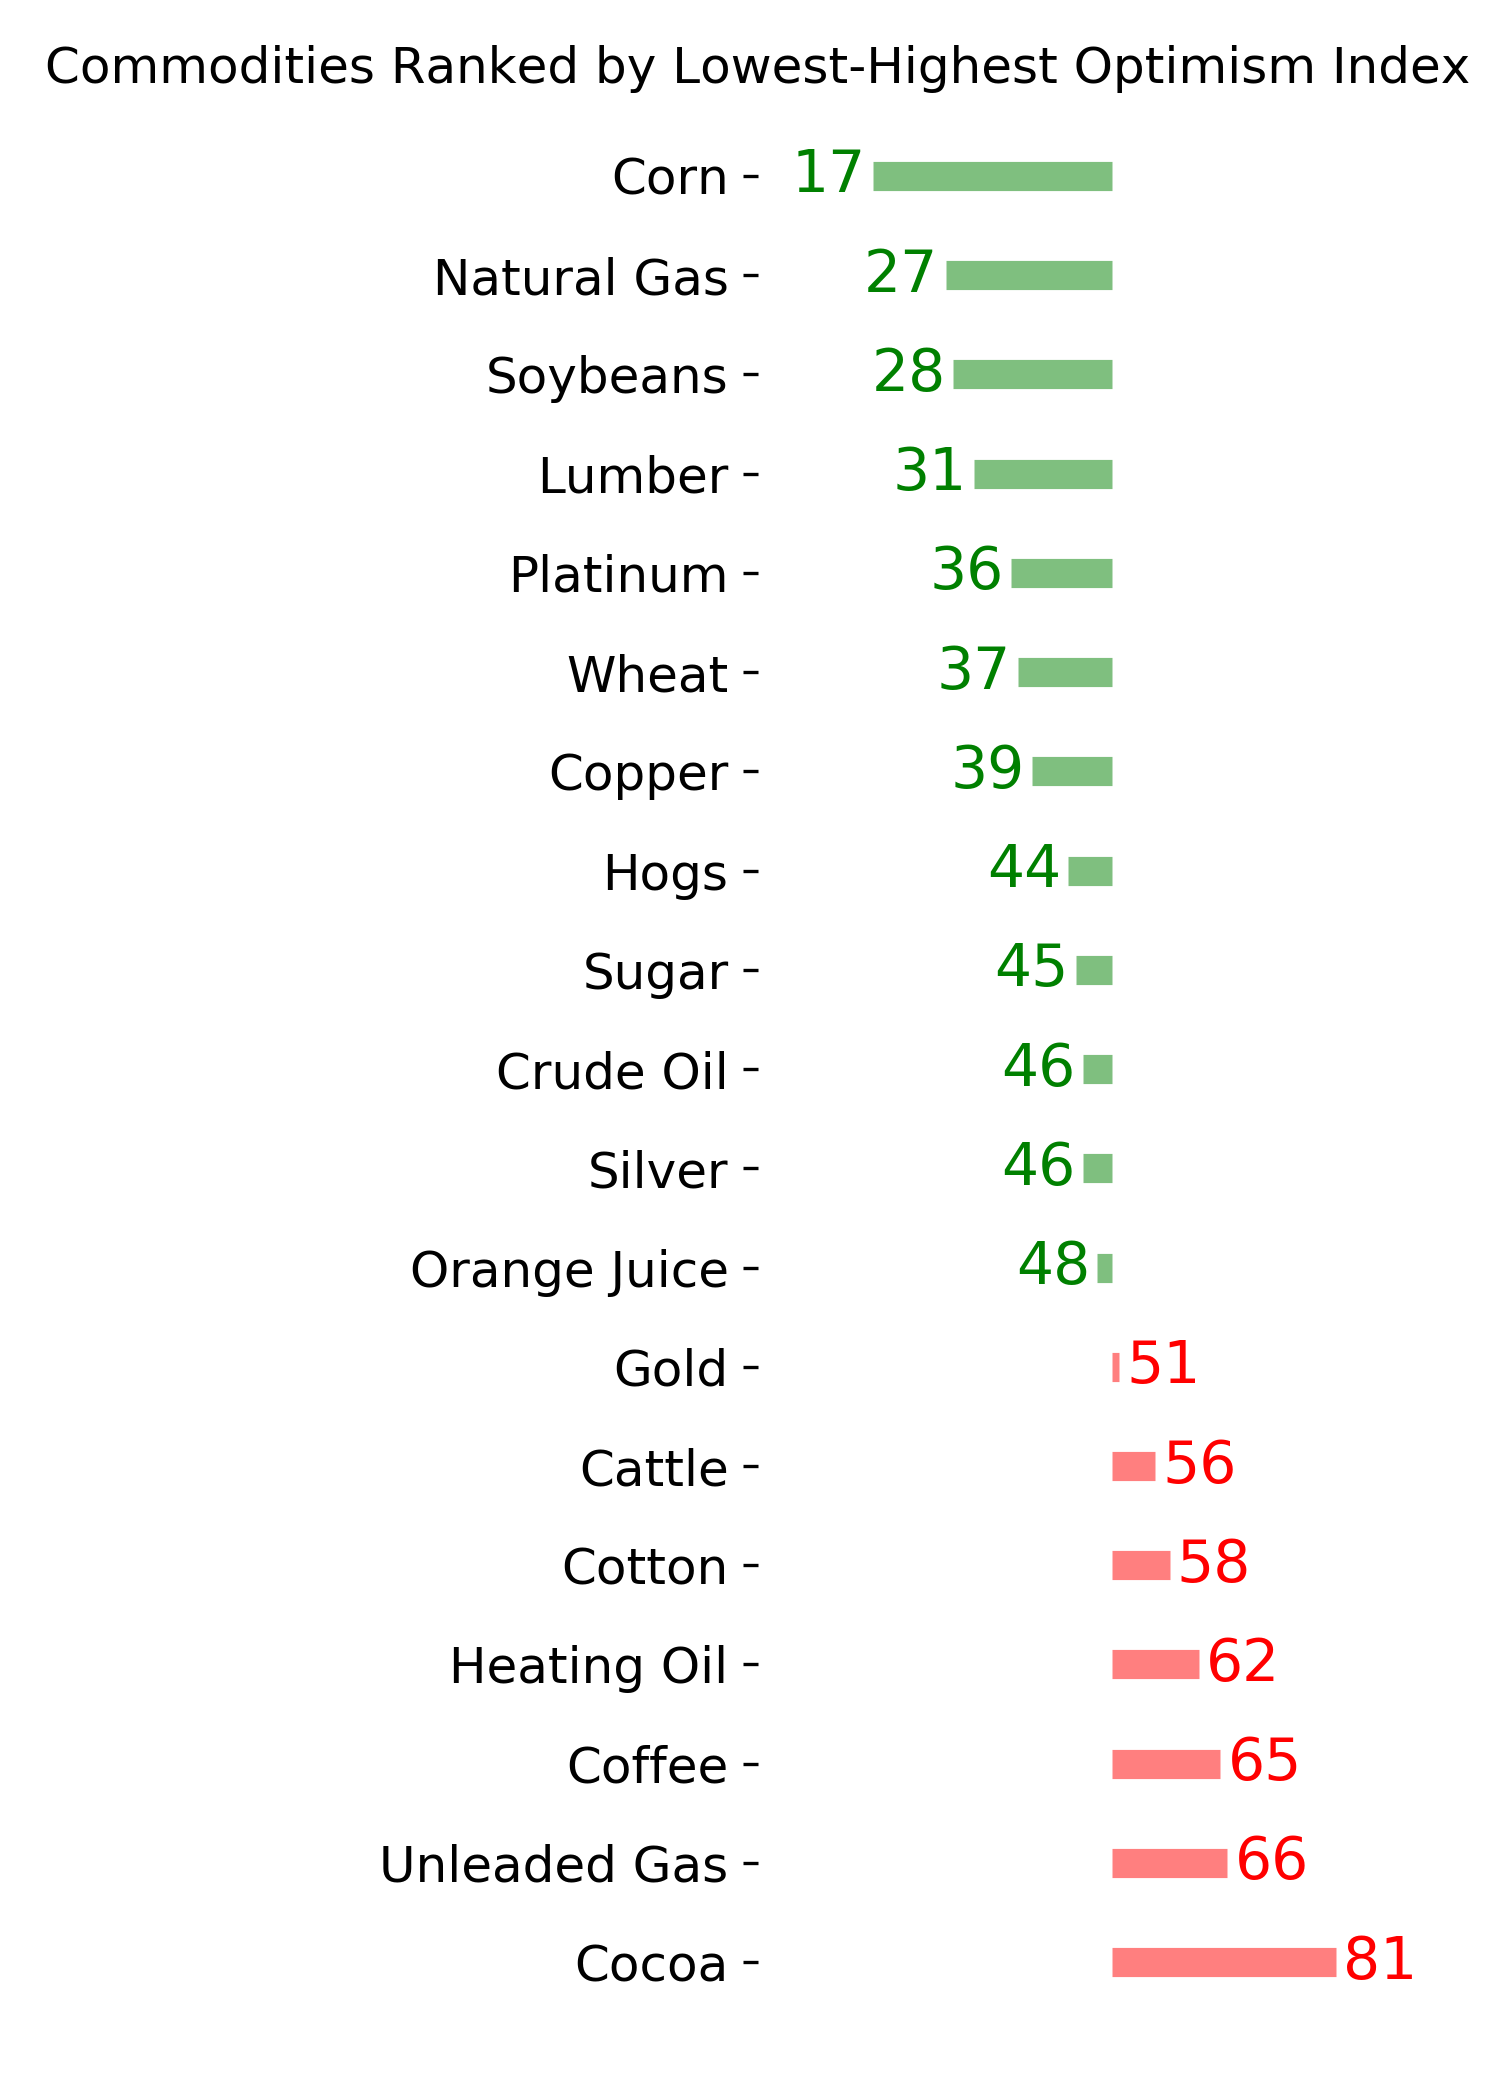
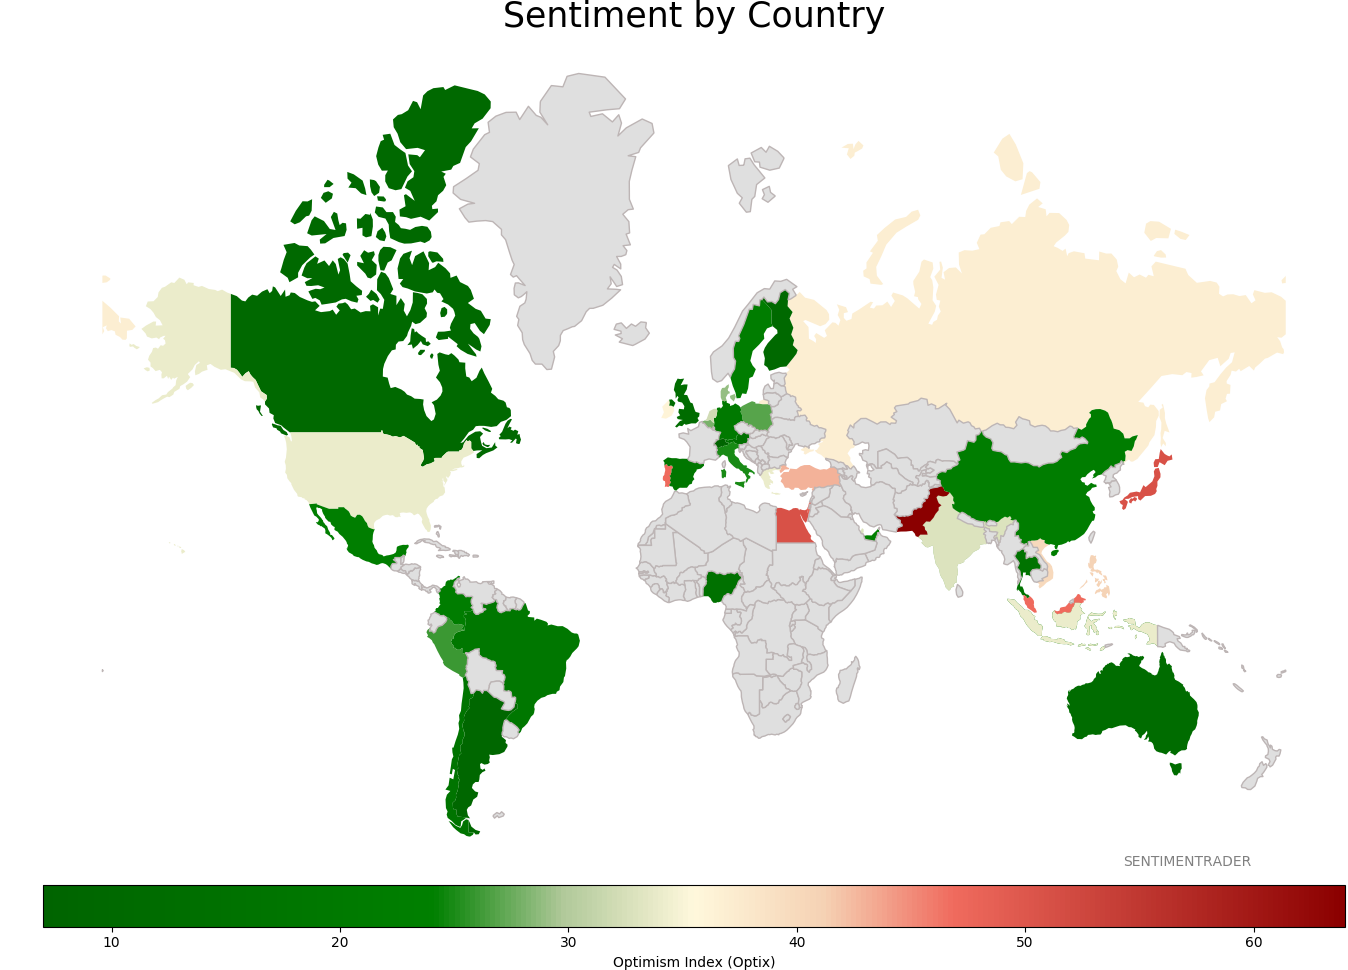
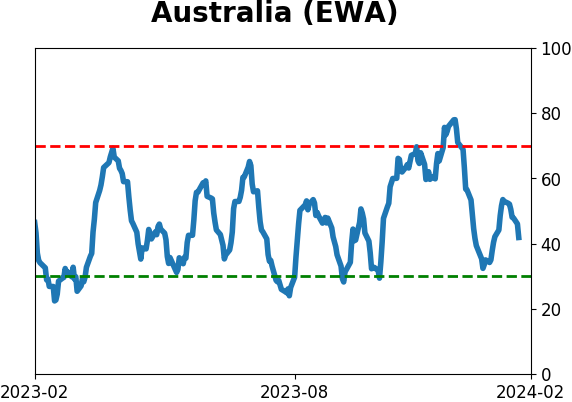
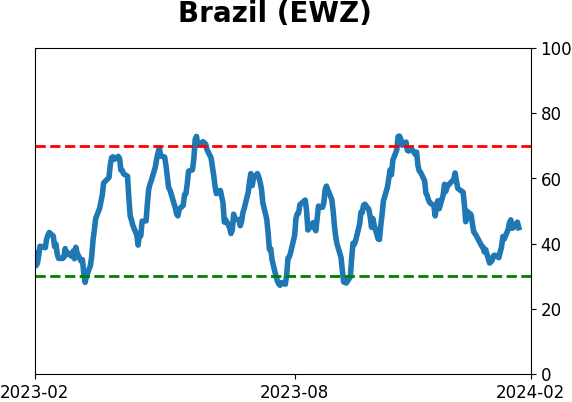
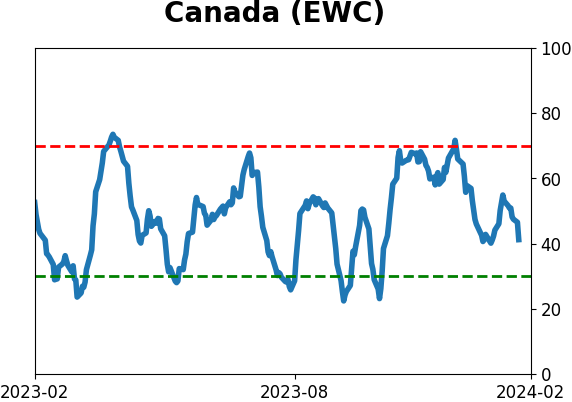
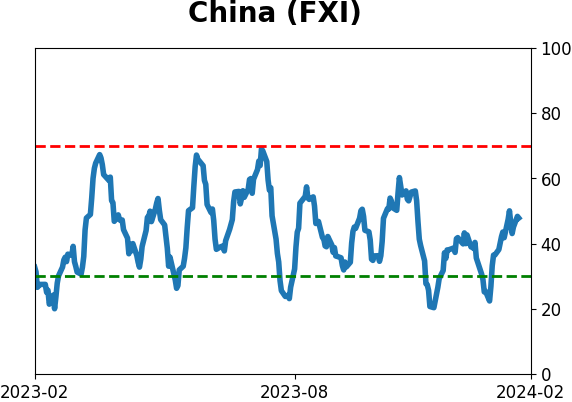
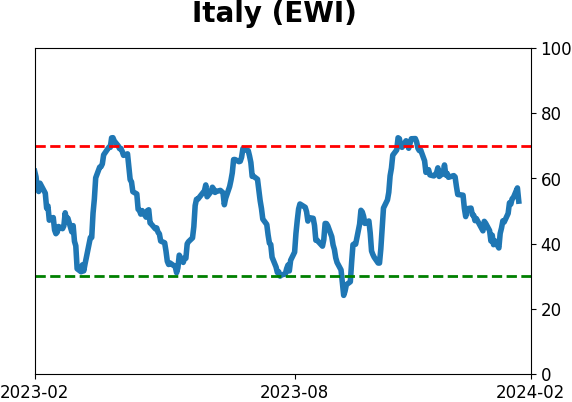
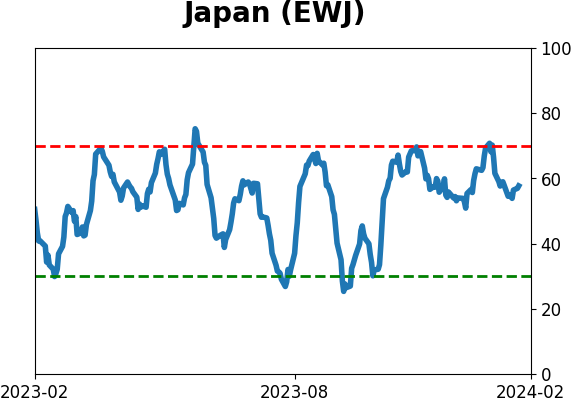
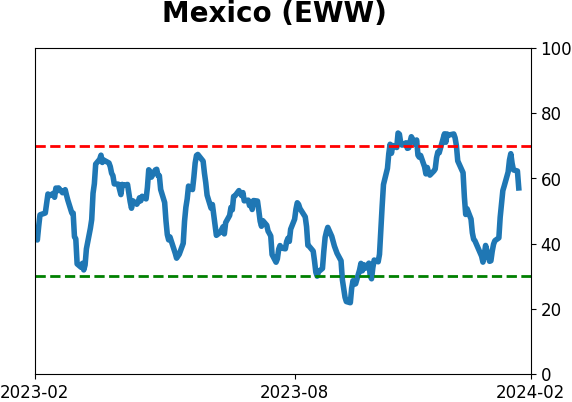
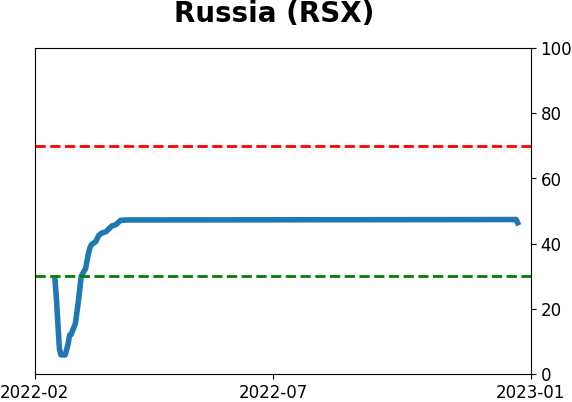
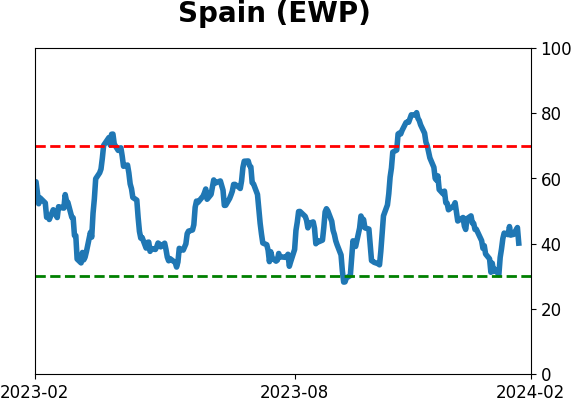
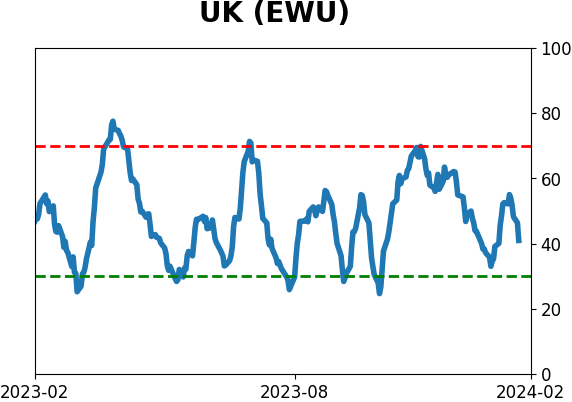
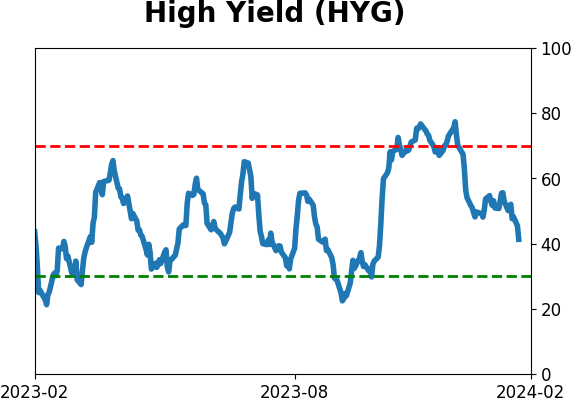
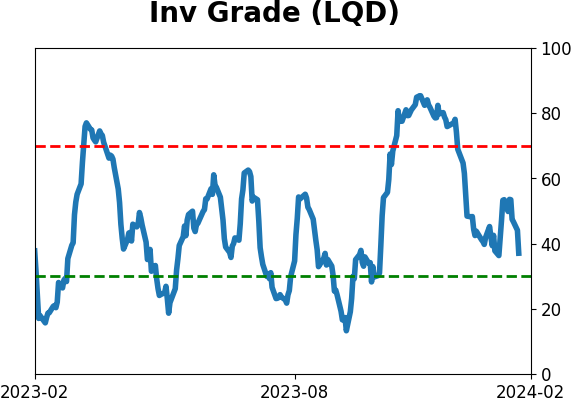
Sentiment Around The World
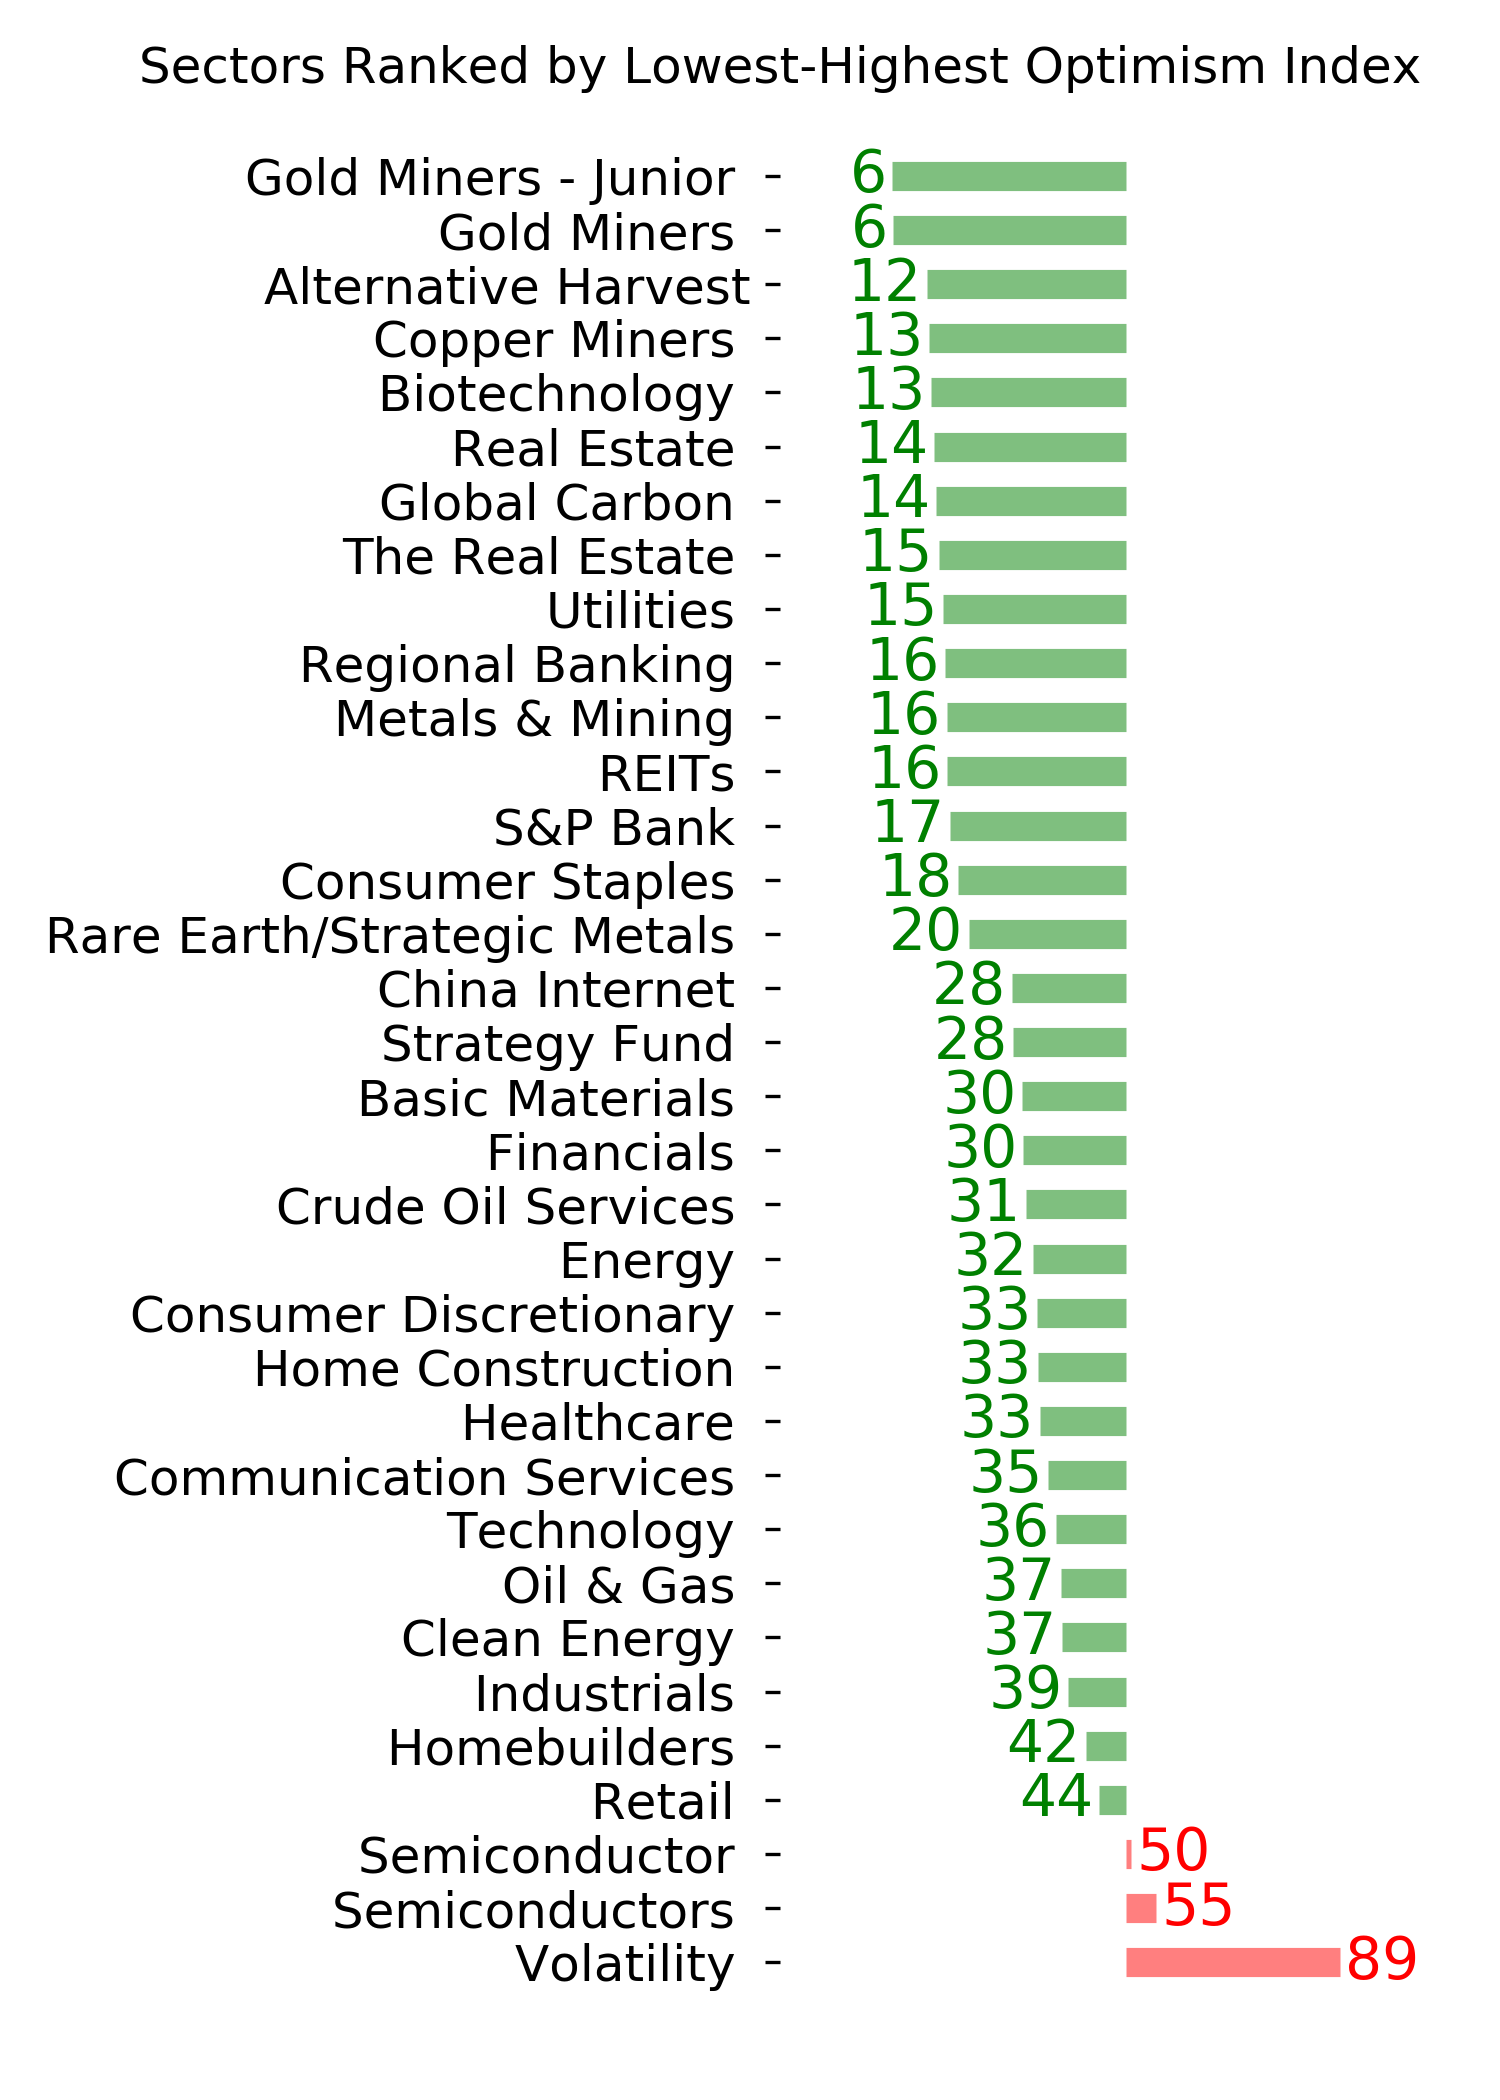
Optimism Index Thumbnails
|
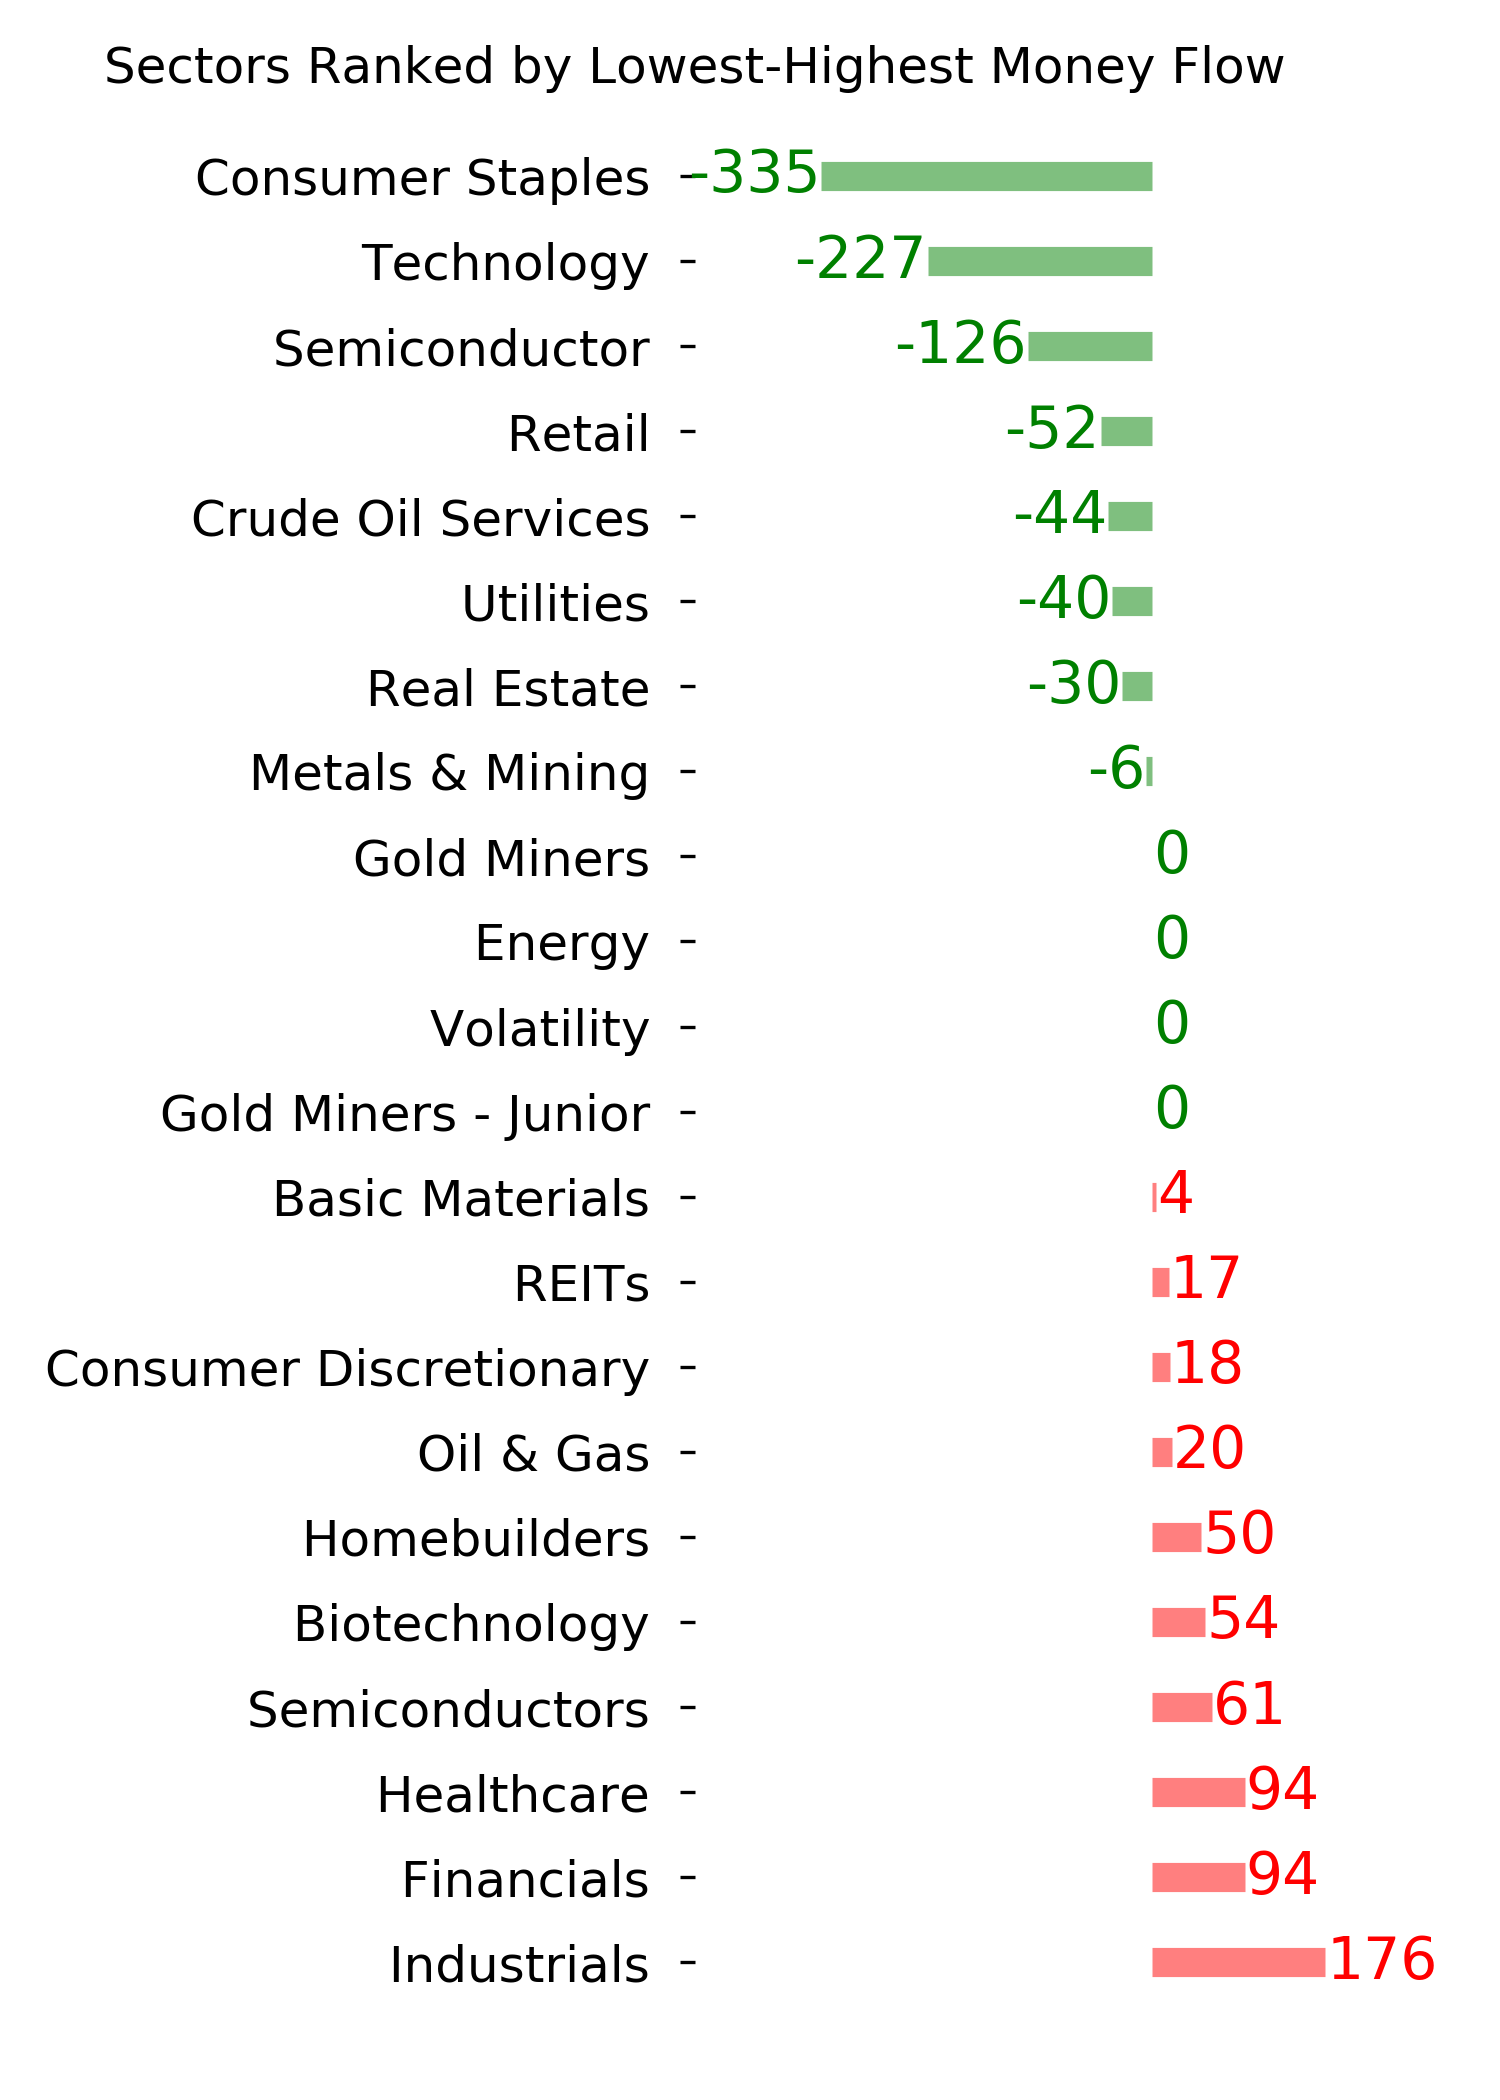
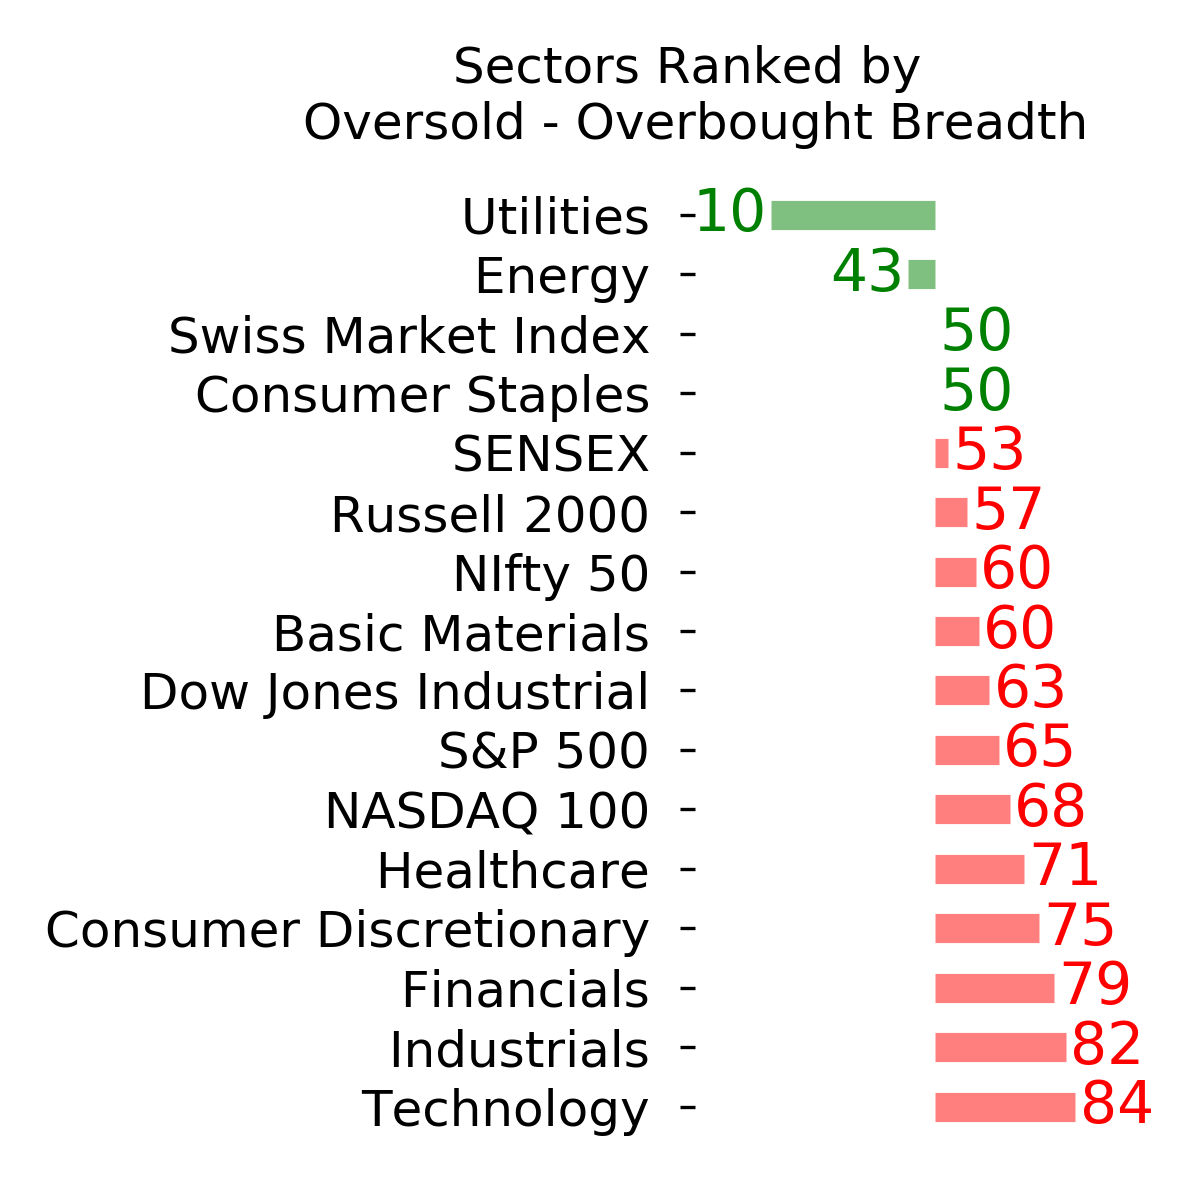
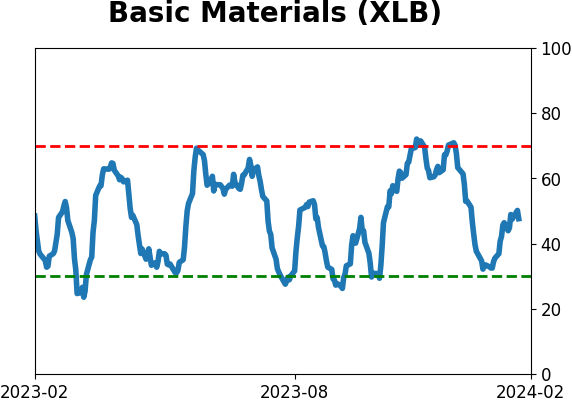
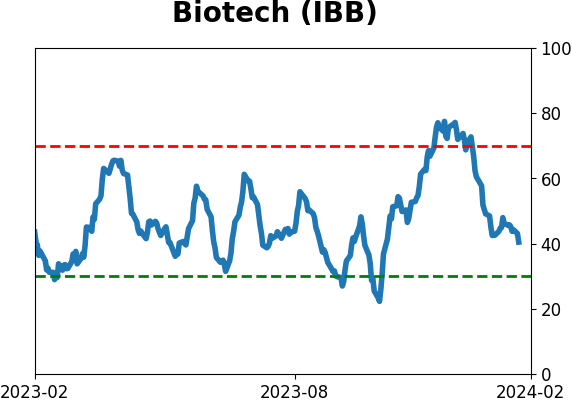
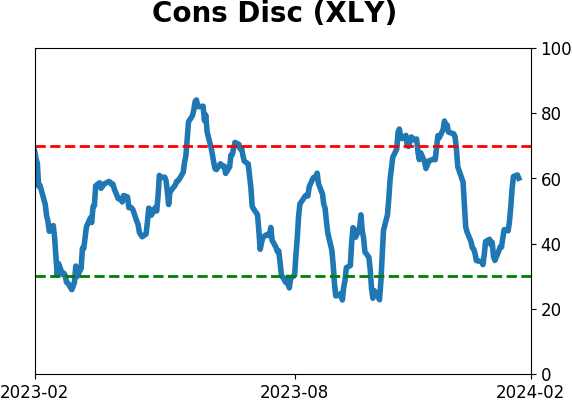
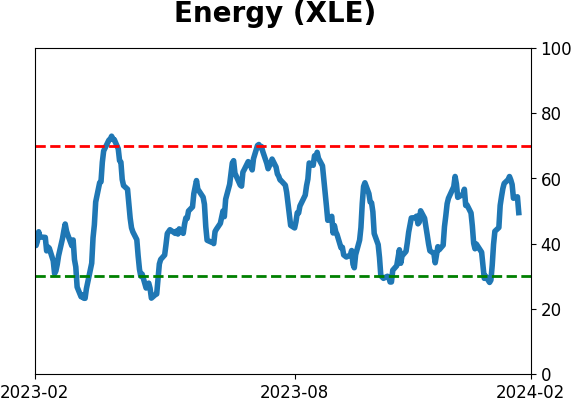
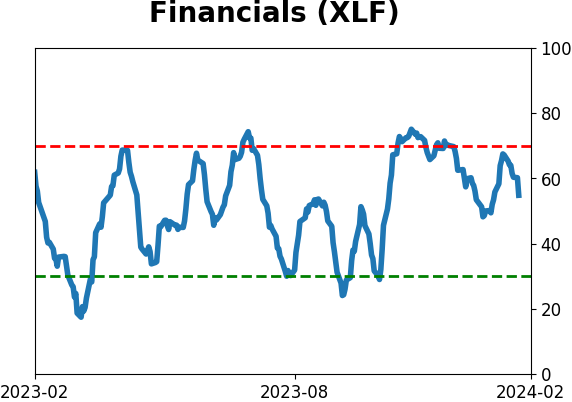
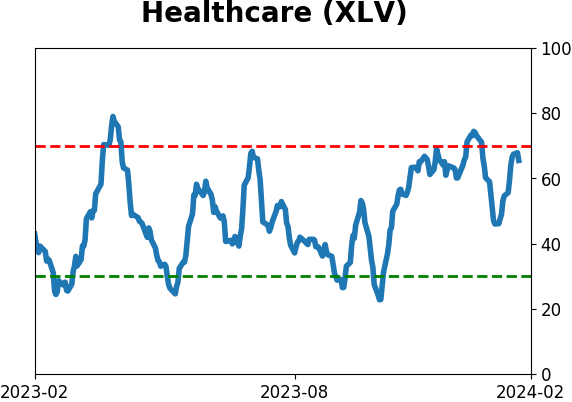
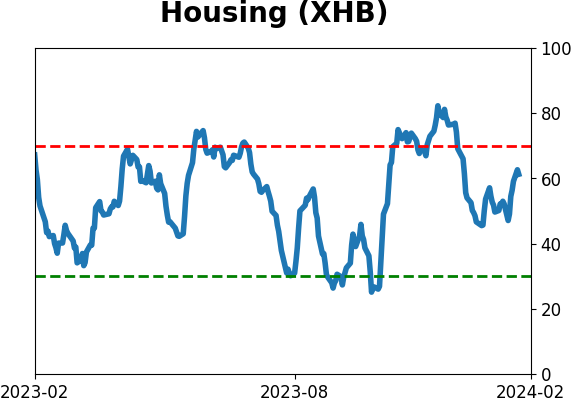
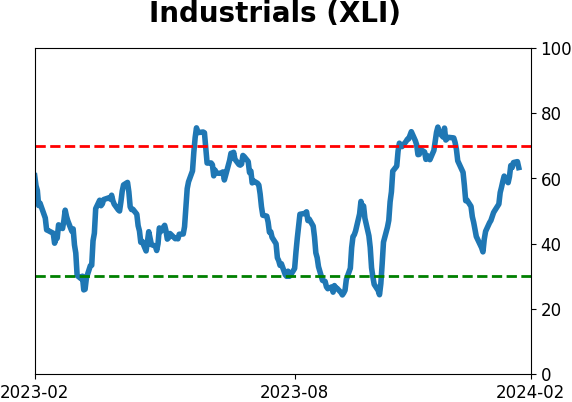
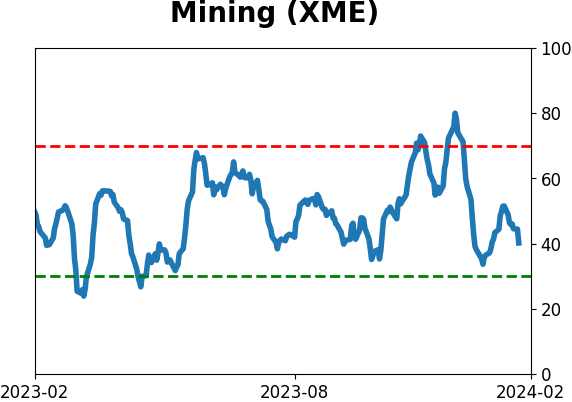
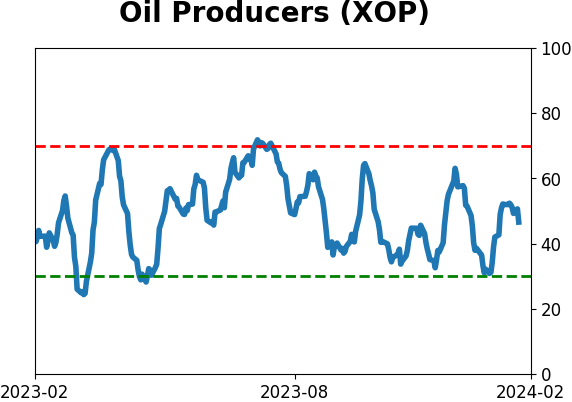
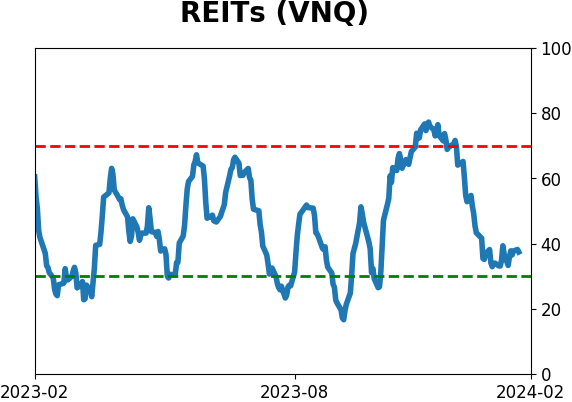
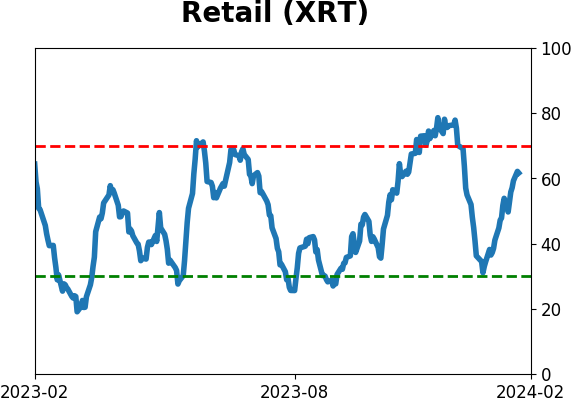
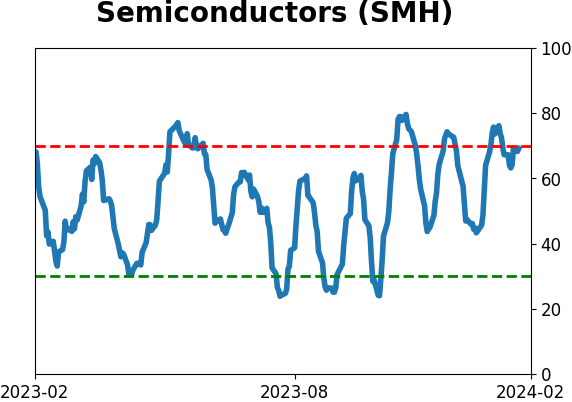
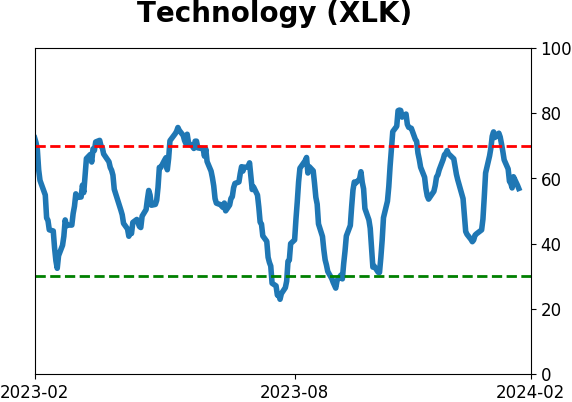
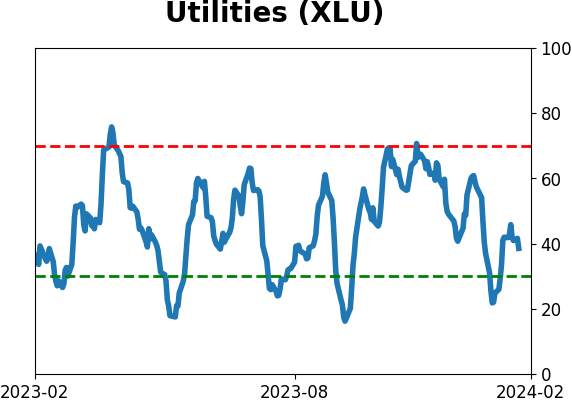
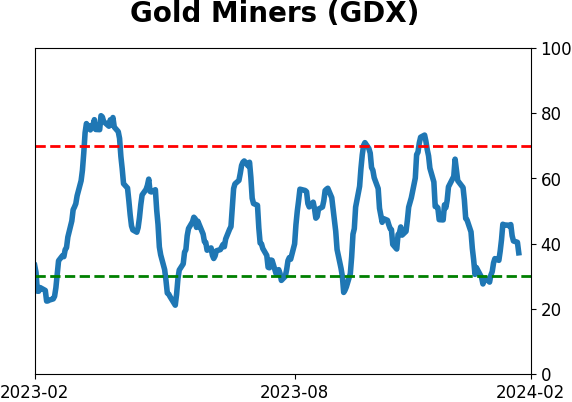
Sector ETF's - 10-Day Moving Average
|
|
|
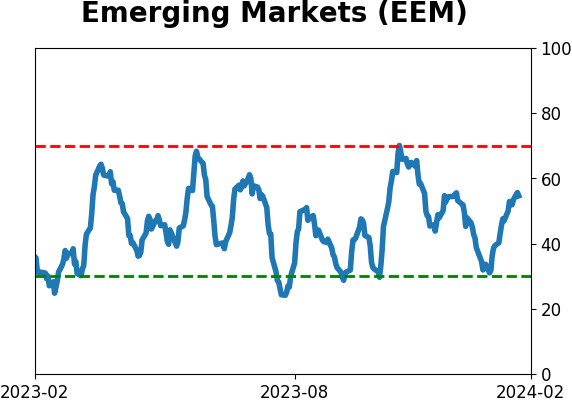
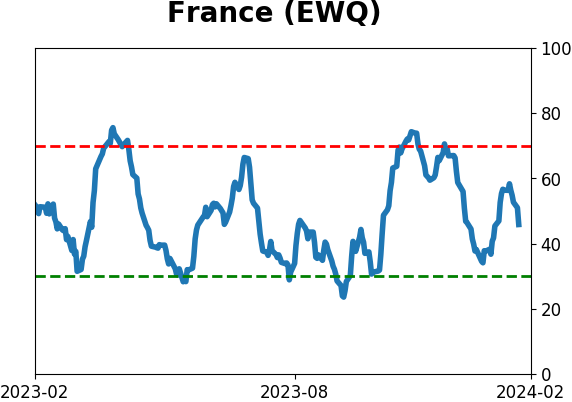
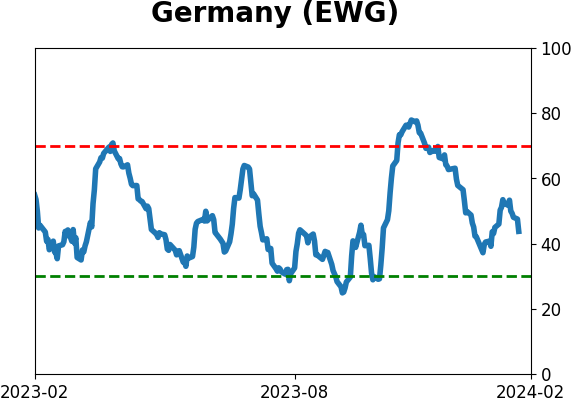
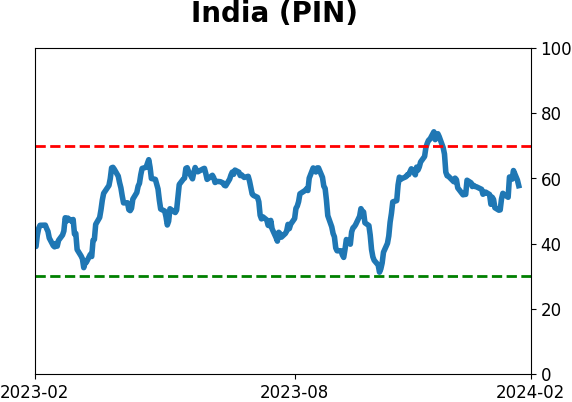
Country ETF's - 10-Day Moving Average
|
|
|
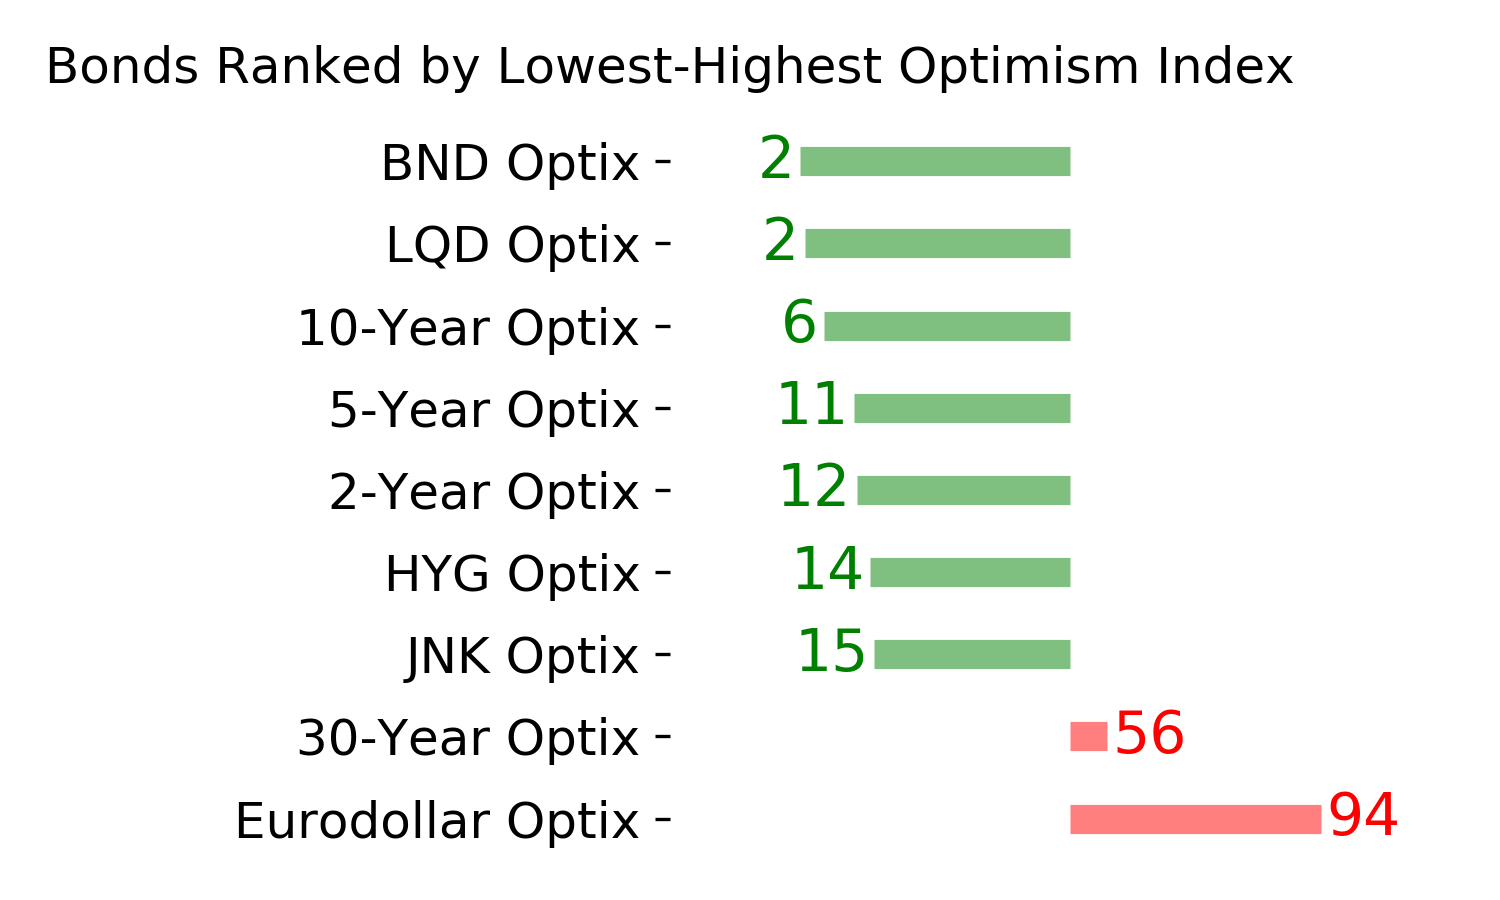
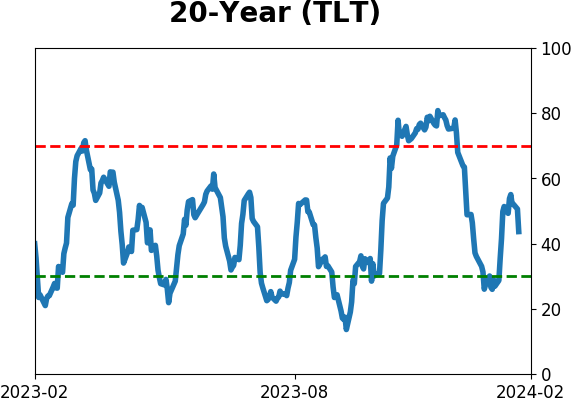
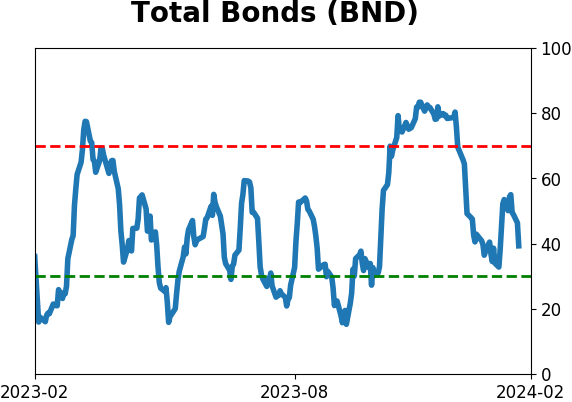
Bond ETF's - 10-Day Moving Average
|
|
|
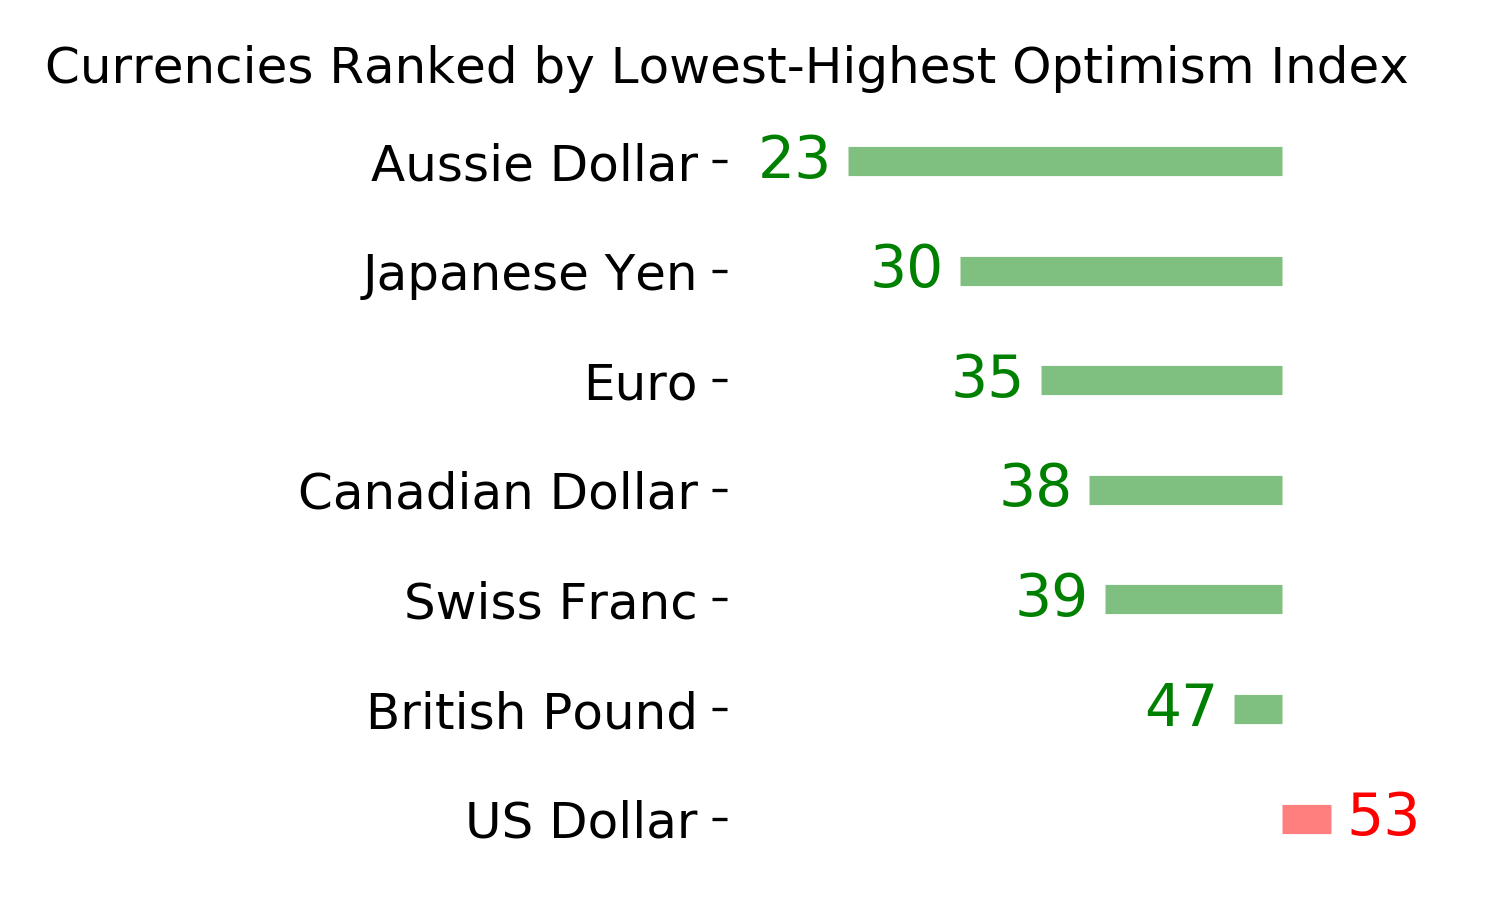
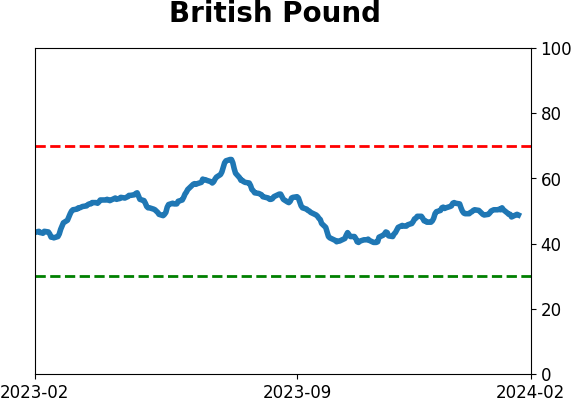
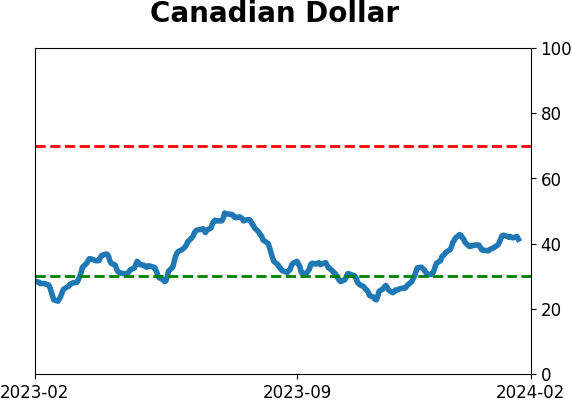
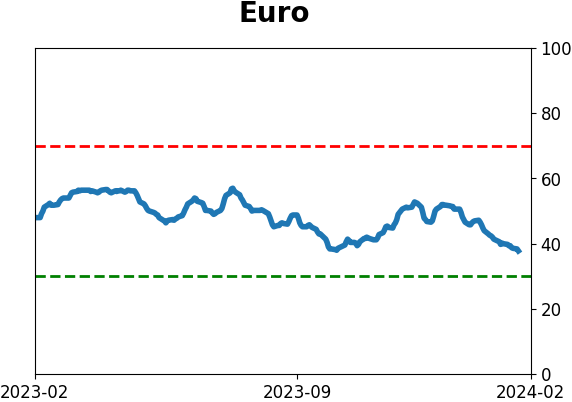
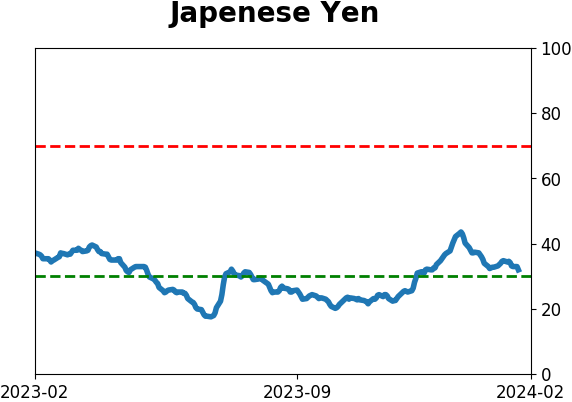
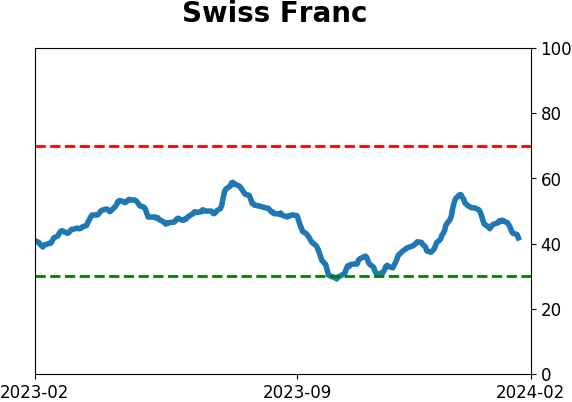
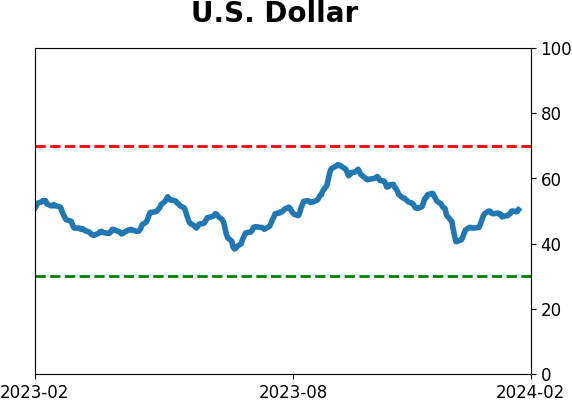
Currency ETF's - 5-Day Moving Average
|
|
|
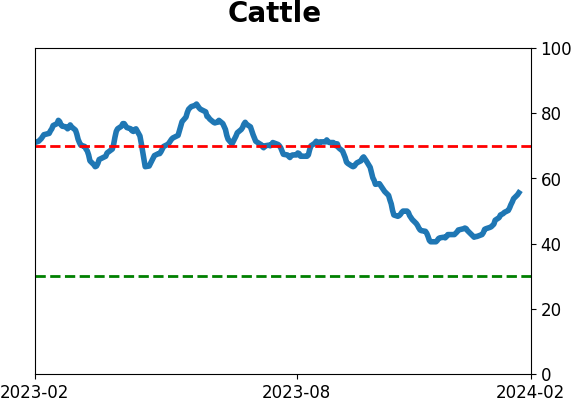
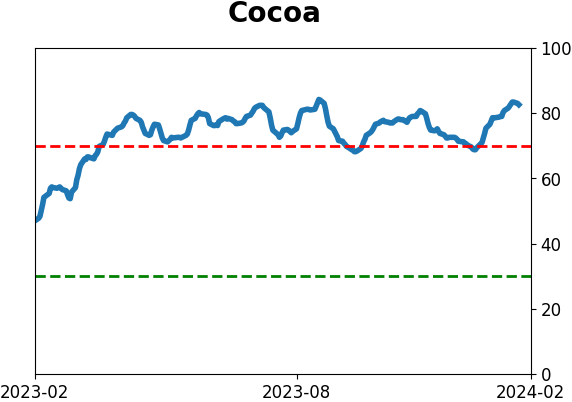
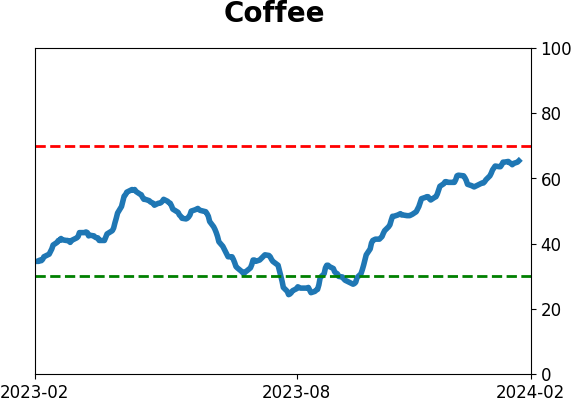
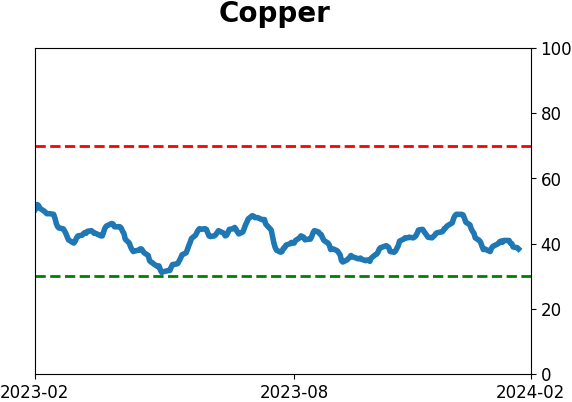
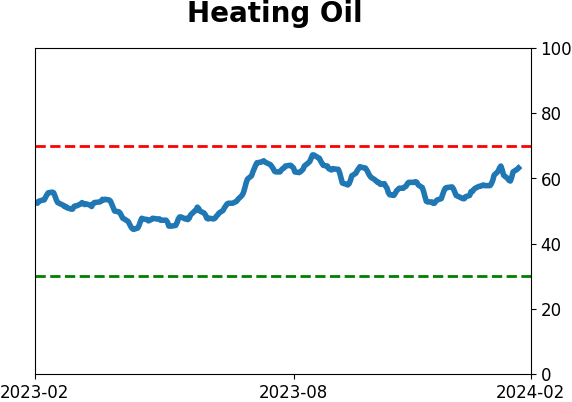
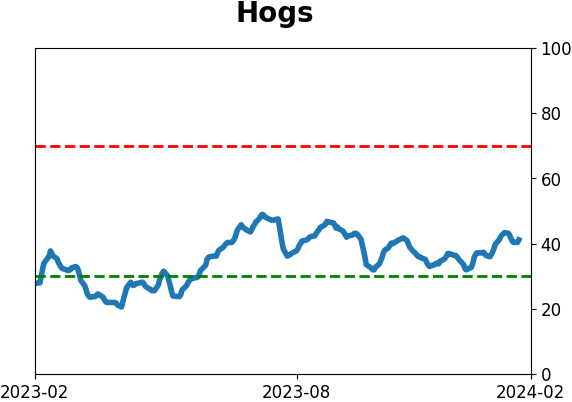
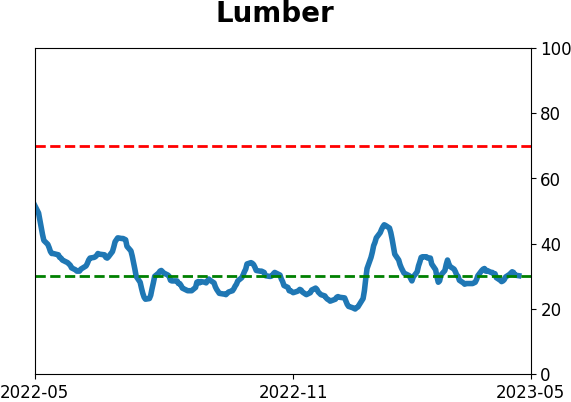
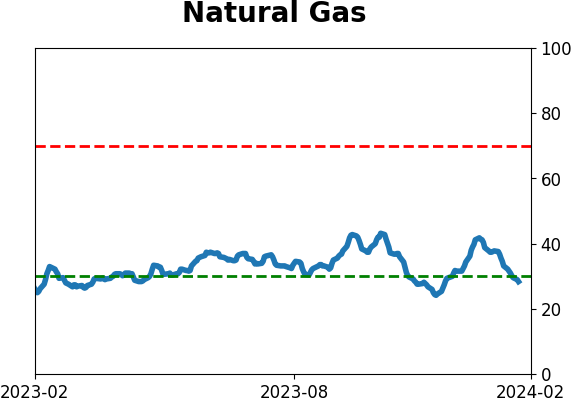
Commodity ETF's - 5-Day Moving Average
|
|