Headlines
|
|
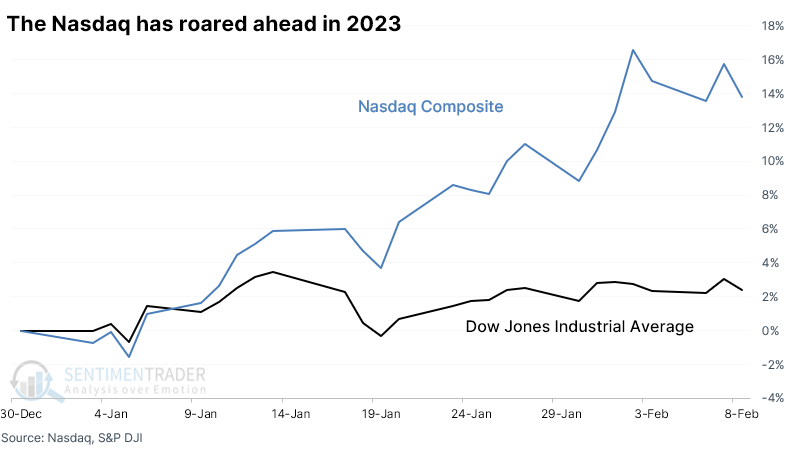
The Nasdaq has soared relative to the Dow:
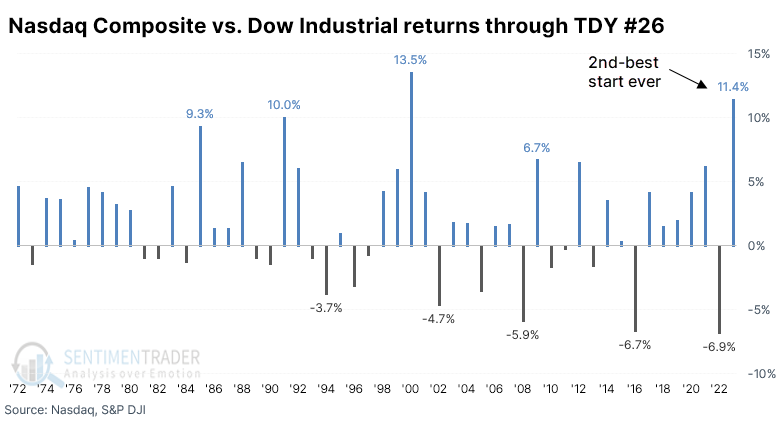
So far in 2023, the Nasdaq Composite has soared relative to the Dow Industrials. It's the 2nd-best relative start for the Nasdaq since 2000, which has triggered some analysts to assume we're headed for a disaster like that year. But big starts for the Nasdaq relative to the Dow showed a strong tendency to lead to broad-market gains.
|
Smart / Dumb Money Confidence
|
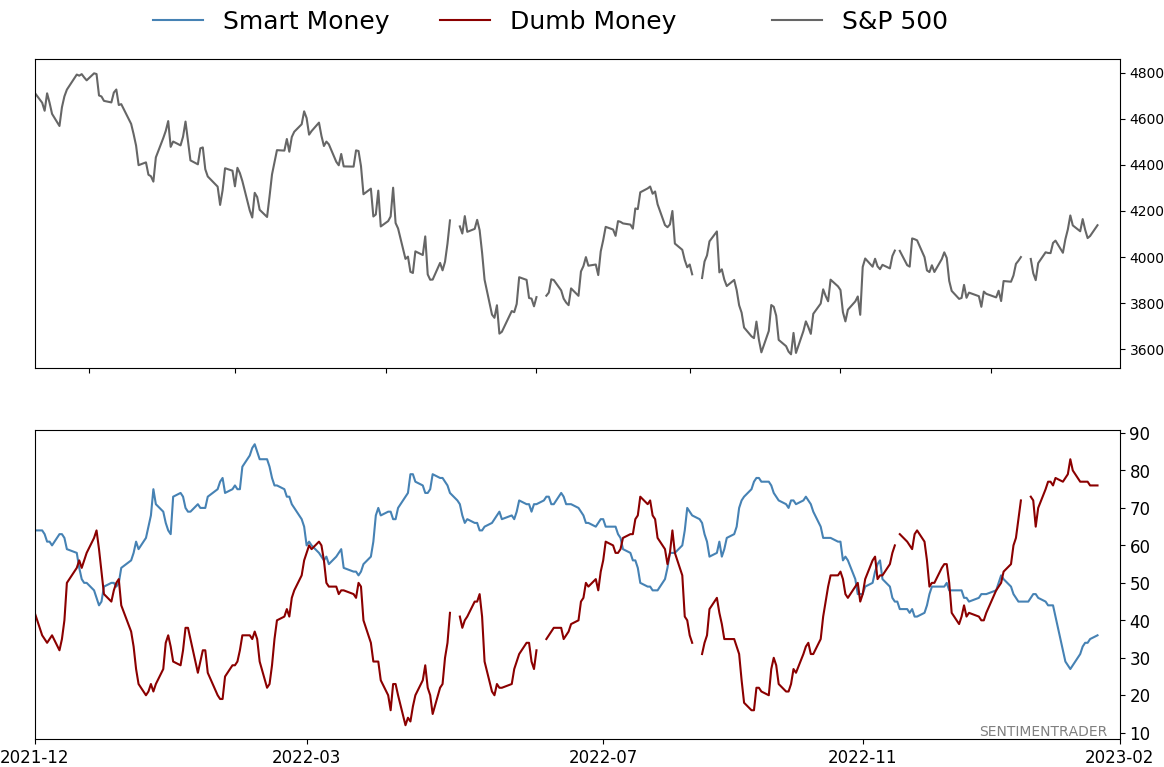
Smart Money Confidence: 36%
Dumb Money Confidence: 76%
|
|
Risk Levels
Stocks Short-Term
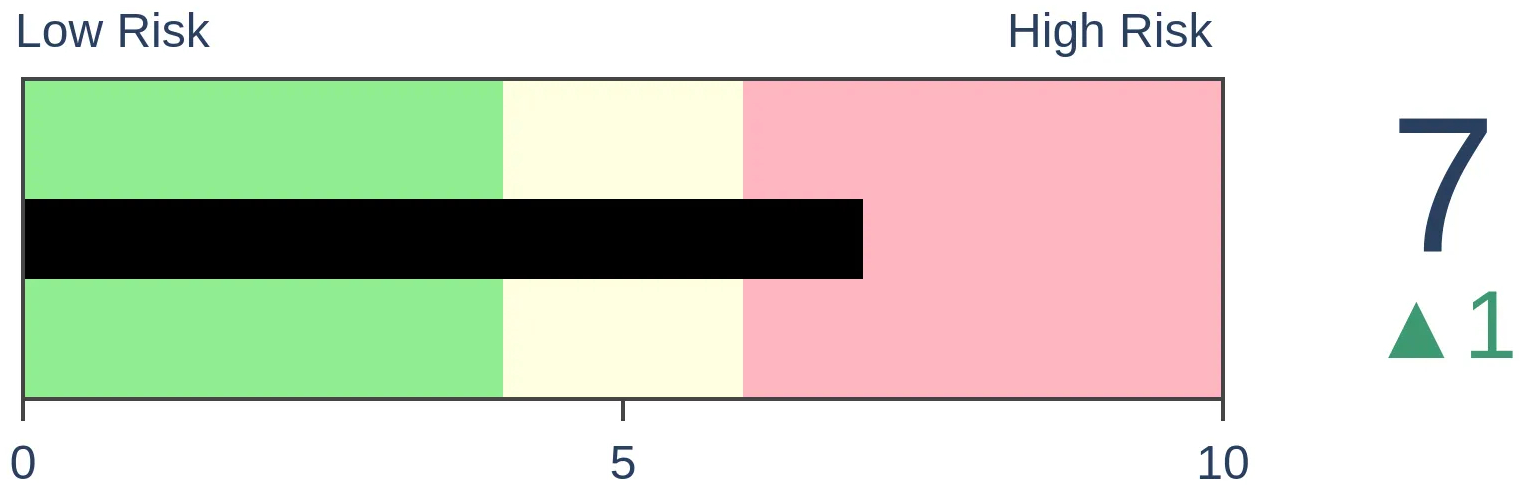
|
Stocks Medium-Term
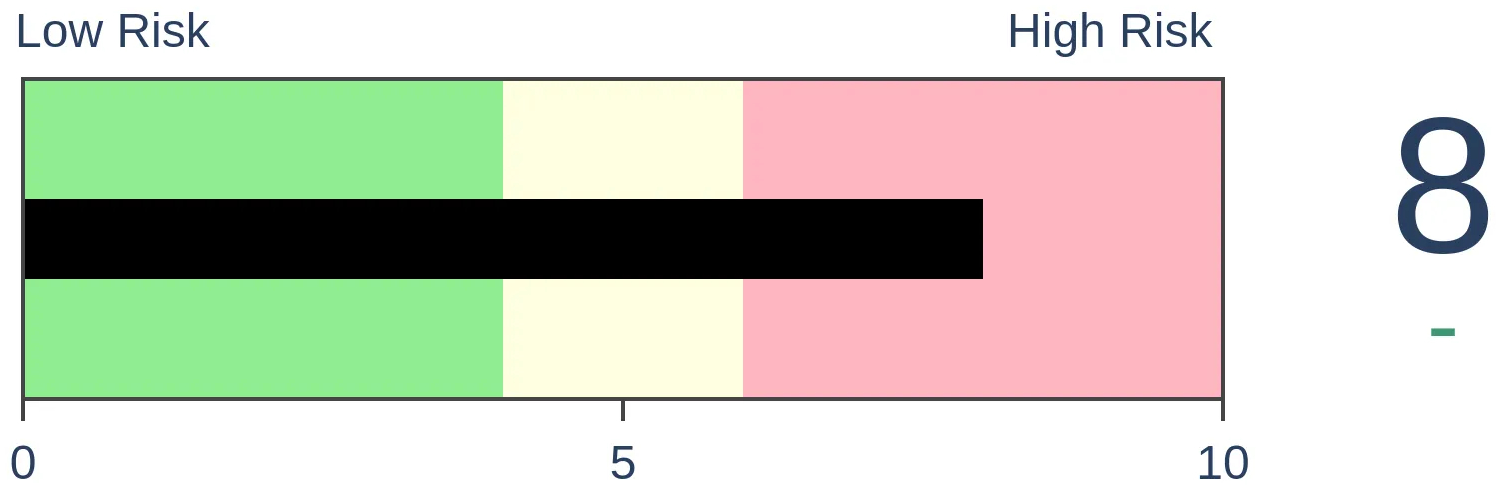
|
|
Bonds
|
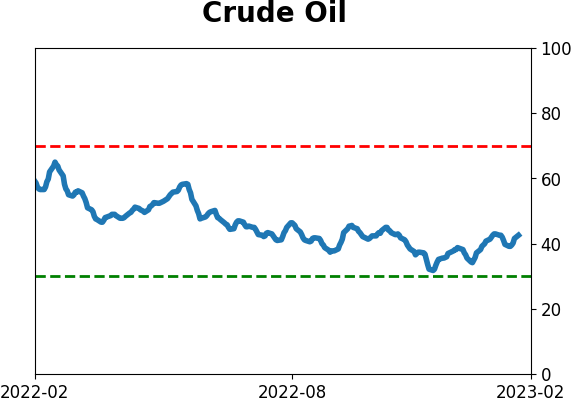
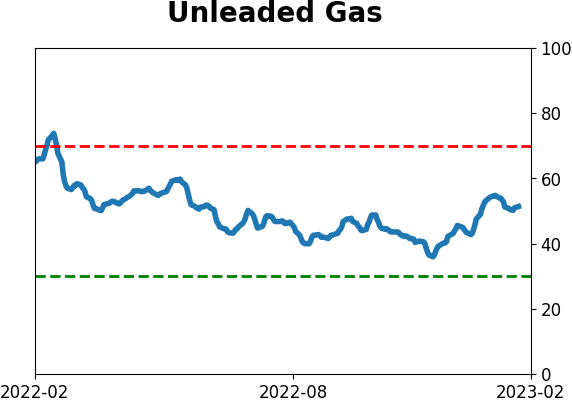
Crude Oil

|
|
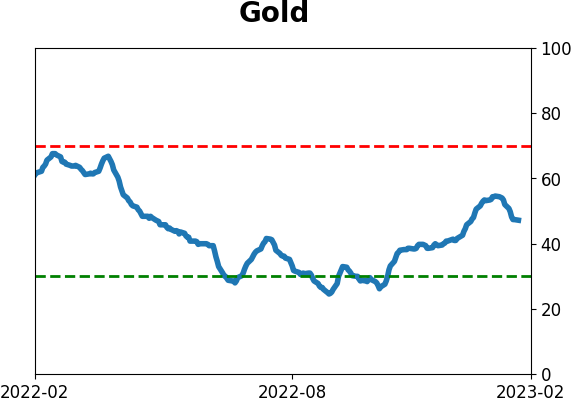
Gold
|
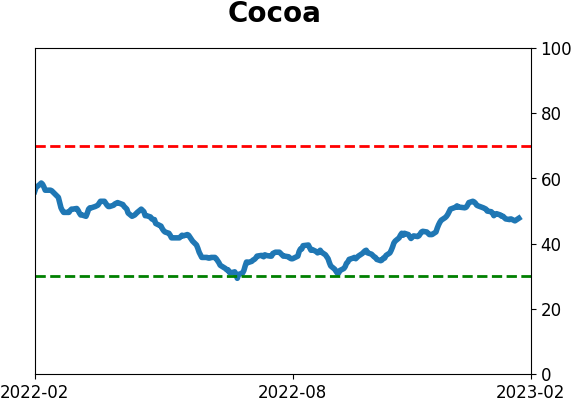
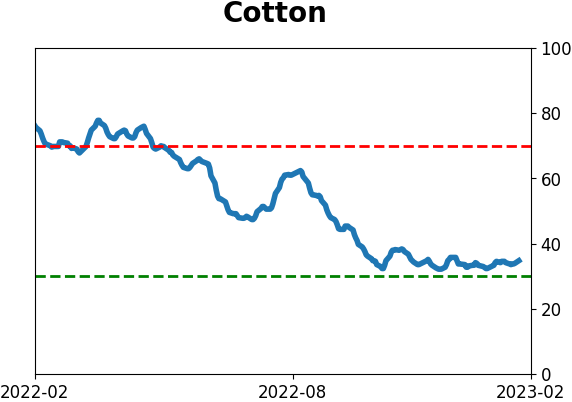
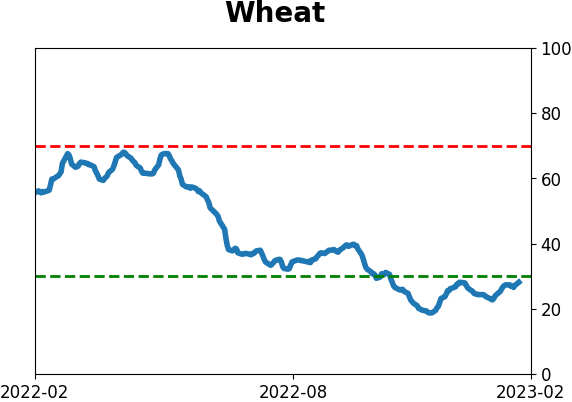
Agriculture
|
|
Research
By Jason Goepfert
BOTTOM LINE
So far in 2023, the Nasdaq Composite has soared relative to the Dow Industrials. It's the 2nd-best relative start for the Nasdaq since 2000, which has triggered some analysts to assume we're headed for a disaster like that year. But big starts for the Nasdaq relative to the Dow showed a strong tendency to lead to broad-market gains.
FORECAST / TIMEFRAME
None
|
Key points:
- So far this year, the Nasdaq Composite has enjoyed its 2nd-best start relative to the Dow Industrials
- Such massive relative outperformance has ignited calls that we're back in a speculative environment
- Big starts for the Nasdaq did not coincide with excessive speculation, and the S&P 500 showed a strong tendency toward gains
The Nasdaq soars versus the Dow
Even with a pullback last week, stocks have gotten off to a roaring start. Especially some of them that had been left for dead.
The Wall Street Journal noted that investors are in such a hurry for risk that they've propelled the Nasdaq Composite to its best start relative to the Dow Industrials since 2000.
The 30-stock index is up 2.4% in 2023 but is badly trailing the Nasdaq Composite Index, which has surged 14%. Largely home to technology and other growth stocks, the Nasdaq is off to its best start since 1991, and the spread between the indexes is the widest since 2000 for any year through Feb. 8.
Anytime the media mentions the year 2000 as a precedent, investors tend to freak out and assume the worst. Regardless, there is no questioning the fast start of the Nasdaq relative to the Dow.
This is the 2nd-best start to a year for the Nasdaq relative to the Dow in the 50 years since the inception of the Composite index. And yes, the year 2000 certainly sticks out as a precedent, but so do 1991 and 1985. However, we don't hear about those in the media because they didn't lead to disaster.
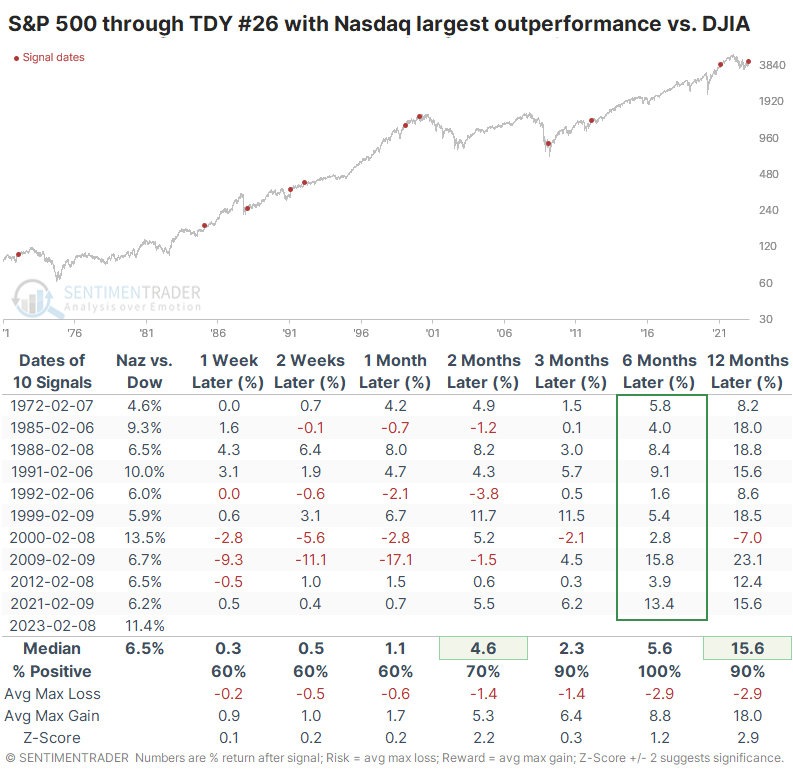
To see what kind of impact fast starts for the Nasdaq vs. Dow had for the broader market, the table below shows the S&P 500's future returns after the Nasdaq Composite showed its best returns relative to the Dow Jones Industrial Average through Trading Day of the Year (TDY) #26.
Even with the year 2000 included, the S&P 500 never showed a negative return over the next six months. It showed above-average gains across every time frame, with an excellent skew of maximum gains relative to maximum losses.
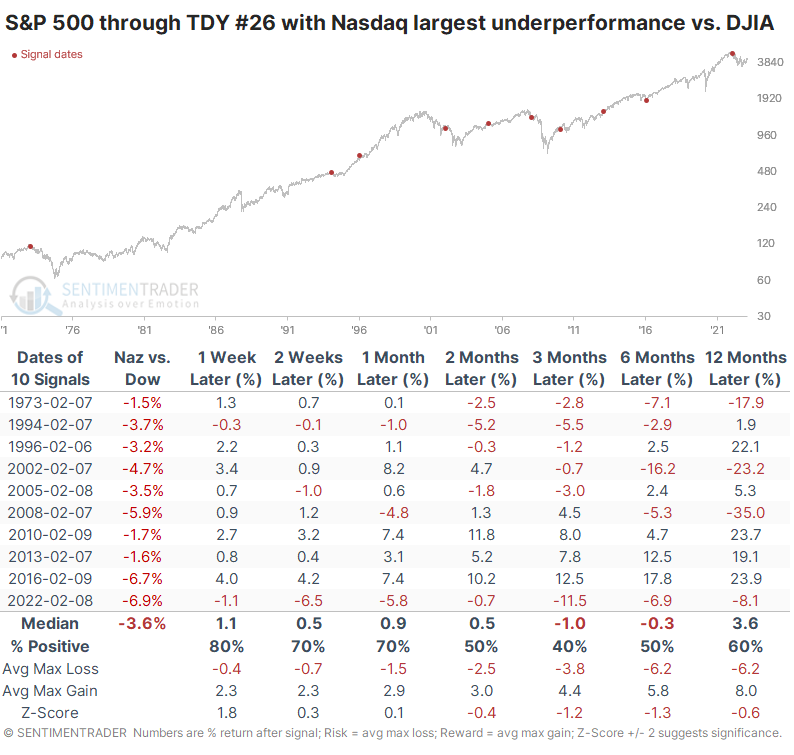
Compare those years to those with the worst starts for the Nasdaq vs. Dow. During these years, the S&P tended to show negative returns over the next 3-6 months, though there were a few significant gains.
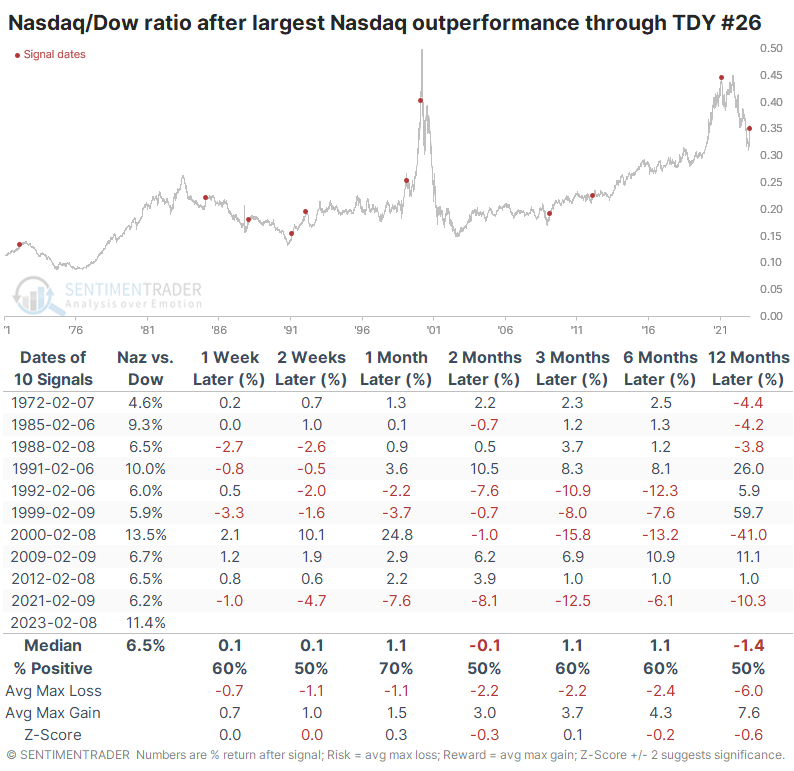
A decent chance for Nasdaq outperformance to continue
For the two indexes, fast starts for the Nasdaq tended to continue, but it wasn't a decisive edge. When the Composite index greatly outperformed the Dow this far in the year, it added to its relative gains across most time frames. It was highly variable, though if the ratio was coming off a deep decline like it had this time, the gains had a higher probability of continuing.
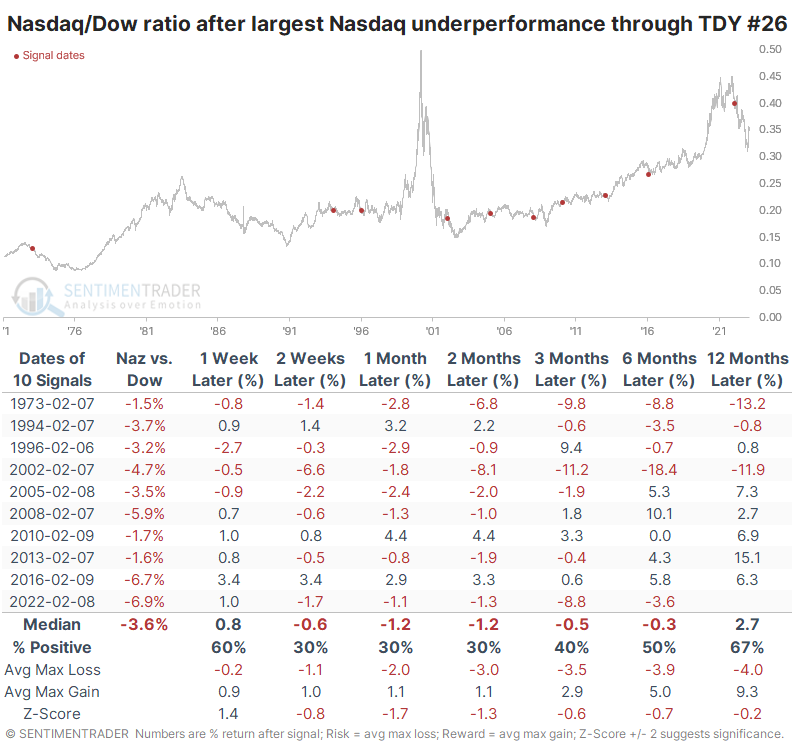
The Nasdaq had a much better chance of continuing to outperform than it did after its worst relative starts to the year. The table below shows that when the Nasdaq significantly underperformed the Dow during the first month or so of the year, it tended to struggle in the weeks and months ahead.
What the research tells us...
After almost every primary bear market, junky stocks will take off when a new bull market begins. It happened in 2003, it happened in 2009, and it has happened over the past few months. The jury is obviously still out on whether it results in a new bull market. Still, it's worth considering versus just assuming that a rebound in stocks that got his massively in 2022 automatically assumes we're back in a bubble that must be popped.
A big rally in the Nasdaq versus the Dow Industrials provides a convenient excuse for knee-jerk contrarians to point out that investors are too complacent and we're about to suffer another wave of selling pressure. Maybe we are; who knows. Historically, they do not have a leg to stand on if they're going to use the relative performance of those two indexes so far this year.
Indicators at Extremes
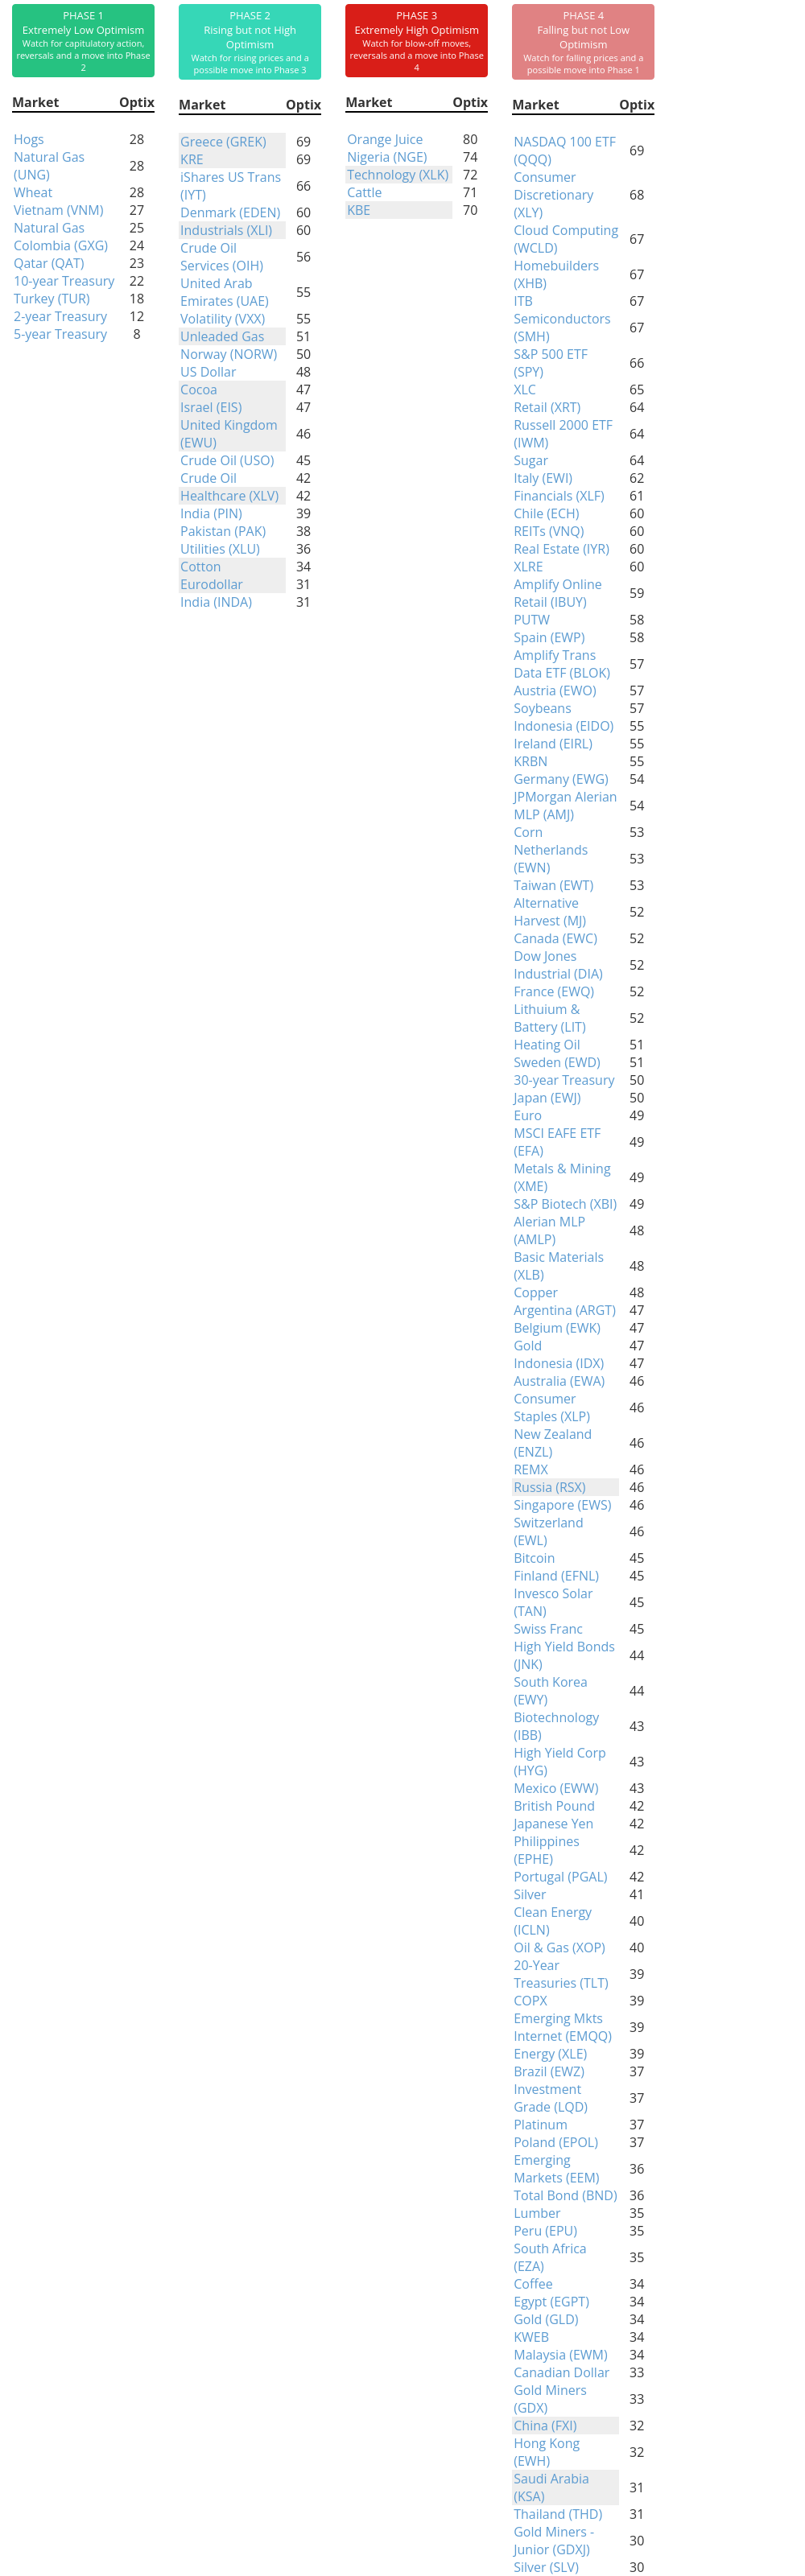
Phase Table
Ranks
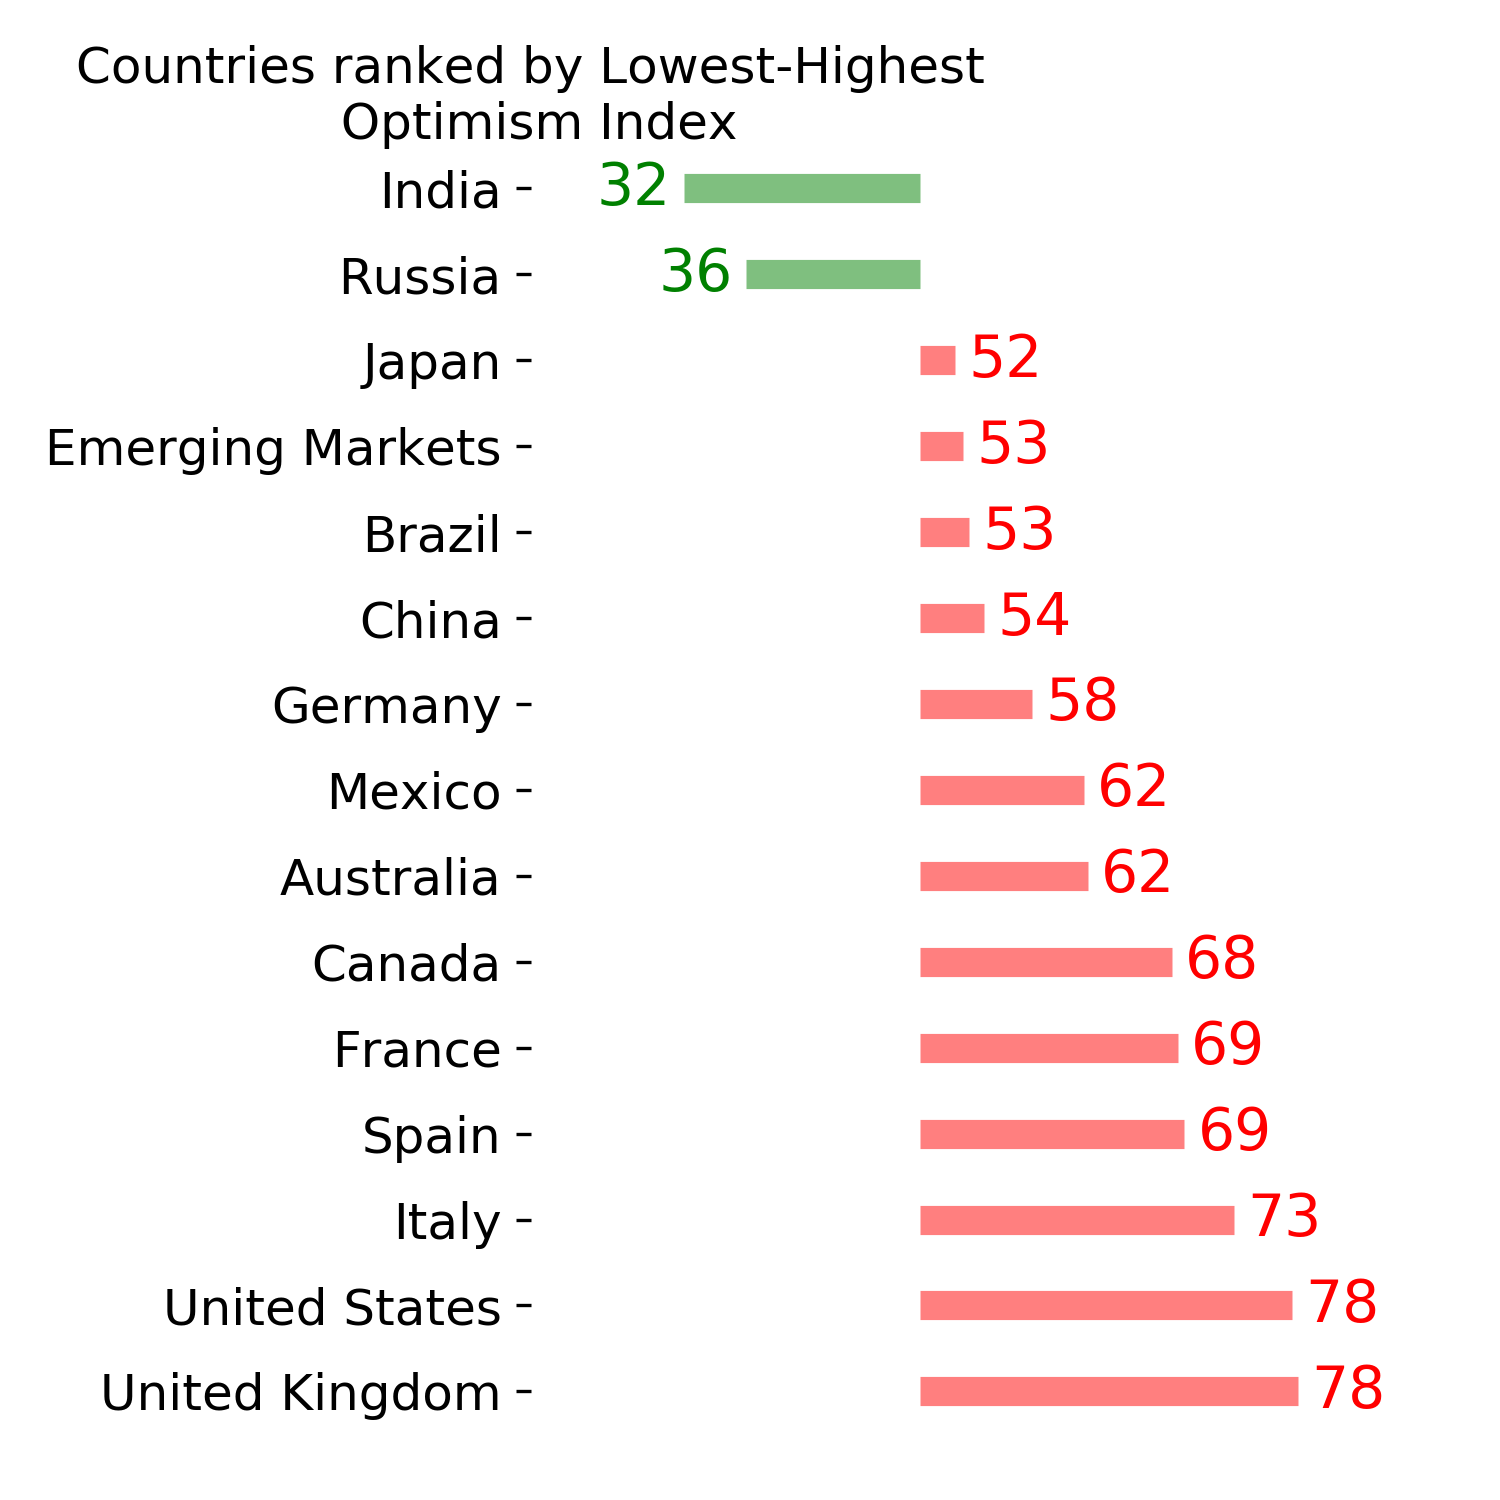
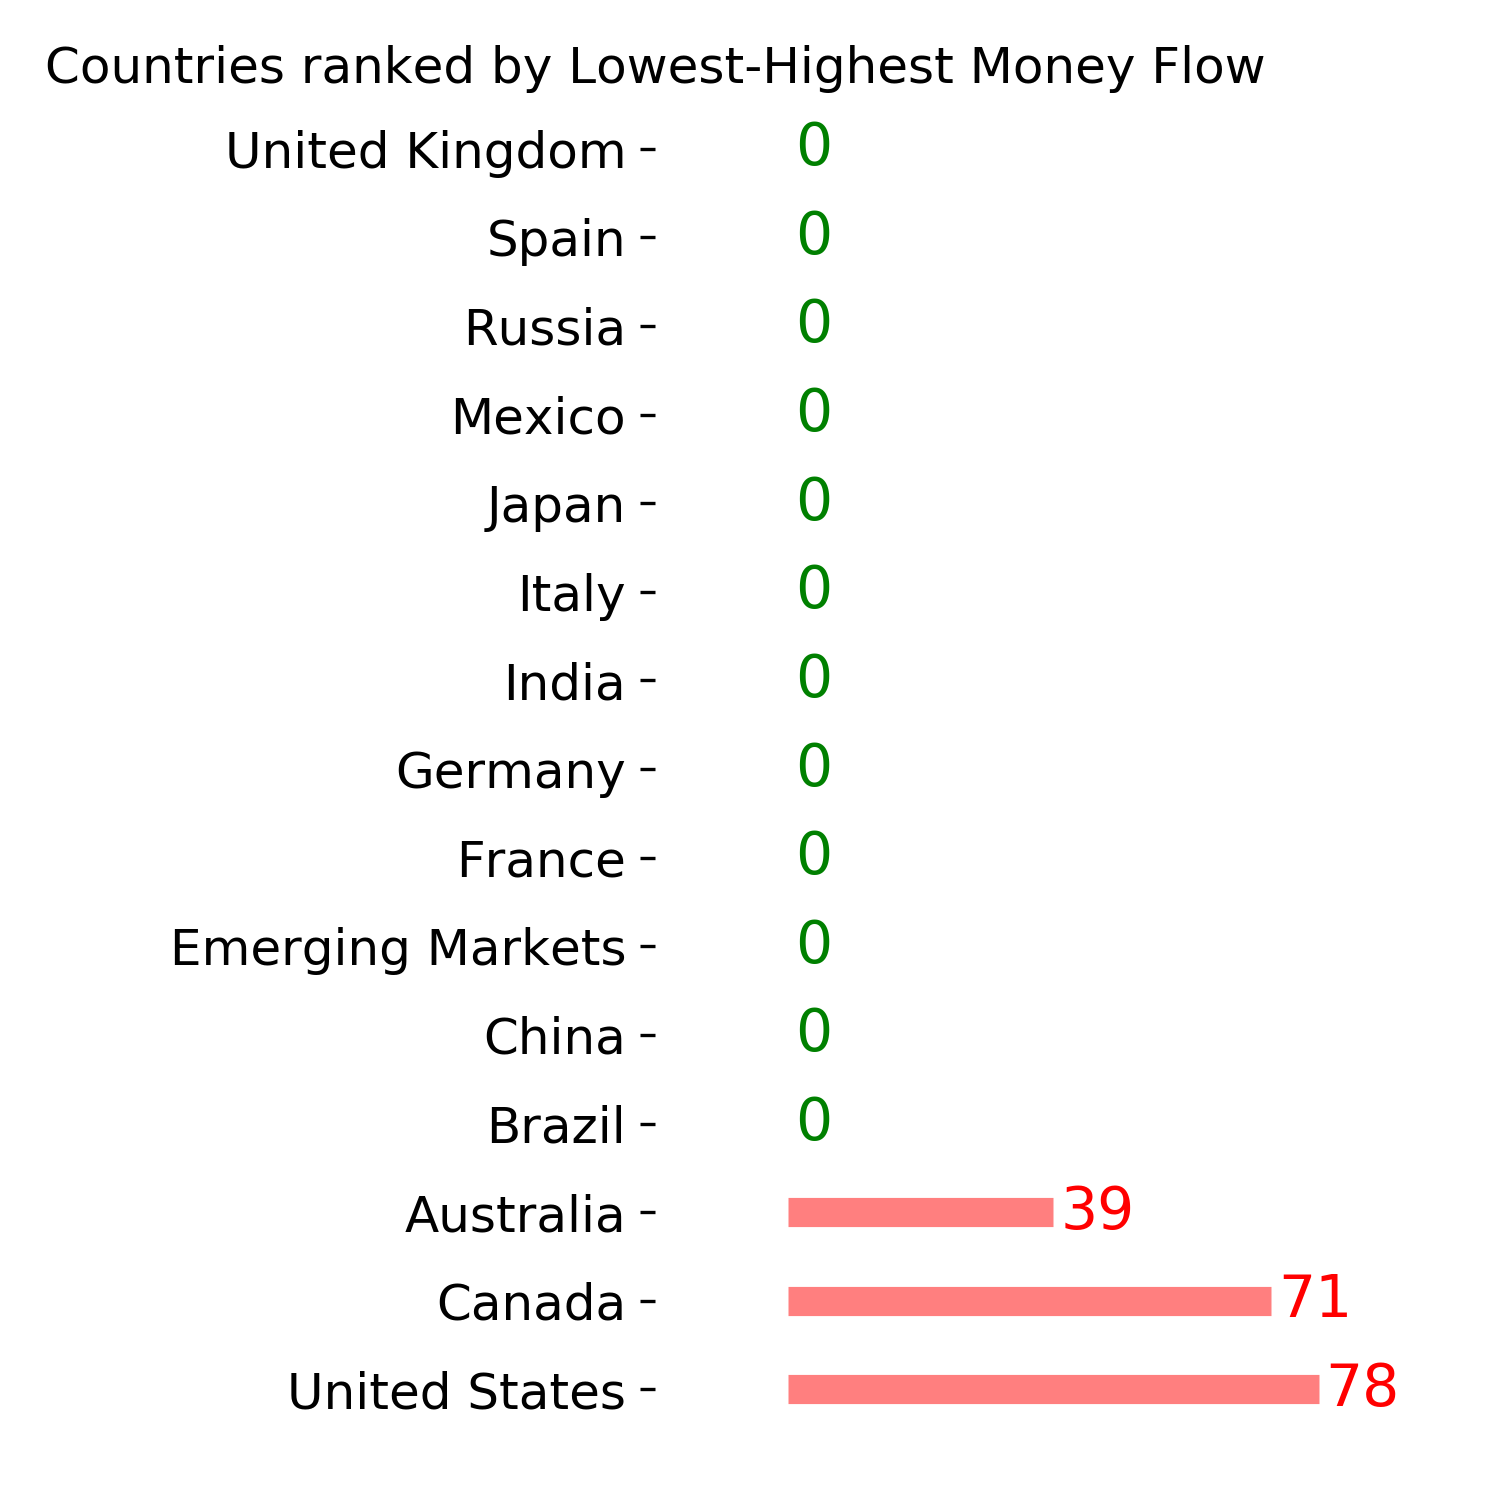
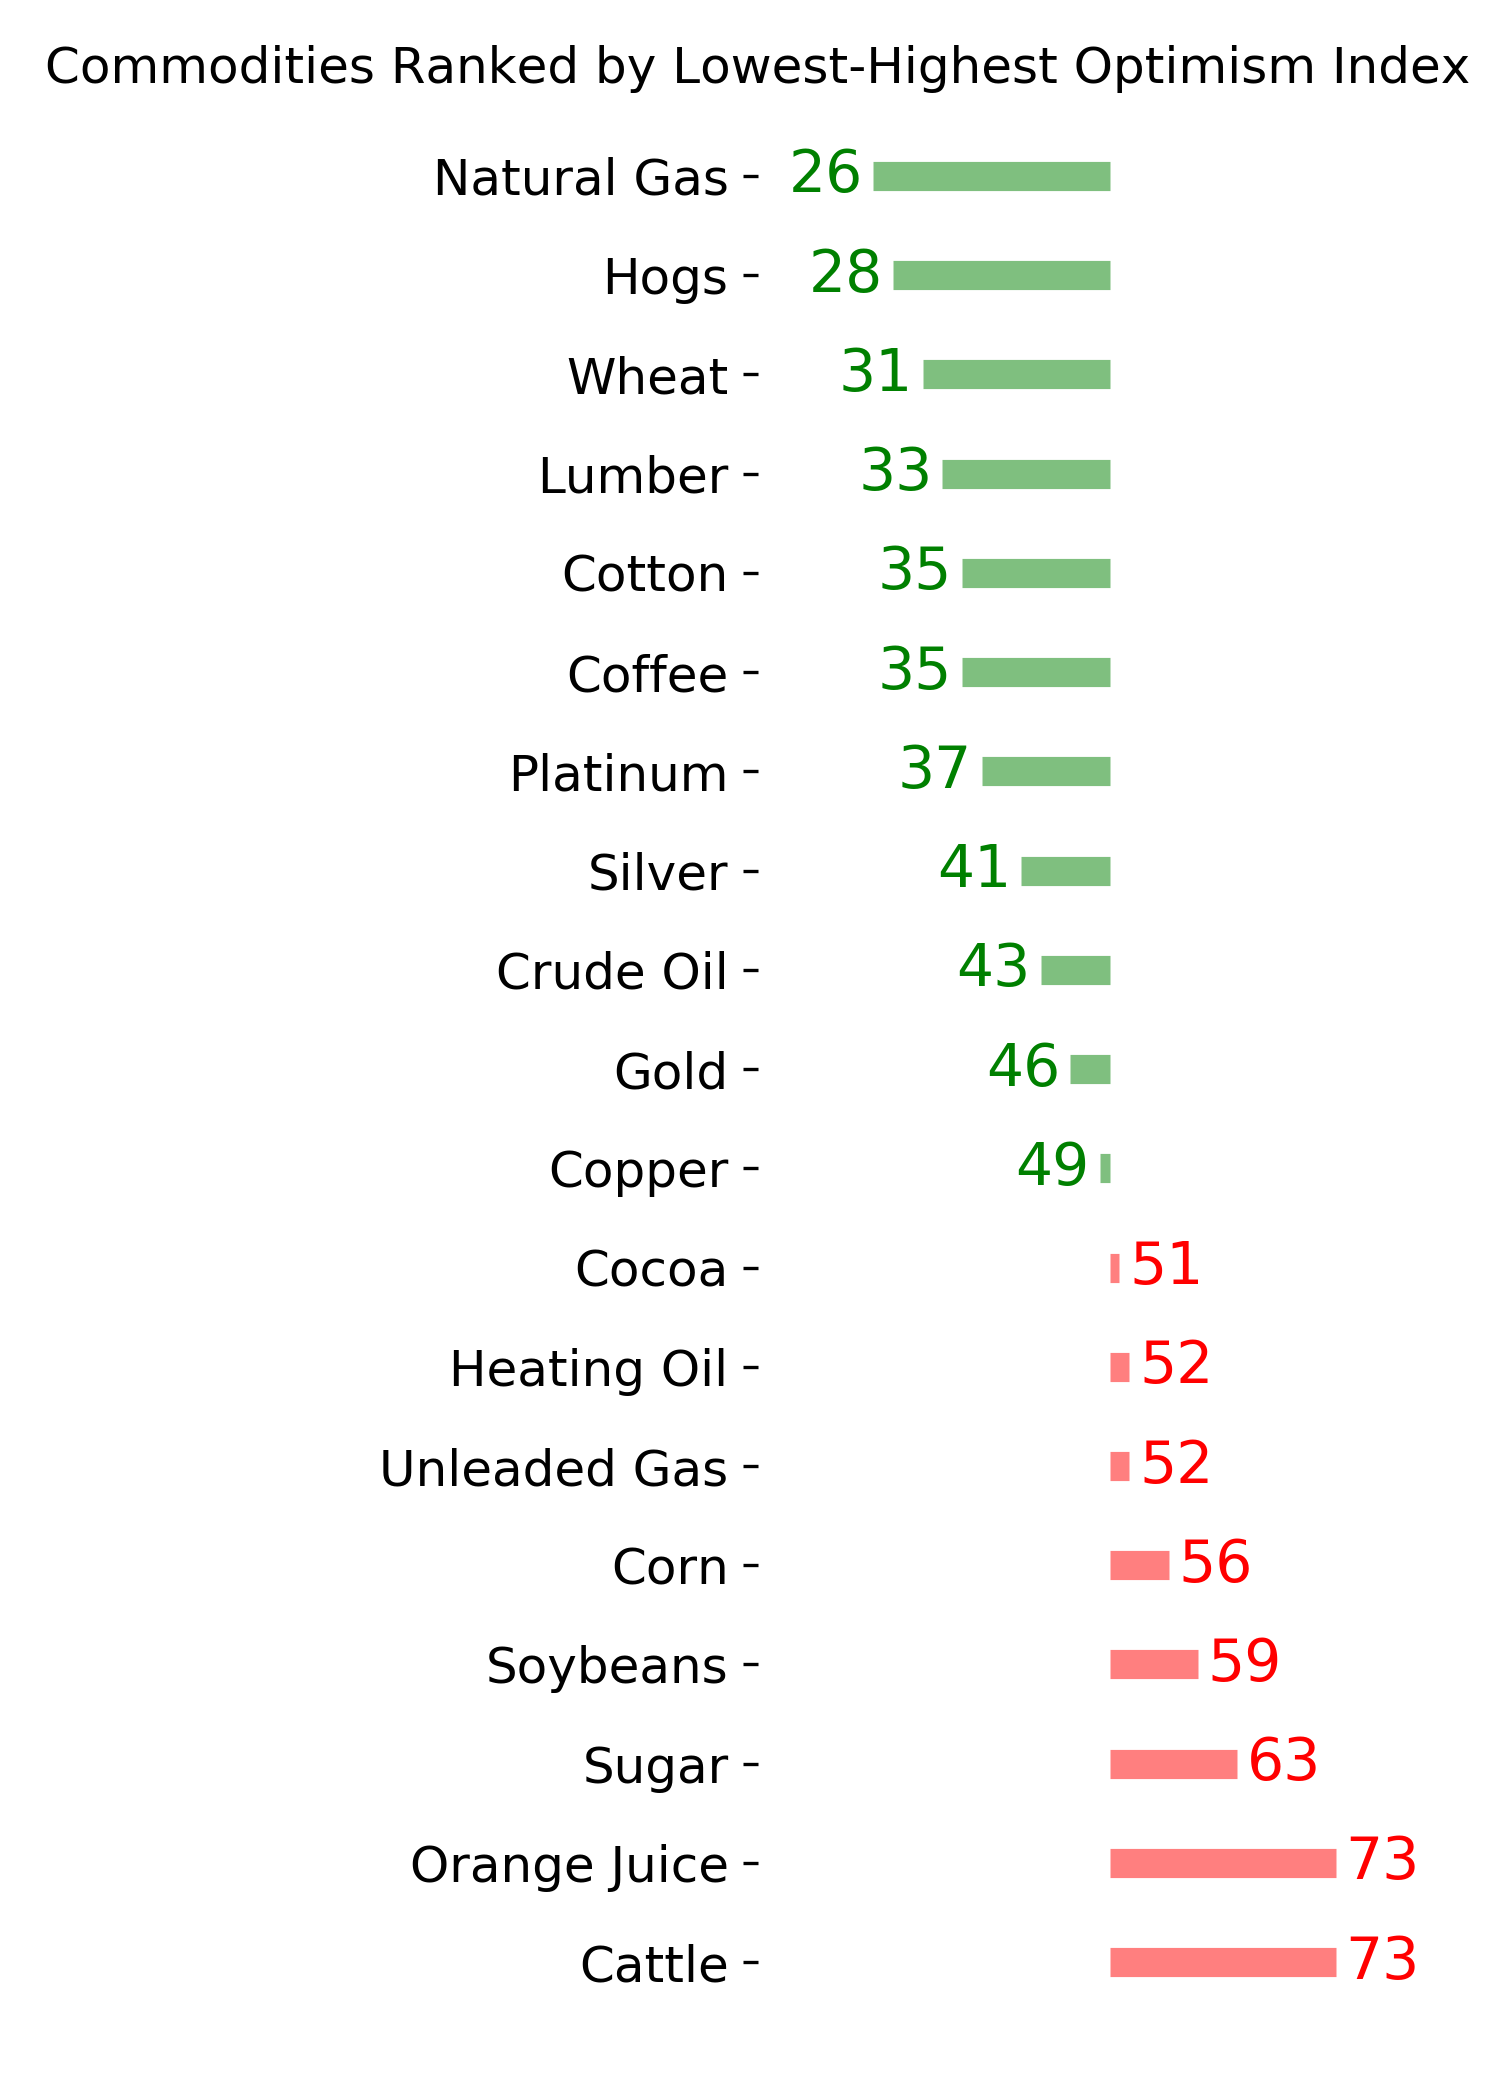
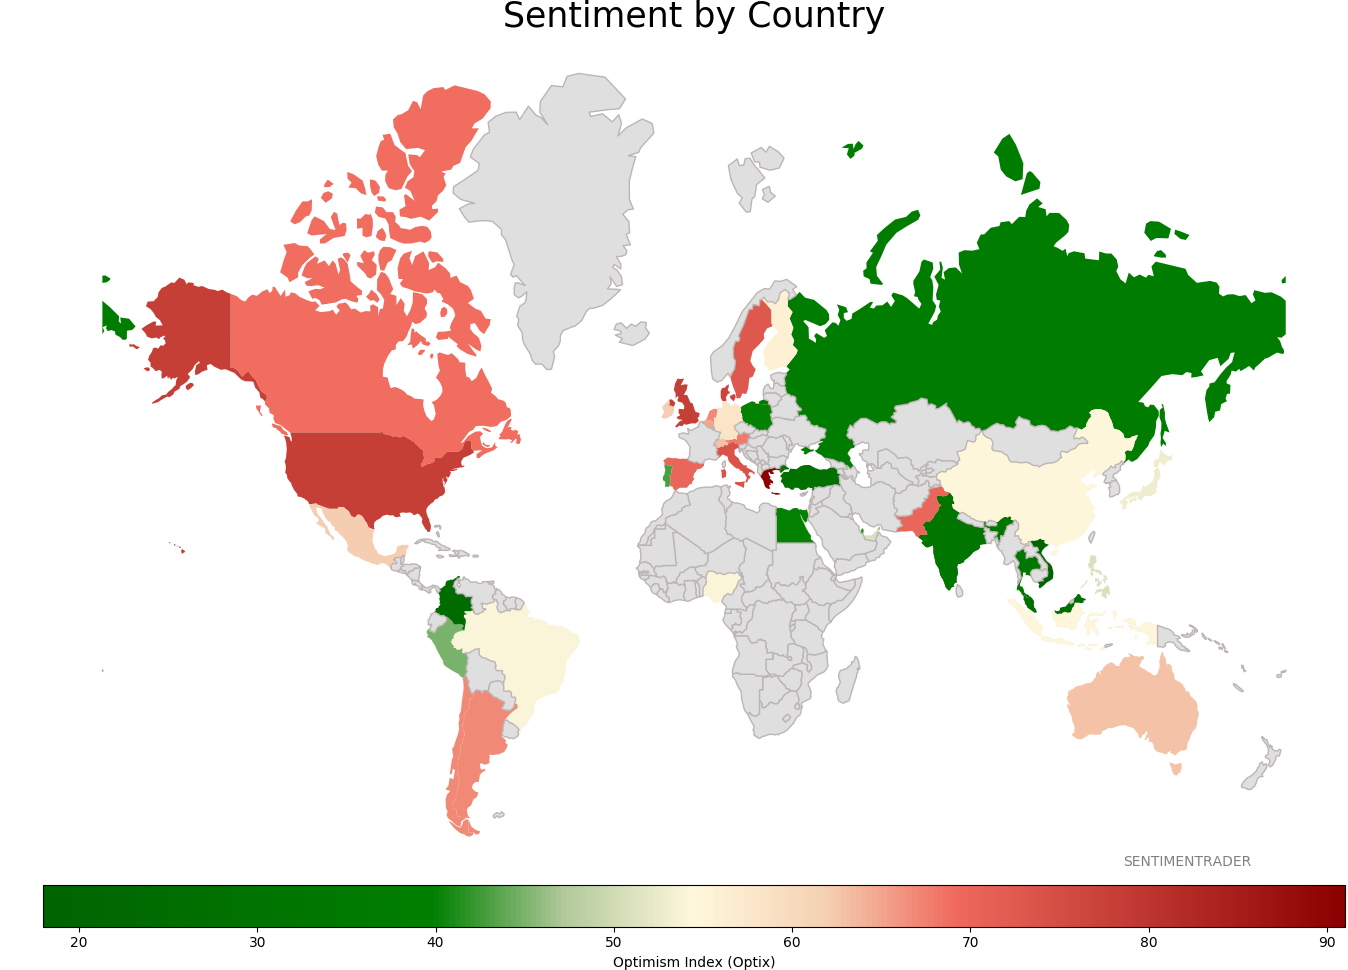
Sentiment Around The World
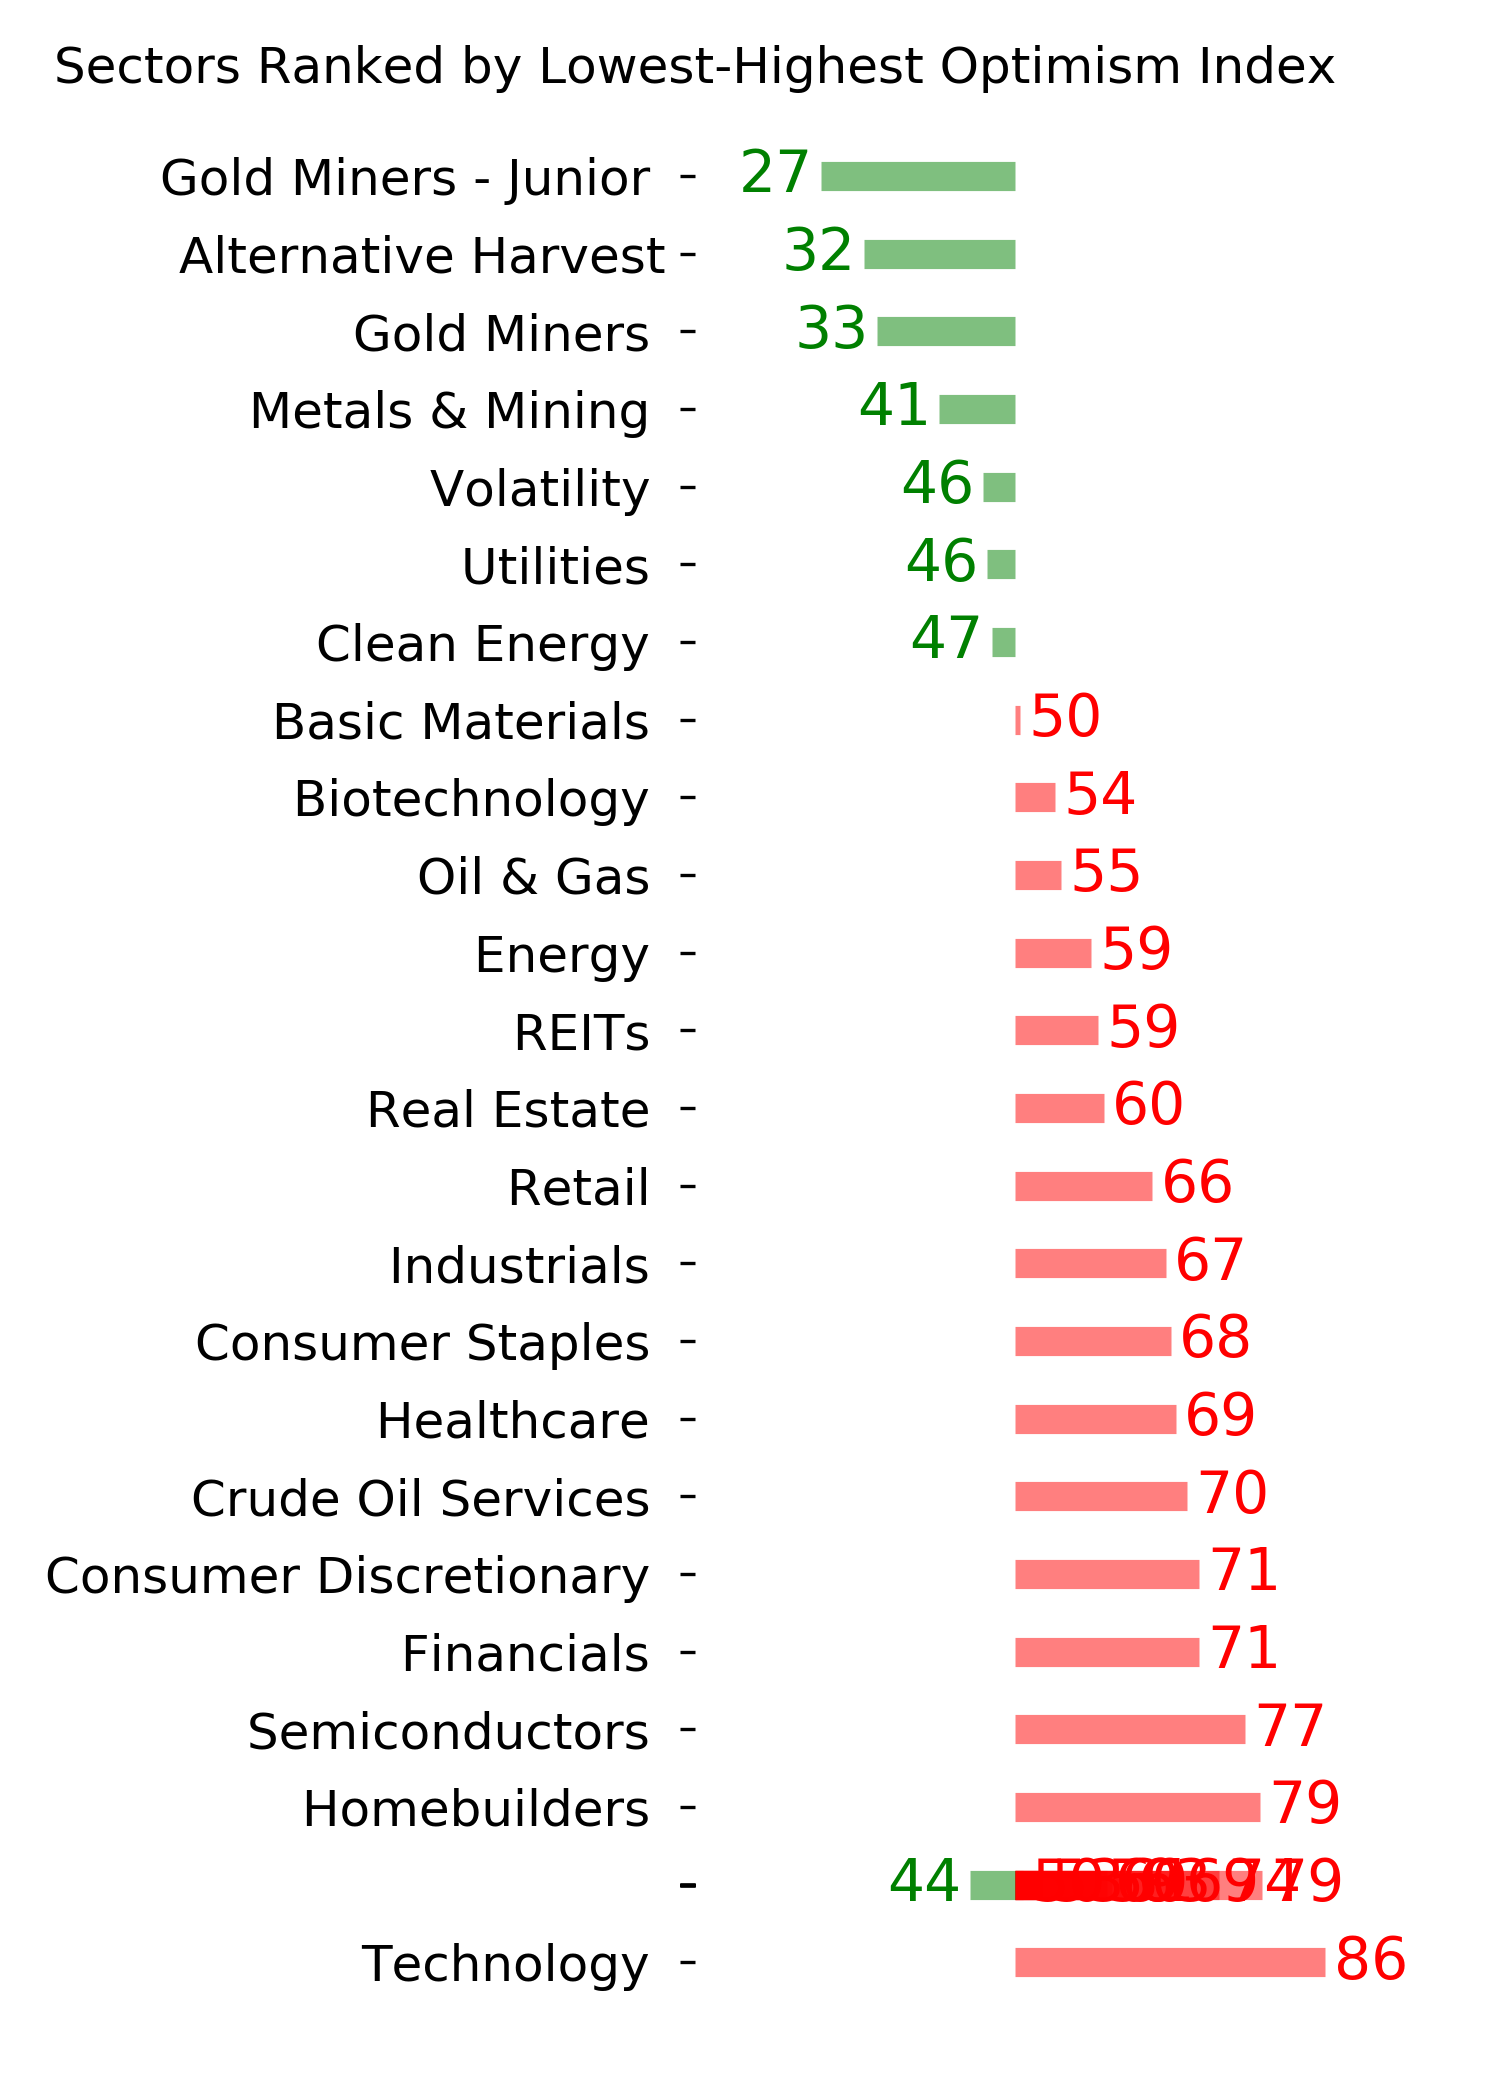
Optimism Index Thumbnails
|
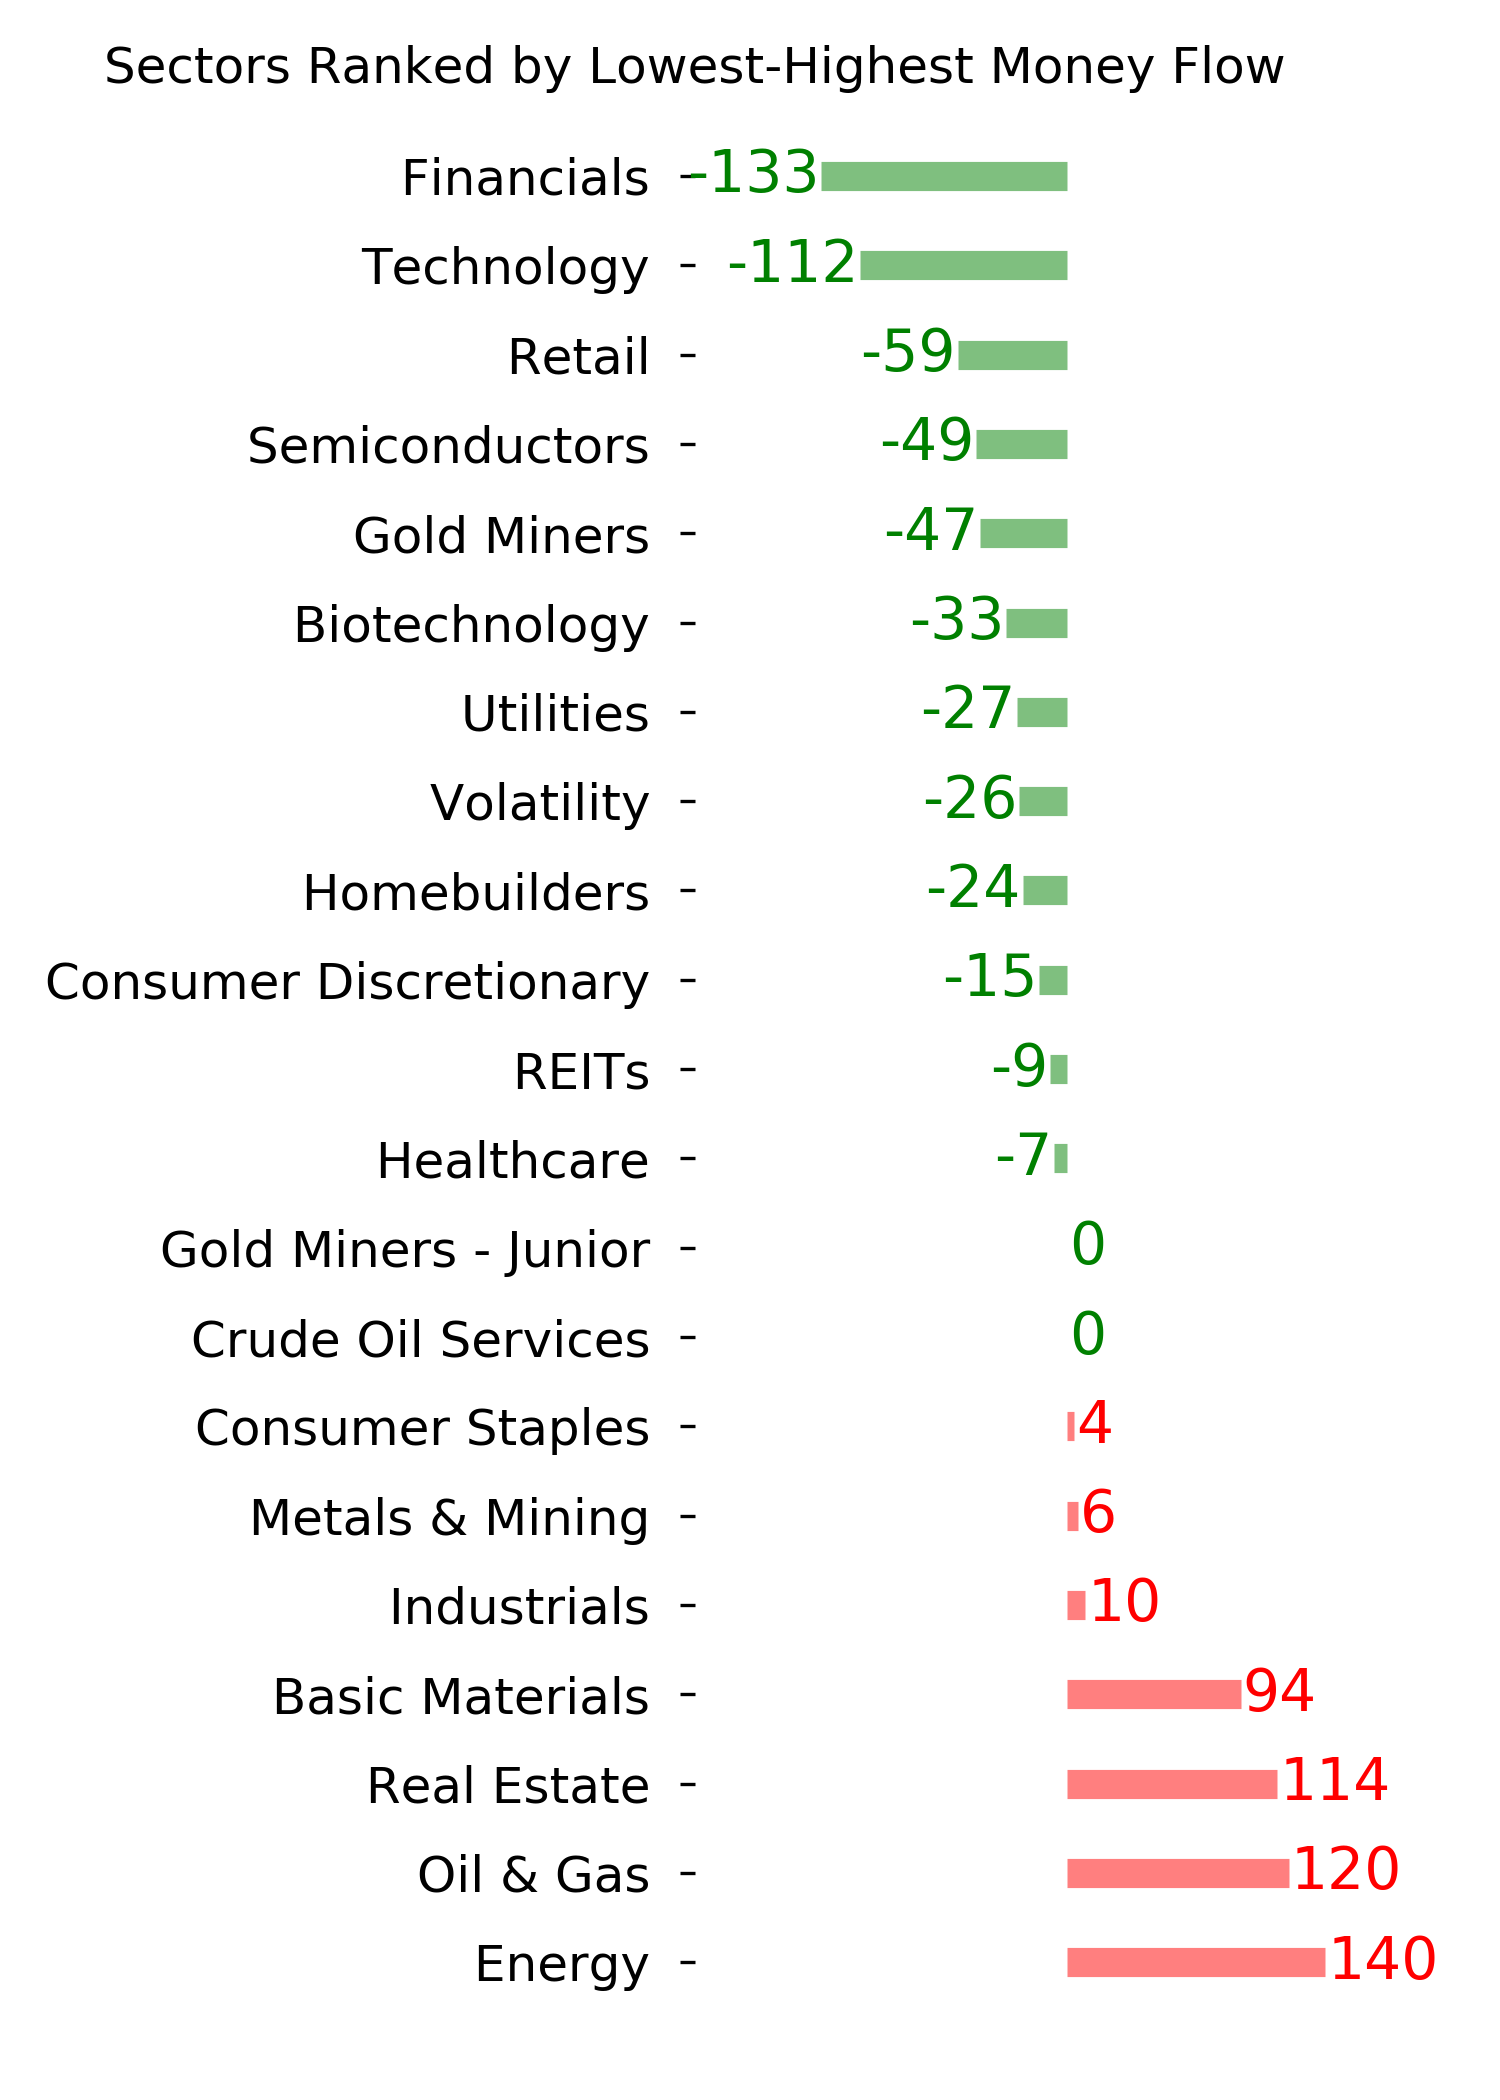
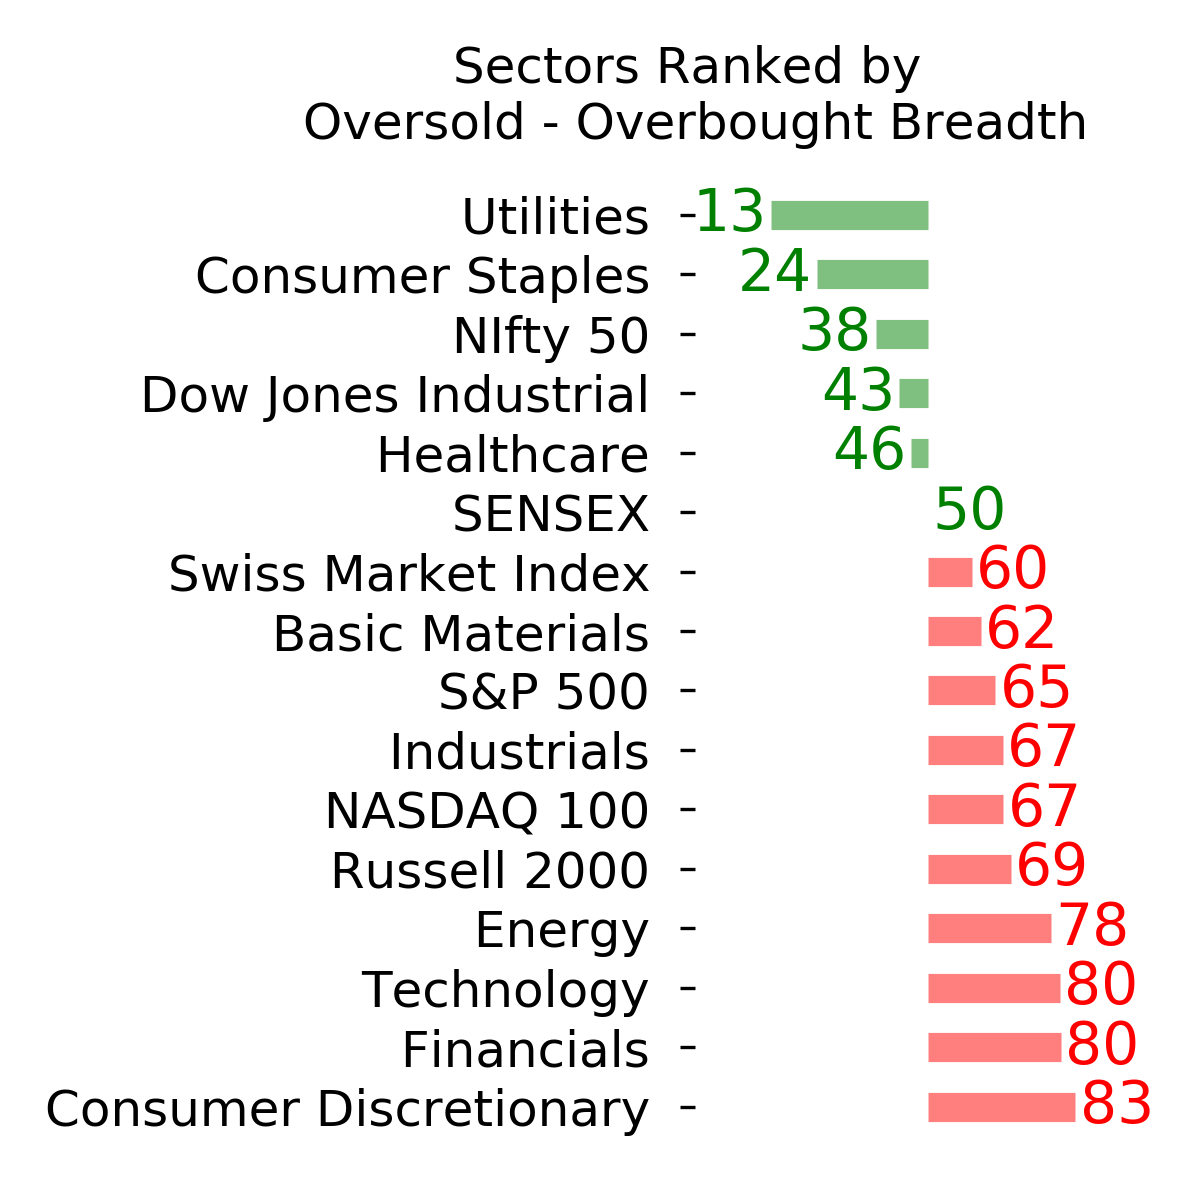
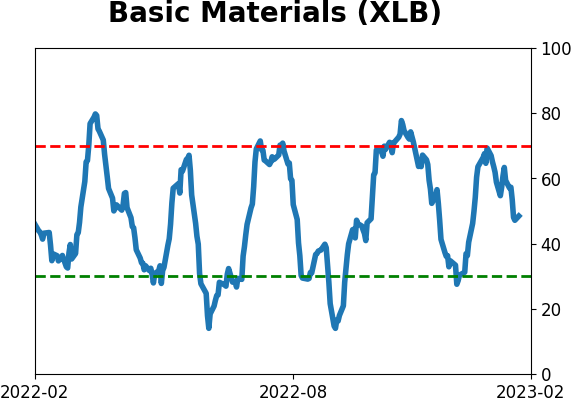
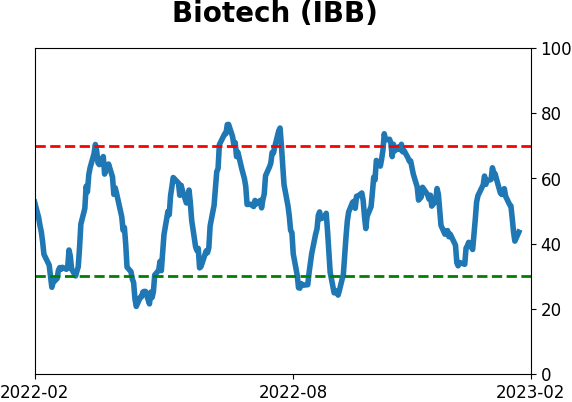
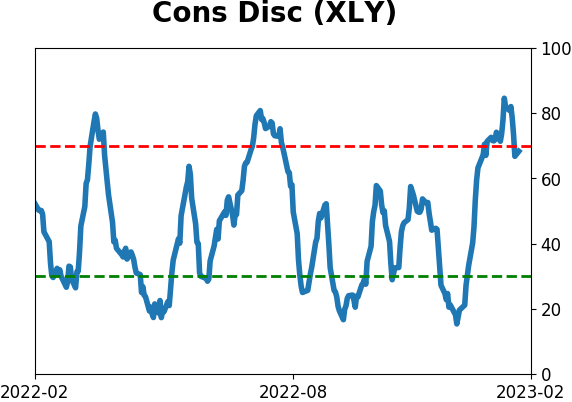
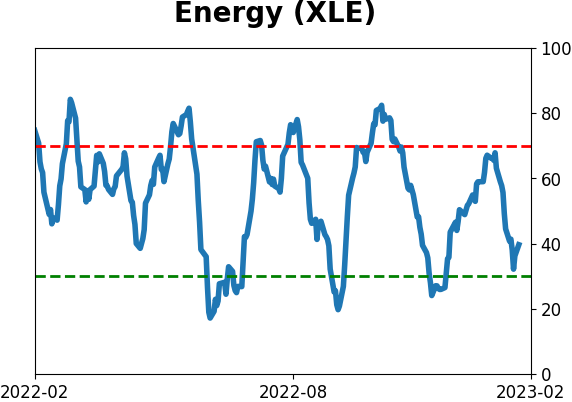
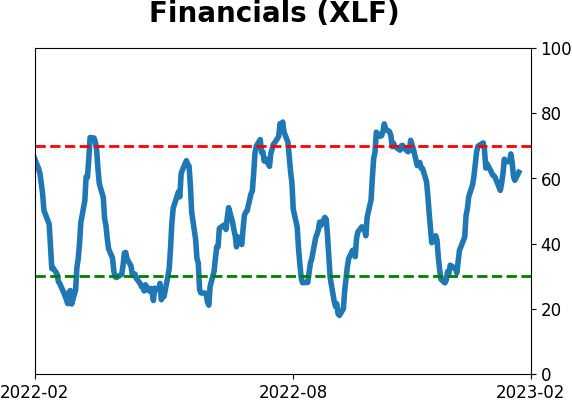
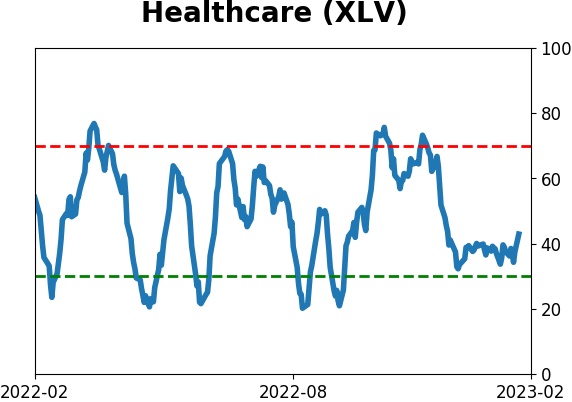
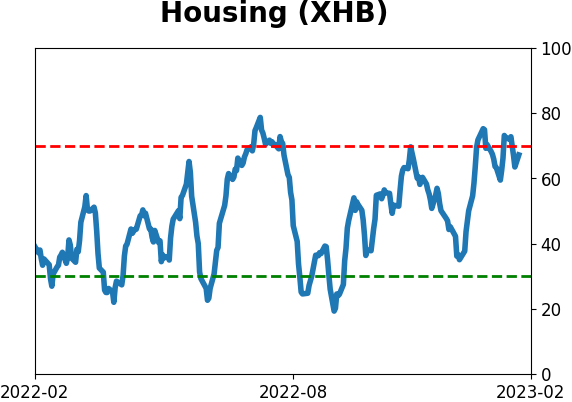
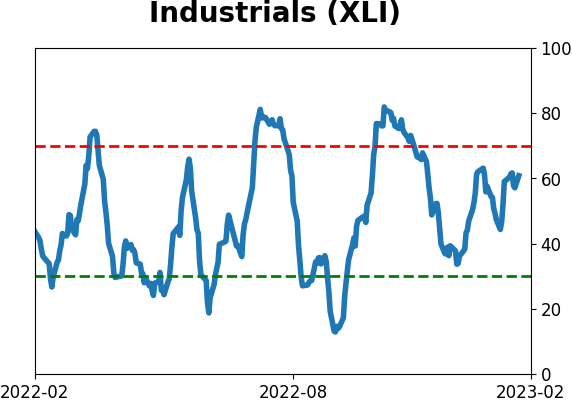
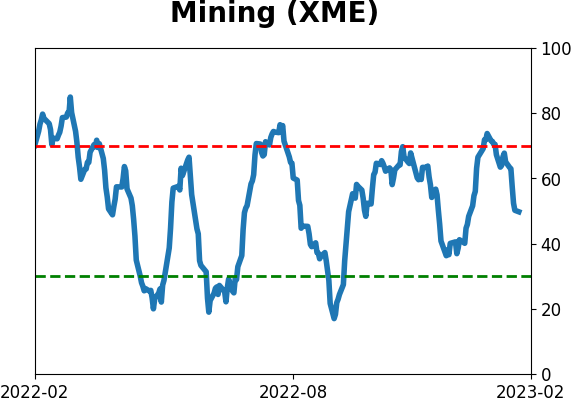
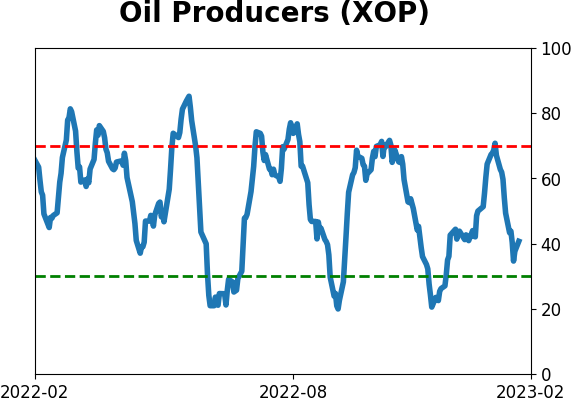
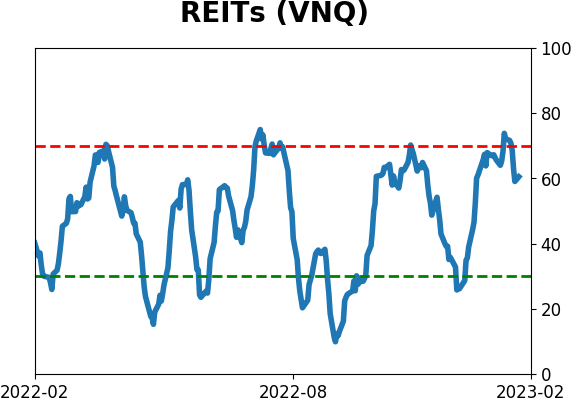
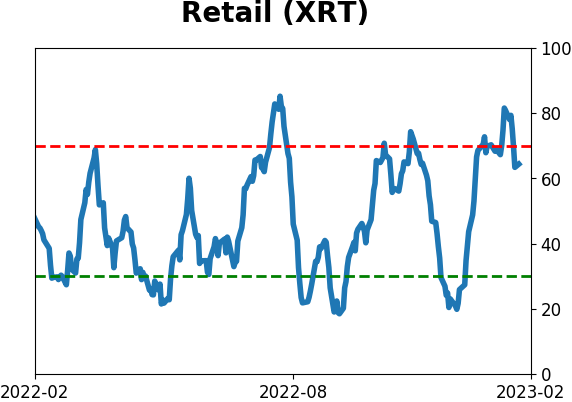
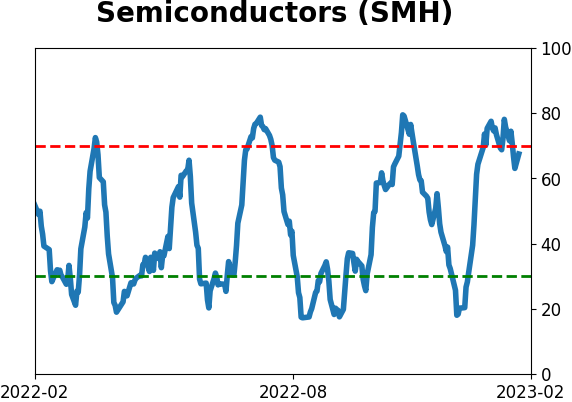
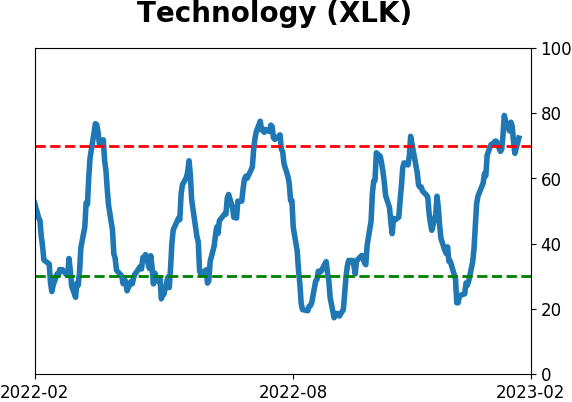
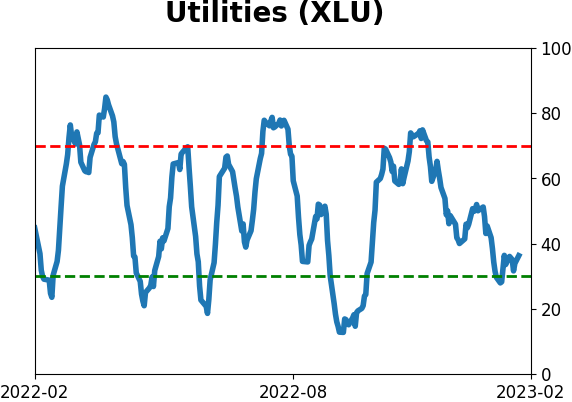
Sector ETF's - 10-Day Moving Average
|
|
|
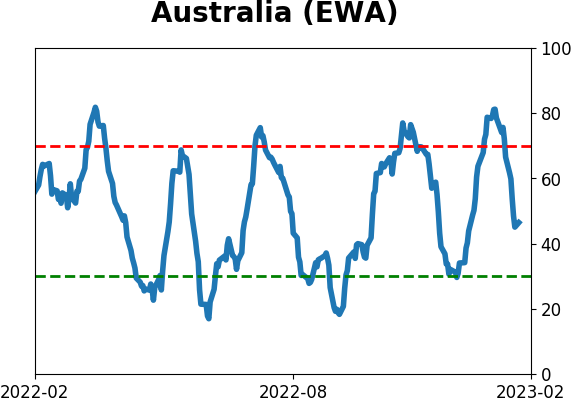
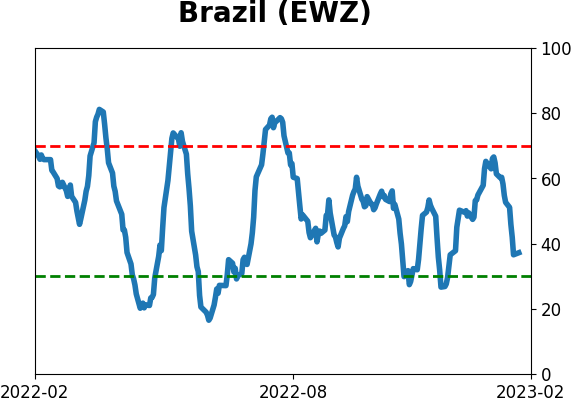
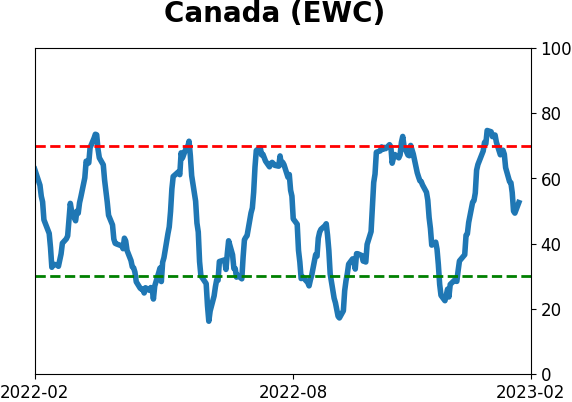
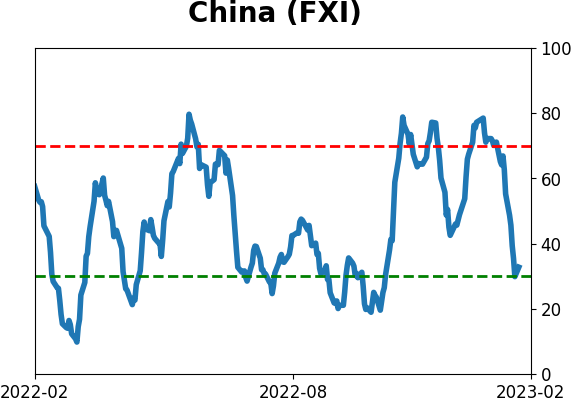
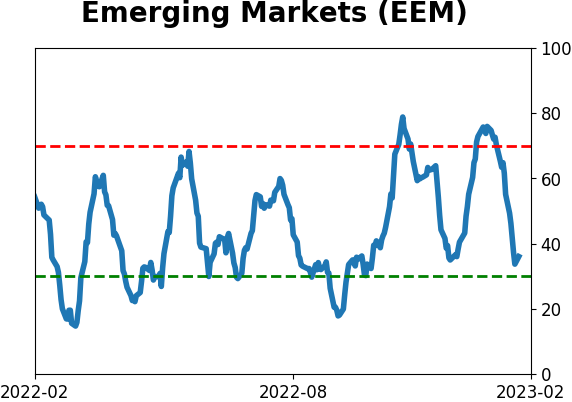
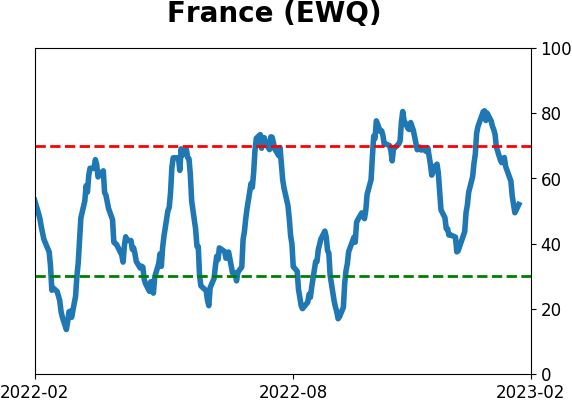
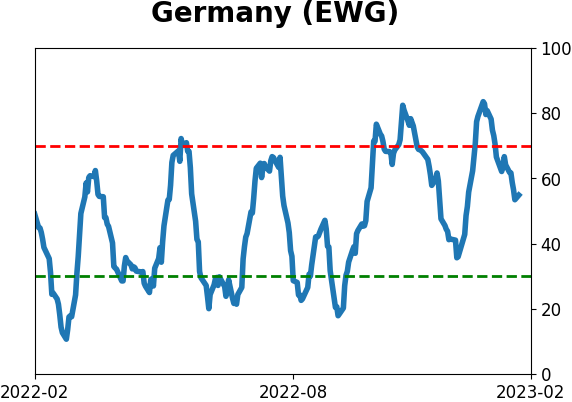
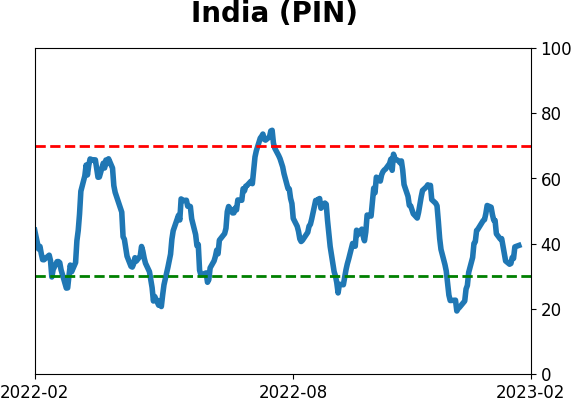
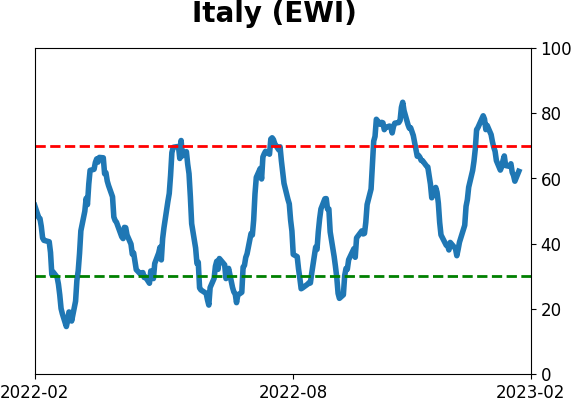
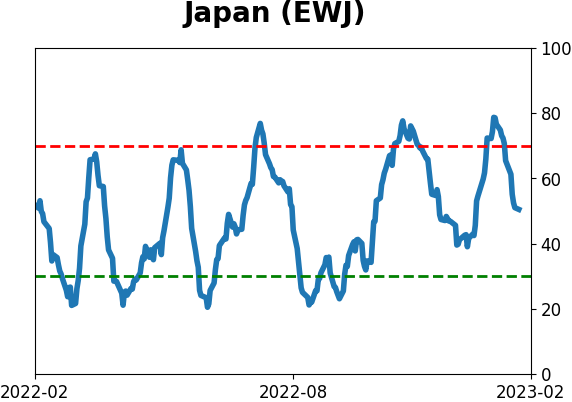
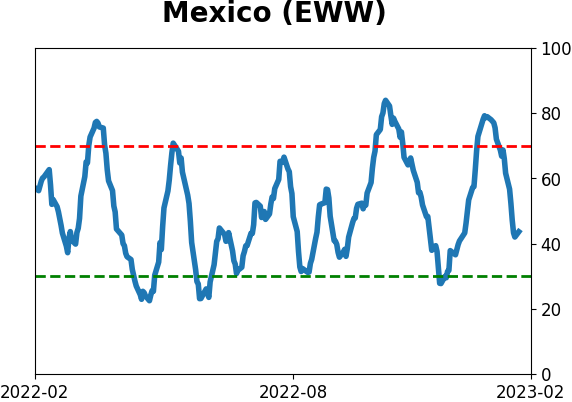
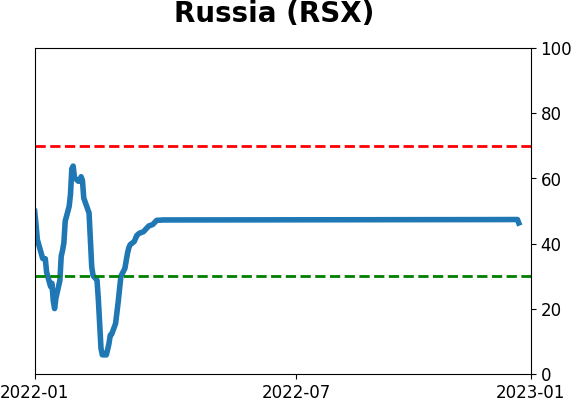
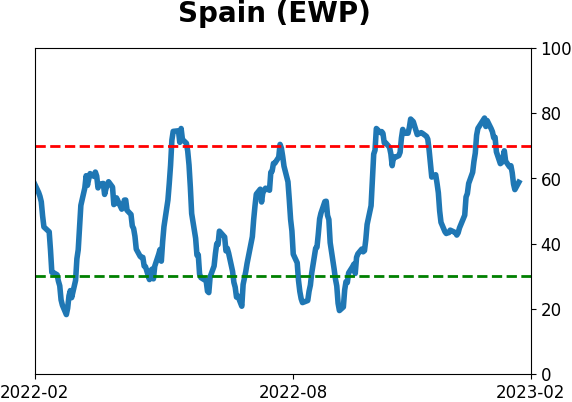
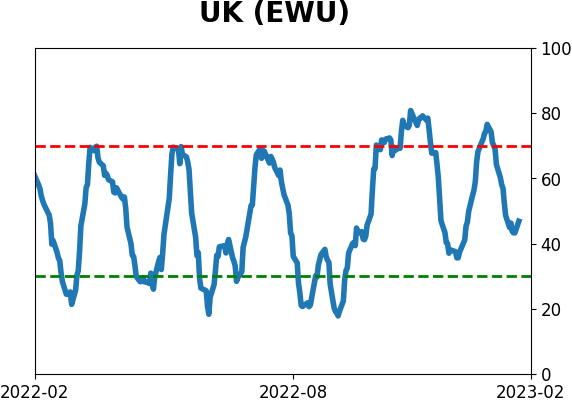
Country ETF's - 10-Day Moving Average
|
|
|
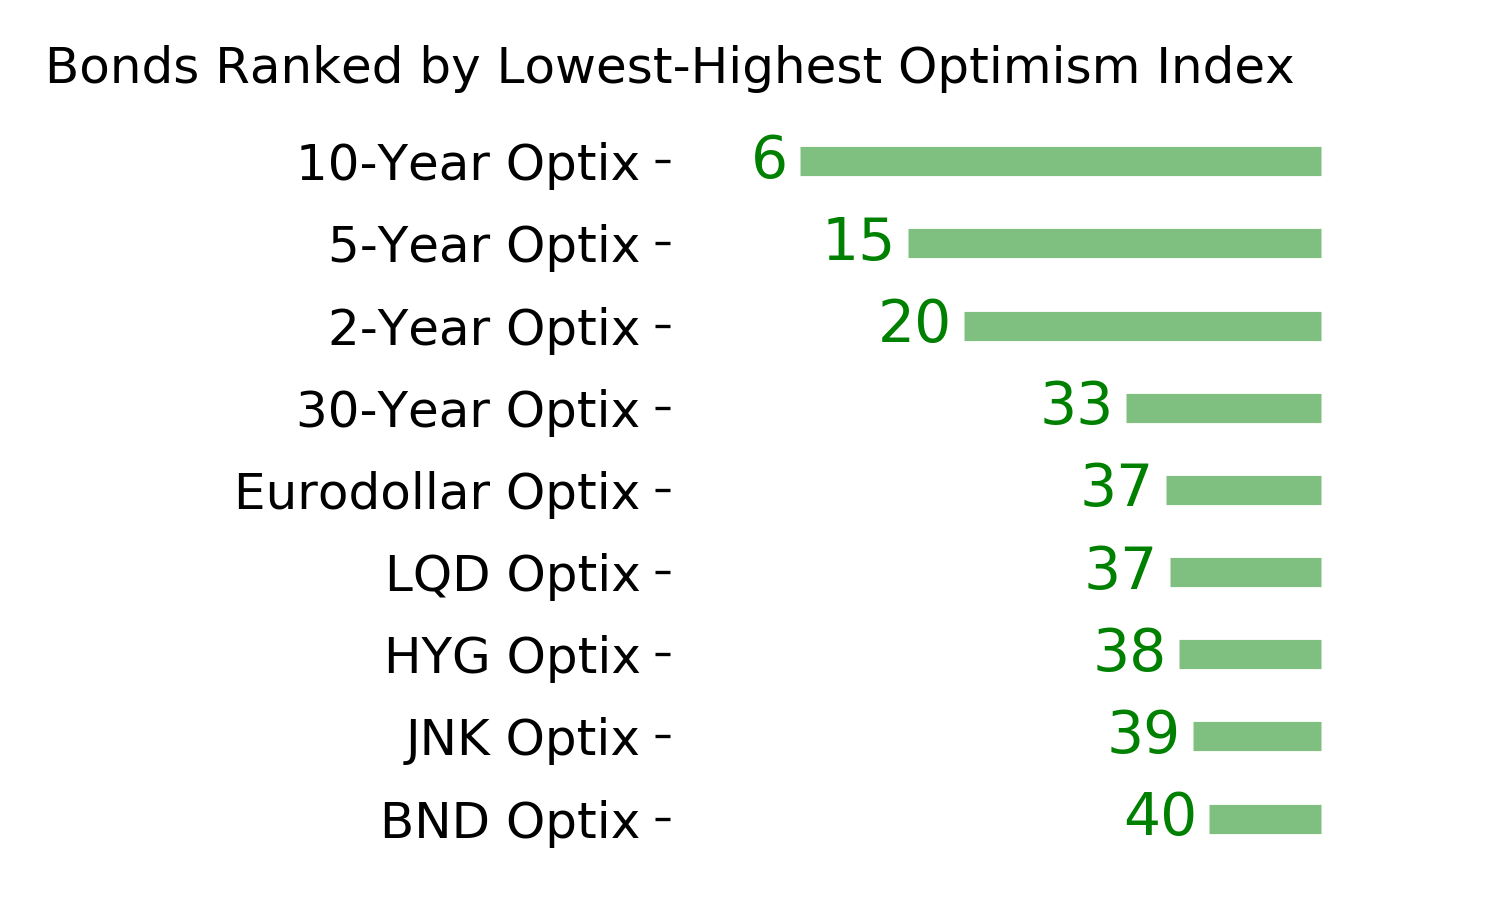
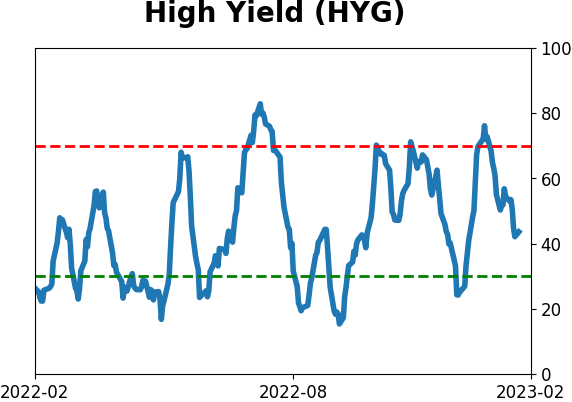
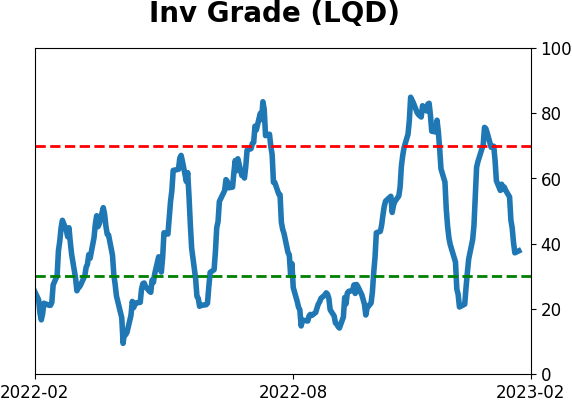
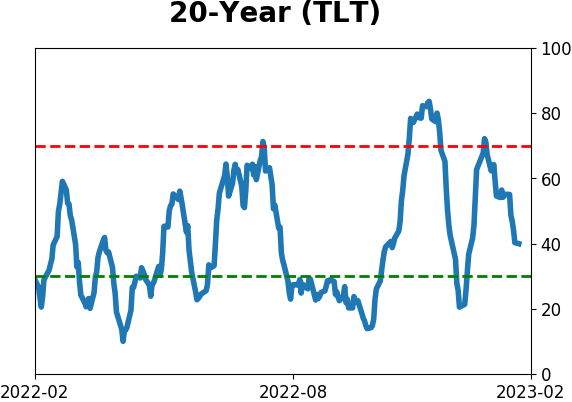
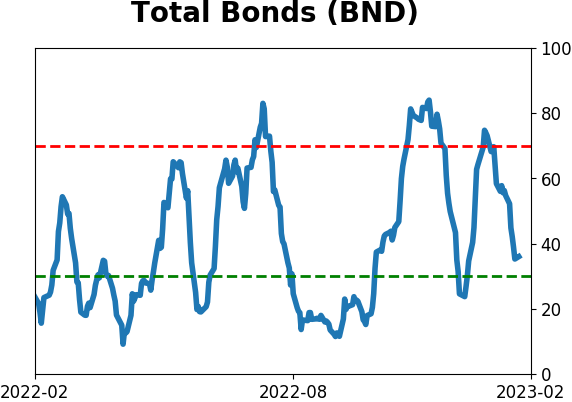
Bond ETF's - 10-Day Moving Average
|
|
|
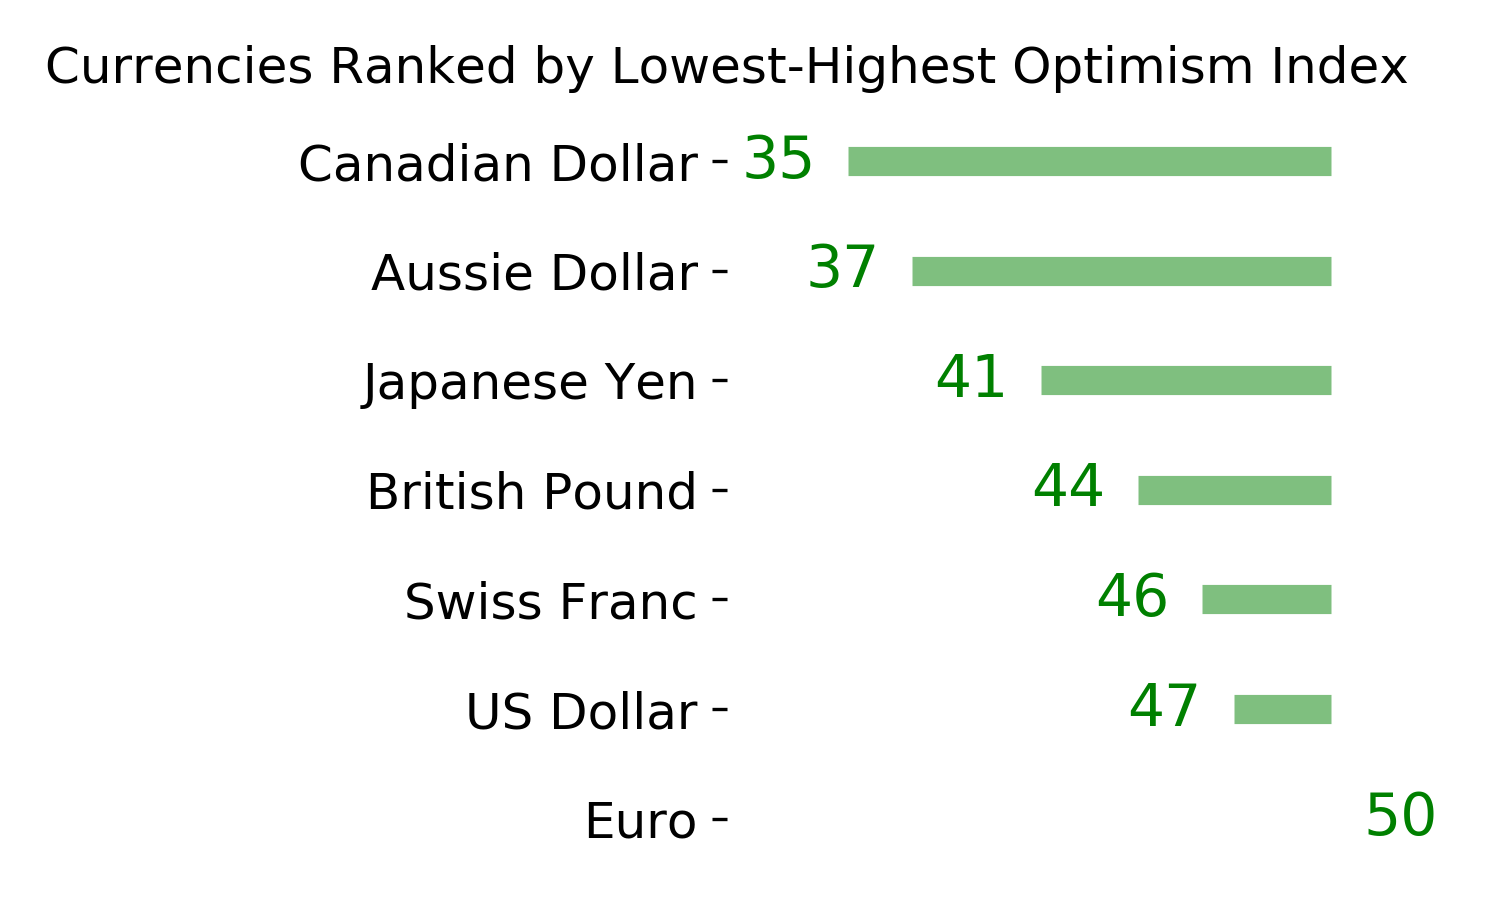
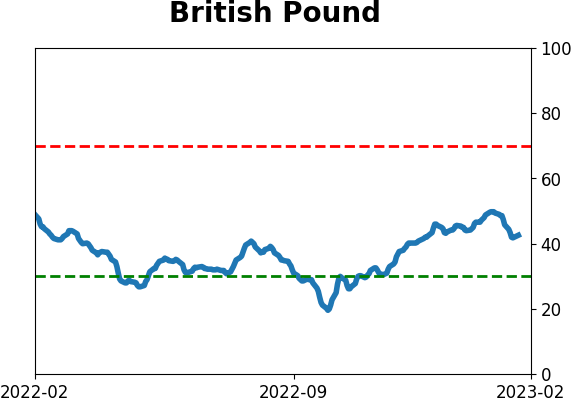
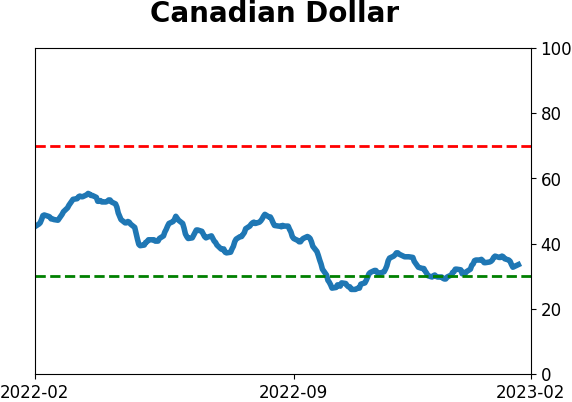
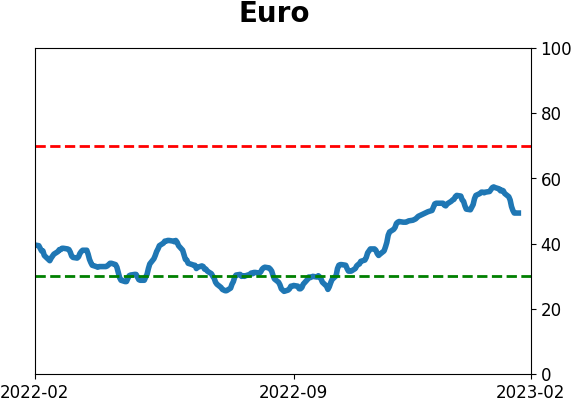
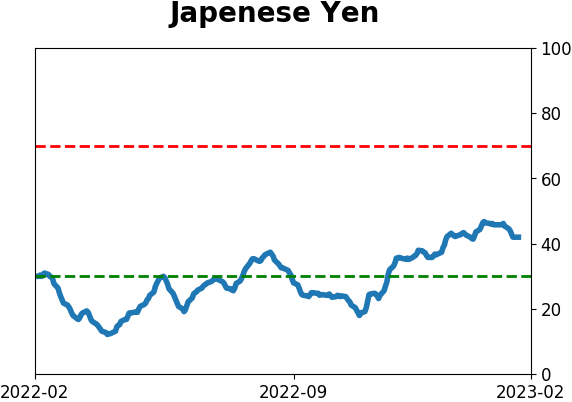
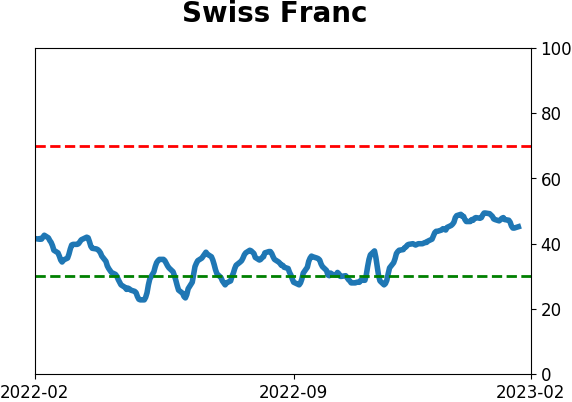
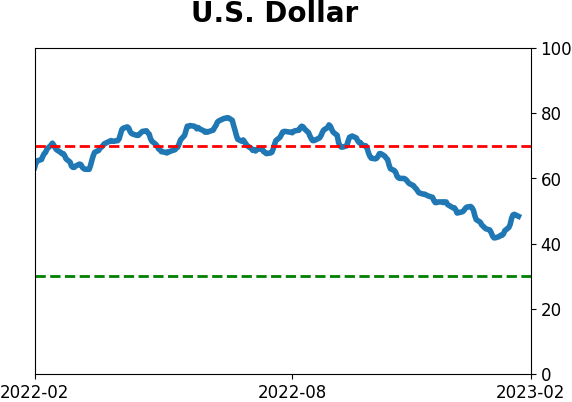
Currency ETF's - 5-Day Moving Average
|
|
|
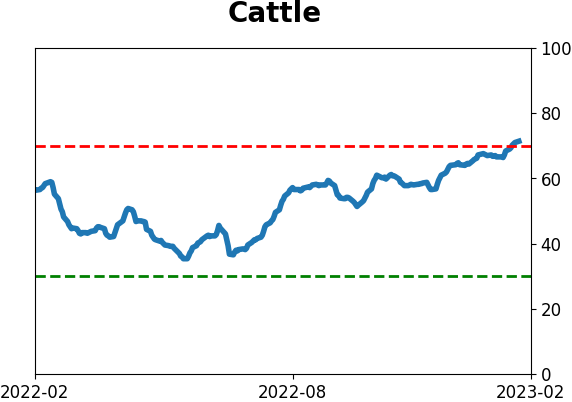
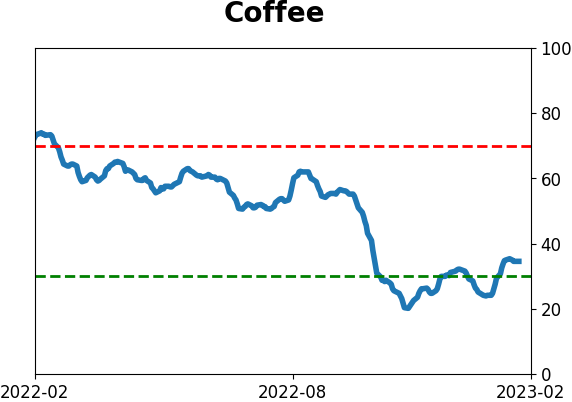
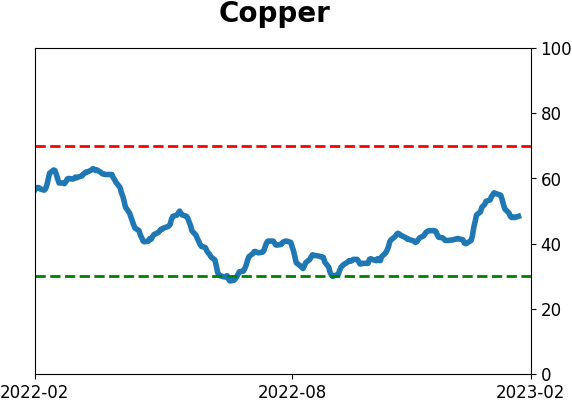
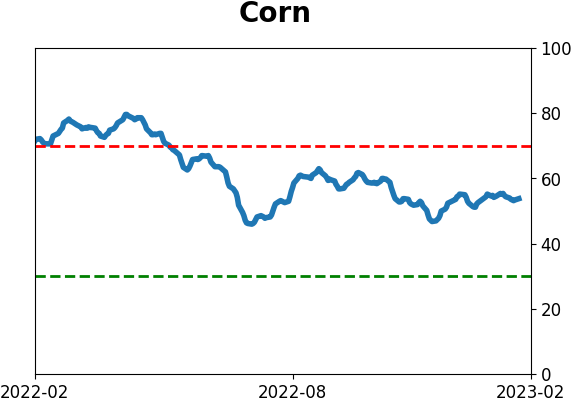
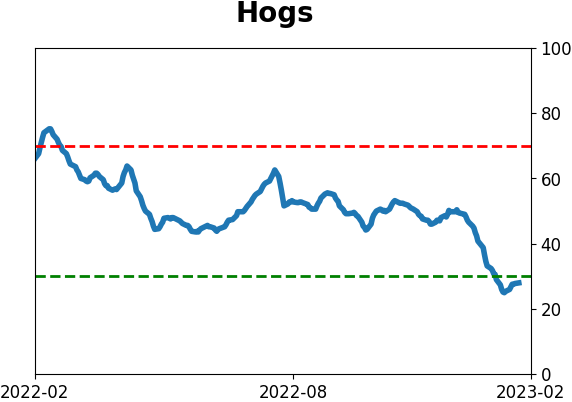
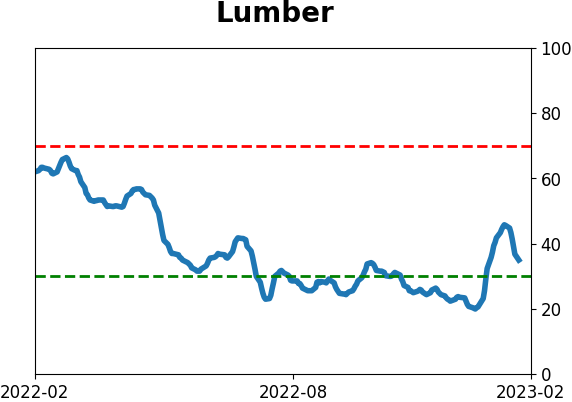
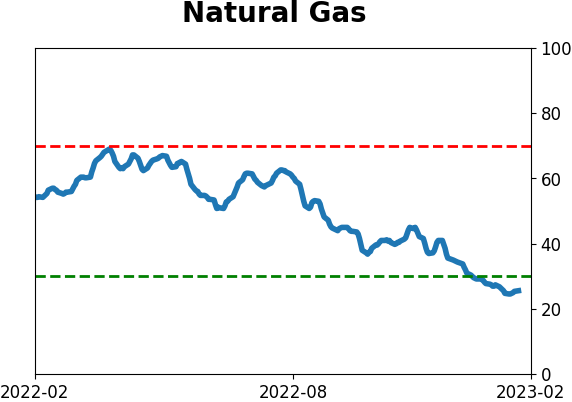
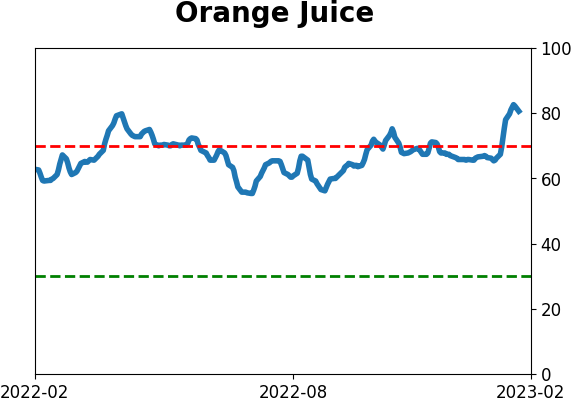
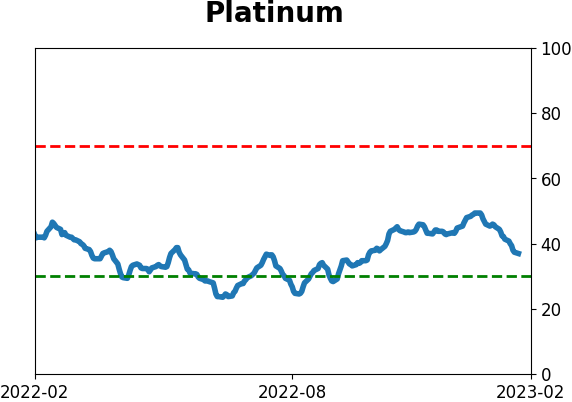
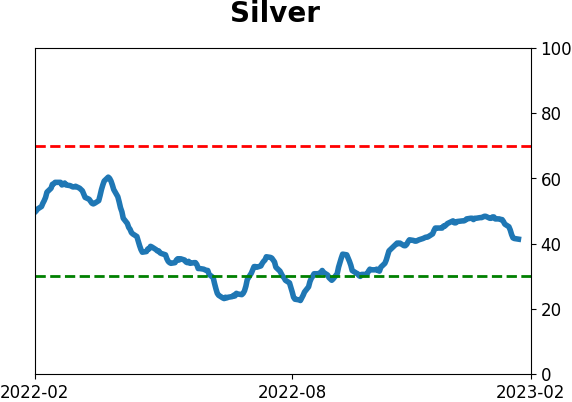
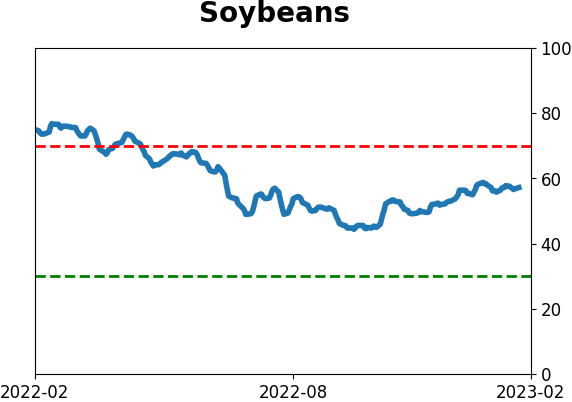
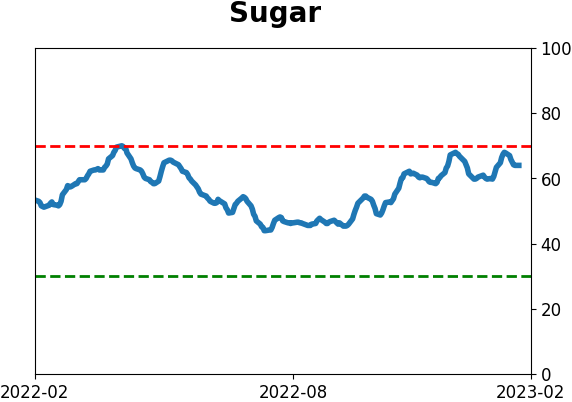
Commodity ETF's - 5-Day Moving Average
|
|