Daily Report : Market Momentum in the Energy Sector

| View/Print a PDF version of this Report |
Headlines
|
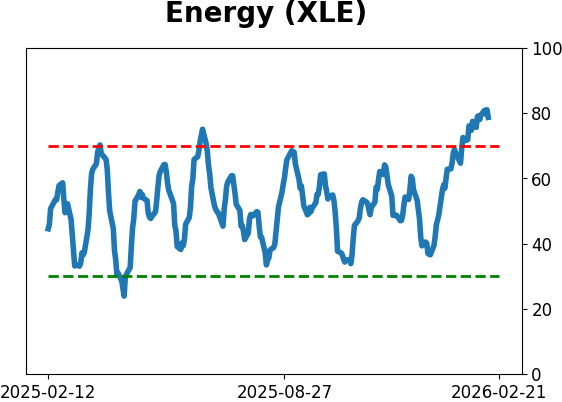
Market Momentum in the Energy Sector: The Energy Sector (XLE) shows strong upward momentum with XLE 22% above its 200-day MA and Optix 10-day MA breaking 80, while short-term overheating and long-term strength present a balanced outlook for investors. |
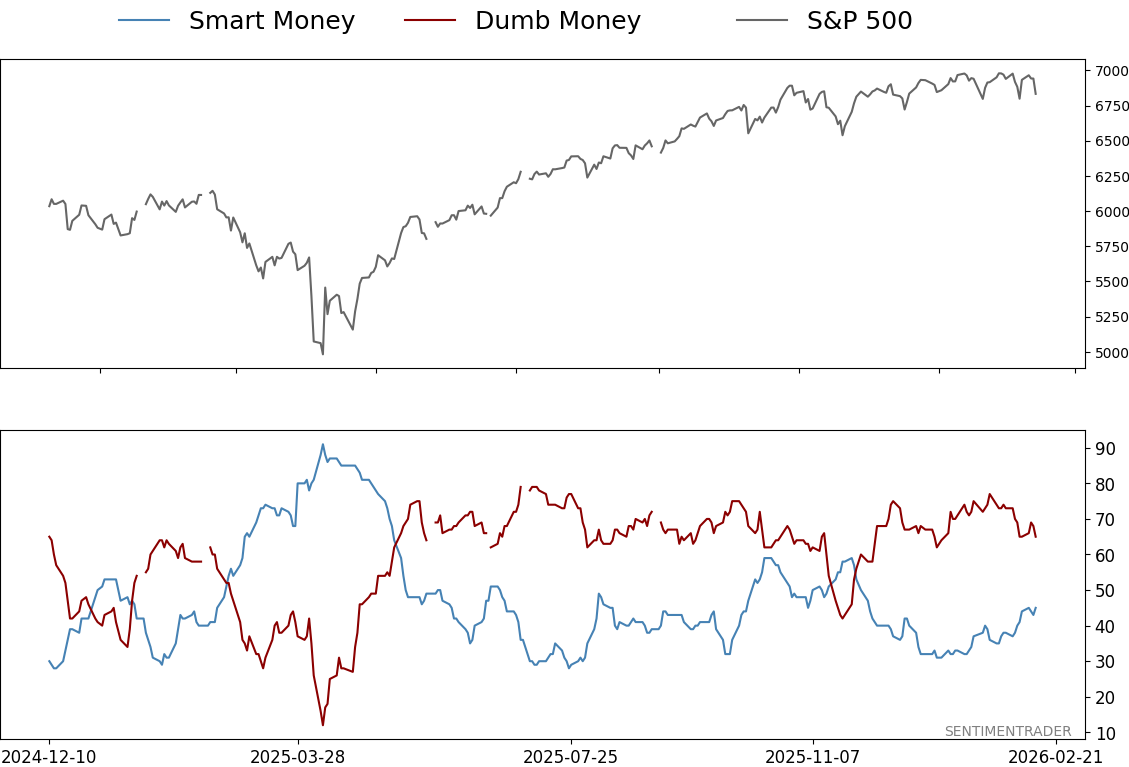
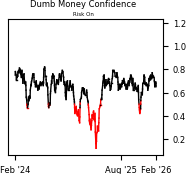
Smart / Dumb Money Confidence
|
|
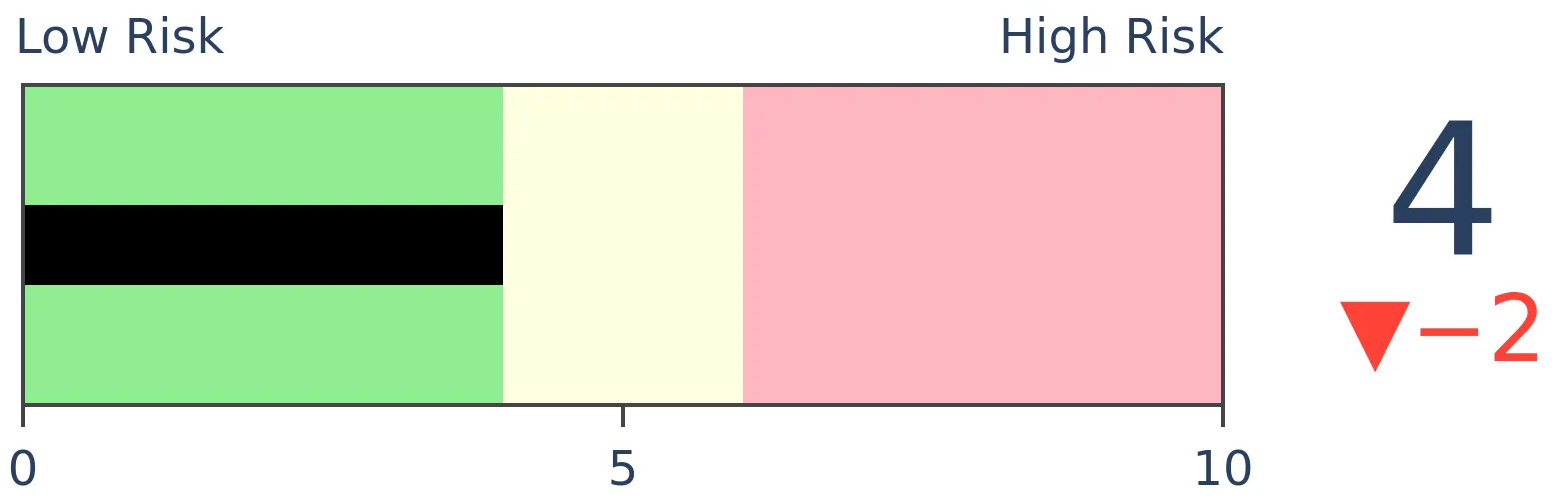
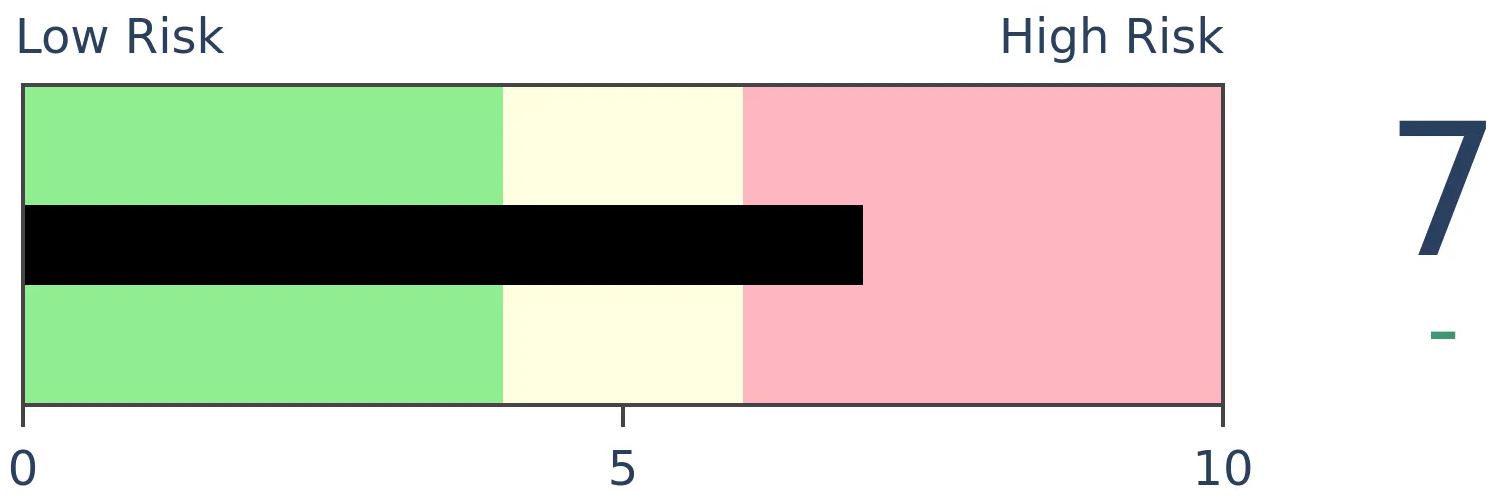
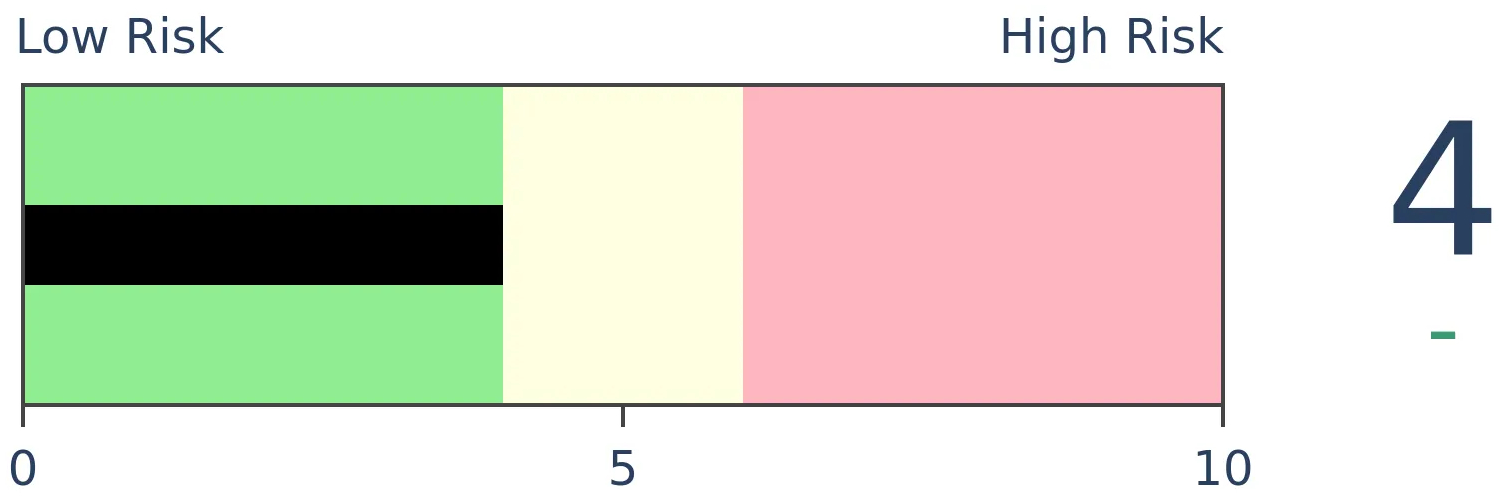
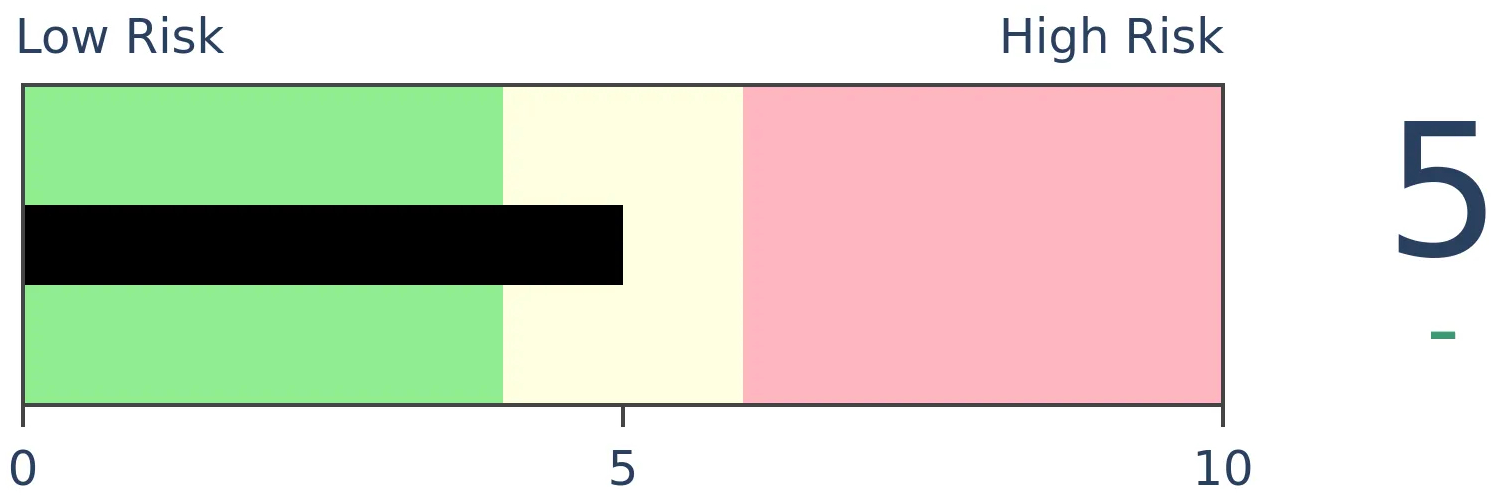
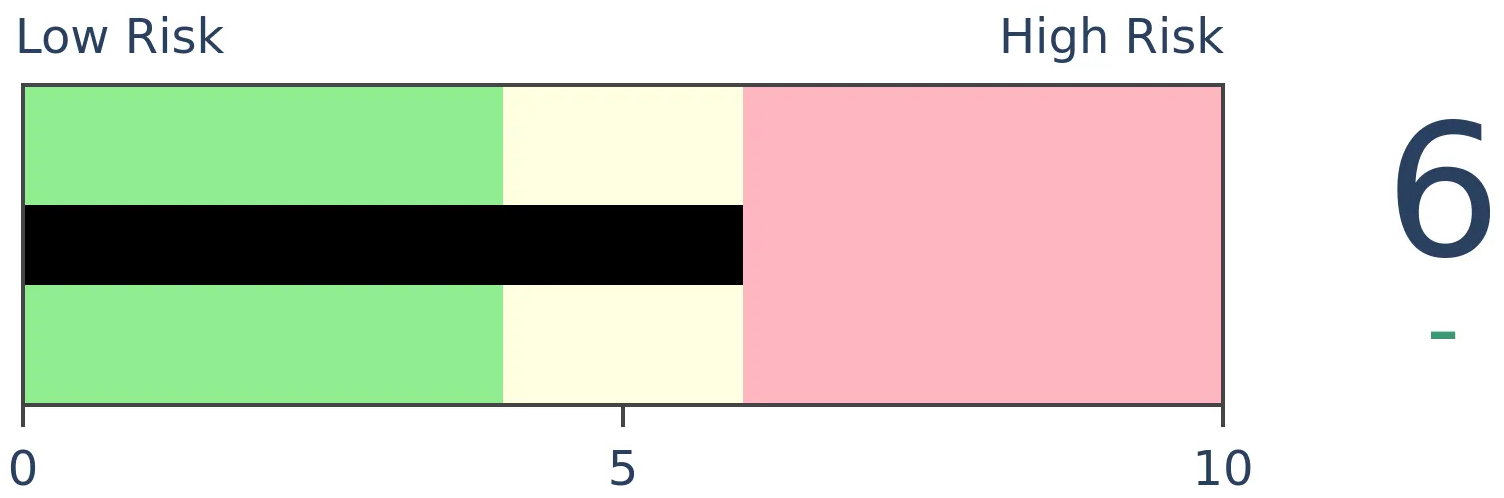
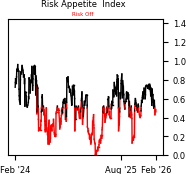
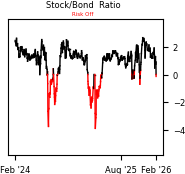
Risk Levels
|
|
|

Research
Market Momentum in the Energy SectorBy by SentimentraderBOTTOM LINEThe Energy Sector (XLE) shows strong upward momentum with XLE 22% above its 200-day MA and Optix 10-day MA breaking 80, while short-term overheating and long-term strength present a balanced outlook for investors. FORECAST / TIMEFRAME |
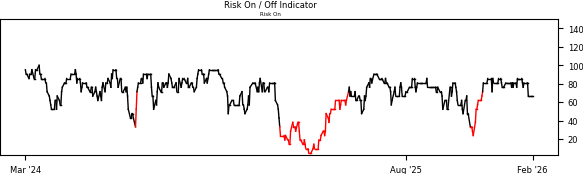
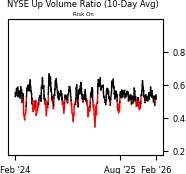
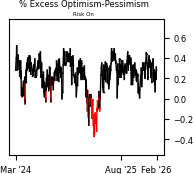
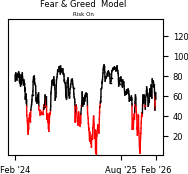
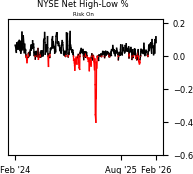
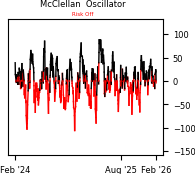
Sentiment Risk On / Risk Off Overview
| ||
|
|
|
|
|
|
|
|
|
|
|
|
Indicators at Extremes
|
|
|
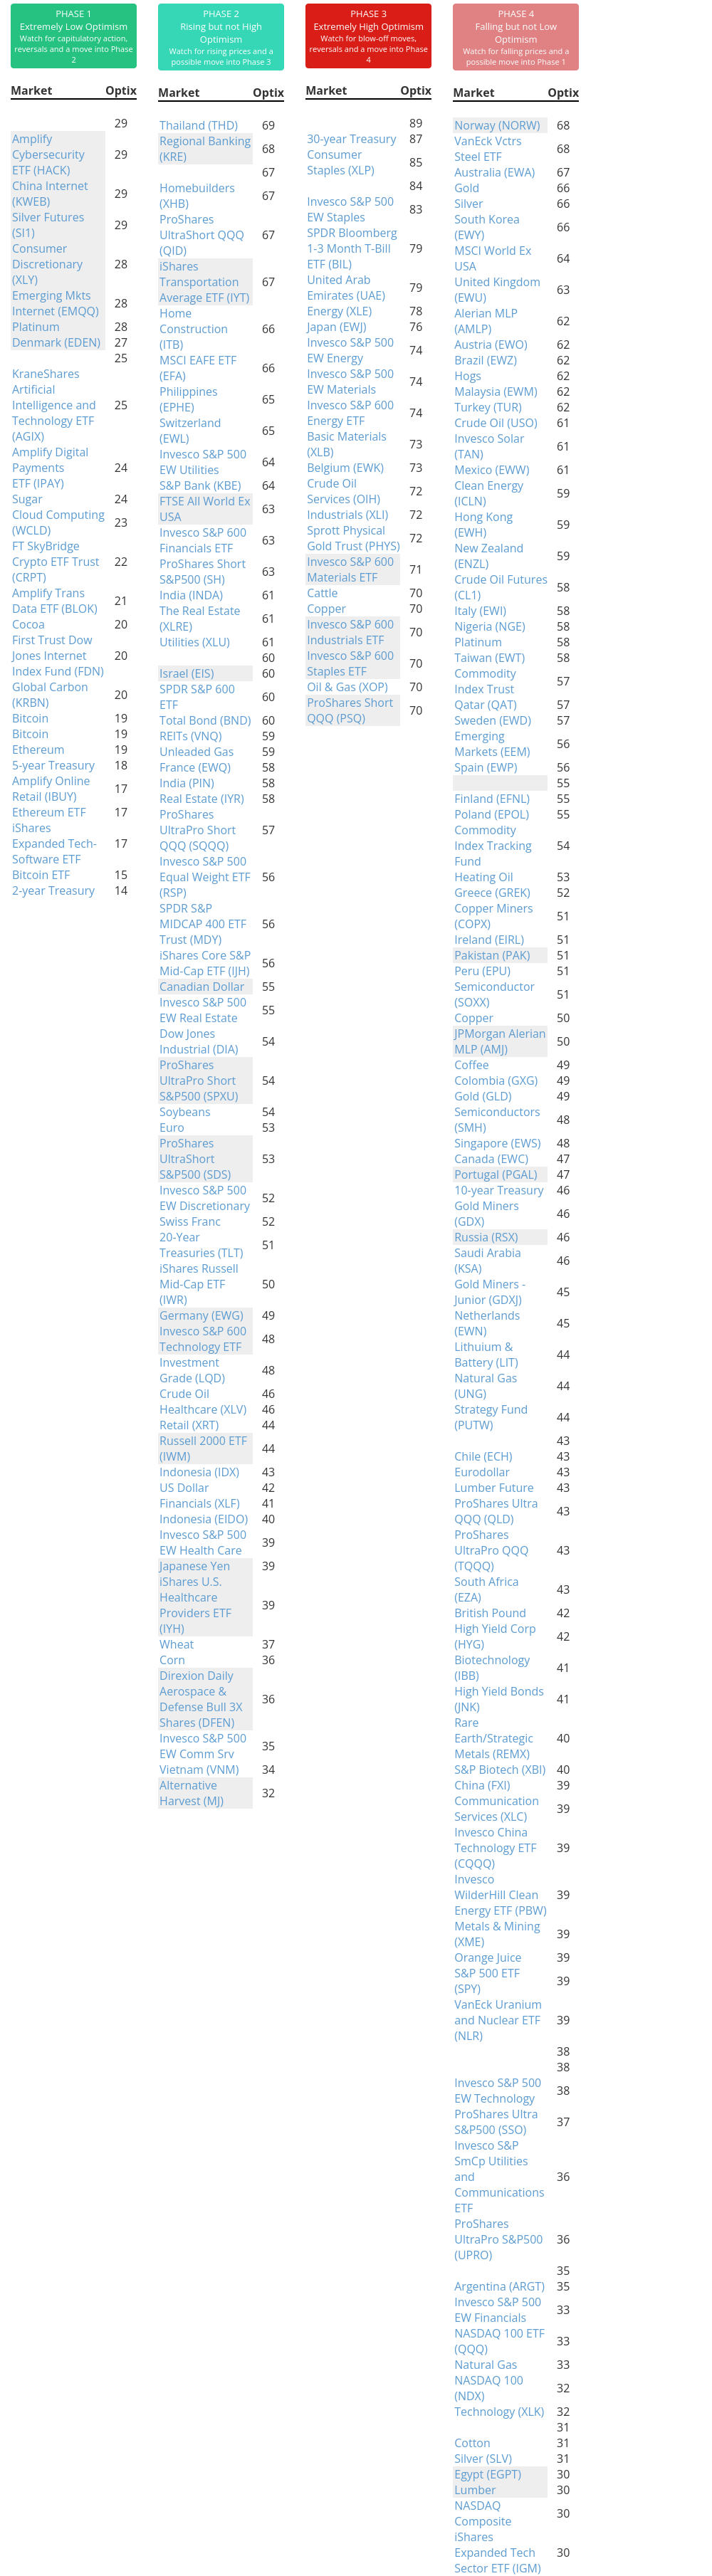
Phase Table
|
|
|
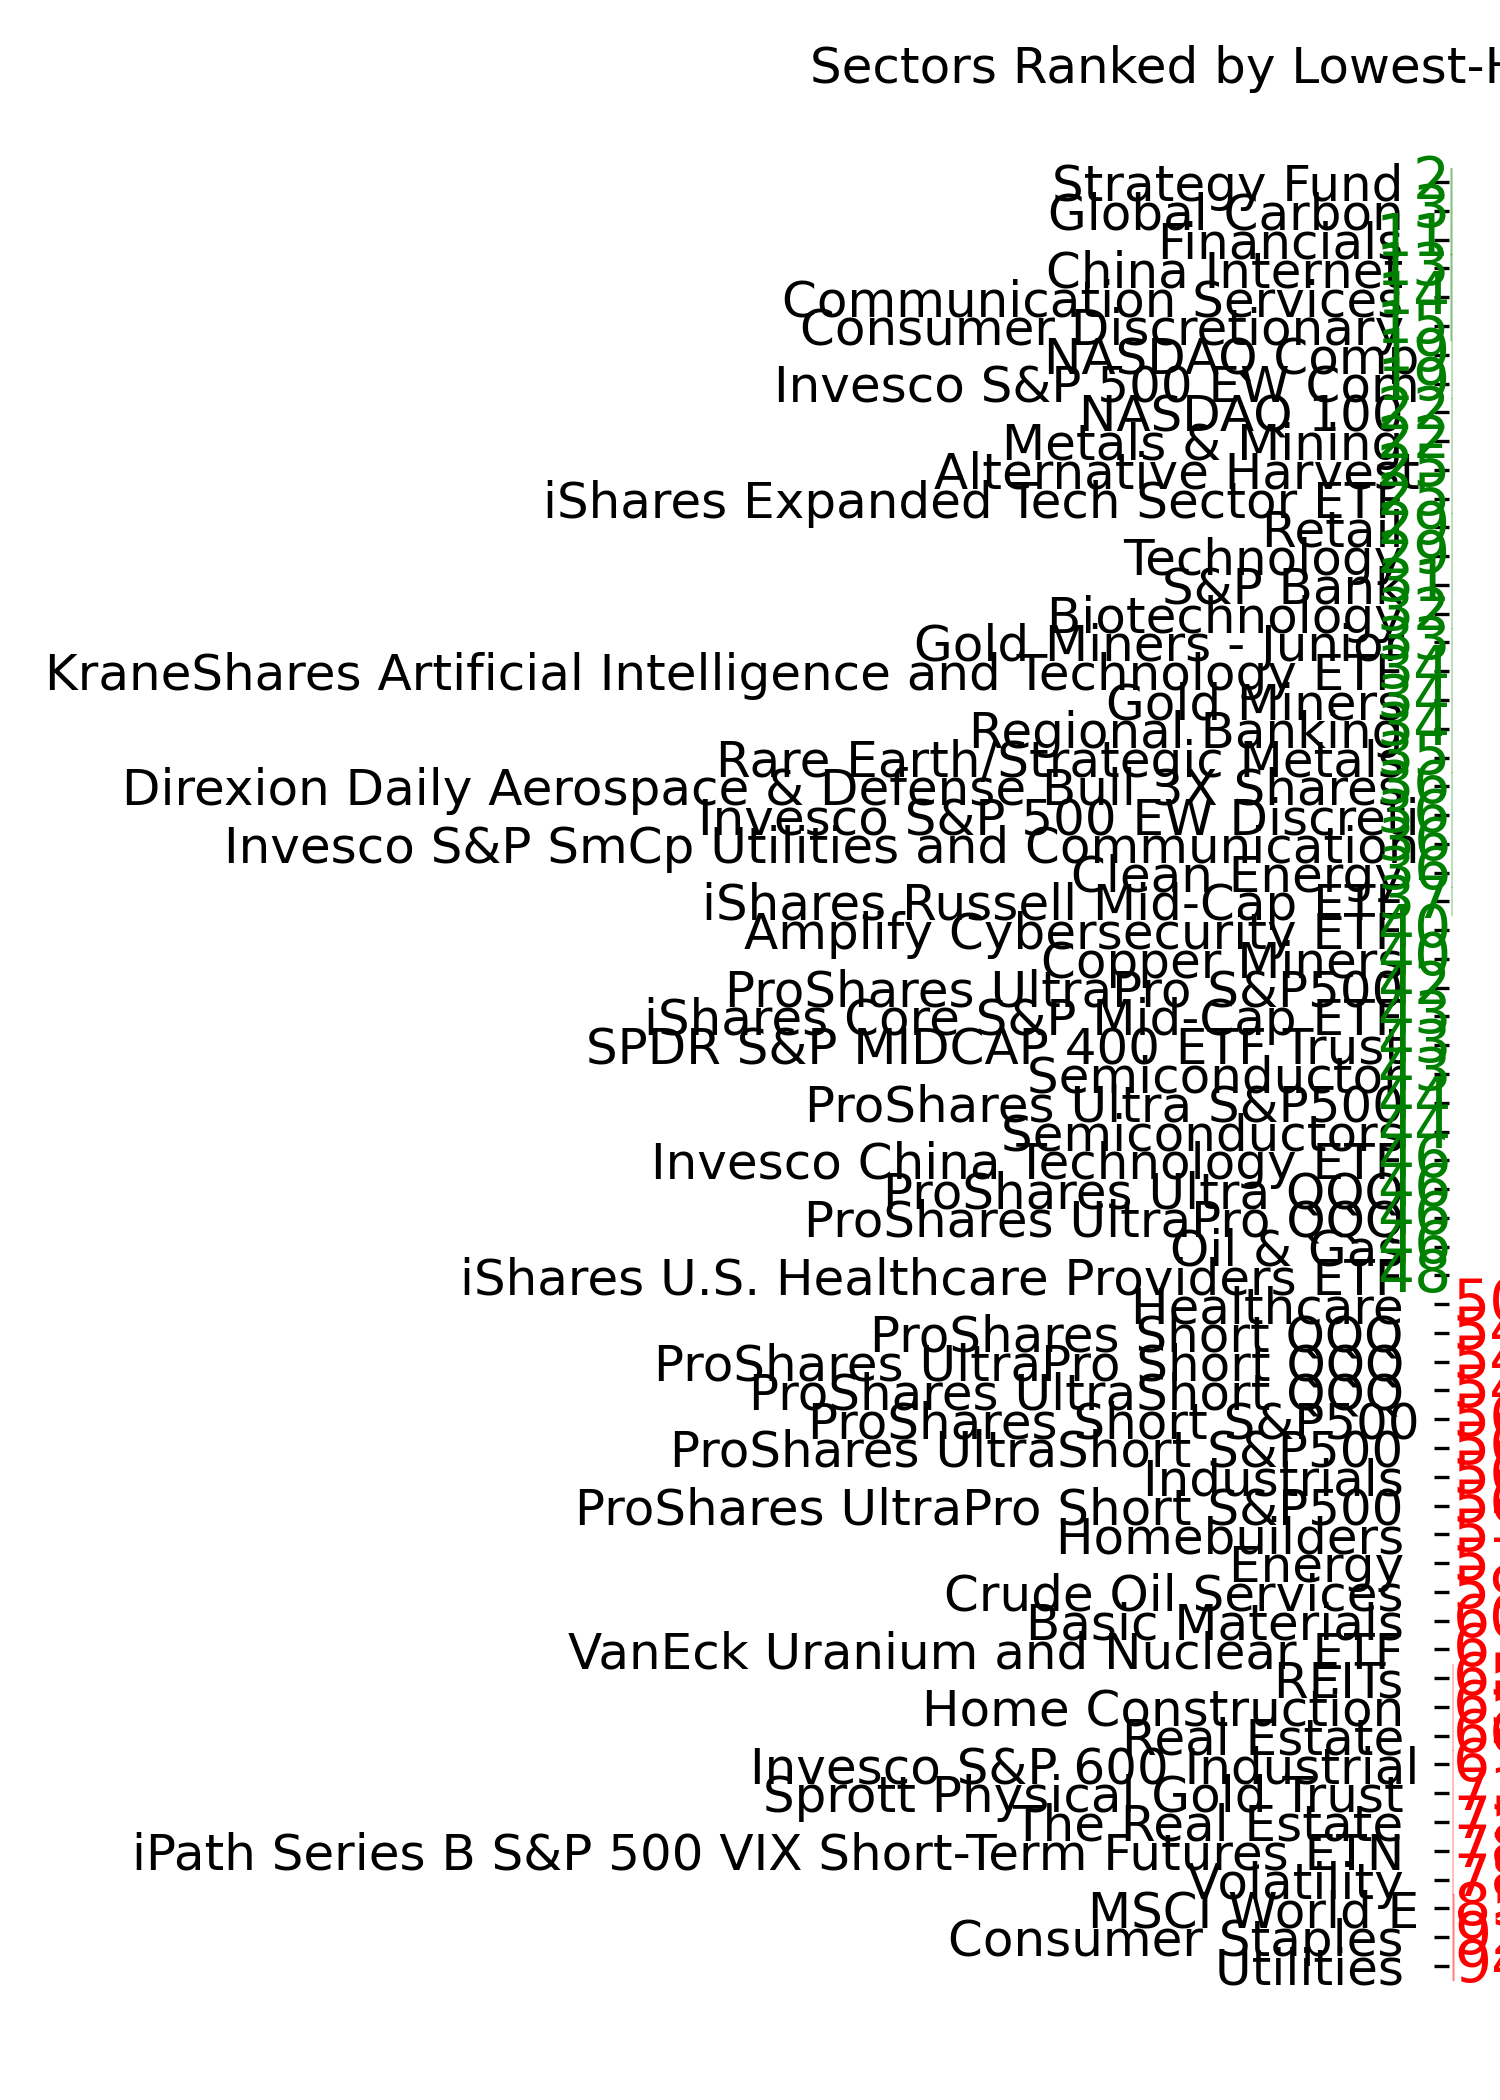
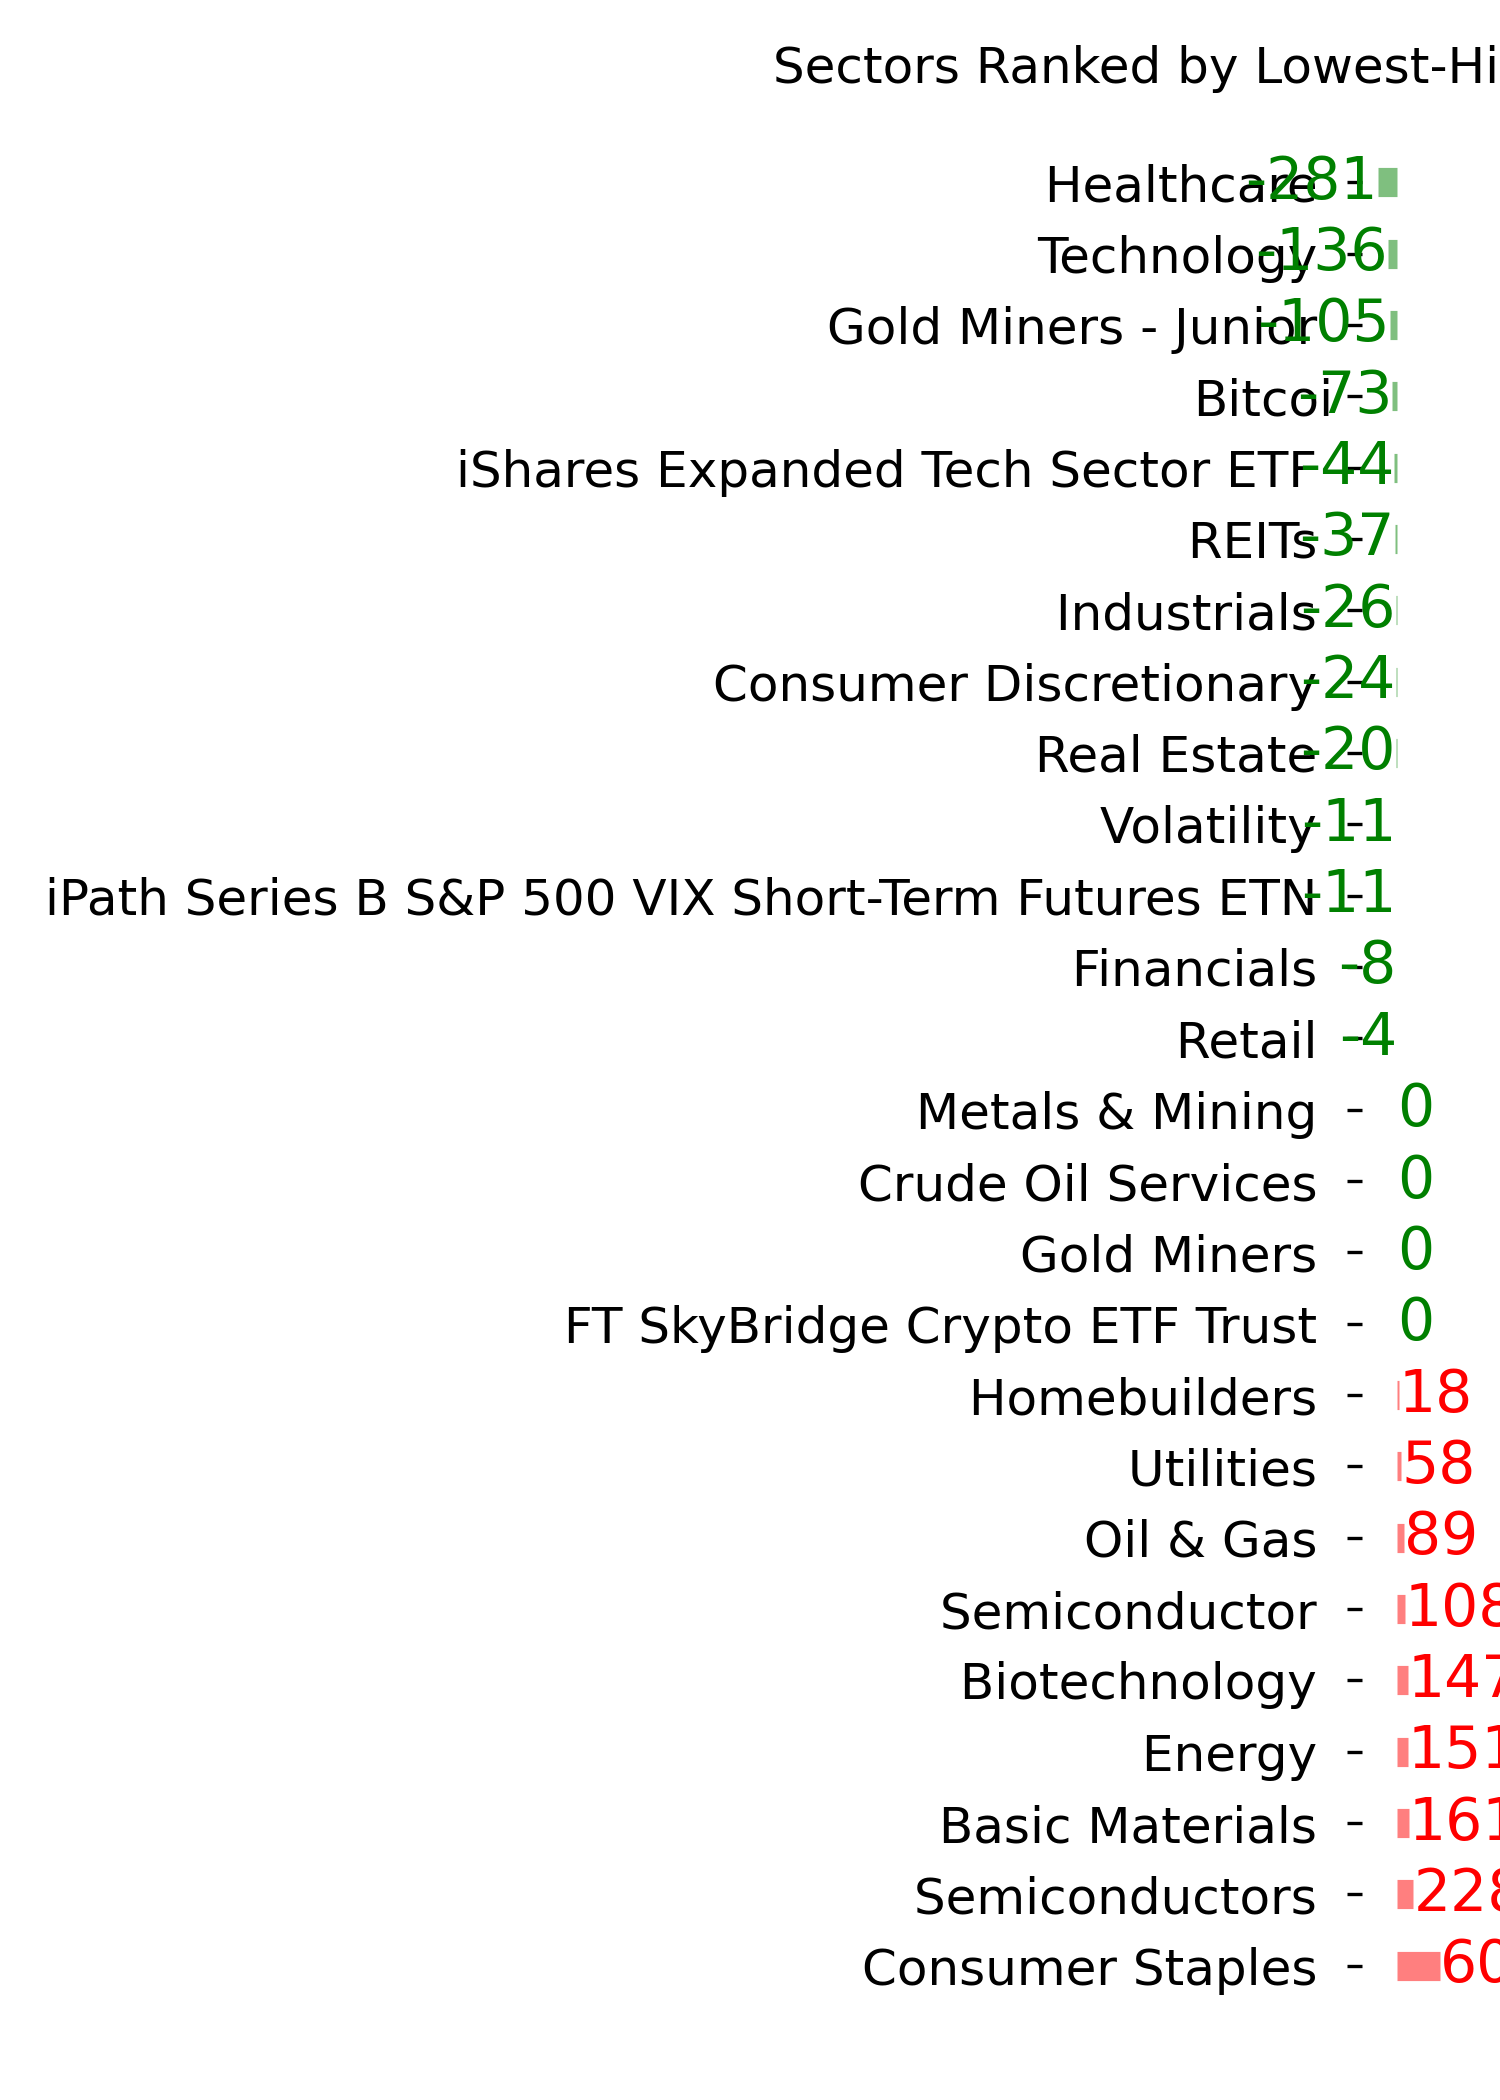
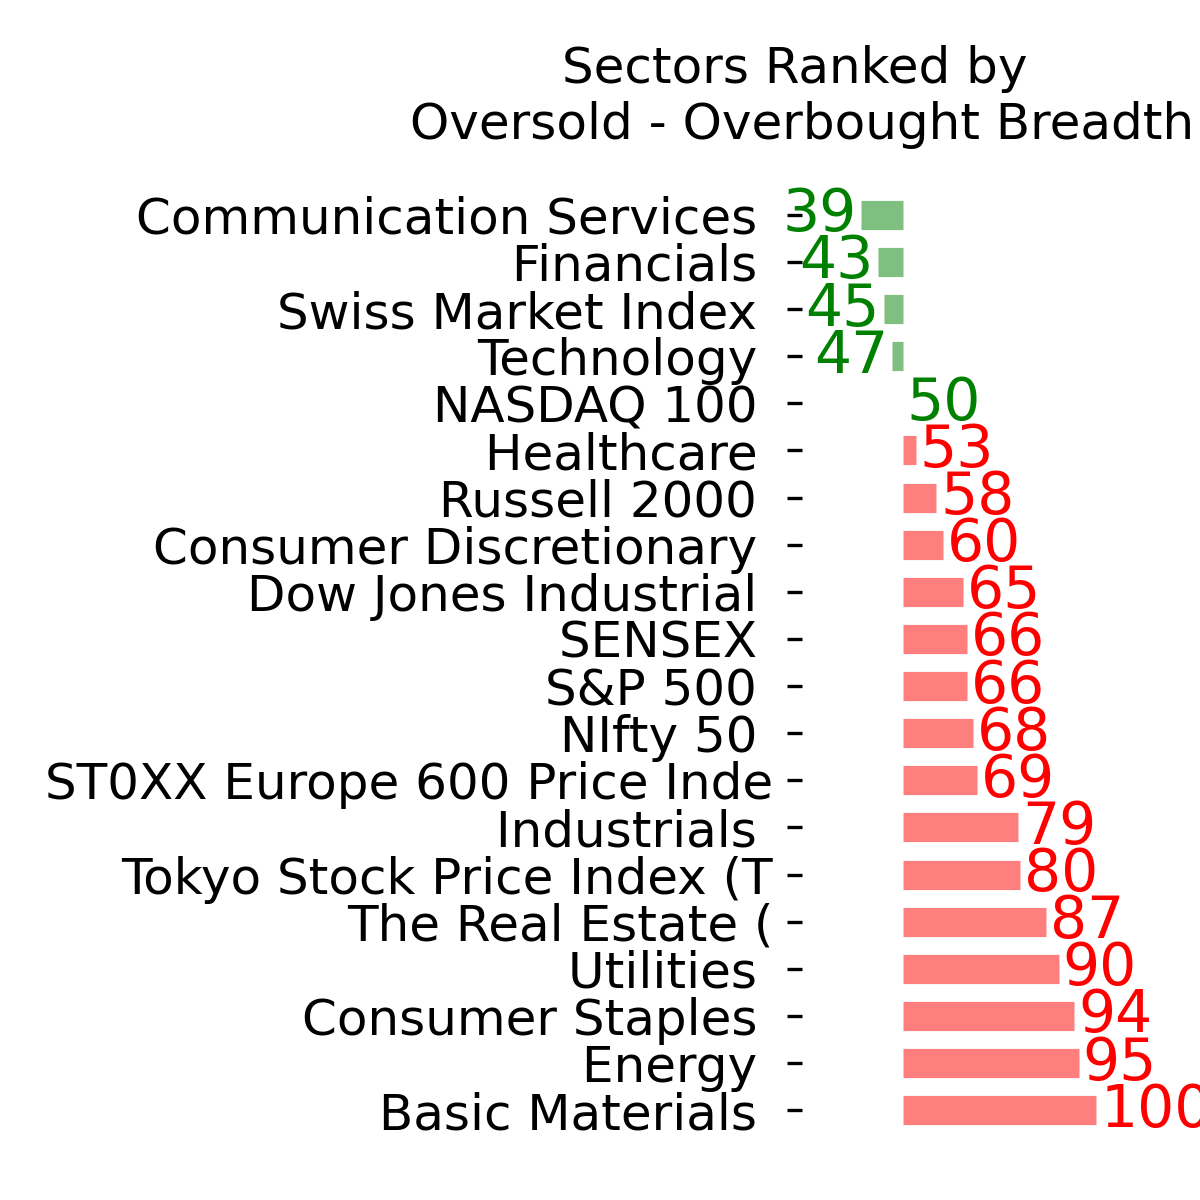
Ranks
|
|
|
|
|
|
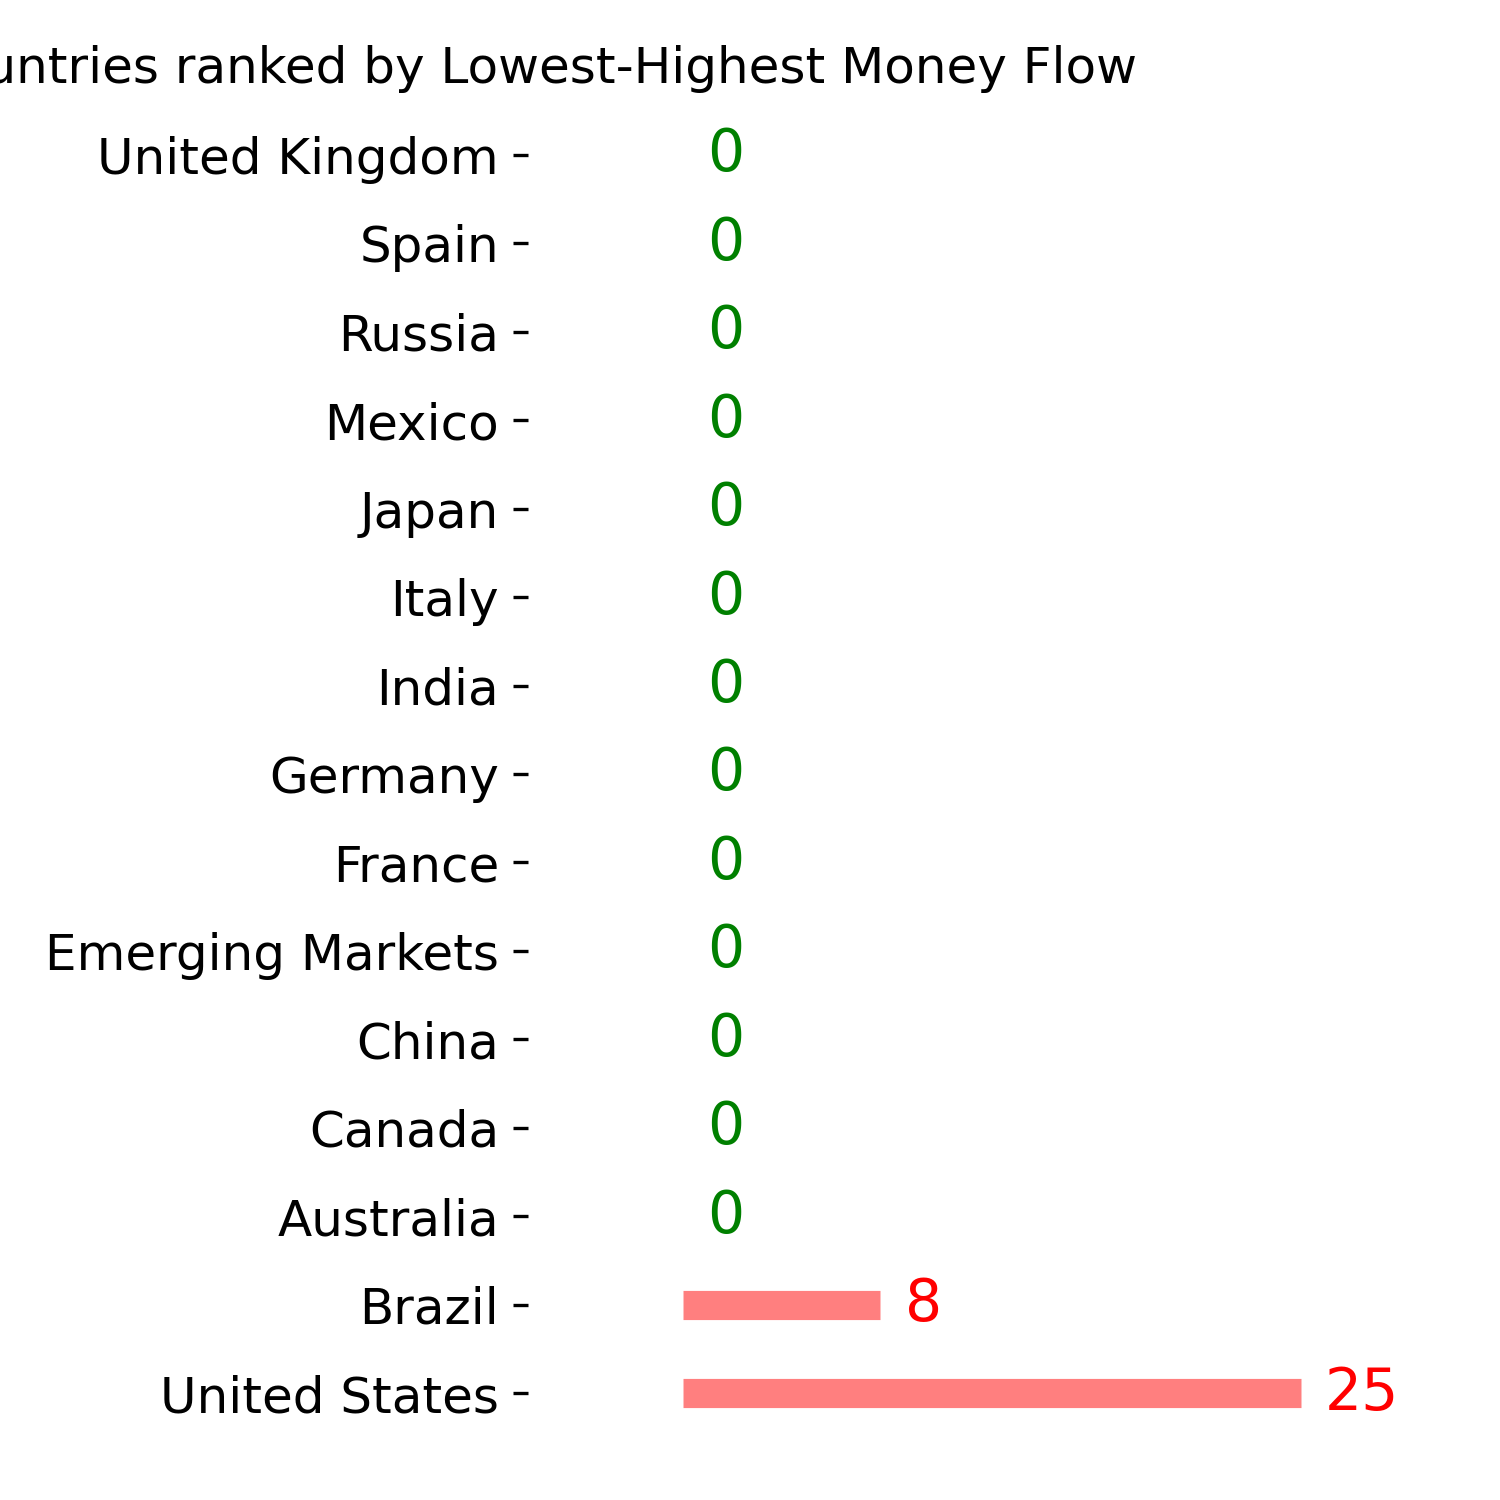
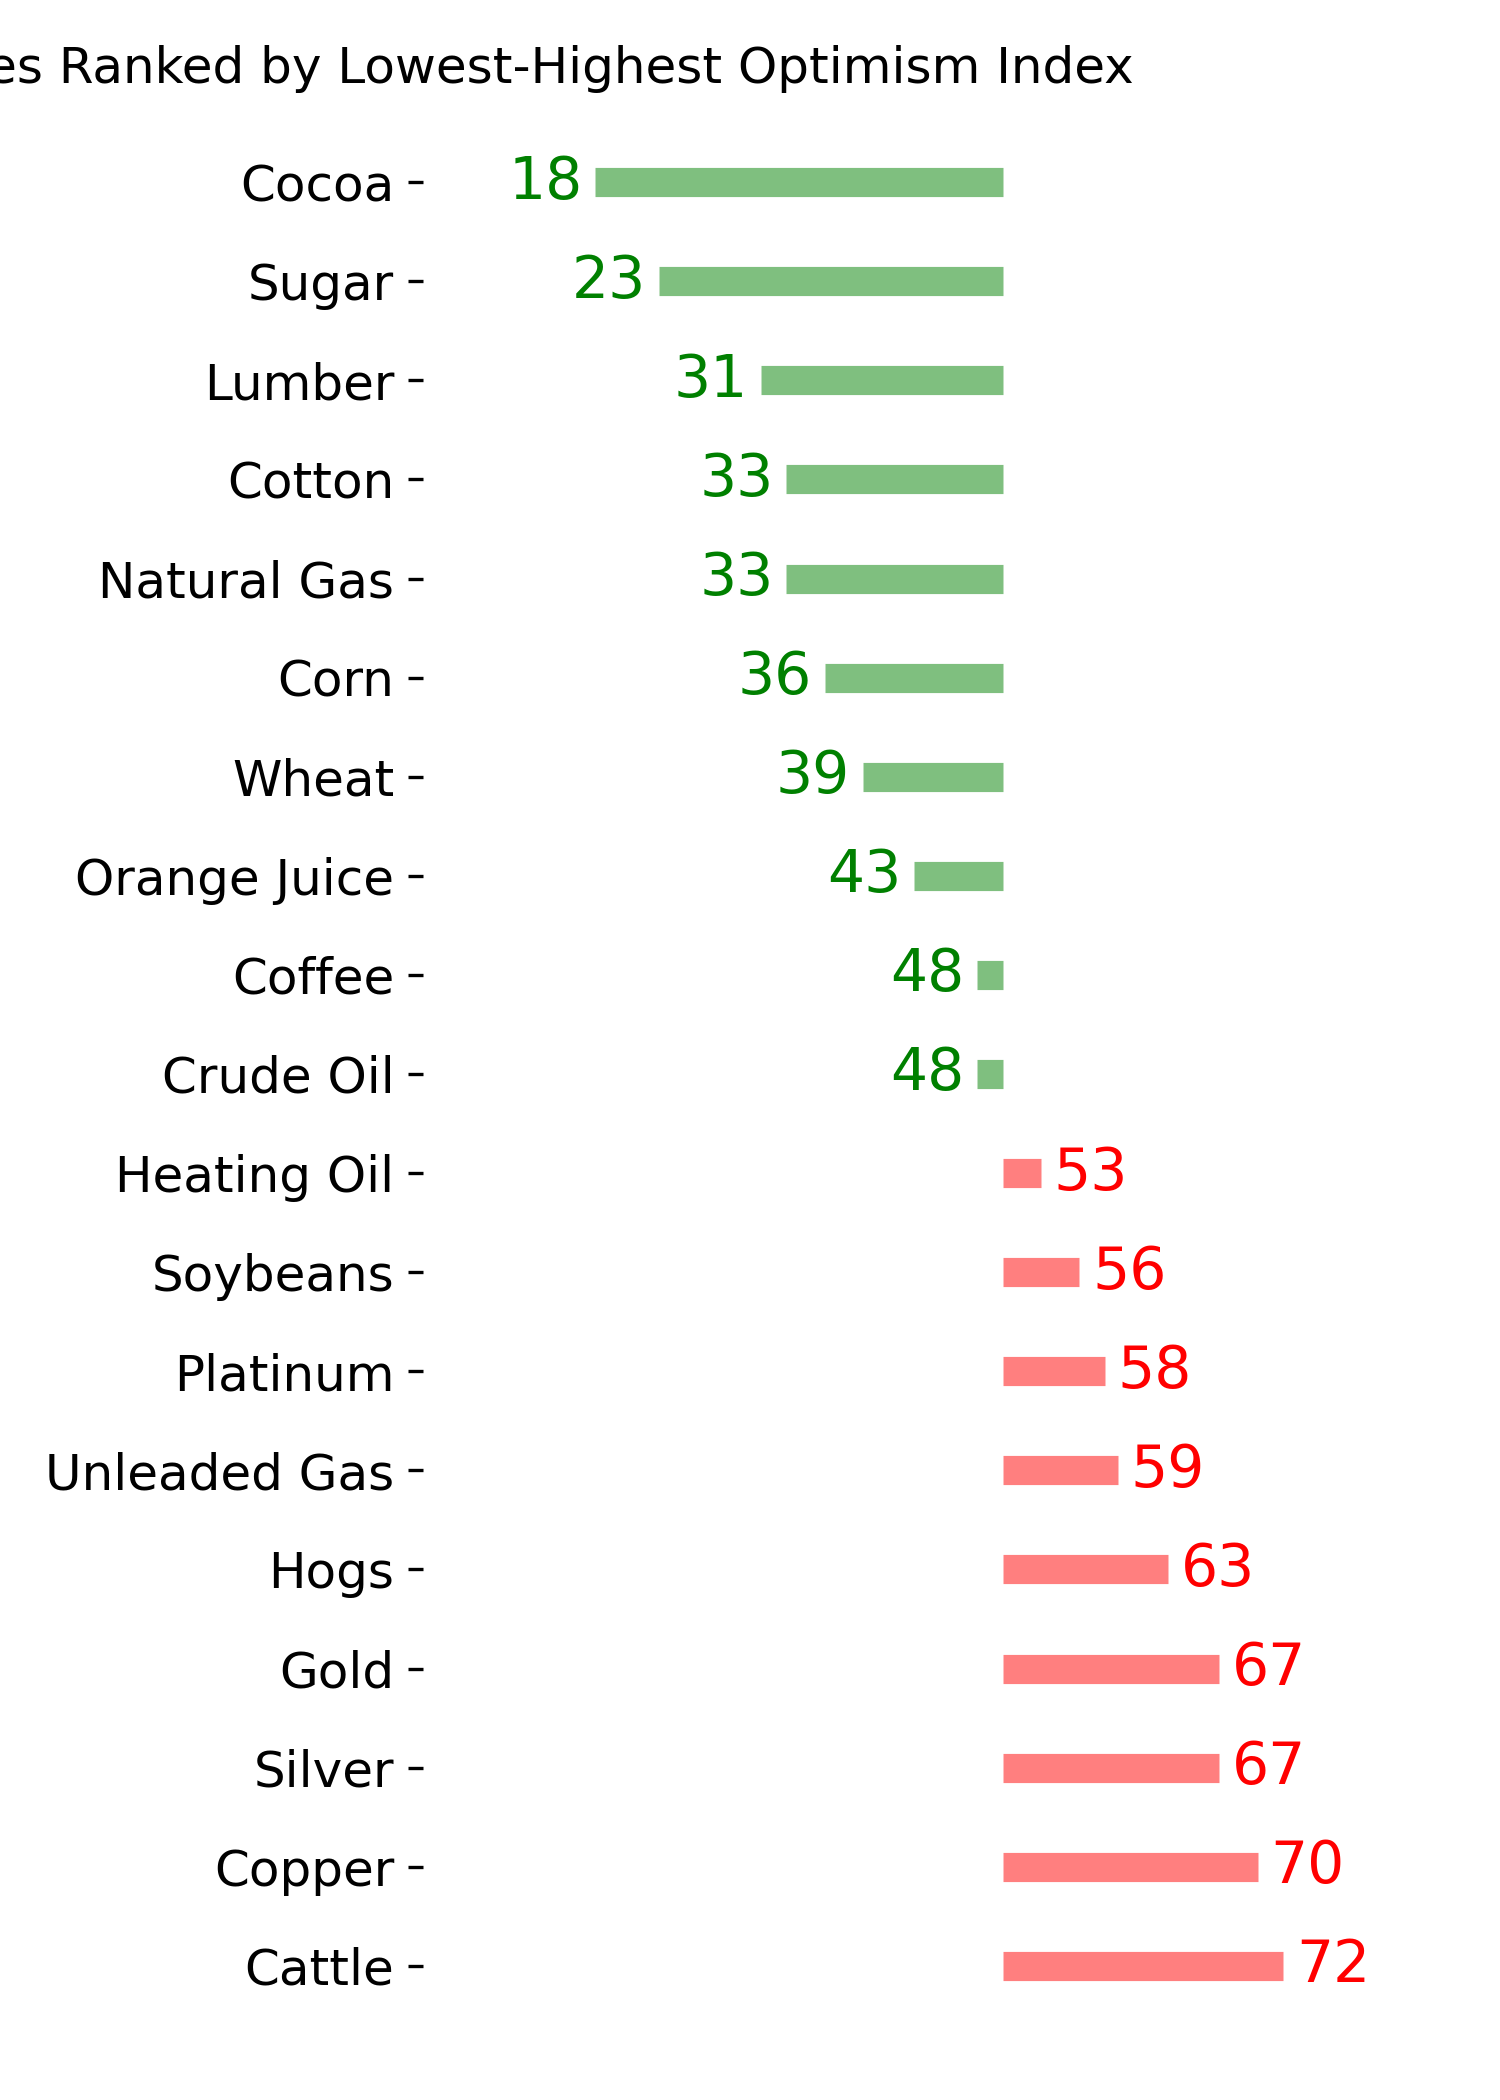
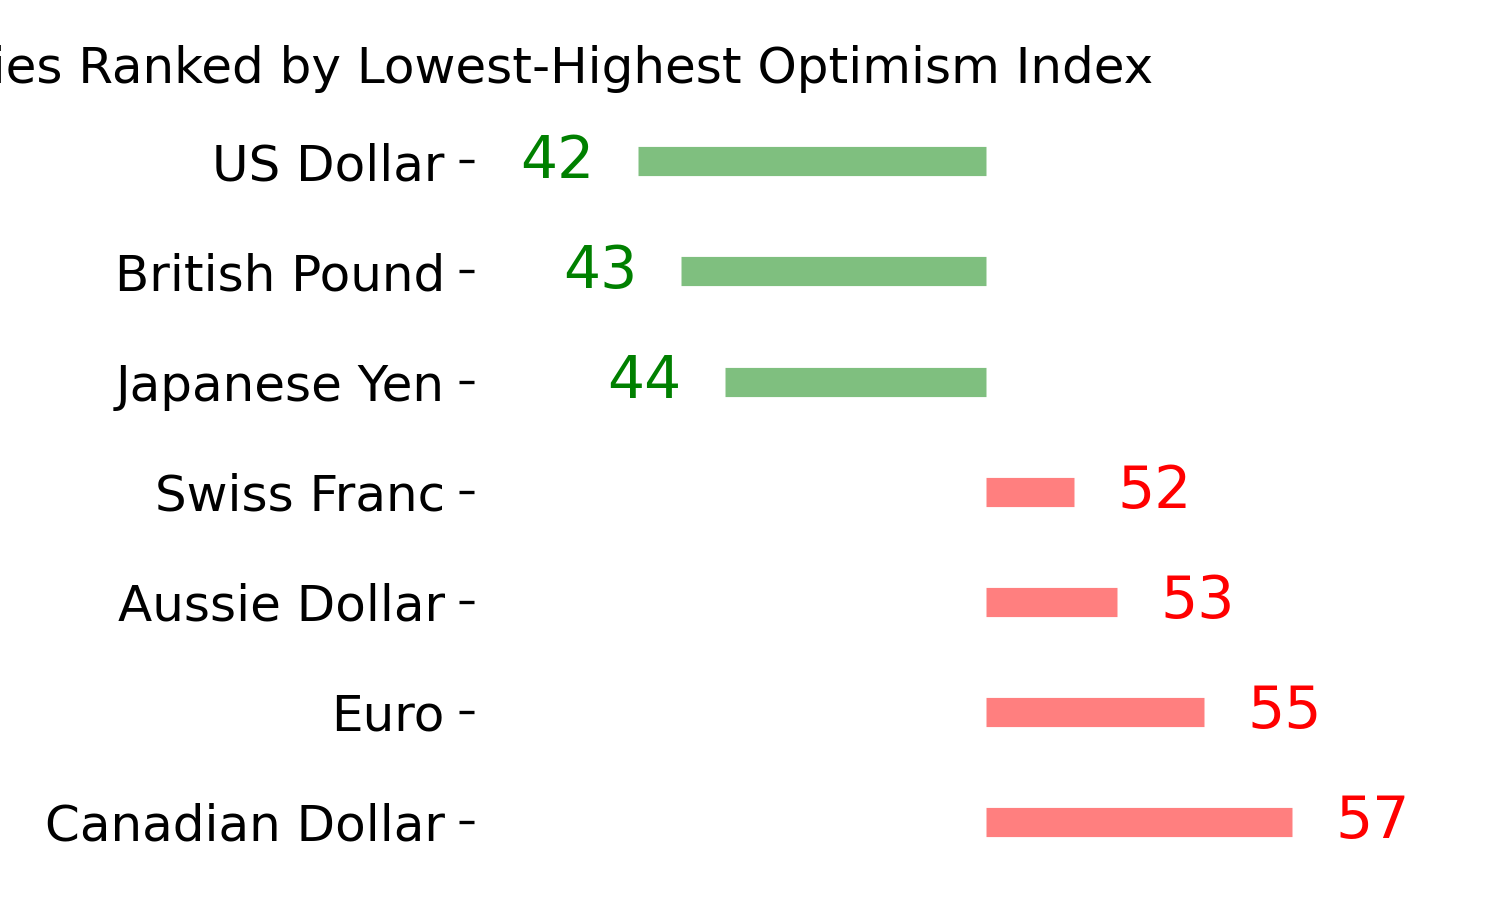
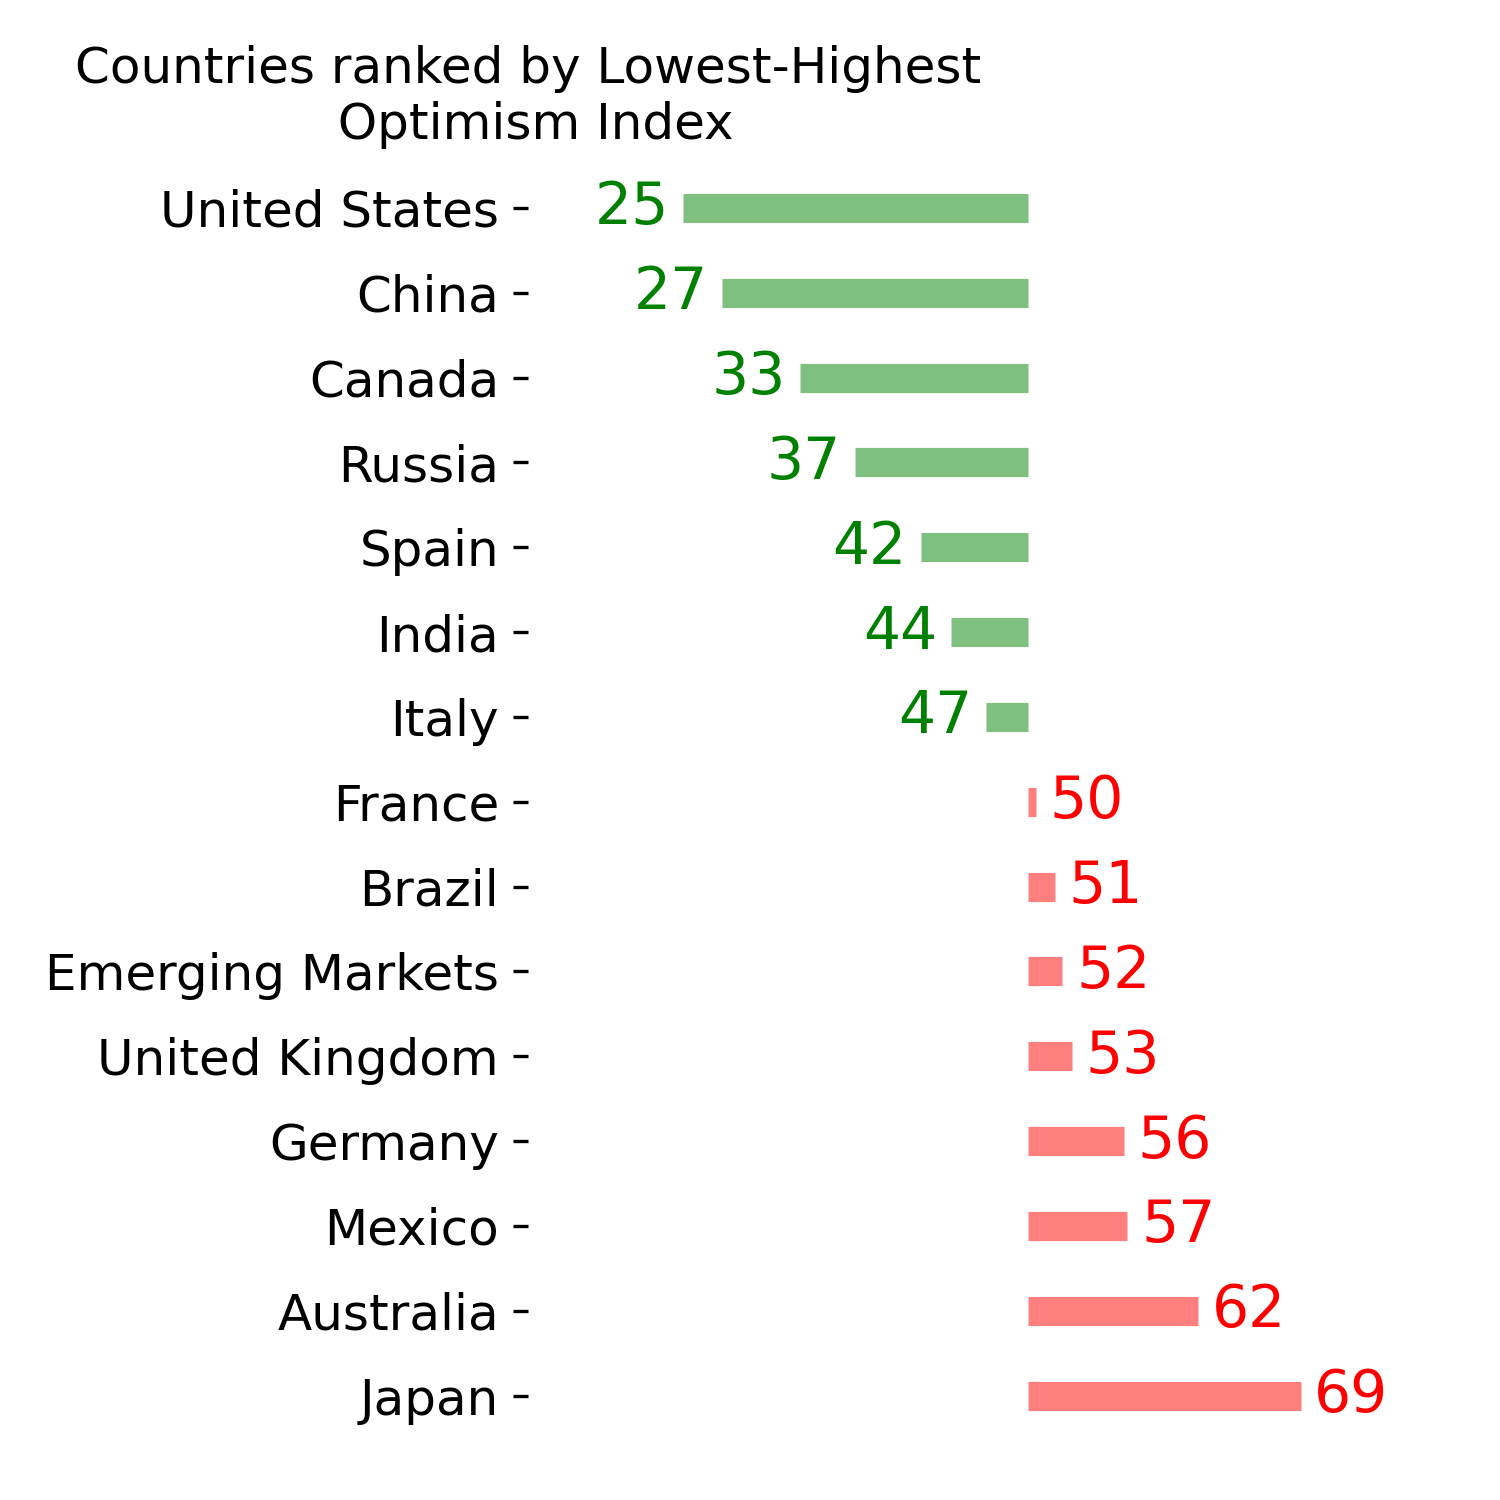
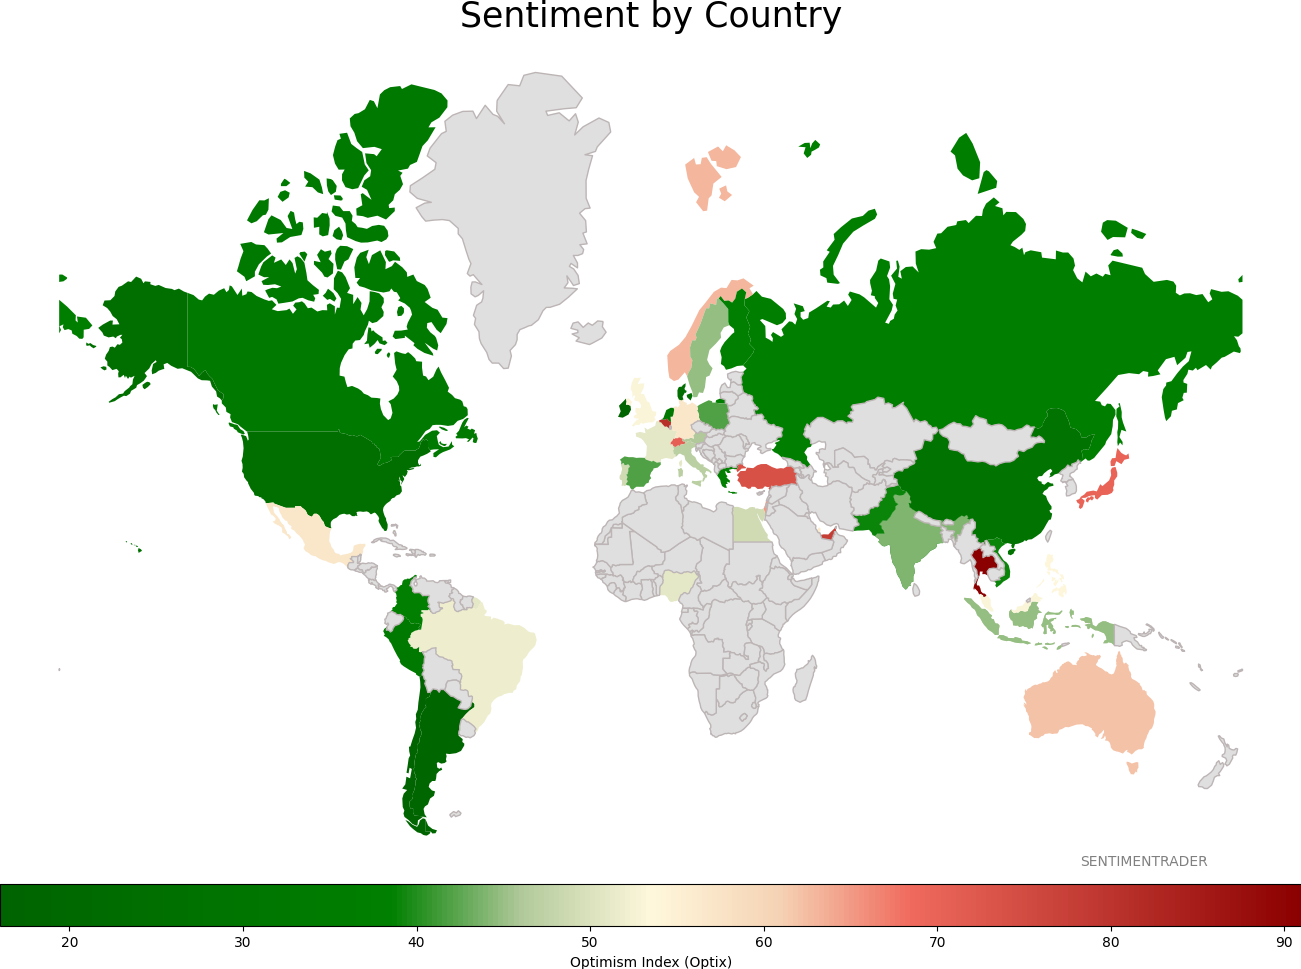
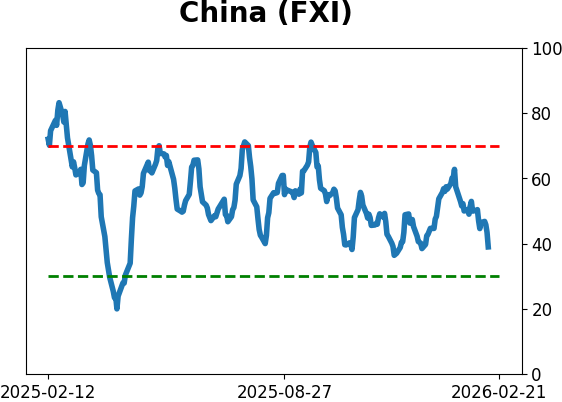
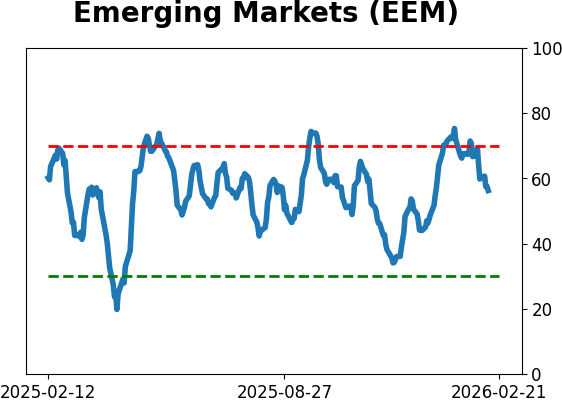
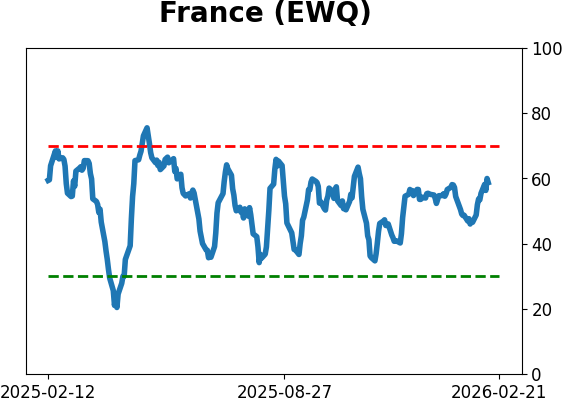
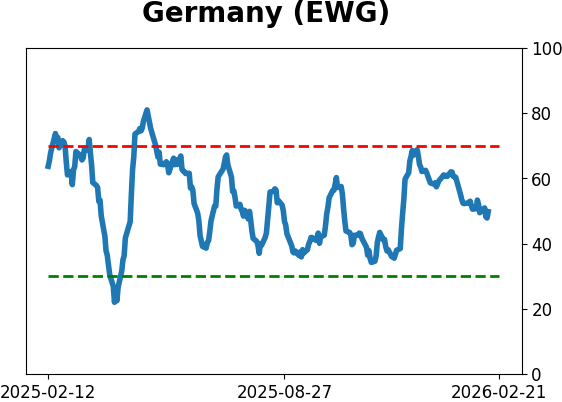
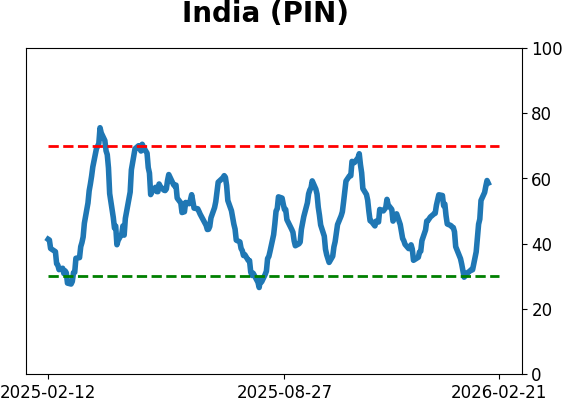
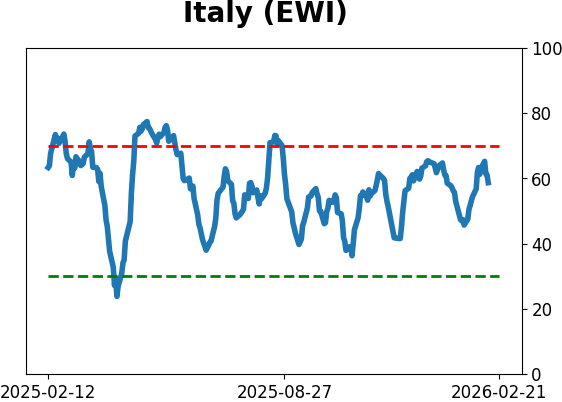
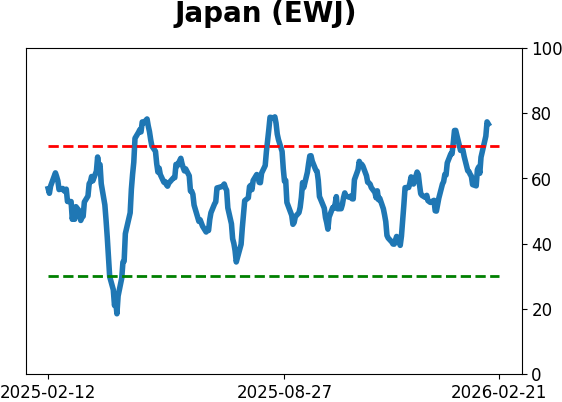
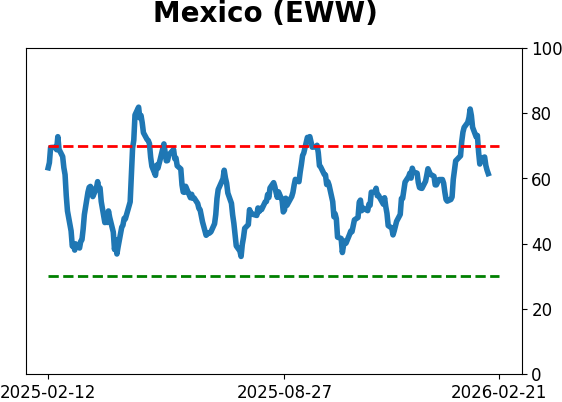
Sentiment Around The World
|
|
|
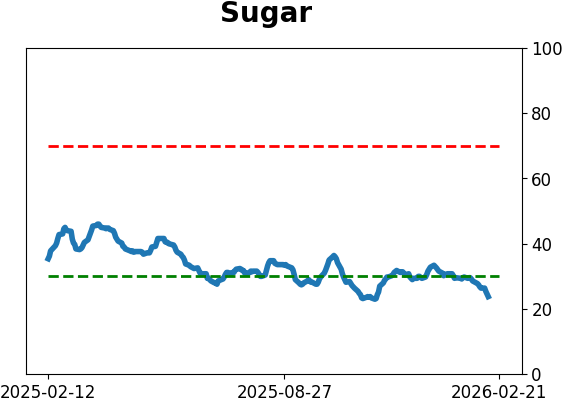
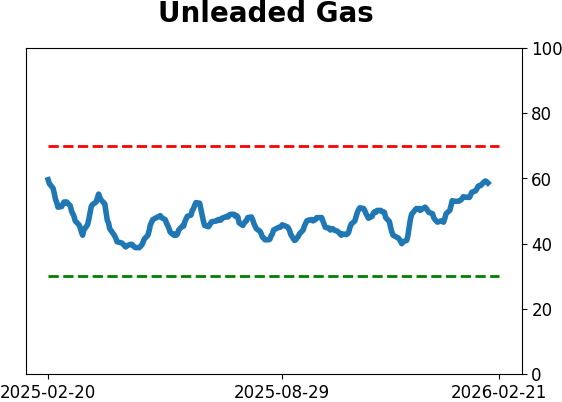
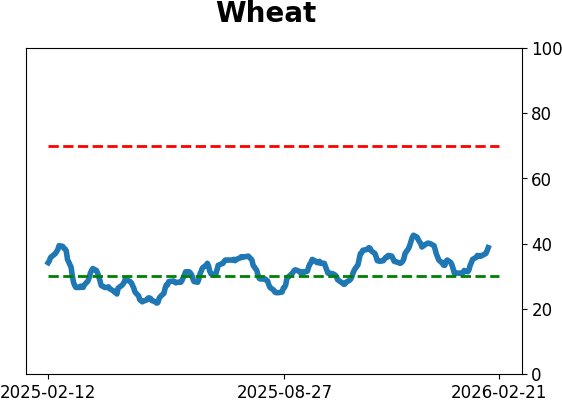
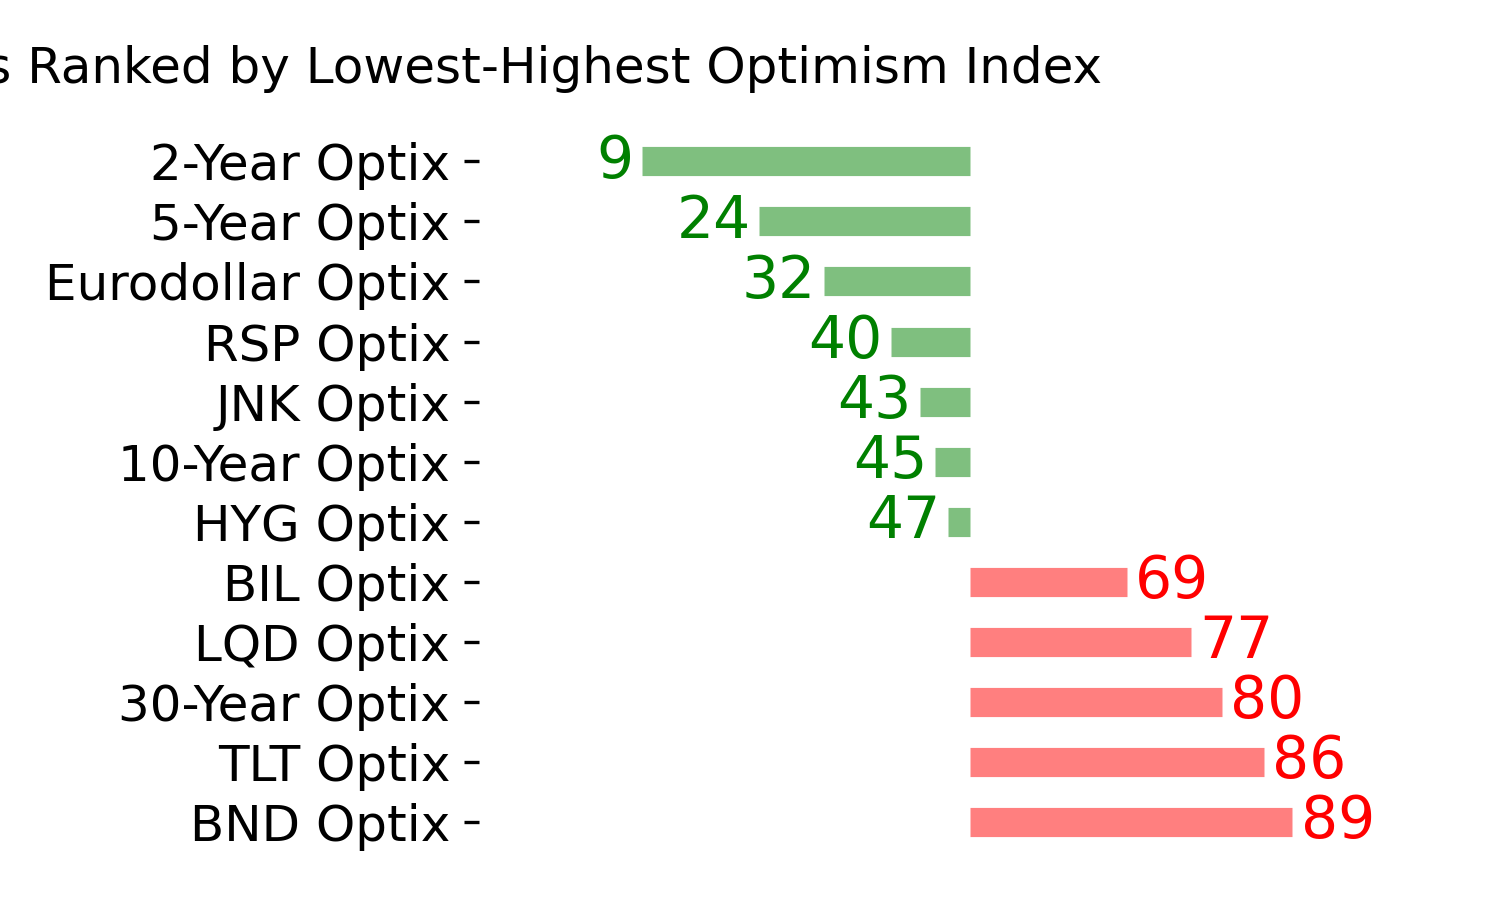
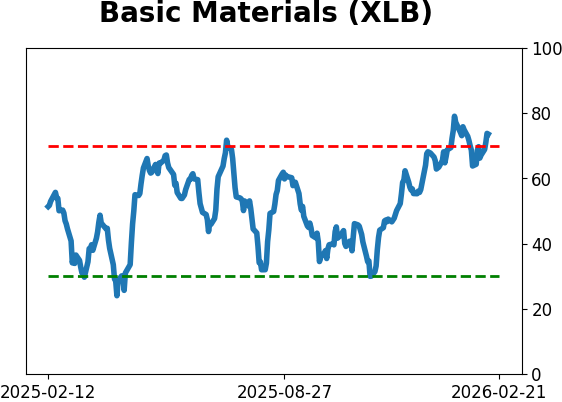
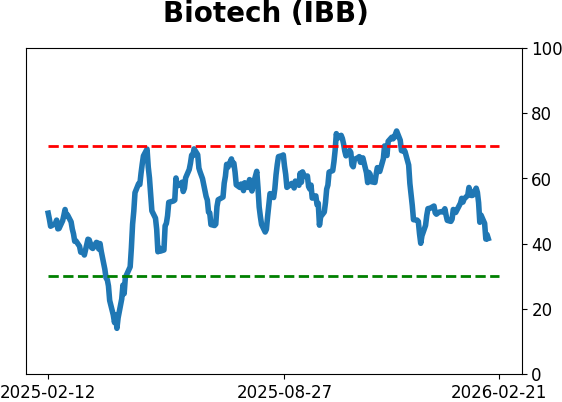
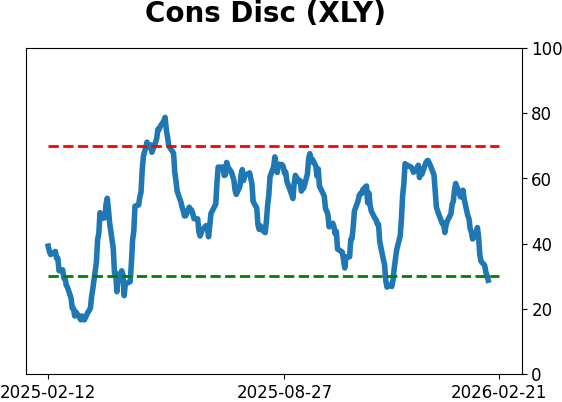
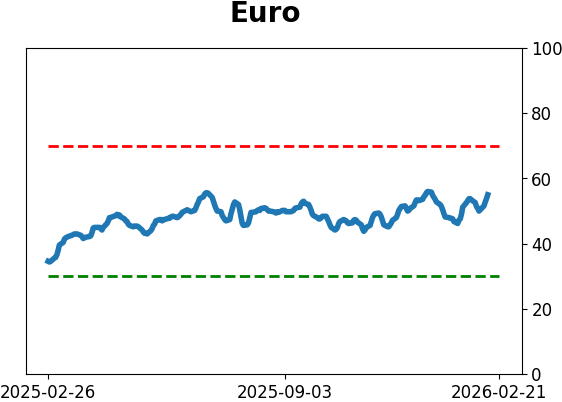
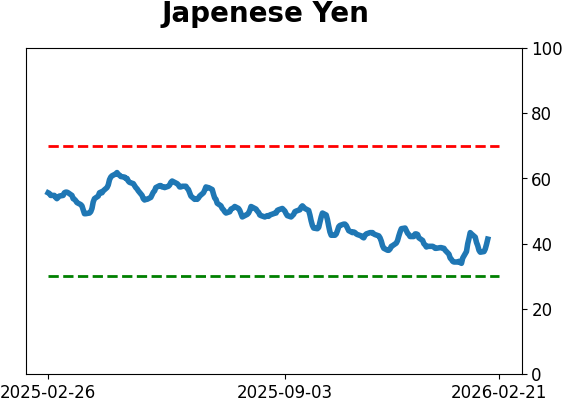
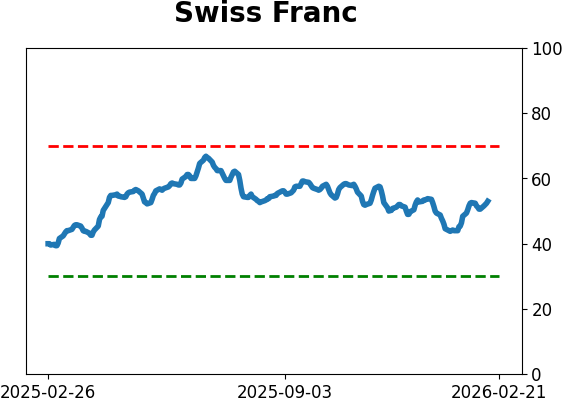
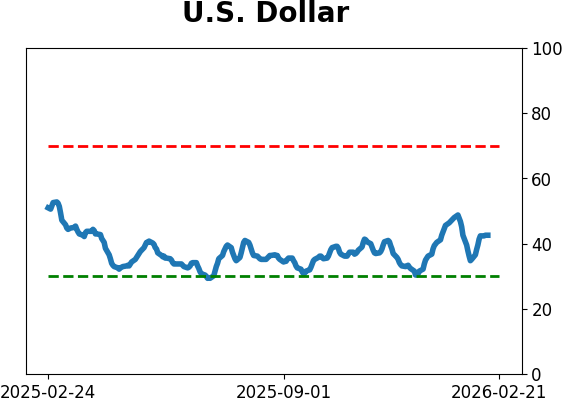
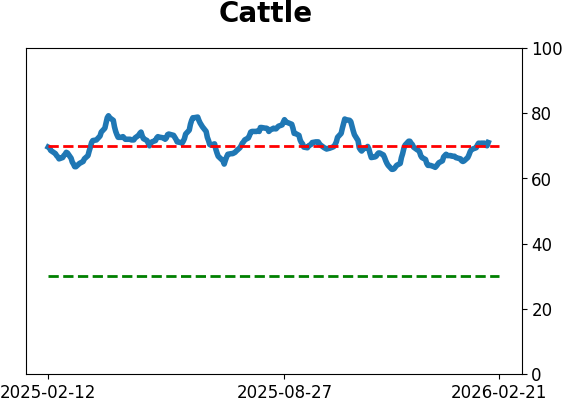
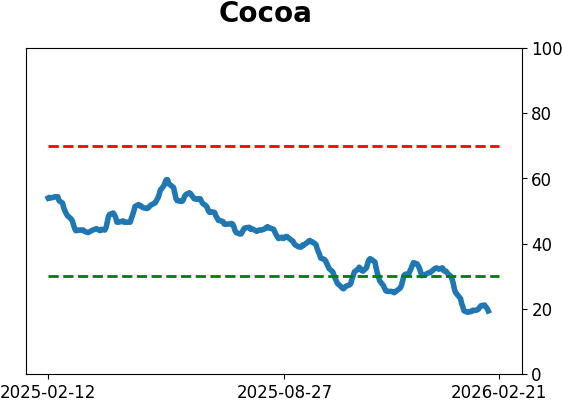
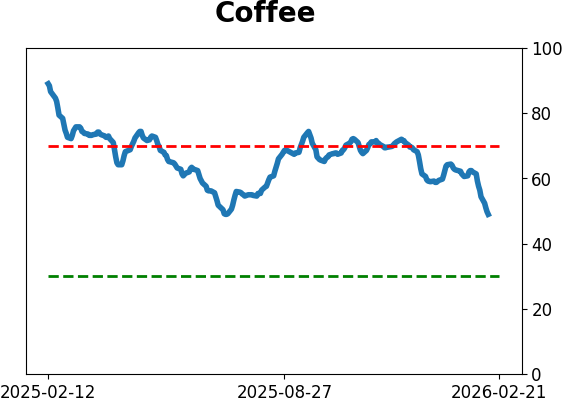
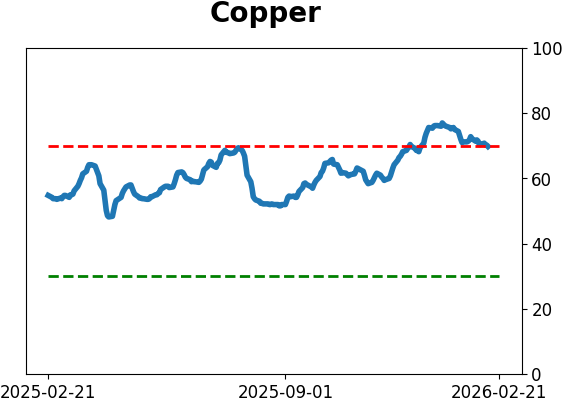
Optimism Index Thumbnails
|
|
|
|
|
|
|
|
|

|
|
|
|
|
|
|
|
|
|

|
|