Headlines
|
|
Internal small cap momentum continues to wane:
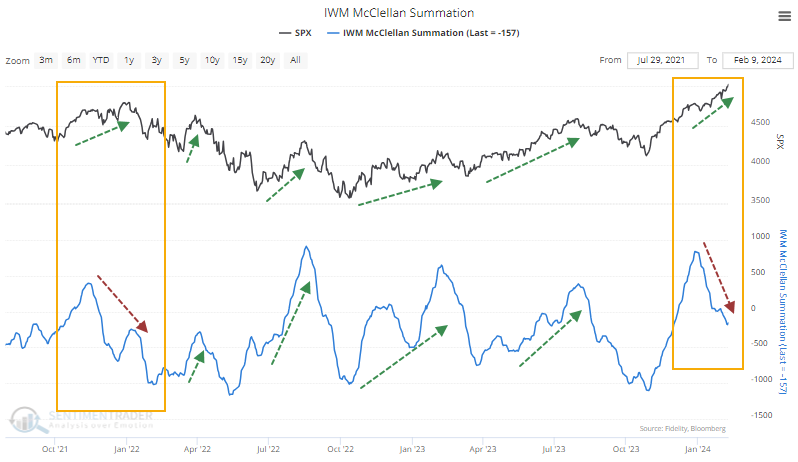
Internal momentum among small cap stocks has been poor. The McClellan Summation Index for the Russell 2000 is deeply negative even as the S&P 500 has been hitting record highs. This is a negative divergence last seen in 2021, and recent signals have been a warning for the broader market.
|
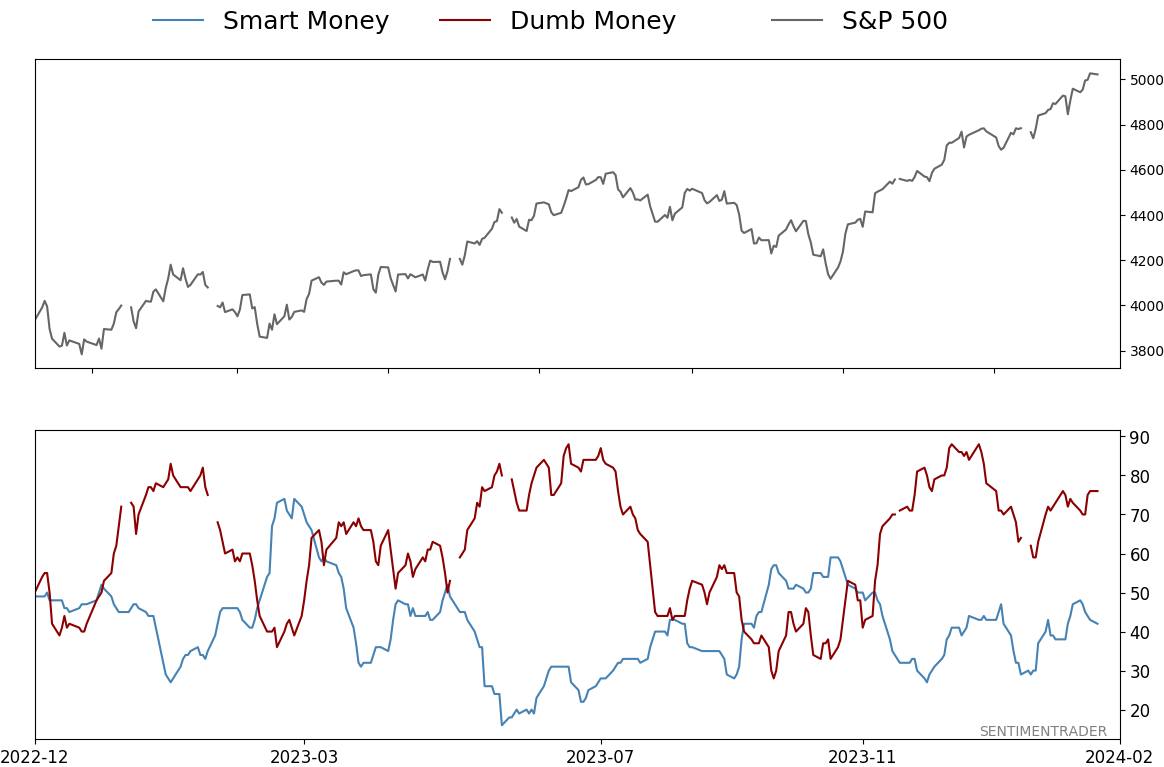
Smart / Dumb Money Confidence
|
Smart Money Confidence: 42%
Dumb Money Confidence: 76%
|
|
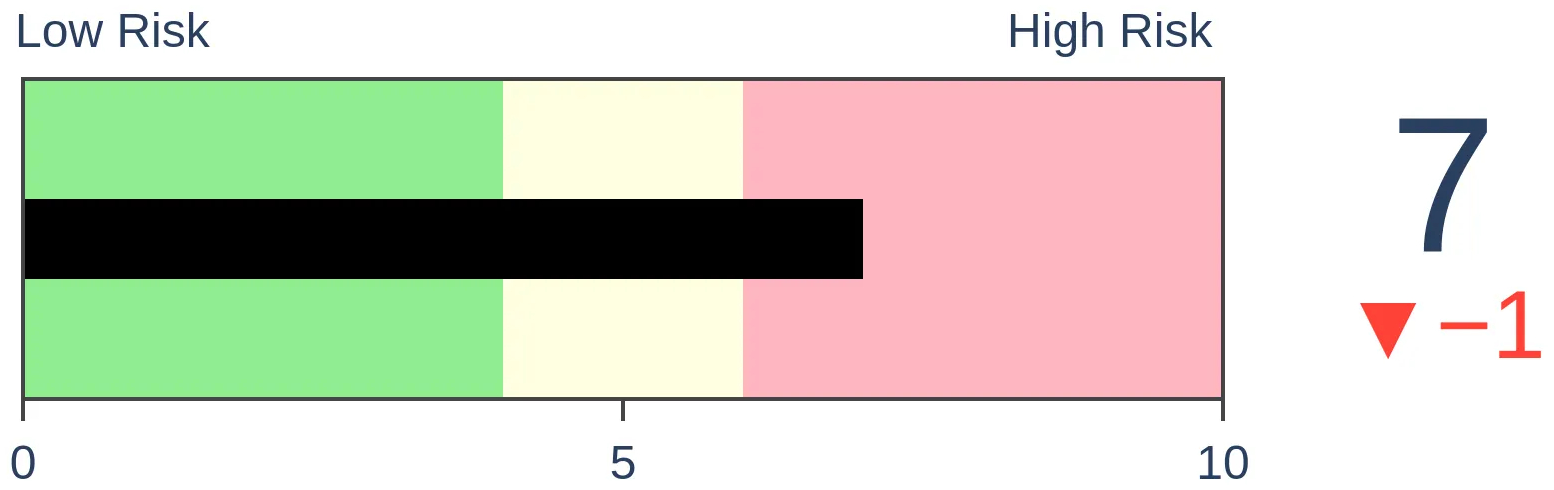
Risk Levels
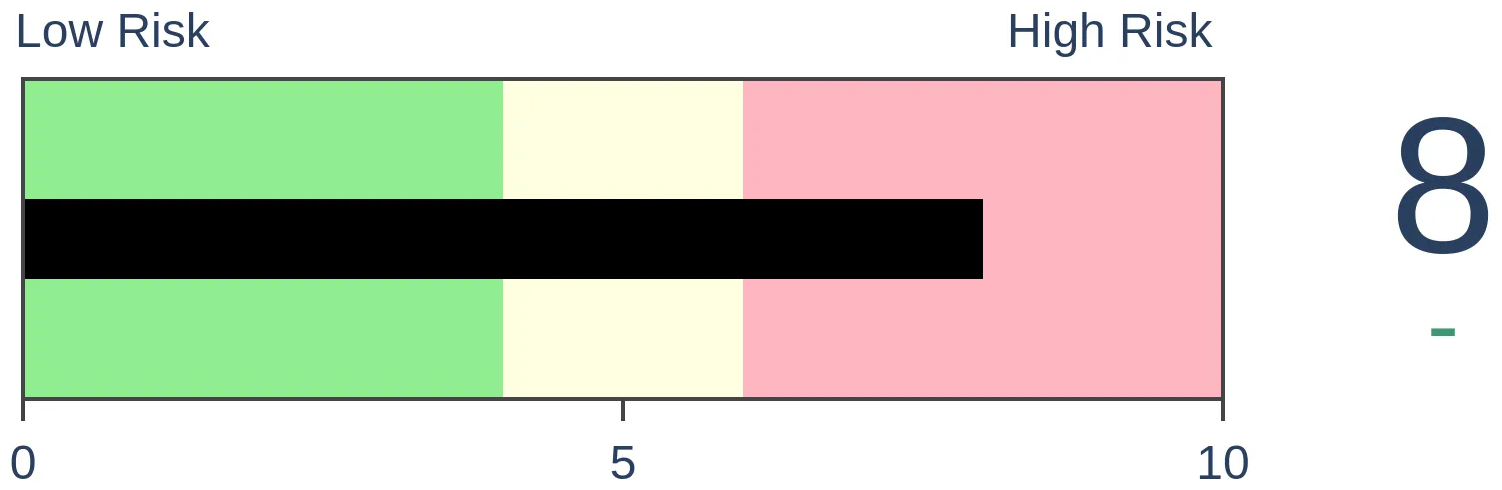
Stocks Short-Term
|
Stocks Medium-Term
|
|
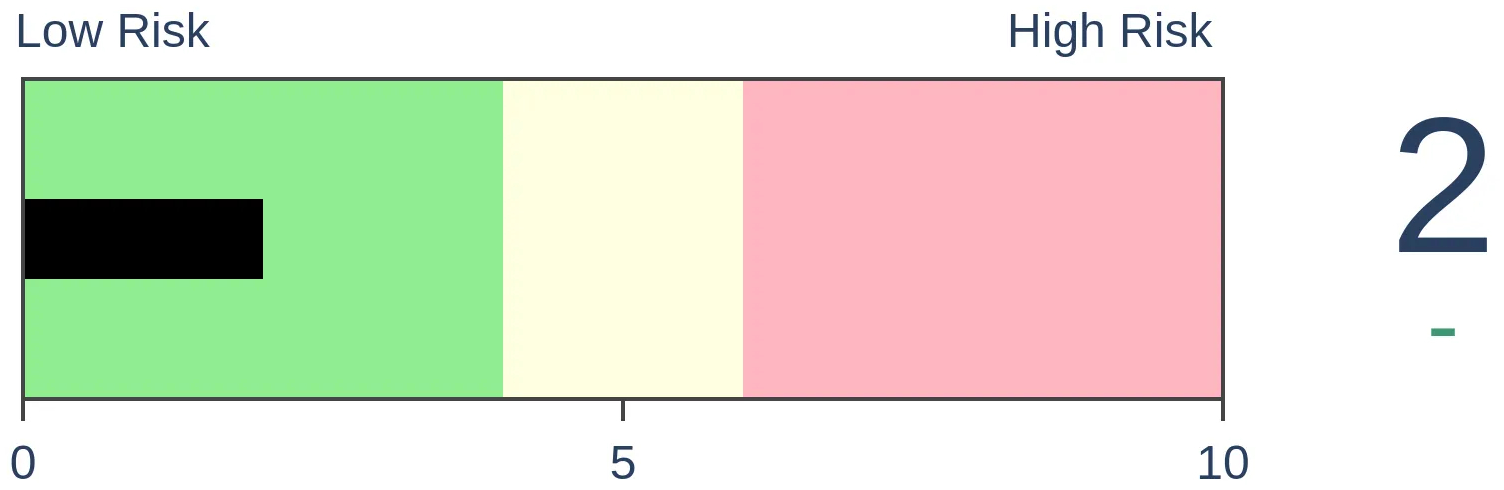
Bonds
|
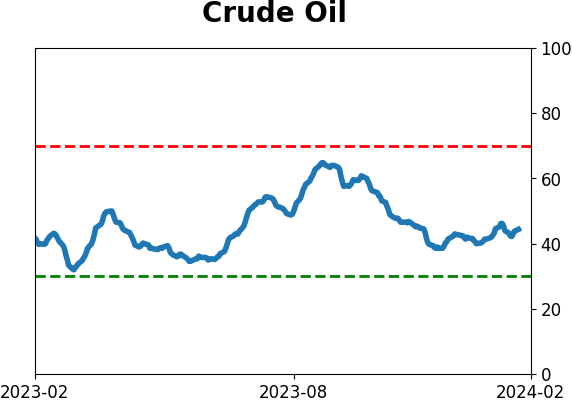
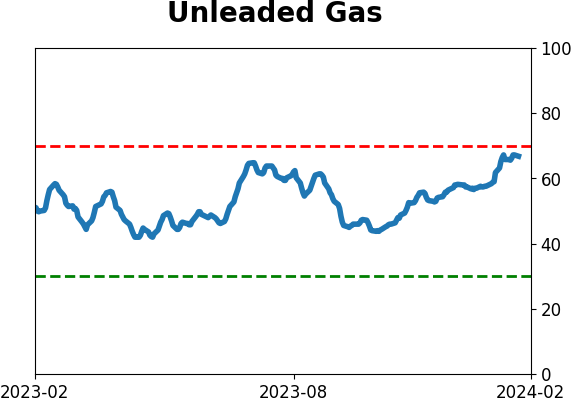
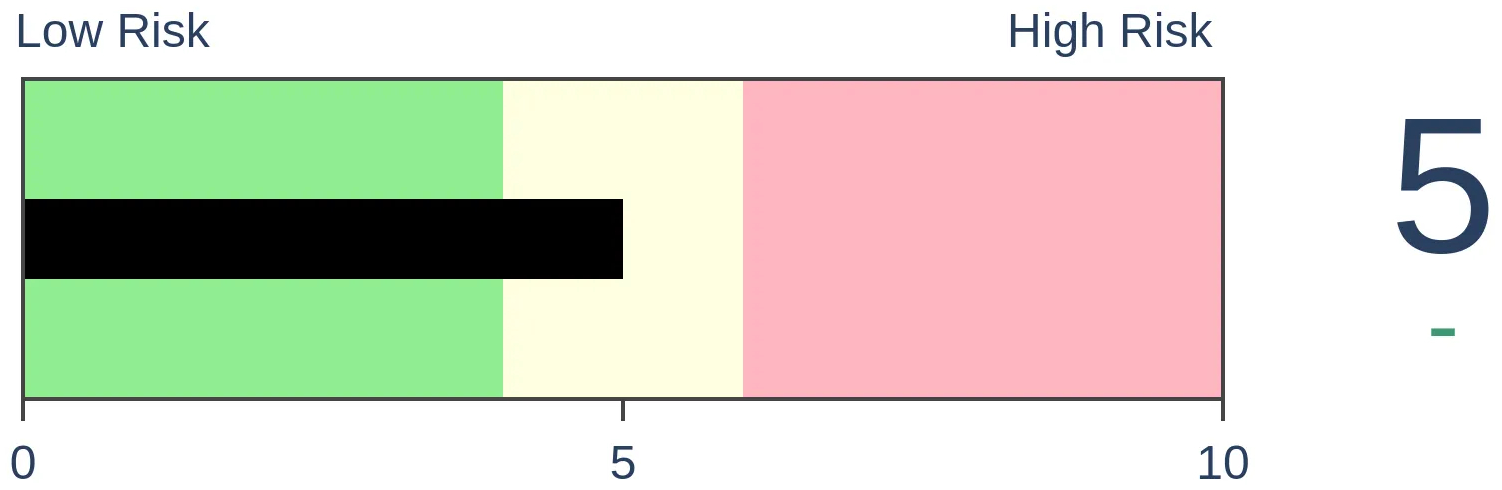
Crude Oil
|
|
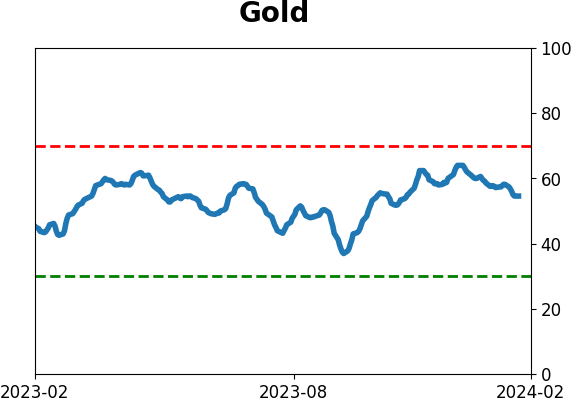
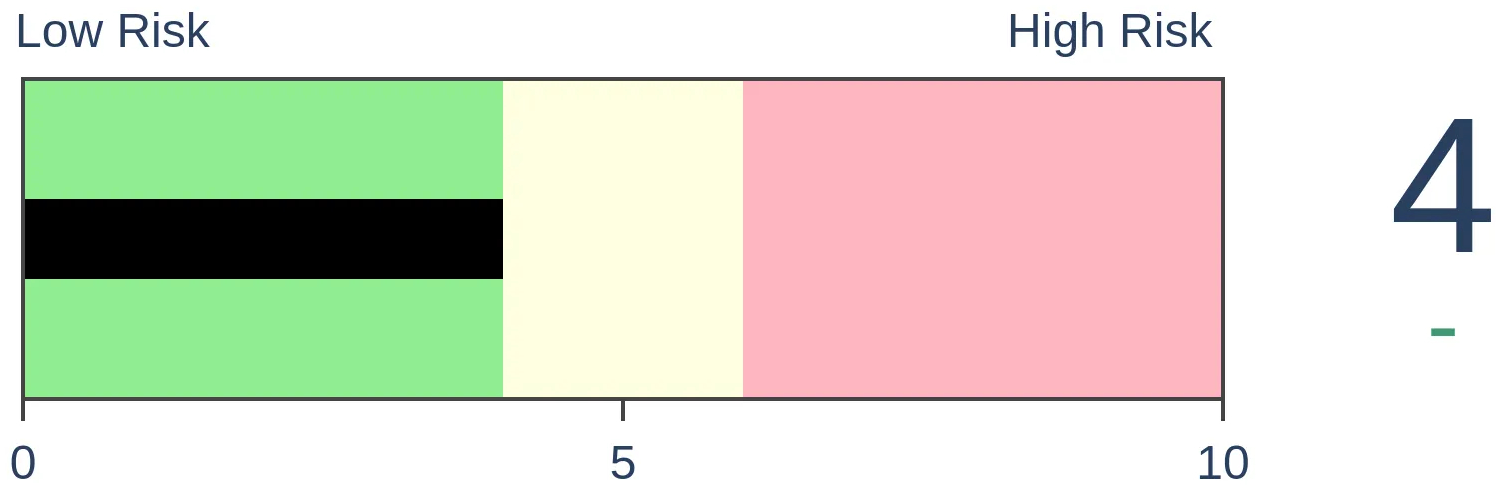
Gold
|
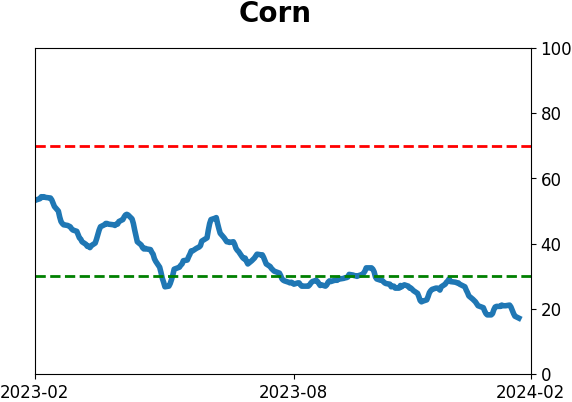
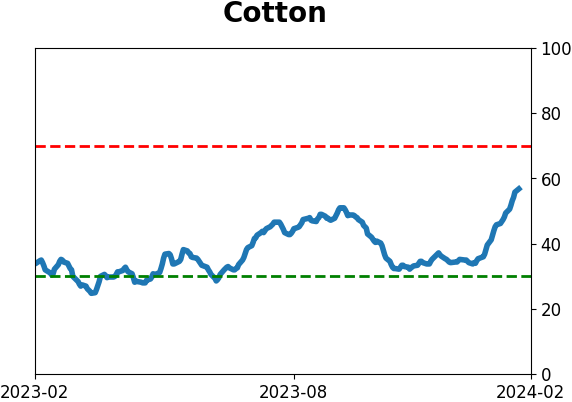
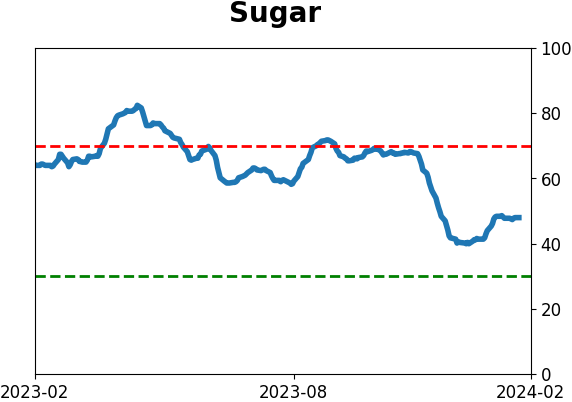
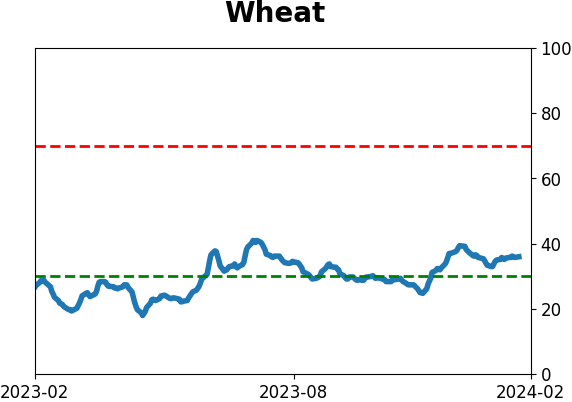
Agriculture

|
|
Research
By Jason Goepfert
BOTTOM LINE
Internal momentum among small cap stocks has been poor. The McClellan Summation Index for the Russell 2000 is deeply negative even as the S&P 500 has been hitting record highs. This is a negative divergence last seen in 2021, and recent signals have been a warning for the broader market.
FORECAST / TIMEFRAME
None
|
Key points:
- The S&P 500 has been hitting record highs as internal small cap momentum deteriorates
- The McClellan Summation Index for the Russell 2000 is deeply negative as the S&P powers to new highs
- This is an unusual divergence last seen near the 2021 peak, and recent signals have been a warning
As the S&P powers to record highs, small cap momentum is waning
We've looked a few times over the last couple of weeks how some oddities are building under the surface of the stock market. Even as most of the major indexes are hitting new high after new high, there is something of a split underneath. There's nothing to get too worried about yet, but it's in yellow-flag territory.
The main reason is that investors have primarily focused on the largest stocks. Many smaller caps are lagging, some badly, and underlying momentum is poor.
The McClellan Summation Index for the Russell 2000 is well below zero even as the S&P 500 has driven to record highs. This is unusual - usually, small cap momentum ebbs and flows along with swings in the S&P as investors are in gear. The last time they were out of gear like this was in 2021.
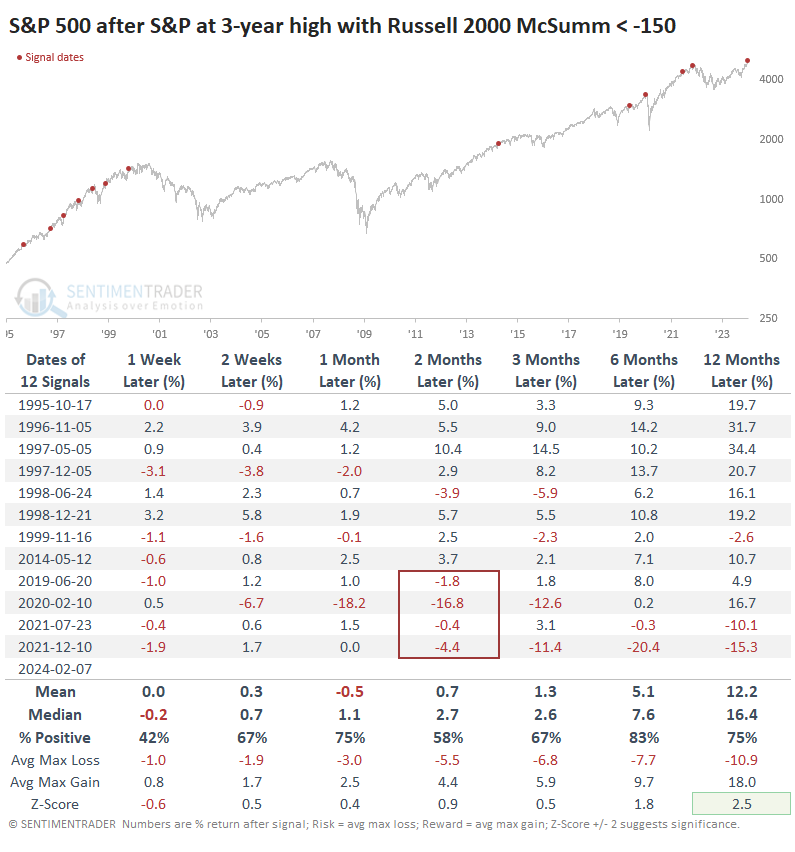
Granted, that was just the last time they were out of gear; the resulting bear market was atypical. The table below shows every time when the S&P 500 closed at least at a multi-year high, but the Summation Index for small cap stocks was below -150, showing poor internal momentum. Overall returns in the S&P going forward weren't bad at all. The most worrying thing was that the last four signals all preceded pullbacks.
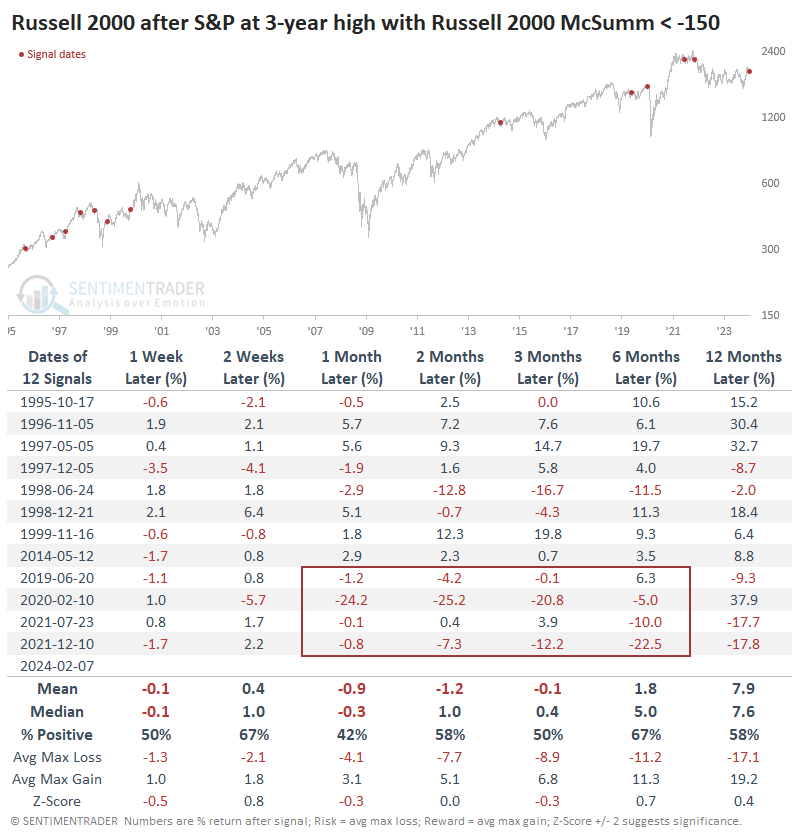
It was a worse sign for the Russell 2000. That index of small cap stocks suffered worse returns in the months ahead, with high risk relative to reward. The most recent signals have been particularly bad.
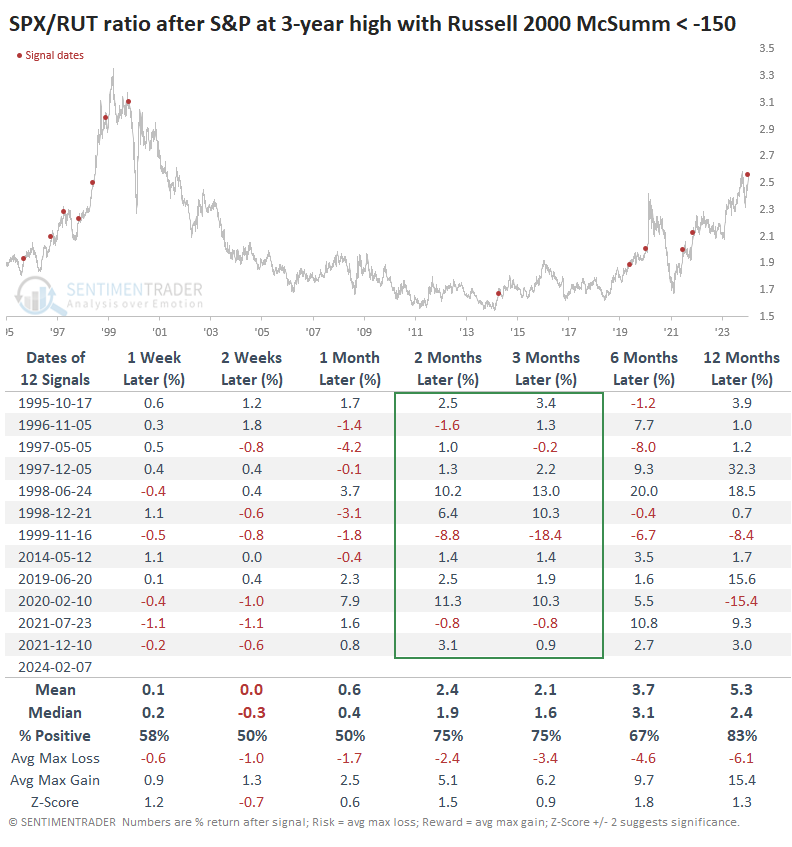
Looking at the S&P 500 to Russell 2000 ratio after these signals, the S&P tended to continue to outperform the Russell over the next two to three months, in particular. The S&P outperformed either two or three months later after all but two of the signals, and after one of those, it quickly resumed its outperformance.
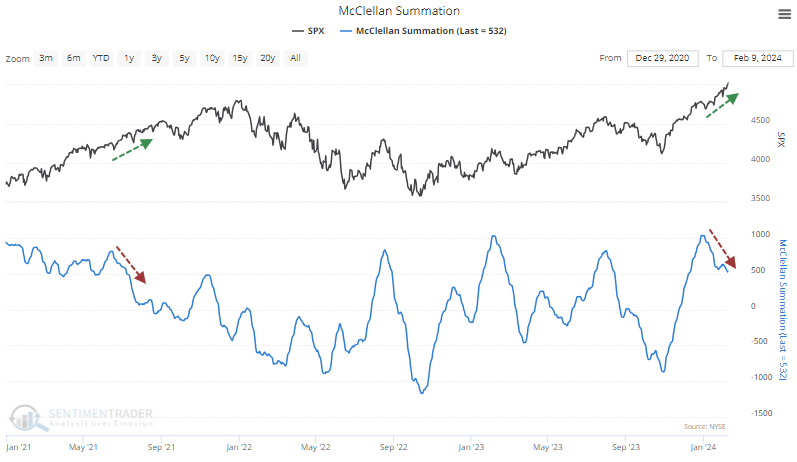
The drag of small cap stocks has continued to have an impact on the wider McClellan Summation Index for the NYSE exchange. That indicator has dropped by nearly 500 points over the past 30 days, even as the S&P 500 has rallied 5% and set more than a dozen record highs. Again, the last time we saw that was in 2021, though well before the peak in the S&P.
Going back to 1962, this is a very unusual situation. The table below highlights every time the S&P rallied at least 4% and set at least 10 52-week highs over the past 30 days, all while the NYSE Summation Index declined by at least 300 points.
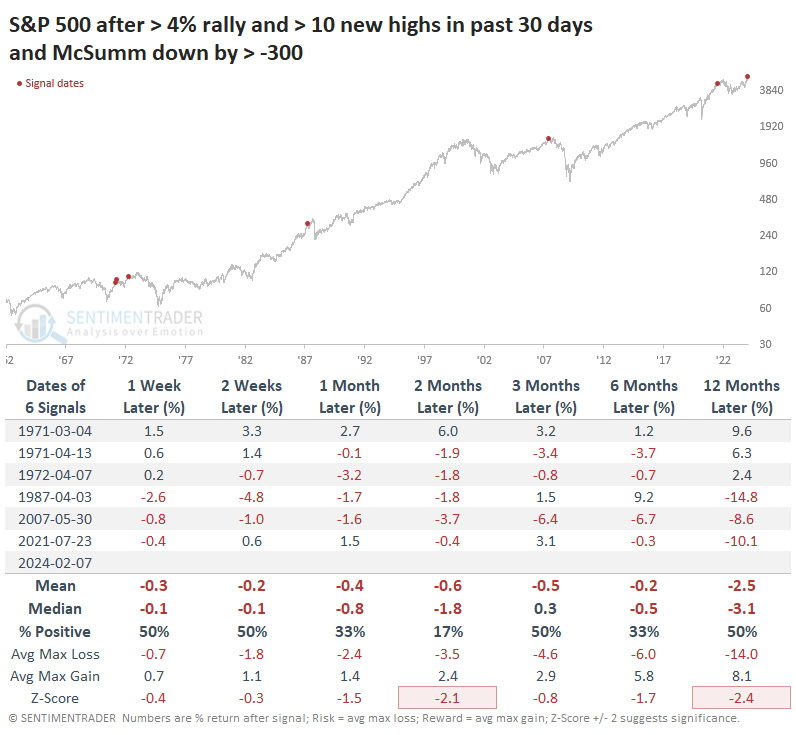
The implications are not great, just by looking at the red dots on the chart. However, we have to be careful about weighting this too heavily given the tiny sample size and multiple conditions for the study.
What the research tells us...
Many investors watch the performance of small cap stocks to get a handle on the domestic economy and earnings outlook of homegrown stocks. Relatively few small cap stocks have outsized revenue from outside the U.S., so when small stocks struggle, investors tend to get a bit nervous about the message they're sending to the broader market.
It has been wise to heed that warning in recent years since a negative divergence in small cap momentum soon preceded trouble in more-indexed benchmarks like the S&P 500. However, that wasn't the case for most of the late 1990s, which is a caveat against reading too much into the most recent divergence. Still, we'd consider it a modest negative implication for the broader market.
Indicators at Extremes
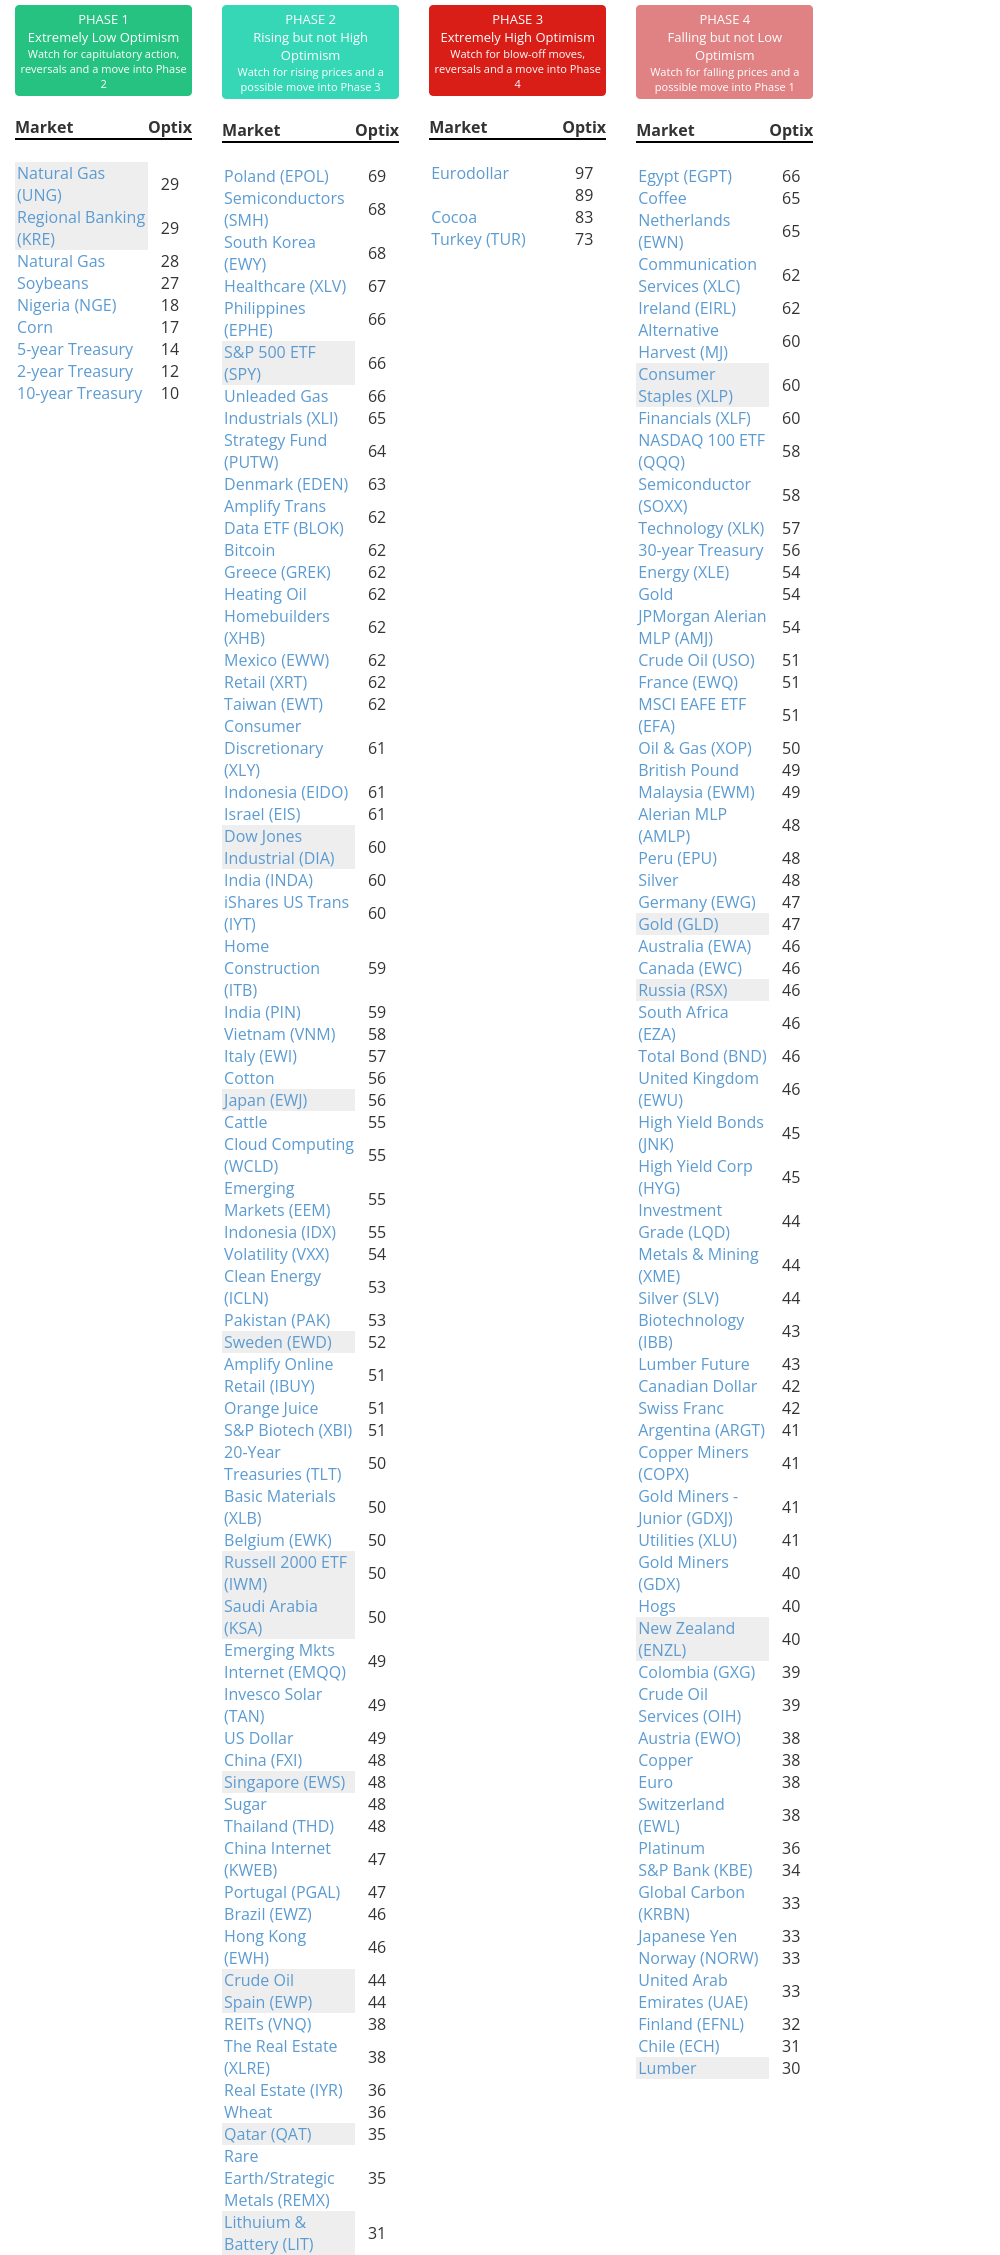
Phase Table
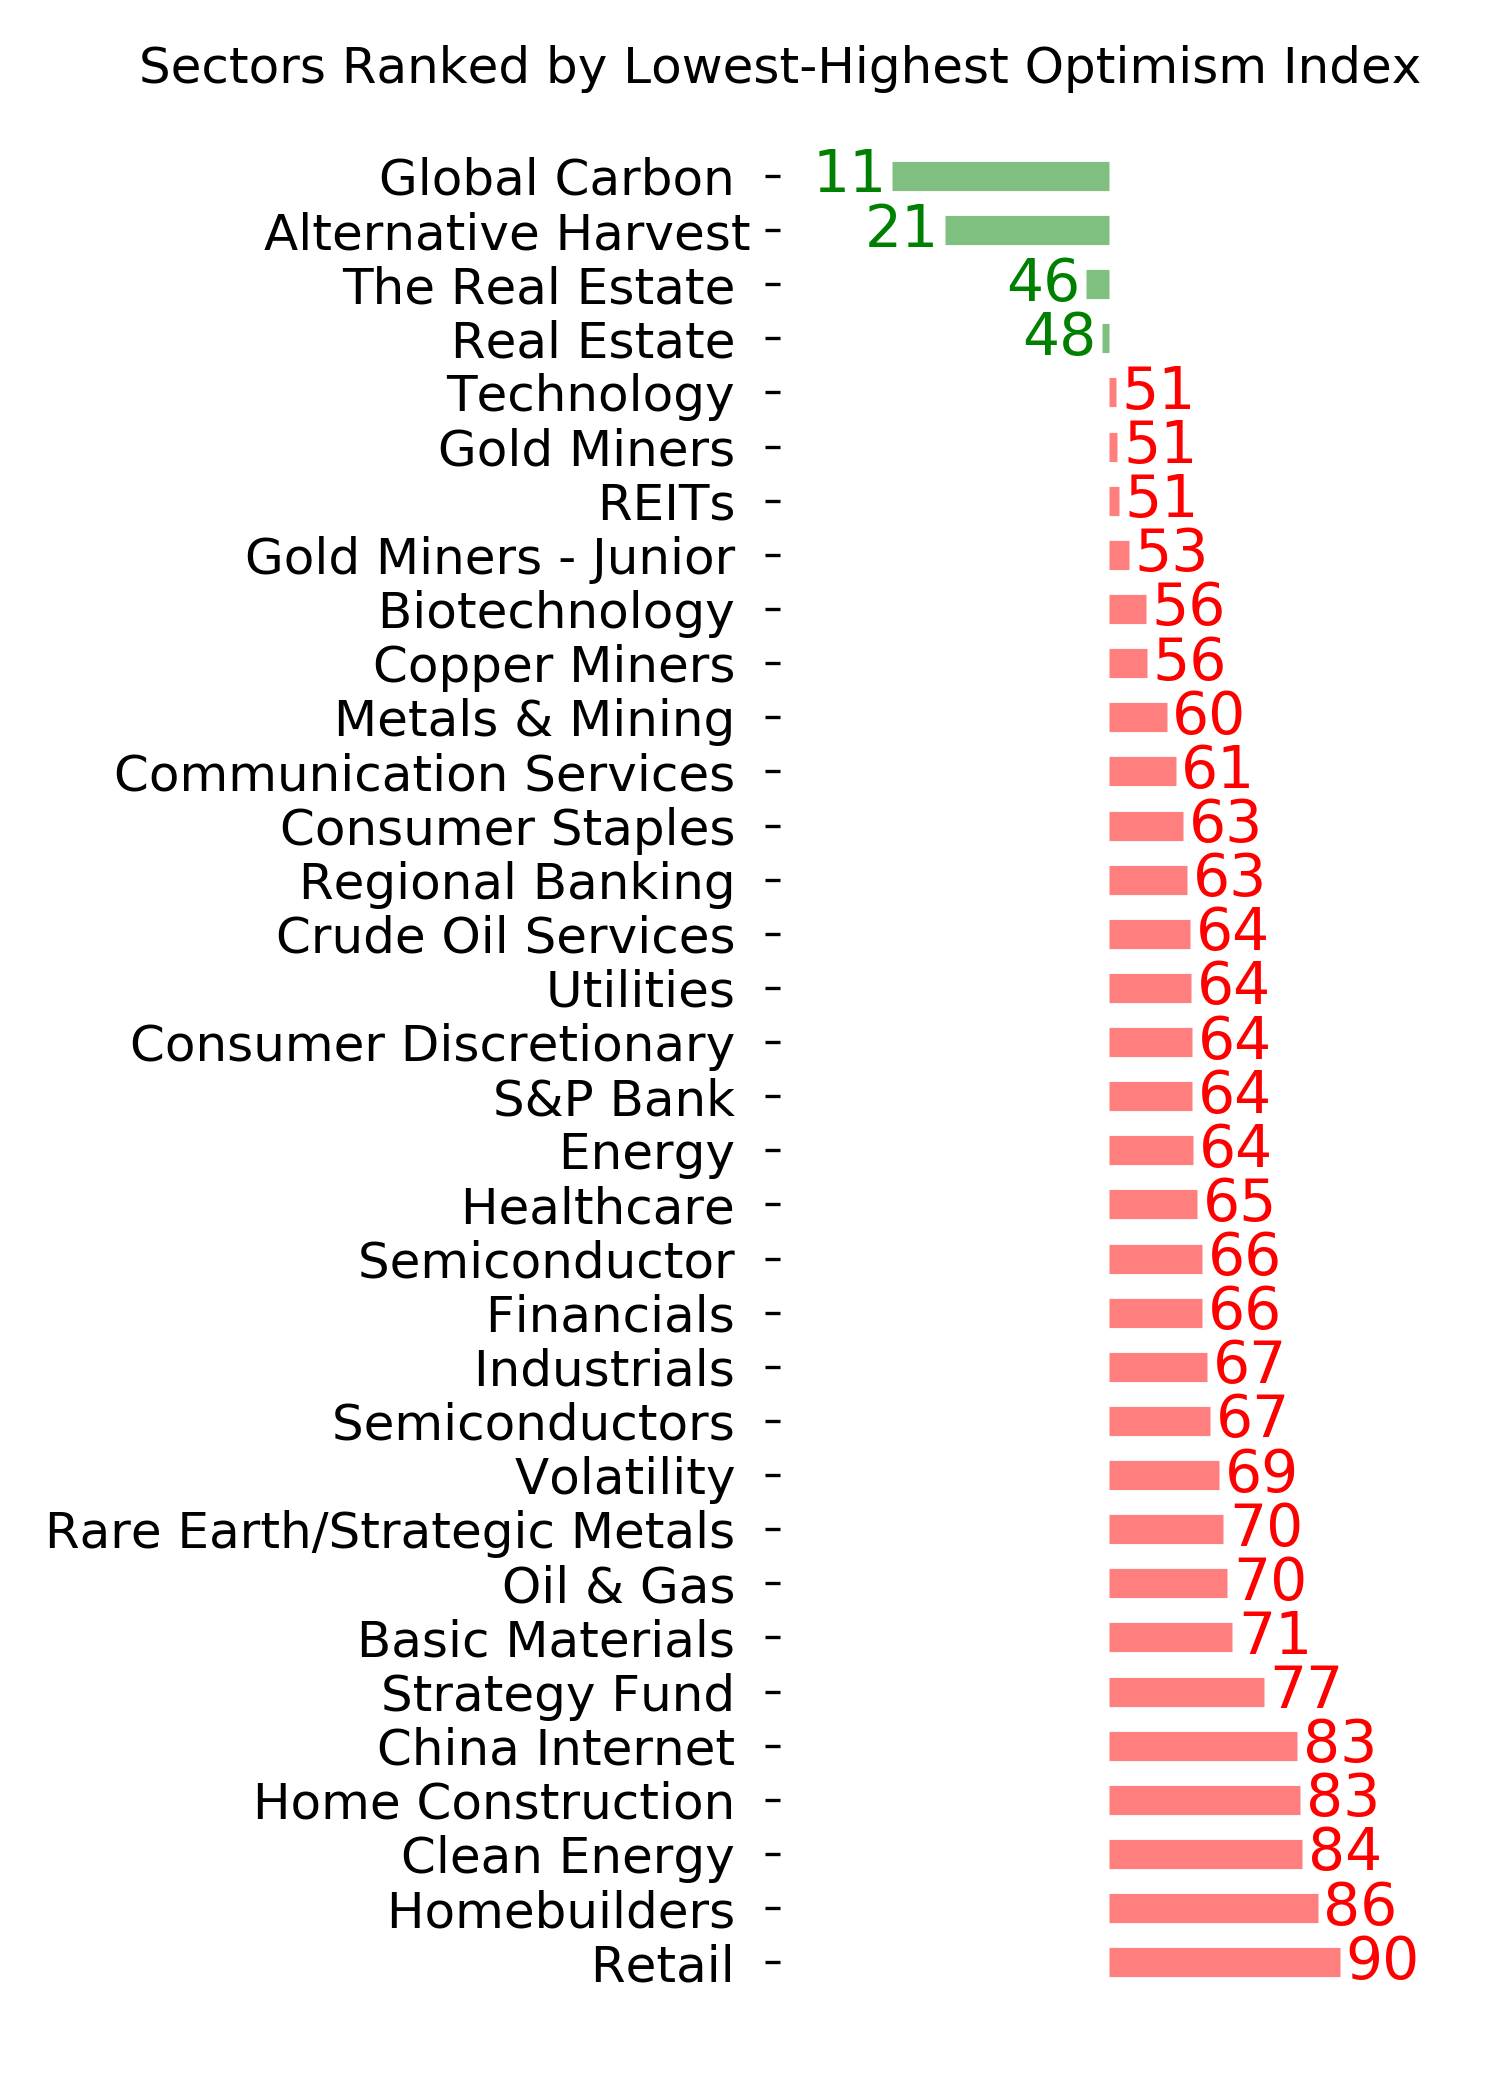
Ranks
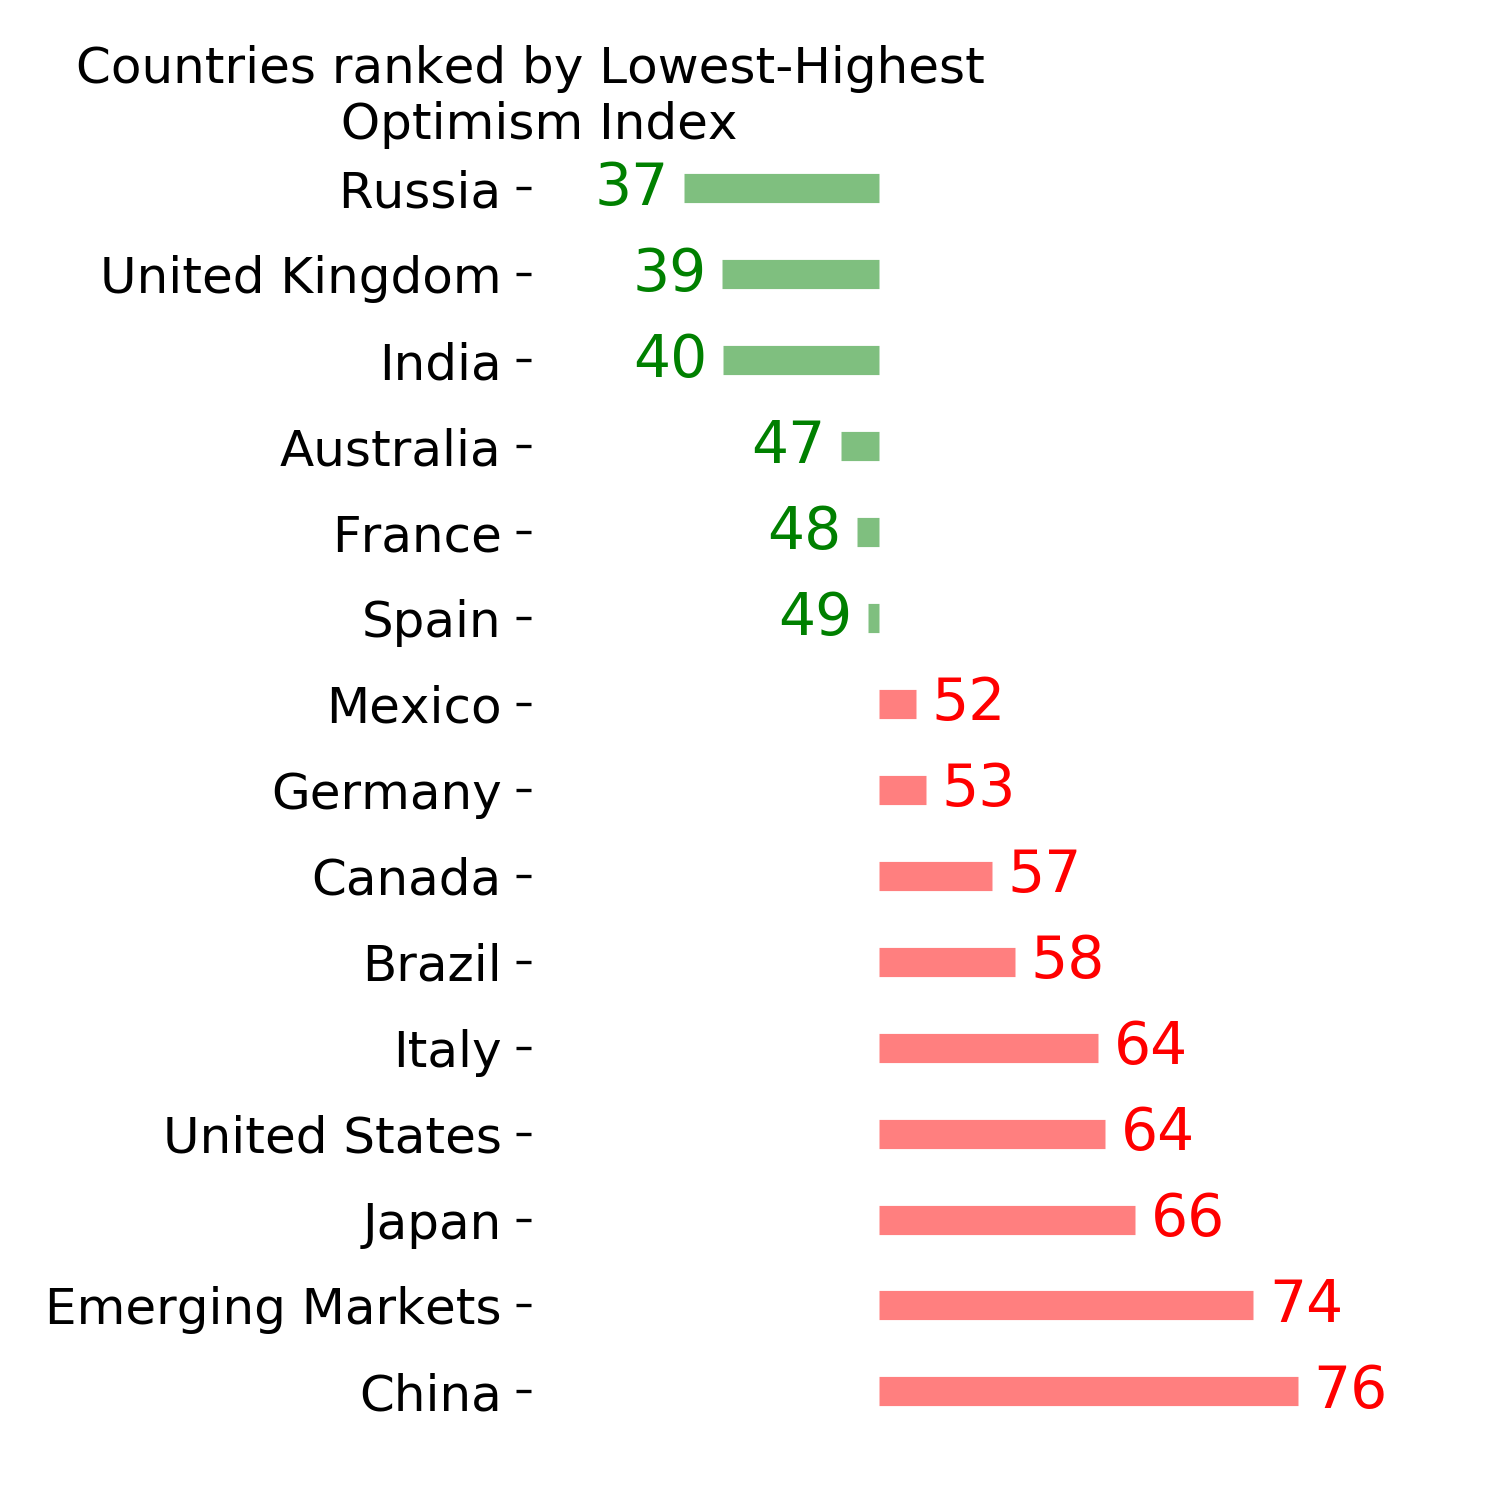
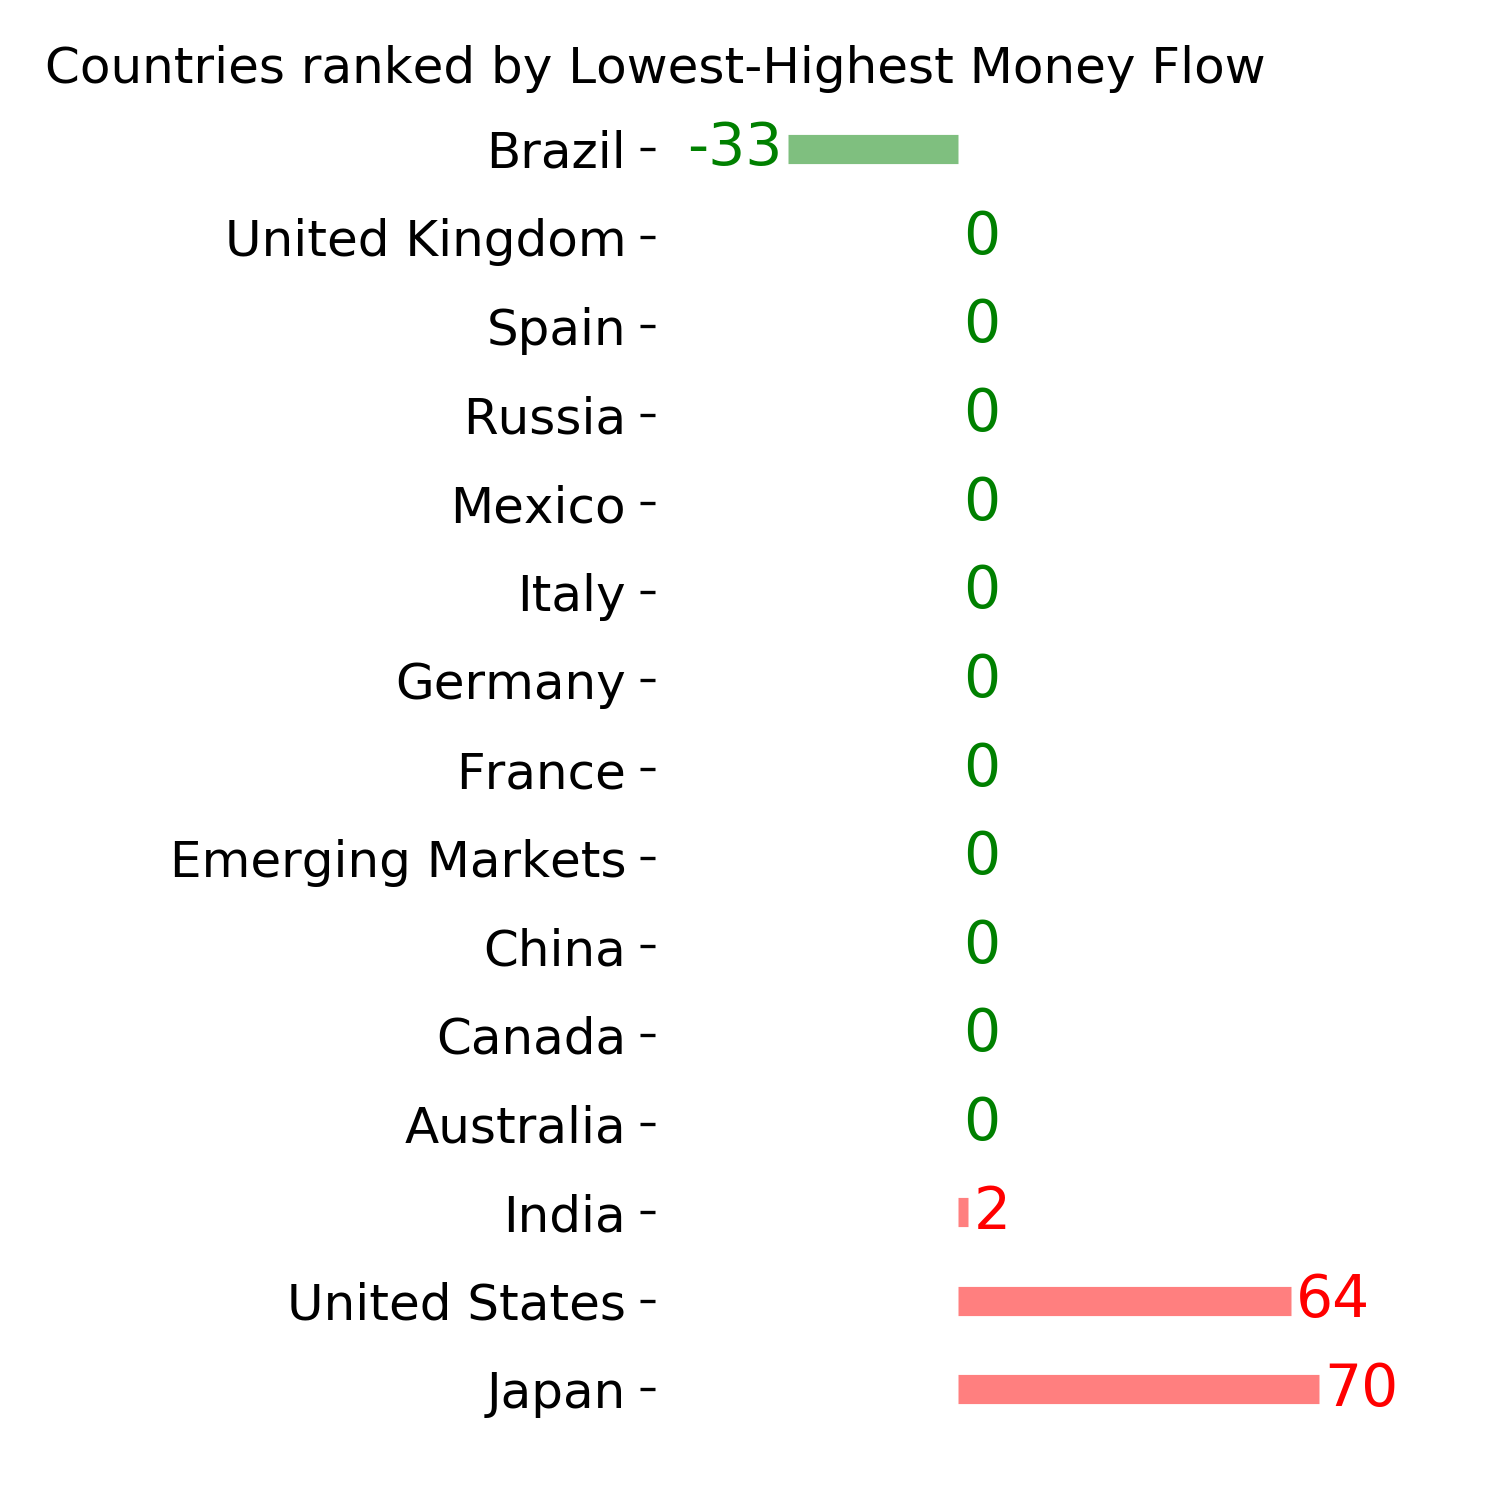
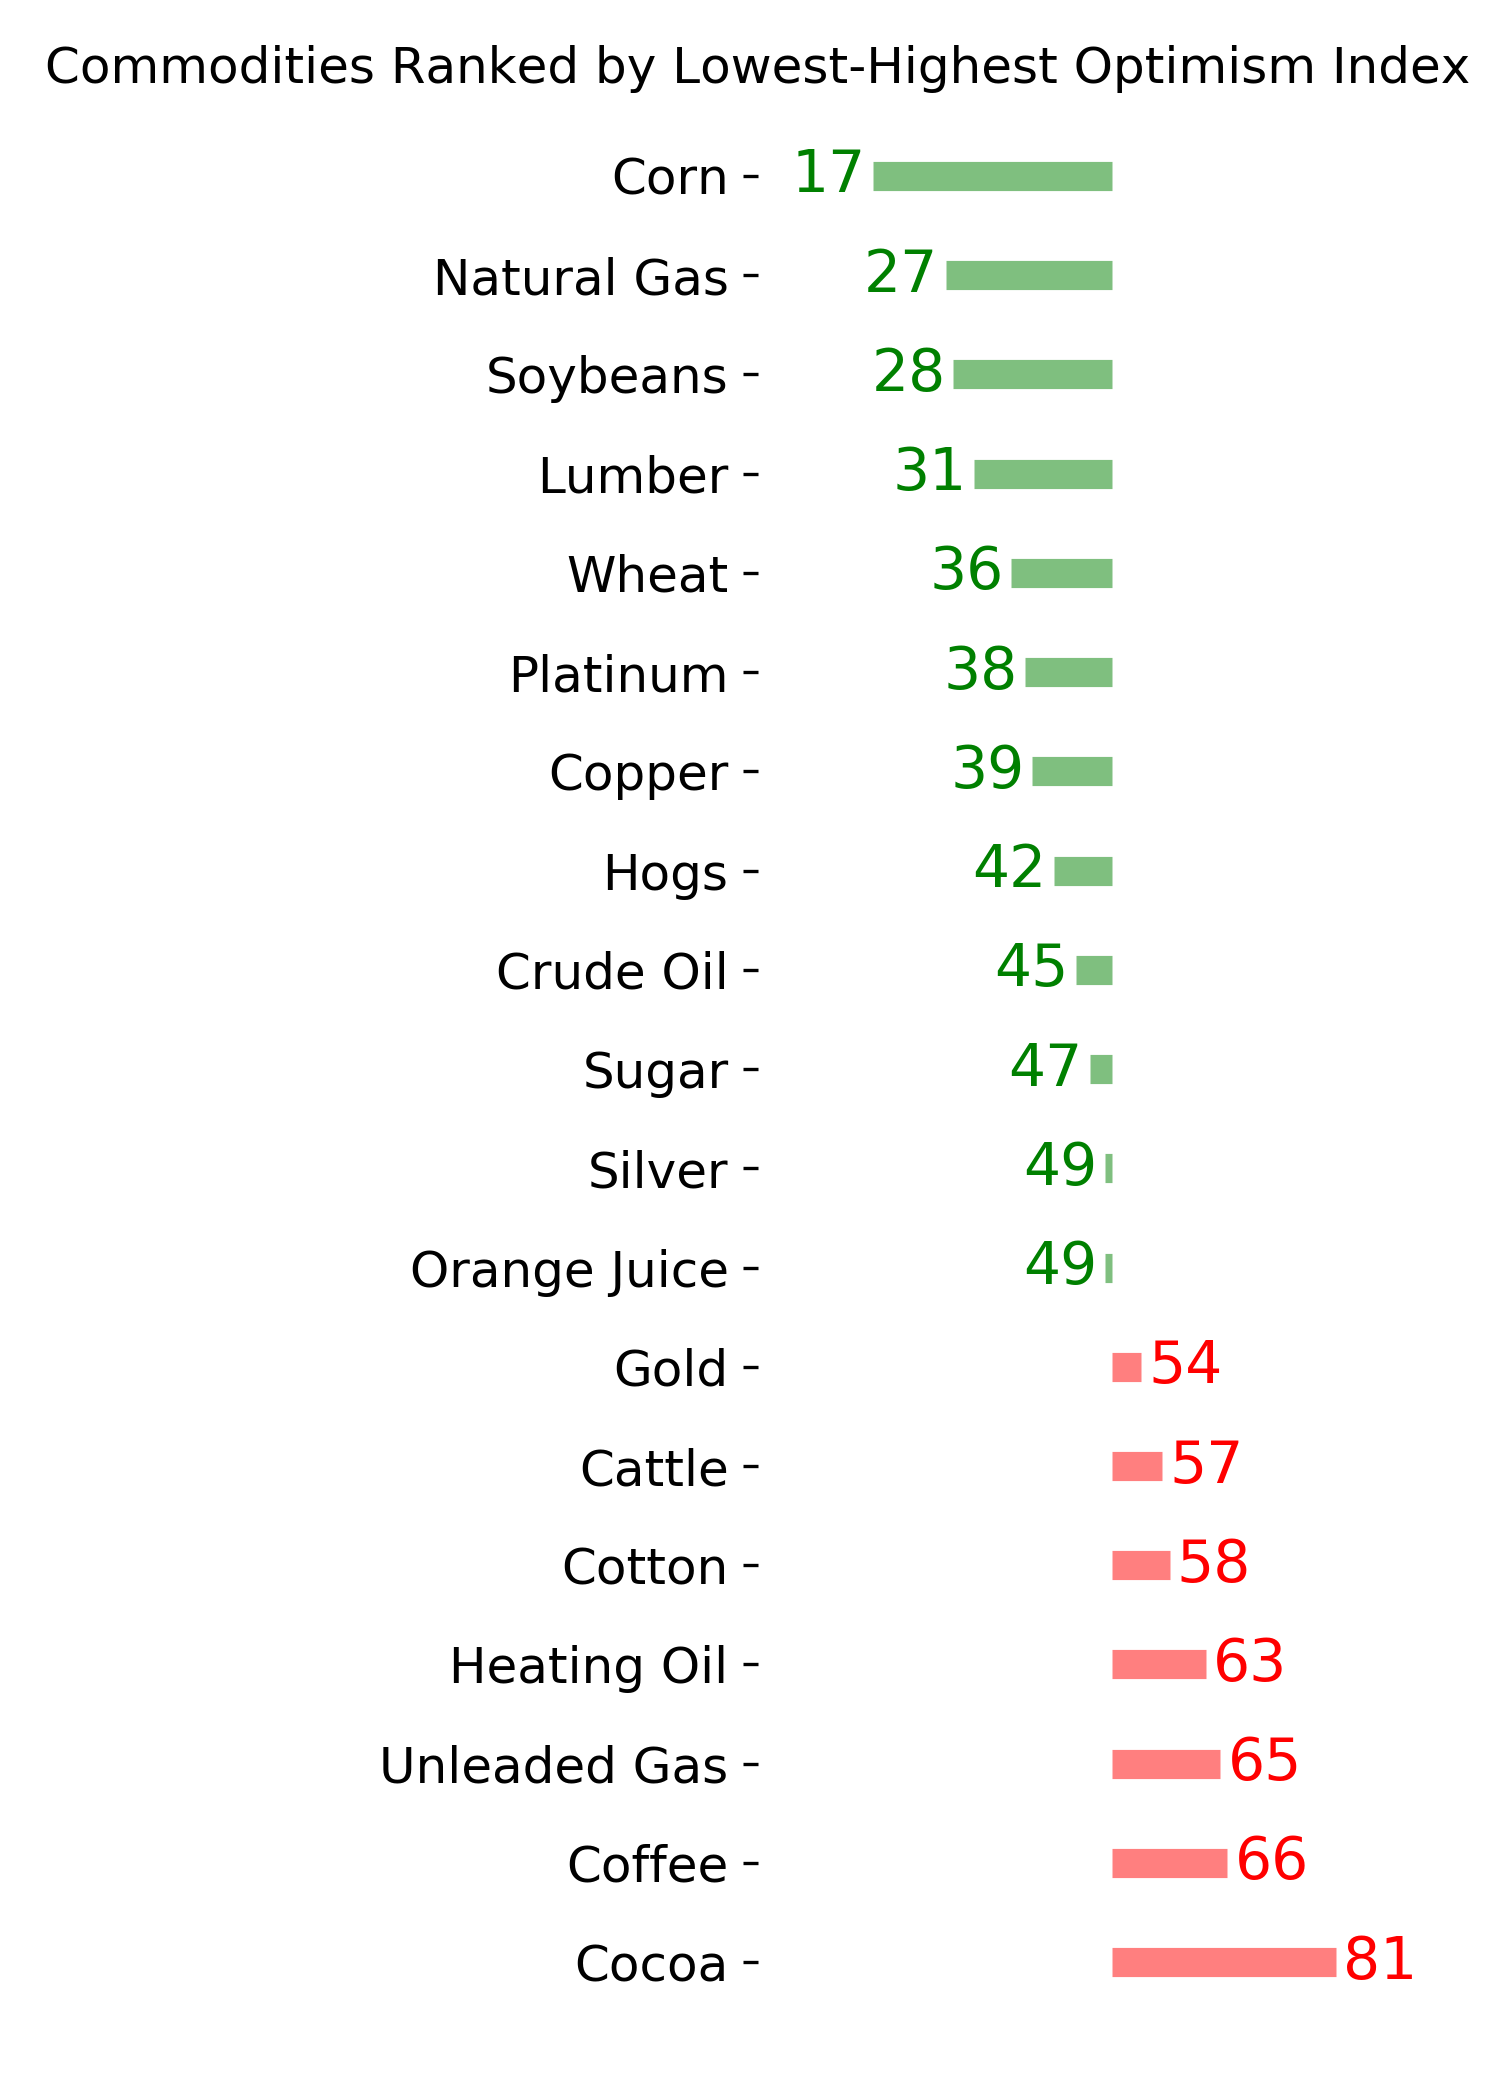
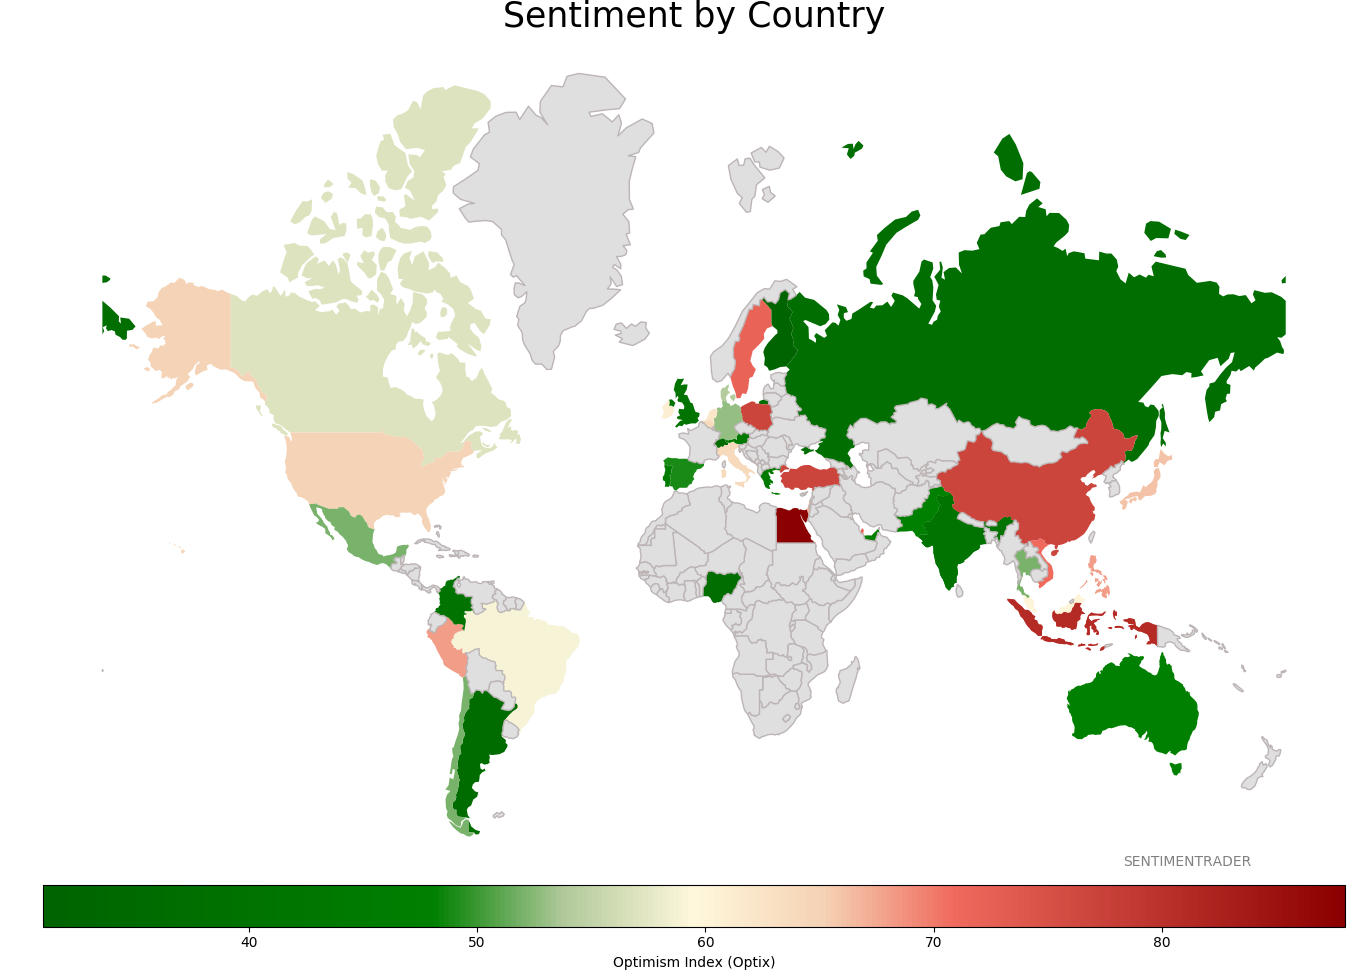
Sentiment Around The World
Optimism Index Thumbnails
|
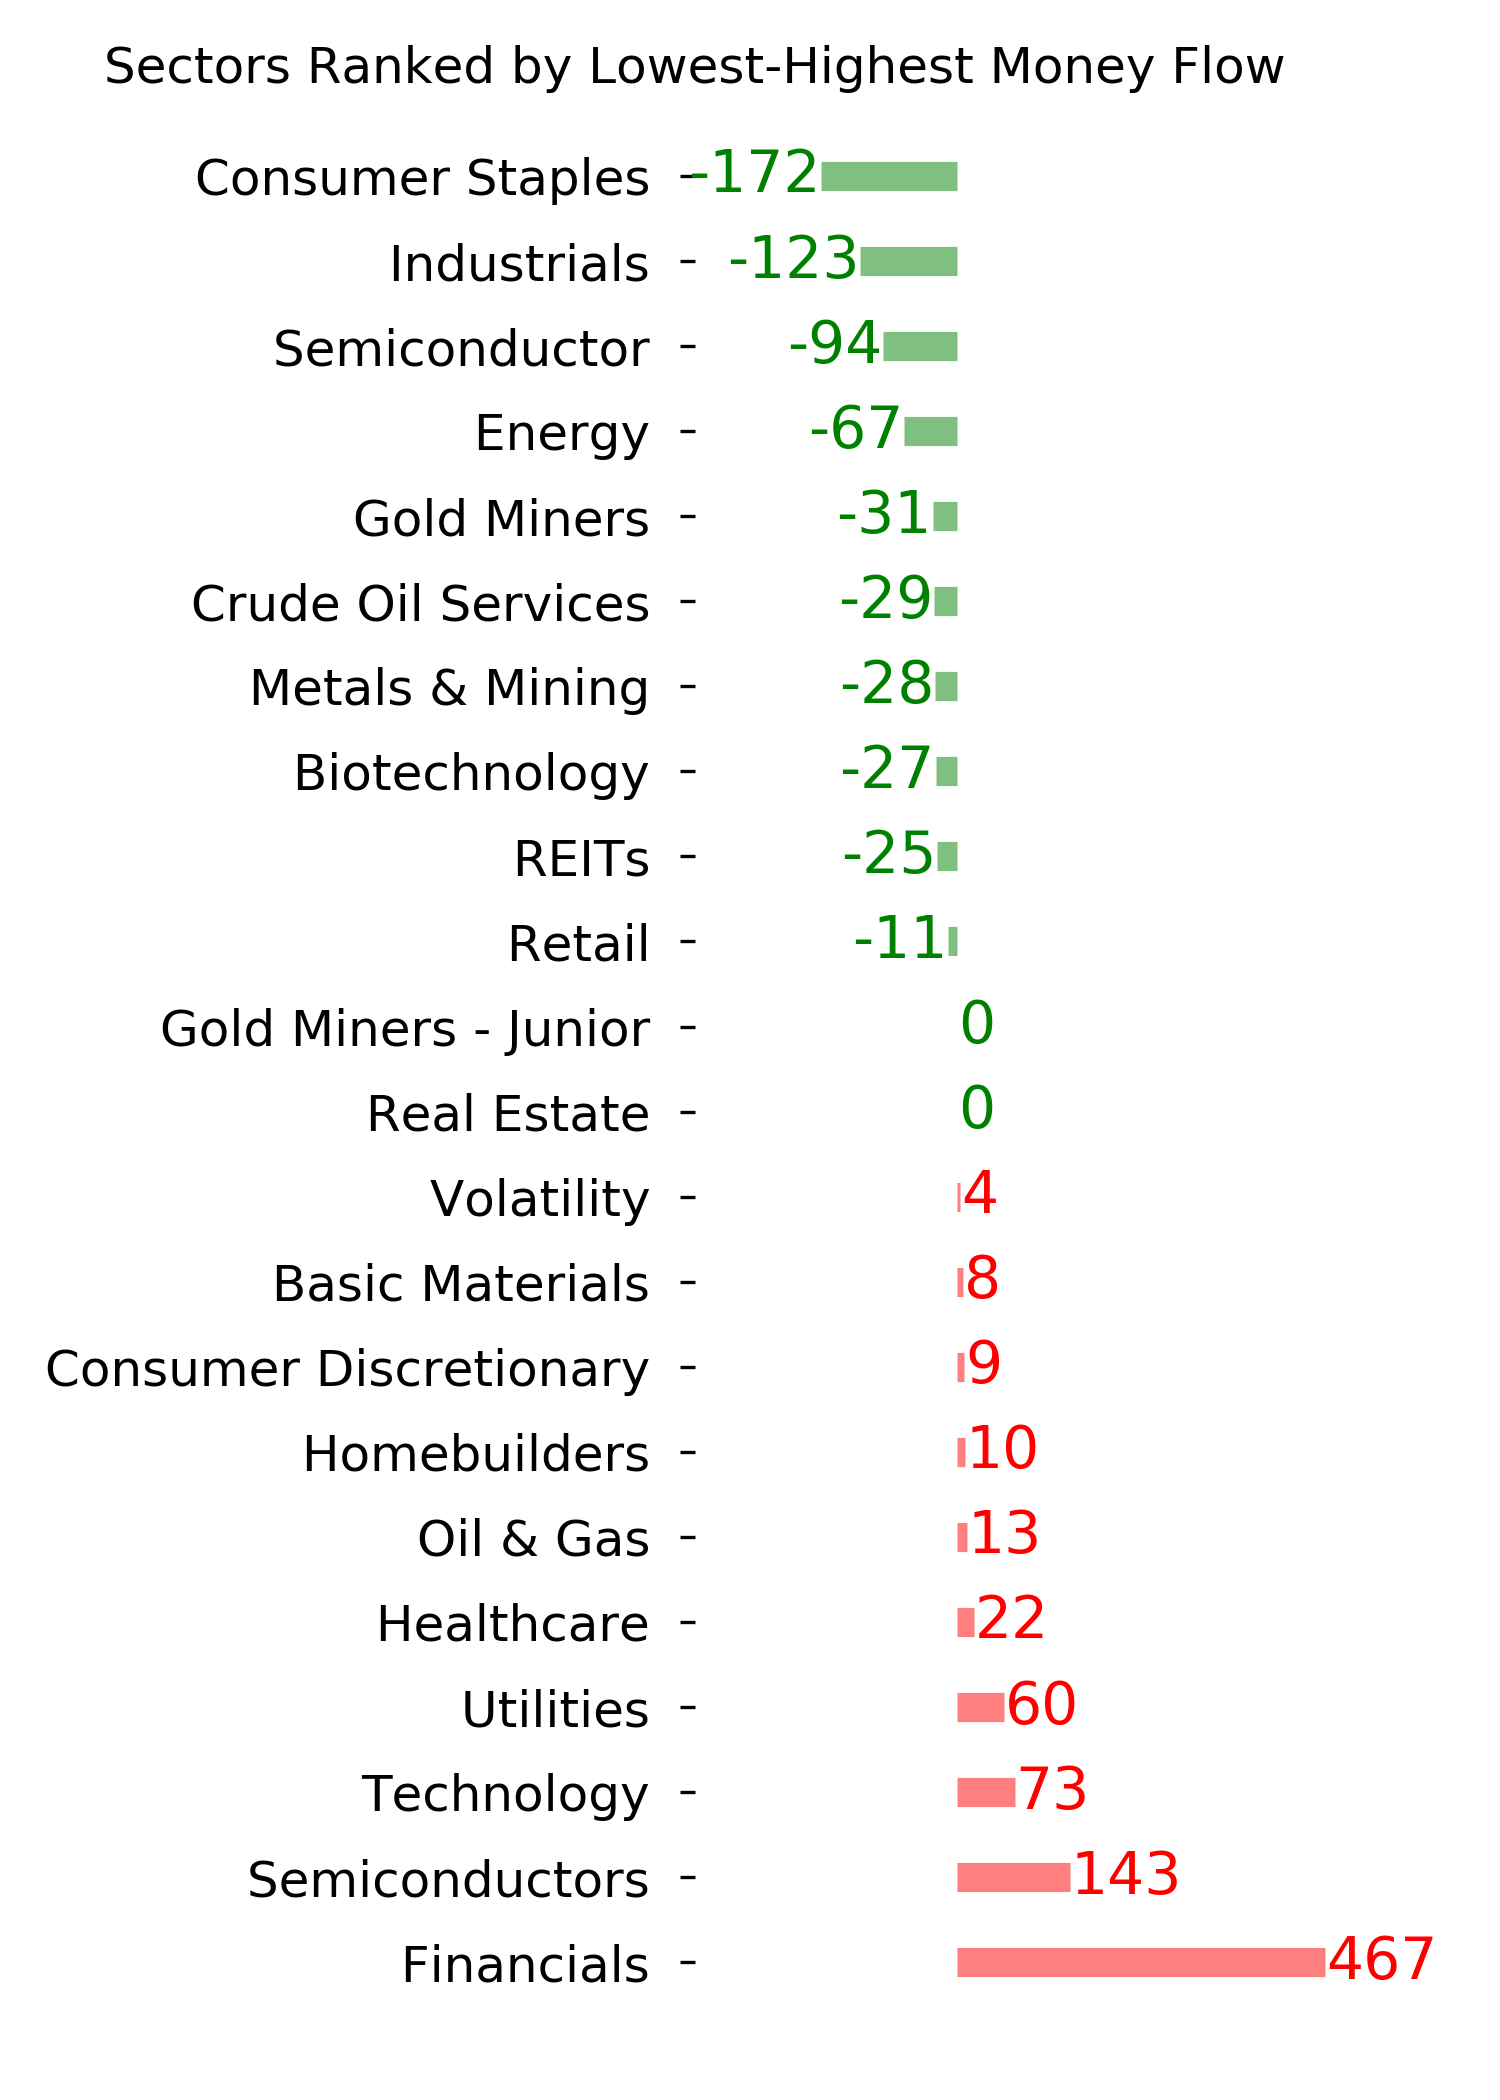
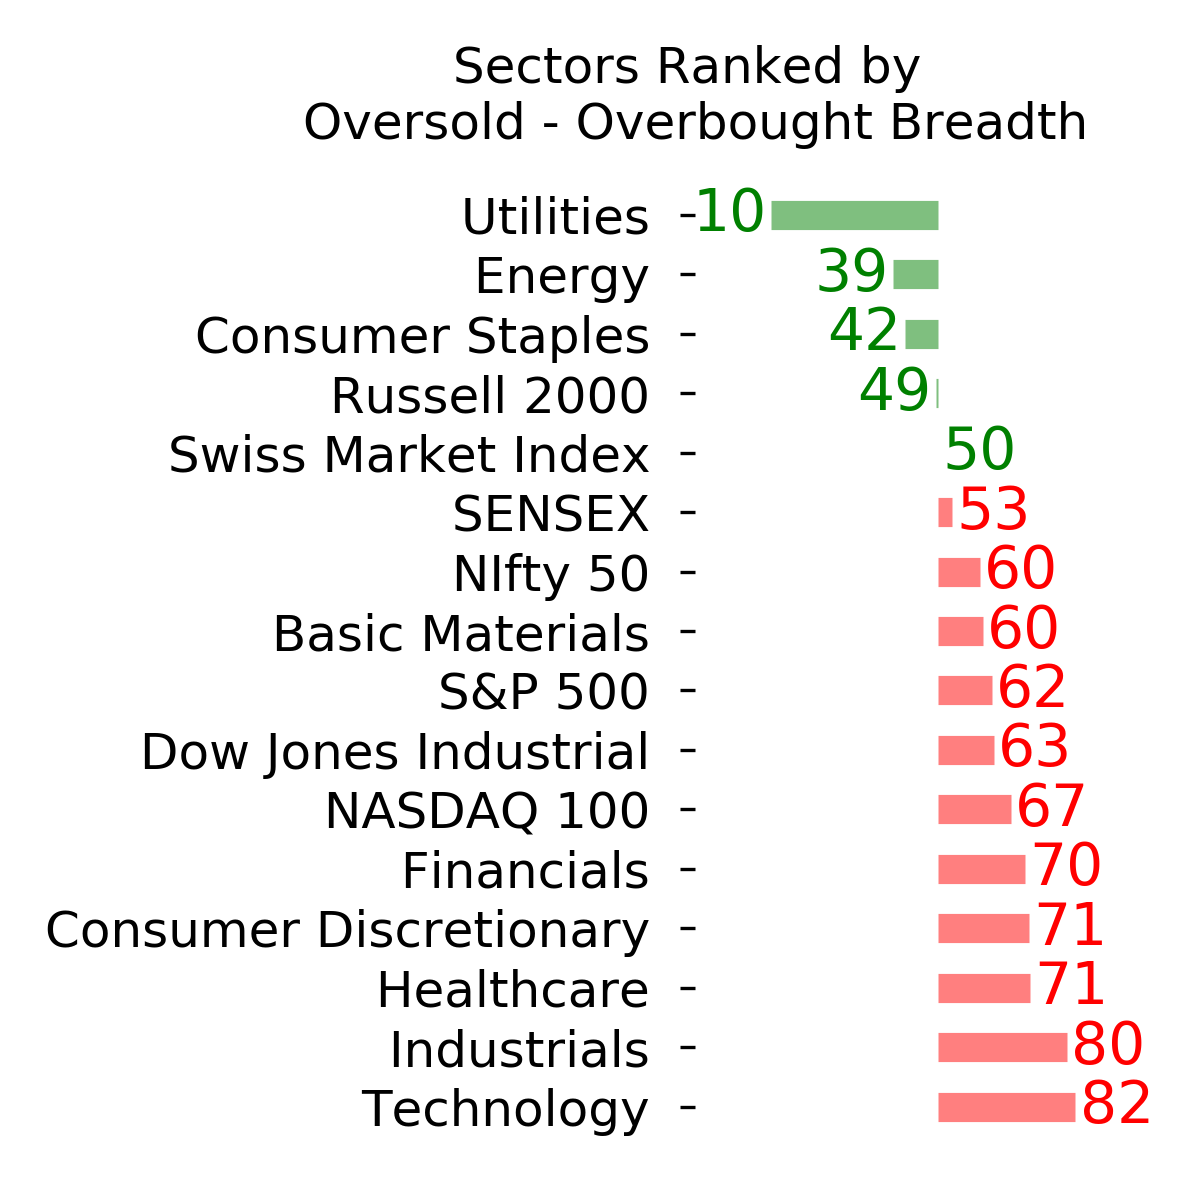
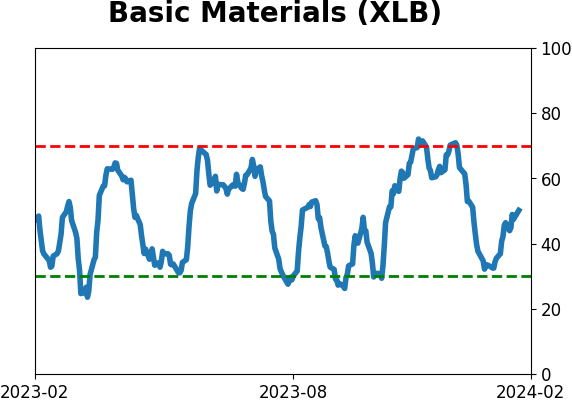
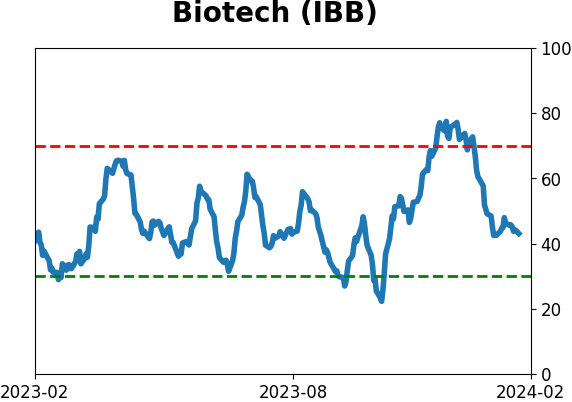
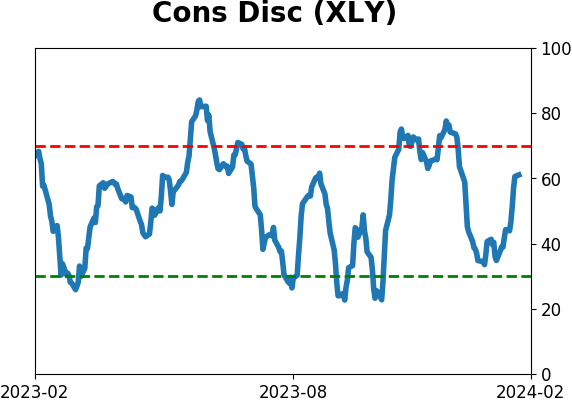
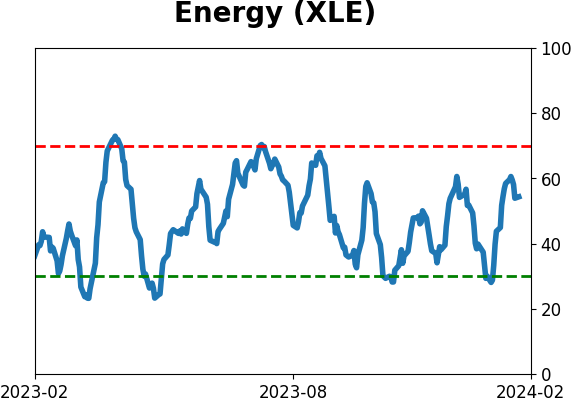
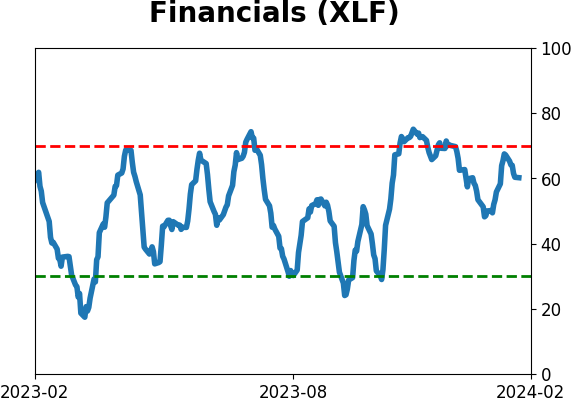
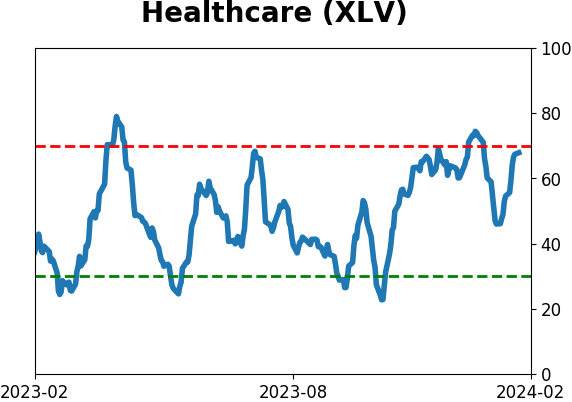
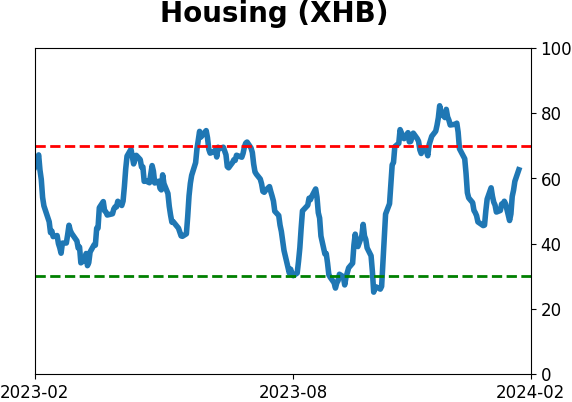
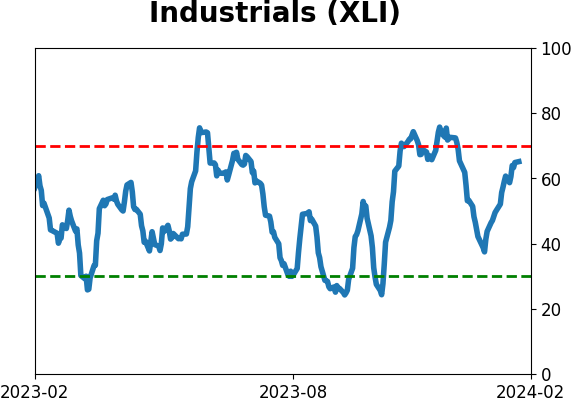
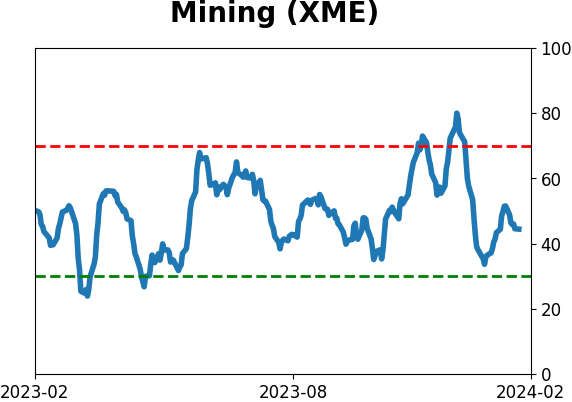
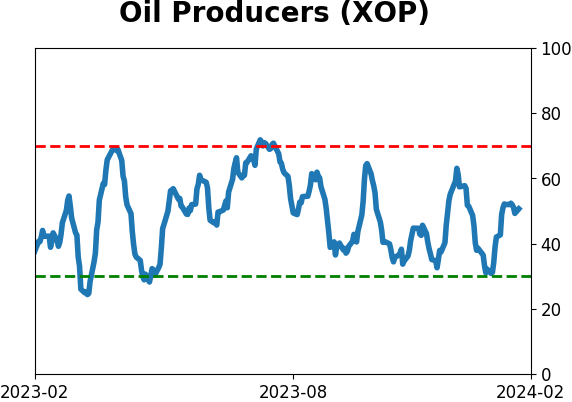
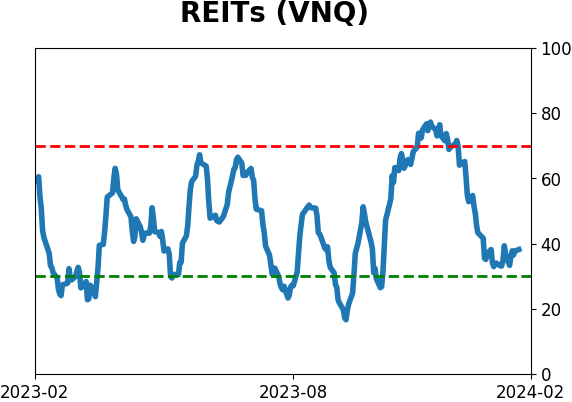
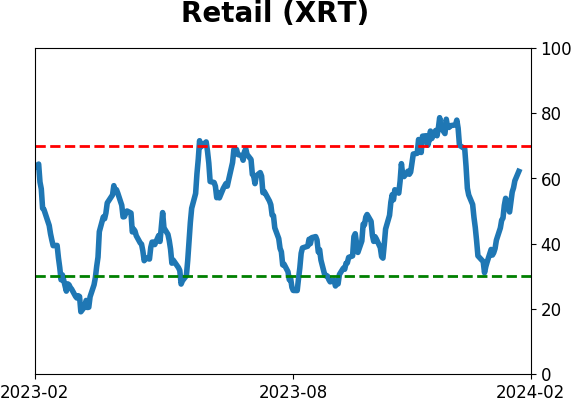
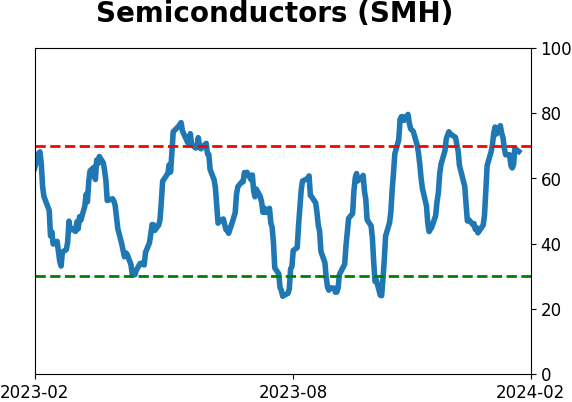
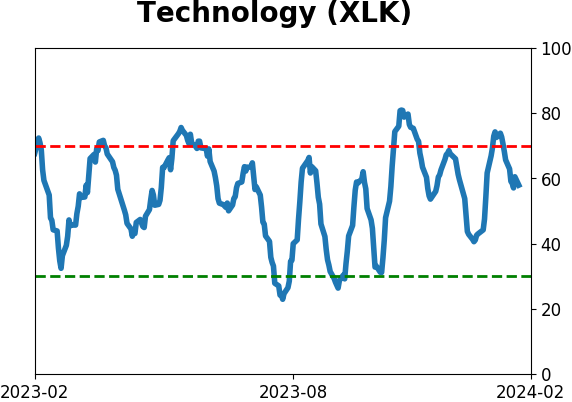
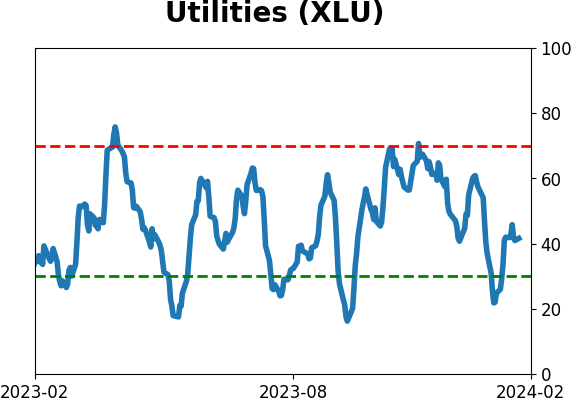
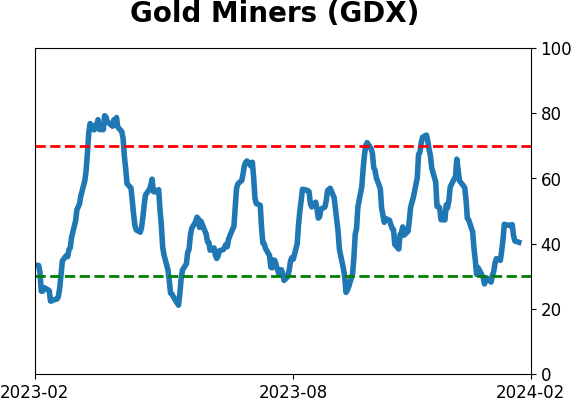
Sector ETF's - 10-Day Moving Average
|
|
|
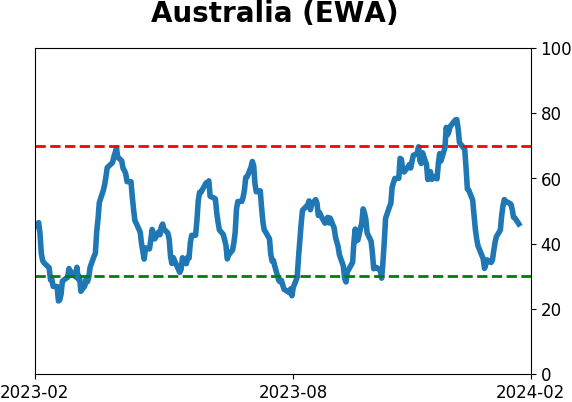
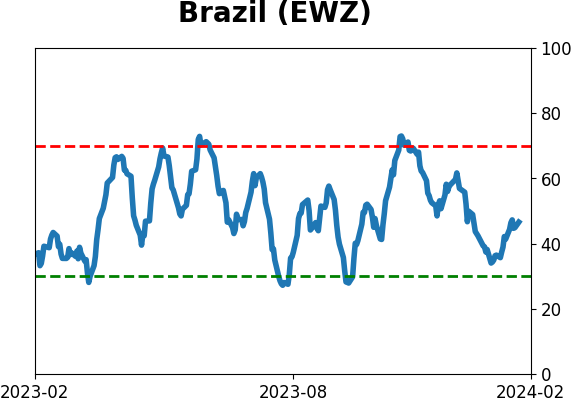
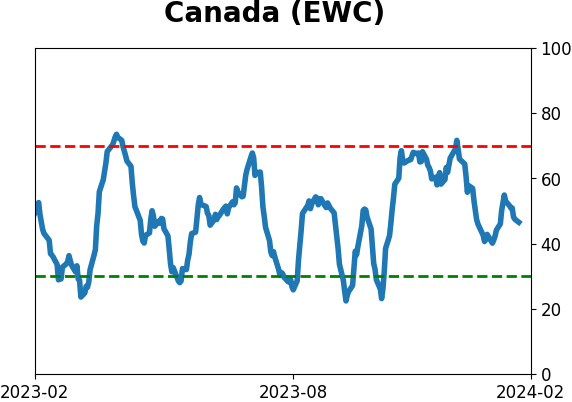
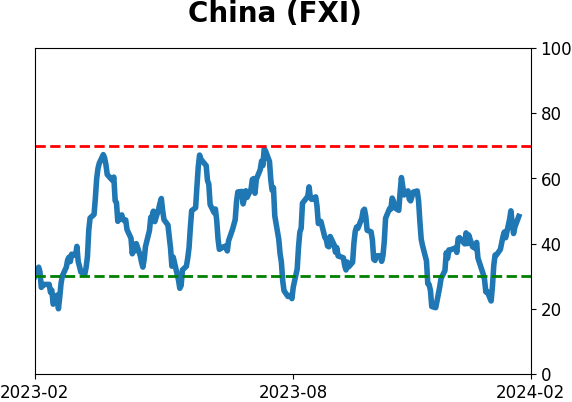
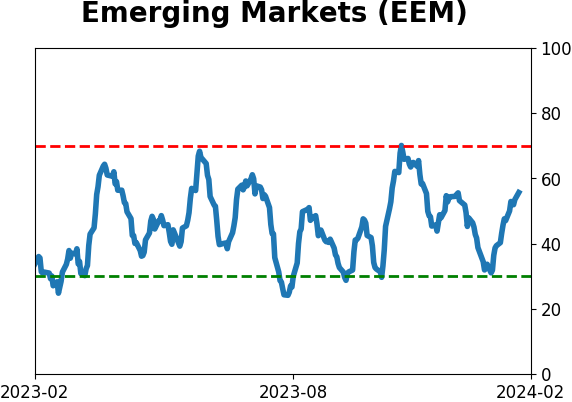
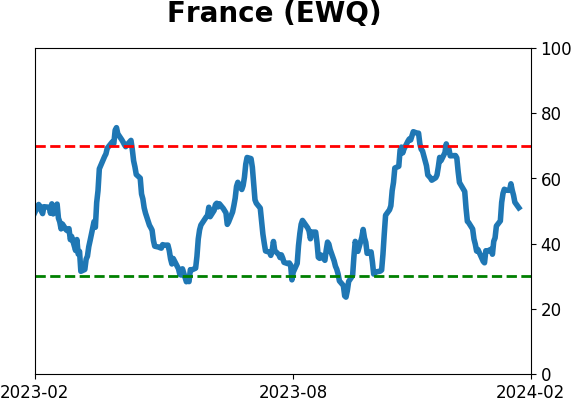
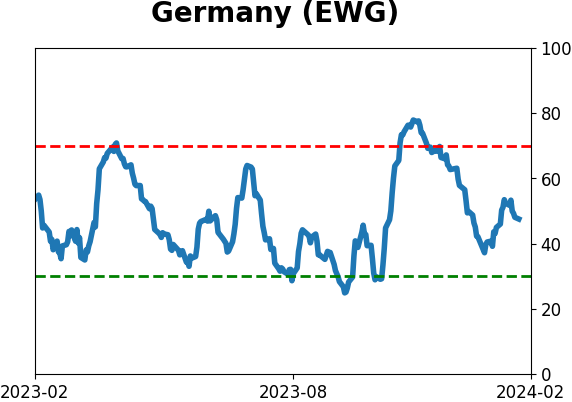
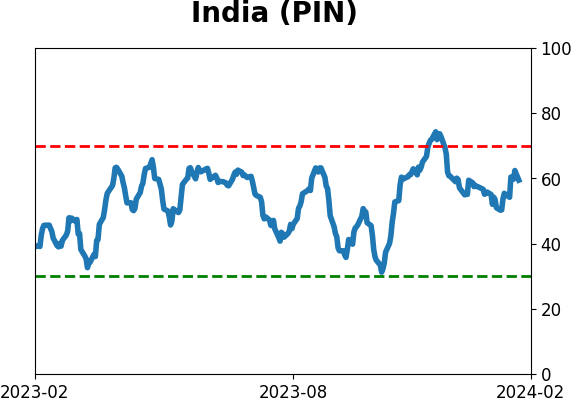
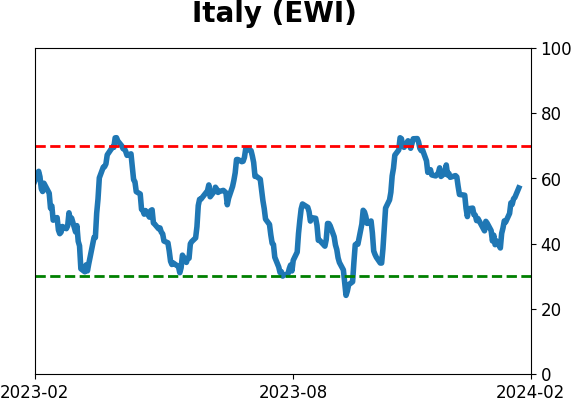
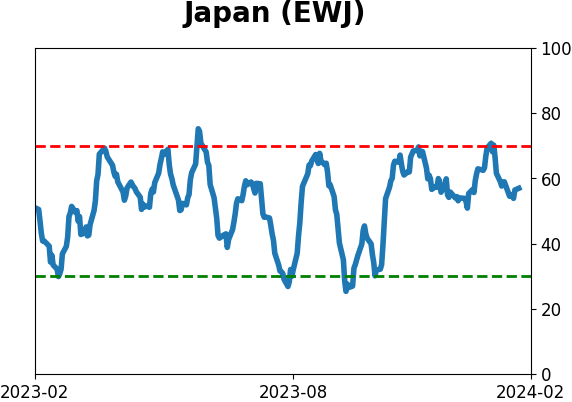
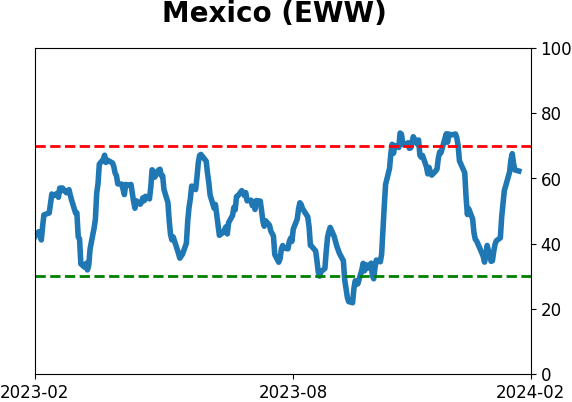
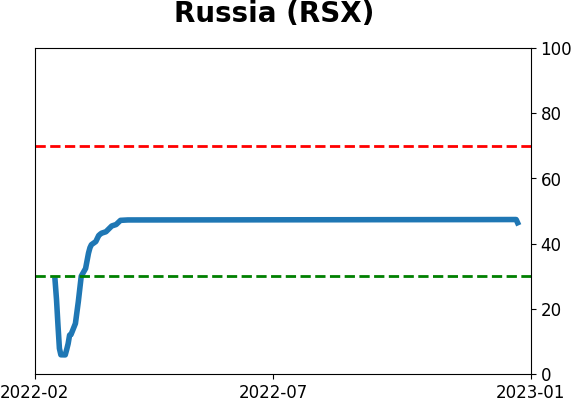
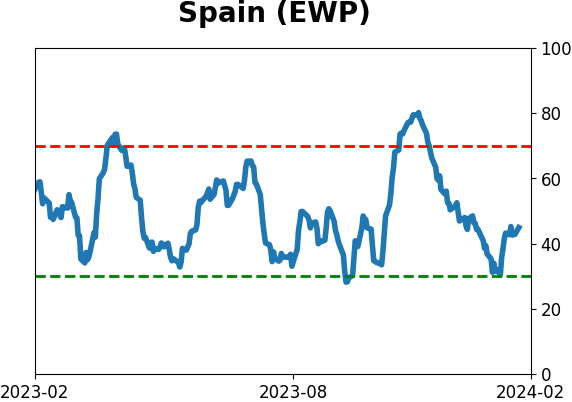
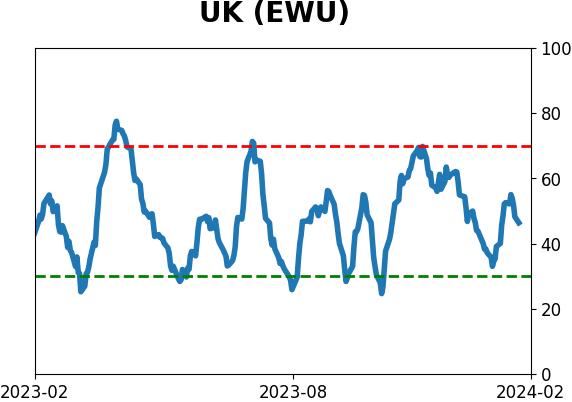
Country ETF's - 10-Day Moving Average
|
|
|
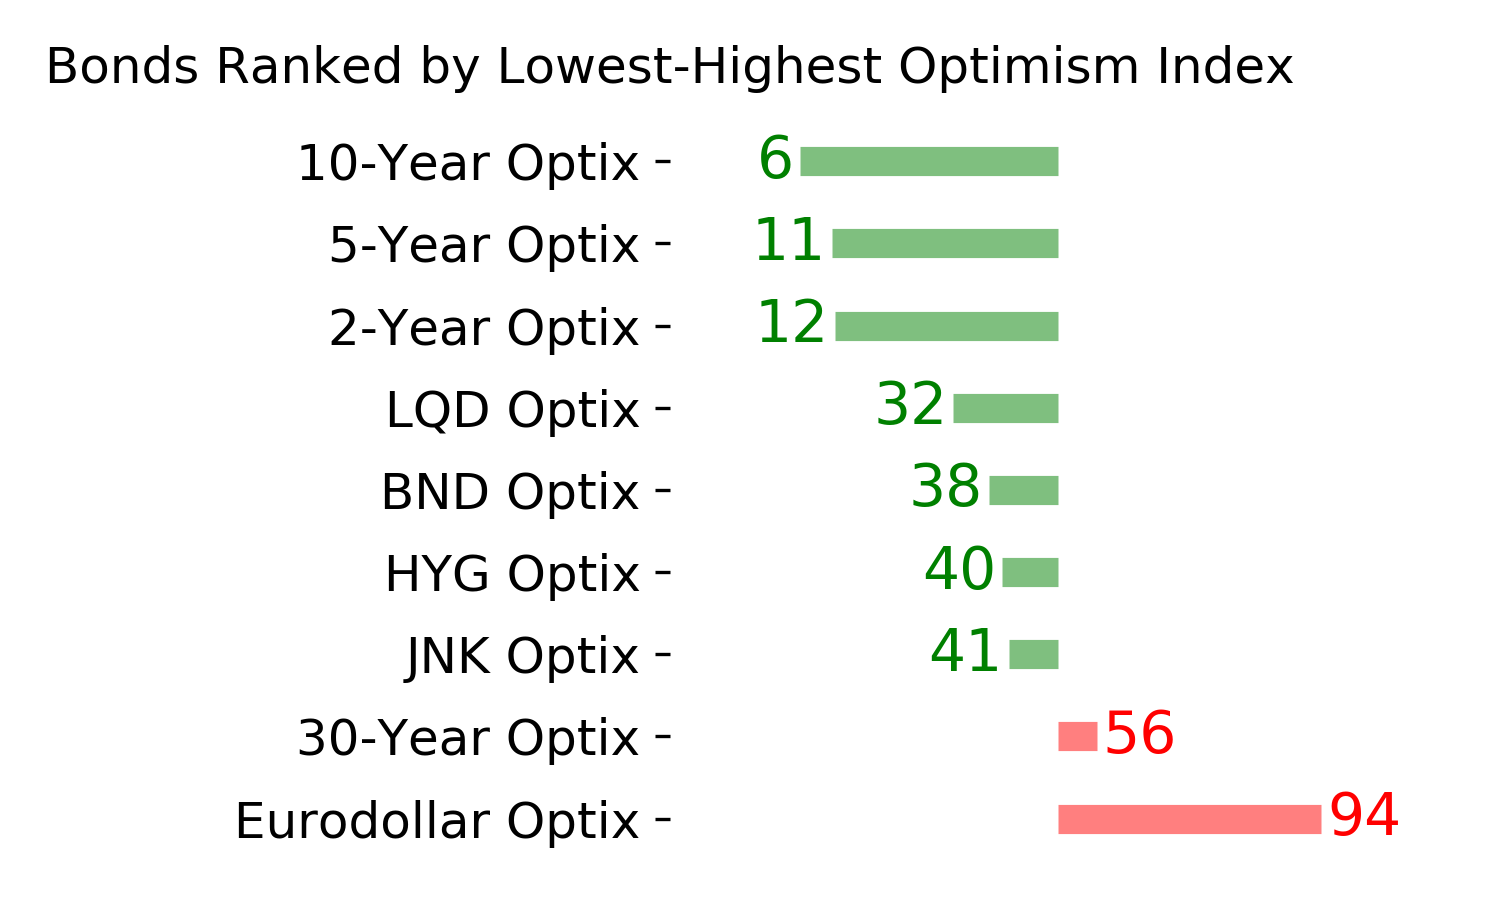
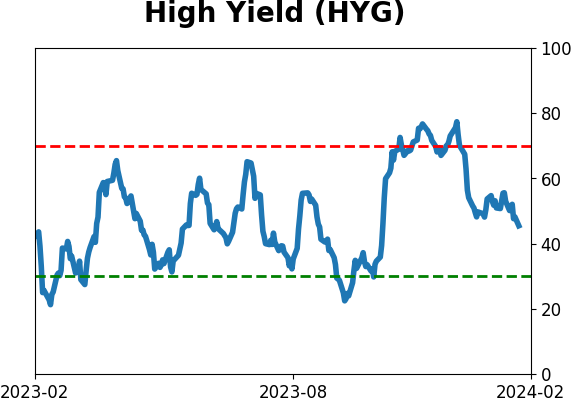
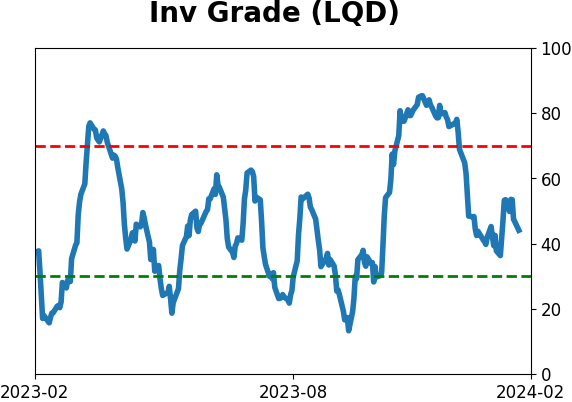
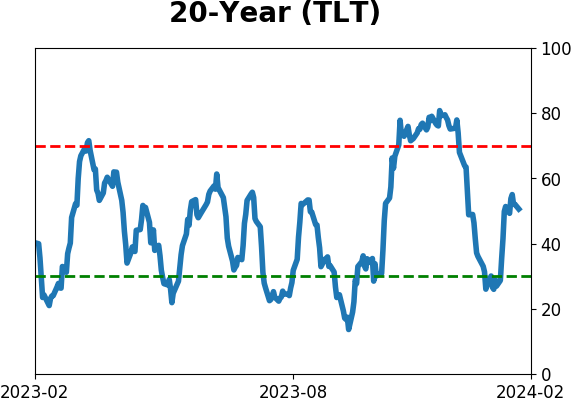
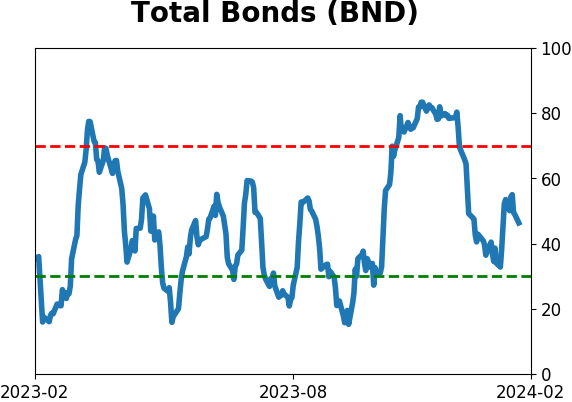
Bond ETF's - 10-Day Moving Average
|
|
|
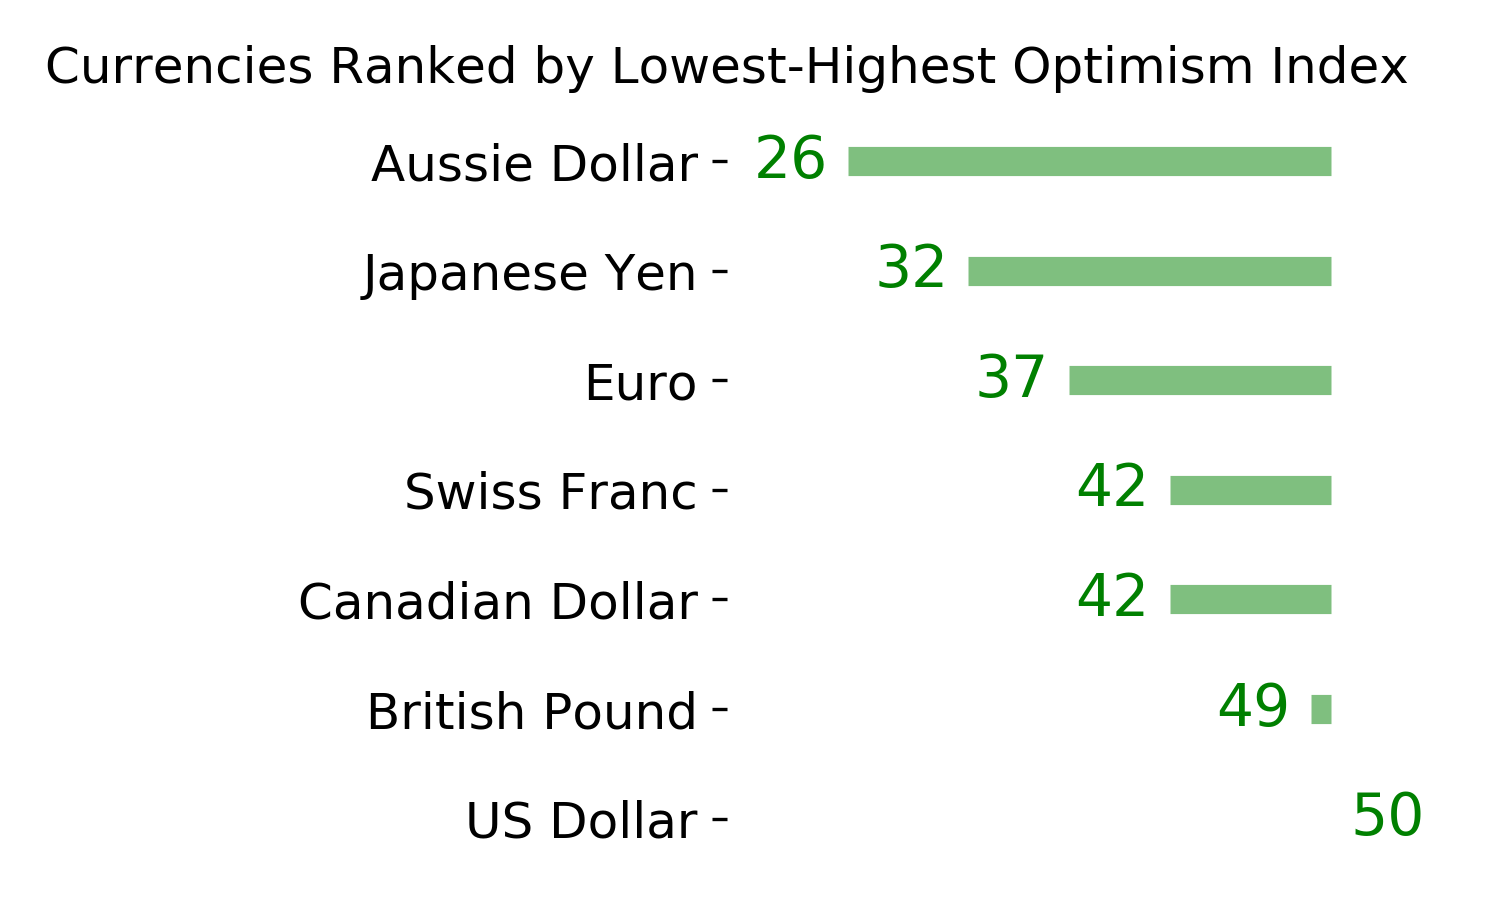
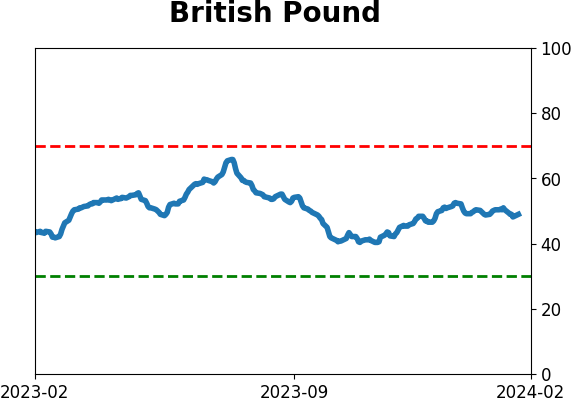
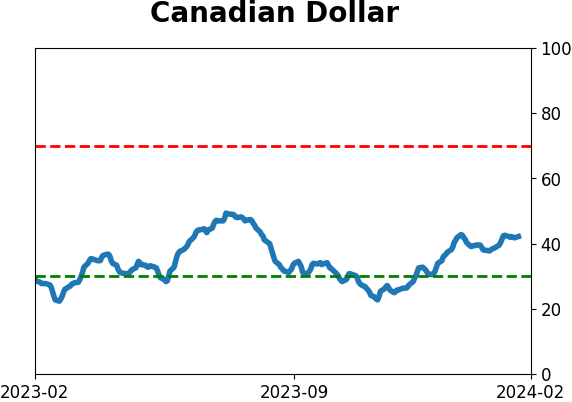
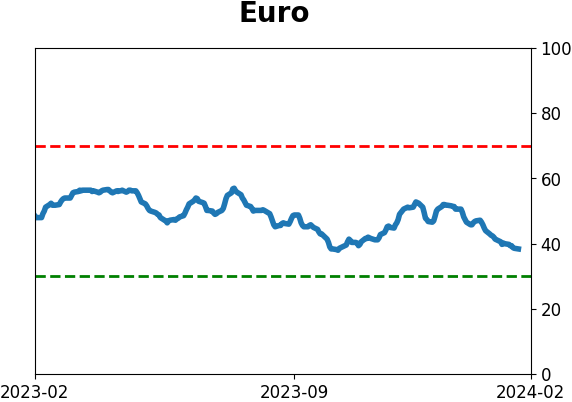
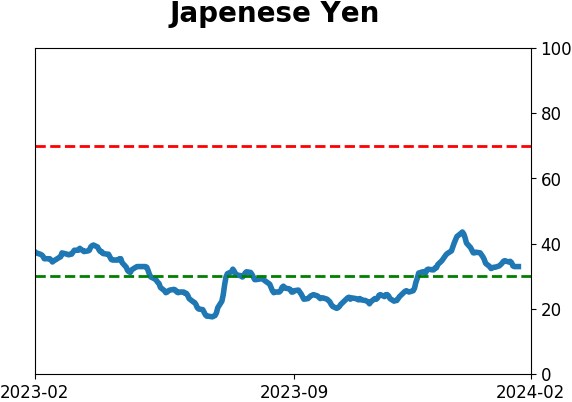
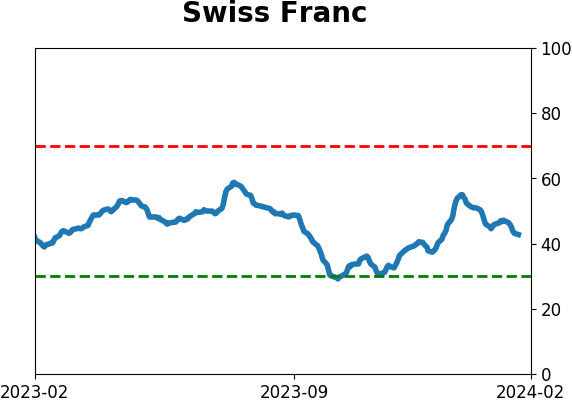
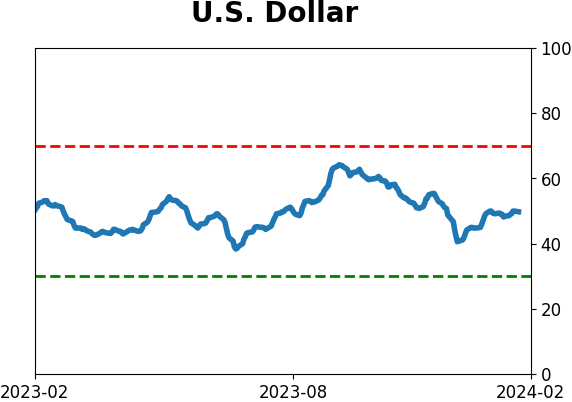
Currency ETF's - 5-Day Moving Average
|
|
|
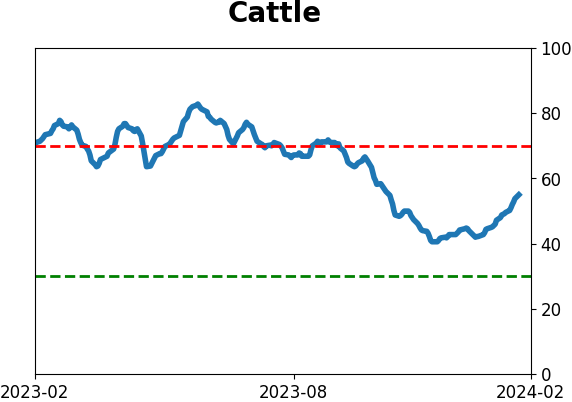
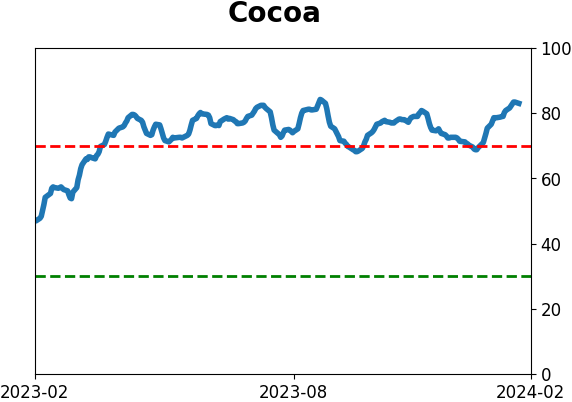
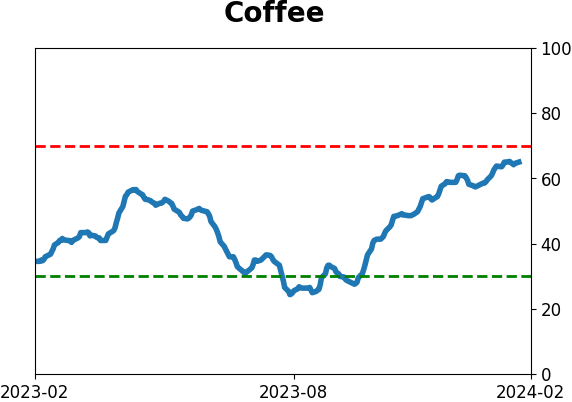
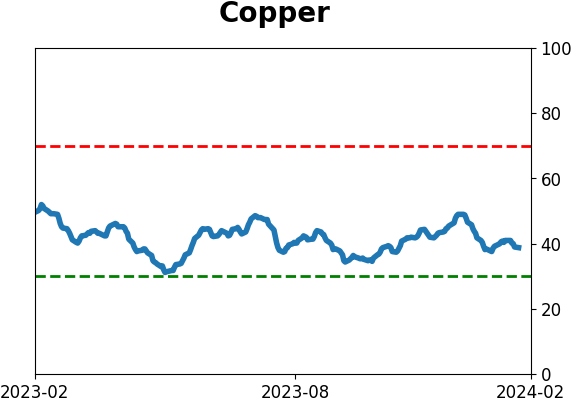
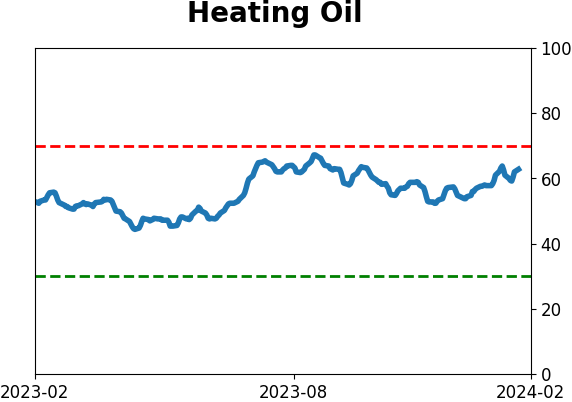
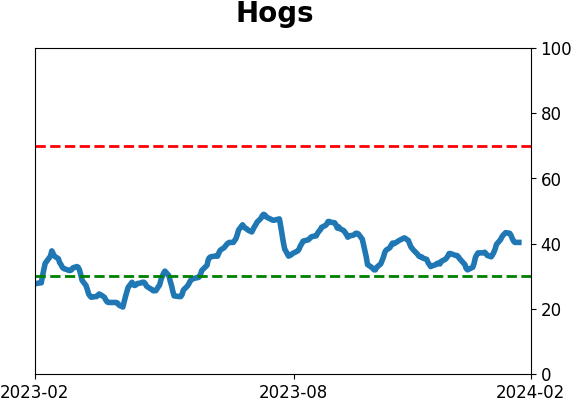
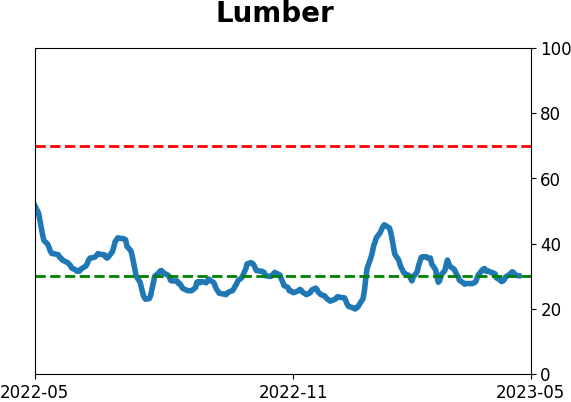
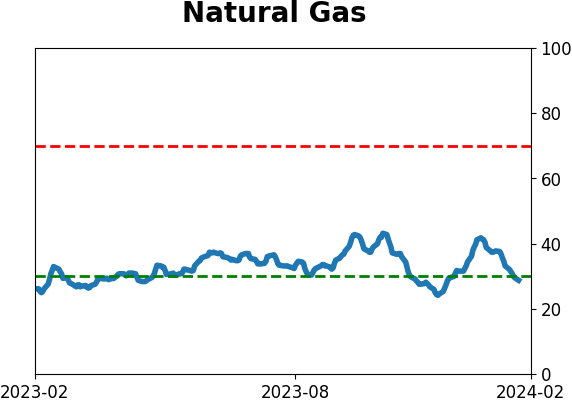
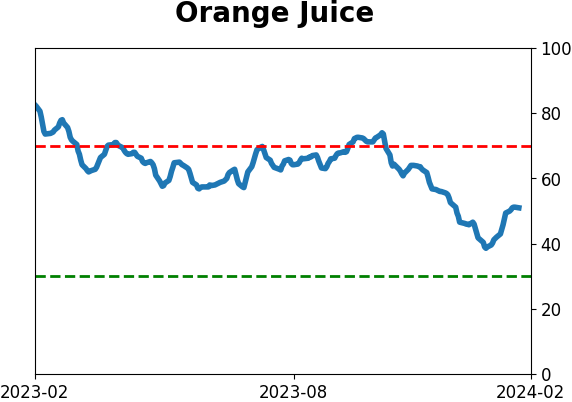
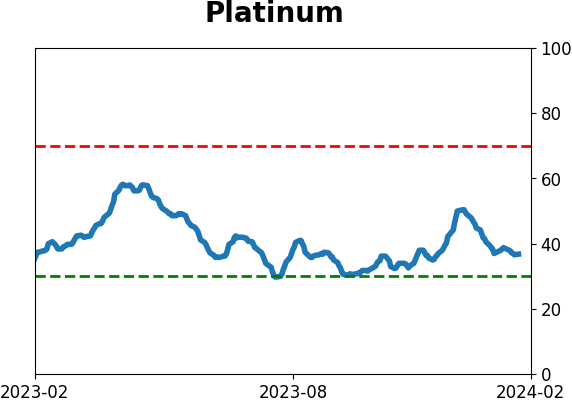
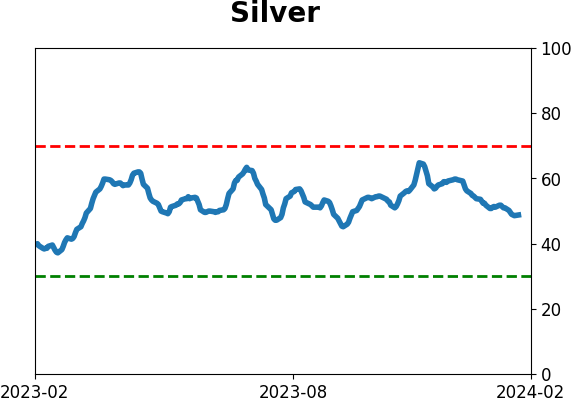
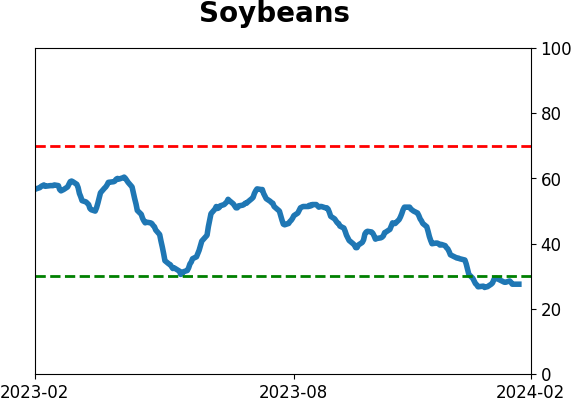
Commodity ETF's - 5-Day Moving Average
|
|