Daily Report : TradingEdge Weekly for Feb 10 - This is not bear market participation, optimism is extreme, OJ is juiced

| View/Print a PDF version of this Report |
Headlines
|
TradingEdge Weekly for Feb 10 - This is not bear market participation, optimism is extreme, OJ is juiced: This week, we saw more compelling evidence that the rise in stocks is consistent with bull market behavior. Some indicators of internal participation are showing readings never before seen during ongoing bear markets. The recovery in stocks has predictably resulted in a jump in Dumb Money Confidence. OJ is going parabolic. |
Smart / Dumb Money Confidence
|
|
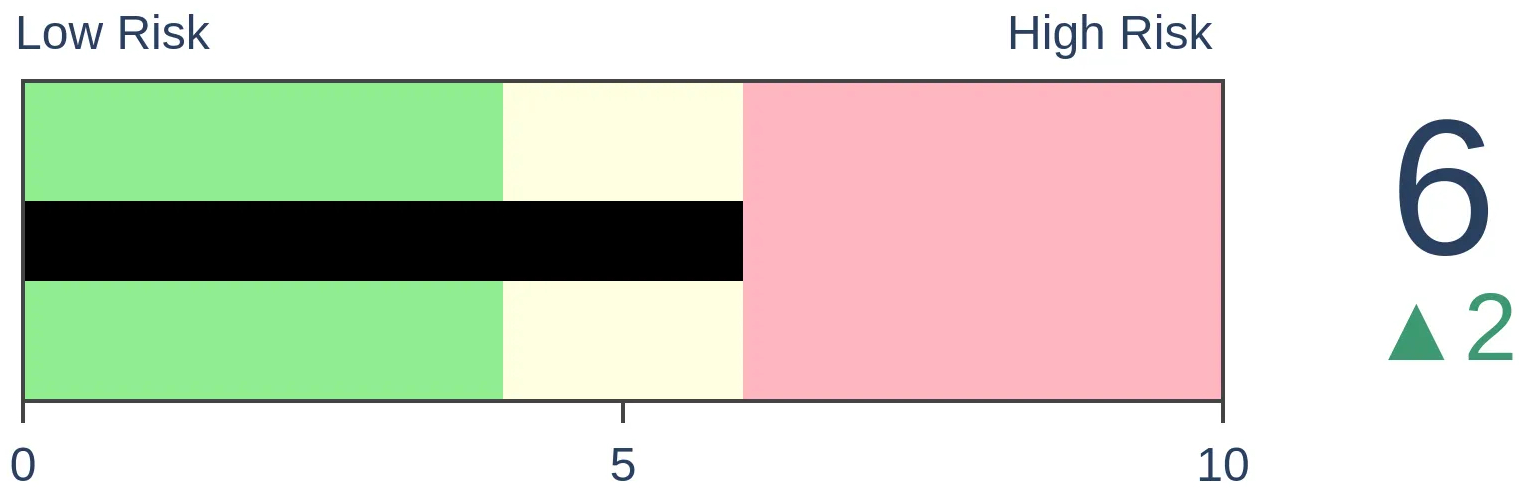
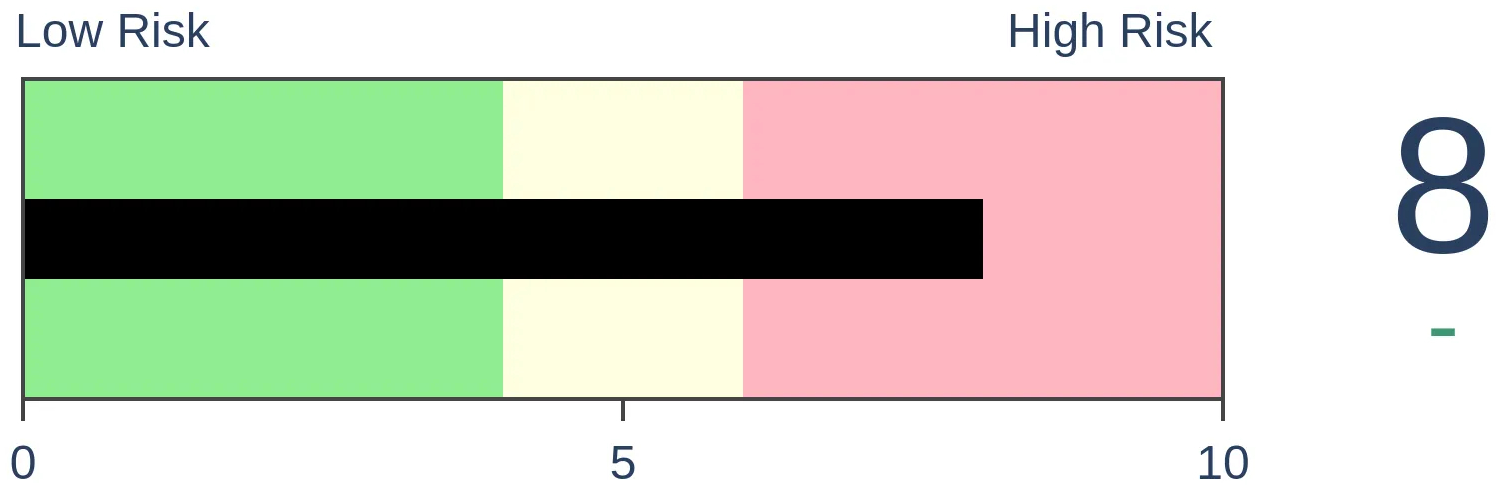
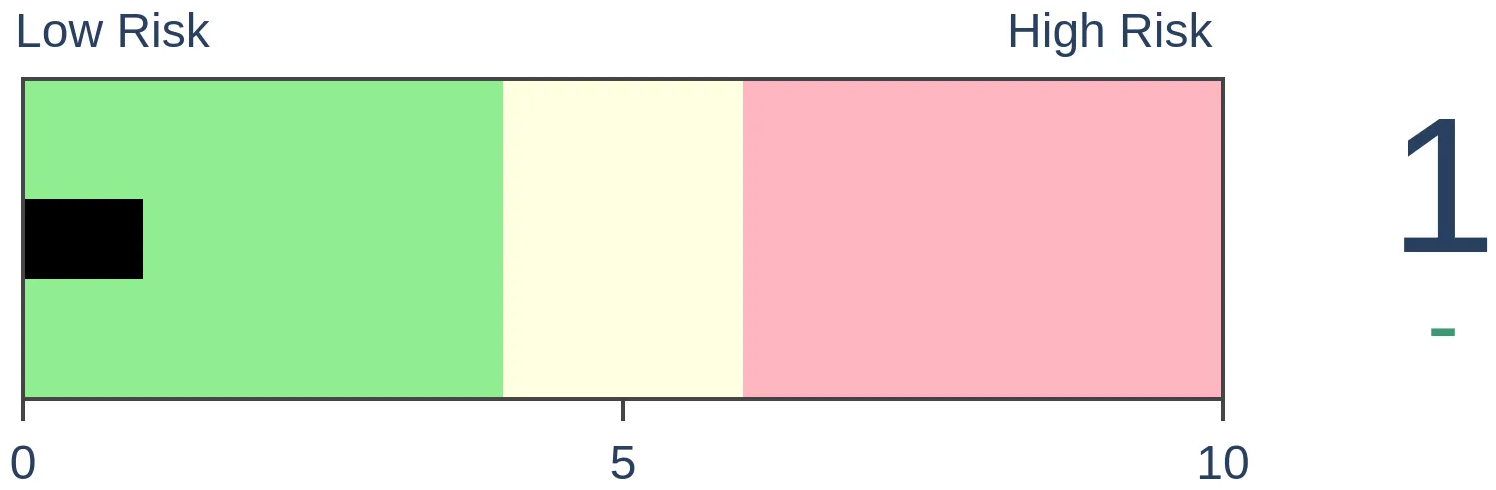
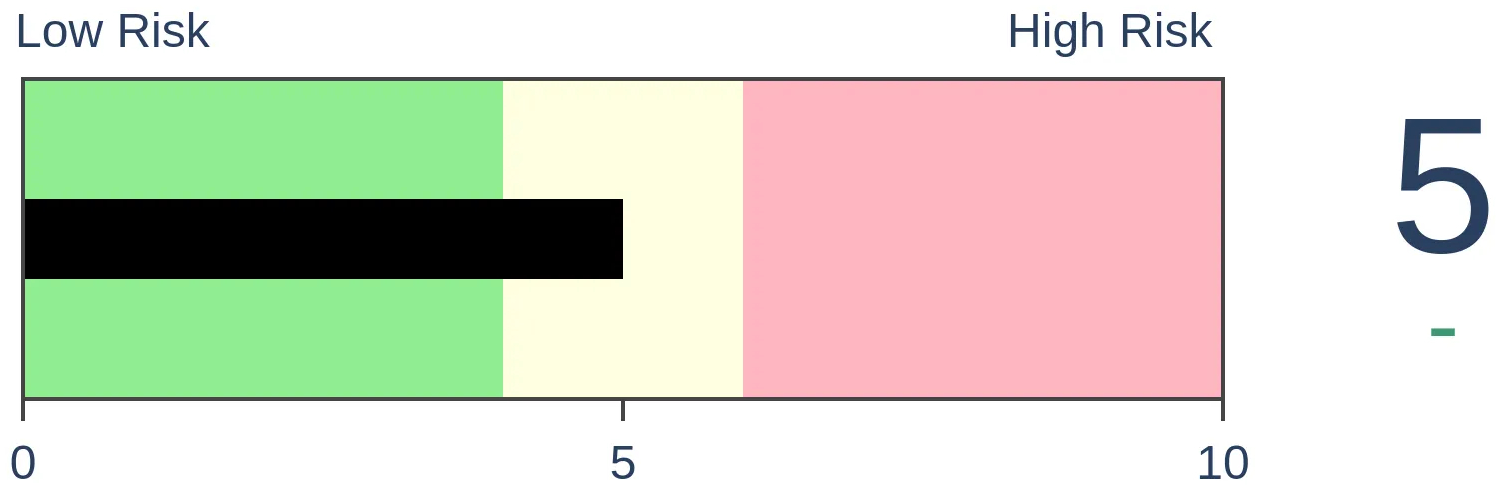
Risk Levels
|
|

|
Research
TradingEdge Weekly for Feb 10 - This is not bear market participation, optimism is extreme, OJ is juicedBy Jason GoepfertBOTTOM LINEThis week, we saw more compelling evidence that the rise in stocks is consistent with bull market behavior. Some indicators of internal participation are showing readings never before seen during ongoing bear markets. The recovery in stocks has predictably resulted in a jump in Dumb Money Confidence. OJ is going parabolic. FORECAST / TIMEFRAME |
Key points:
- Almost all major industries are in uptrends, a stark change from last fall
- The recovery in many stocks has triggered a surge in 52-week highs relative to 52-week lows
- Internal momentum has been building, with historically high readings in the McClellan Oscillator
- A longer-term and broader Summation Index has triggered a "lift off" threshold, never seen during bear markets
- Technology stocks in general have continued to recover, pushing well above long-term trends
- Even so, investors are trading stocks together, causing correlations to stay high
- The broad-based recovery in stocks pushed the spread between Dumb Money and Smart Money Confidence to an extreme
- Newsletter writers are becoming more optimistic, too
- The dollar has been plunging but some factors are lining up for a rebound
- Orange juice is going parabolic, and sentiment is following
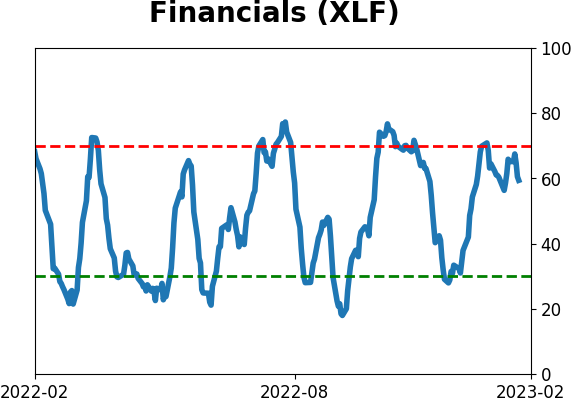
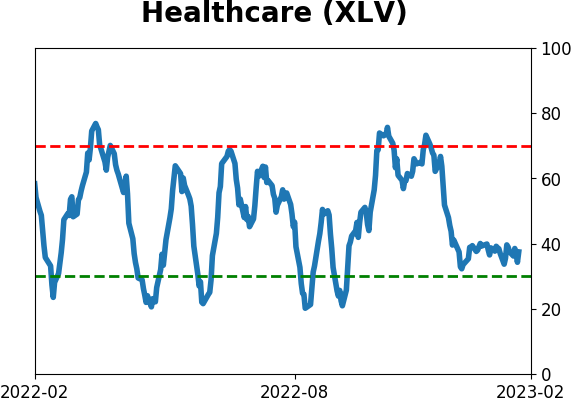
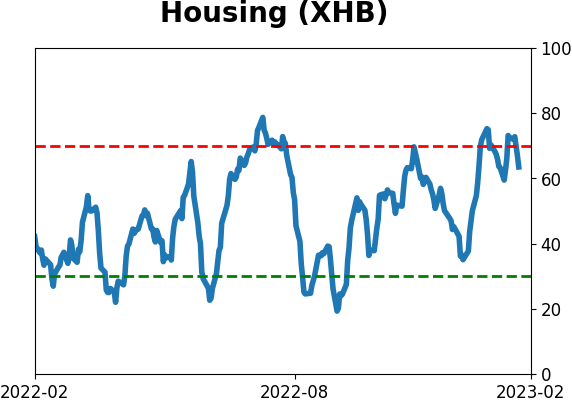
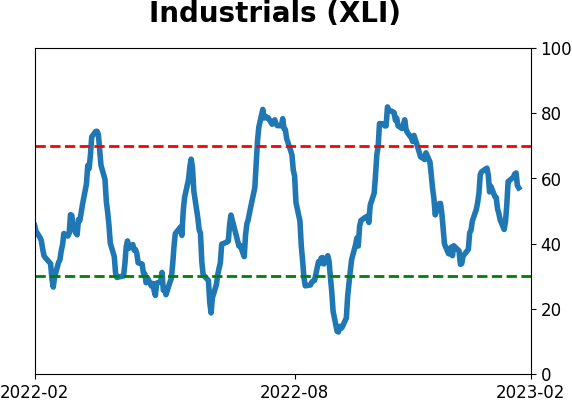
Almost all industries are in uptrends
We've seen in recent weeks how broad-based and persistent the rally over the past few months have been. It's now enough to have pushed more than 90% of sectors and industries above their 200-day moving averages.
We'll focus on the industry cycles because they are more comprehensive.The last few times when trends cycled like this, it preceded further gains.
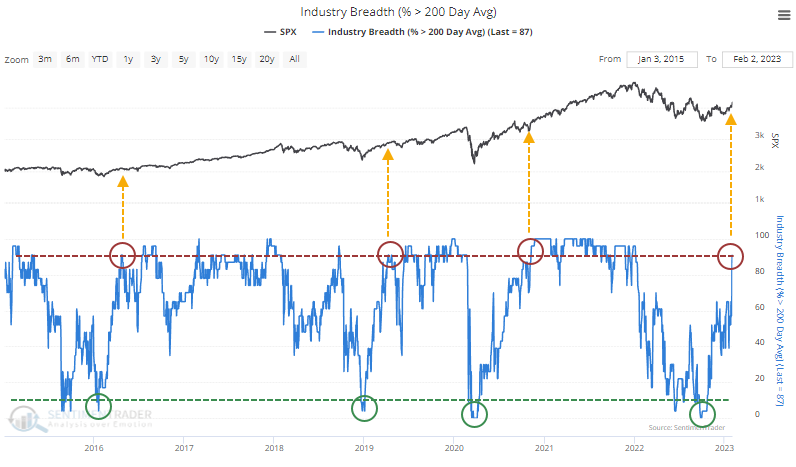
If we concentrate on the percentage of industries trading above their 200-day averages, which just exceeded 90%, this figure never exceeded 82% during the 2000-2002 and 2007-2008 bear markets. This is another data point suggesting investors' behavior now is different than it was amid the last two protracted declines.
Whenever the percentage of industries above their long-term averages cycled from fewer than 10% to more than 90%, the S&P 500 never showed a negative return over the next three or six months. Its average returns were well above average, with low risk. At no point within the next six months did any signal lose more than -5.2%.
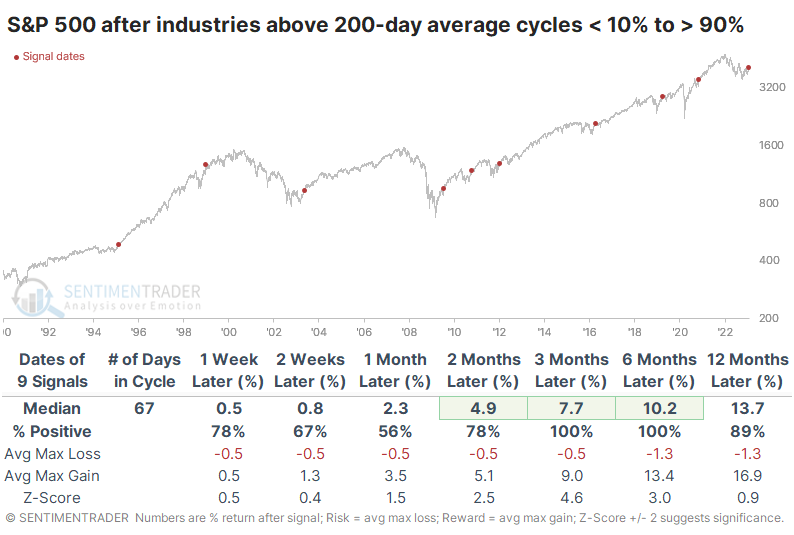
After these signals, defensive sectors were not the place to be. Utilities and Health Care show the lowest average returns, while Technology, Financial, Discretionary (and Cyclical stocks in general), and Small-Caps enjoyed the largest average returns.
Increasing uptrends led to more 52-week highs
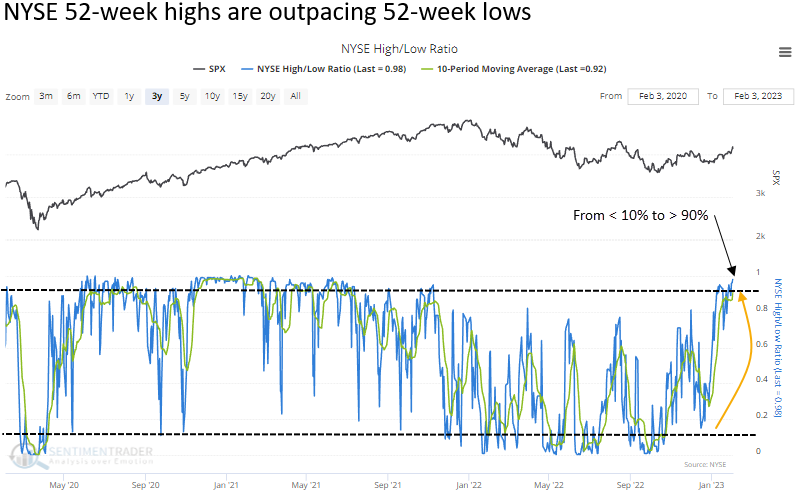
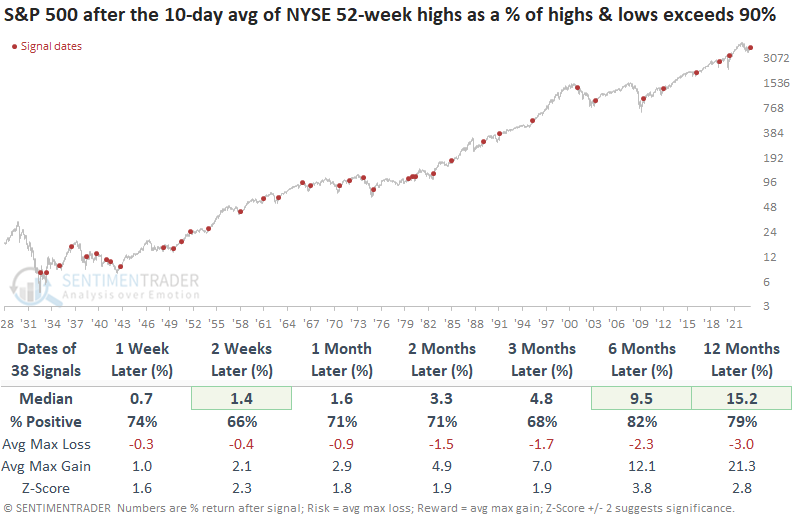
Dean showed that the 10-day average of NYSE 52-week highs as a percentage of highs and lows exceeded 90%, and when the average exceeds a high level like now, stocks tend to rise.
The NYSE, which contains stocks and bond proxies, has seen a pickup in 52-week highs relative to new lows and total issues traded. For the first time in 18 months, the 10-day moving average for NYSE 52-week highs as a percentage of highs and lows exceeded 90%. The resurgence in new highs relative to lows occurred after the average fell below 10%.
When the 10-day average of NYSE 52-week highs as a percentage of highs and lows exceeds 90%, the S&P 500 showed excellent returns over the next six and twelve months since 1942, with a few notable exceptions. Before 1942, the signal mainly struggled in the 1937-42 period.
If we measure NYSE 52-week highs as a percentage of total issues, new highs exceeded 6% last Thursday. While not exceptionally high relative to what you typically find in bull markets, the rate expanded above the highest level in over a year. When similar "breakouts" triggered, the S&P 500 consistently rises over the long term, with notable exceptions again occurring in the 1973-74 and 2000-02 bear markets.
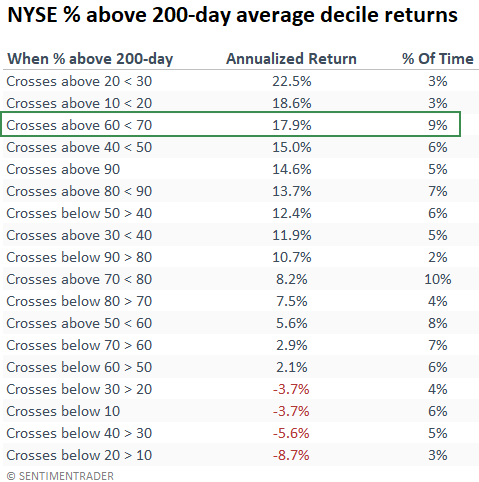
Last December, Dean highlighted the reversal in the number of NYSE common stocks trading above their 200-day average. Since that note, the percentage has continued to climb, with more than two-thirds of issues closing above their long-term average. While readings above 65% are bullish for the S&P 500, the current reading of 69% bodes well for stocks, with one of the highest annualized returns.
Internal momentum is building
Jay noted that the McClellan Oscillator uses NYSE advance/decline data to identify extreme buying and selling in the market. The McClellan Summation Index uses the daily McClellan Oscillator values to identify the market trend as well as extreme strength and weakness. Both indicators recently gave signals in the same direction.
For the first test, we run the Backtest Engine to identify those times when the indicator crosses above 90.9, including any overlapping signals. The table summarizes S&P 500 performance following these signals.
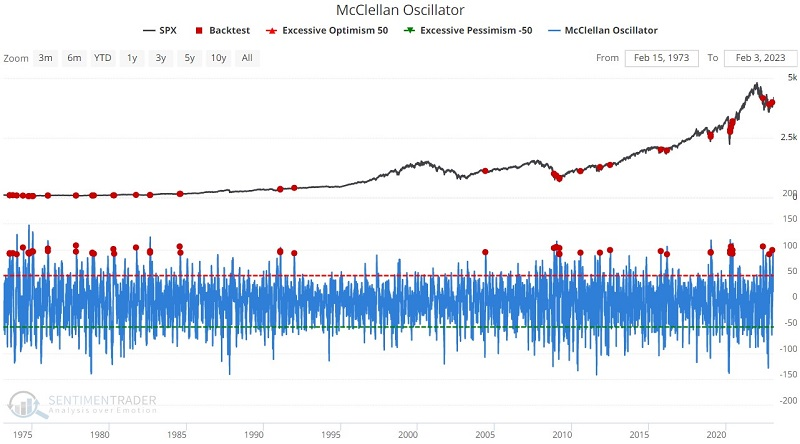
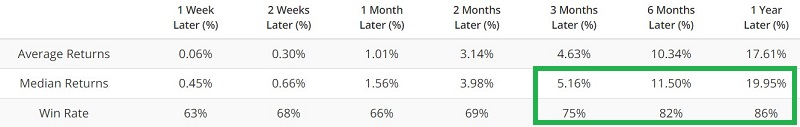
Results are quite positive, albeit with some "too early" signals in 1973-74 and 2008-09. For the next iteration, we run the same test but add the requirement that the S&P 500 must be above its 100-day moving average at the time of the McClellan Oscillator signal for it to be counted.
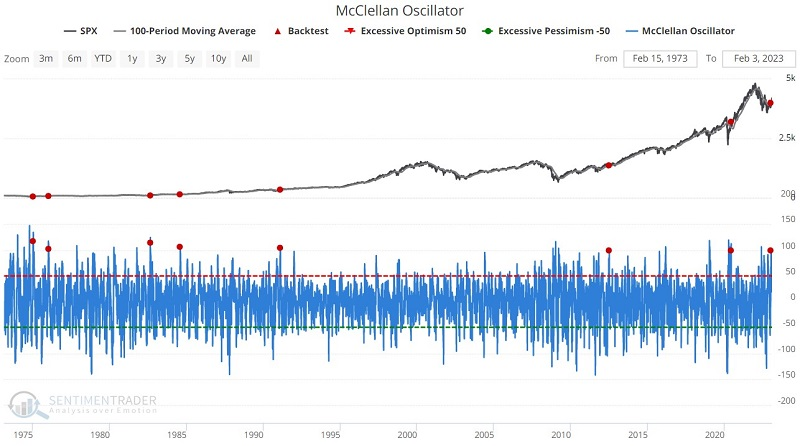
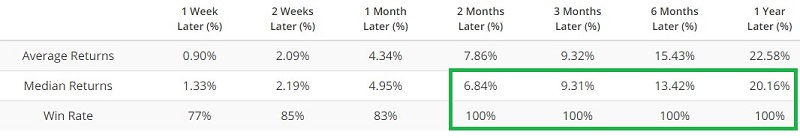
The price filter refinement cuts the number of signals down to twelve and slightly reduces the Median Return. On the plus side, the historical Win Rate for this particular iteration is 100% for two months out to 12 months.
The Summation Index gives a longer-term look at the momentum of the underlying breadth of the market by adding each day's McClellan Oscillator reading to the day before. While the two indicators stand alone, it is often meaningful when they both give favorable signals within a short period of time. The test below identifies those times when the McClellan Summation Index crosses above 1,000 for the first time in twelve months.
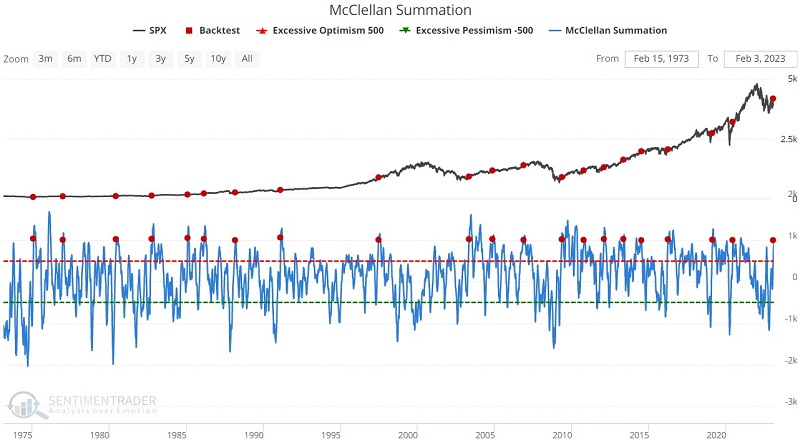
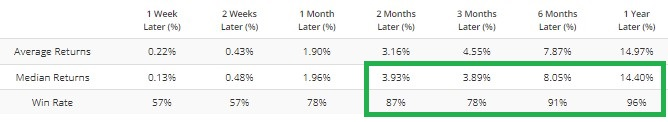
22 of 23 previous signals saw the S&P 500 gain ground over the ensuing twelve months. The one losing signal occurred in 1976.
More on the Summation Index
After plunging to one of the worst levels in 30 years, the market's internal momentum has completely reversed. As a result, the NYSE McClellan Summation Index has reached the lift-off stage.
For the first time in two years, the NYSE version of the Summation Index has crossed above +1,000 after declining below -1,000 last fall. The S&P 500's annualized returns tend to be best when the indicator is extremely low (deeply oversold) or extremely high (positive momentum). The recovery in the Summation Index occurred thanks to persistently high readings in the shorter-term Oscillator, as Jay noted earlier.
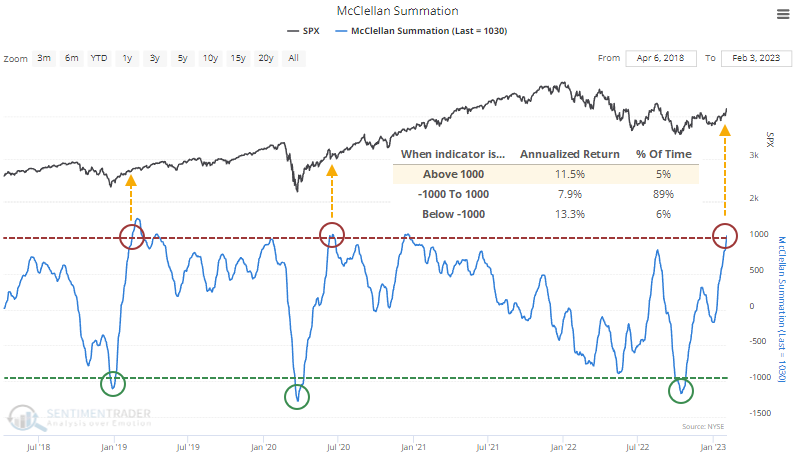
As we saw with uptrends among sectors and industries, these readings are not seen during ongoing bear markets. It did not happen during the last two bears or any before them.
The S&P 500's returns following cycles in the Summation Index from below -1,000 to above +1,000 were pristine. There was a single tiny loss three or six months later, but all showed a positive return over the following year.
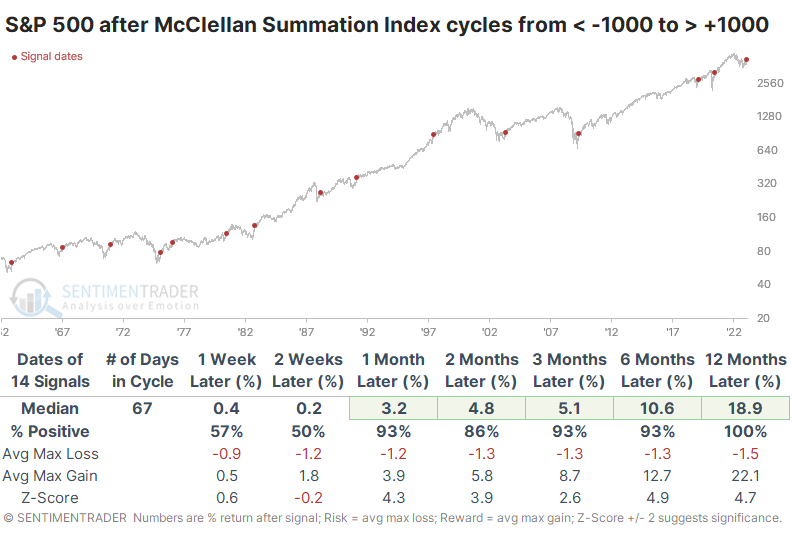
The signals enjoyed an incredible risk versus reward profile. The most significant drawdown among any signal within the next year was a modest -6.8%. At the same time, every signal saw a rally of at least +11.4%.
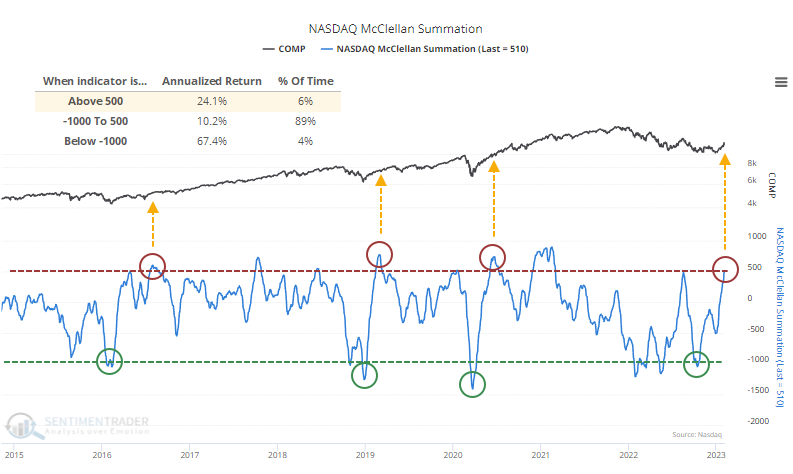
The Nasdaq McClellan Summation Index has similarly cycled from an extreme low to extreme high. There is a lot of junk on the Nasdaq exchange, so it's rare to see any breadth measures for that exchange reach levels as high as on the NYSE.
The last few times the Nasdaq's Summation Index cycled like this, it coincided with the ends of bear markets. The Composite's annualized return when the Summation Index was above +500 is a whopping +24.1% since 1986.
The improvement in internal momentum is not relegated to securities trading on the NYSE. It's also evident from multi-year highs in the Summation Indexes in the French CAC, German DAX, UK FTSE, and Hong Kong's Hang Seng.
Recovering Technology stocks are helping
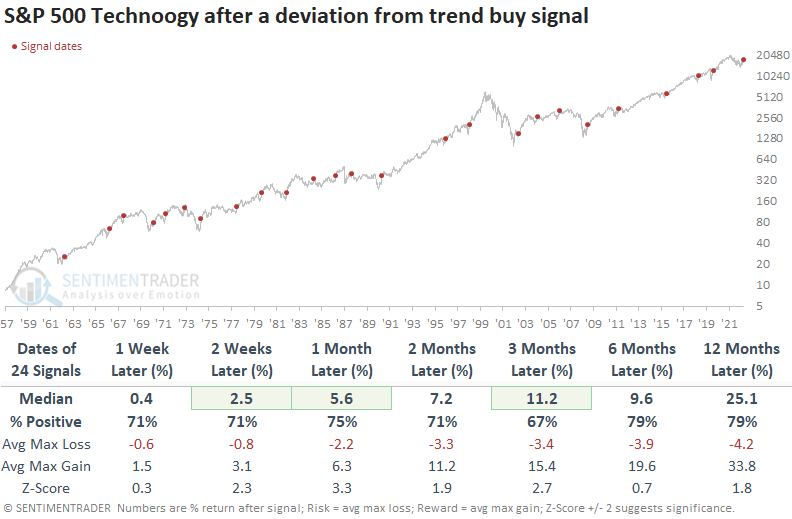
The equal-weighted S&P 500 Technology sector triggered a deviation from trend buy signal. Dean showed that after similar reversals, an equal-weighted Technology index was higher a year later 79% of the time.
The deviation from trend buy signal measures the 4-week moving average for the index relative to the 40-week average. An alert occurs when the ratio between the two averages rises above 1.04 after a reset below 0.93.
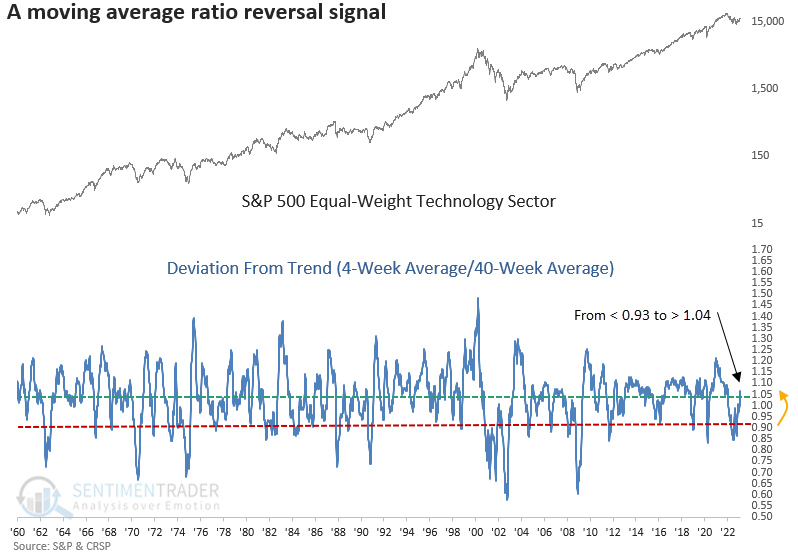
Technology typically outperforms in the early stages of a new cyclical advance. So, the new signal is a welcome development as it has occurred after most bear market lows, with only one unfortunate whipsaw alert in 1973.
Also, after closing below its 10-day moving average for more than 12 consecutive days, the cap-weighted S&P 500 Technology reversed higher and registered 21 consecutive sessions above the average, triggering a buy signal for the sector. Since 1979, these signals have shown a profit in every case at some point in the next six months. Similar to the deviation signal, the only whipsaw alert occurred n 1973.
Even as stocks recover, many of them are trading together
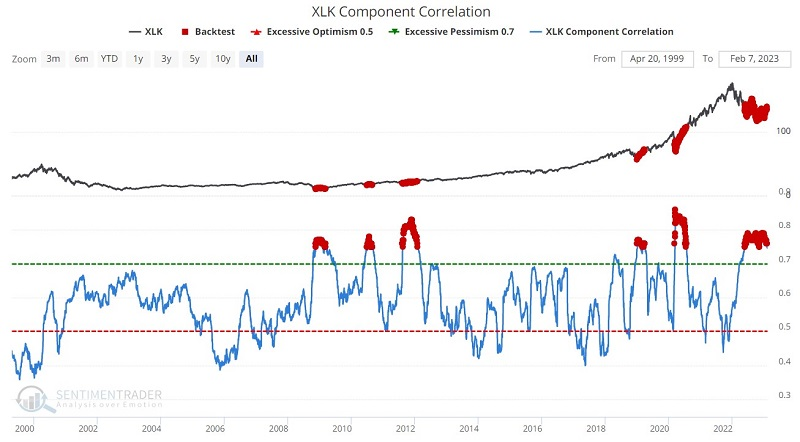
Component correlation measures the degree to which the stocks in an industry group are trading in a similar manner, and high correlation tends to presage price strength because investors are panicking without regard to individual stocks' merits. Jay showed that a number of key industries continue to show favorable readings.
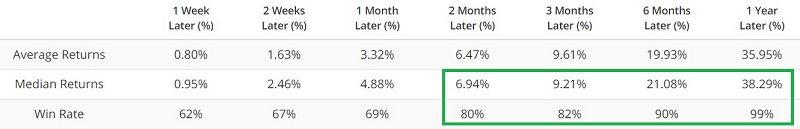
The chart and table below highlight the performance of the Technology Select Sector SPDR Fund ETF (ticker XLK) following those days when the XLK Component Correlation was above 0.75. All the signals triggered after the financial crisis, but even so, XLK's average returns were impressive.
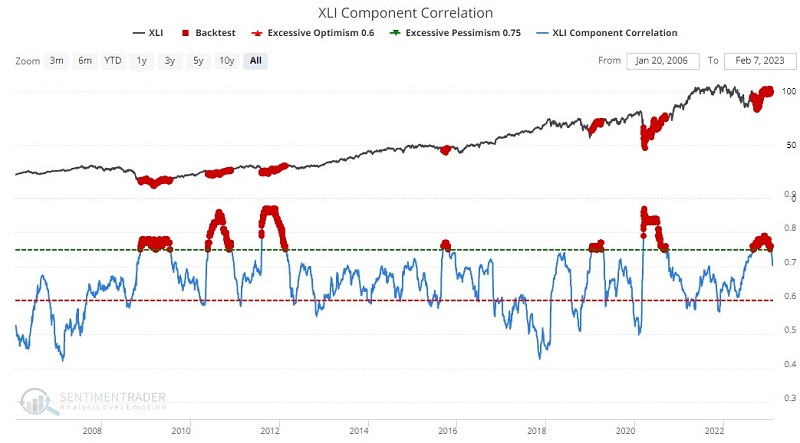
Among other sectors, Industrial stocks are still showing high correlation. The chart and table below highlight the performance of the Industrial Select Sector SPDR Fund ETF (ticker XLI) following those days when the XLE Component Correlation was above 0.75. Similar to XLK, XLI showed very strong average returns.
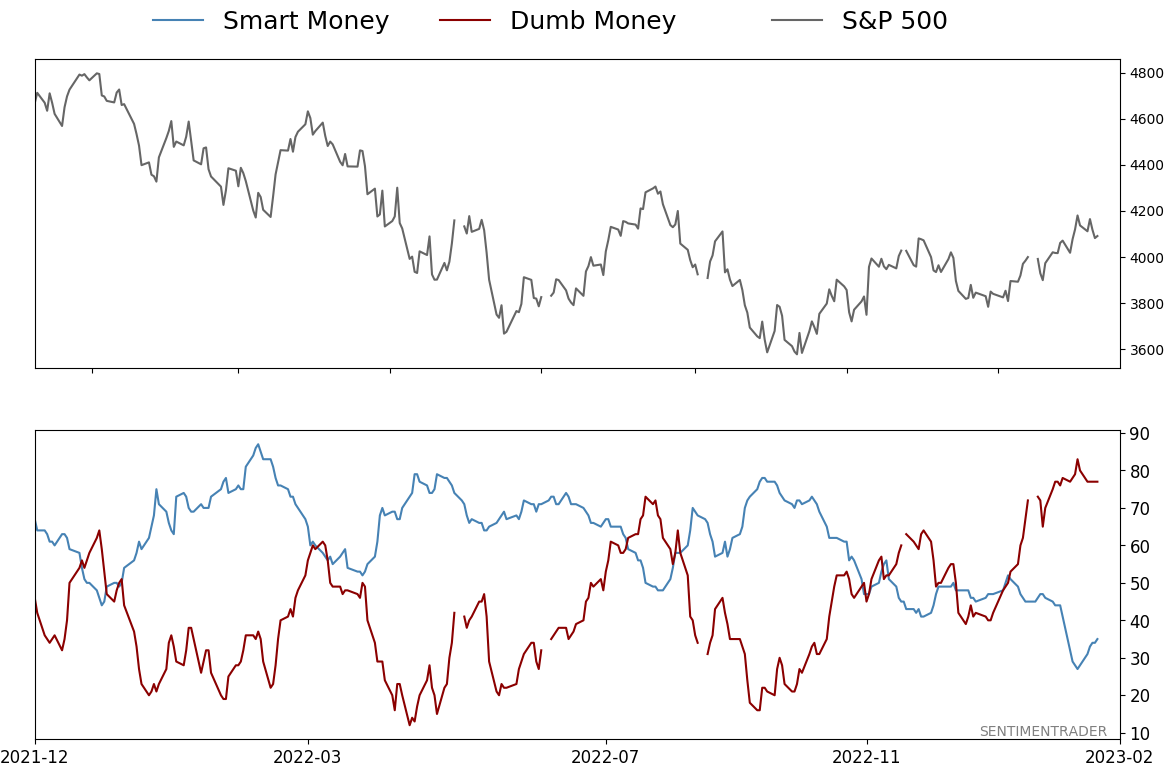
The stock market recovery has pushed sentiment to an extreme
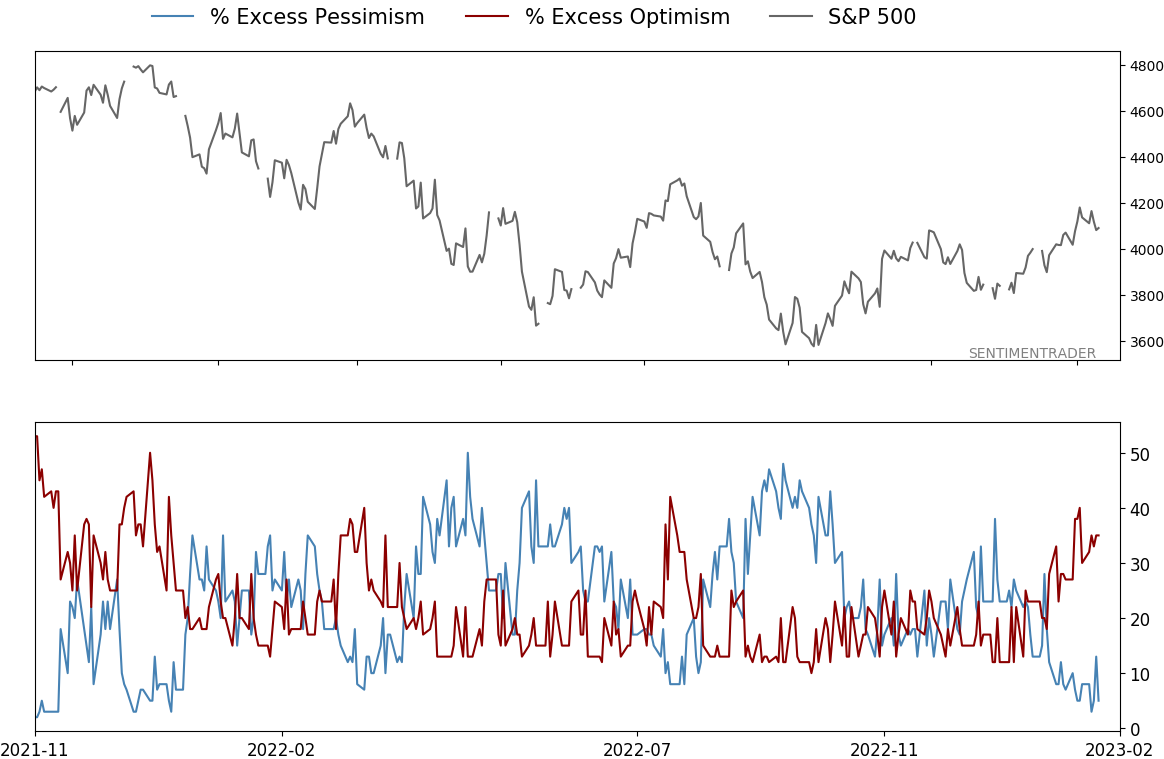
Early last October, investors were in full-on panic mode. Dumb Money (mostly trend-followers) was selling ferociously, while Smart Money (mostly corporate insiders and institutional traders) was buying.
Since then, a persistent and remarkably broad-based rally in financial assets has dramatically shifted sentiment. The Spread between Dumb Money and Smart Money confidence in a further rally has fully cycled from one extreme to the other.
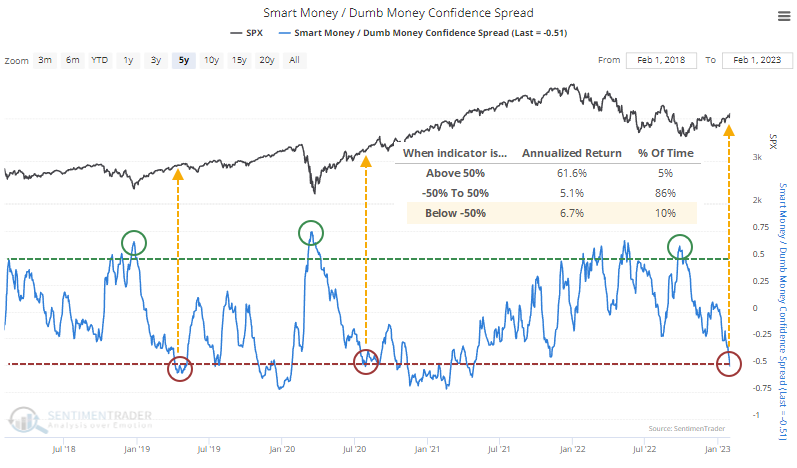
The Backtest Engine shows that when the Spread is very high (Dumb Money is selling and Smart Money is buying), forward returns in the S&P 500 have been consistently positive. But the opposite is also true. When the Spread is very negative, the S&P's returns have also been quite positive.
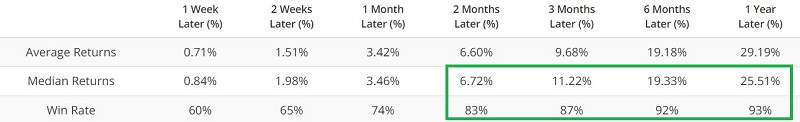
Well, that sounds pretty useless. If returns are above-average, whether the model is at either extreme, then what's the point? But it gets down to the heart of what we've been highlighting for 20 years - sentiment works differently in bull and bear markets. Since we began computing this in 1998, whenever the Spread was below -0.5, the S&P 500 was positive over the next year 93% of the time, averaging 12.3%.
Perhaps the best way to look at this is by comparing it to other sentiment cycles. These are times when the Spread cycled from above +0.5 to below -0.5, from deep pessimism to high optimism.
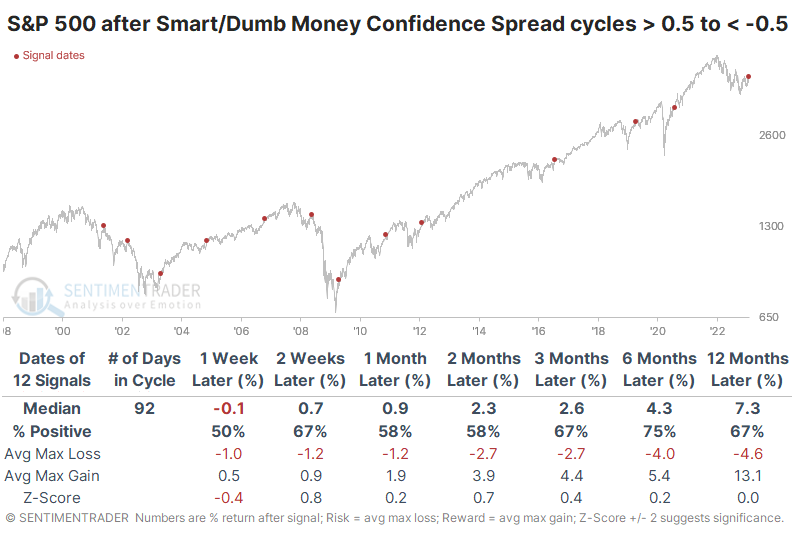
Over the next six months, the S&P showed a positive return after 9 of the 12 cycles. What seems notable is that the three outright failures all failed immediately. While a negative return over the next 1-2 weeks did not guarantee a negative long-term return, a negative long-term return was precipitated by a negative short-term return each time.
More evidence of returning bullishness
Dean further noted that sentiment among newsletter writers has recovered from near the bottom of its all-time range to the upper 40% of it.
Investors Intelligence released the latest sentiment data this week, with one component, the % bulls survey, climbing to the highest level in more than a year. The recovery occurred from a level typically associated with significant stock market lows. Relative to all other values since the inception of the data, the percent rank cycled from < 10% to > 60%.
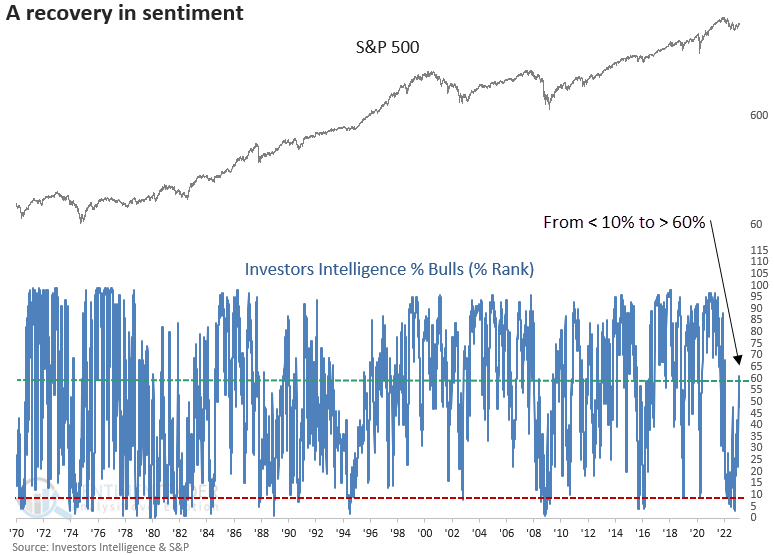
When the % rank for the II % bulls survey cycles from < 10% to > 60%, the S&P 500 tends to see some follow-through in the near term. However, the 2-month window suggests the market could consolidate its recent gains. A year later, looks excellent, with only two untimely signals. Interestingly, they both occurred in an inflation/rate environment similar to today.
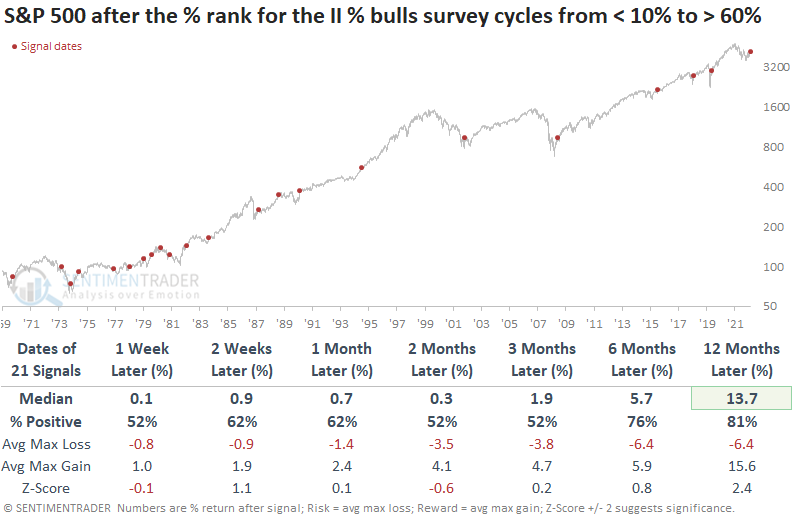
The potential for a market consolidation looks even more pronounced when applied to sectors, with 6 out of 10 cap-weighted groups showing either flat or negative returns at the 2-month mark.
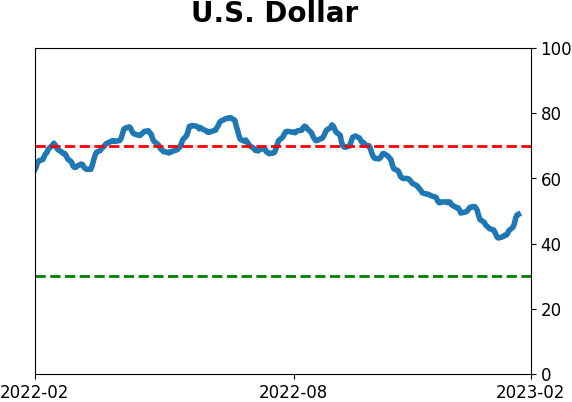
Betting on a rebounding dollar
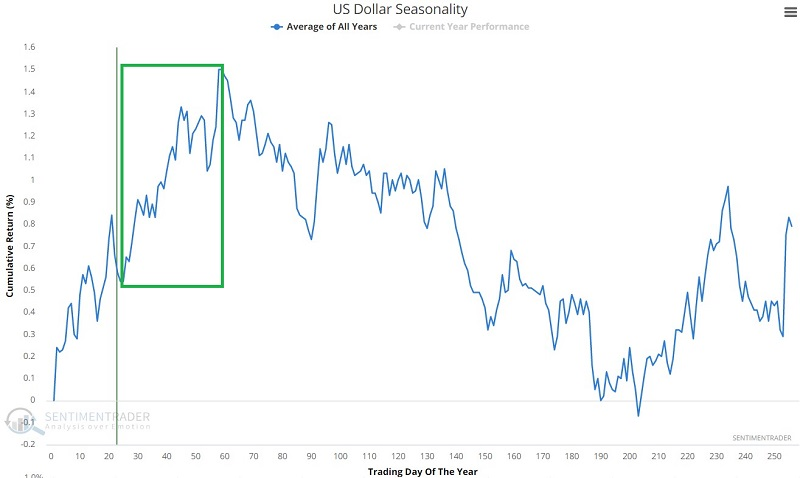
The U.S. Dollar enjoyed a great run from May 2021 into September 2022. Jay noted that a number of factors suggest the potential for a surprise rebound for the buck.
The chart below displays the annual seasonal trend for U.S. dollar futures. Since 1980, the dollar has advanced 61% of the time and declined 39% of the time between Trading Day of Year (TDY) #25 and TDY #58. For 2023, this period extends from the close on 2023-02-06 through 2023-03-23.
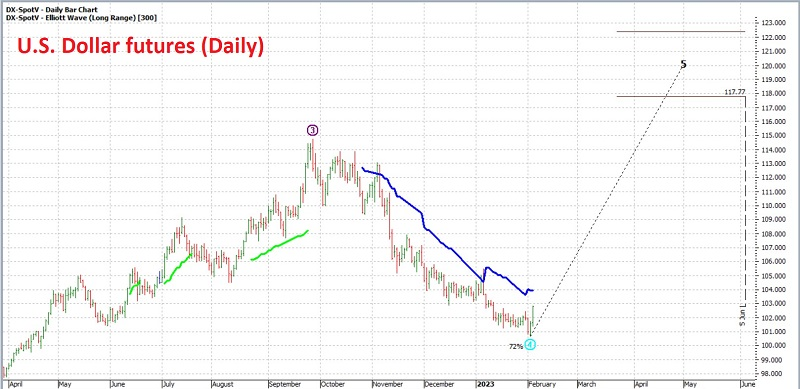
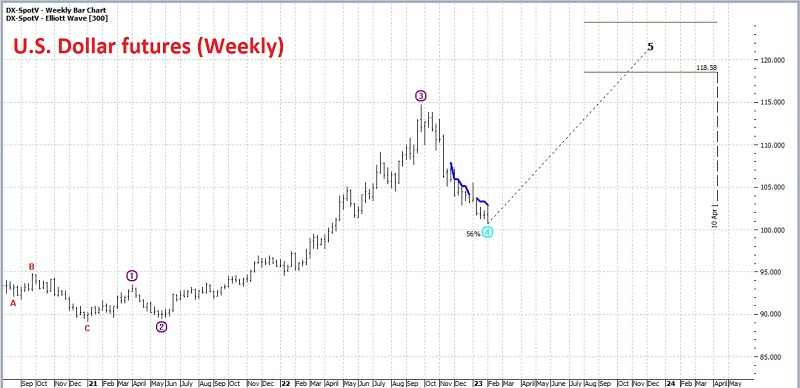
Elliot Wave theory is founded in the notion that things in nature (including prices) move in 5 waves up - three up, two down alternatingly, and then five waves down - three down and two up.
The two charts below (courtesy of ProfitSource) display a daily and weekly chart for U.S. dollar futures with the daily and weekly Elliott Wave count drawn, respectively. The wave counts - for better or worse - are generated using an objective algorithm rather than someone's subjective interpretation, and both daily and weekly charts are pointing to a Wave 5 higher.
Jay also highlighted a couple of technical indicators that are showing bullish divergences versus the price action.
An alternative for non-futures traders to trade a potential rebound is to buy shares of ticker UUP, which trade like shares of stock. But for sake of example, let's assume a trader wants exposure to a long position in the U.S. dollar but is not willing to risk much money on this trade. One potential example trade involves a bull call spread strategy using options on ticker UUP.
Our example position involves:
- Buying the UUP June16 2023 28 strike price call @ $0.86
- Selling the UUP June16 2023 31 strike price call @ $0.12
The particulars for this position and the risk curves (risk curves display the expected profit or loss as of a given date based on the price of UUP shares at that time) appear in the chart below (courtesy of Optionsnalysis.com).
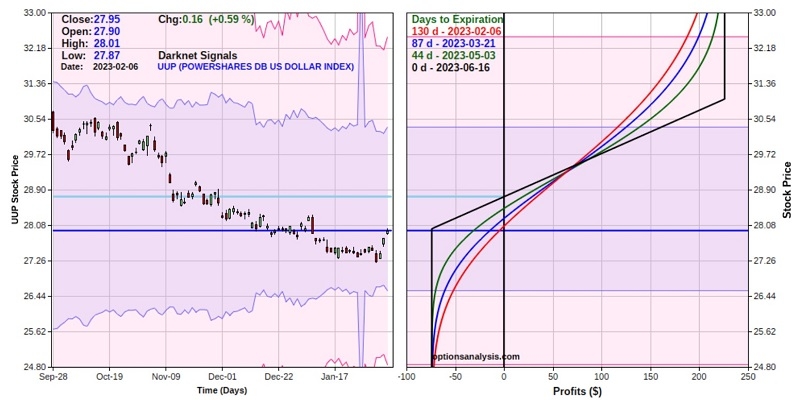
The cost to enter the trade - and the maximum risk - is $74 per 1-lot. A trader with a $25K account willing to risk 2% (or $500) on a single trade could buy a 6-lot and risk $444. The maximum profit potential on the trade is $226 per 1-lot and would be achieved if the trade were held until expiration and UUP was above $31 a share at that time. The breakeven price for the trade at option expiration is $28.74.
There are no hard and fast rules for managing a bull call spread. In general, a trader should consider what level of profit he or she would be willing to accept and/or what price level on UUP, or what level on another indicator, might suggest profit-taking is in order.
On the downside, the trader should decide in advance how they will react if UUP declines in price after the trade is entered. Just below the recent low of $27.22 a share is a natural stop-loss level. However, if a trader thinks the dollar will rally in the next several months and the total dollar commitment is within their acceptable dollar loss range, they can let it ride even if the recent UUP low is taken out.
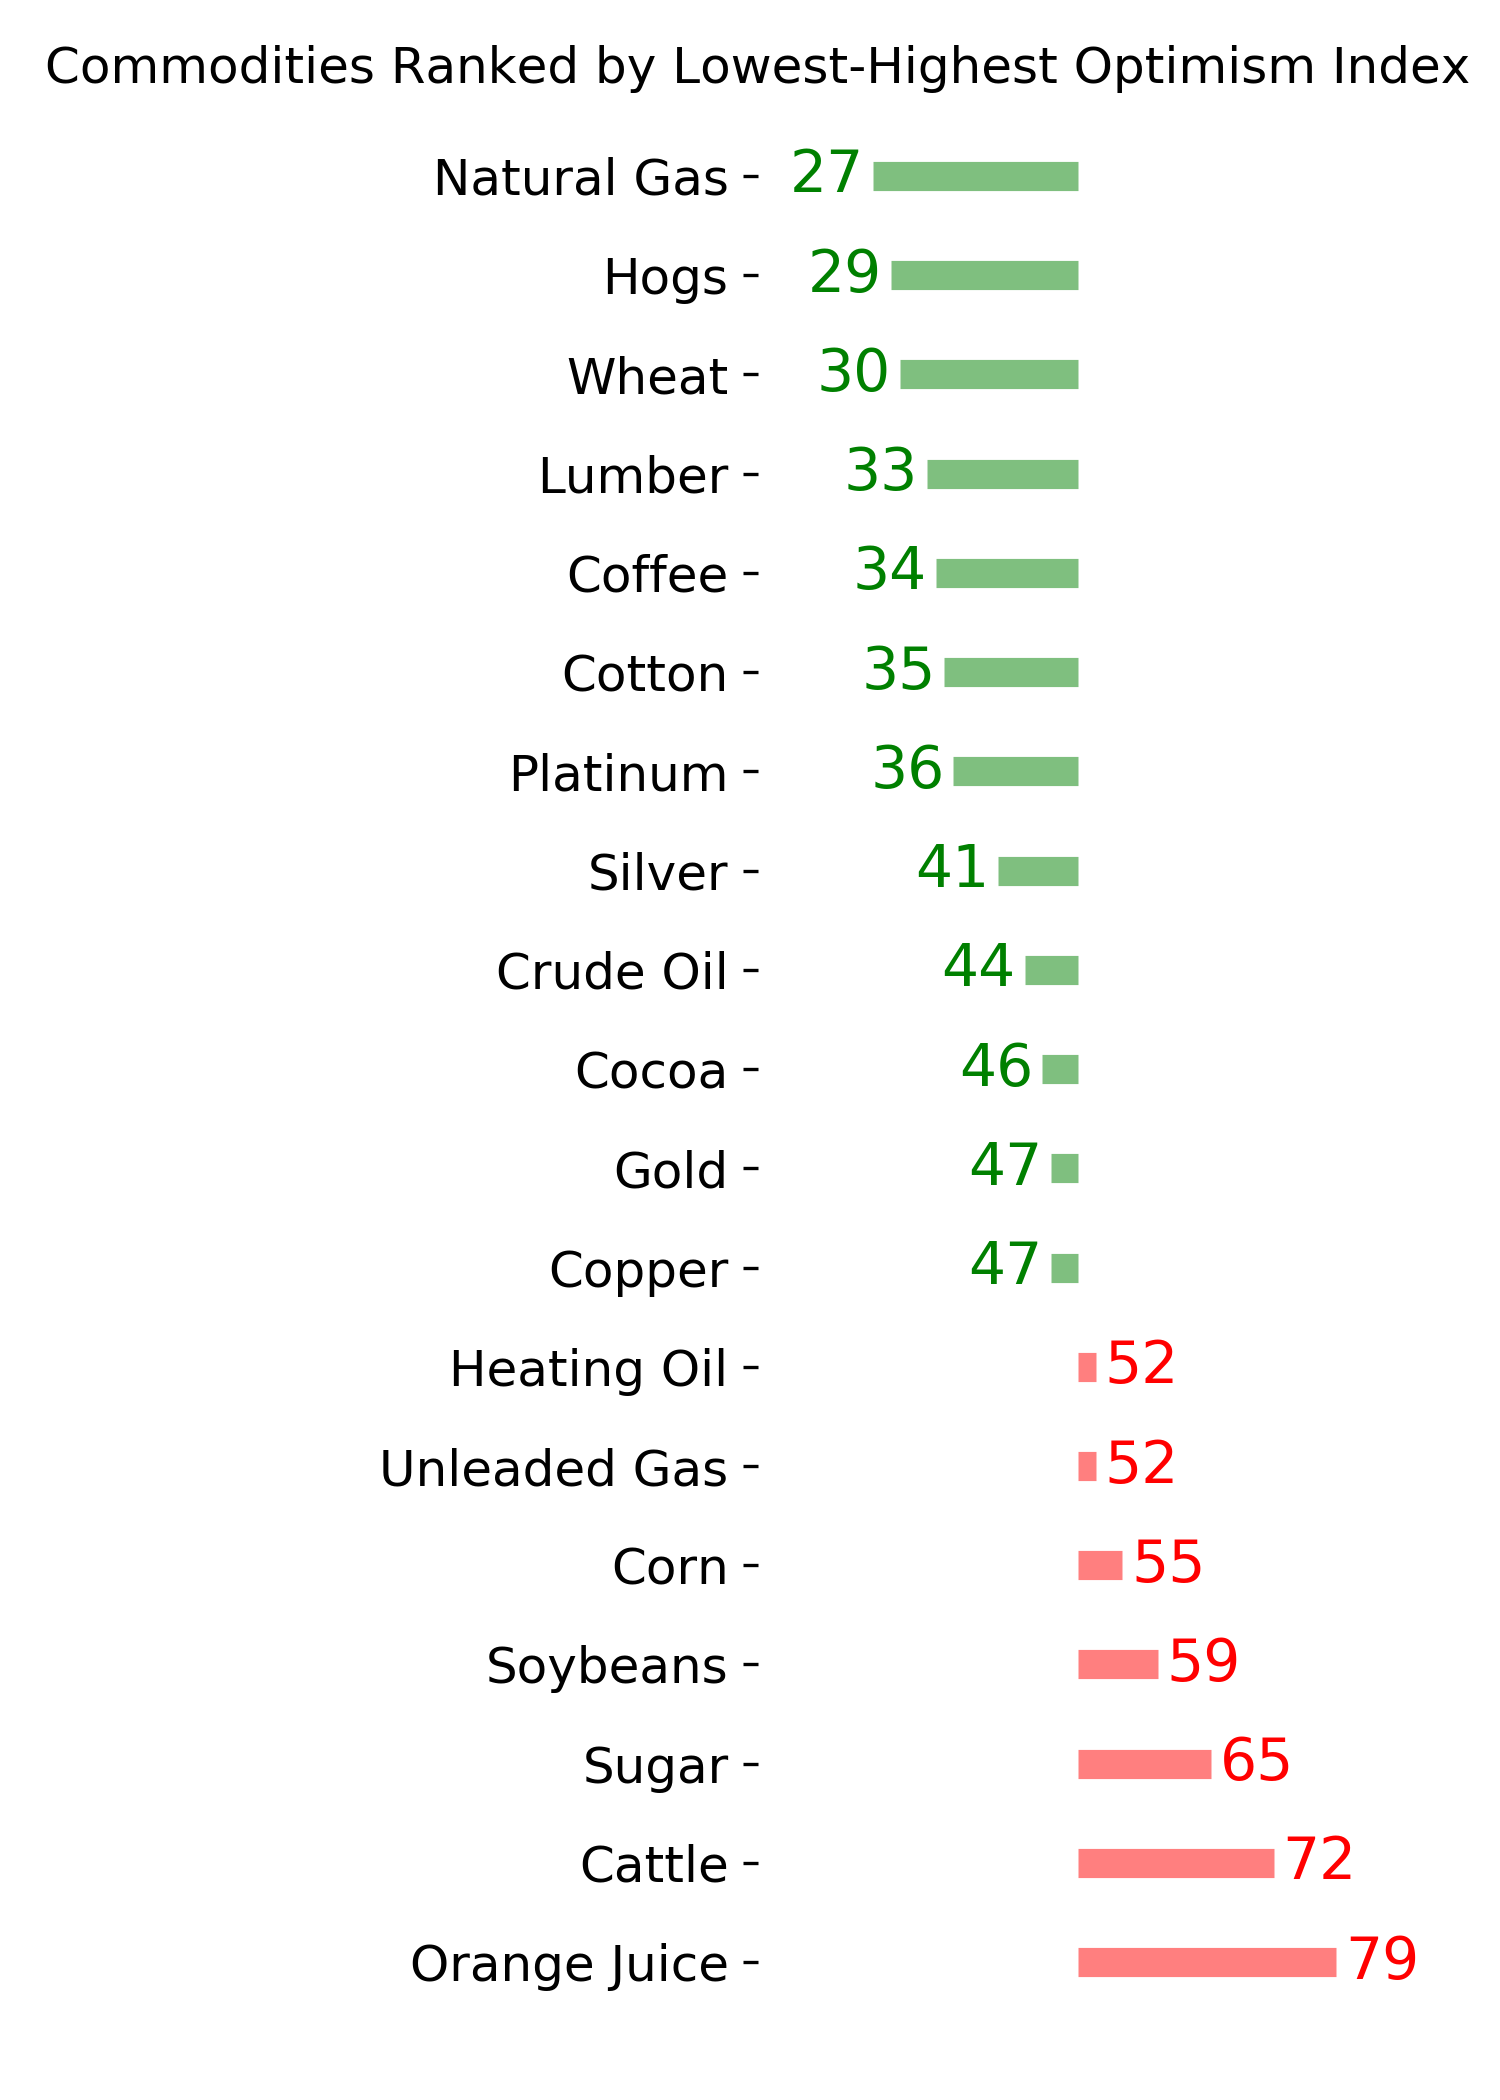
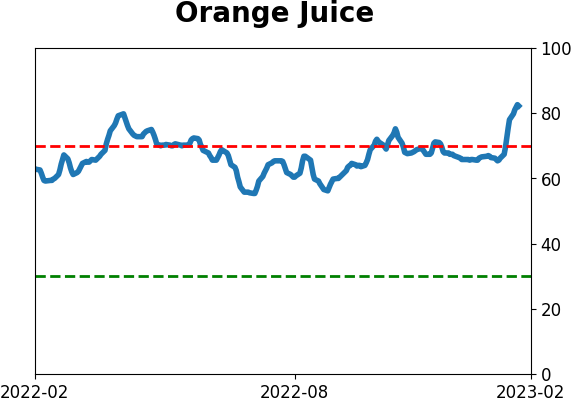
Orange juice is juiced
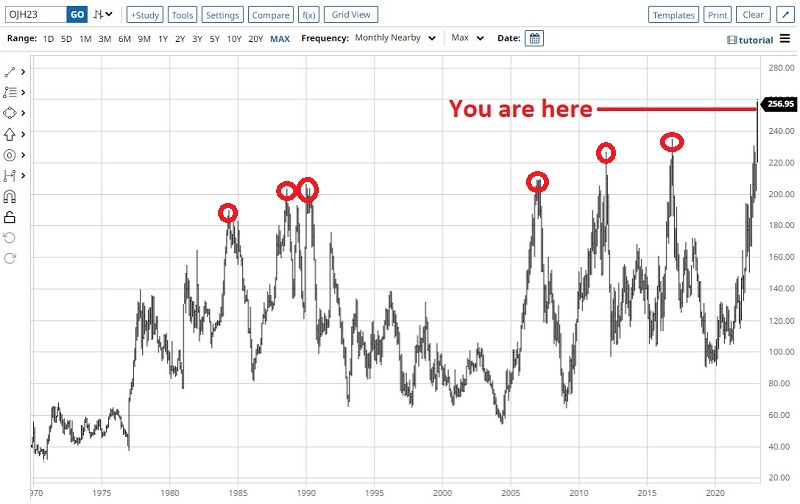
Orange juice futures have been in a major advance. History strongly suggests that once this rally runs its course, the reversal will be swift and severe. Jay showed that both sentiment and seasonality are already issuing warning signs.
Due primarily to the threat of frost to an already hurricane-depleted crop in Florida, orange juice futures have witnessed an unprecedented rally. The chart below shows the latest spike in the price of OJ (courtesy of Barchart.com). To say that we are in nosebleed territory is an understatement. The other key thing to note is that swift and severe declines eventually followed all previous tops above 180.
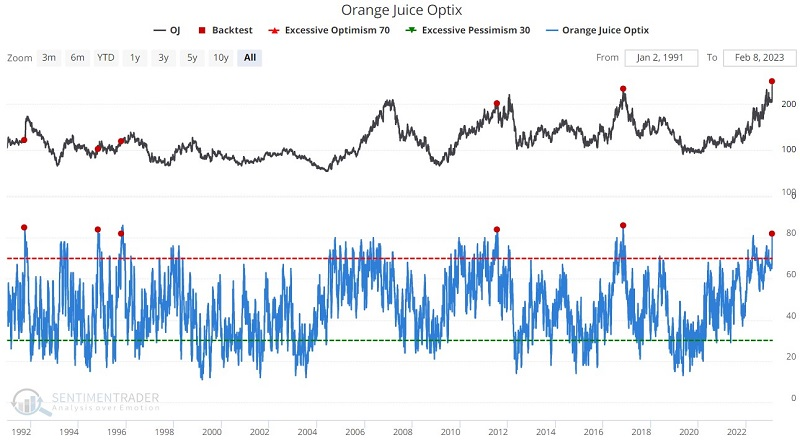
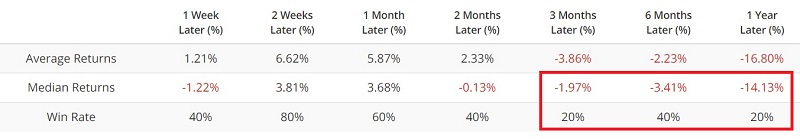
As is usually the case, investor sentiment soars as a market shoots higher. The chart below displays our Optimism Index for OJ, and red dots denote when it rose above 82 for the first time in six months. The table below the chart summarizes performance.
The chart below displays the annual seasonal trend for orange juice futures. Note that we are in the early stages of a typically unfavorable period that extends from the close on Trading Day of the Year (TDY) #23 through TDY #38. For 2023, this period extends from February 3 through February 27.
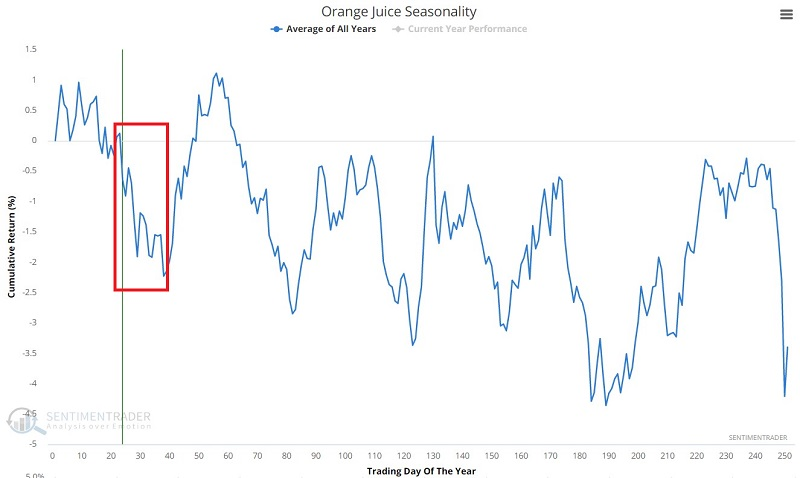
So far, seasonality is dead wrong. It is important to note that OJ has staged some significant rallies during this period (2007 and 2011), so the current action is not unprecedented. Nevertheless, the contract showed gains only 32% of the time, and was four times more likely to suffer a loss greater than -$7,000 than a gain of more than +$7,000.
About TradingEdge Weekly...
The goal of TradingEdge Weekly is to summarize some of the research published to SentimenTrader over the past week. Sometimes there is a lot to digest and this summary is meant to highlight the highest conviction or most compelling ideas we discussed. This is NOT the full research that's published, rather it pulls out some of the most relevant parts. It includes links to the published research for convenience; if you don't subscribe to those products it will present the options for access.
Indicators at Extremes
|
|
|
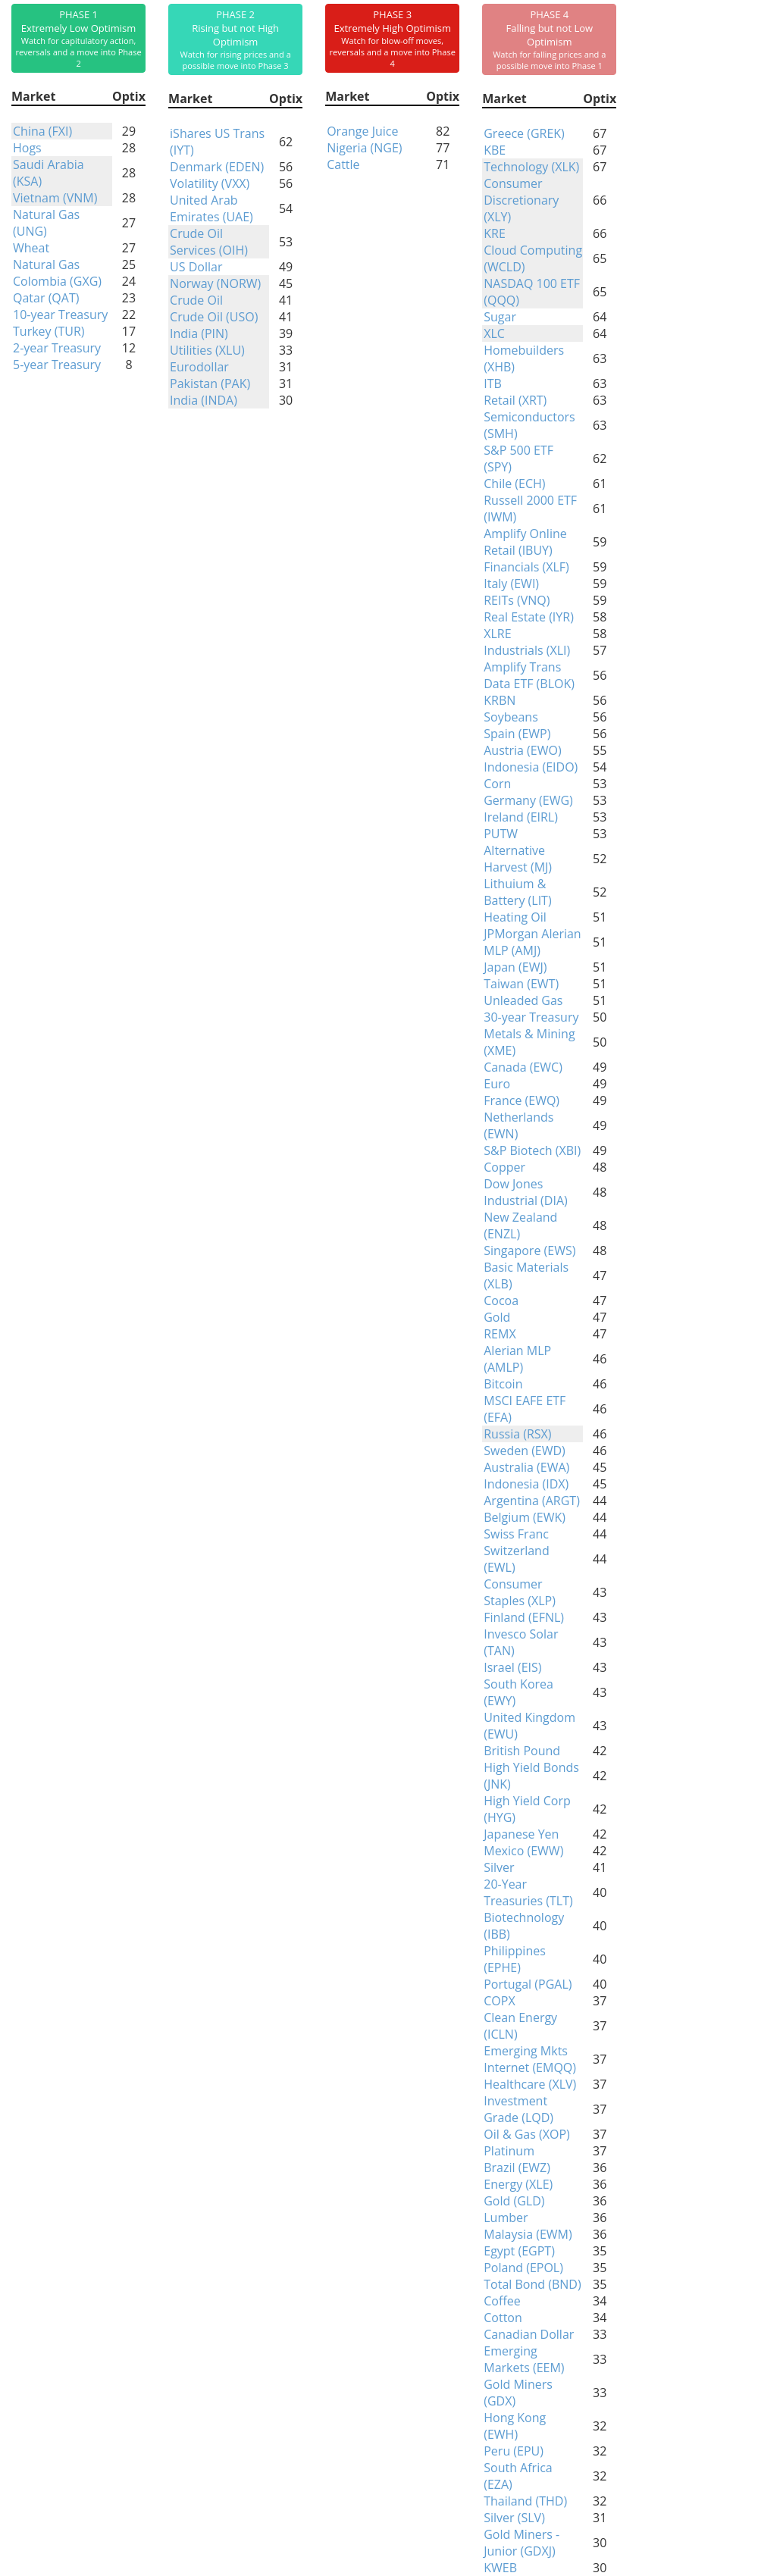
Phase Table
|
|
|
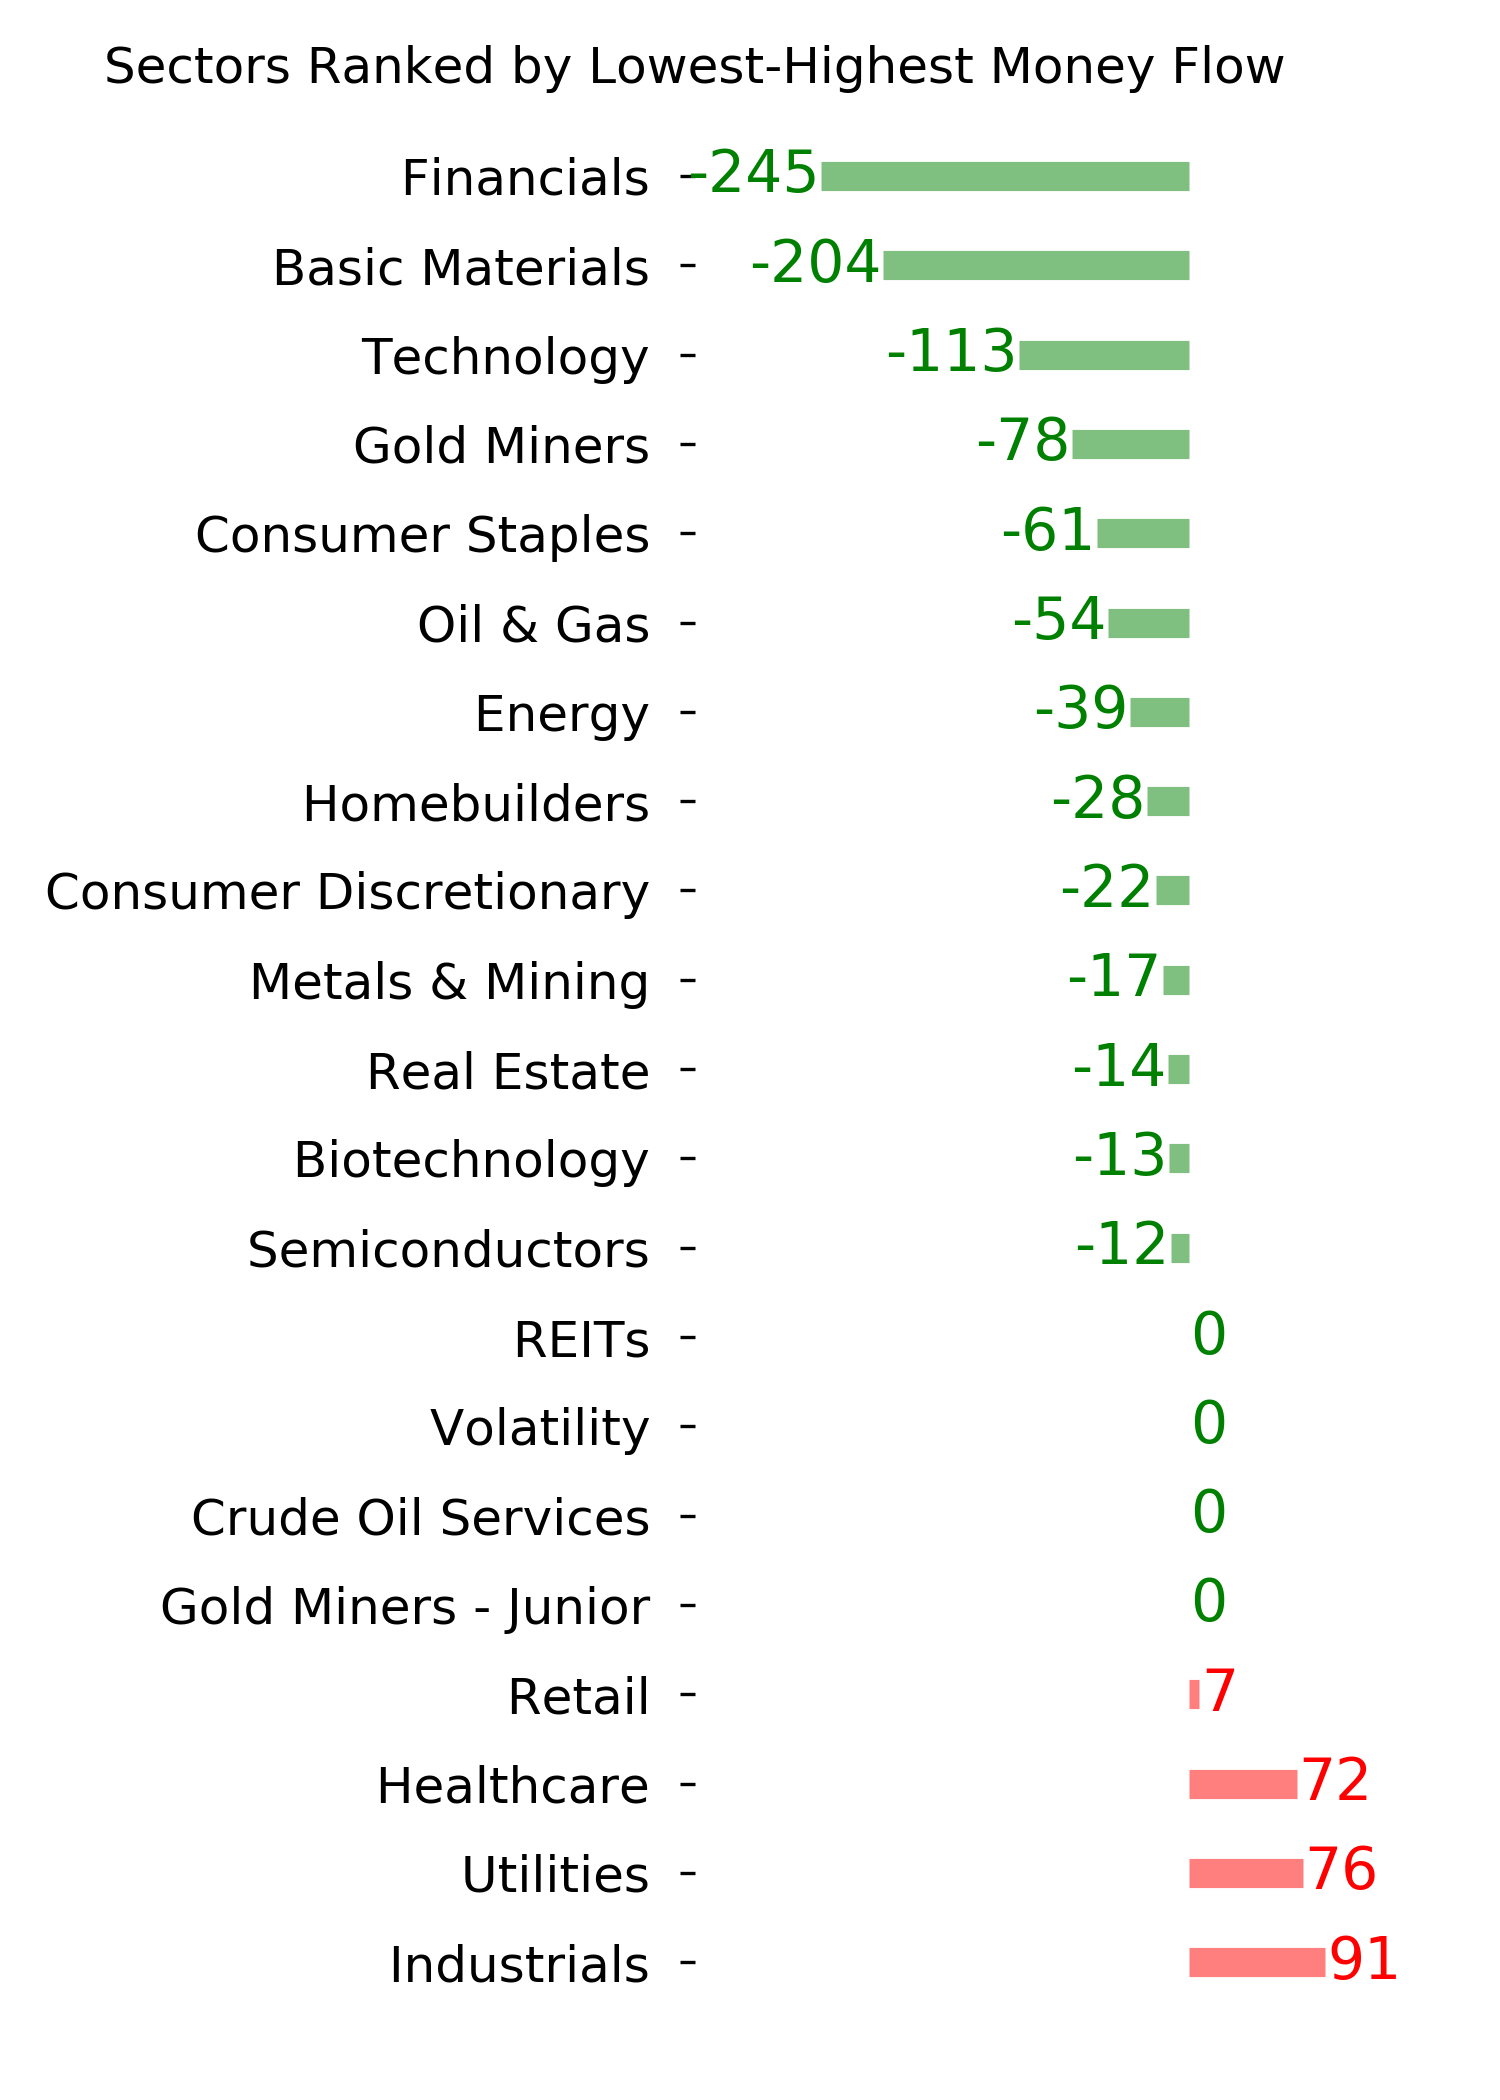
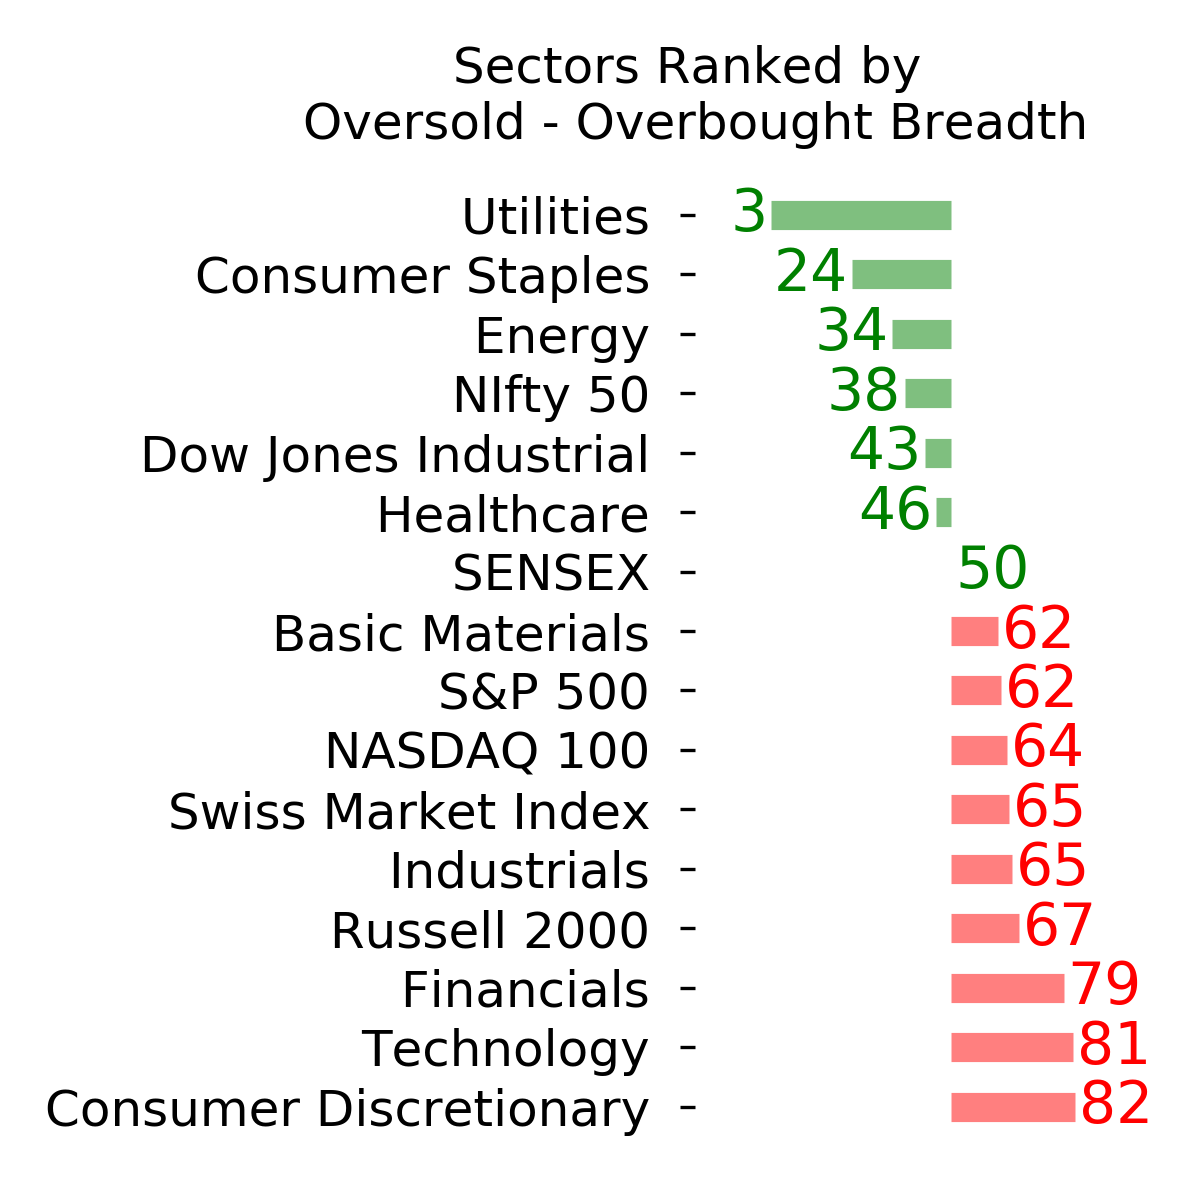
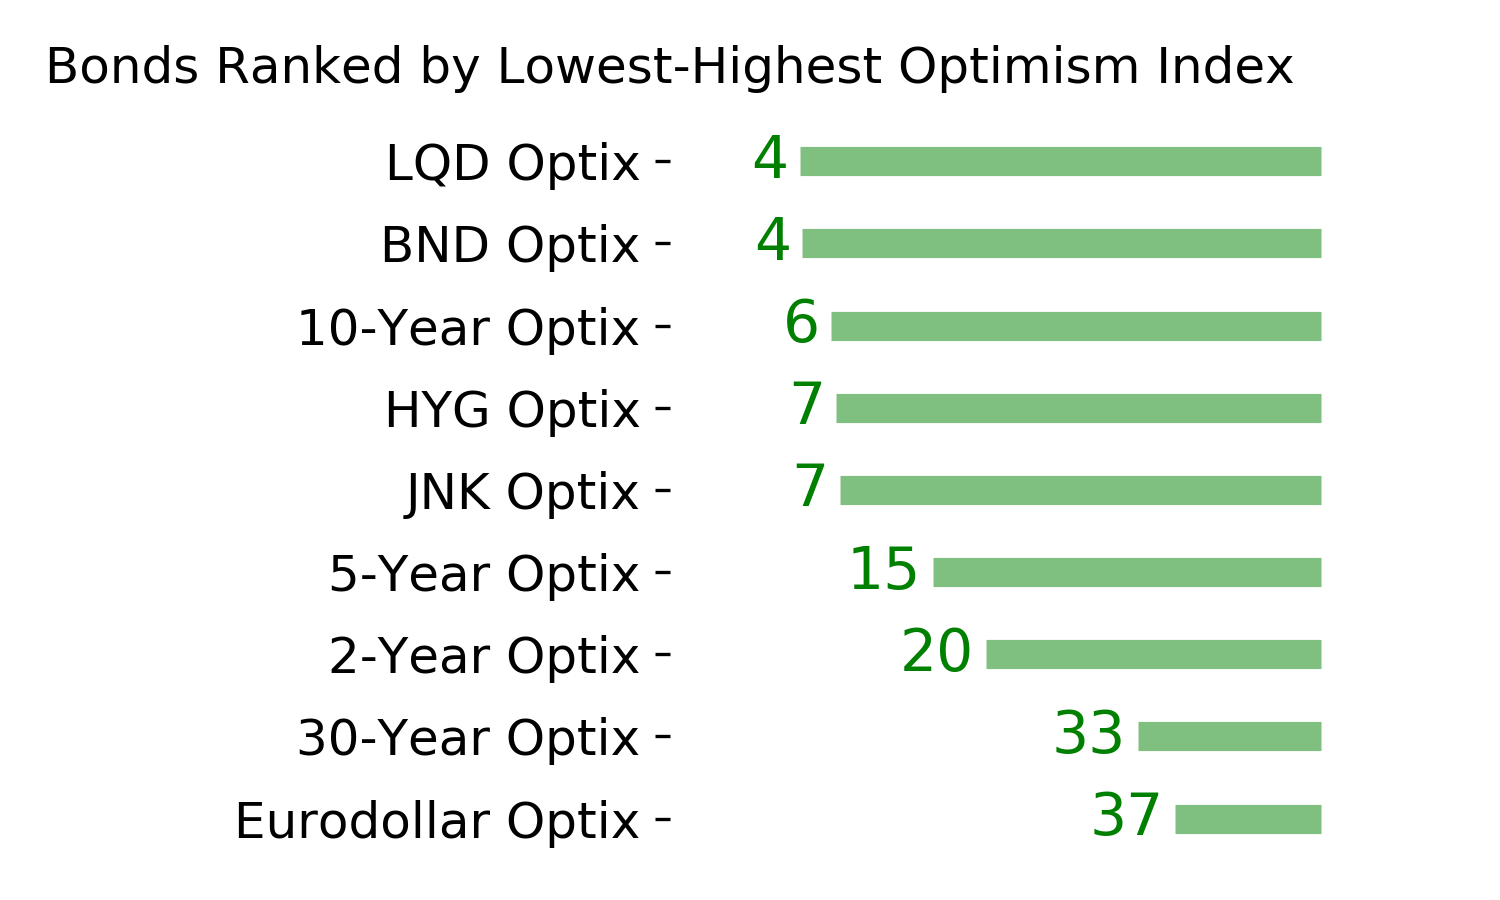
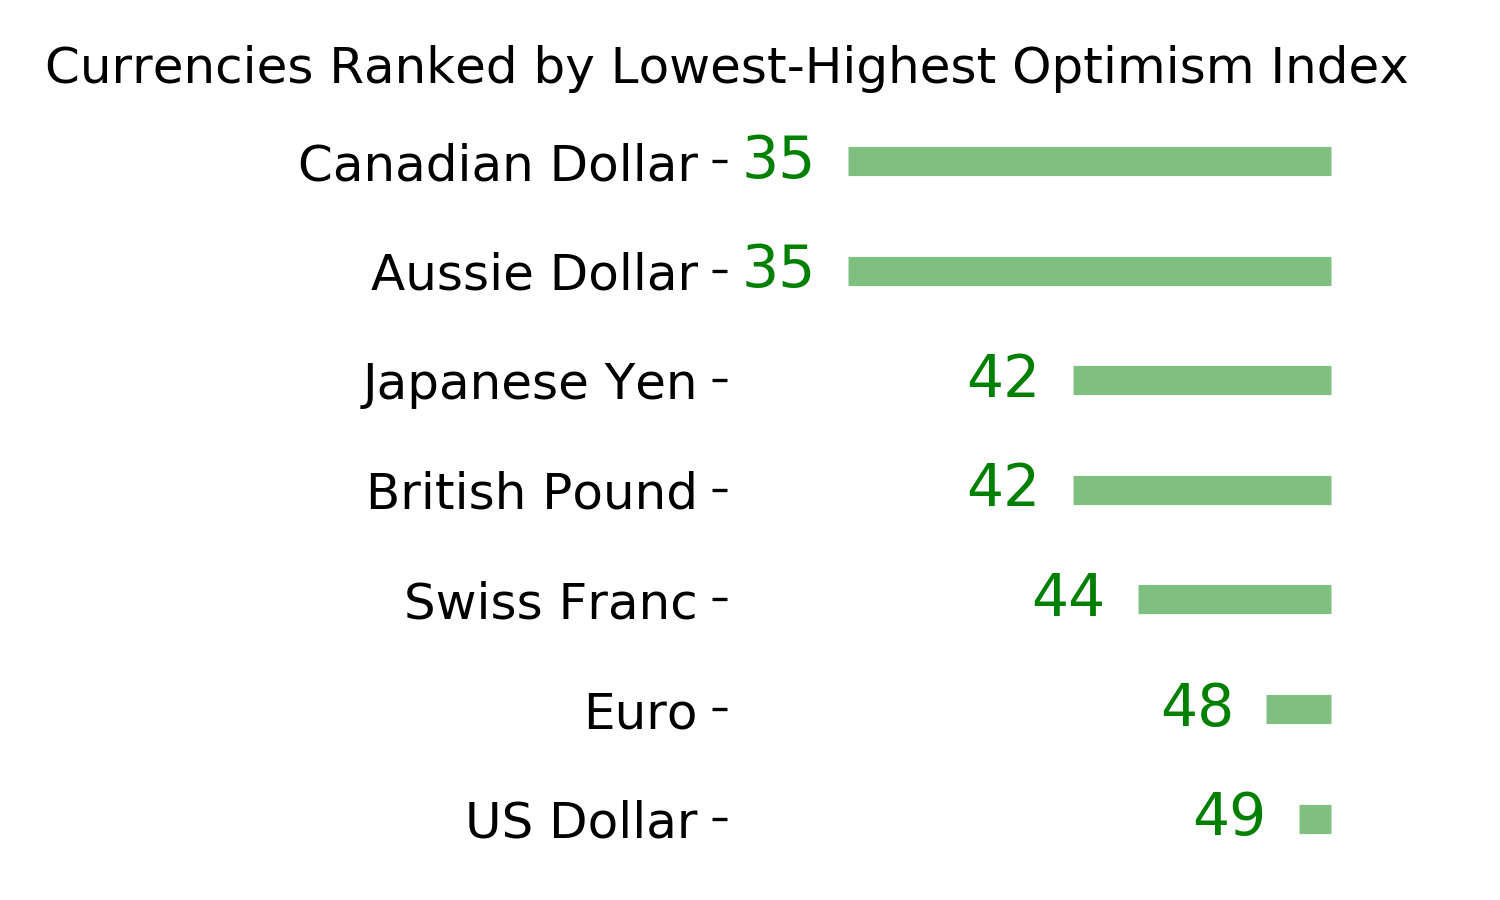
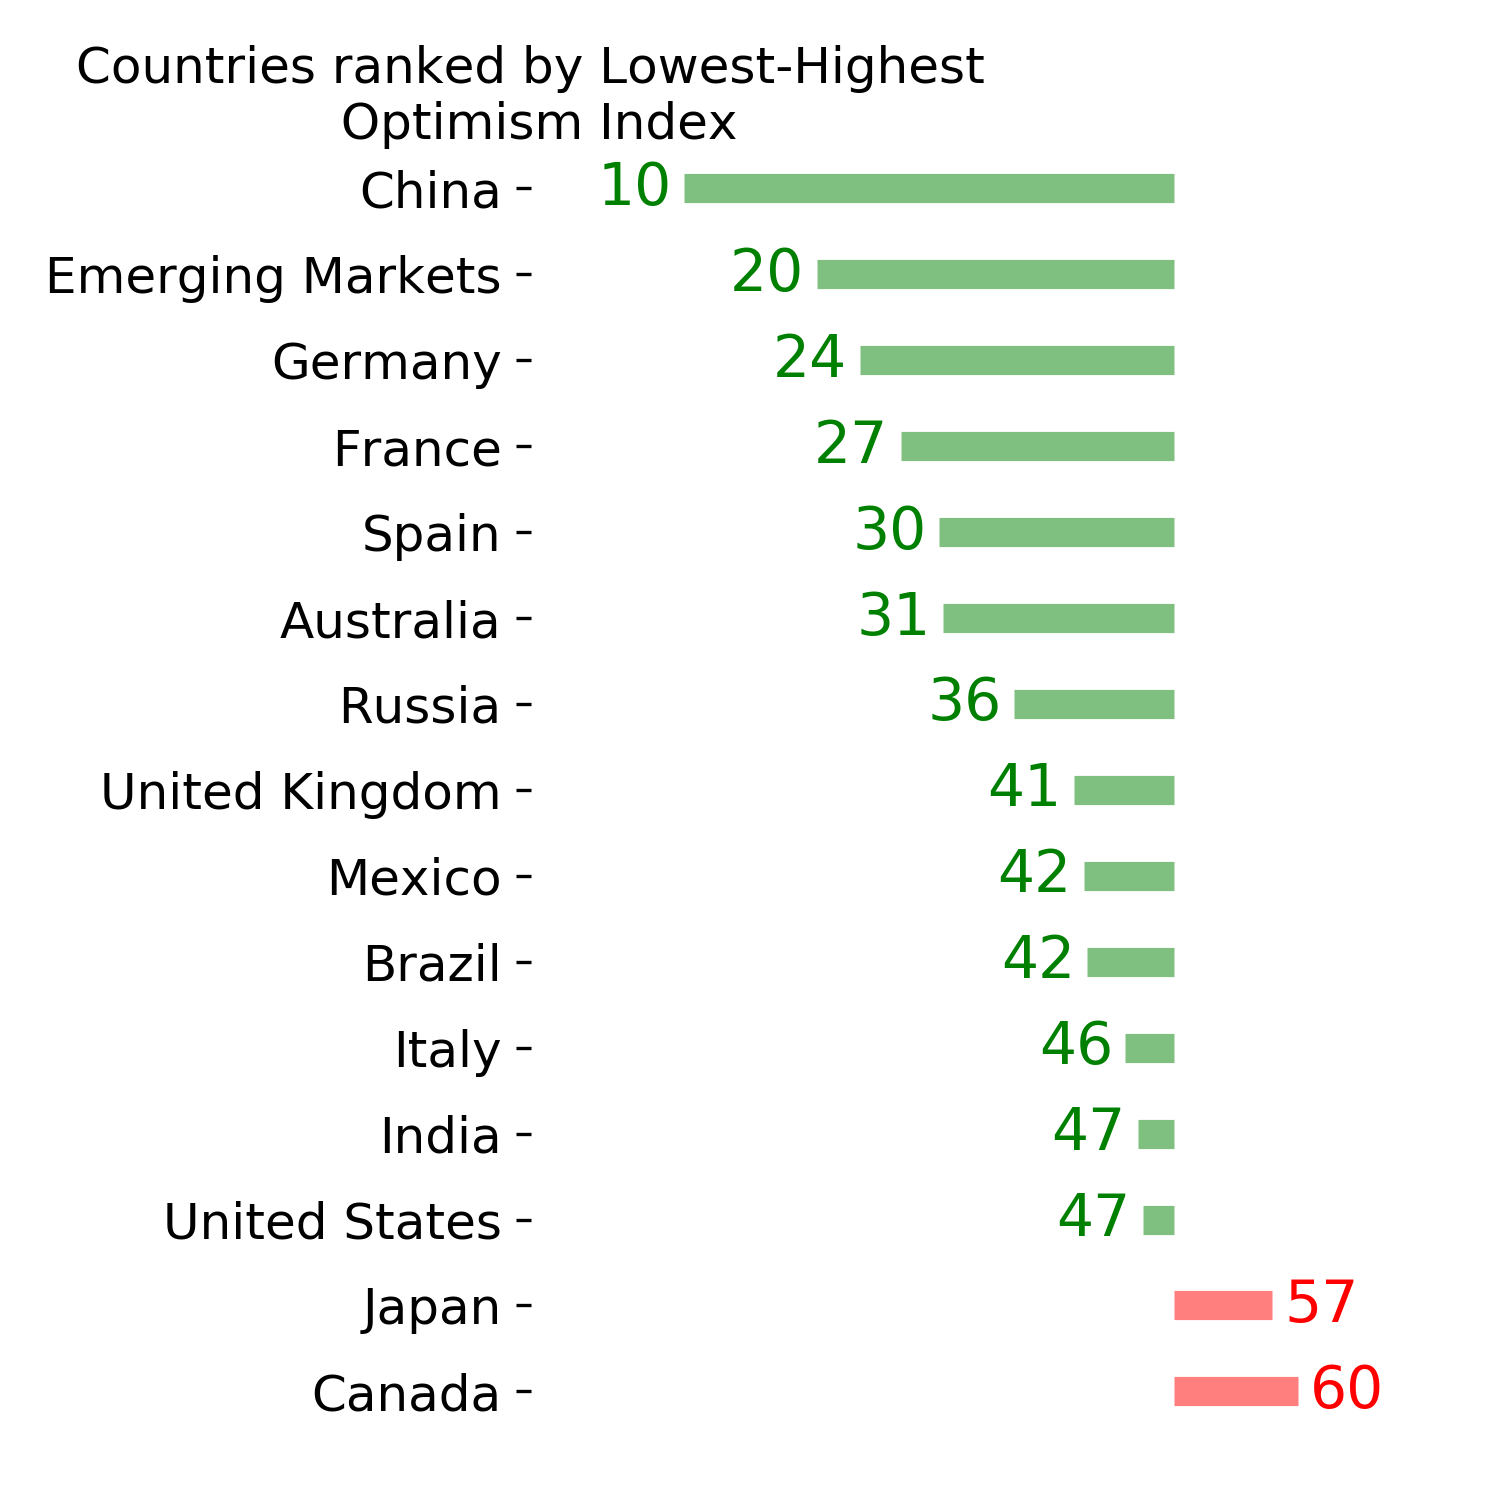
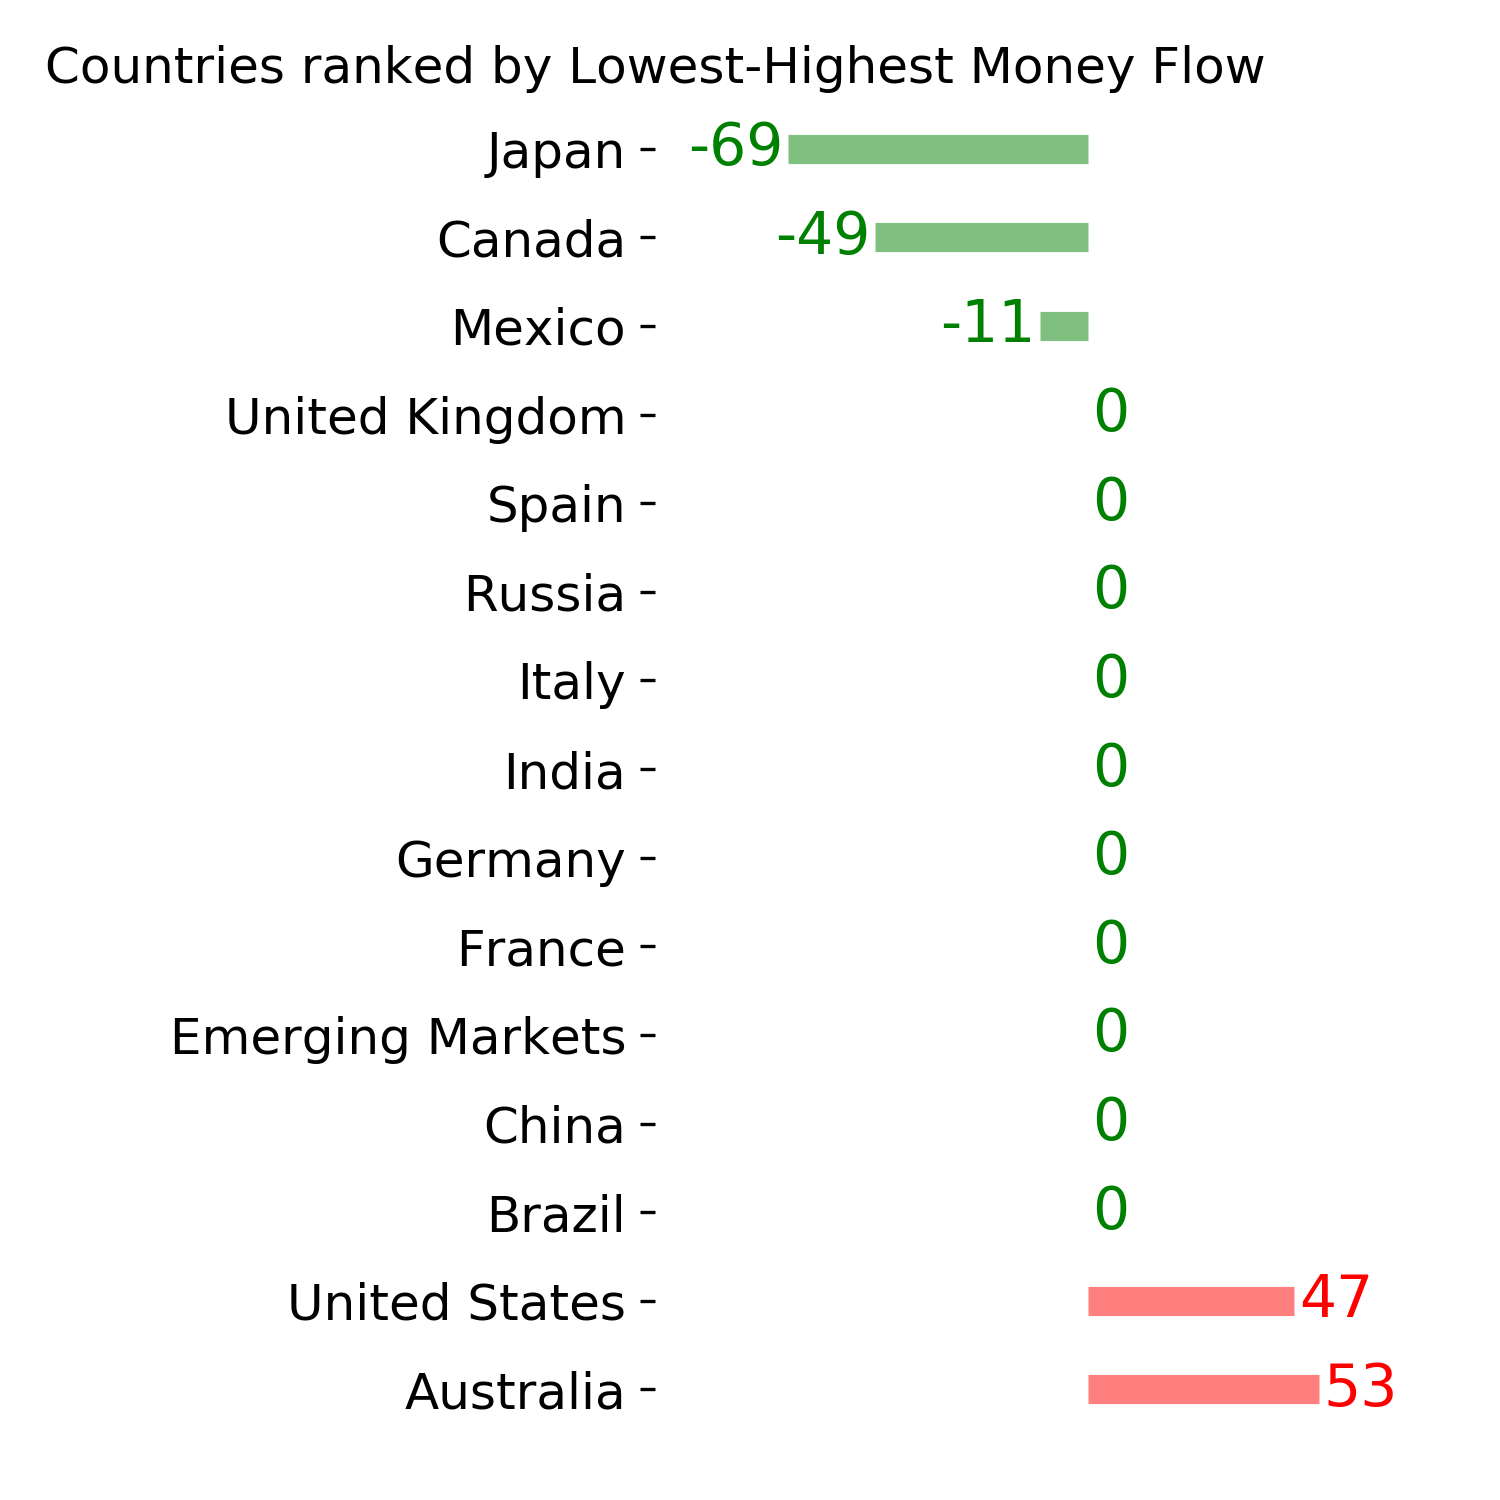
Ranks
|
|
|
|
|
|
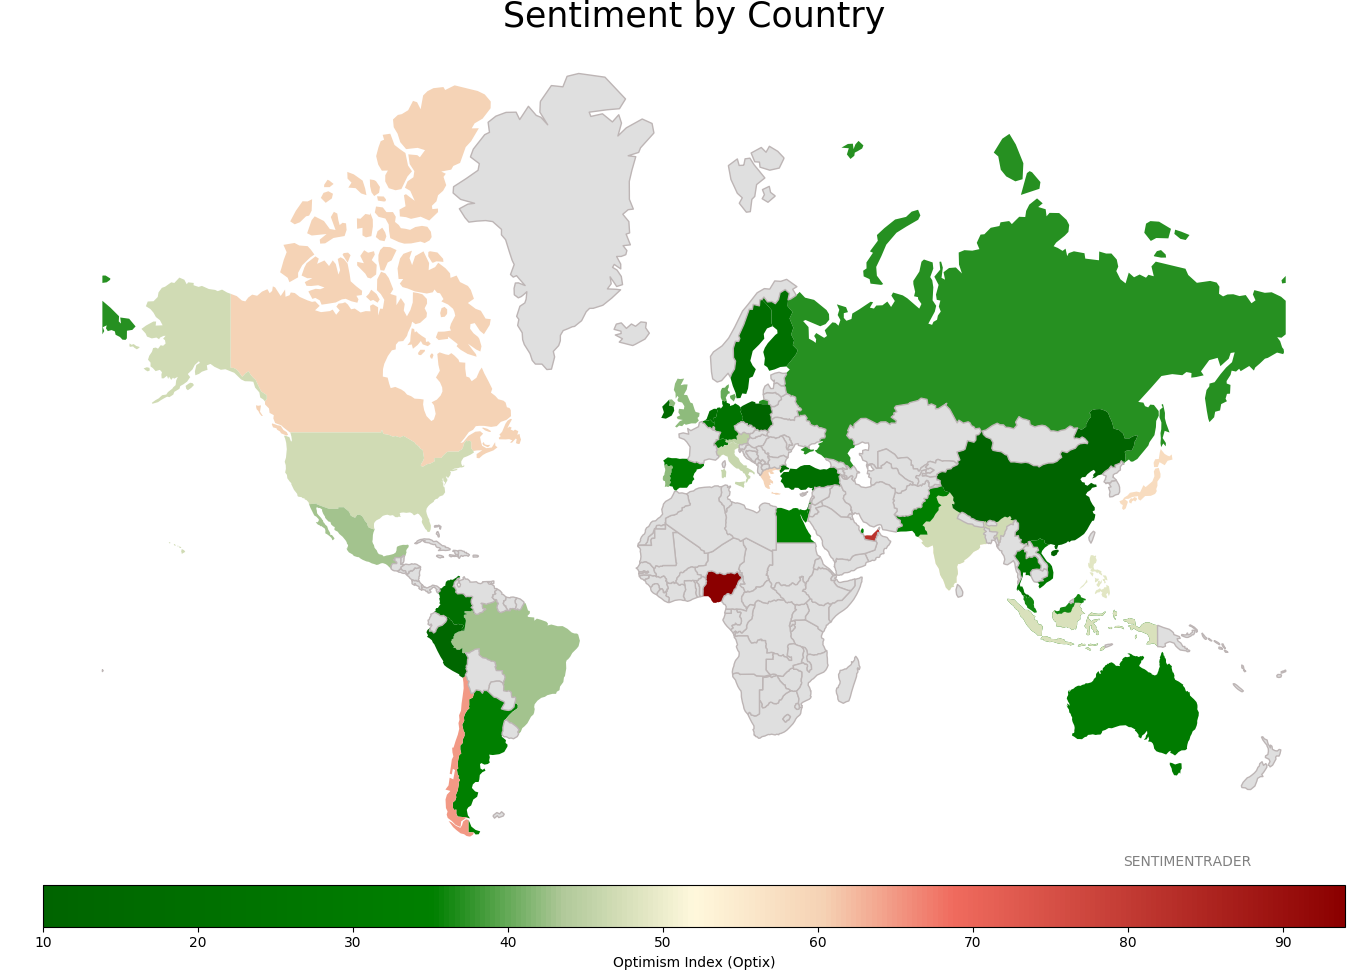
Sentiment Around The World
|
|
|
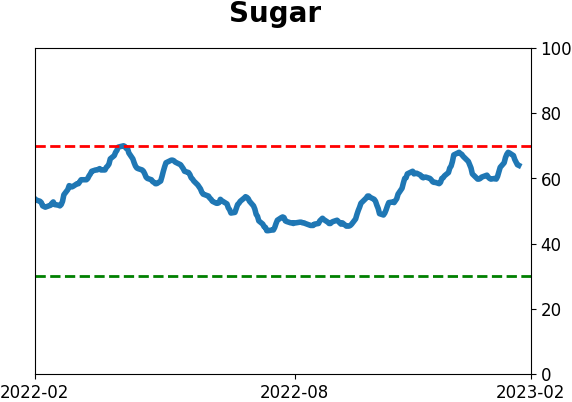
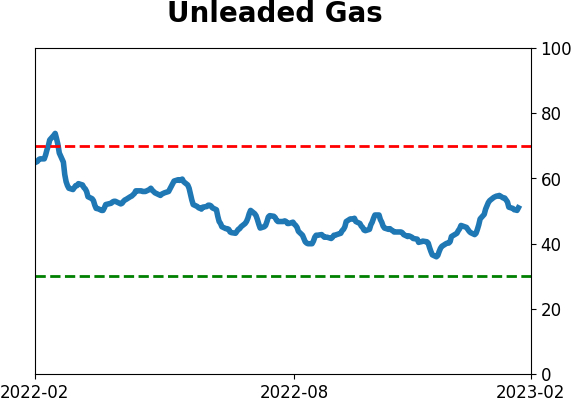
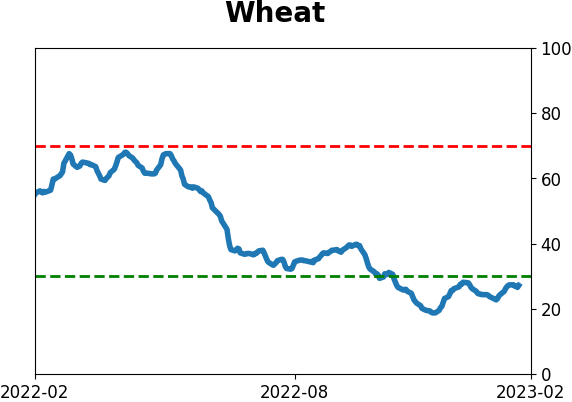
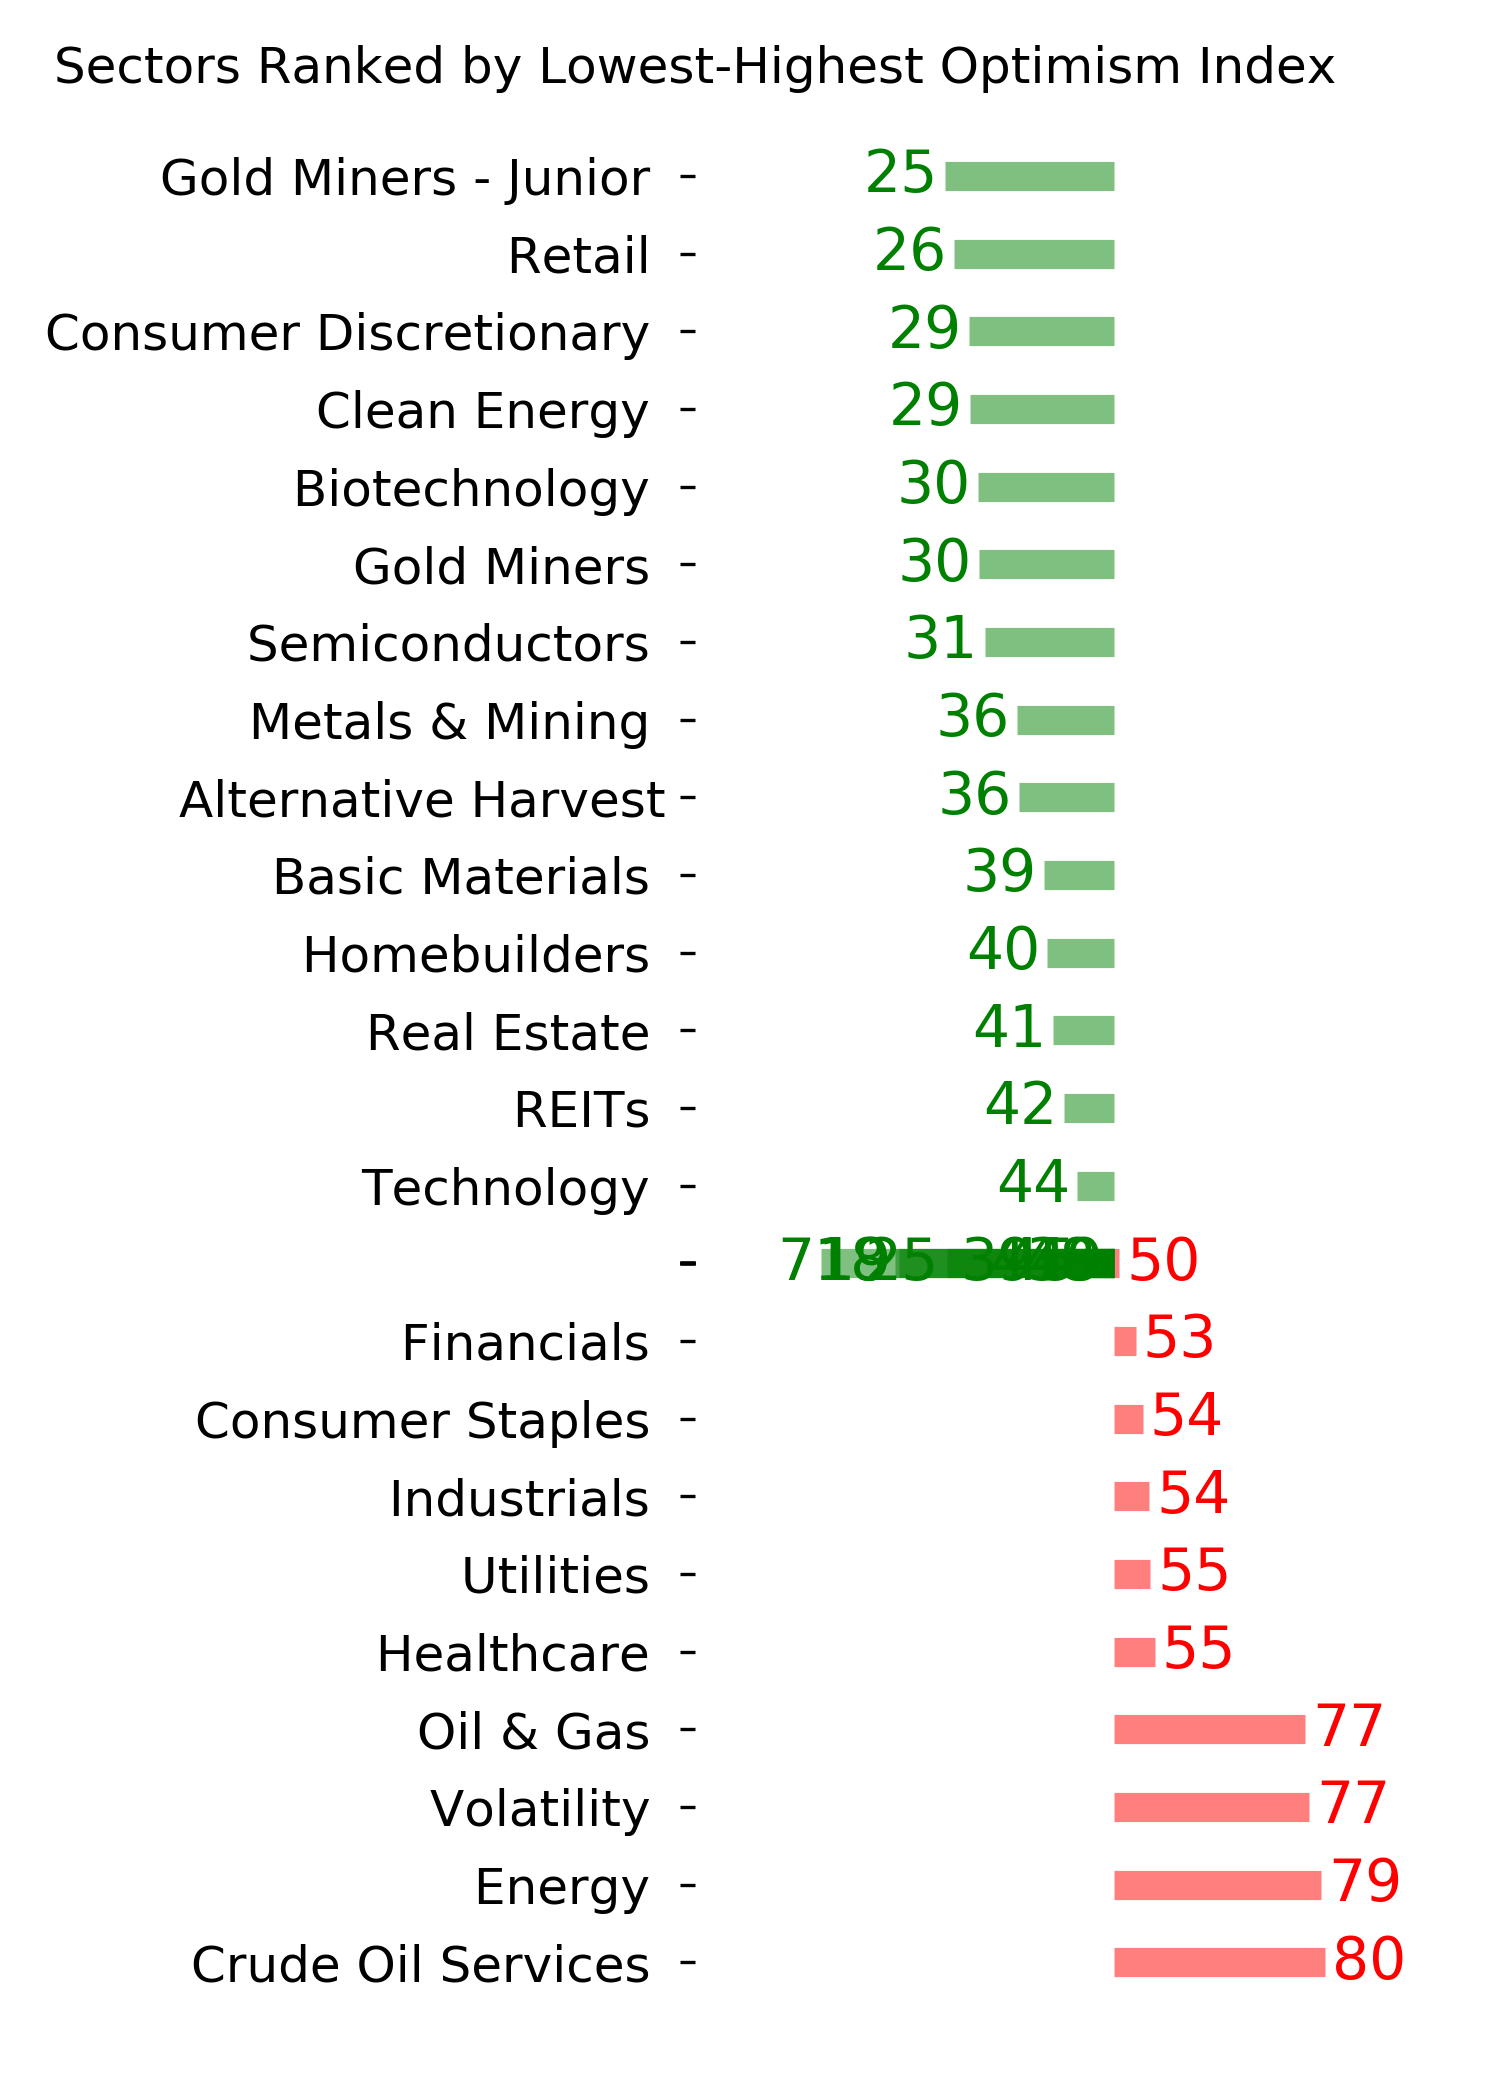
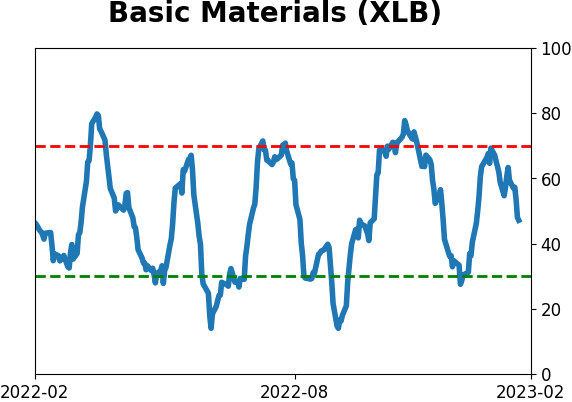
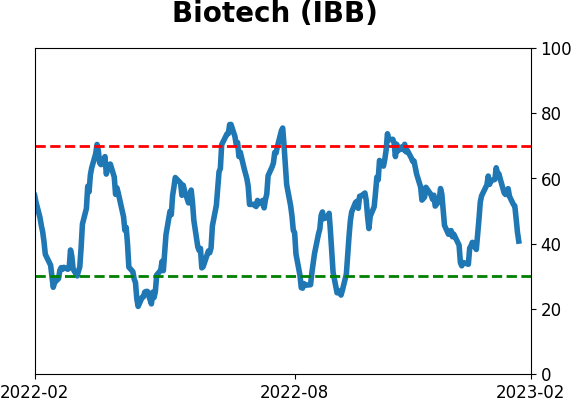
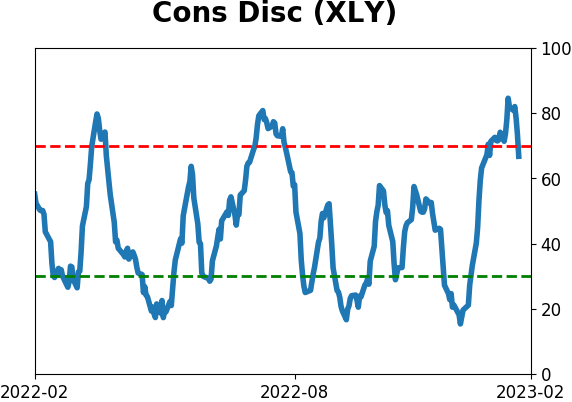
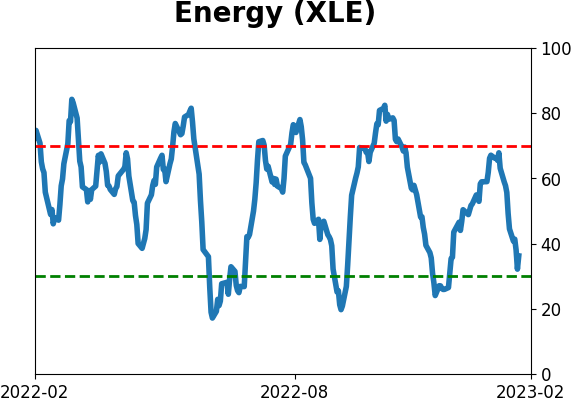
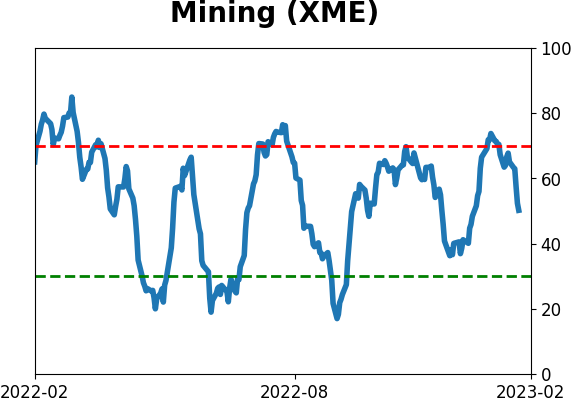
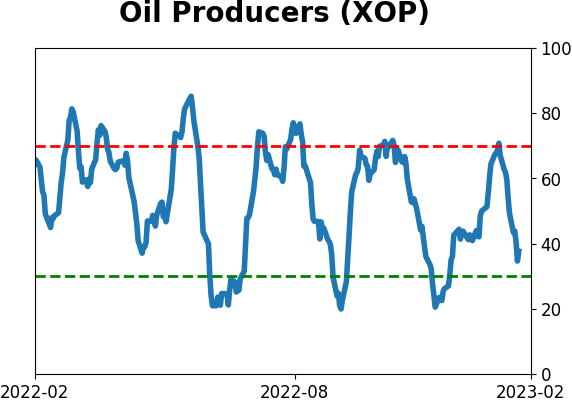
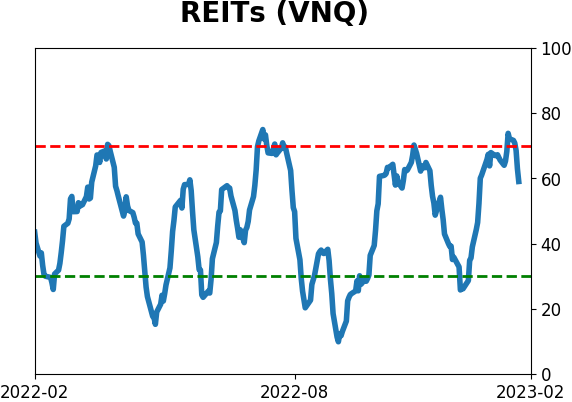
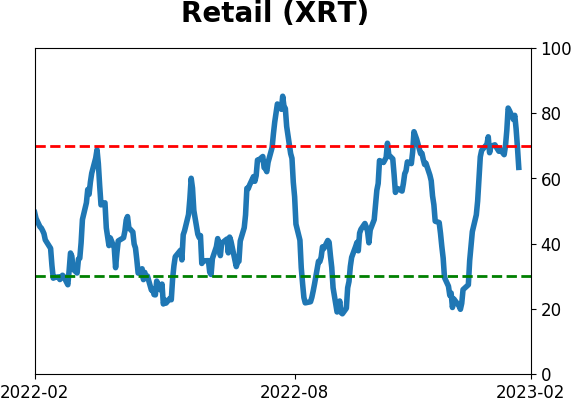
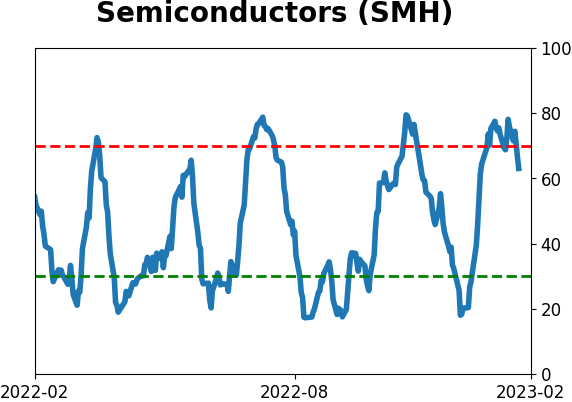
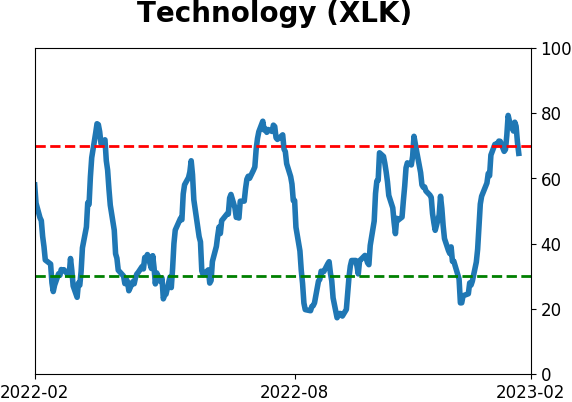
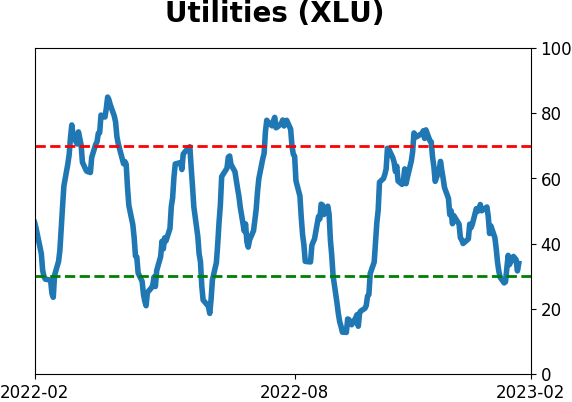
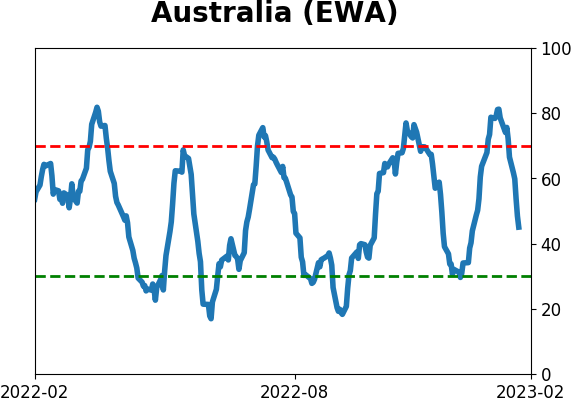
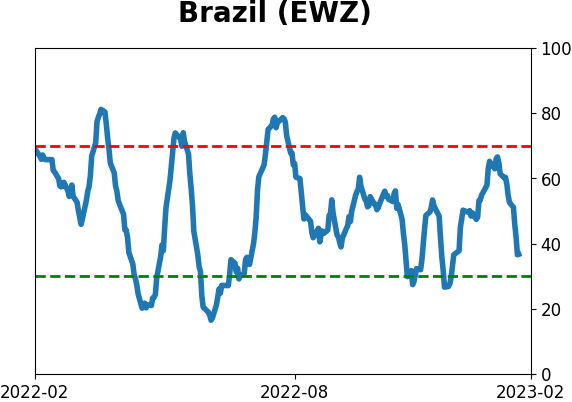
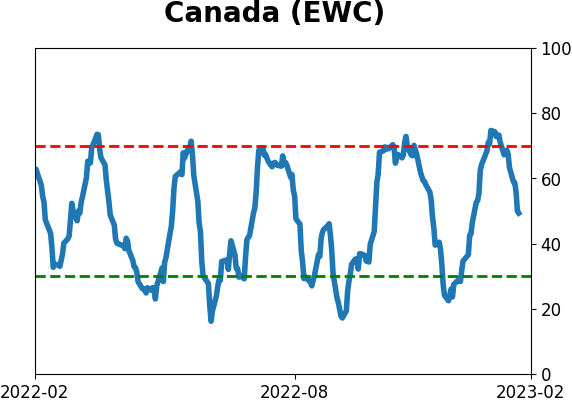
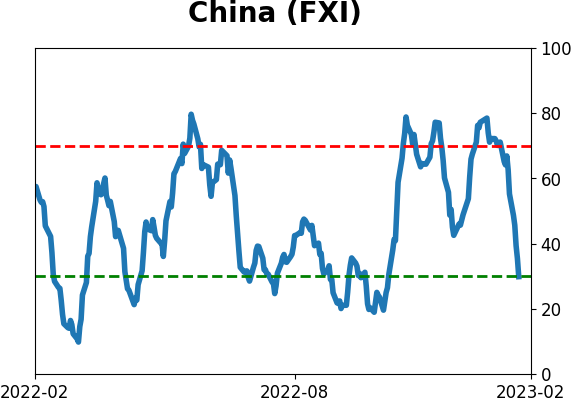
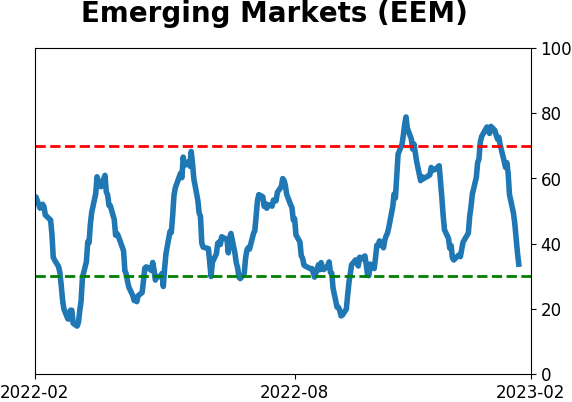
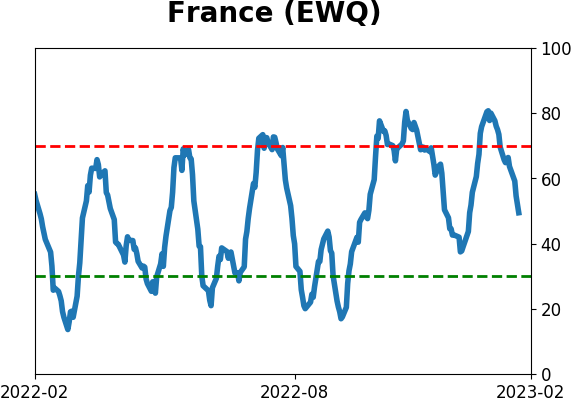
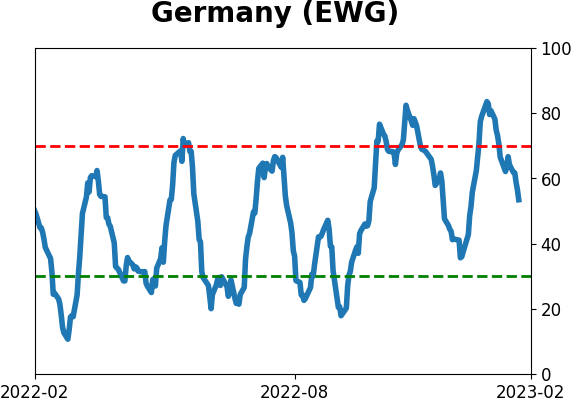
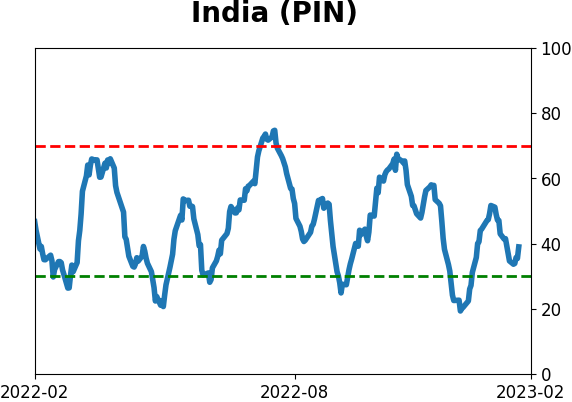
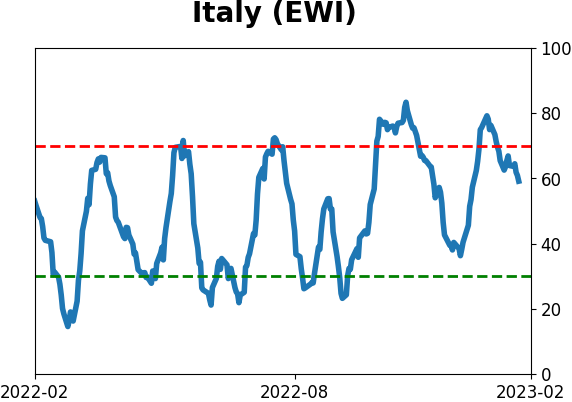
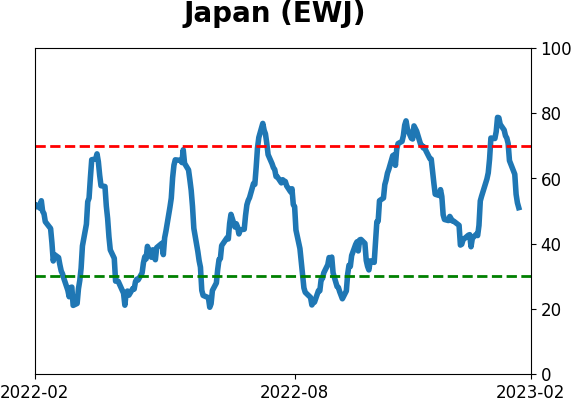
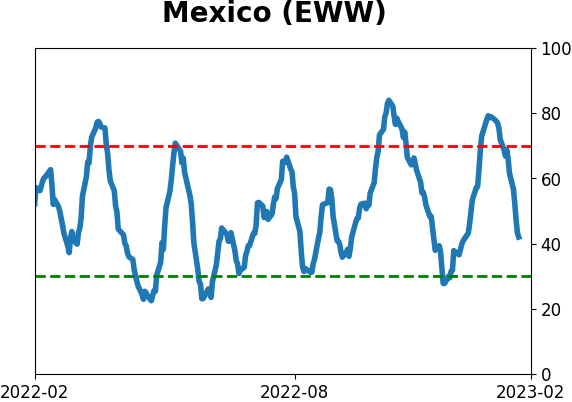
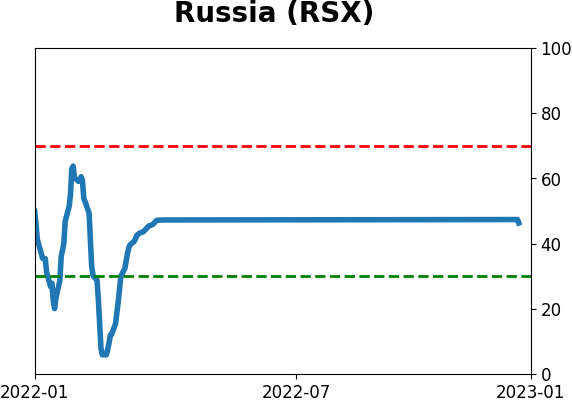
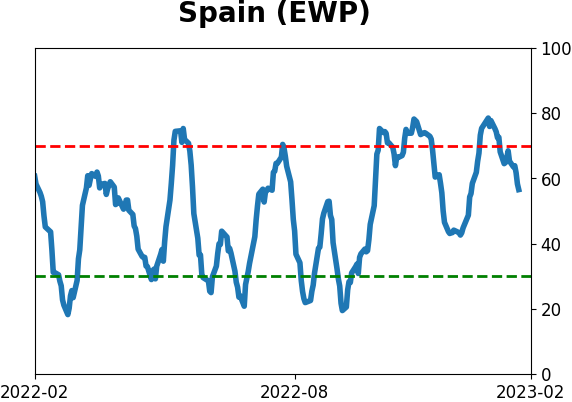
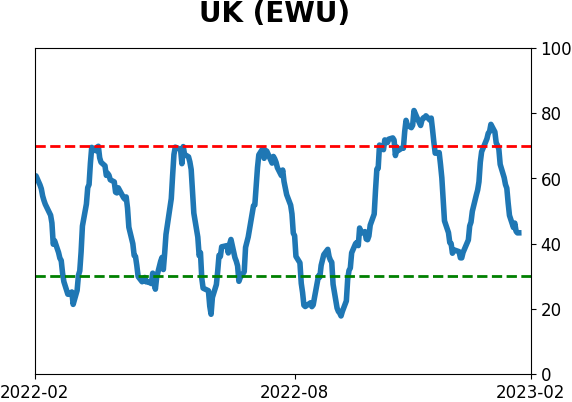
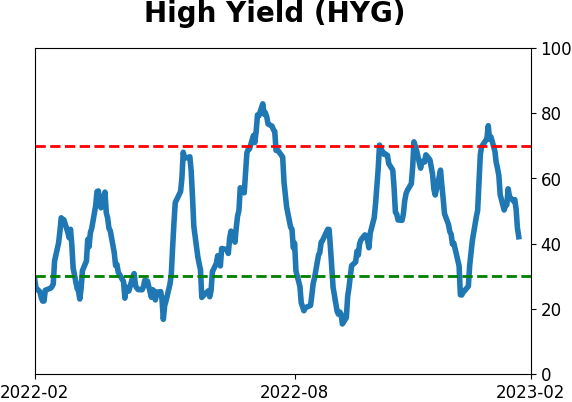
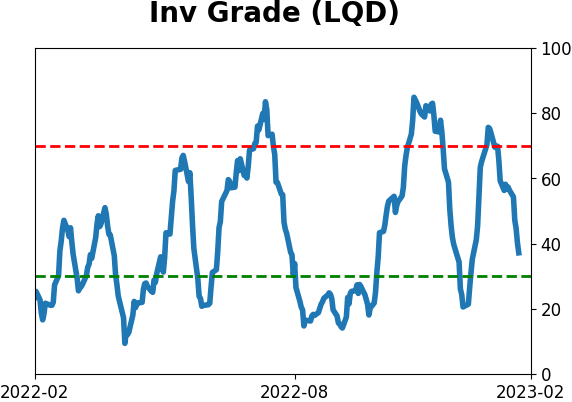
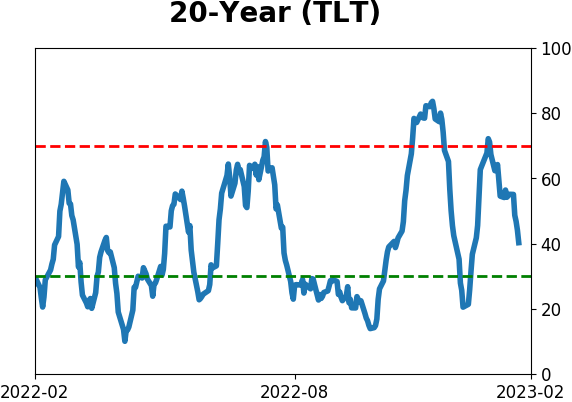
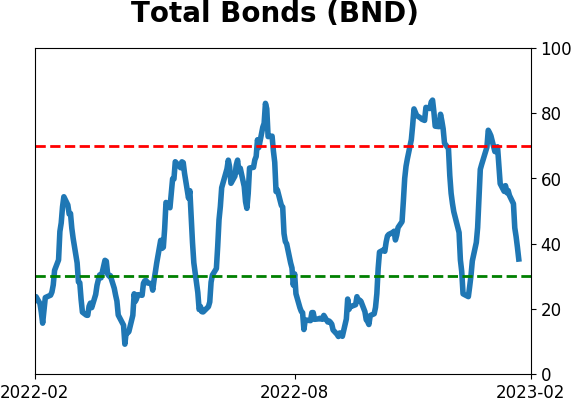
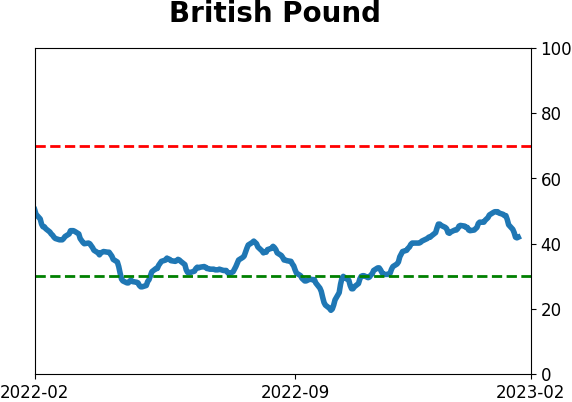
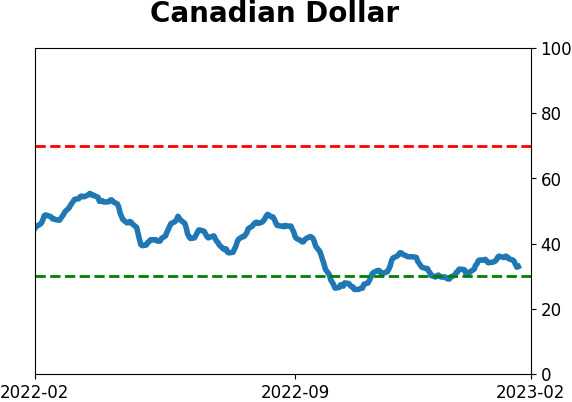
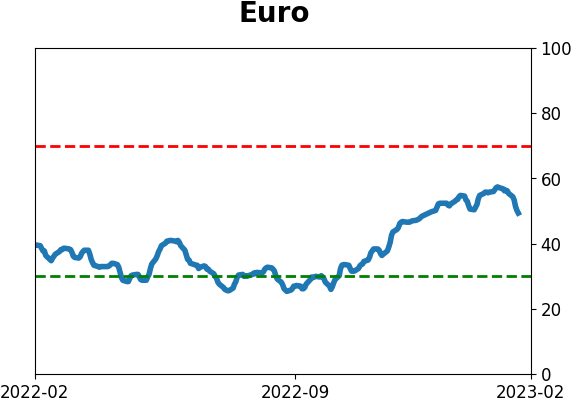
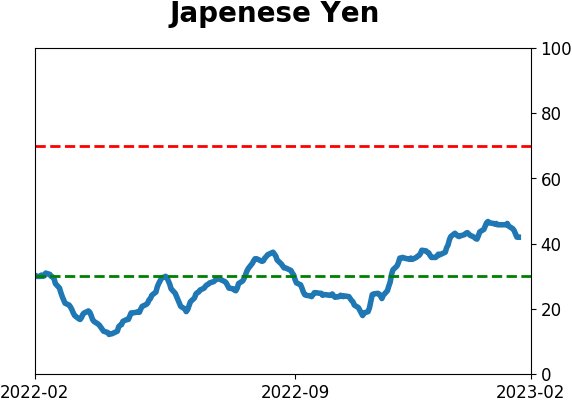
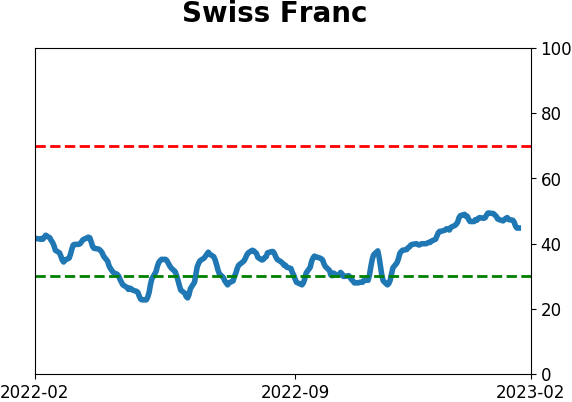
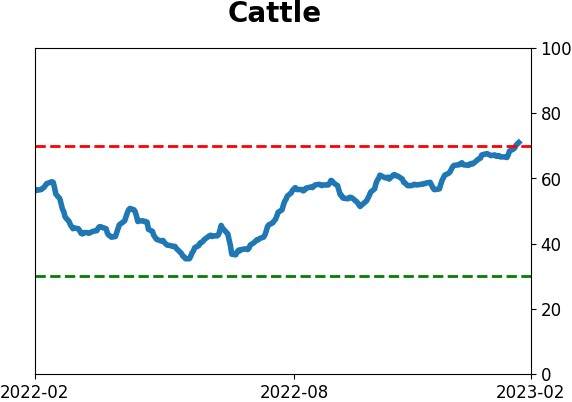
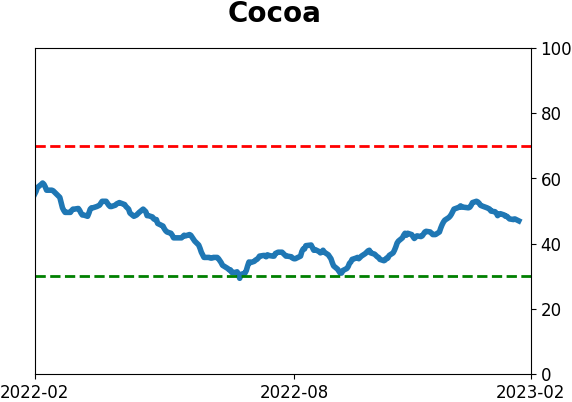
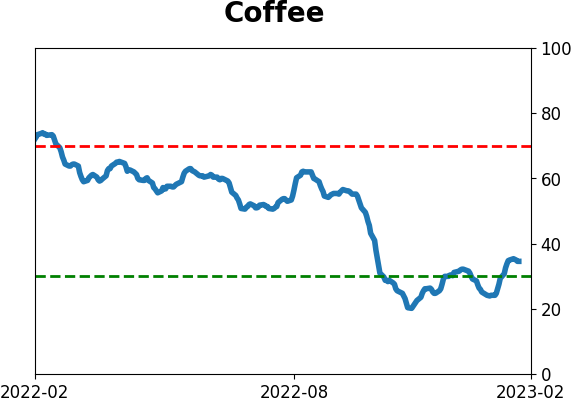
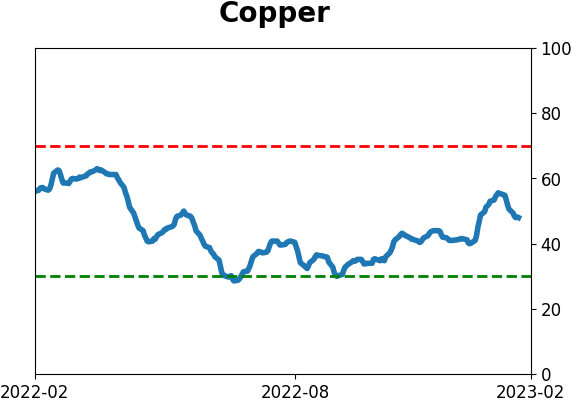
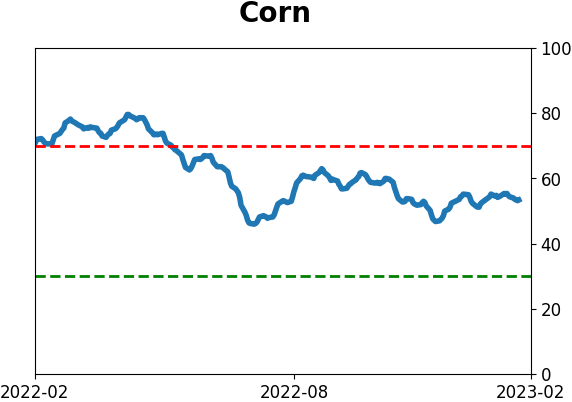
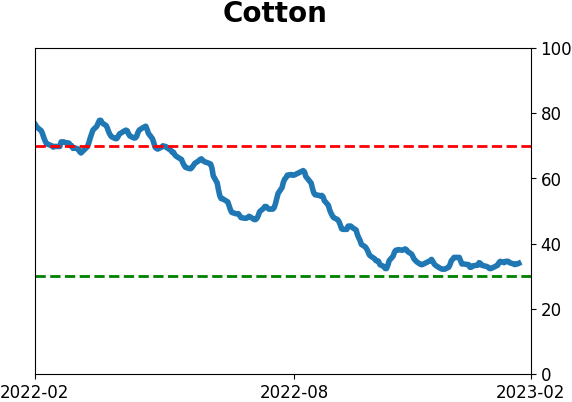
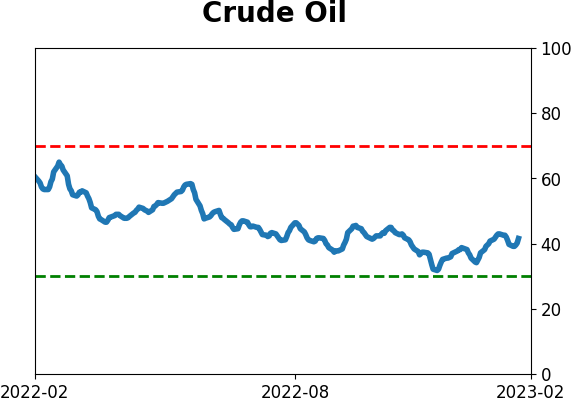
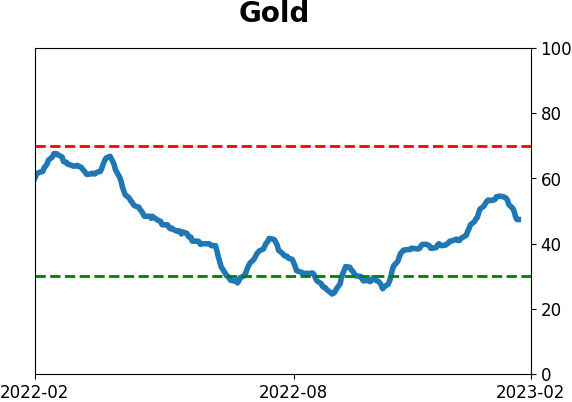
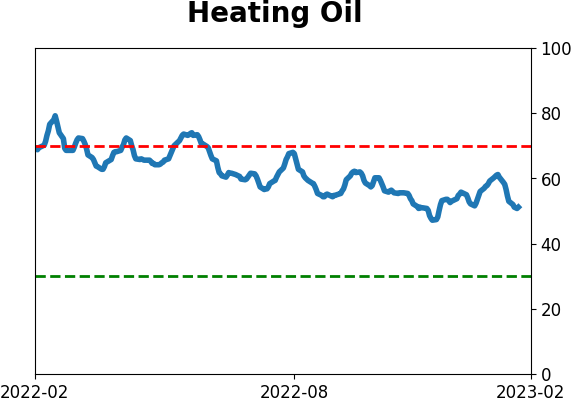
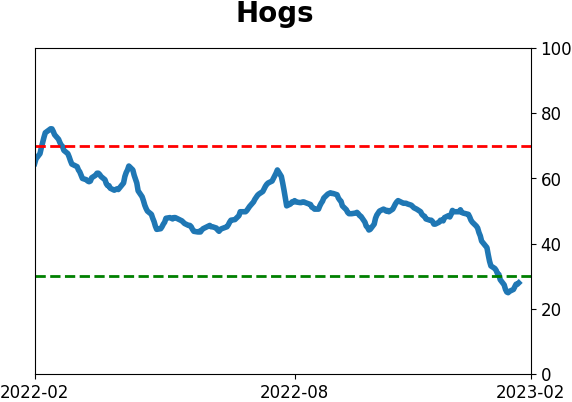
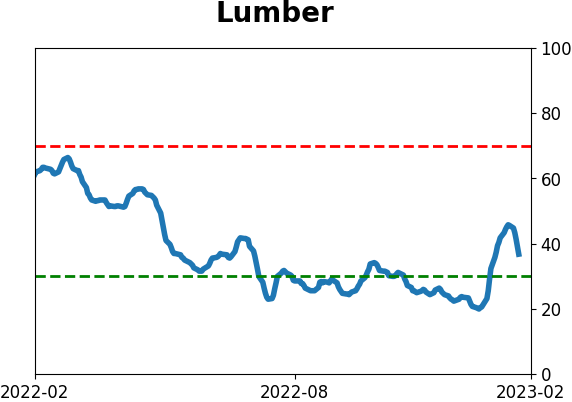
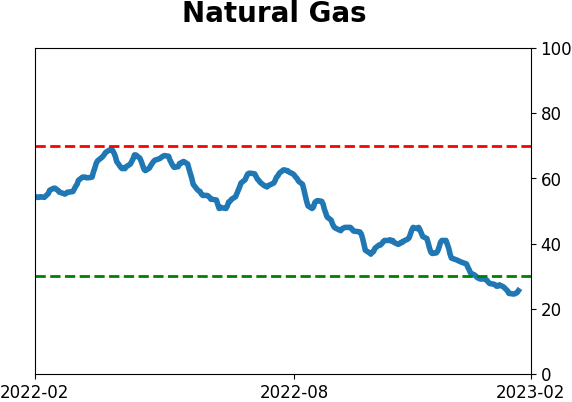
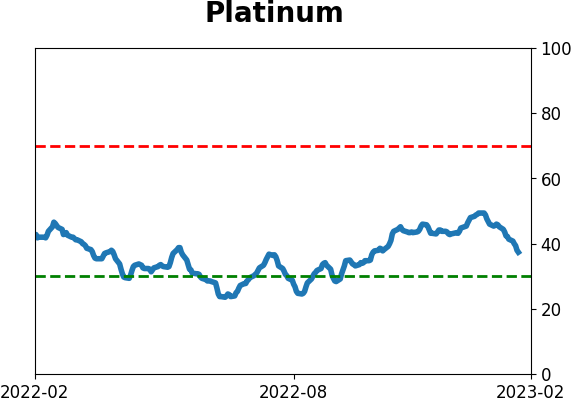
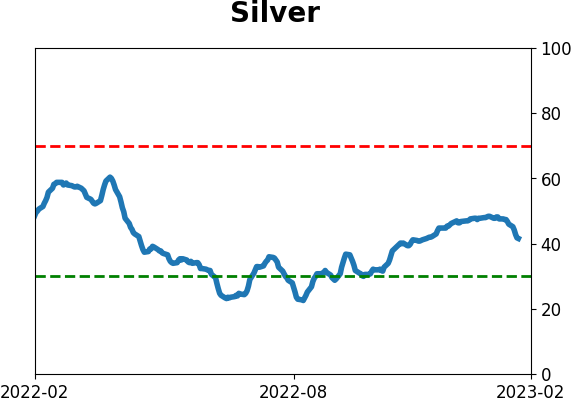
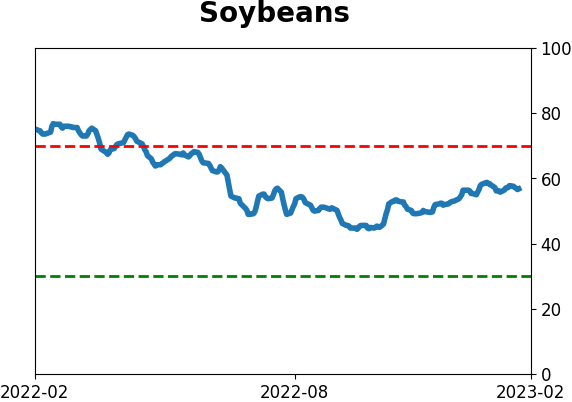
Optimism Index Thumbnails
|
|
|
|
|
|
|
|
|
|
|
|
|
|
|
|
|
|
|
|
|