Headlines
|
|
A historic shift toward Defensive and Value stocks:
Heading into this week, Defensive stocks outperformed Cyclical ones by more than 7% over the prior month. And Value stocks outperformed Growth by that same amount. When both "safe" factors outperformed their "riskier" counterparts by more than 7%, stocks struggled.
|
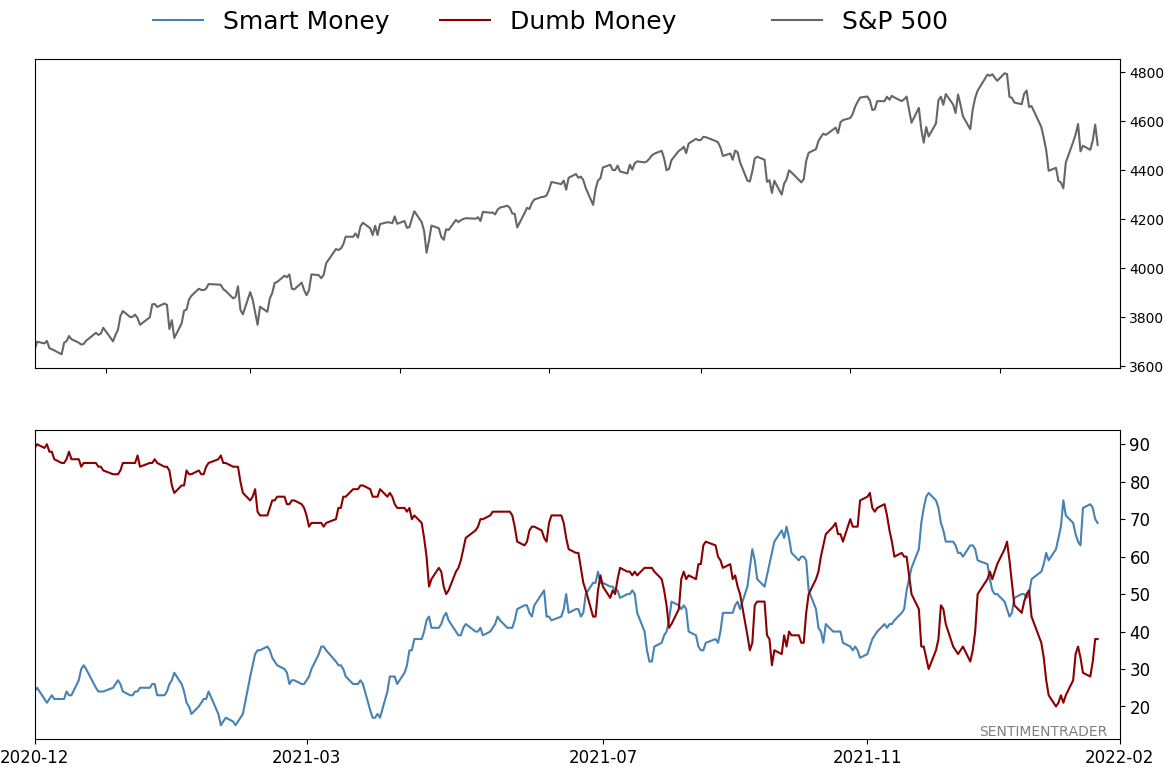
Smart / Dumb Money Confidence
|
Smart Money Confidence: 69%
Dumb Money Confidence: 38%
|
|
Risk Levels
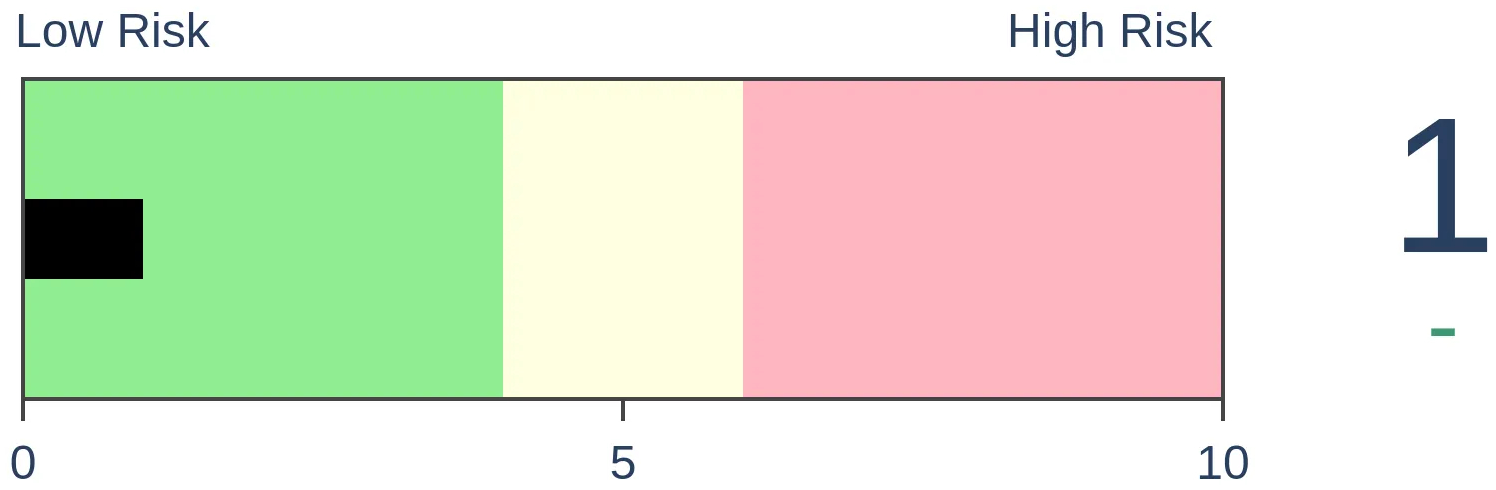
Stocks Short-Term
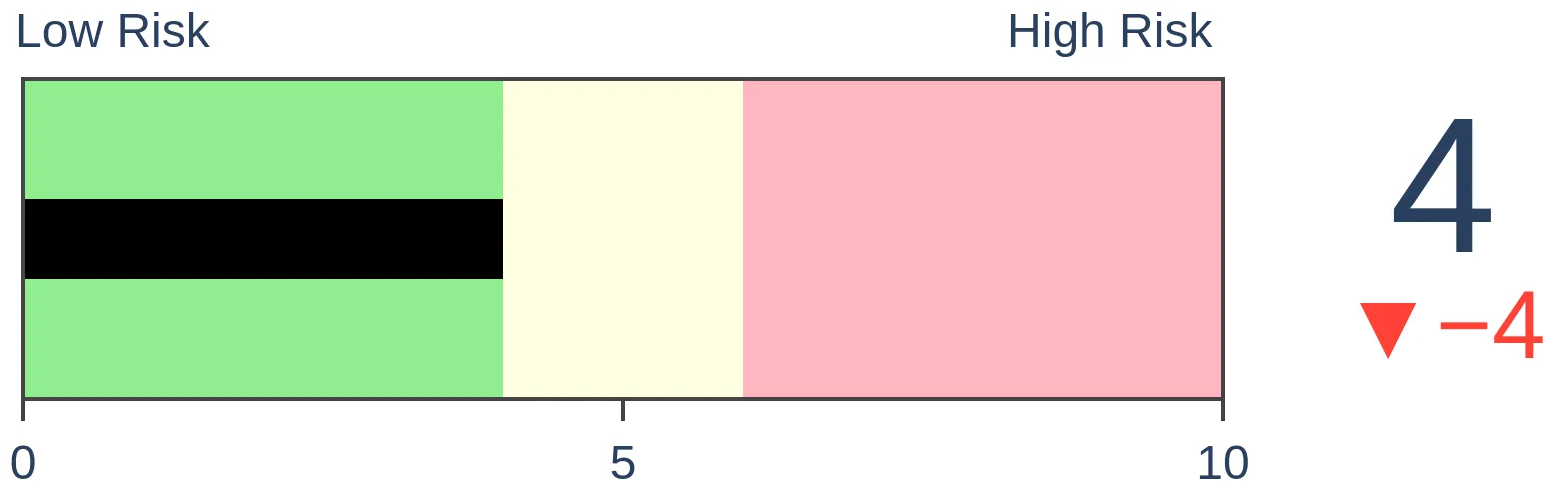
|
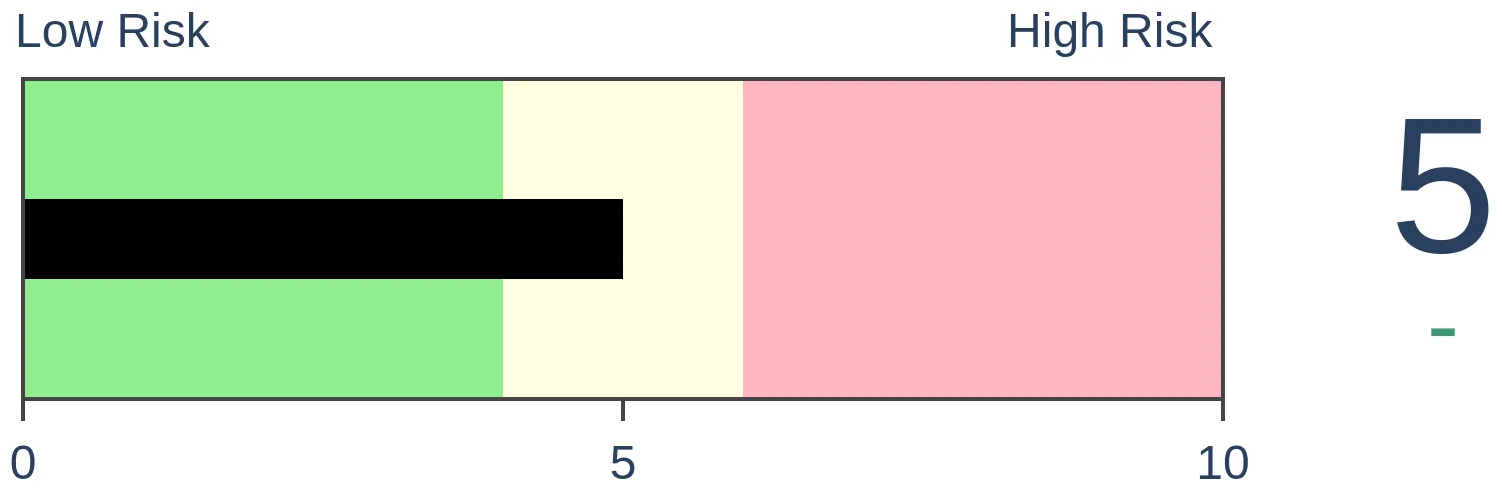
Stocks Medium-Term

|
|
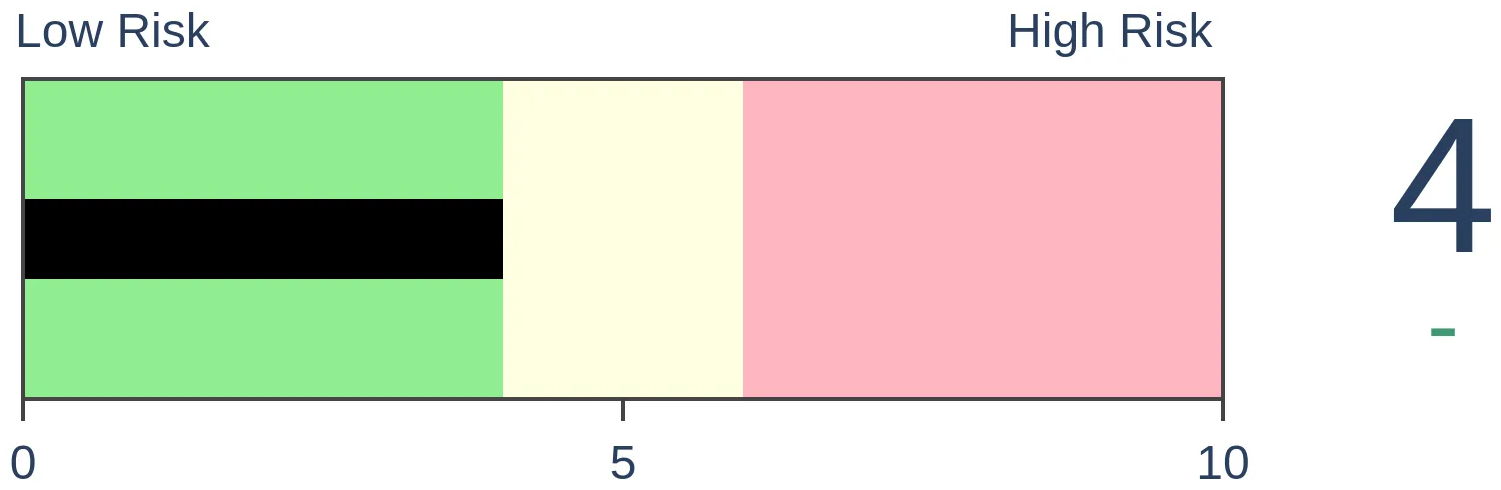
Bonds
|
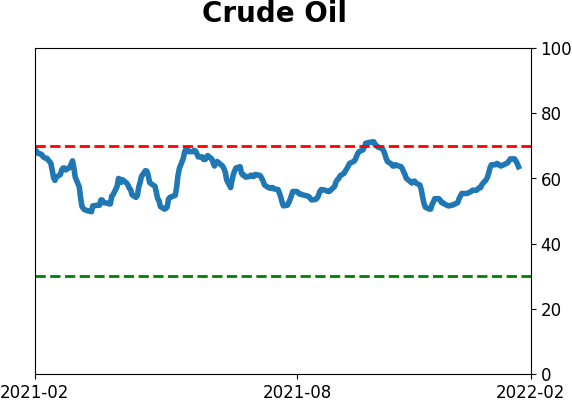
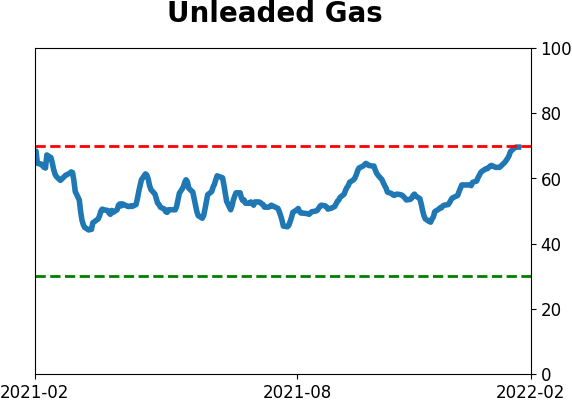
Crude Oil
|
|
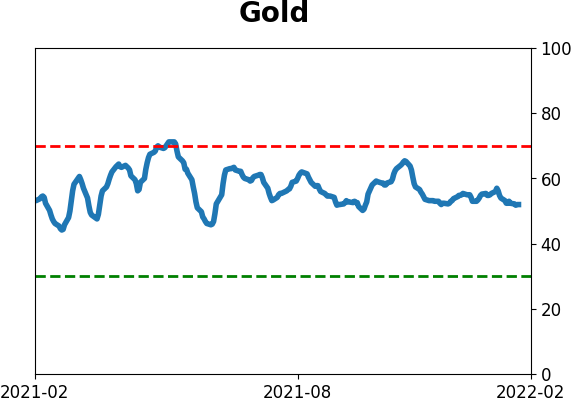
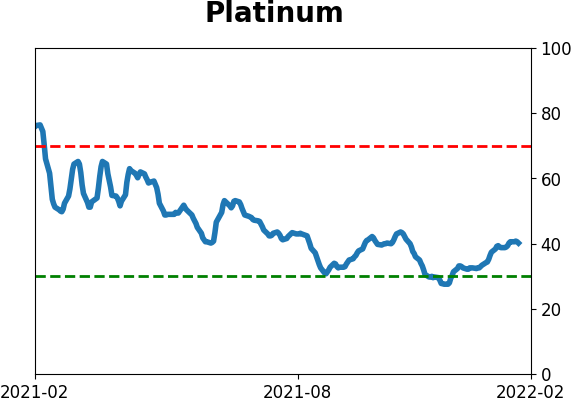
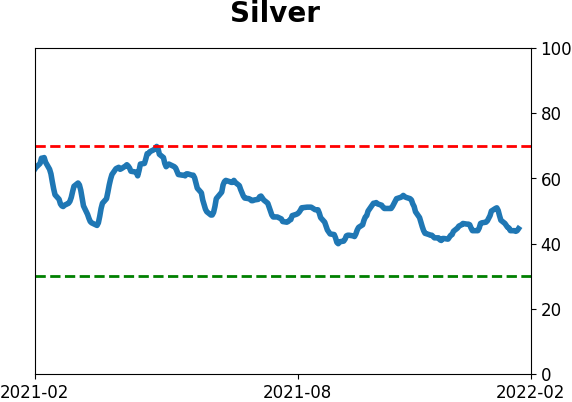
Gold

|
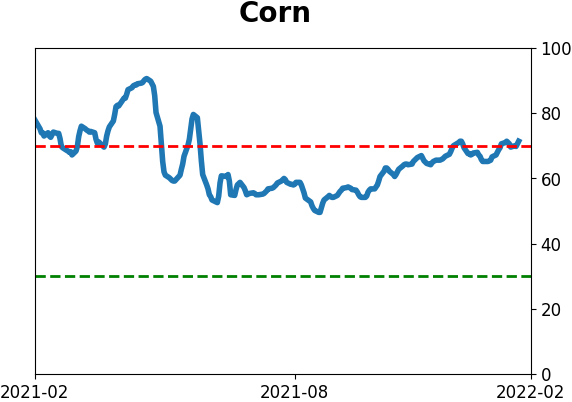
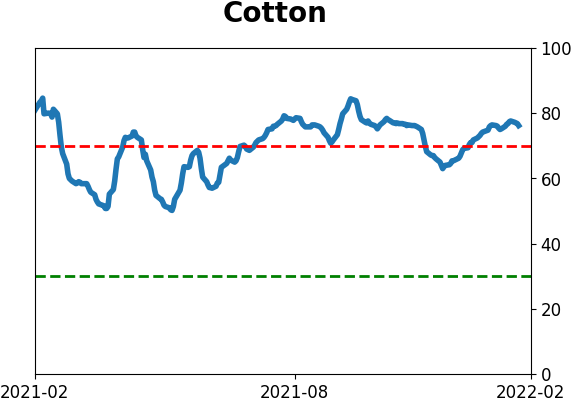
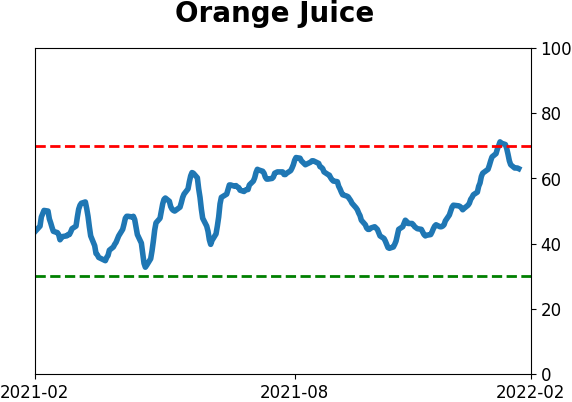
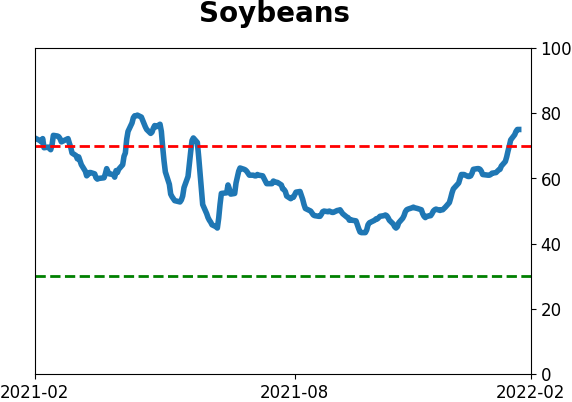
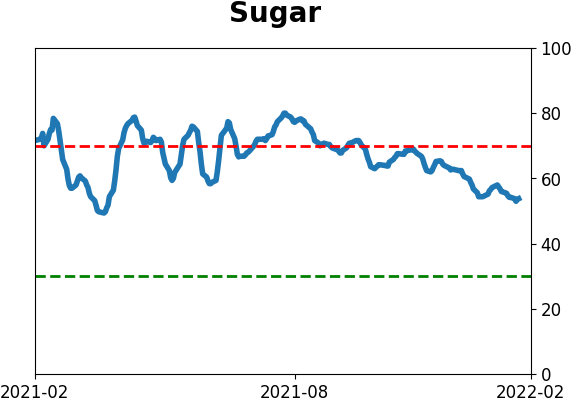
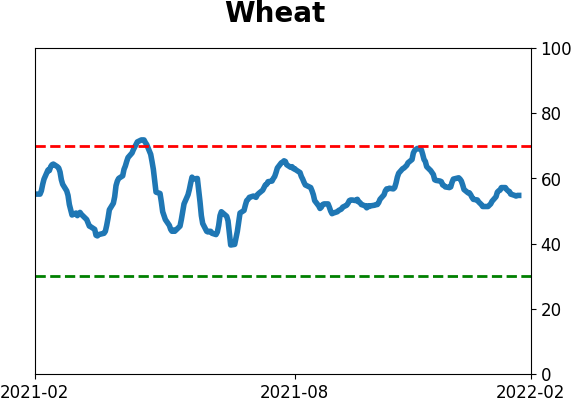
Agriculture
|
|
Research
By Jason Goepfert
BOTTOM LINE
Heading into this week, Defensive stocks outperformed Cyclical ones by more than 7% over the prior month. And Value stocks outperformed Growth by that same amount. When both "safe" factors outperformed their "riskier" counterparts by more than 7%, stocks struggled.
FORECAST / TIMEFRAME
None
|
Key points:
- Defensive stocks outperformed Cyclical ones by more than 7% over the past month
- Value outperformed Growth, also by more than 7%
- When both "safe" factors outperformed their "risky" counterparts by so much, stocks struggled
Investor preference for Defensive and Value stocks hits historical proportions
Over the past month, we've seen a massive shift. Investor sentiment turned sour on Cyclical and Growth stocks, greatly favoring Defensive and Value factors.
It has eased back over the past few days as risk appetite made a comeback, but using a rolling 21-day lookback, Defensive stocks outperformed Cyclical by more than 7%. So did Value stocks over Growth. Both ratios eased a bit in recent days, but their outperformance is still notable and is among the most extreme moves in years.
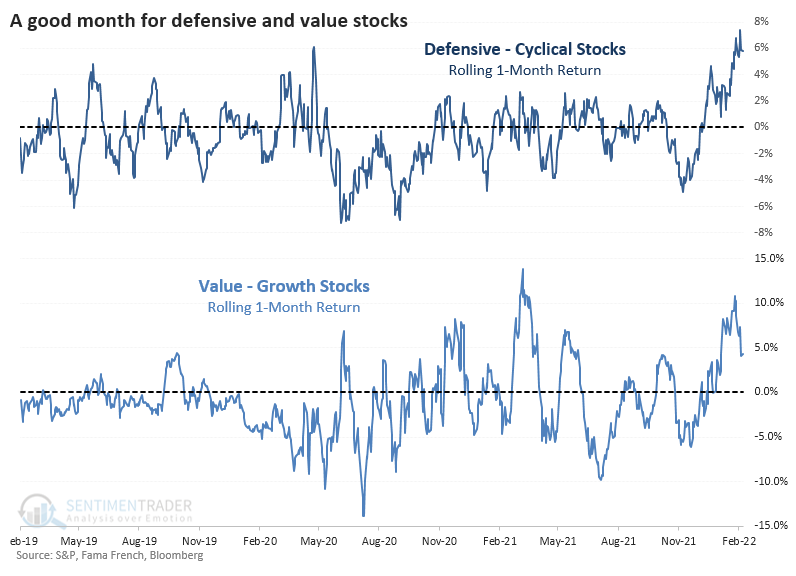
Going back to 1928, this 7% relative outperformance in both Defensive and Value stocks is remarkable. The chart below shows the minimum rolling 1-month return between Defensive - Cyclical stocks and Value - Growth stocks. If it's positive, then it means that investors favored both Defensive and Value stocks.
Not only was the recent spread positive, it was also historically so. There have only been a few other times since 1928 when investors so heavily favored Defensive and Value stocks over Cyclical and Growth.
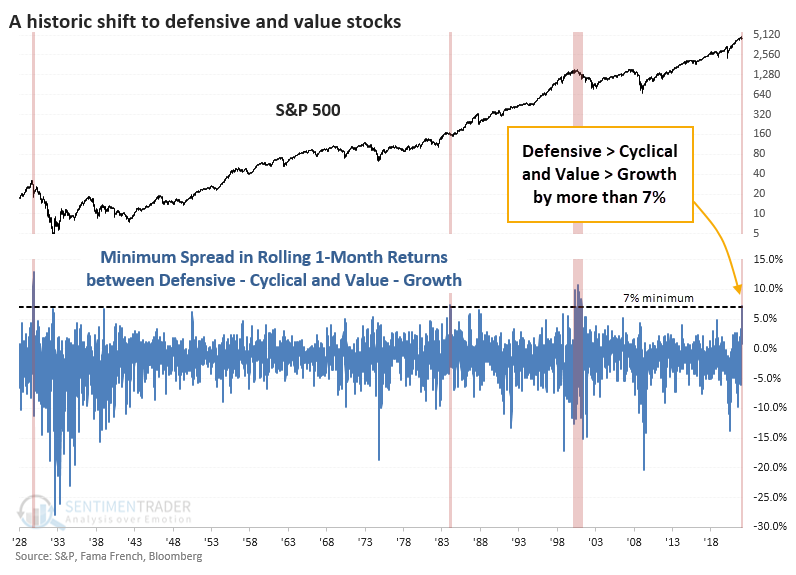
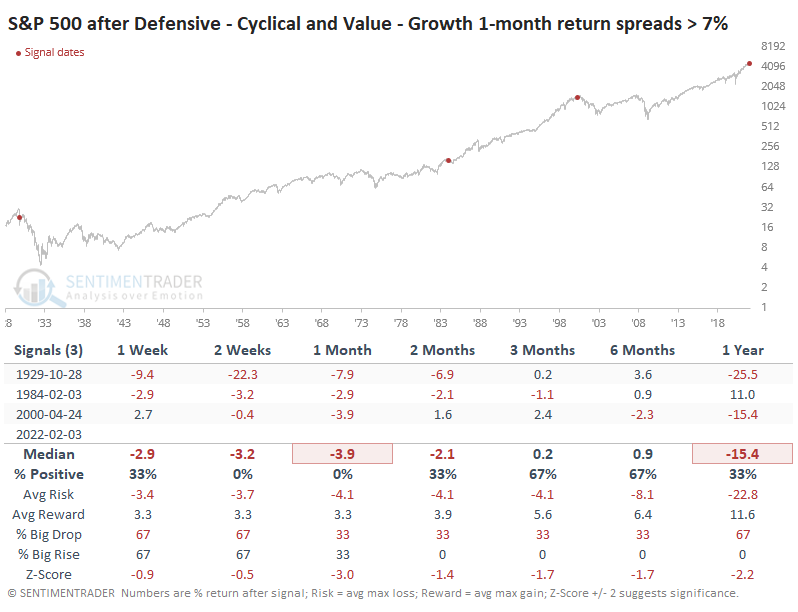
It would be easy to highlight 1929 and 2000 and suggest this is a sign of the apocalypse. It's harder to reconcile 1984, which preceded a few months of choppiness, then a fantastic bull run.
Lesser outperformance for Defensive and Value stocks preceded better returns
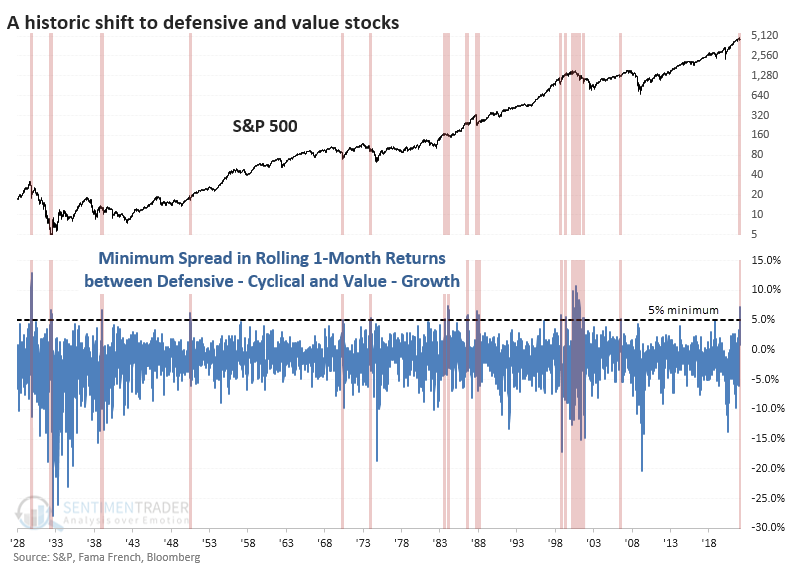
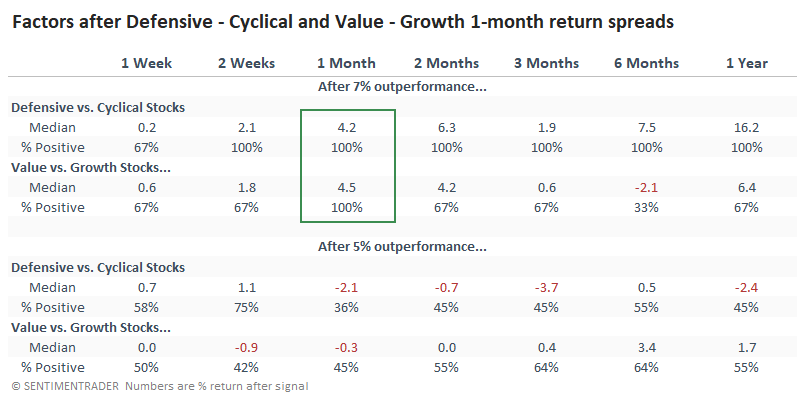
It's hard to rely on a sample size of 3. If we relax the threshold to 5% outperformance, then we get quite a few more precedents, though the last signal was still 16 years ago.
Looking at forward returns after those signals, returns in the S&P 500 improved and were quite good over all time frames. Since 1950, almost all the signals showed a positive return over the next 1-3 months, and most of them extended those gains in the months ahead.
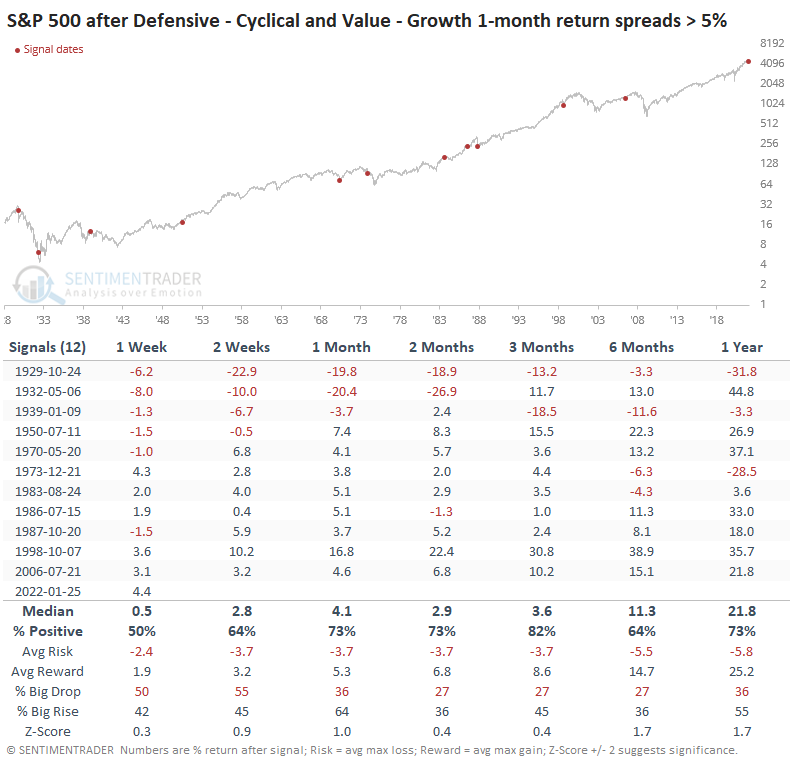
Returns in the factors themselves were mixed. After the few periods of 7% outperformance, Defensive stocks continued to outperform Cyclicals and Value stocks outperformed Growth. But again, a sample size of 3. Unfortunately, the implications weren't consistent when we reduced the threshold to 5% outperformance. After those signals, there was much less consistency.
What the research tells us...
This is one of those tough periods when we have to judge how much weight to give the outstanding outperformance of Defensive and Value stocks. The few precedents are clear that stocks, in general, tended to suffer, with Defensive and Value stocks adding to their gains versus higher-risk factors. But a modest reduction in the extreme greatly changed the outcomes, which makes it much harder to rely on the signal as an input.
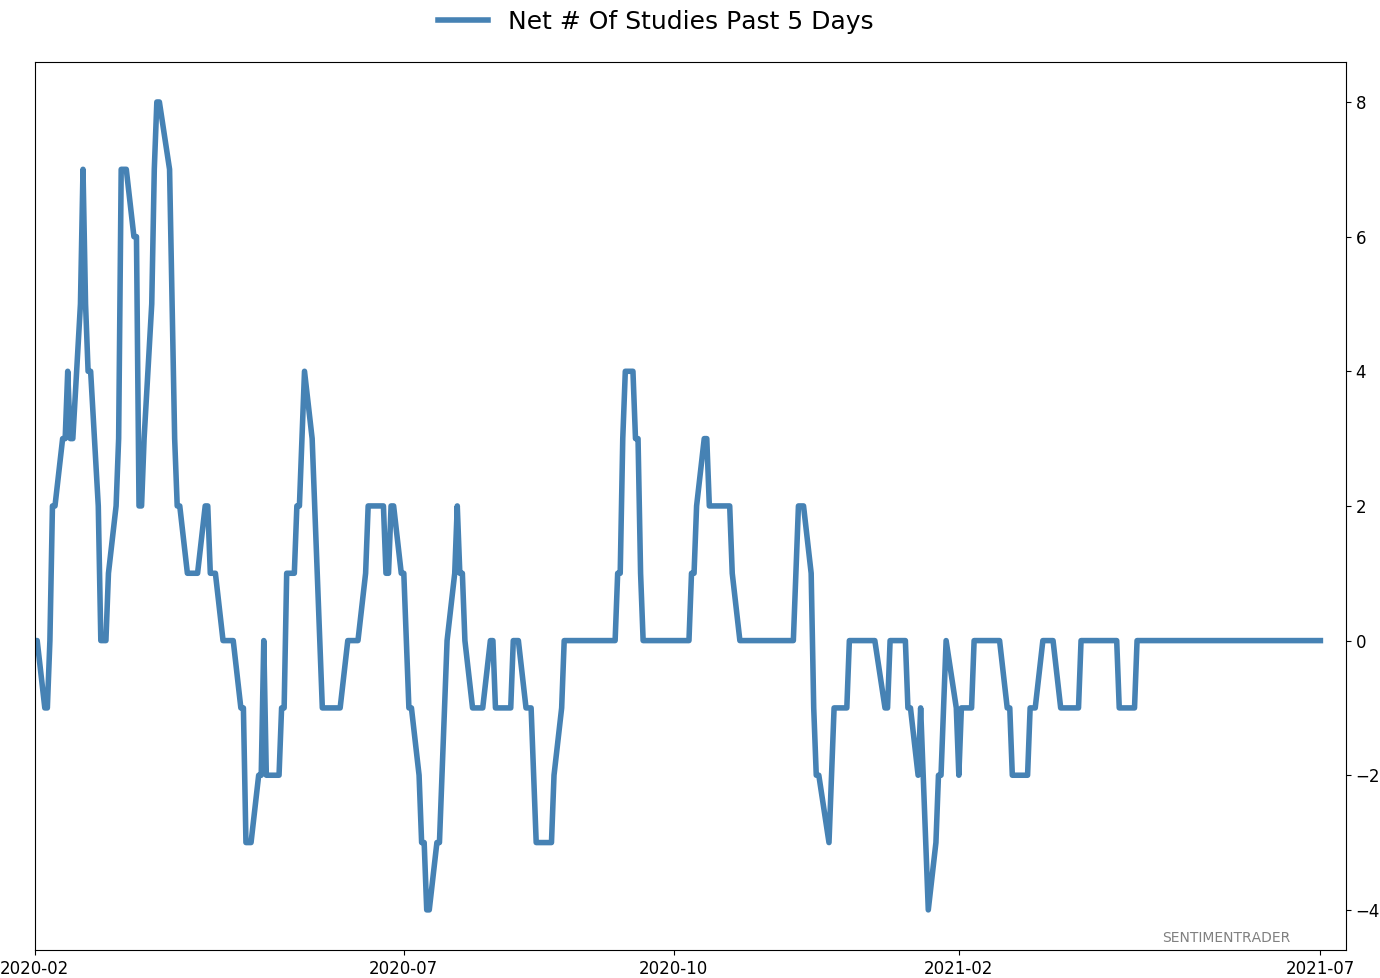
Active Studies
| Time Frame | Bullish | Bearish | | Short-Term | 3 | 0 | | Medium-Term | 17 | 2 | | Long-Term | 15 | 5 |
|
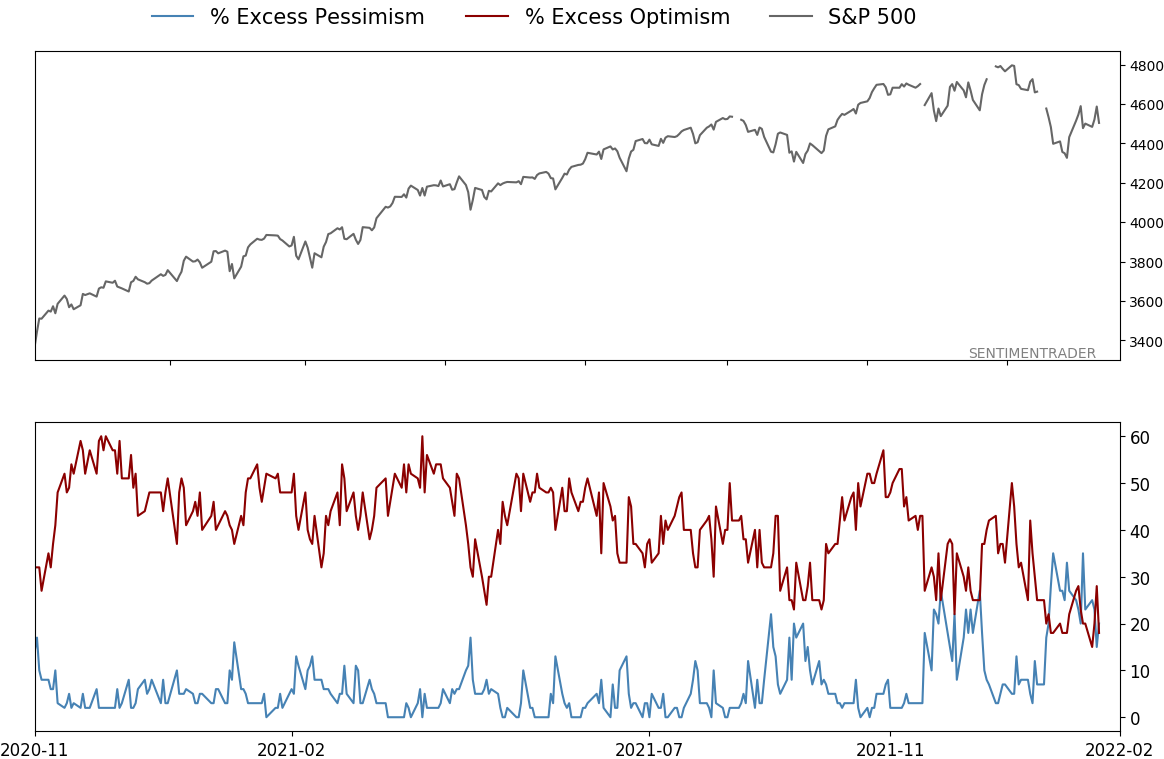
Indicators at Extremes
Portfolio
| Position | Description | Weight % | Added / Reduced | Date | | Stocks | RSP | 21.4 | Added 10.2% | 2022-01-28 | | Bonds | 32.7% BND, 7.1% SCHP | 40.1 | Added 8.3% | 2021-10-26 | | Commodities | GCC | 2.4 | Reduced 2.1%
| 2020-09-04 | | Precious Metals | GDX | 4.6 | Reduced 4.2% | 2021-05-19 | | Special Situations | 8.1% KWEB, 3.6% XLE, 1.7% PSCE | 13.4 | Reduced 3.9% | 2022-01-18 | | Cash | | 17.9 | | |
|
Updates (Changes made today are underlined)
With a typical time frame of several months in this account, I normally don't make changes so quickly. I've added back part of the stock exposure I took off earlier in January due to the washed-out conditions and extreme pessimism we're seeing across a wide array of metrics. The biggest issue is that the environment is unhealthy and we could be in the throes of a protracted bear market. Even so, the readings we've seen recently have a good record at preceding relief rallies, so we'll have to see how that pans out. Bond sentiment is trying to recover from a recent bout of pessimism, and gold stocks are doing their thing which is not much at all. They've been flat for six months. Chinese tech stocks were doing exactly what they're supposed to do, then did *not* by plunging to new lows. This is troubling on a shorter-term time frame, but this was never meant for a trade, rather a multi-year investment. Recent behavior is troubling and I will not be adding any exposure as long as that's the case. RETURN YTD: -0.2% 2021: +8.7%, 2020: +8.1%, 2019: +12.6%, 2018: +0.6%, 2017: +3.8%, 2016: +17.1%, 2015: +9.2%, 2014: +14.5%, 2013: +2.2%, 2012: +10.8%, 2011: +16.5%, 2010: +15.3%, 2009: +23.9%, 2008: +16.2%, 2007: +7.8%
|
|
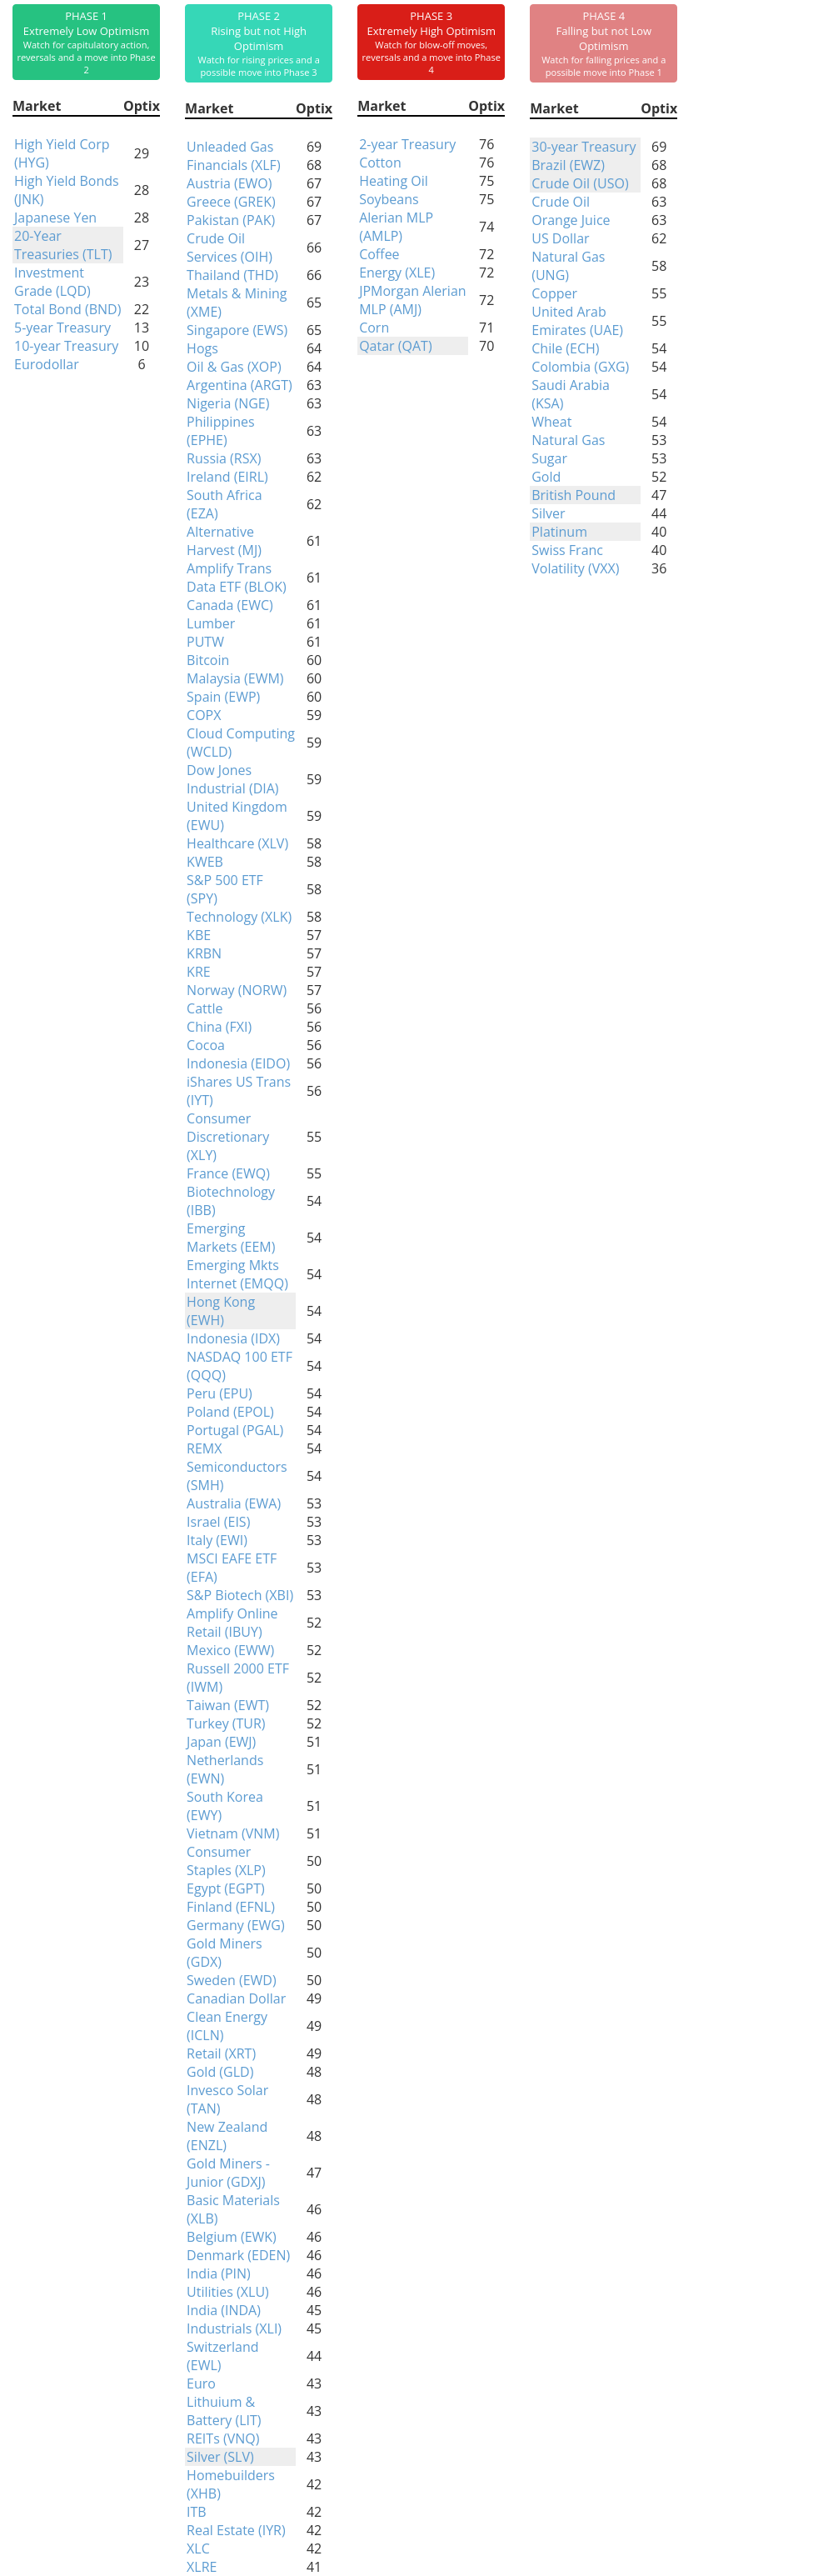
Phase Table
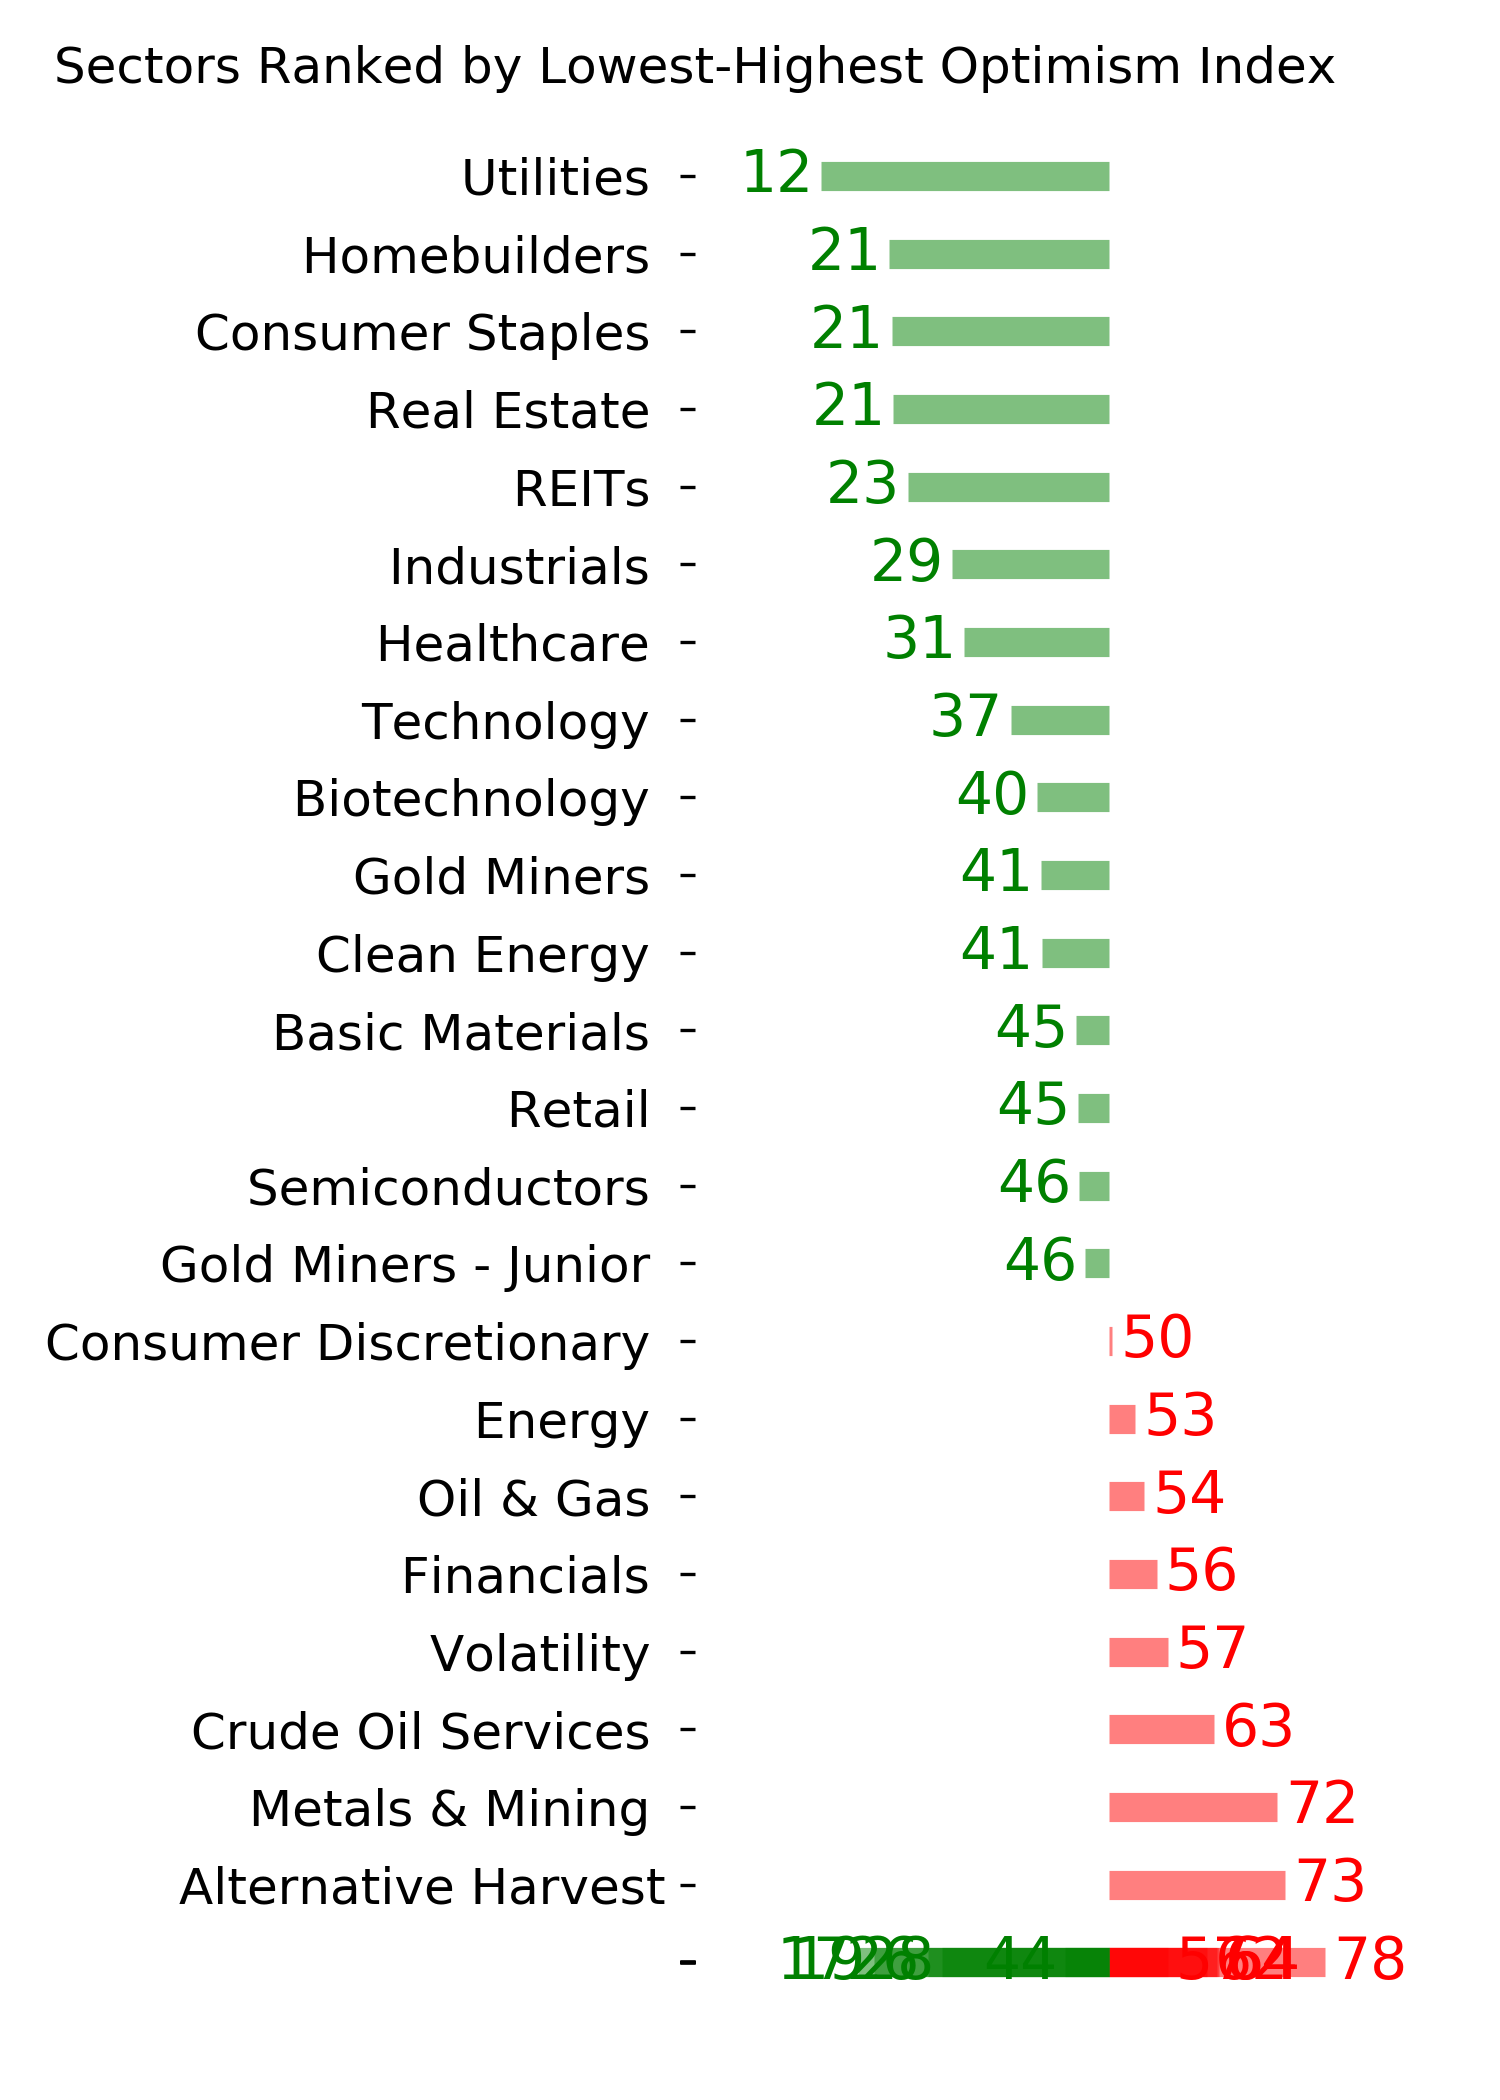
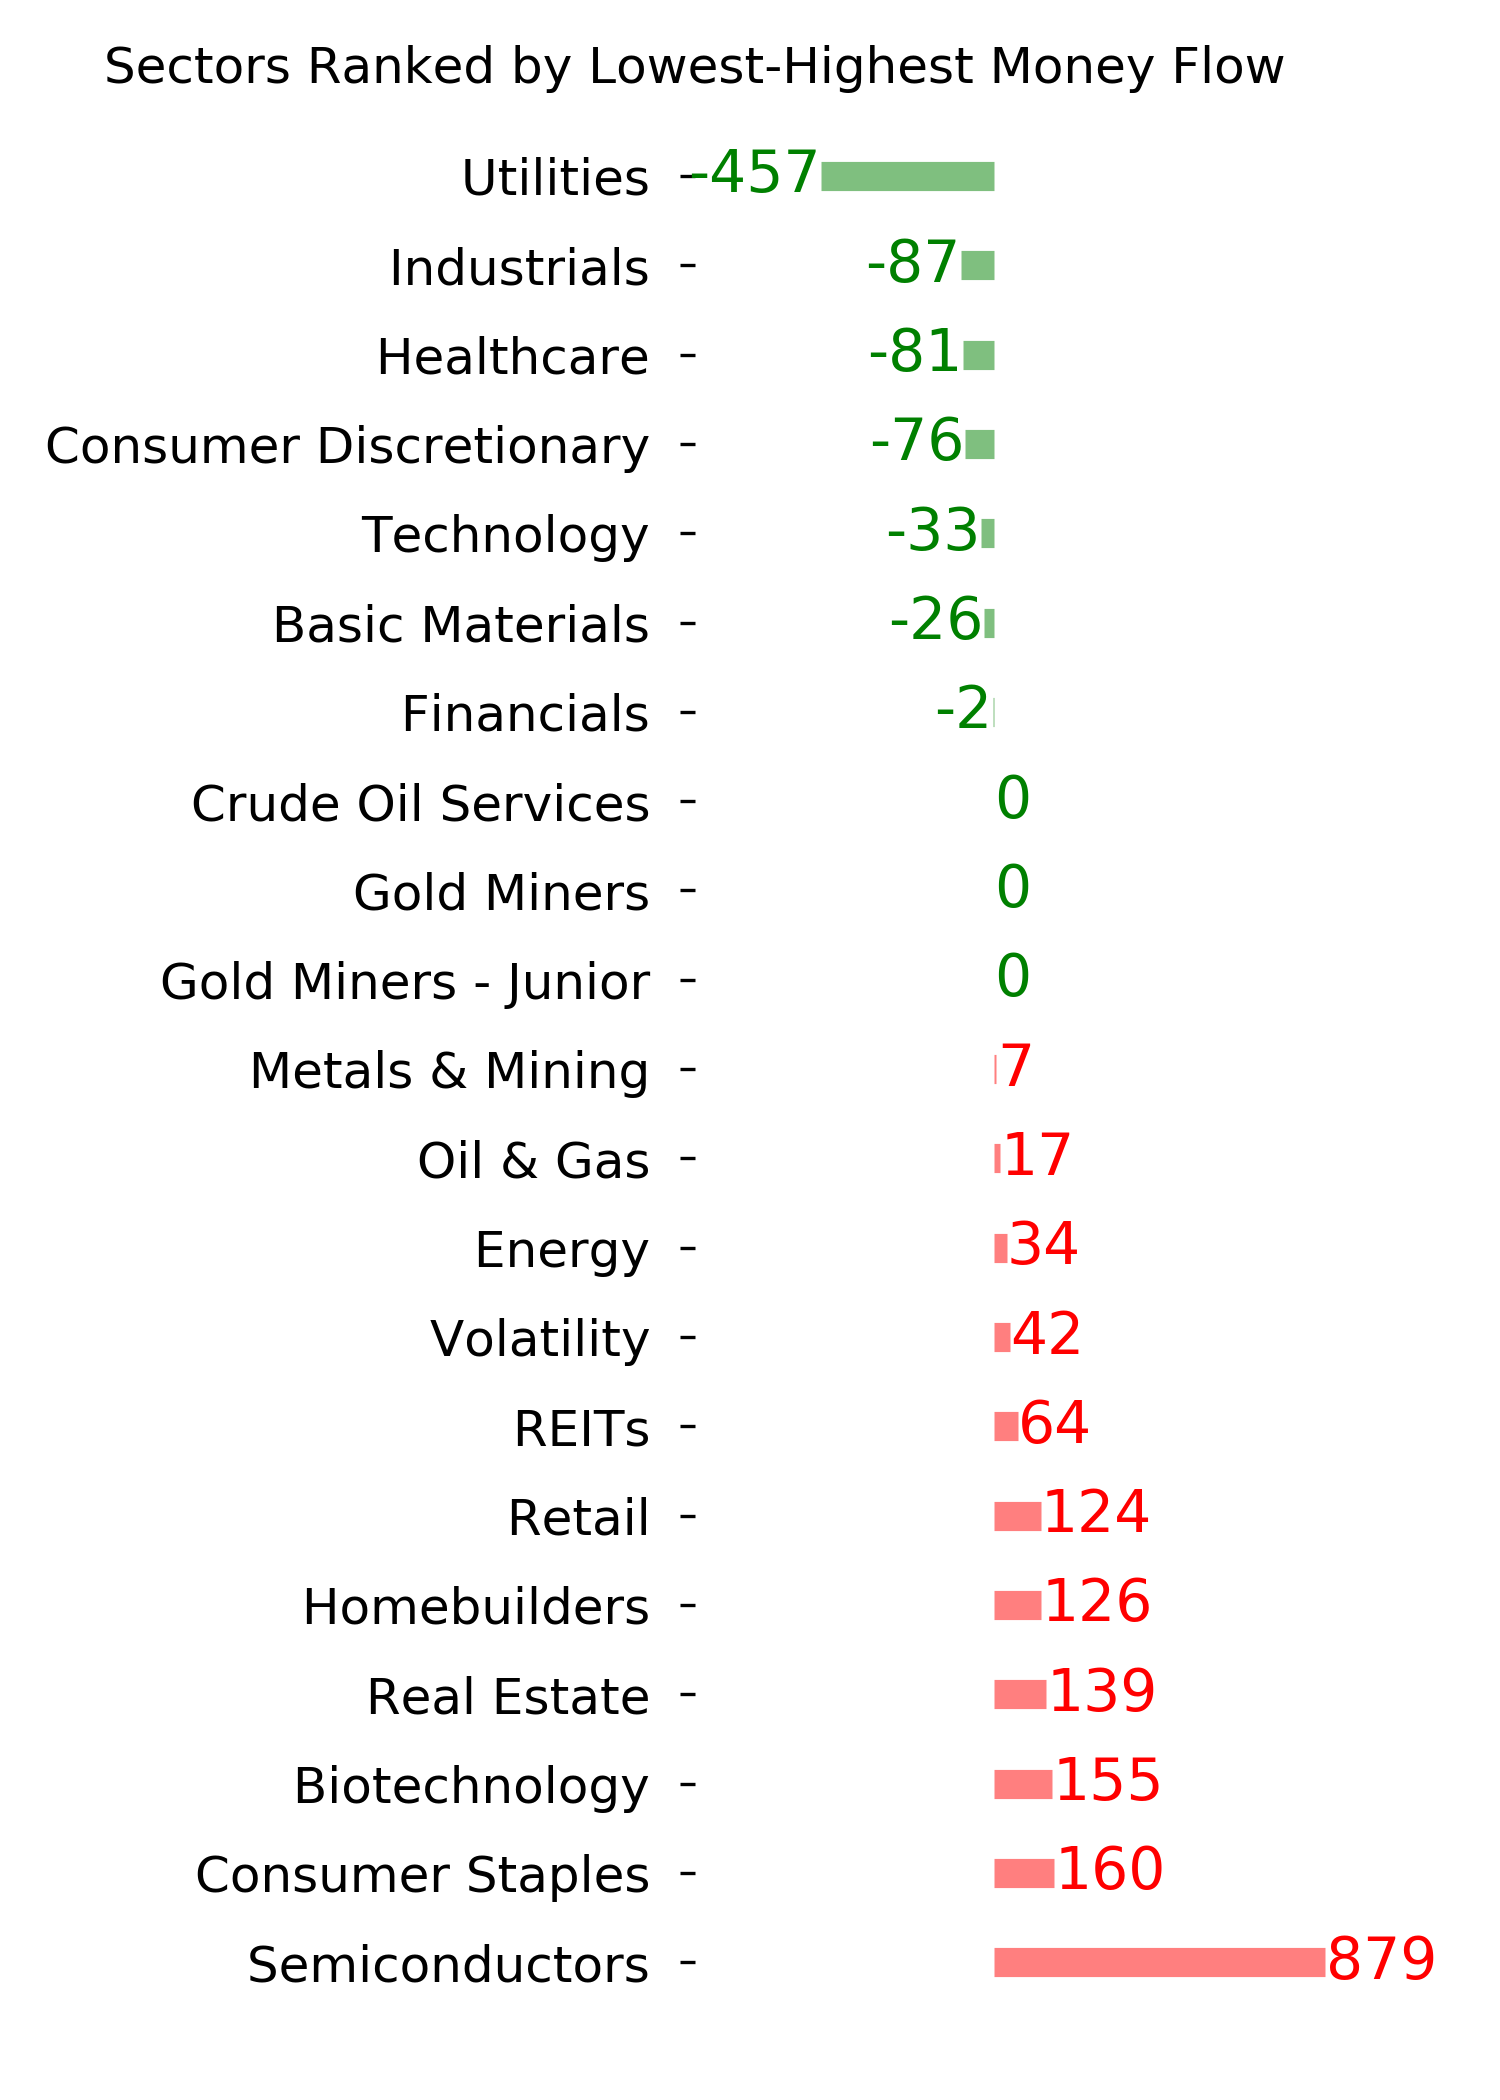
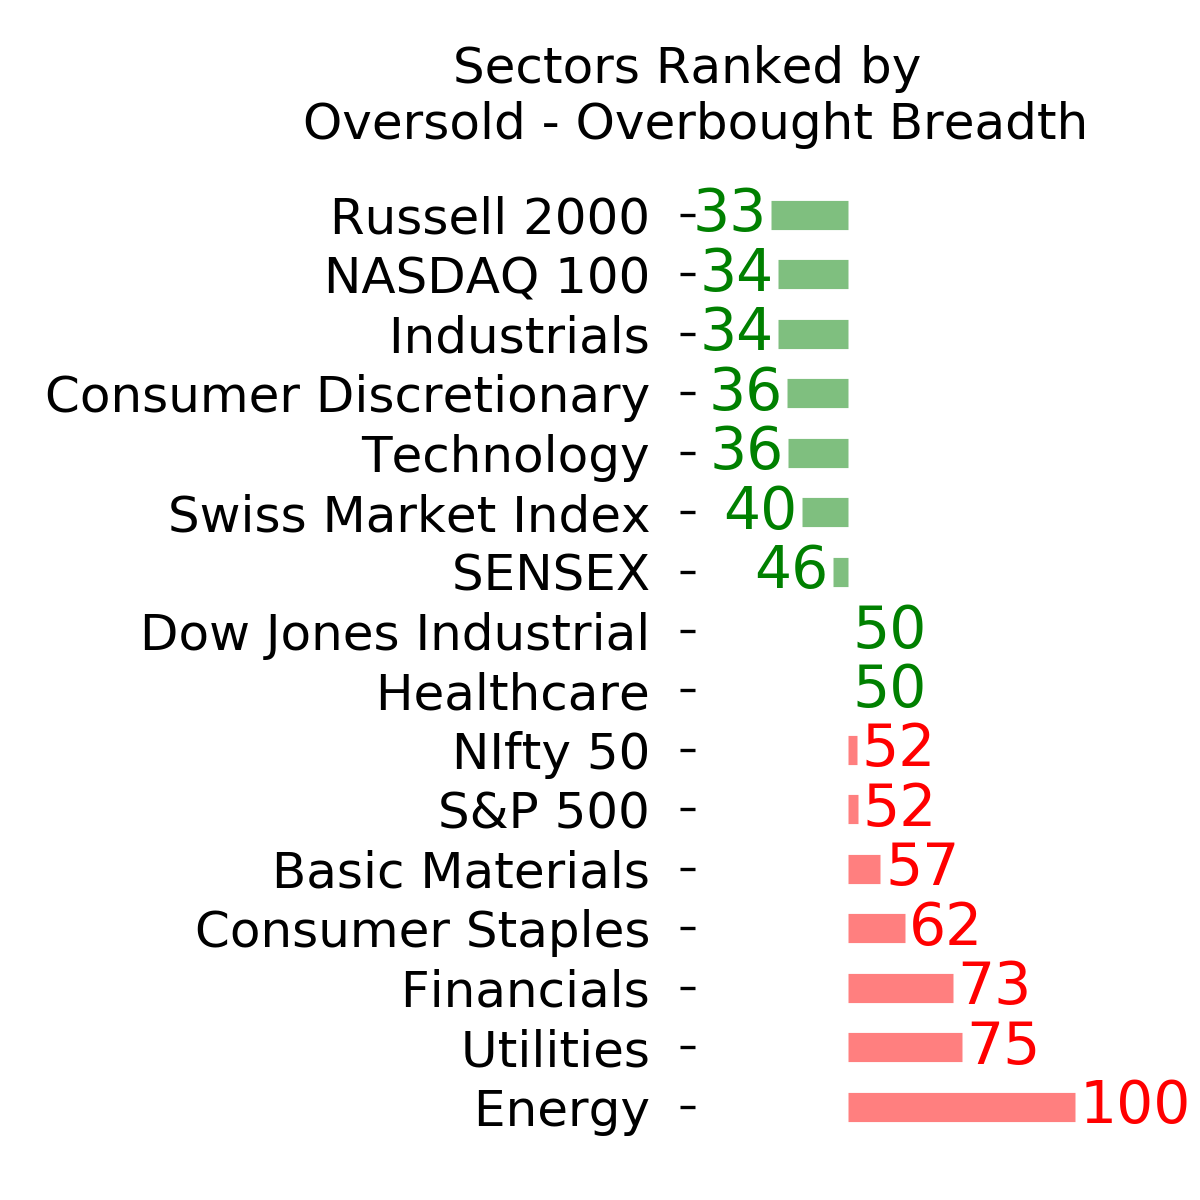
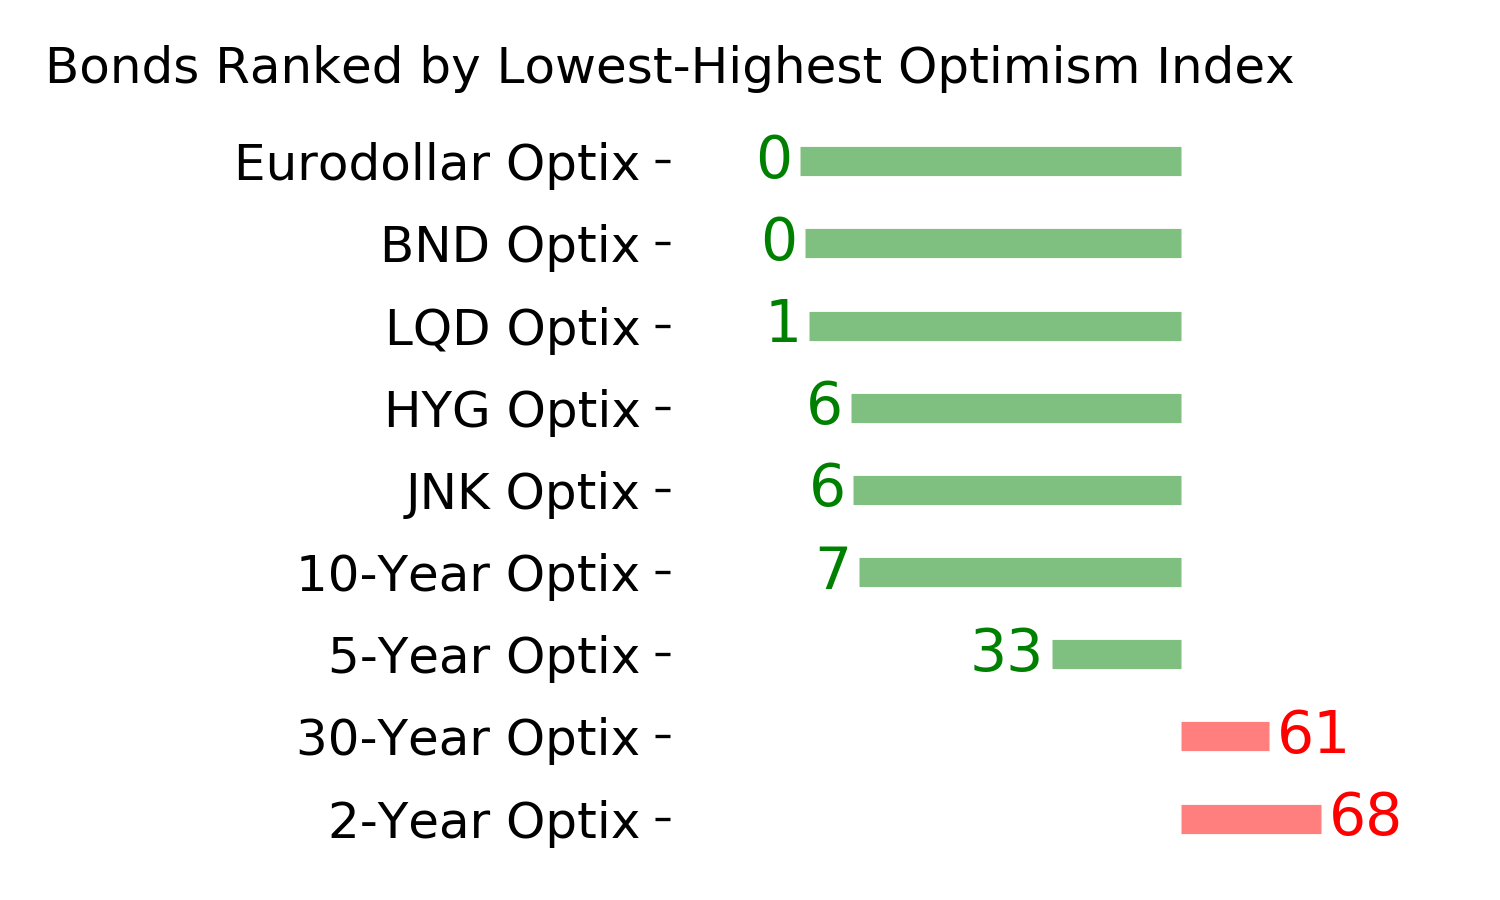
Ranks
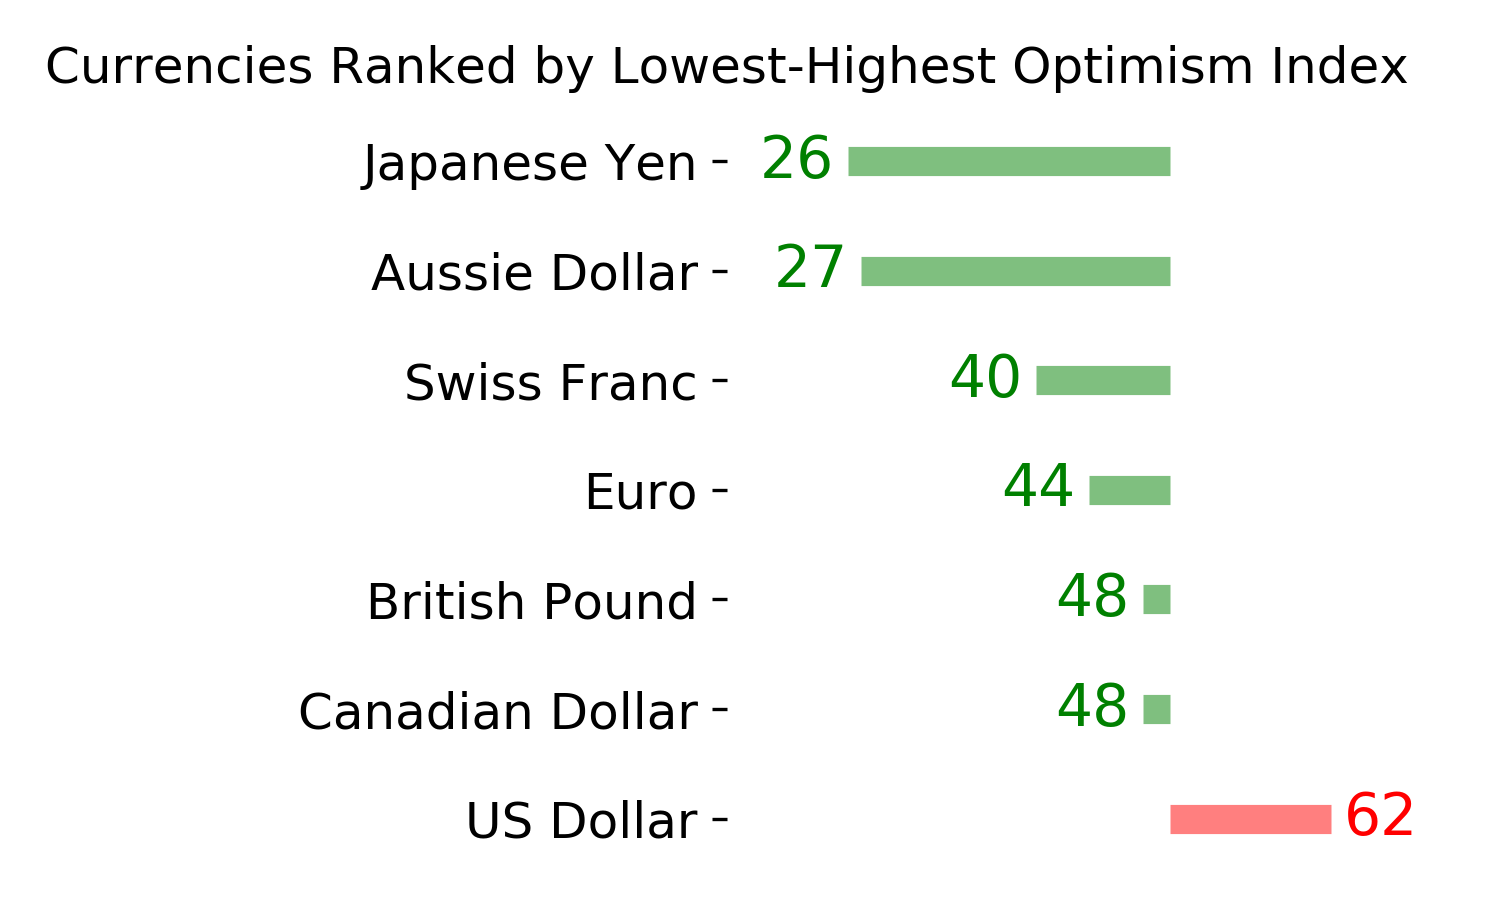
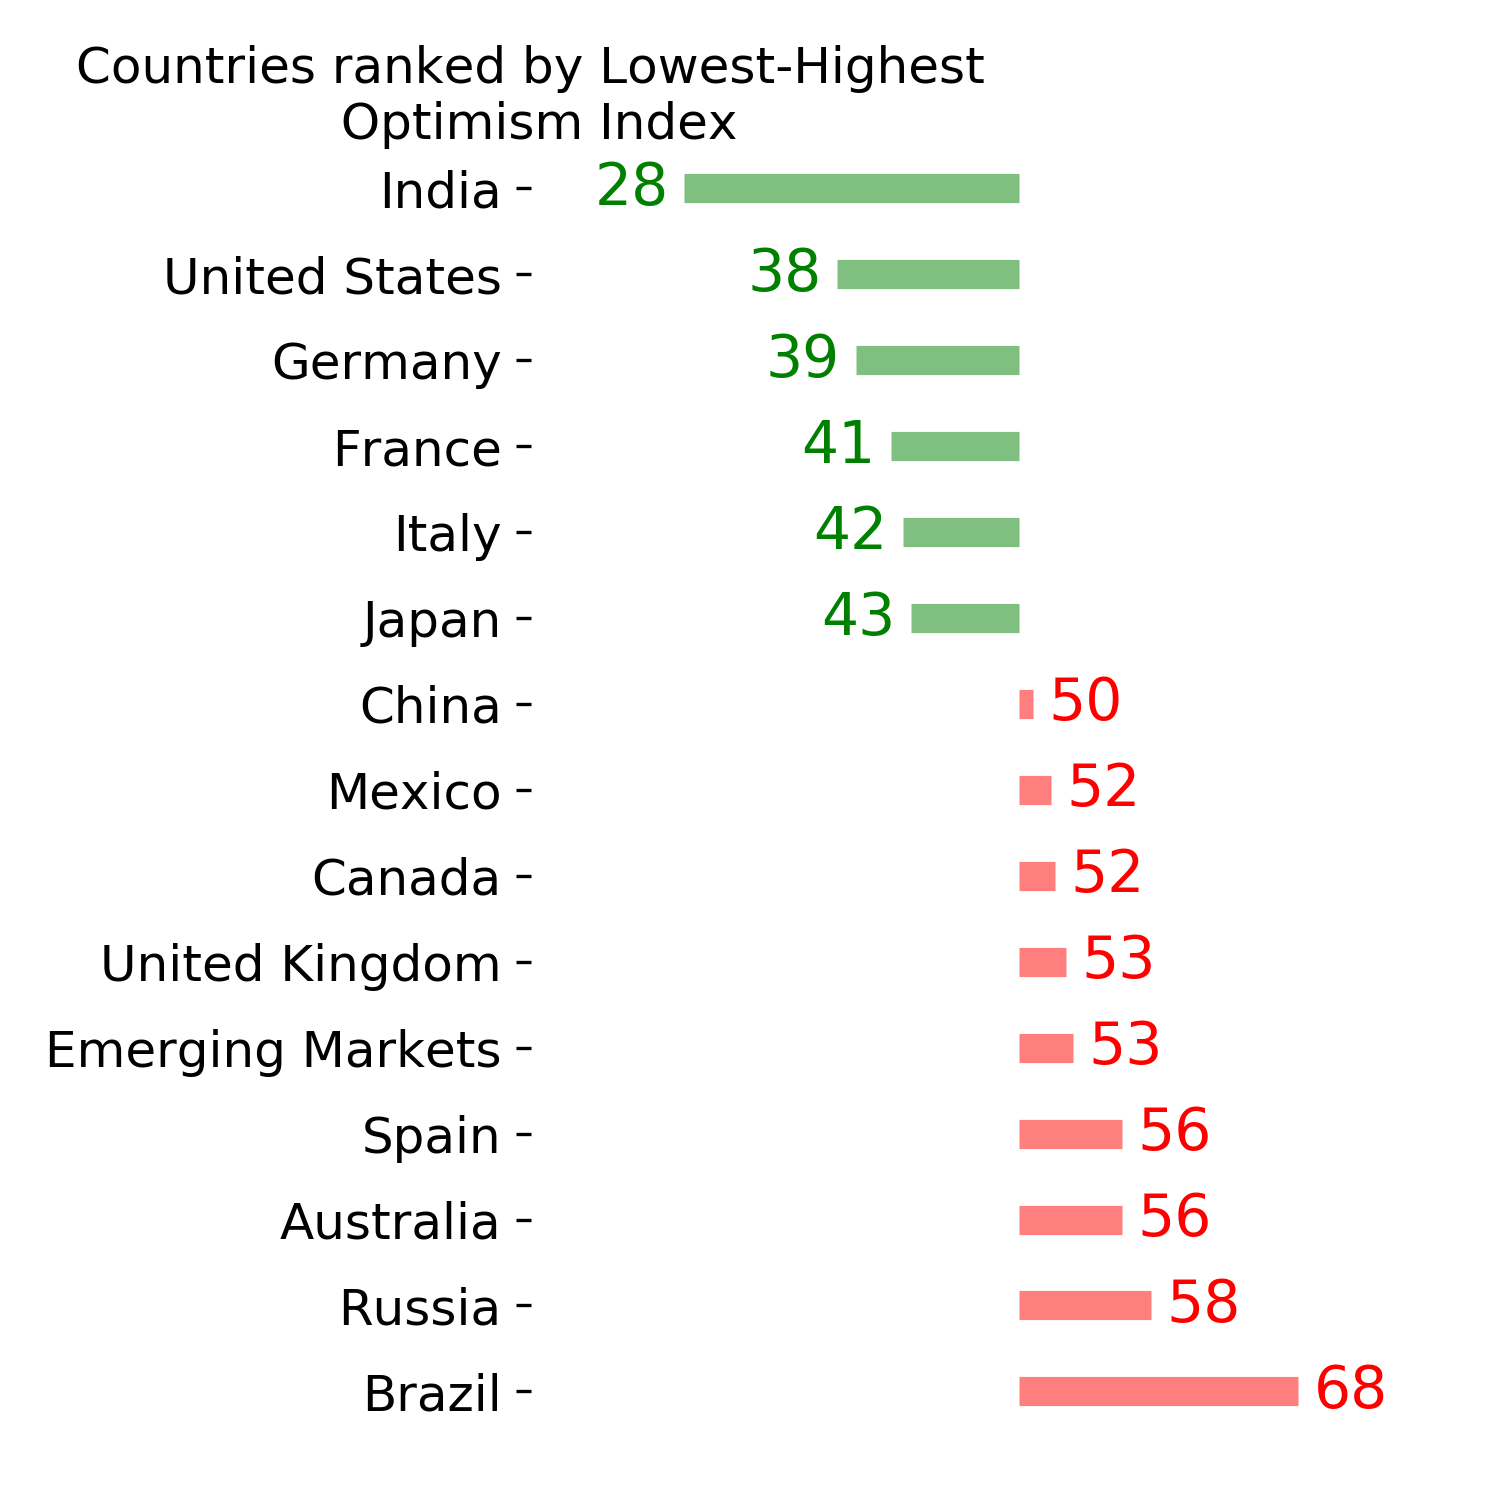
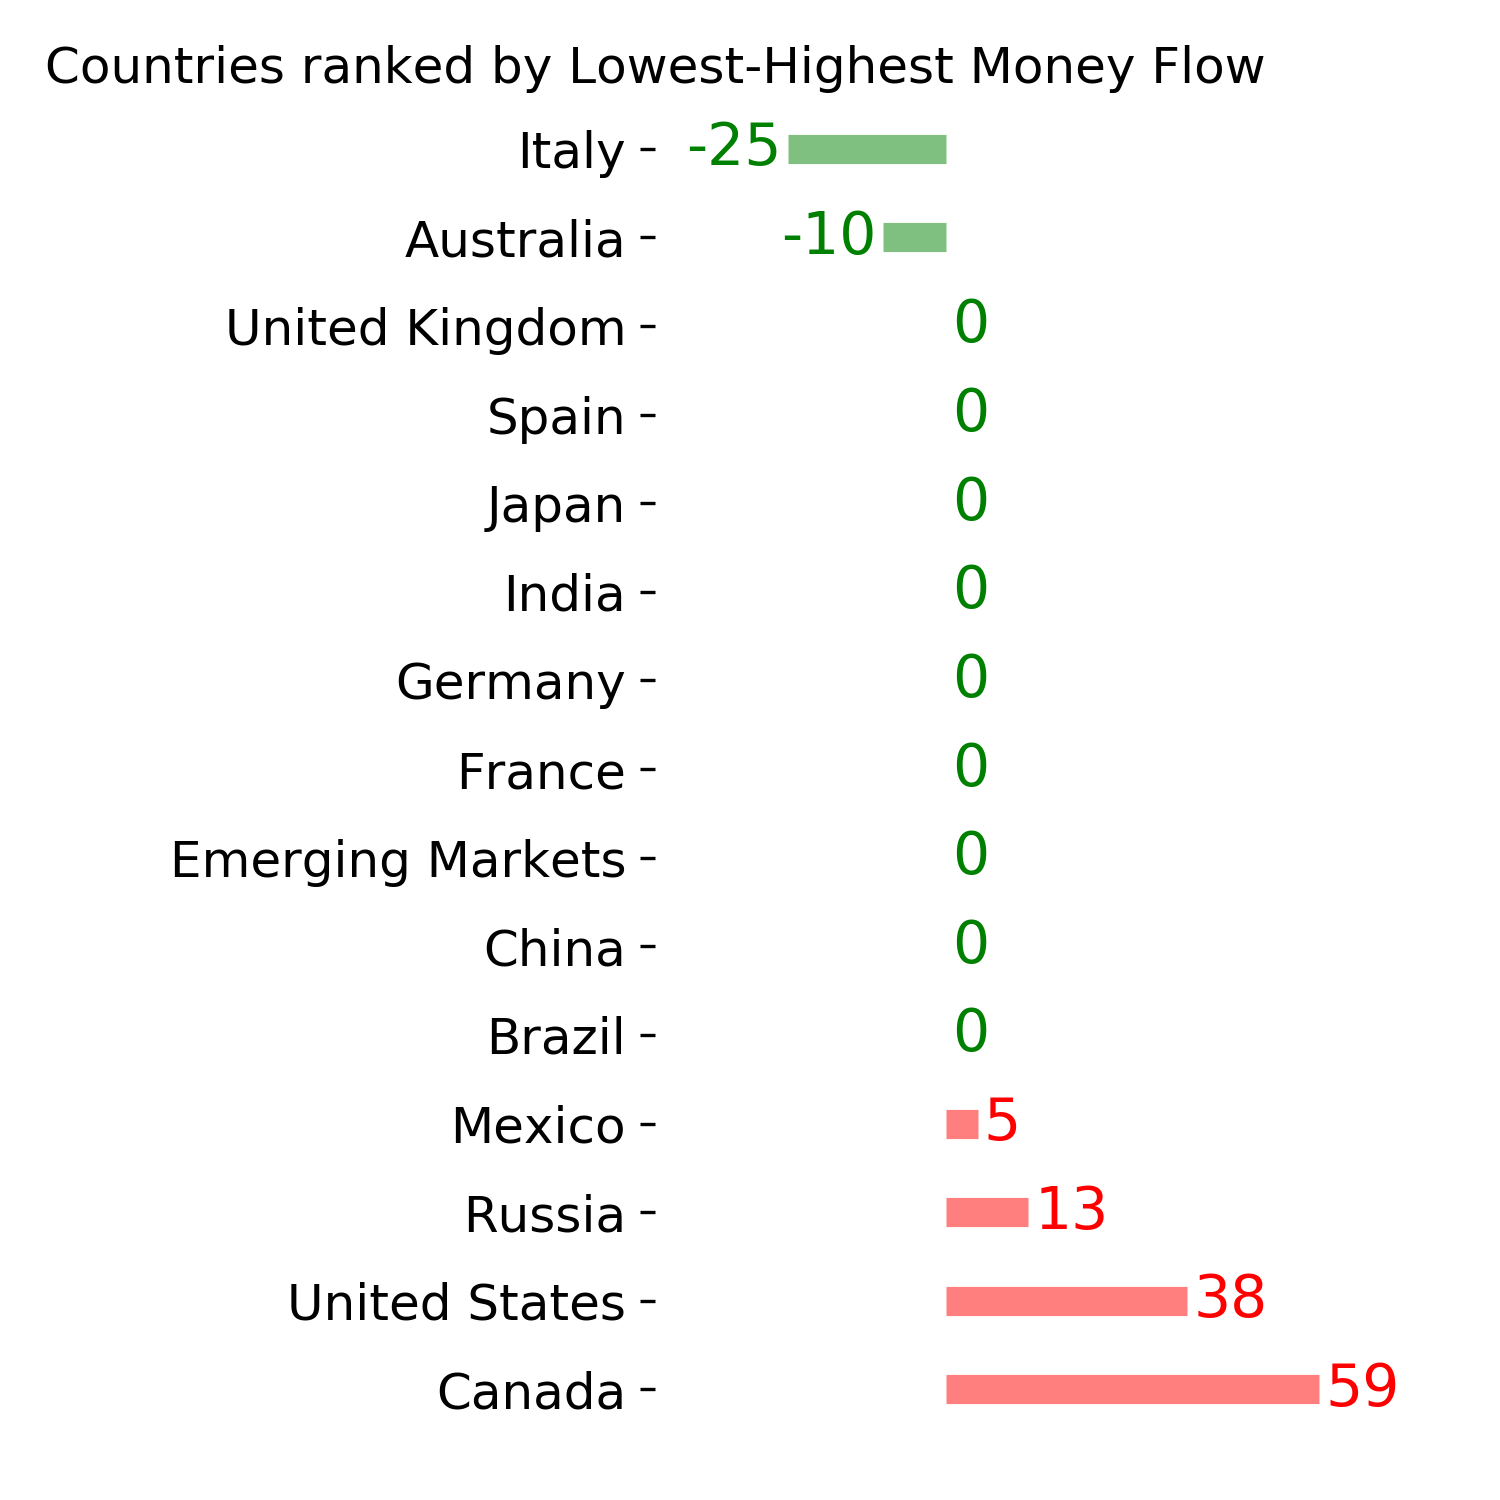
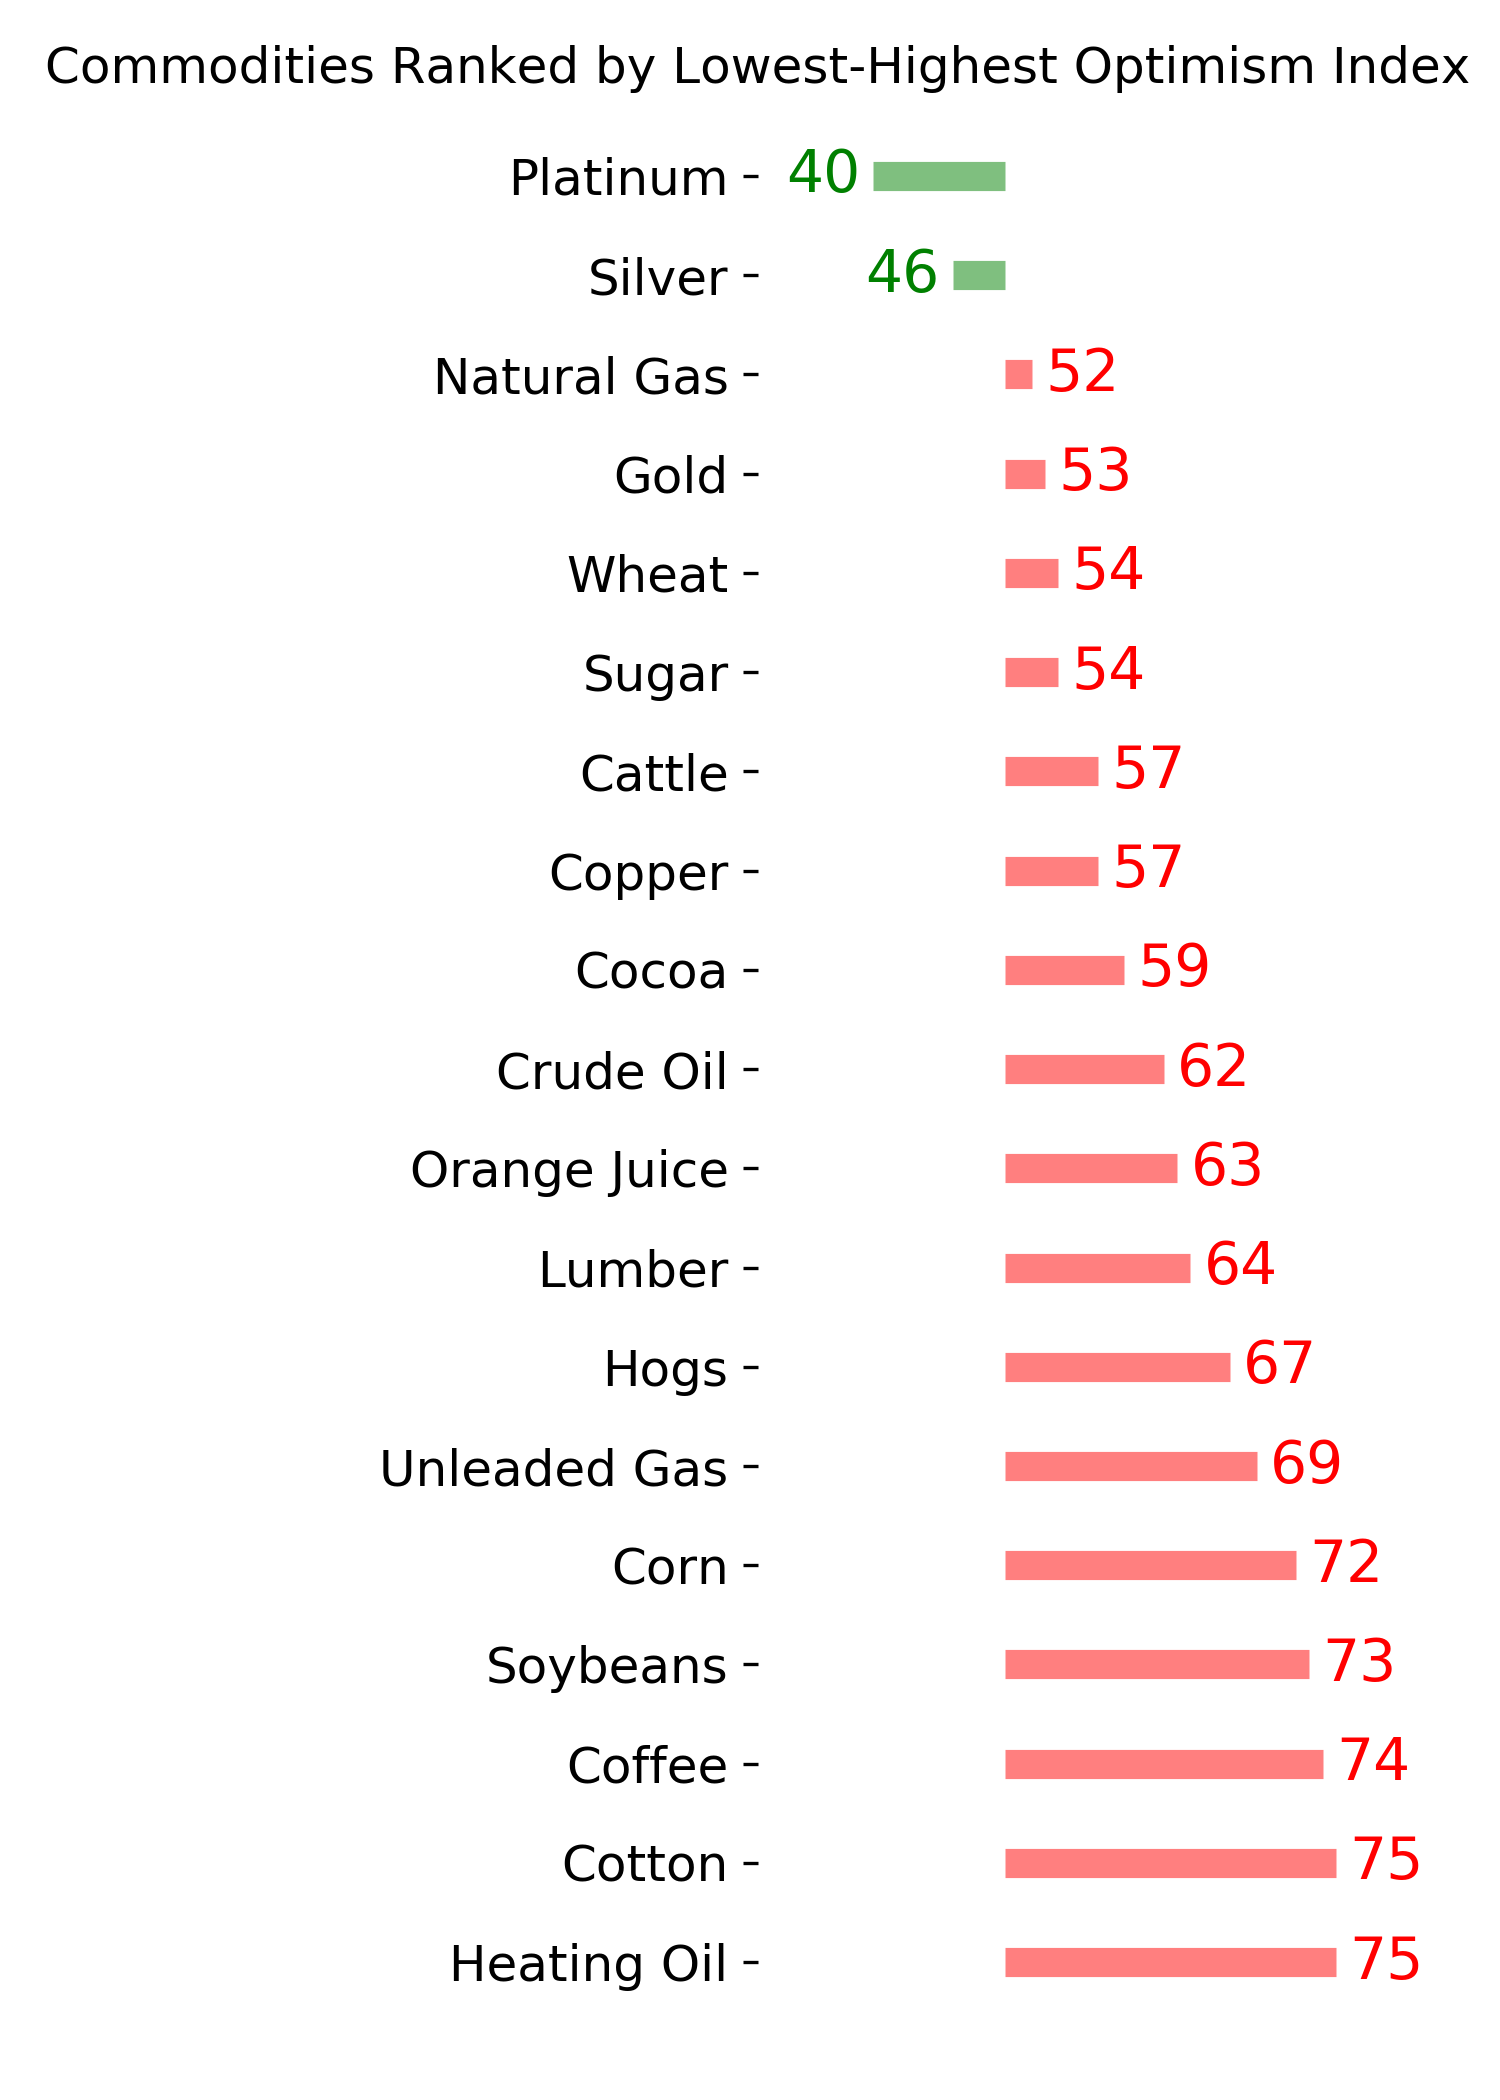
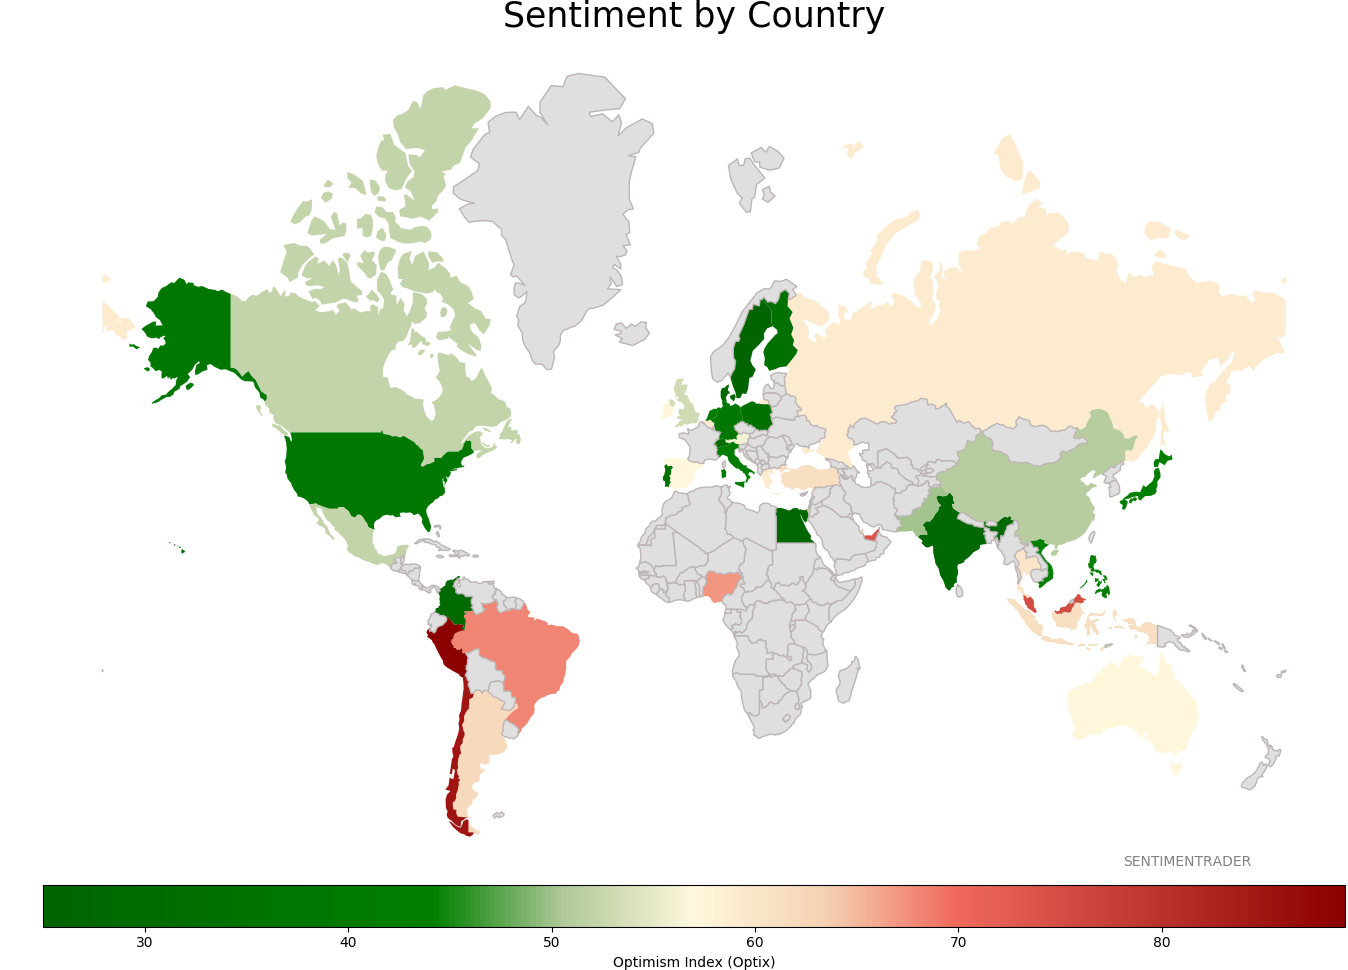
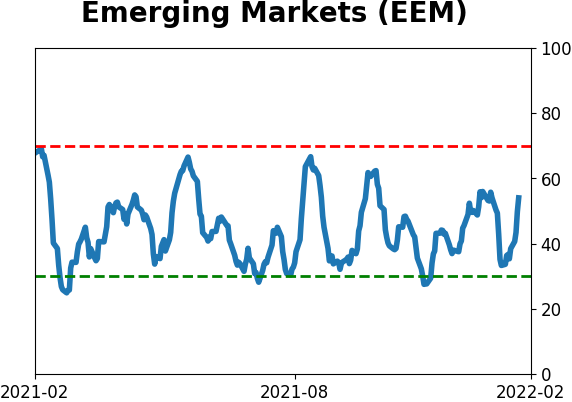
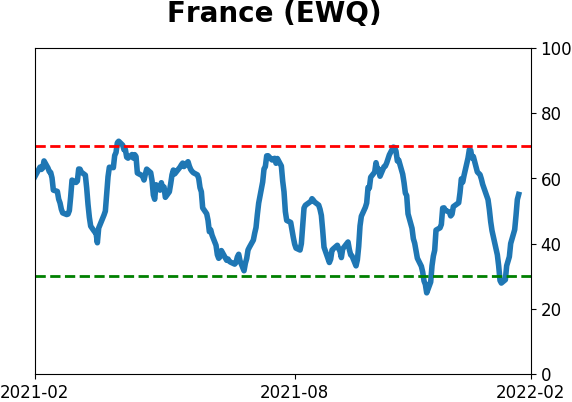
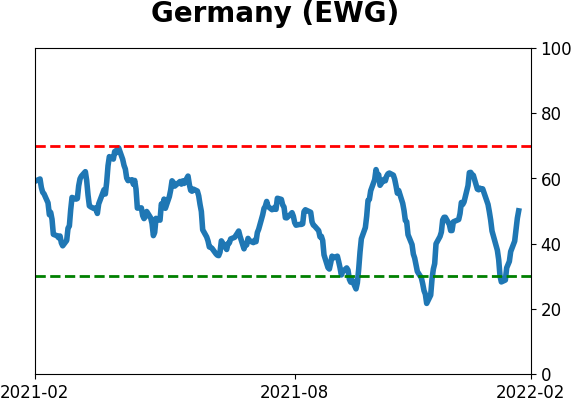
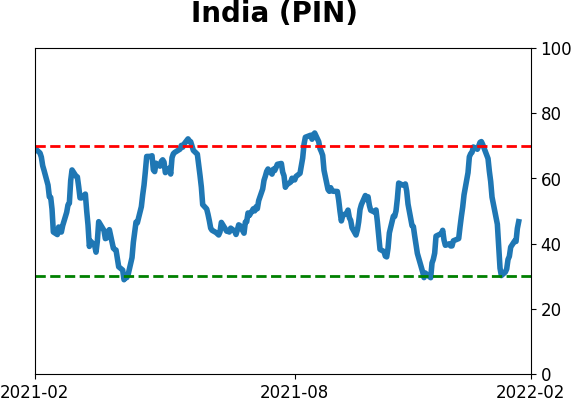
Sentiment Around The World
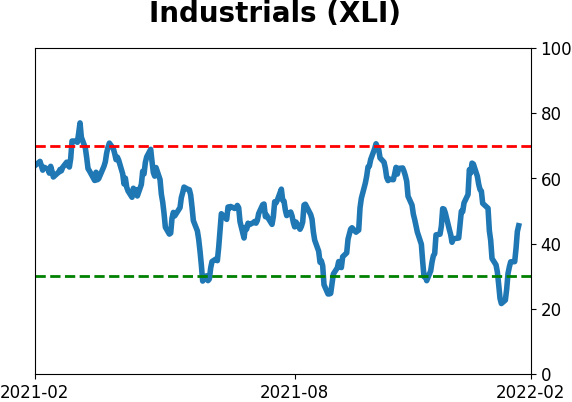
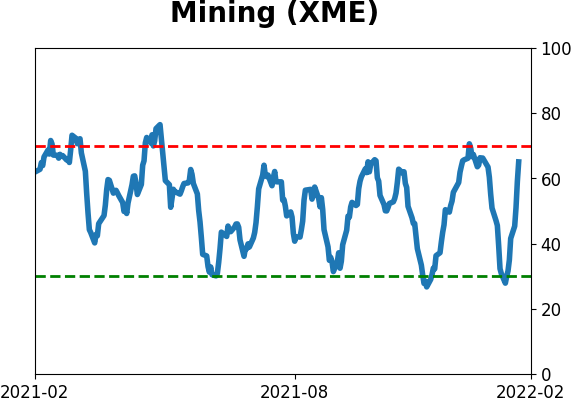
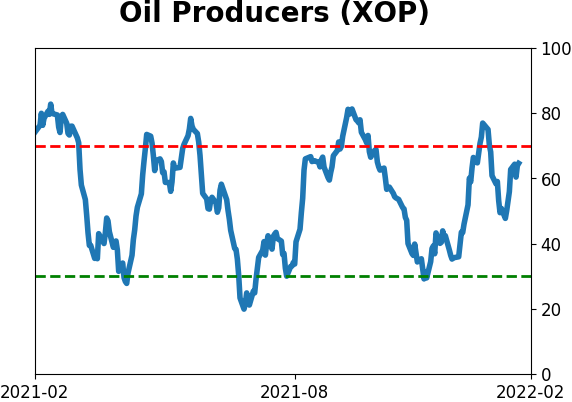
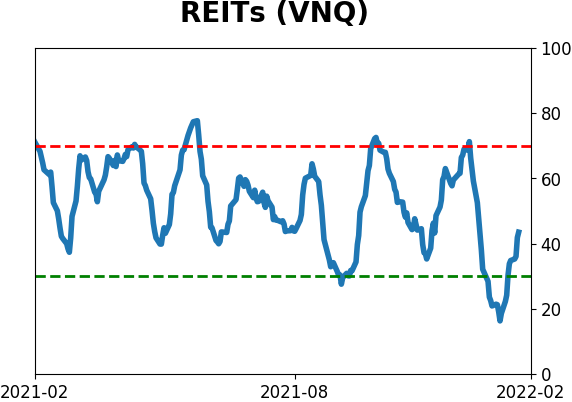
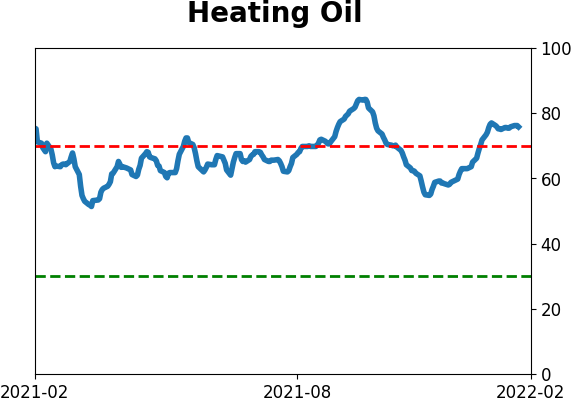
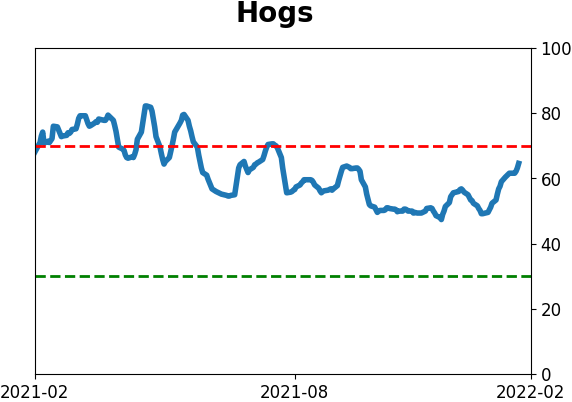
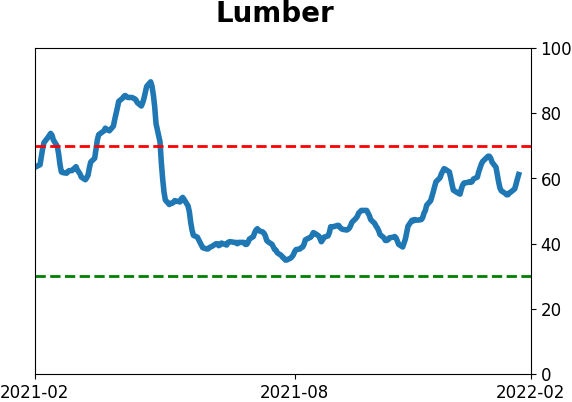
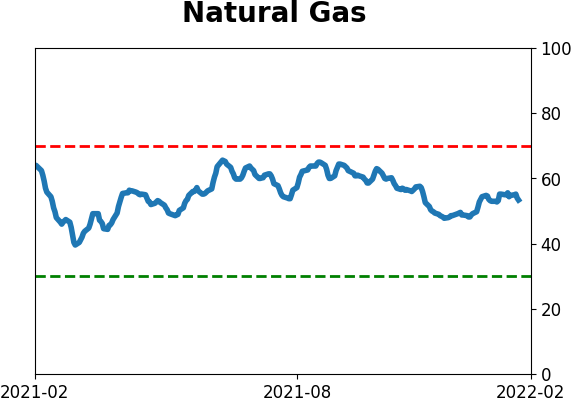
Optimism Index Thumbnails
|
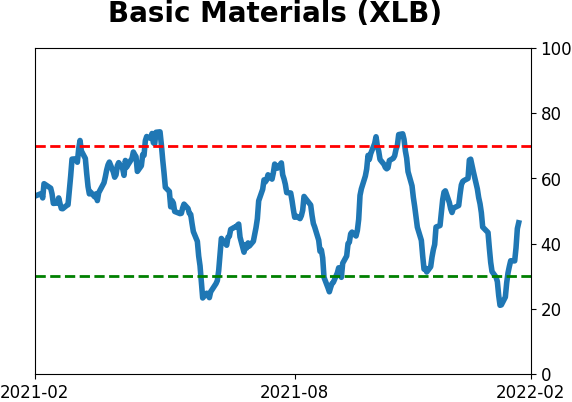
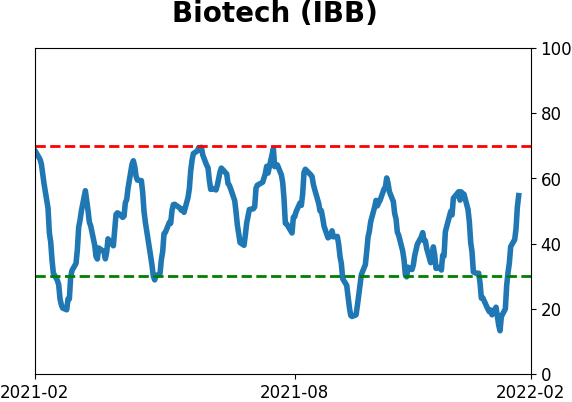
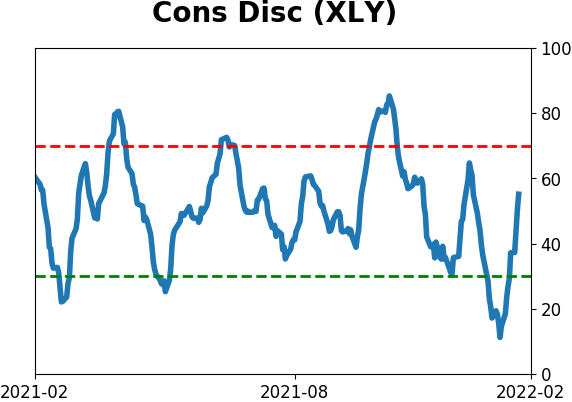
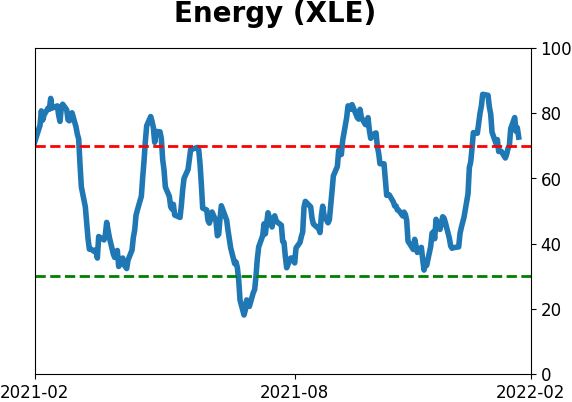
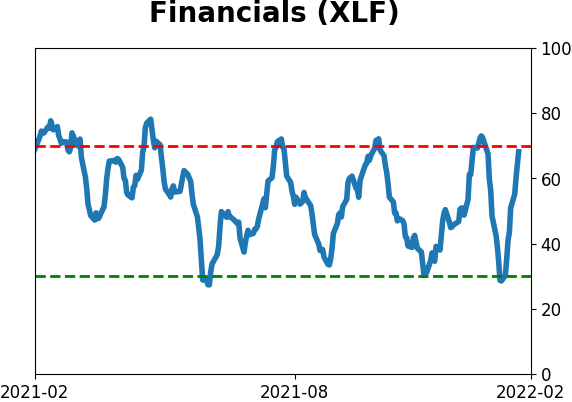
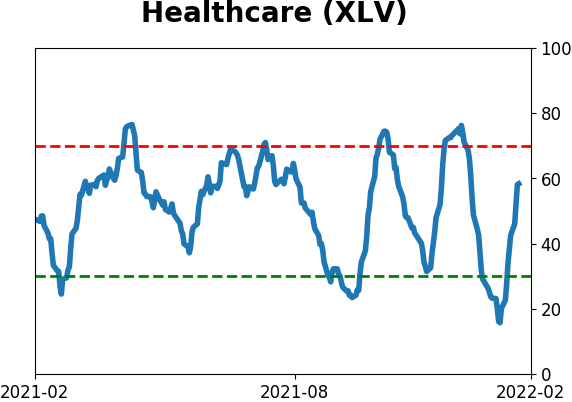
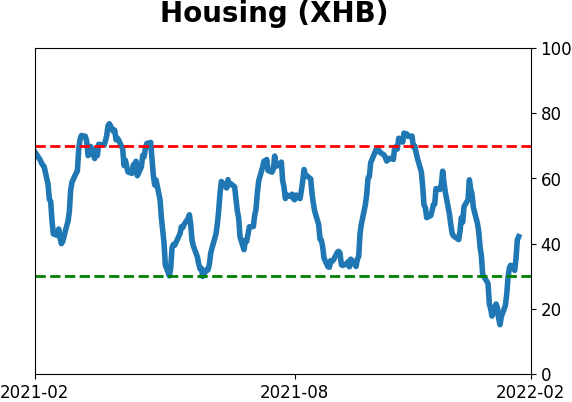
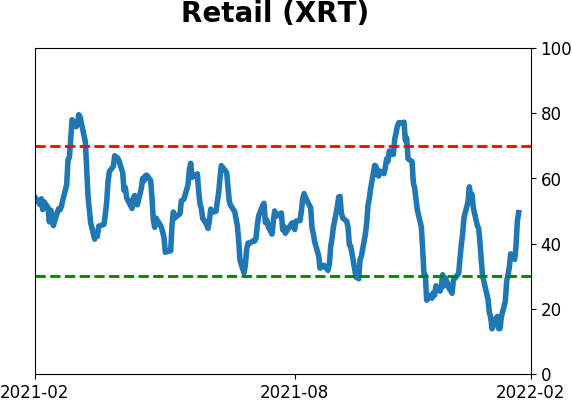
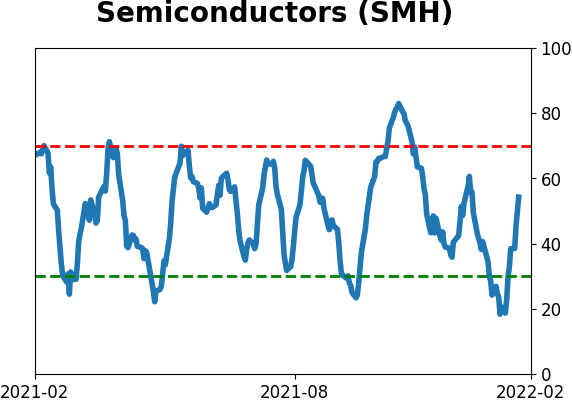
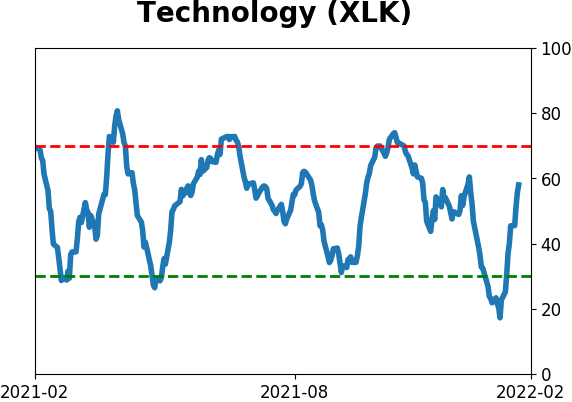
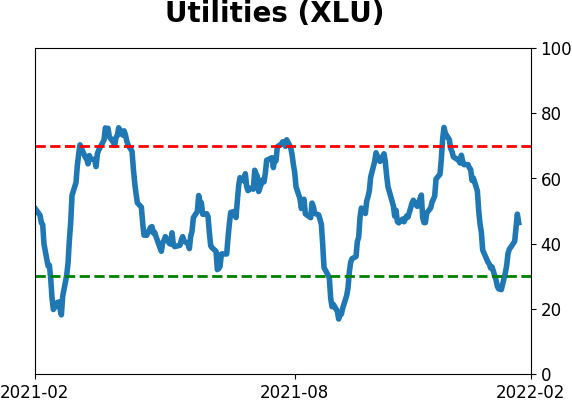
Sector ETF's - 10-Day Moving Average
|
|
|
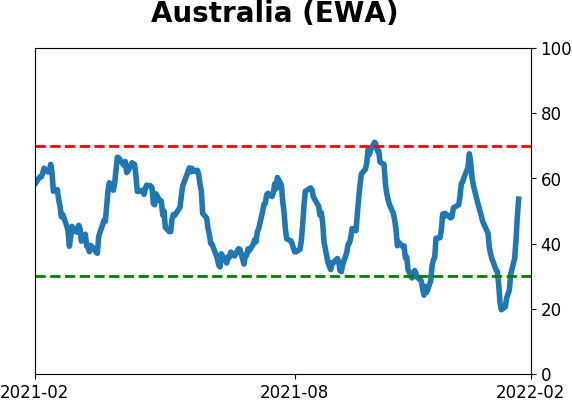
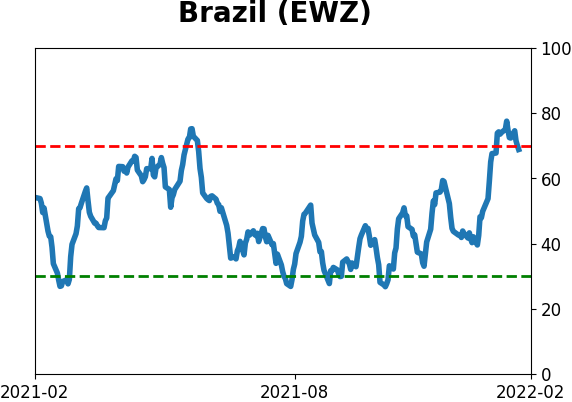
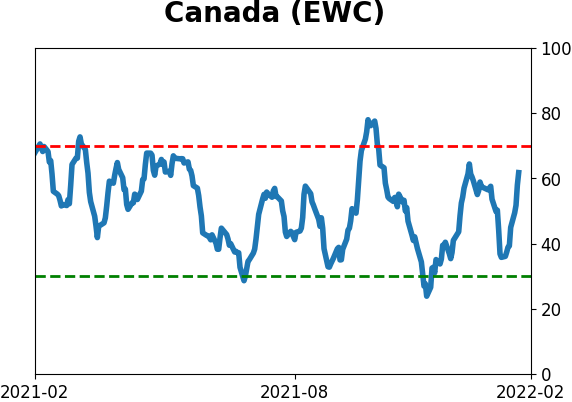
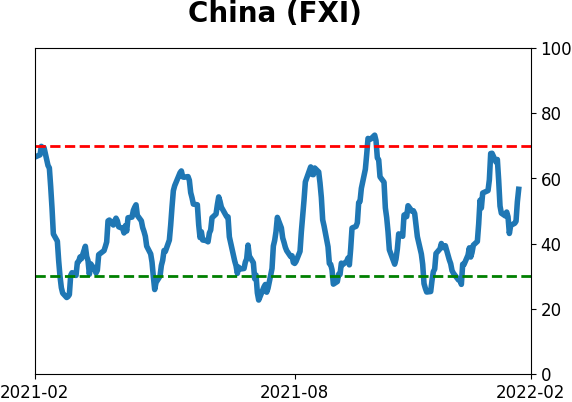
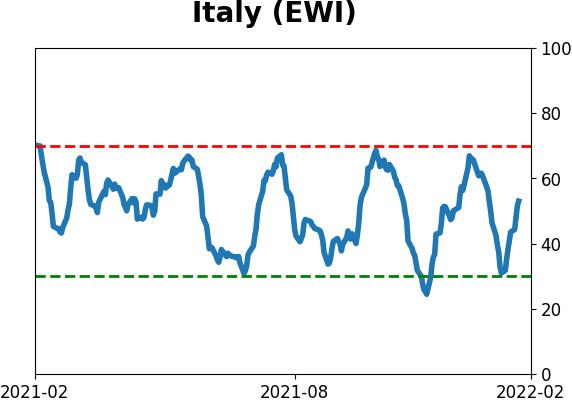
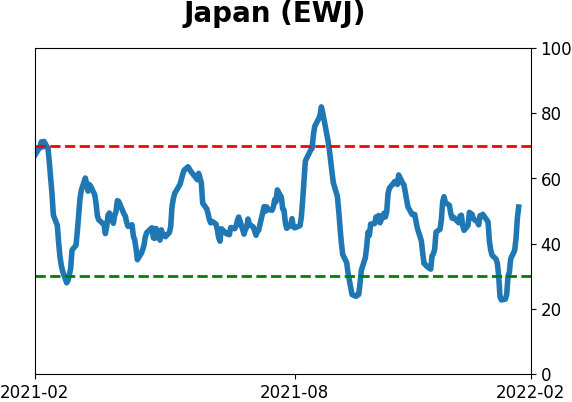
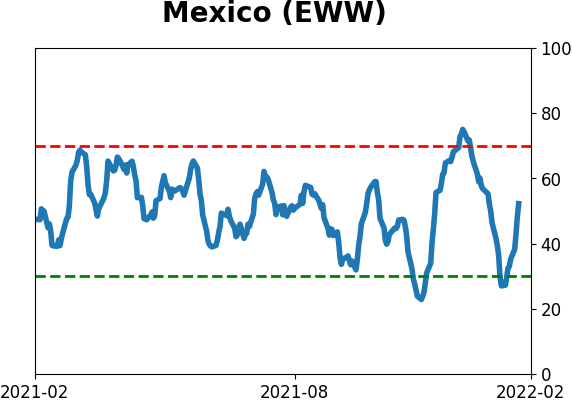
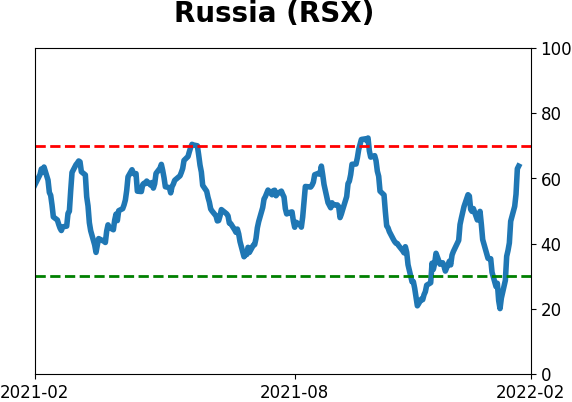
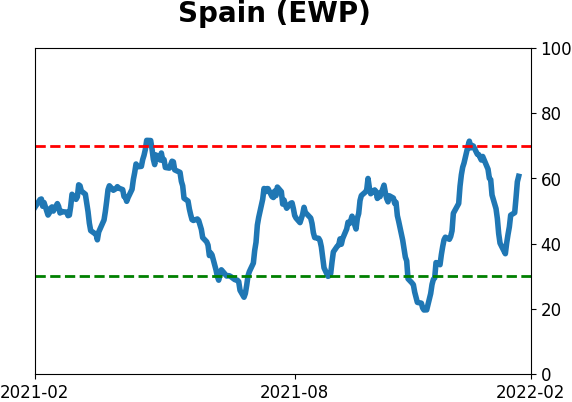
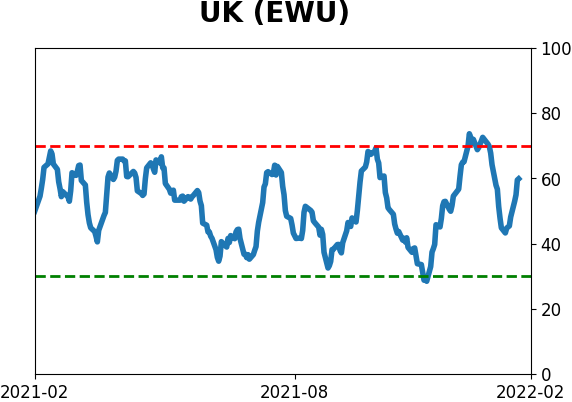
Country ETF's - 10-Day Moving Average
|
|
|
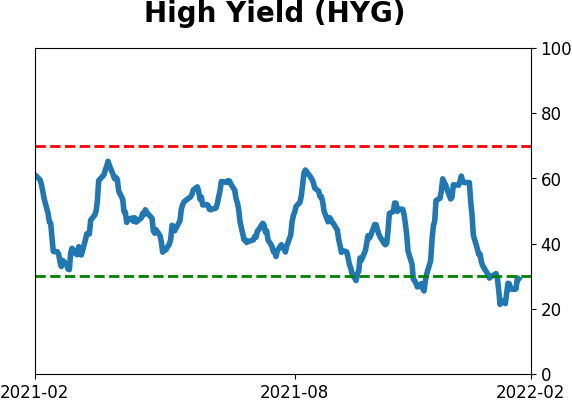
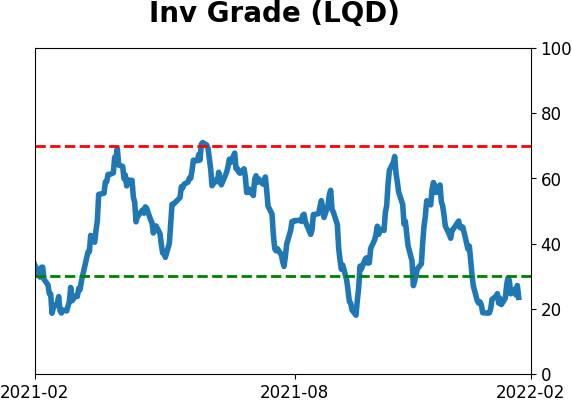
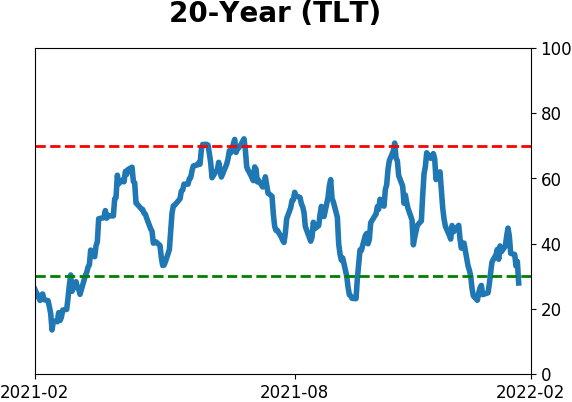
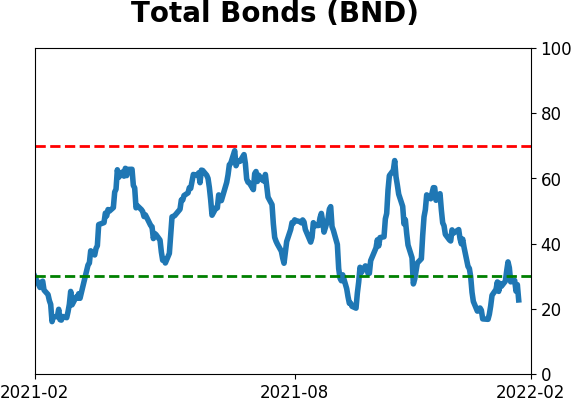
Bond ETF's - 10-Day Moving Average
|
|
|
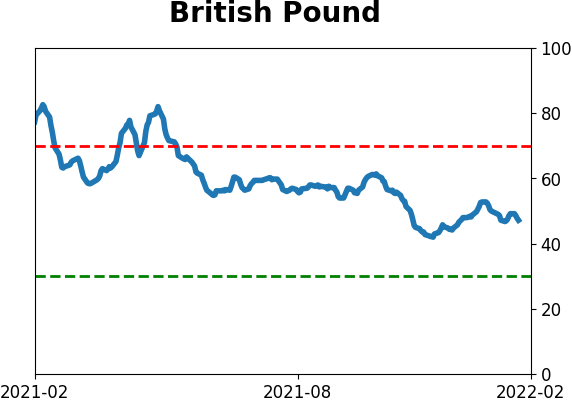
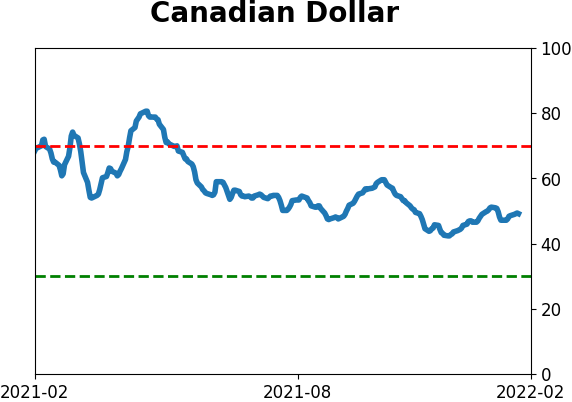
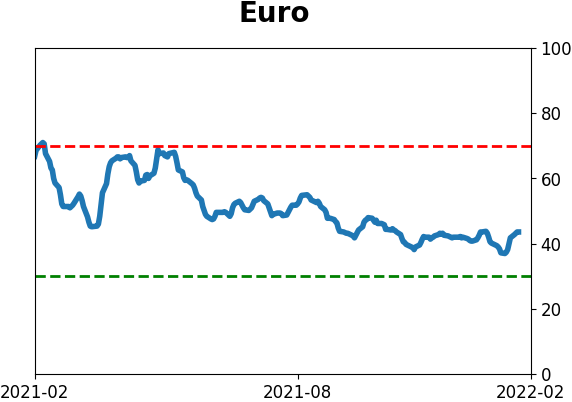
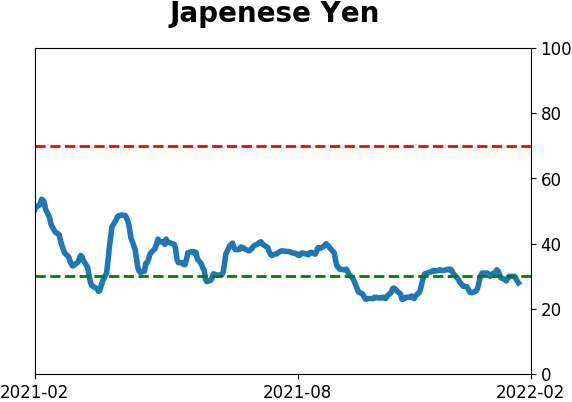
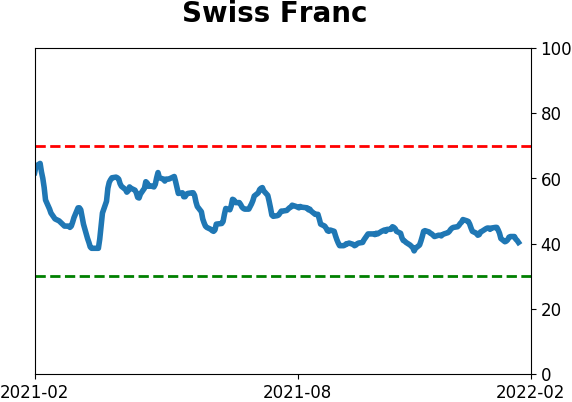
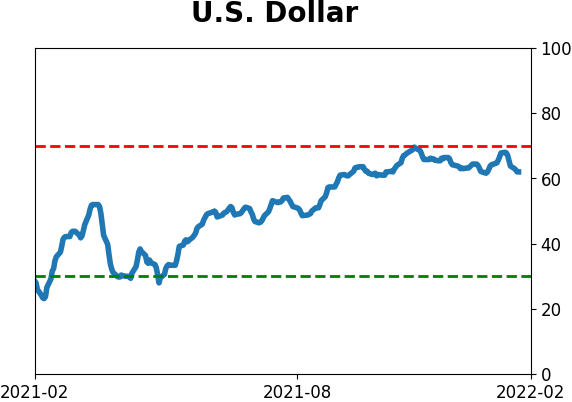
Currency ETF's - 5-Day Moving Average
|
|
|
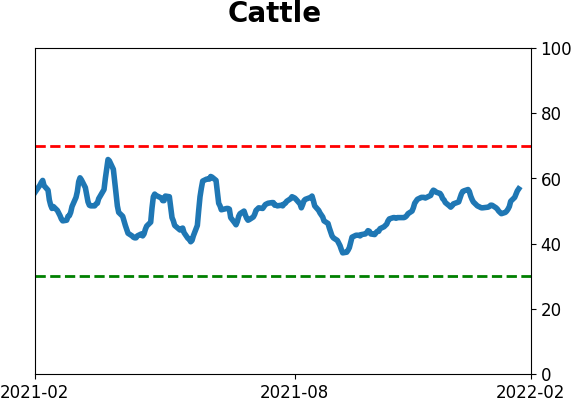
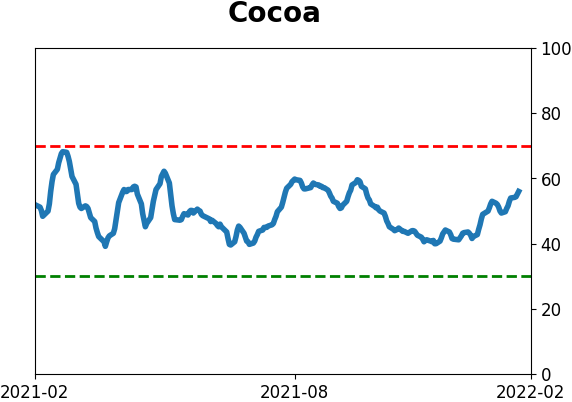
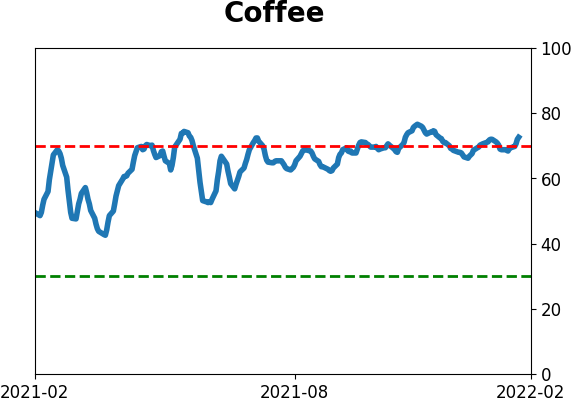
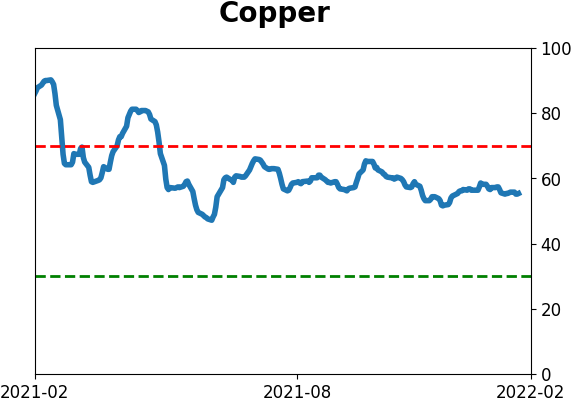
Commodity ETF's - 5-Day Moving Average
|
|