Headlines
|
|
Long-term momentum continues to roll along:
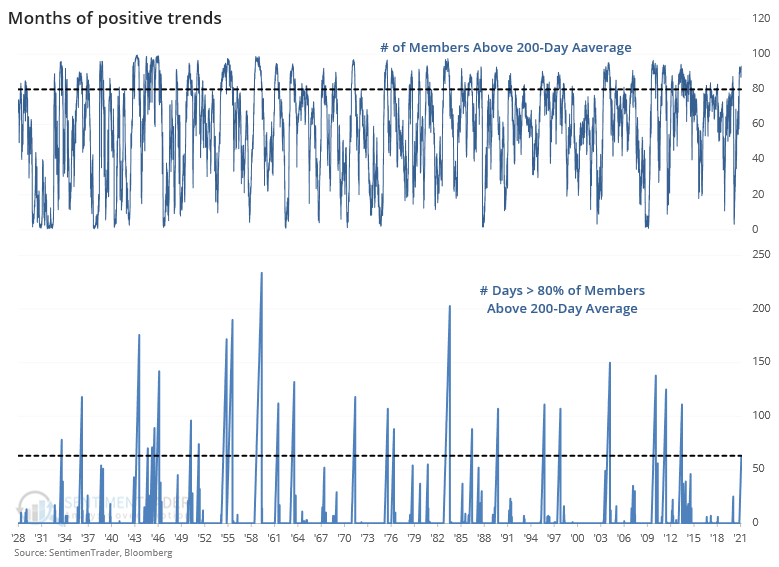
Despite a horribly speculative environment and some cracks under the surface, long-term trends within indexes like the S&P 500 remain positive. More than 80% of its stocks have held above their 200-day averages for 3 straight months, the longest streak of momentum in 7 years, and among the longest since 1928.
Bottom Line:
See the Outlook & Allocations page for more details on these summaries STOCKS: Weak sell
We're in an extremely speculative environment that is enough to become defensive, especially with recent cracks showing in what had been pristine breadth conditions. The spike in fear from last week has already mostly dissipated and likely not enough to offset the negatives over a medium-term time frame. BONDS: Weak buy
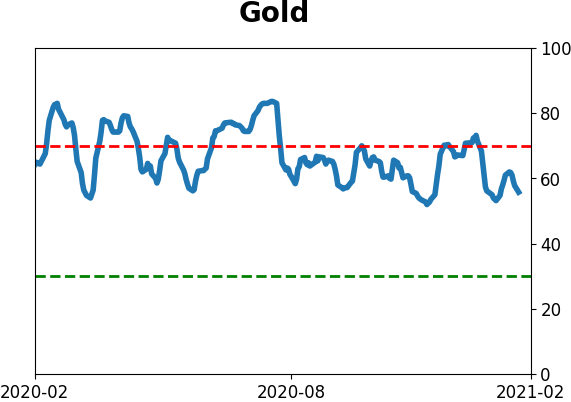
Various parts of the market have been hit in recent weeks, with mild oversold conditions. Treasuries have been hit hard and will likely start to register some extremes soon. GOLD: Weak buy
A dollar trying to rebound from a severe short position has weighed on gold and miners. The types of signals they've given in recent weeks, within the context of their recent surge, have usually resulted in higher prices over a medium- to long-term time frame.
|
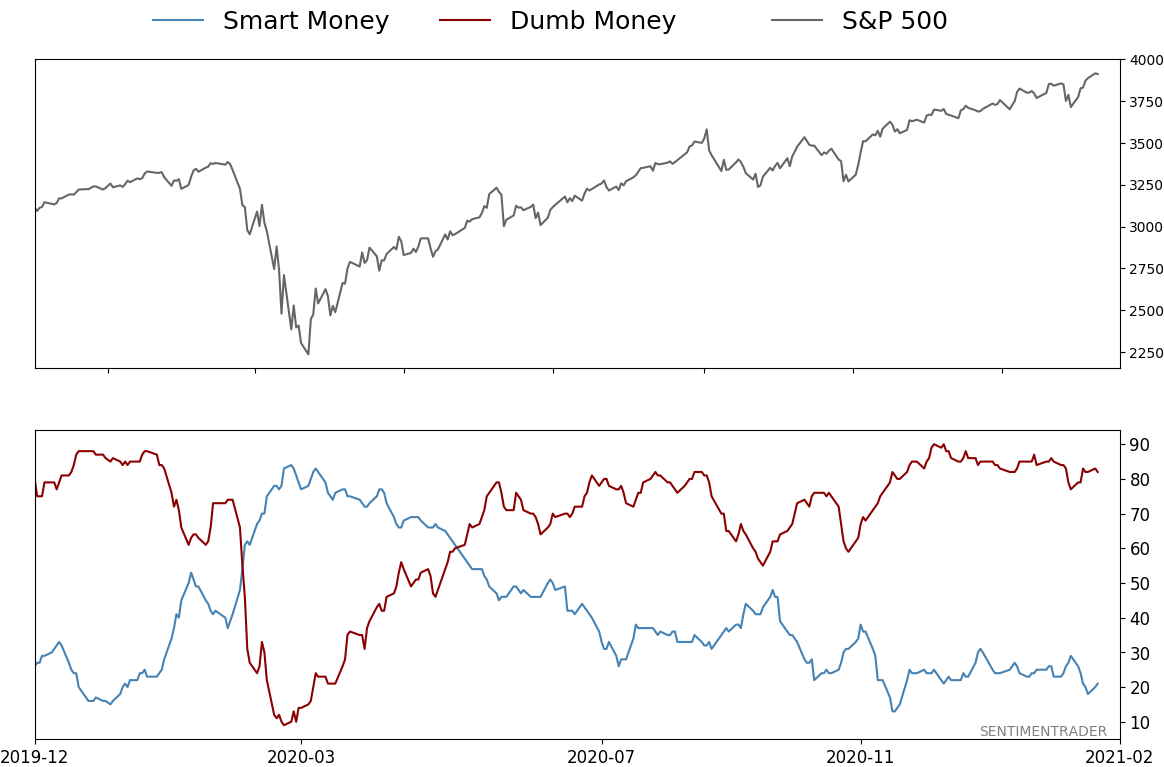
Smart / Dumb Money Confidence
|
Smart Money Confidence: 21%
Dumb Money Confidence: 82%
|
|
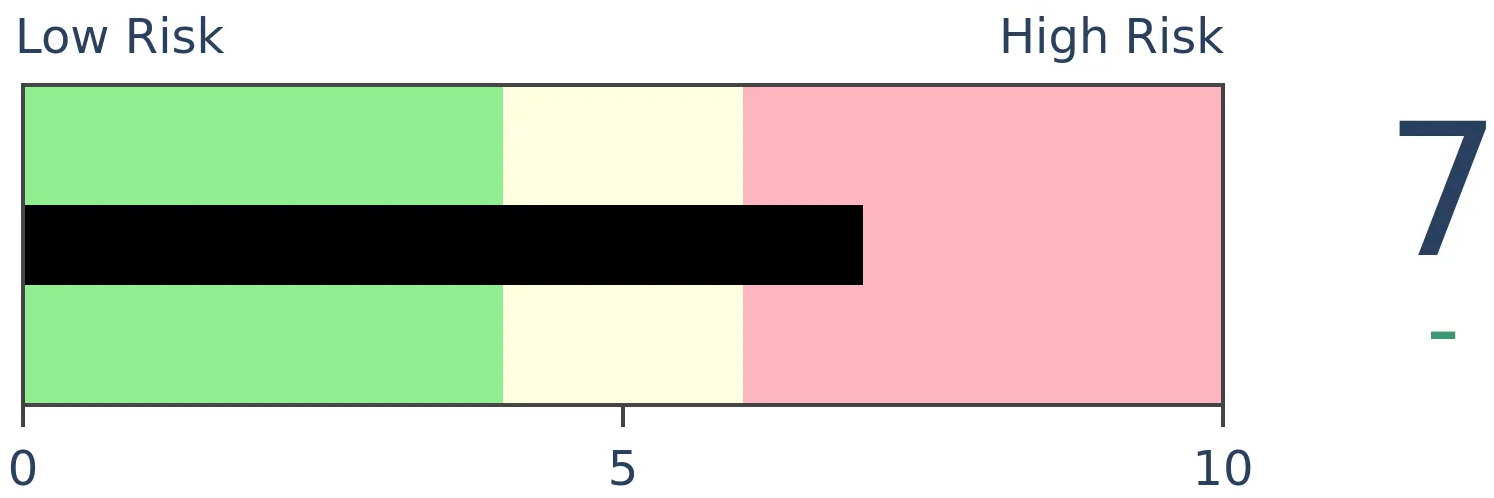
Risk Levels
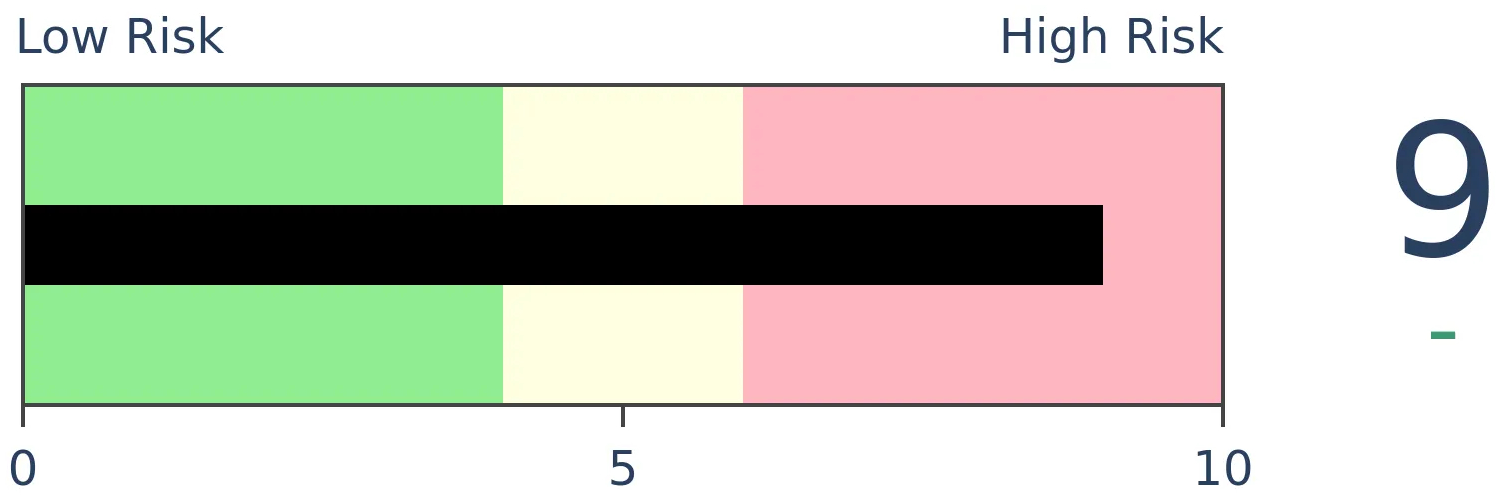
Stocks Short-Term
|
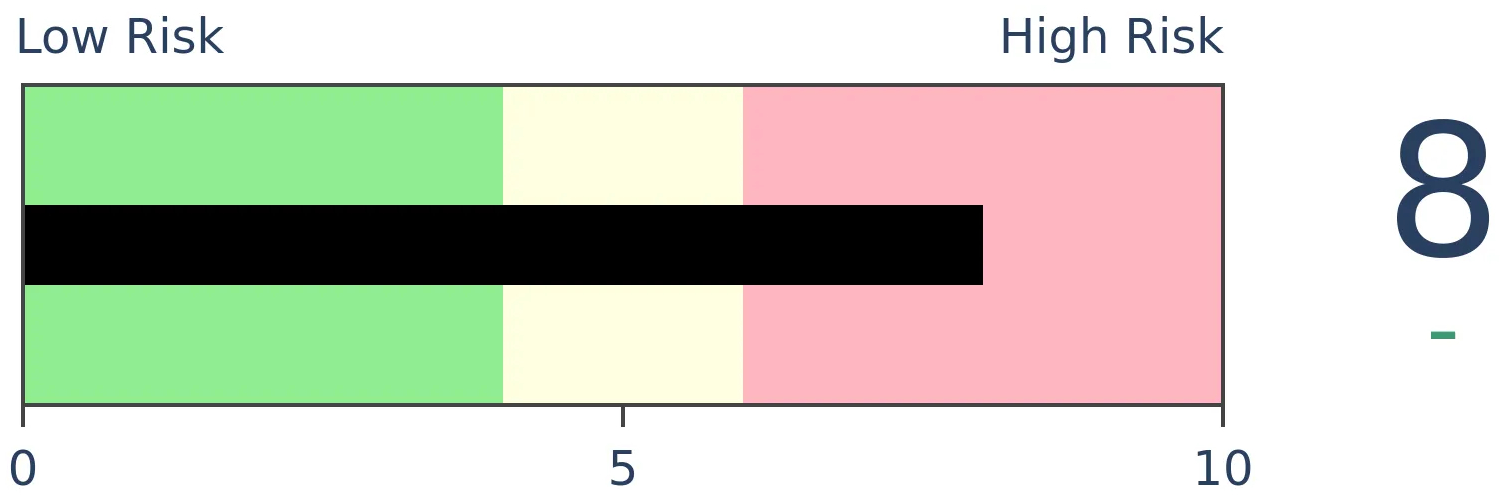
Stocks Medium-Term
|
|
Bonds
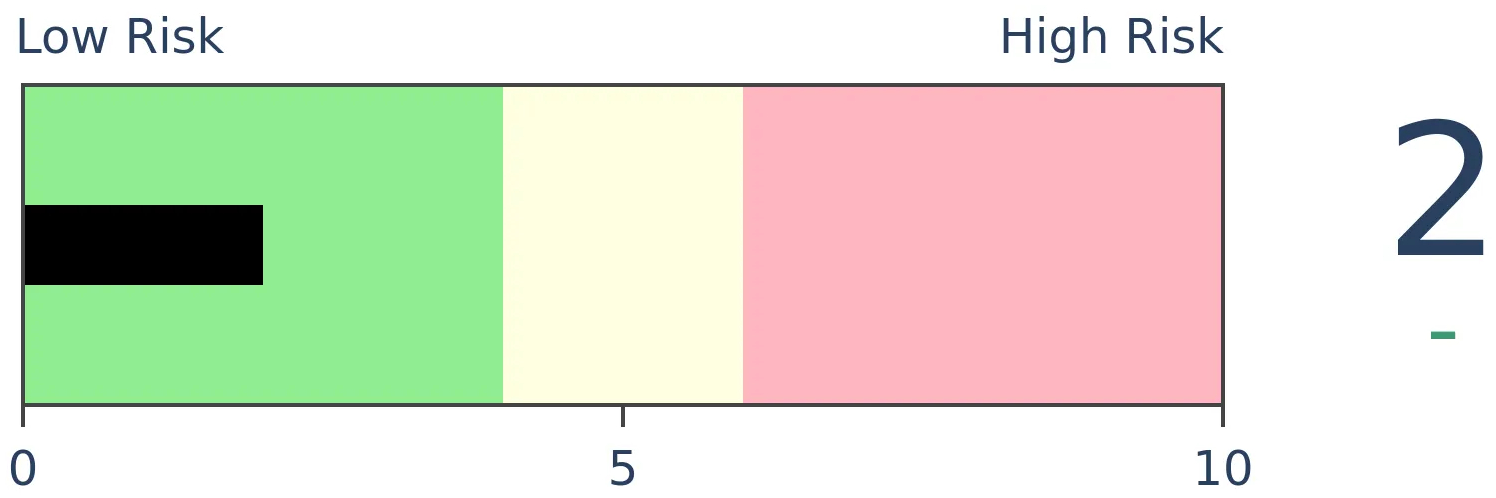
|
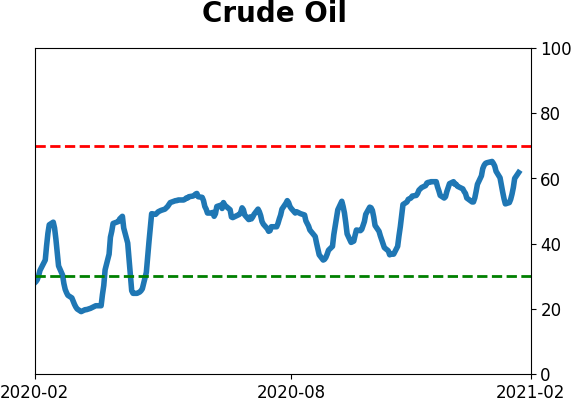
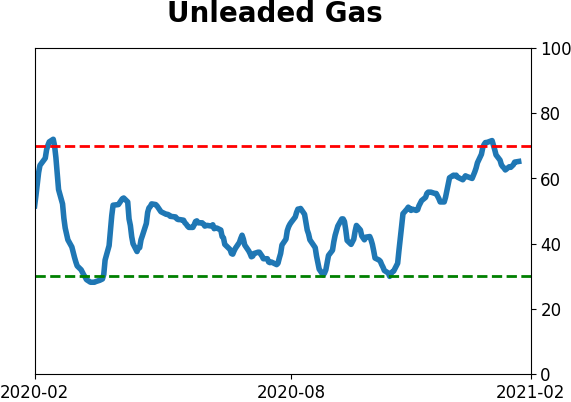
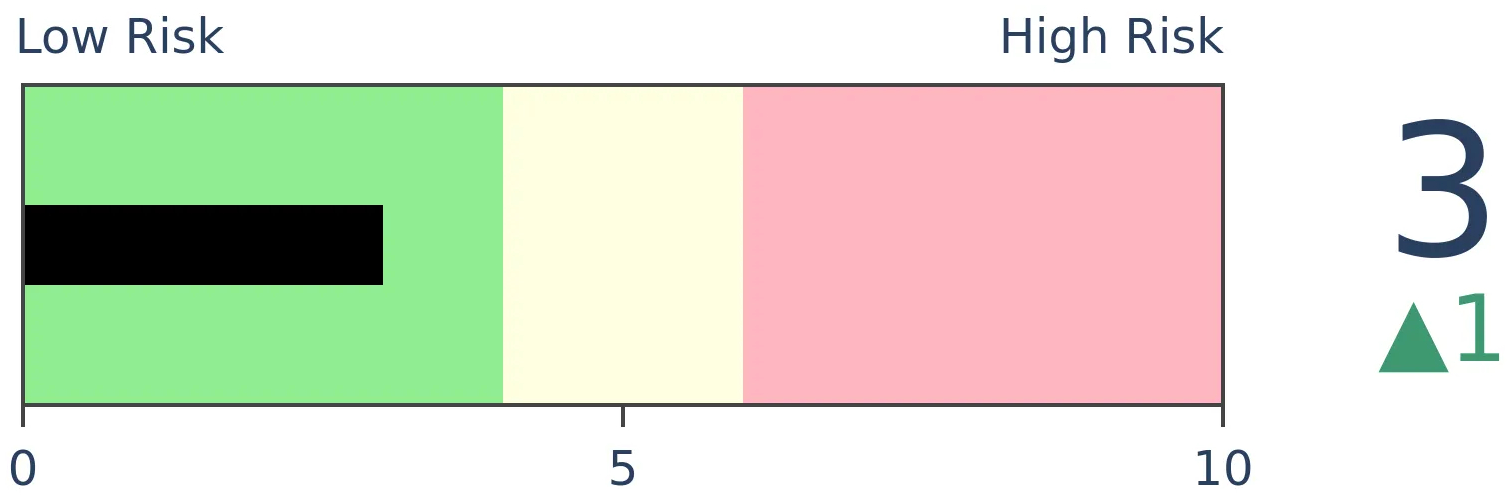
Crude Oil
|
|
Gold
|
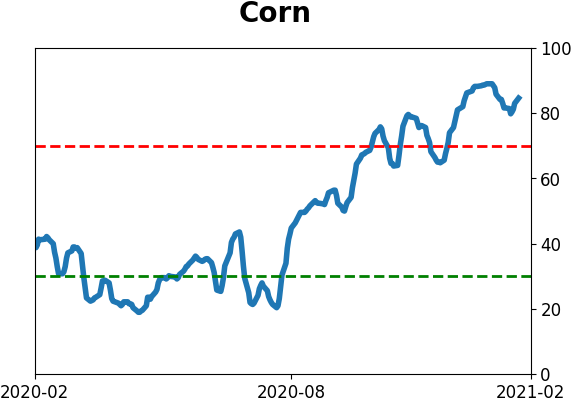
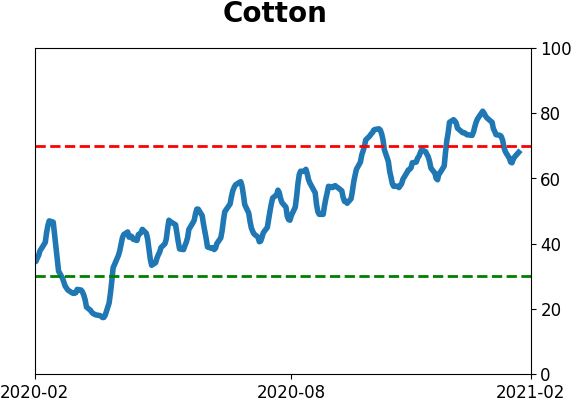
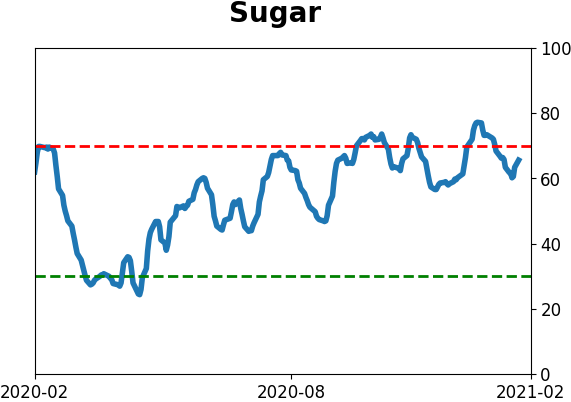
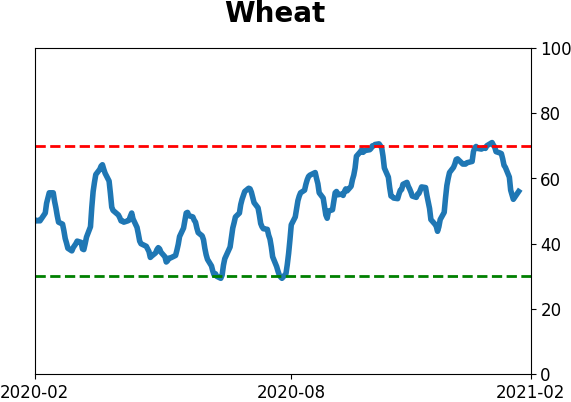
Agriculture

|
|
Research
BOTTOM LINE
Despite a horribly speculative environment and some cracks under the surface, long-term trends within indexes like the S&P 500 remain positive. More than 80% of its stocks have held above their 200-day averages for 3 straight months, the longest streak of momentum in 7 years, and among the longest since 1928.
FORECAST / TIMEFRAME
SPY -- Up, Long-Term
|
Last November, we finally saw an overwhelming percentage of stocks within the S&P 500 that were able to climb above their 200-day moving averages, after almost all of them had been below. The few other times it cycled from an extremely low percentage to an extremely high one, it indicated long-term recoveries ahead.
So far, so good. And it still hasn't stopped.
A "normal" market sees some oscillations back and forth in the number of stocks in uptrends, but not this one. The percentage of stocks above their long-term averages has been stuck at a high level since that note three months ago.
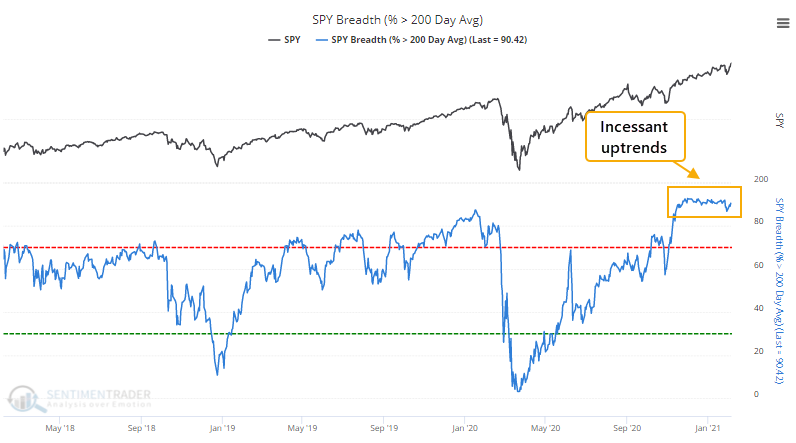
Going back to 1928, this is one of the longest streaks that so many stocks have traded above their 200-day moving averages. While it has continued for nearly 3 times as long, this is the most persistent streak in 7 years.
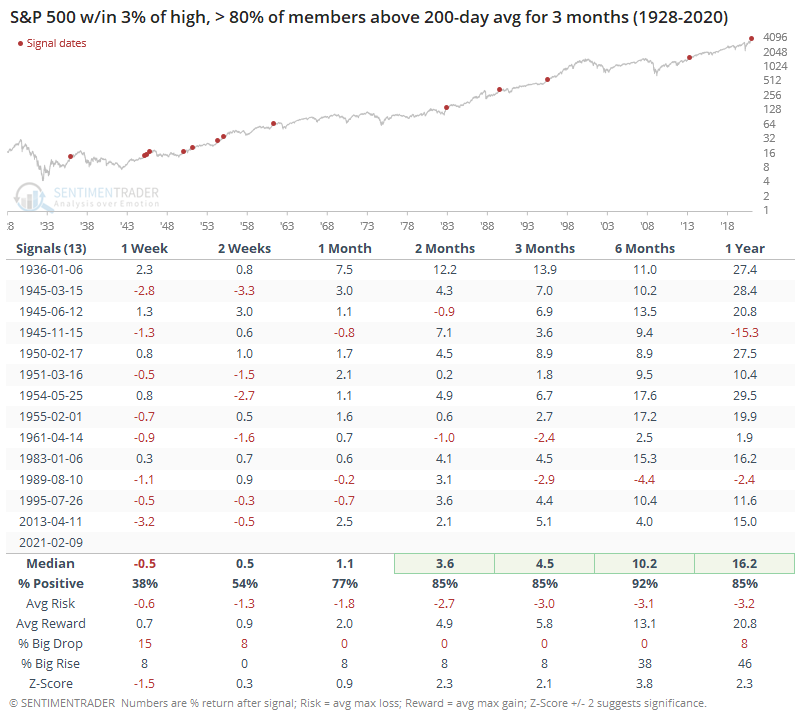
As we've seen in past comments, especially last April/May and October/November, this kind of momentum has almost always continued to carry forward.

Sometimes, when we see momentum like this, it's only because stocks are climbing out of prolonged declines. It's rarer to see it when stocks are at or near a multi-year high. That didn't dent the results too much, except in the shorter-term. The next 6 months were almost perfect.
We're seeing a market that's recovering from the fastest bear market (and fastest recovery) ever, so there is a mix of readings that we normally see when stocks are well below their highs, as well as readings normally seen after long bull markets.
This is the exact same thing we discussed a few weeks ago. The biggest difference is that there have been more signs of internal cracks now than there were then. They're mostly shorter-term, so the risk/reward over a short- to medium-term time frame still seems skewed to the "risk" side. It's harder to be negative on the longer-term when considering metrics like the above, even with an environment that can be ranked among the most speculative in history.
Active Studies
| Time Frame | Bullish | Bearish | | Short-Term | 0 | 0 | | Medium-Term | 2 | 6 | | Long-Term | 16 | 3 |
|
Indicators at Extremes
Portfolio
| Position | Description | Weight % | Added / Reduced | Date | | Stocks | RSP | 4.9 | Reduced 4% | 2021-02-09 | | Bonds | 10% BND, 8.9% SCHP, 4.8% ANGL | 23.7 | Reduced 4% | 2021-02-09 | | Commodities | GCC | 2.3 | Reduced 2.1%
| 2020-09-04 | | Precious Metals | GDX | 8.9 | Added 4.8% | 2020-12-01 | | Special Situations | 9.6% XLE, 8.2% PSCE | 17.8 | Reduced 1.5% | 2021-02-09 | | Cash | | 42.8 | | |
|
Updates (Changes made today are underlined)
With a market that has seen the kinds of broad participation and big breath thrusts like we did in the fall, it's hard to become too negative. Those kinds of conditions have consistently preceded higher returns over the next 6-12 months. It's the interim that's more of an issue. Even conditions like that haven't prevented some shorter-term pullbacks. And when we combine an environment where speculation is rampant and recent days have seen an increase in cracks under the surface of the indexes, it's enough to become more defensive over a short- to medium-term time frame. We still don't have much confirmation from the price action in the indexes, so those who are more conservative would likely wait before increasing cash levels. Not much has changed, but I'm getting increasingly anxious and prefer to hold cash over riskier assets so I increased the cash cushion. RETURN YTD: 5.4% 2020: 8.1%, 2019: 12.6%, 2018: 0.6%, 2017: 3.8%, 2016: 17.1%, 2015: 9.2%, 2014: 14.5%, 2013: 2.2%, 2012: 10.8%, 2011: 16.5%, 2010: 15.3%, 2009: 23.9%, 2008: 16.2%, 2007: 7.8%
|
|
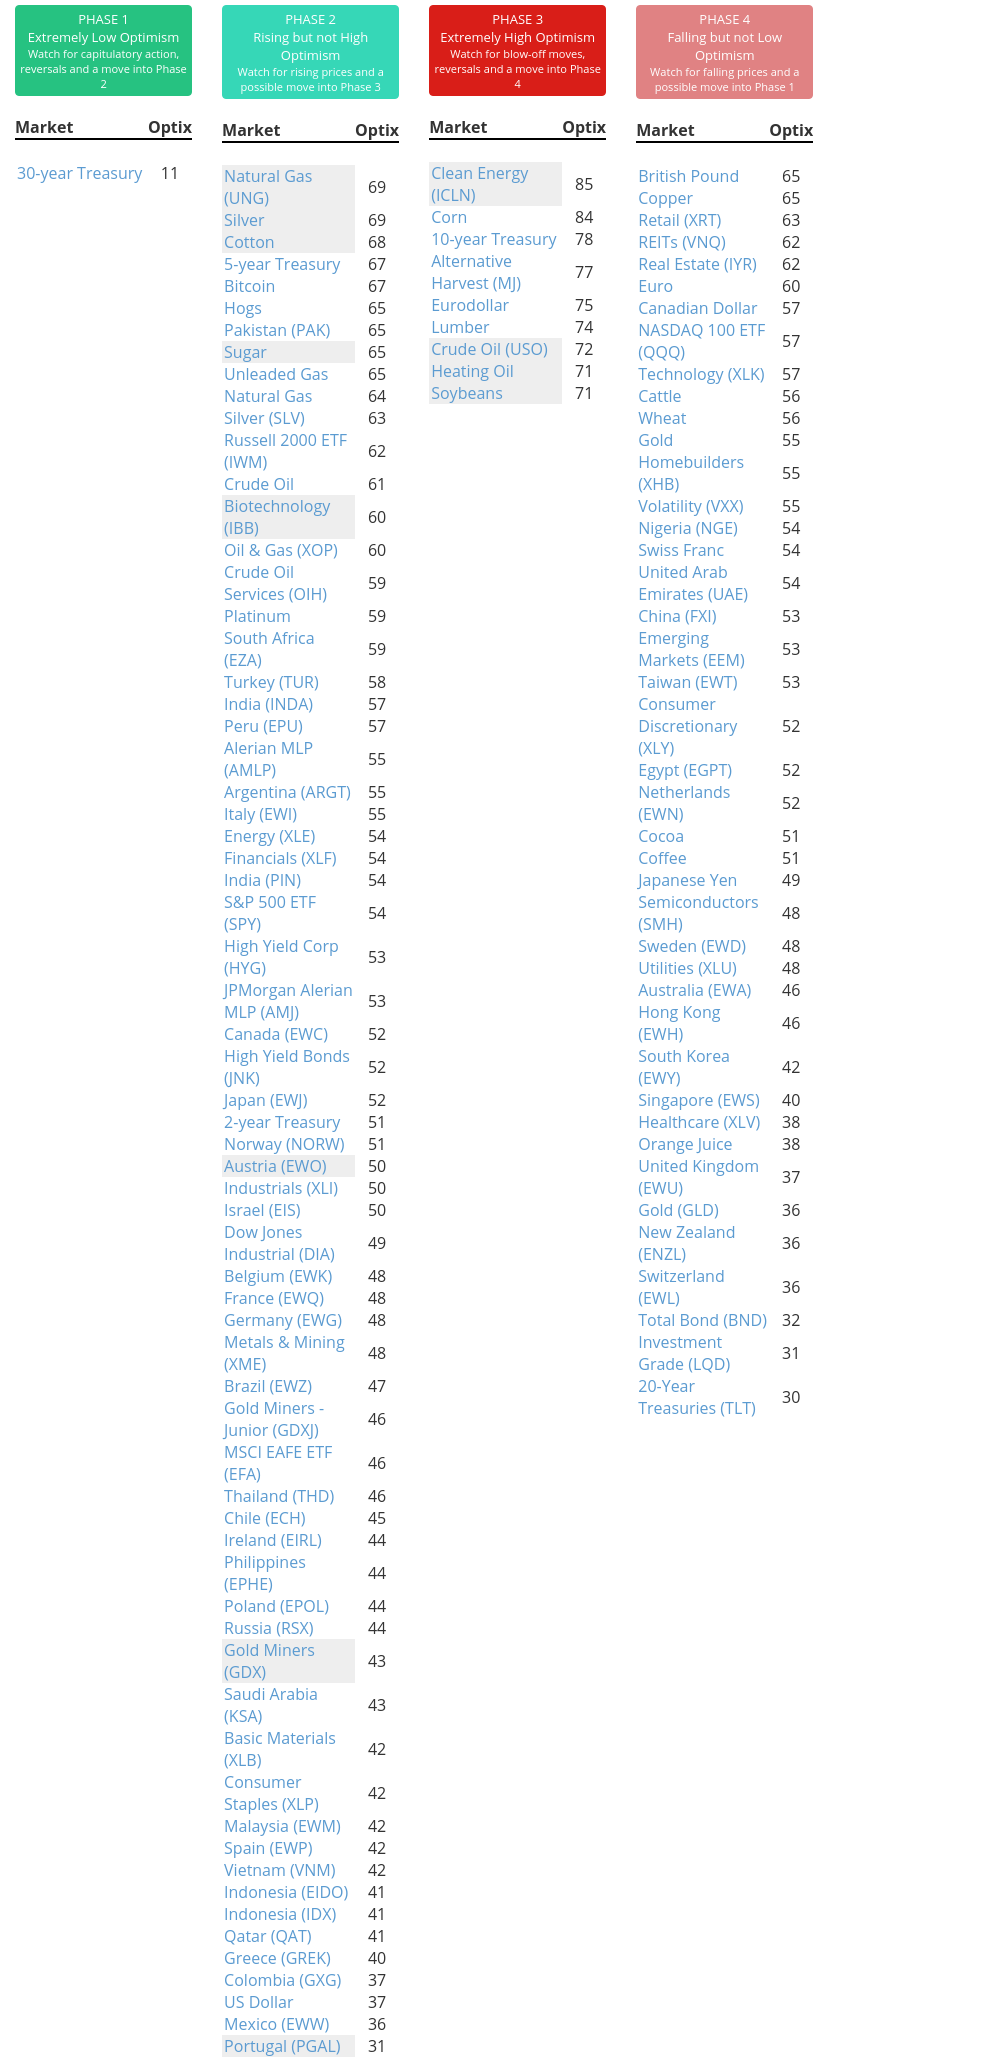
Phase Table
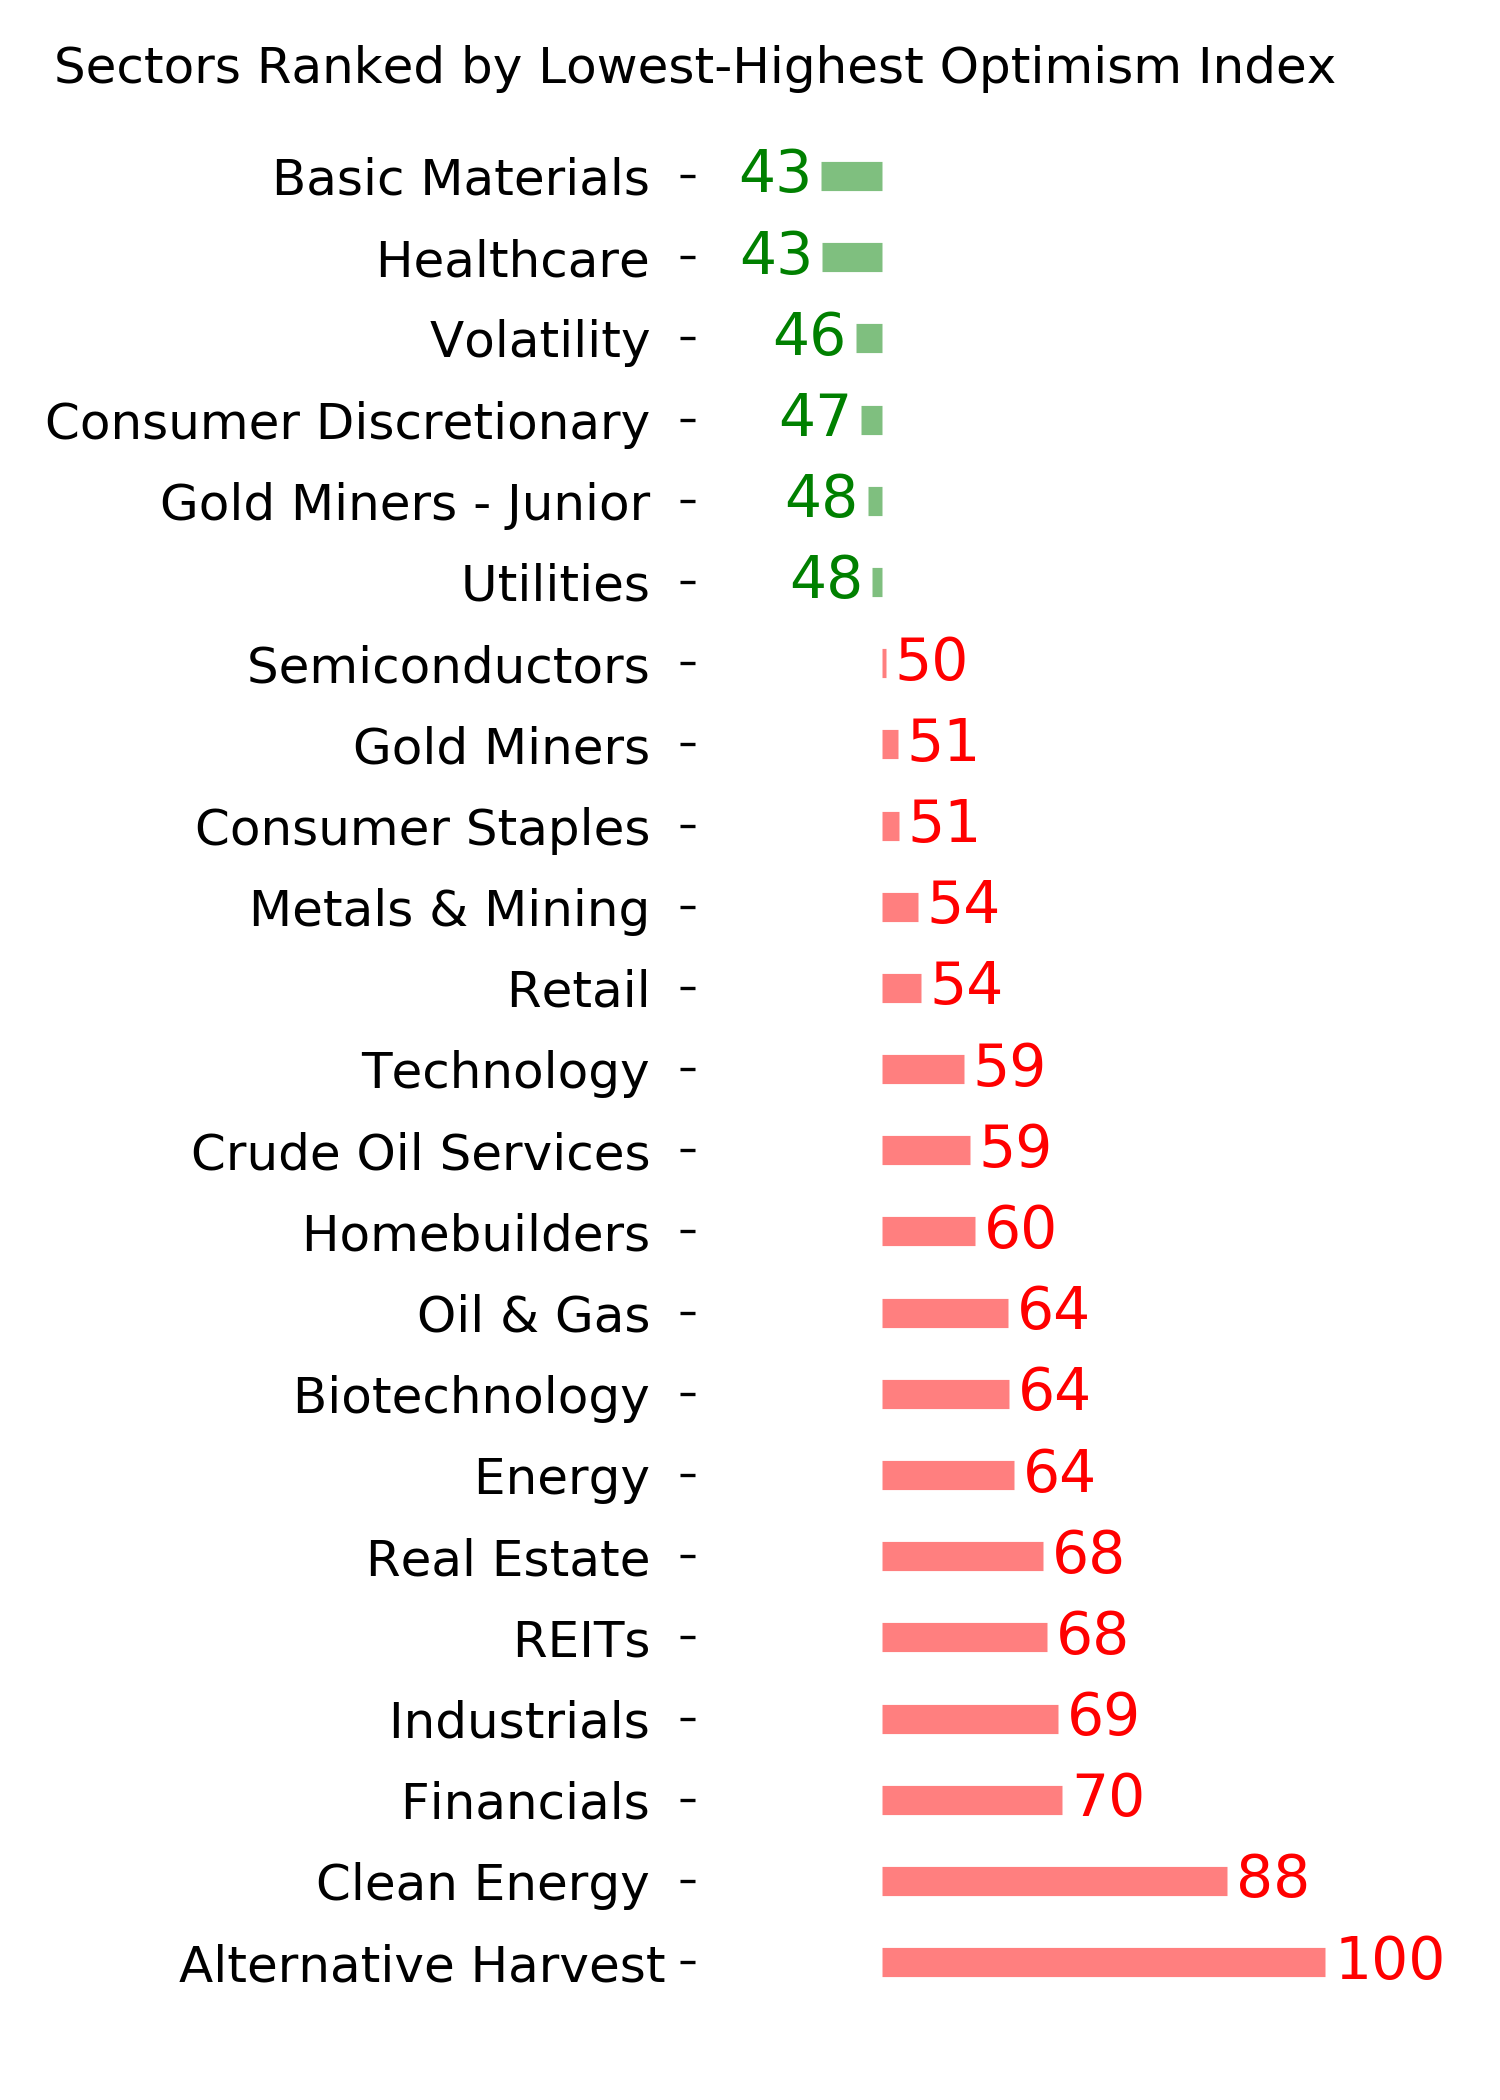
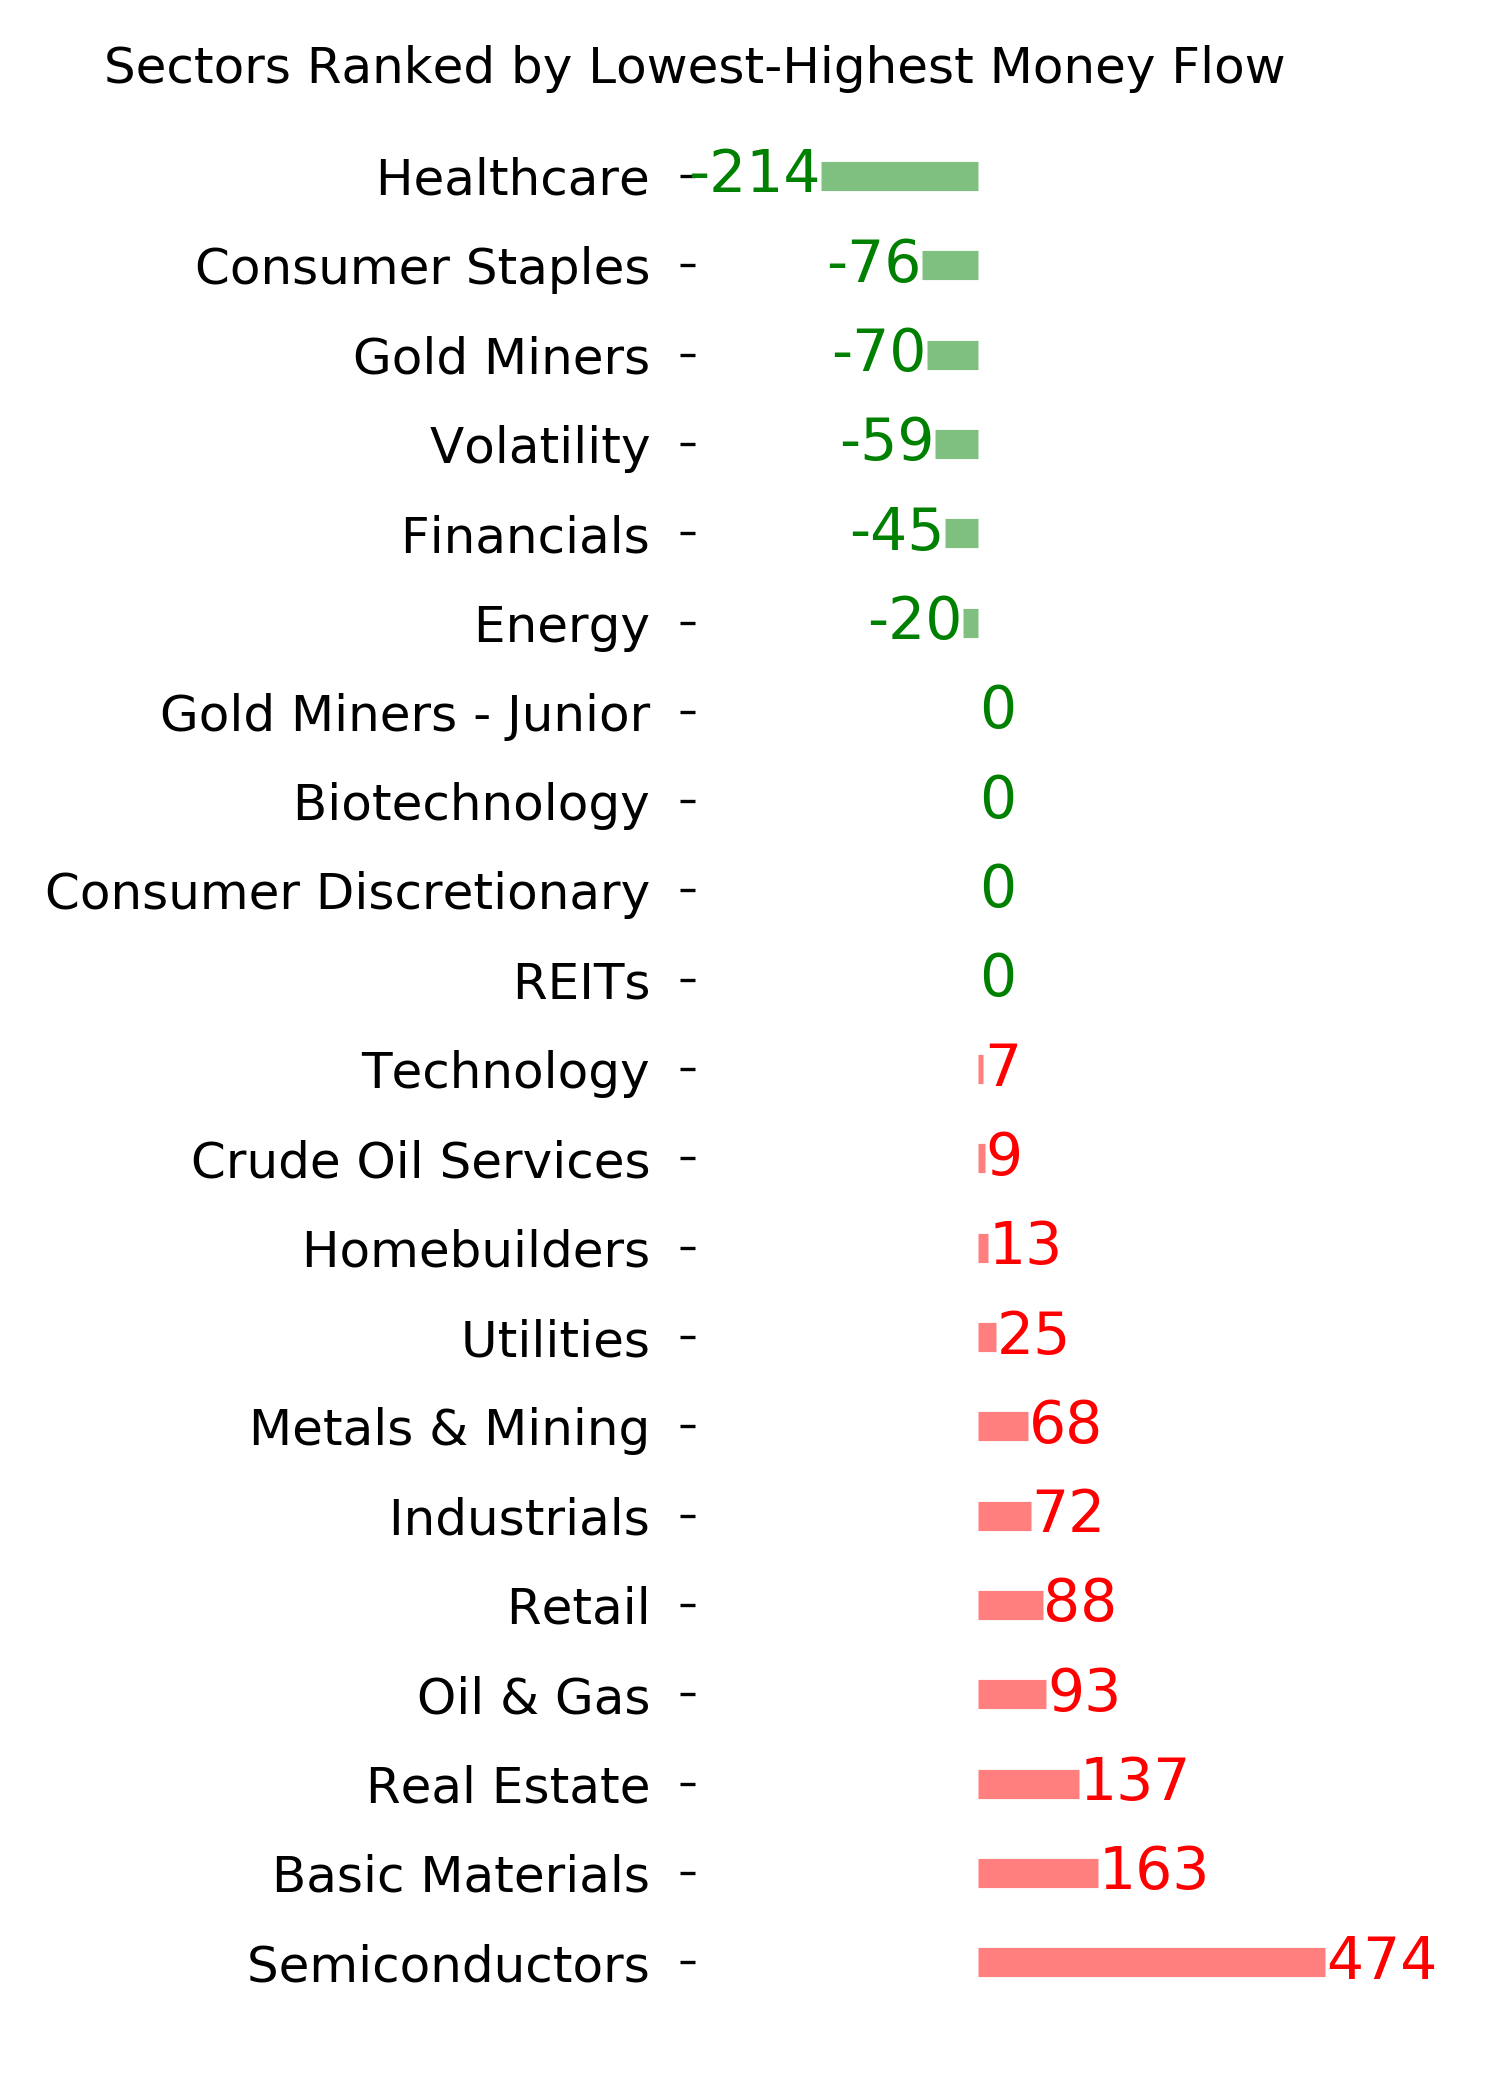
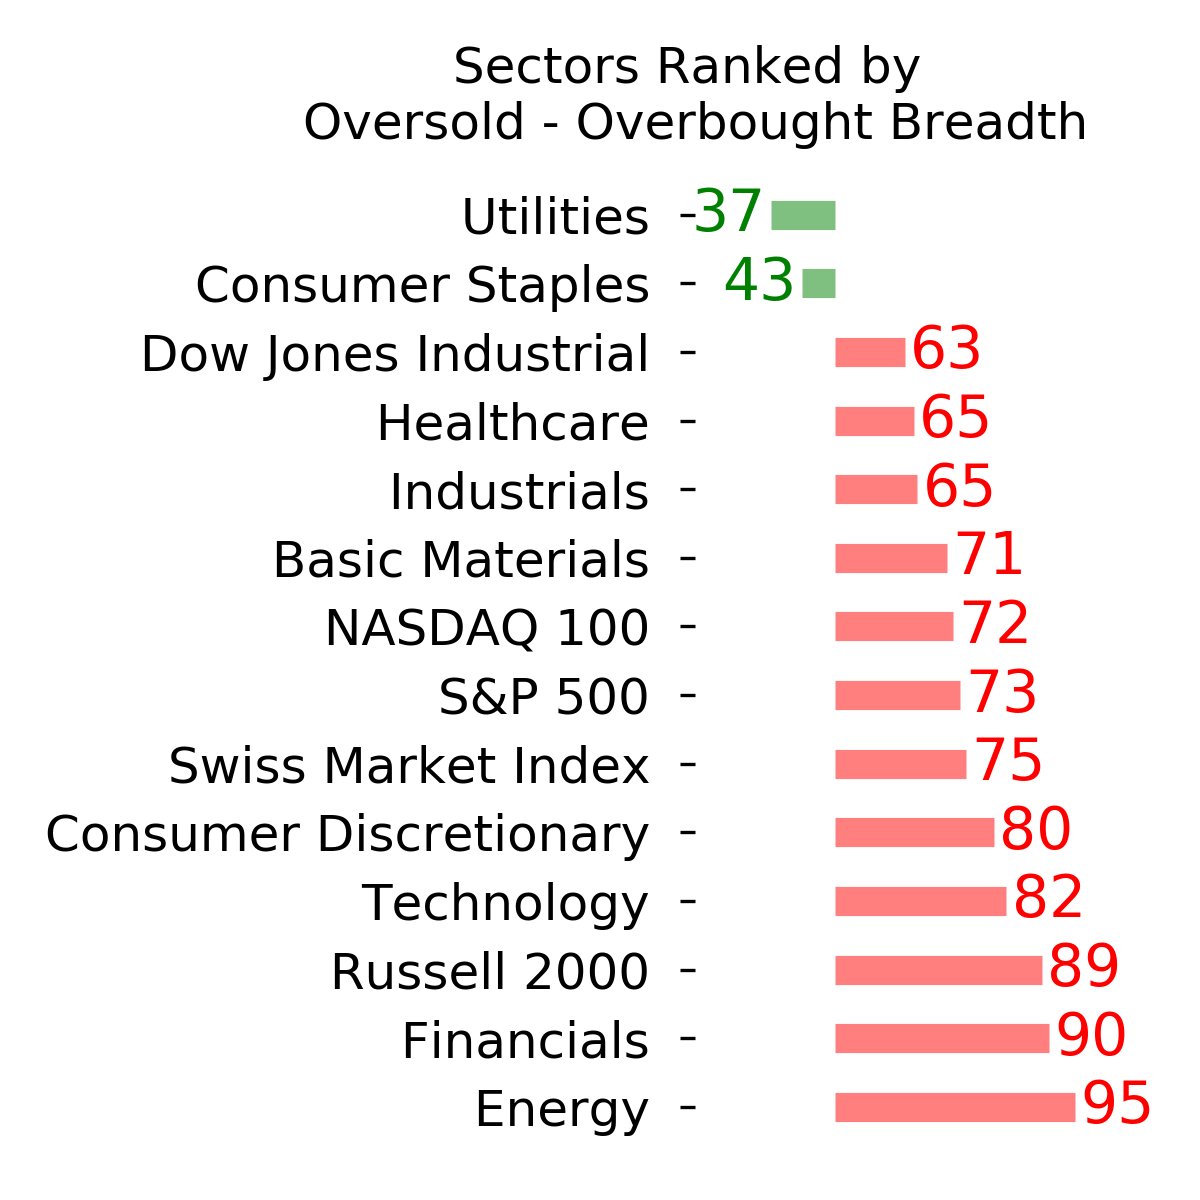
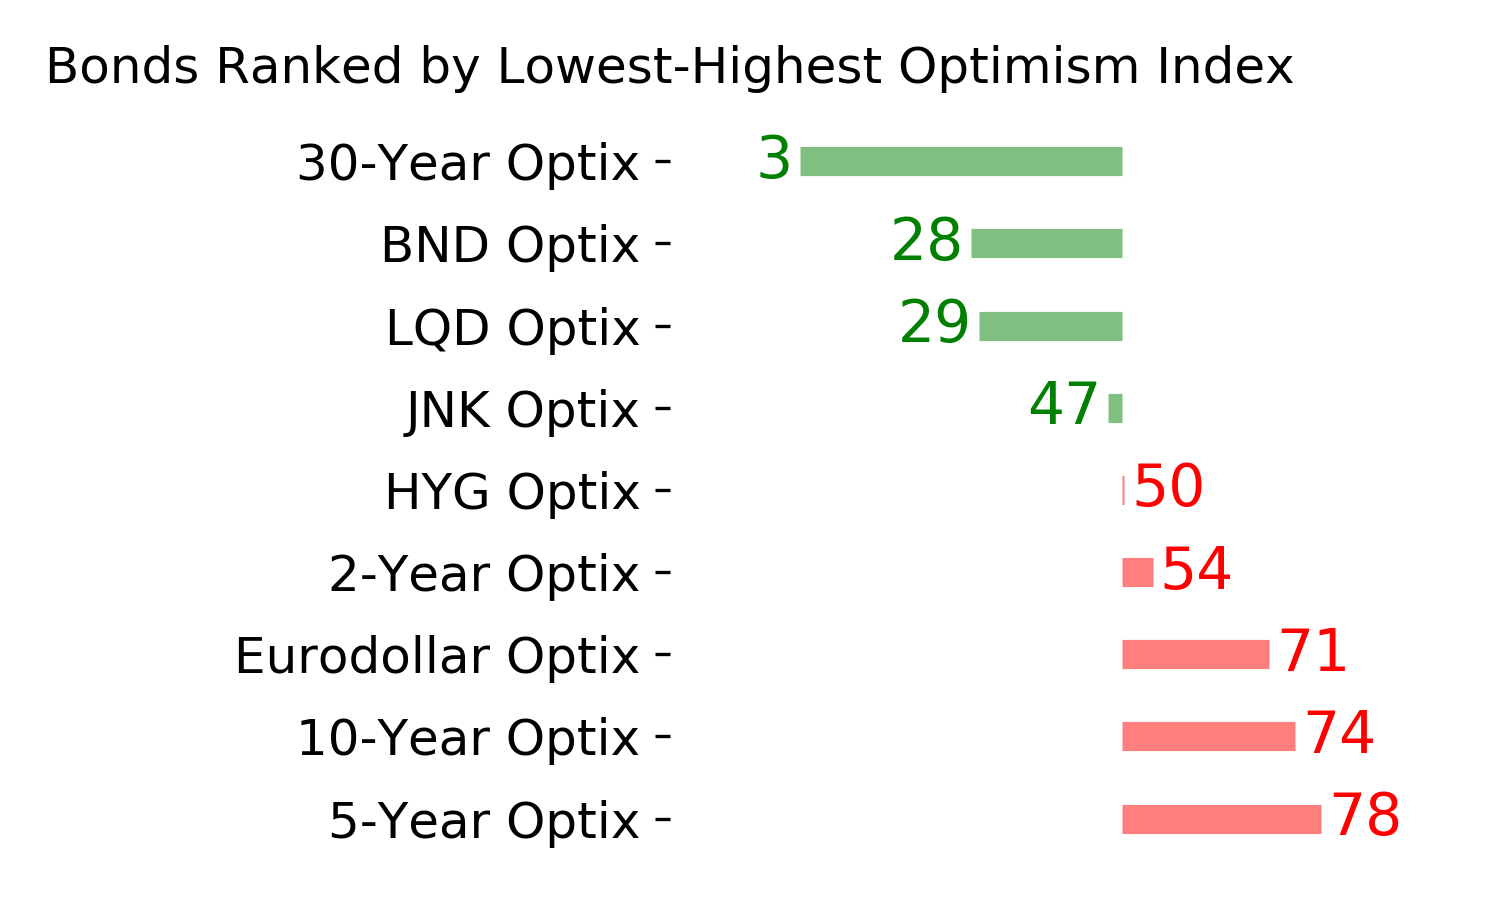
Ranks
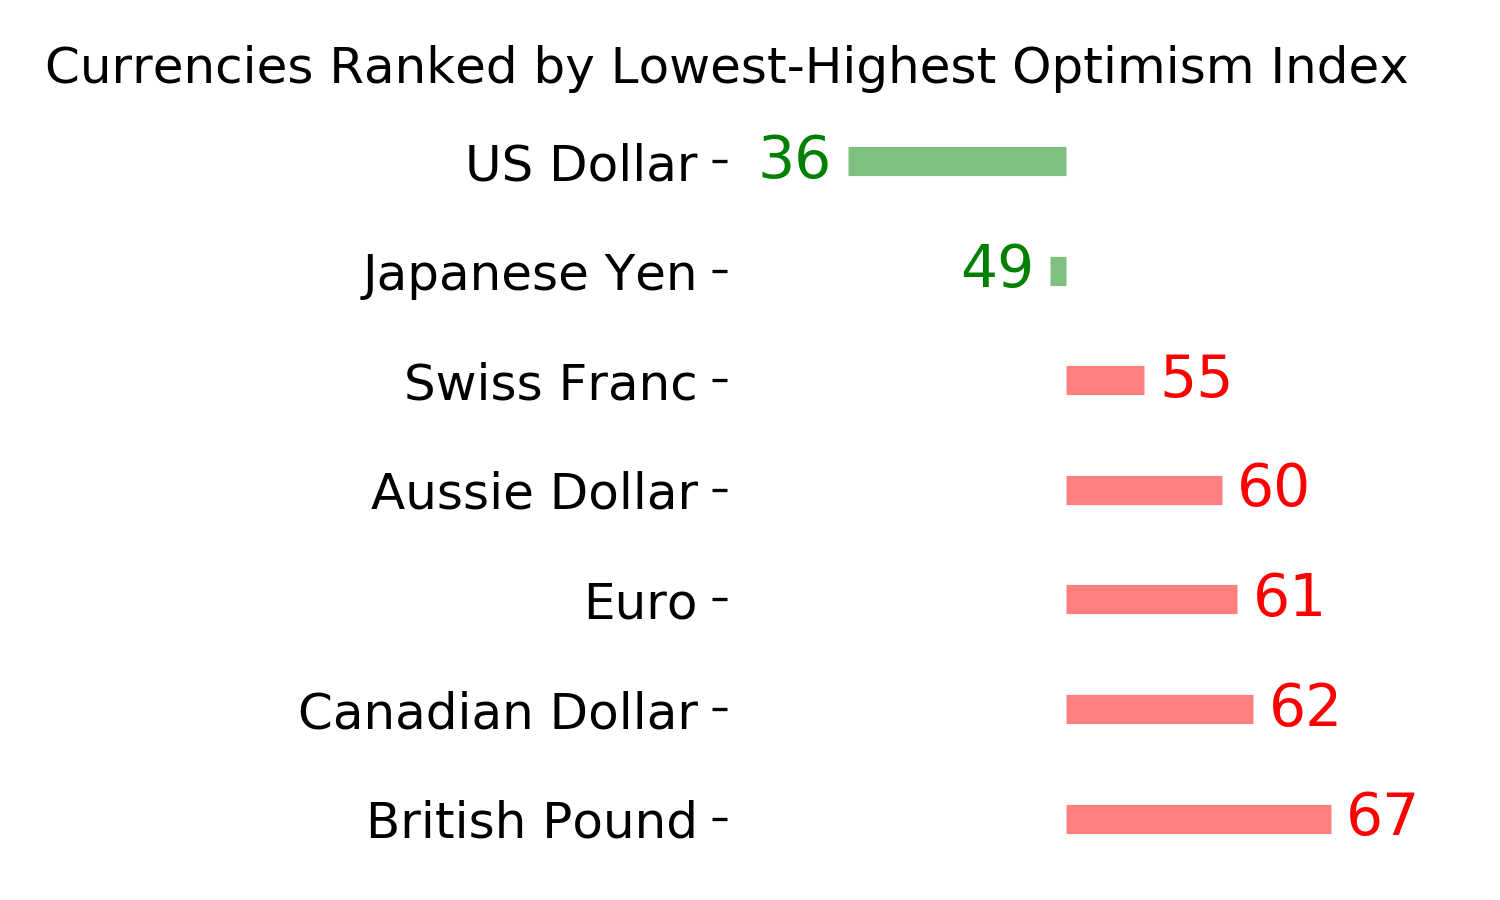
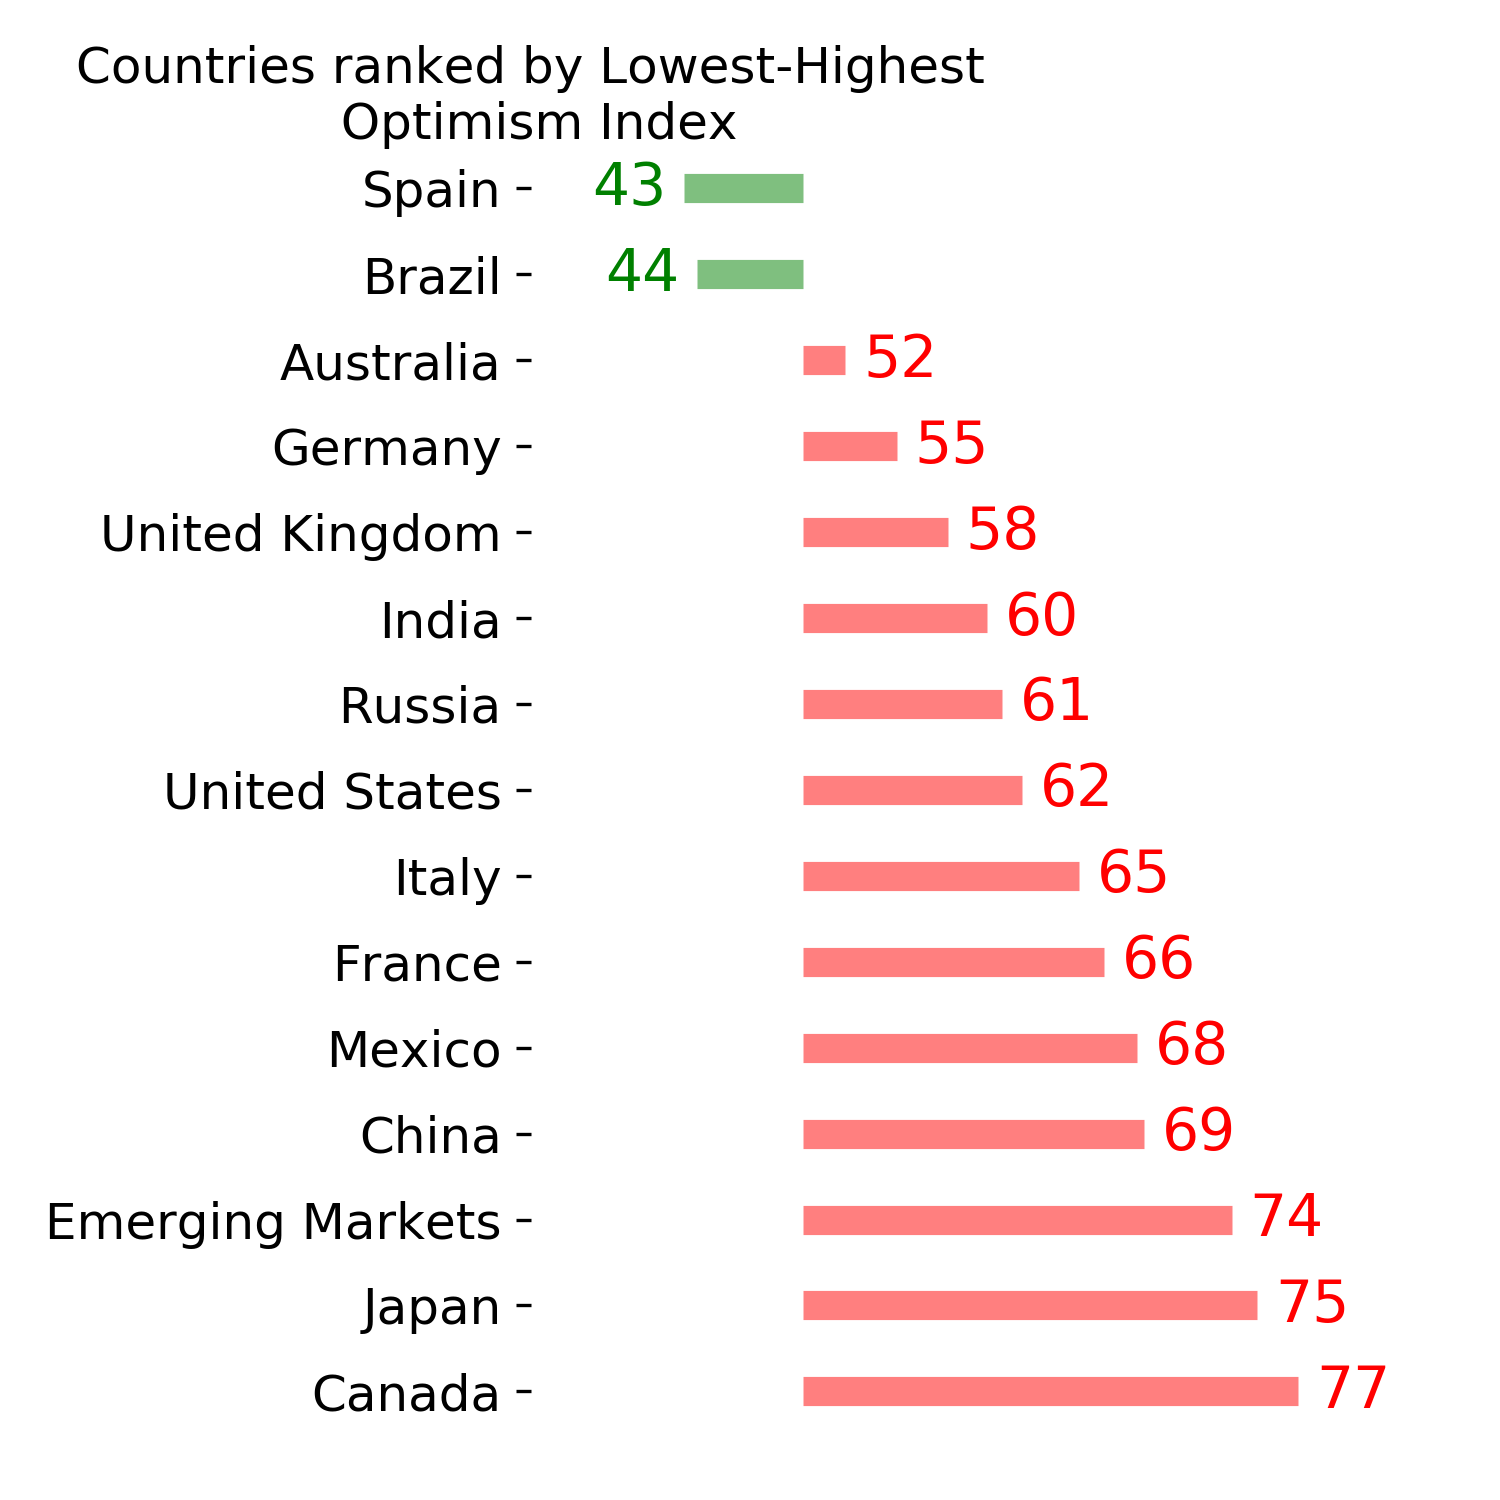
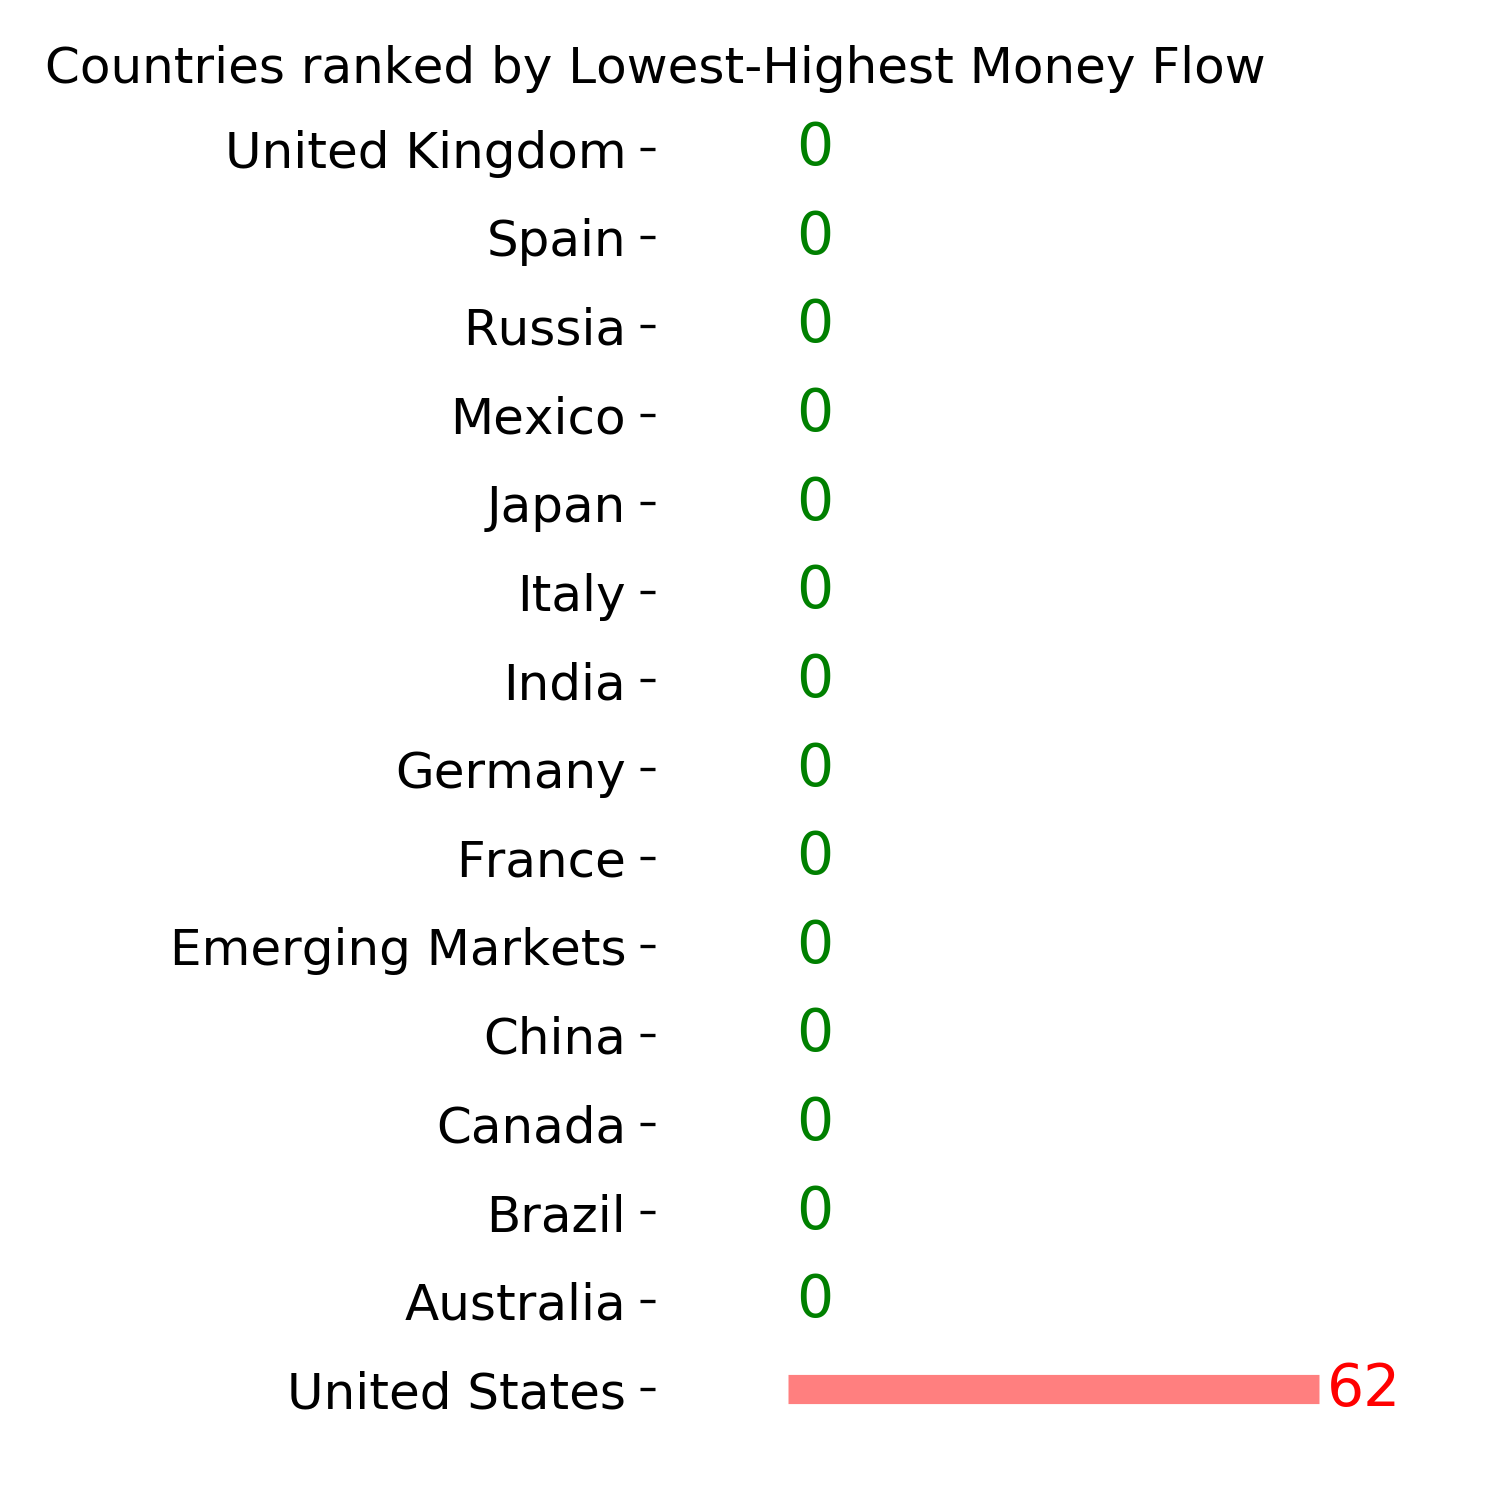
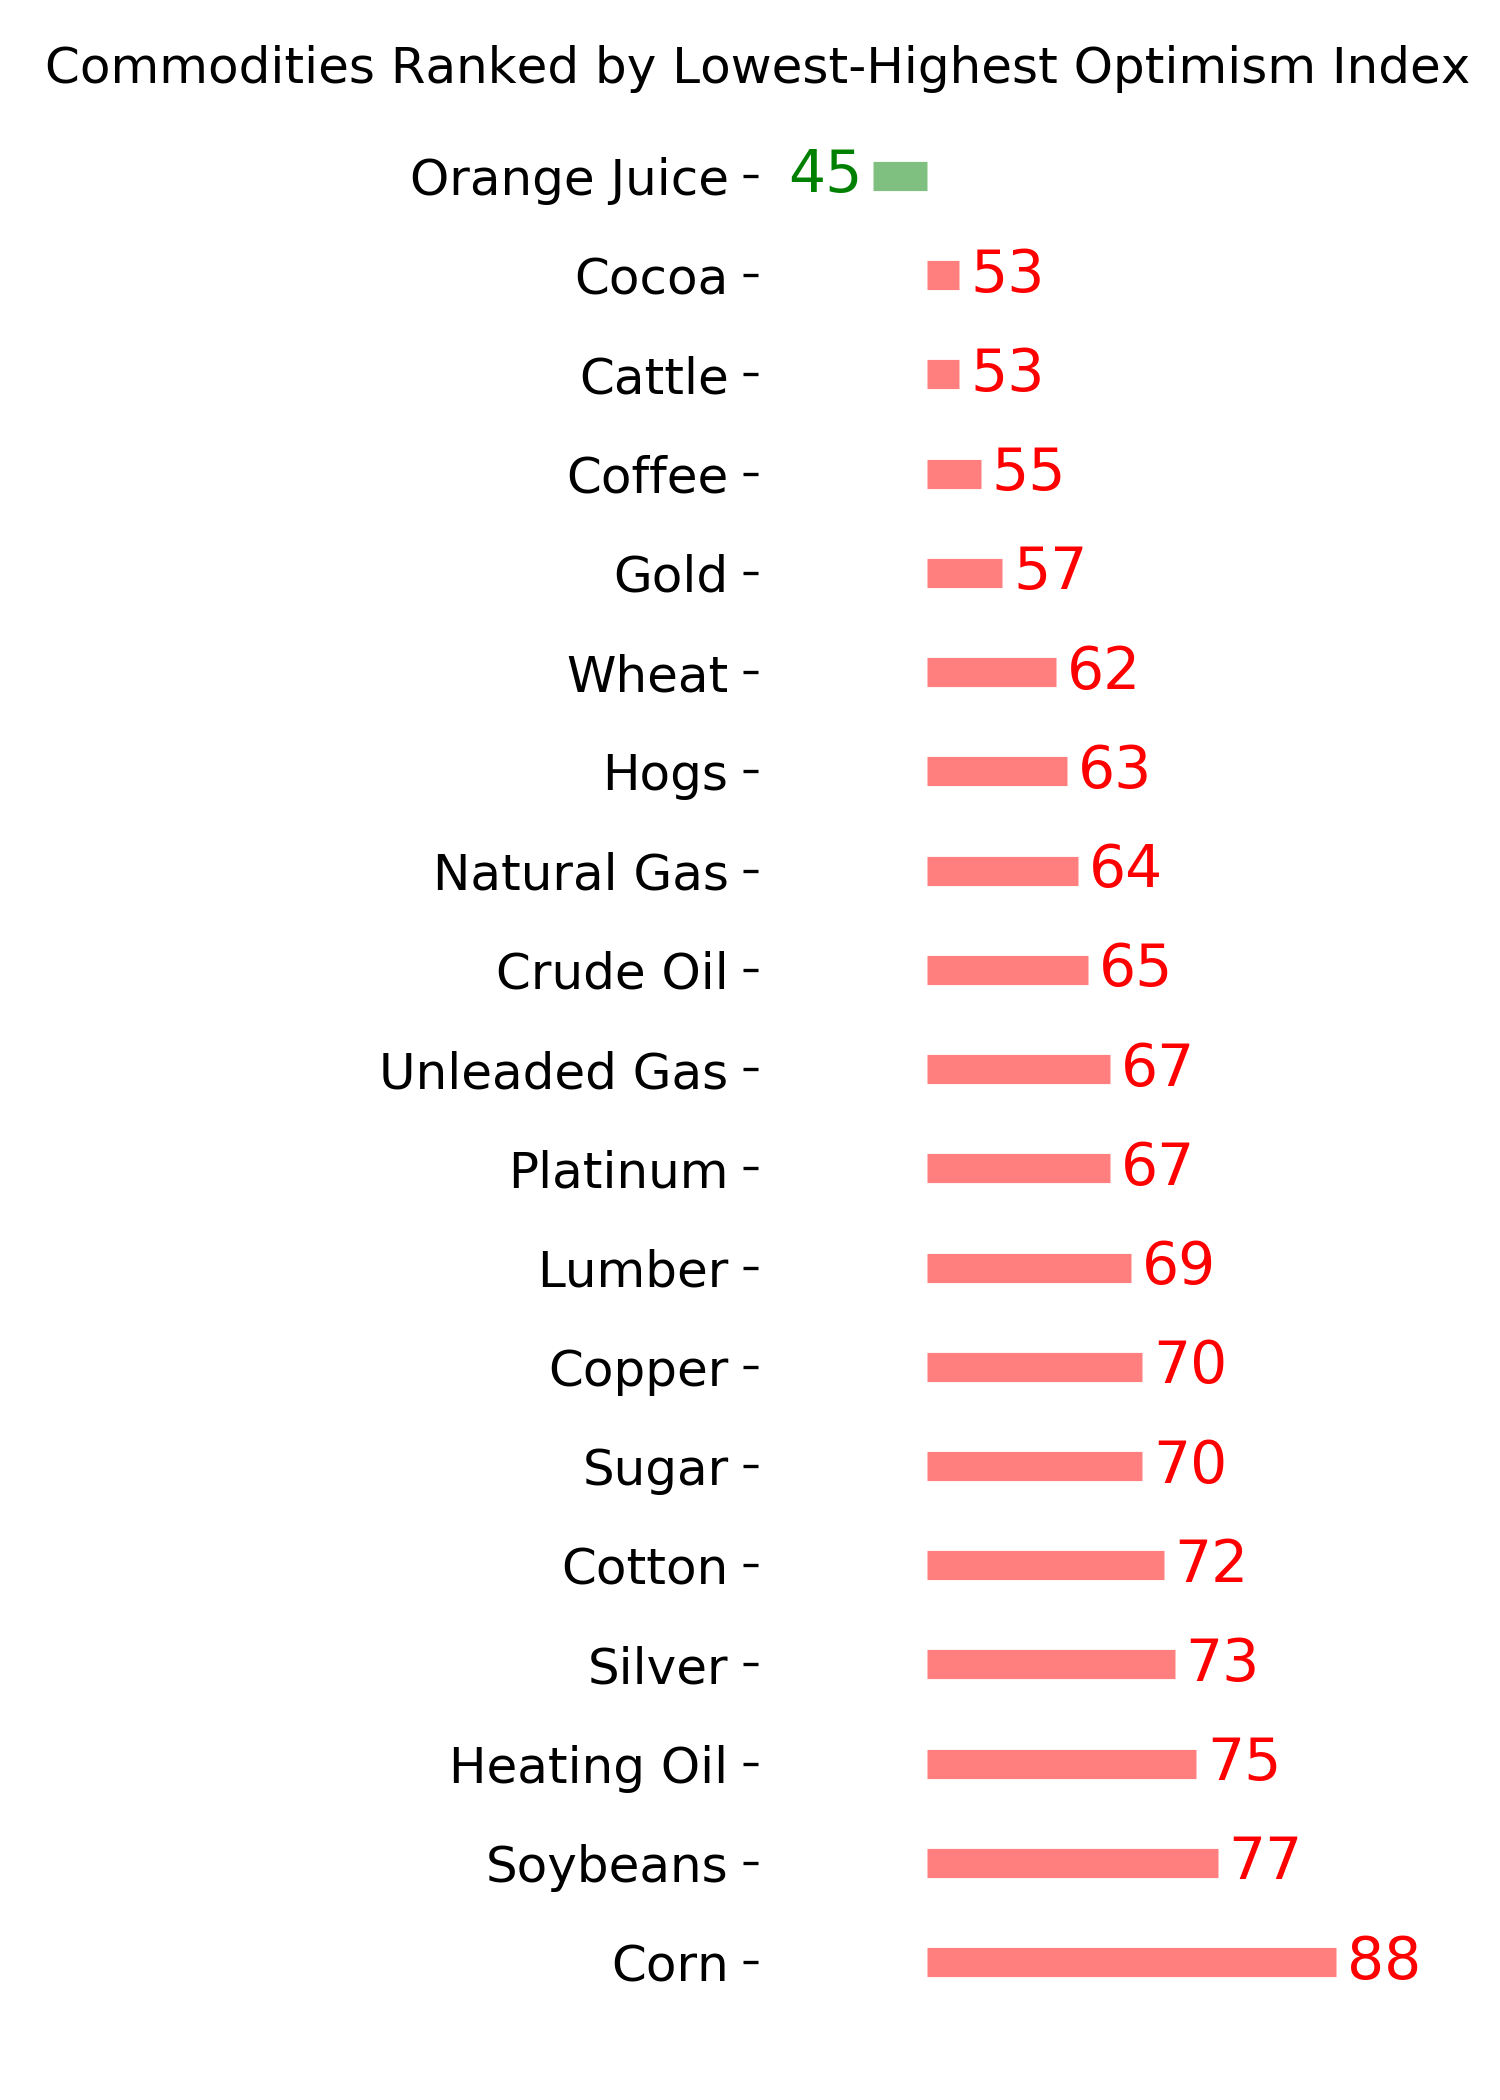
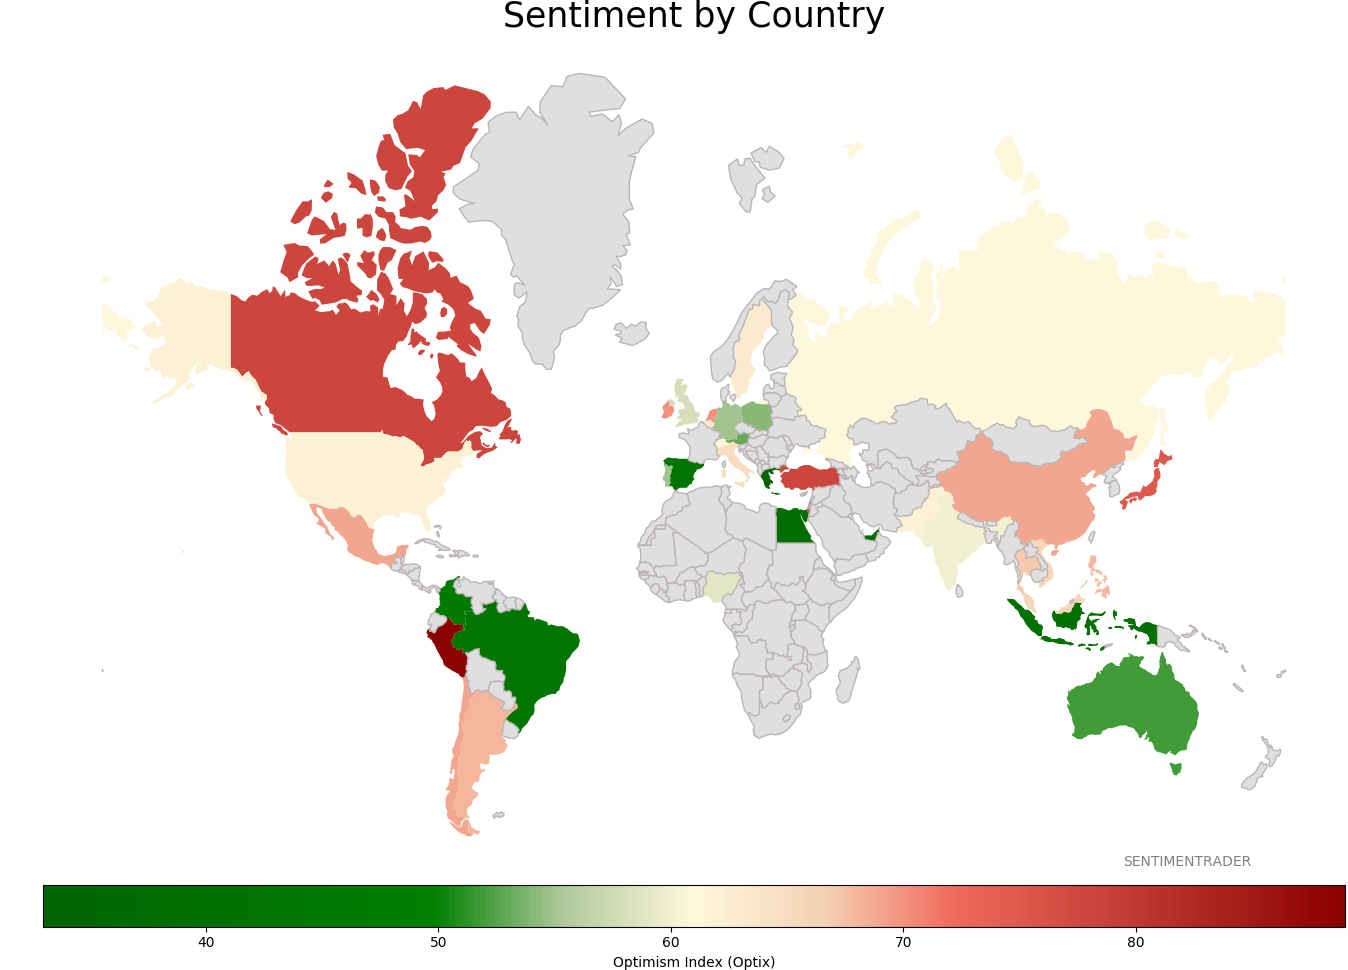
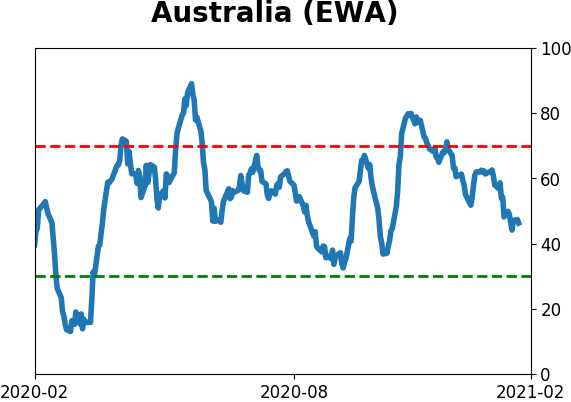
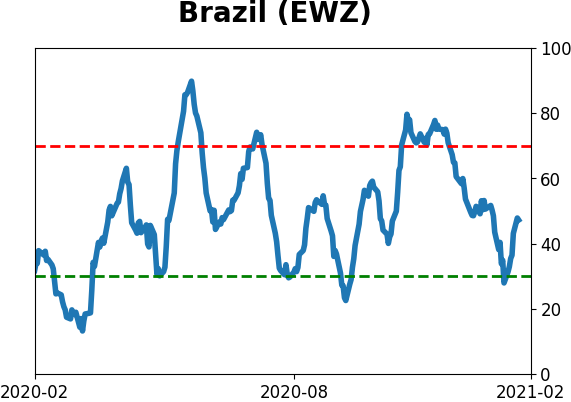
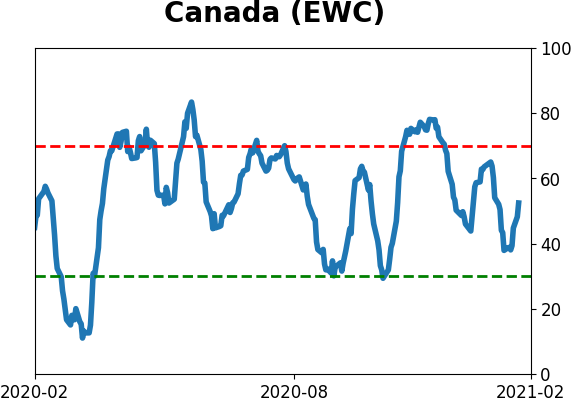
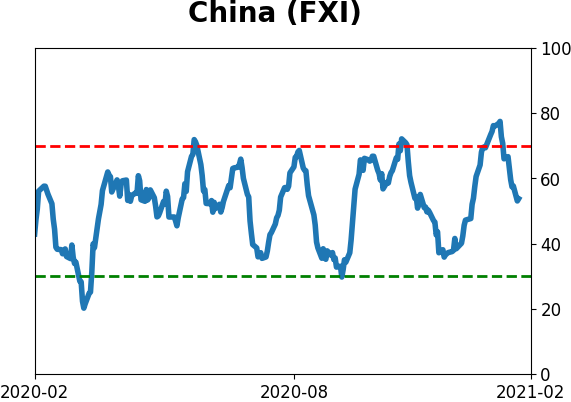
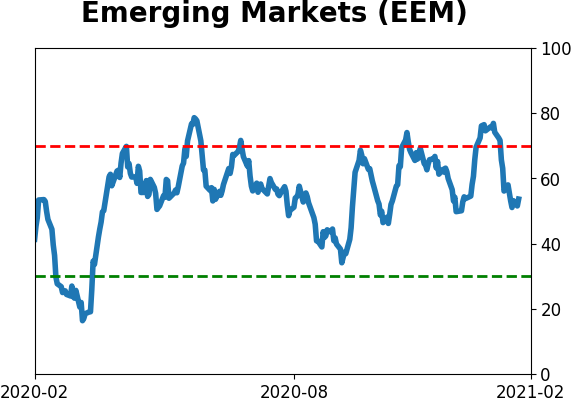
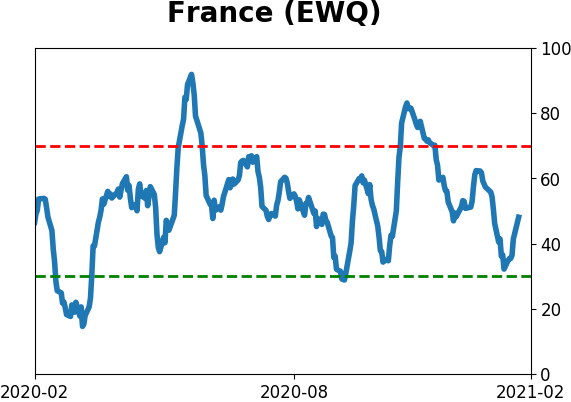
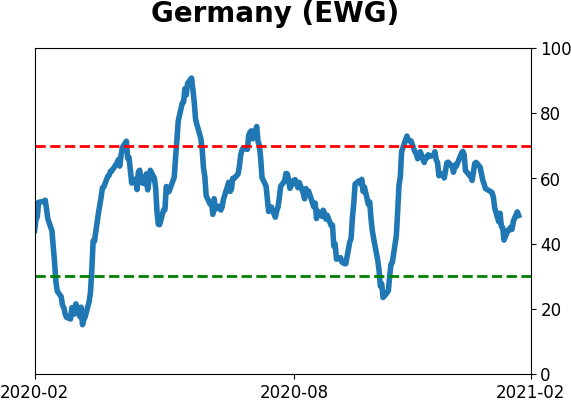
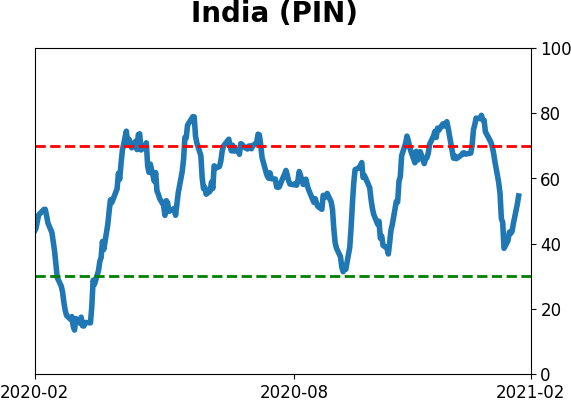
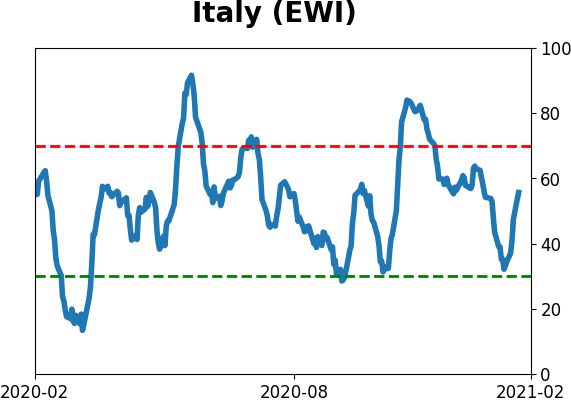
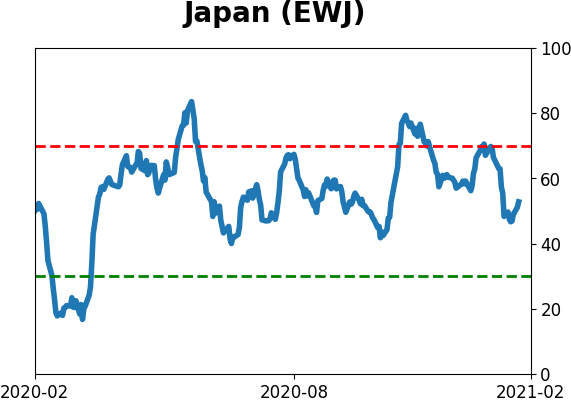
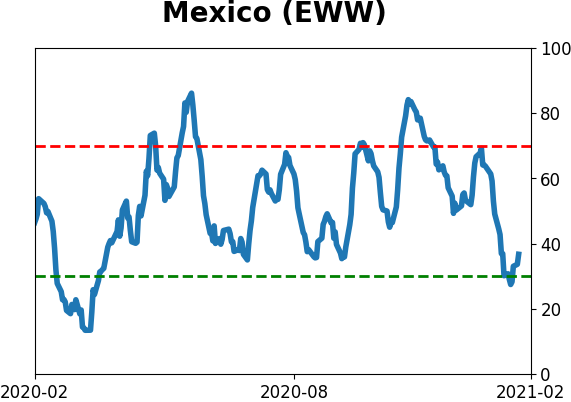
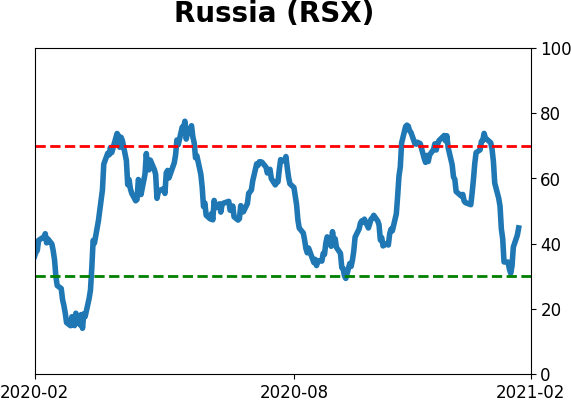
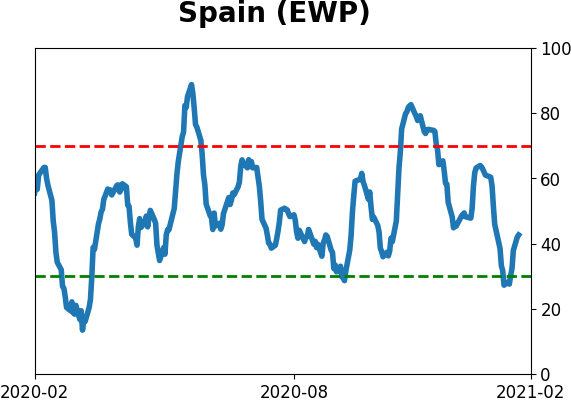
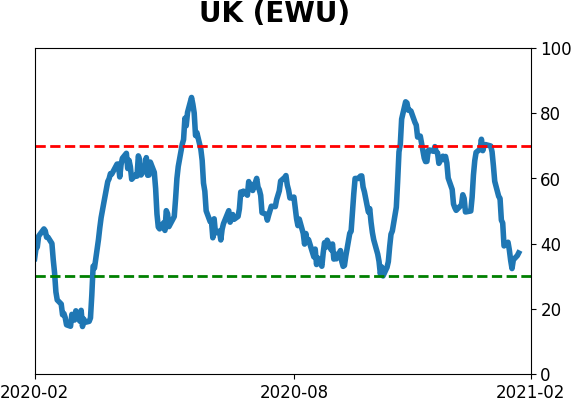
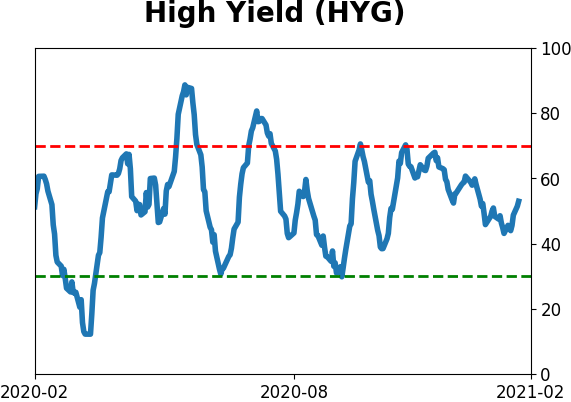
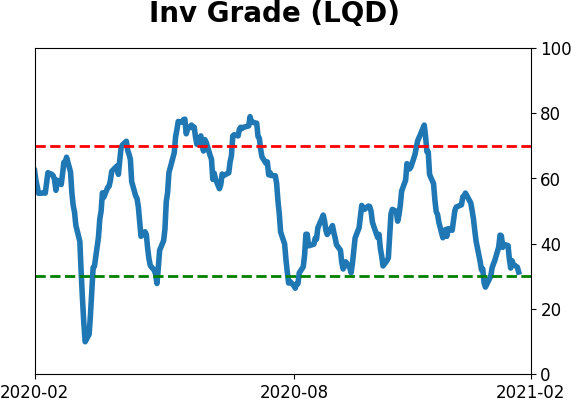
Sentiment Around The World
Optimism Index Thumbnails
|
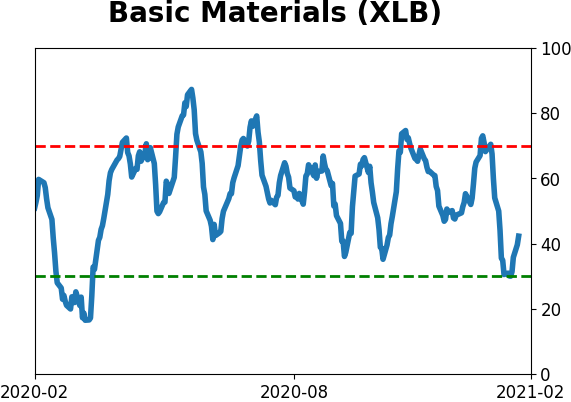
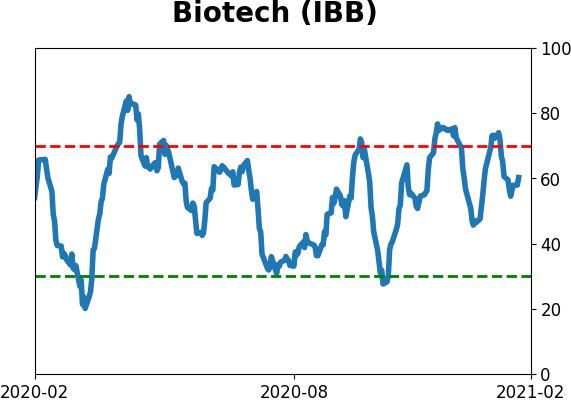
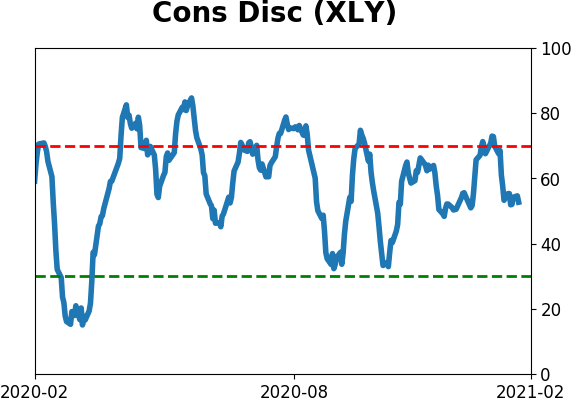
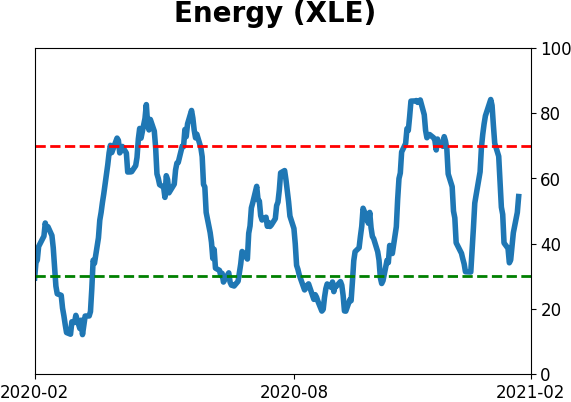
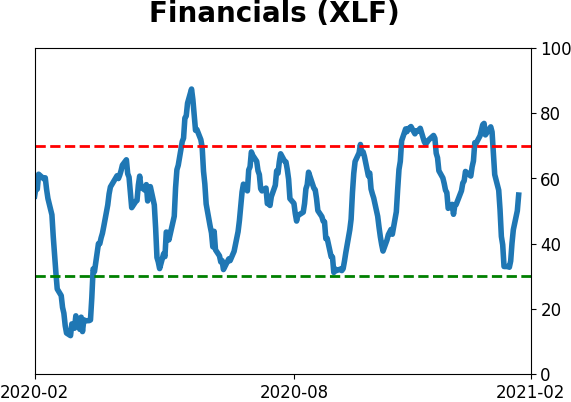
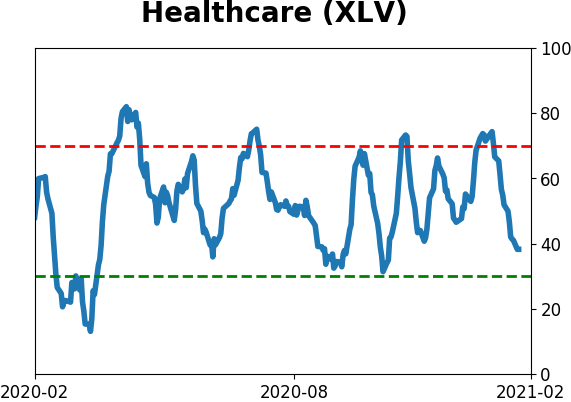
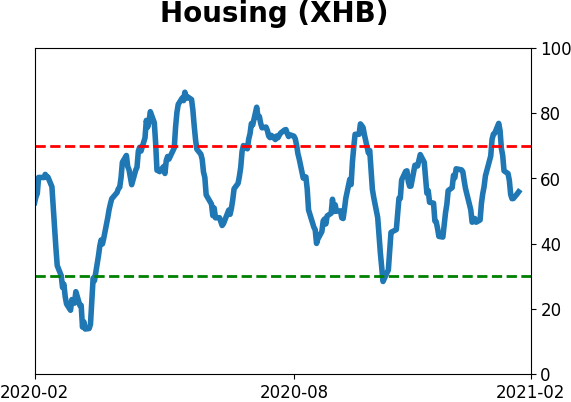
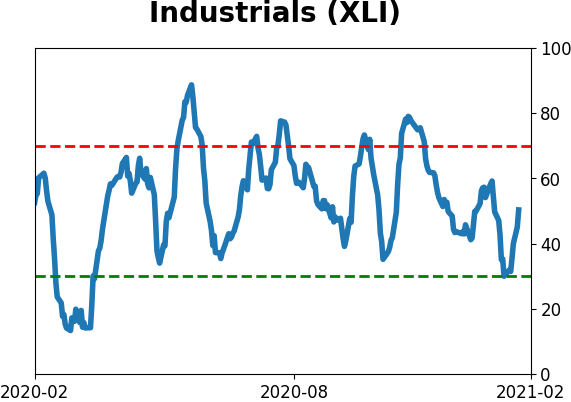
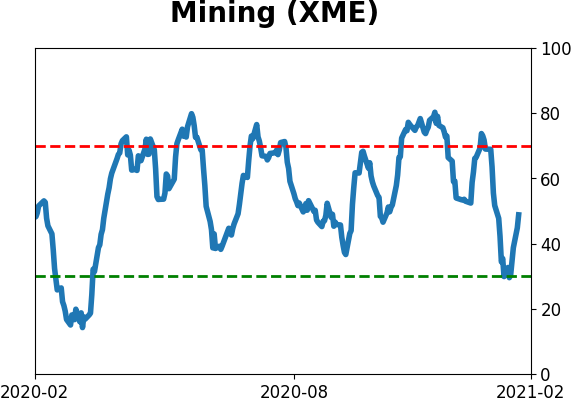
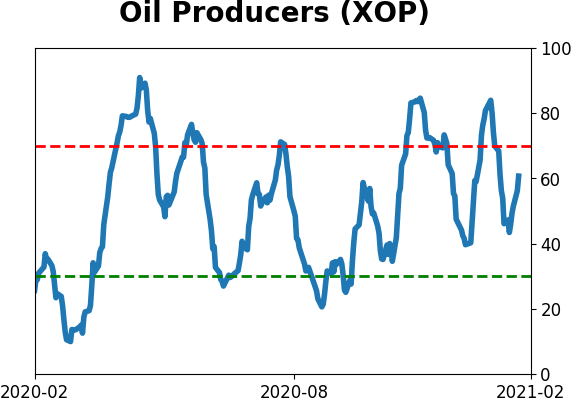
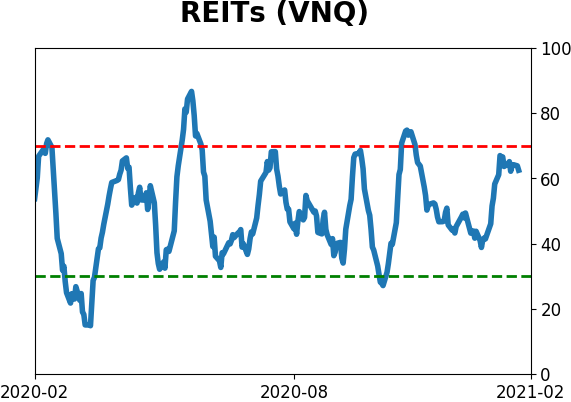
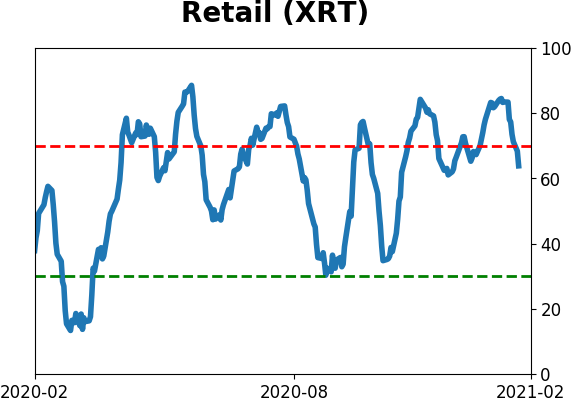
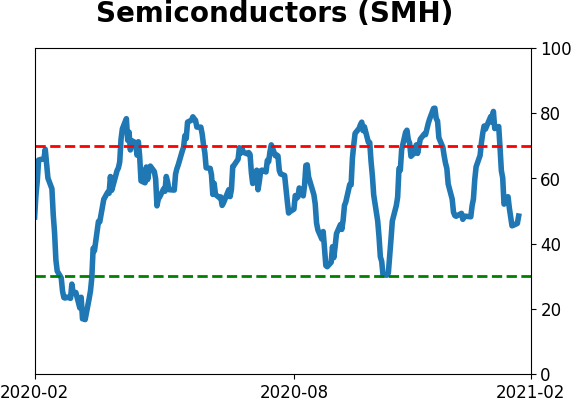
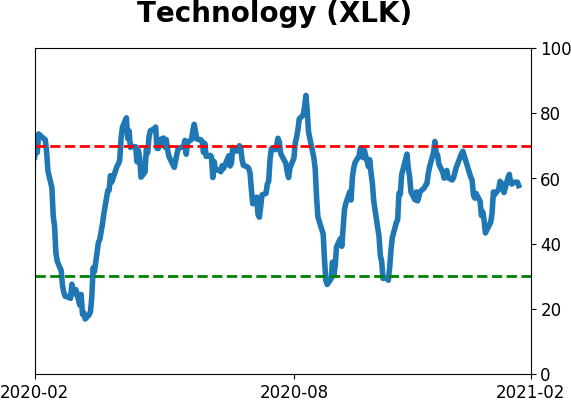
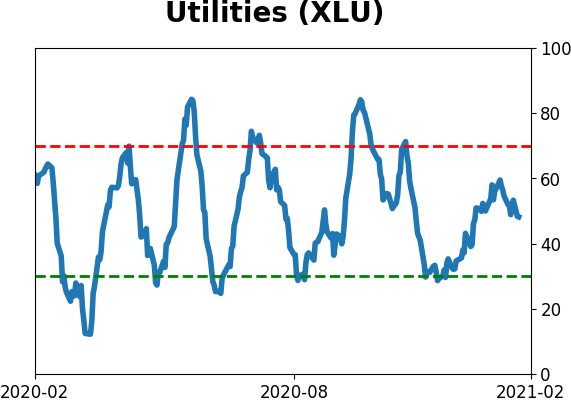
Sector ETF's - 10-Day Moving Average
|
|
|
Country ETF's - 10-Day Moving Average
|
|
|
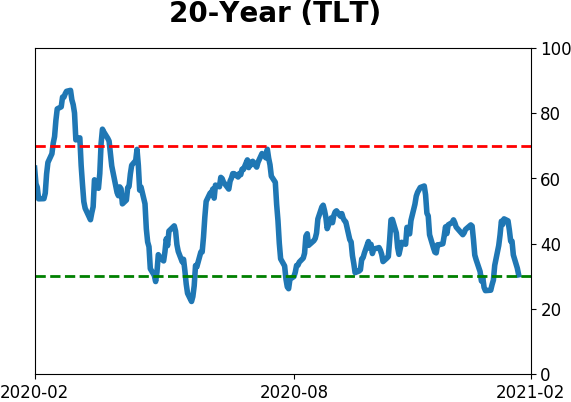
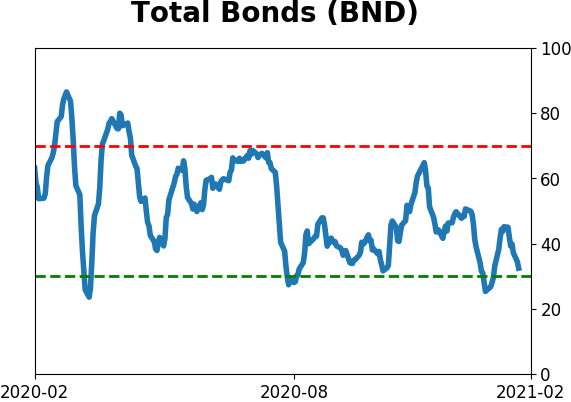
Bond ETF's - 10-Day Moving Average
|
|
|
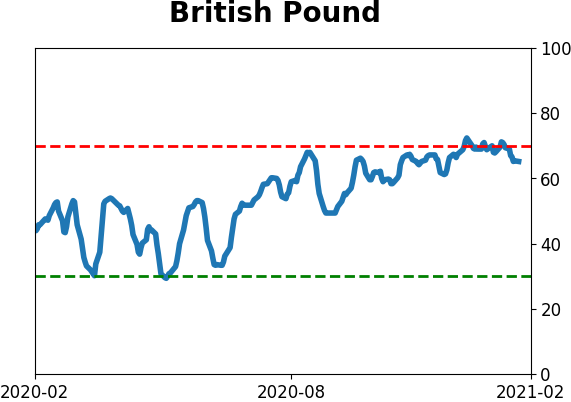
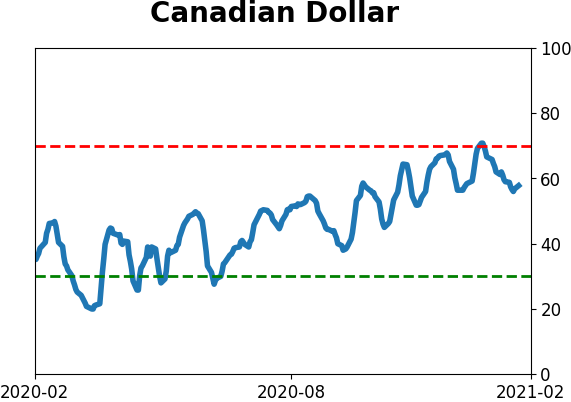
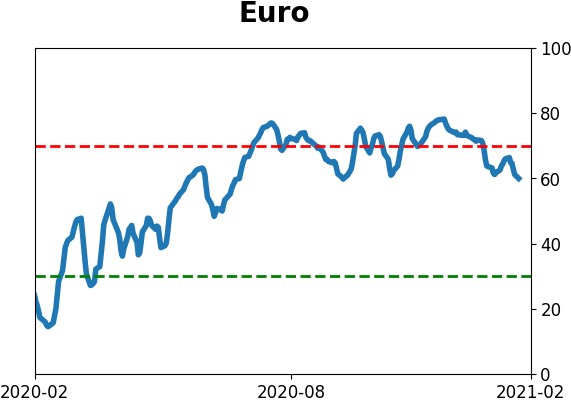
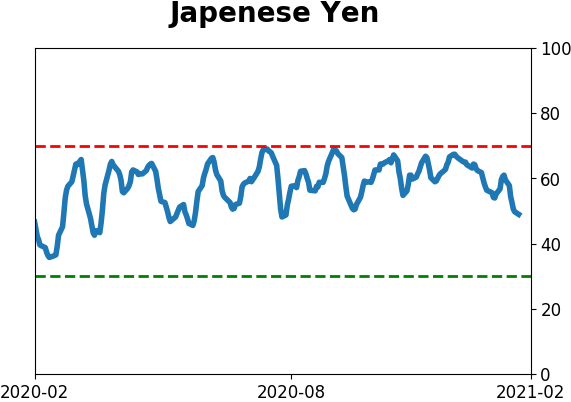
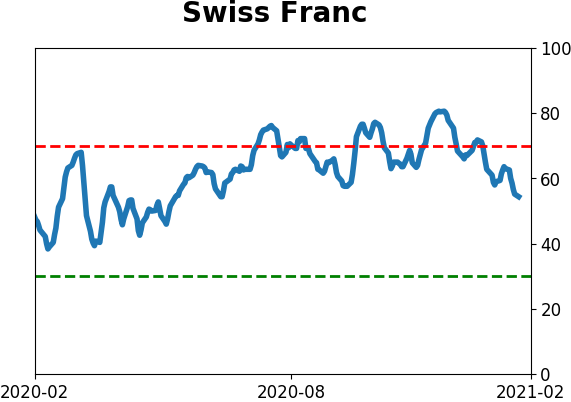
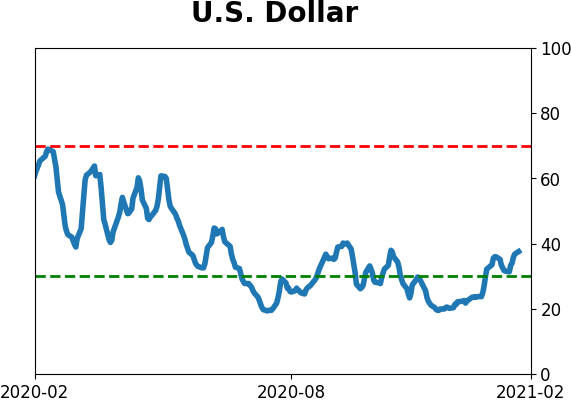
Currency ETF's - 5-Day Moving Average
|
|
|
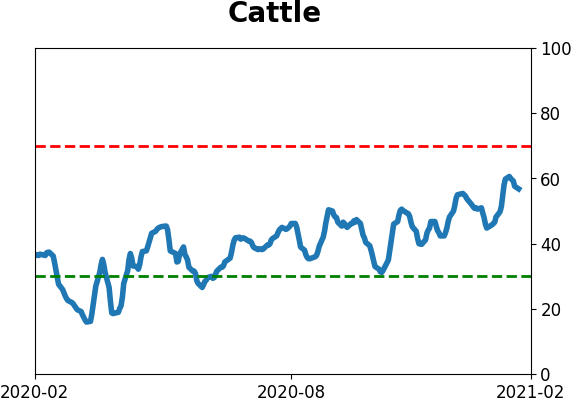
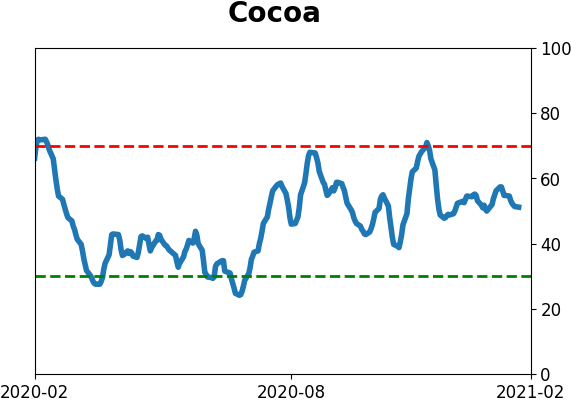
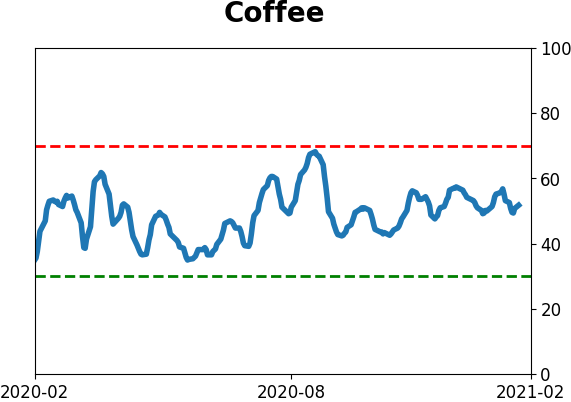
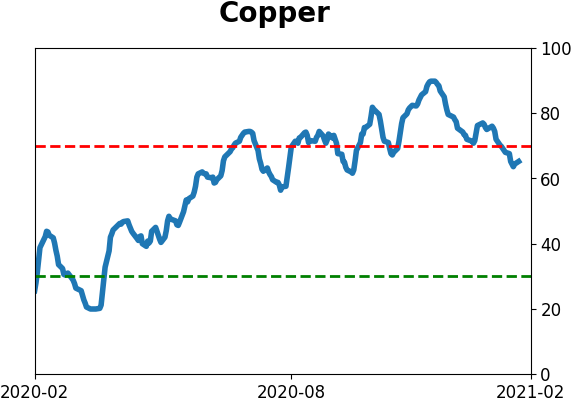
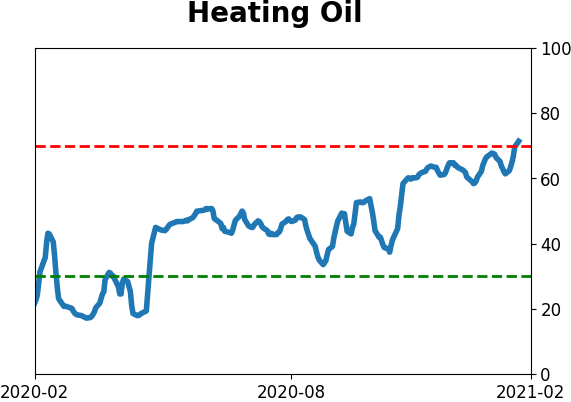
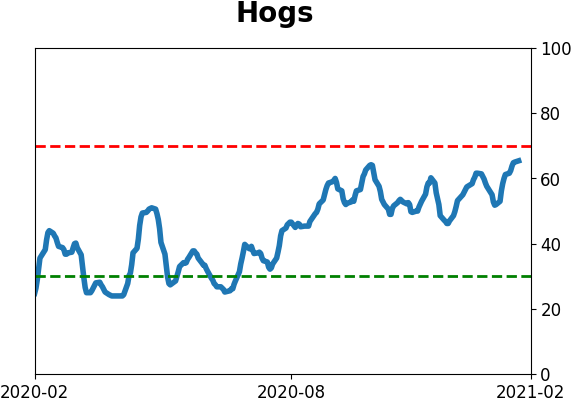
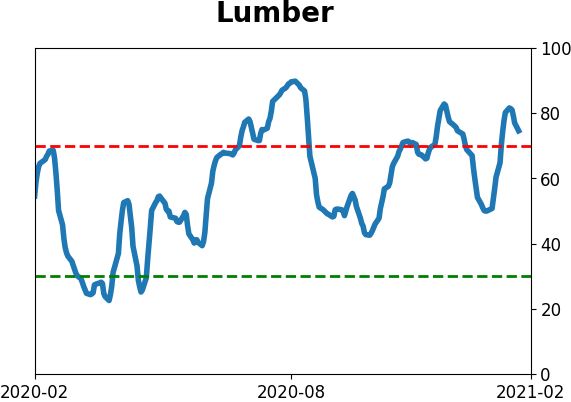
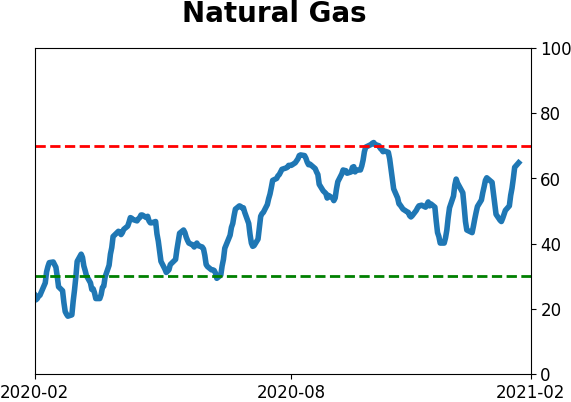
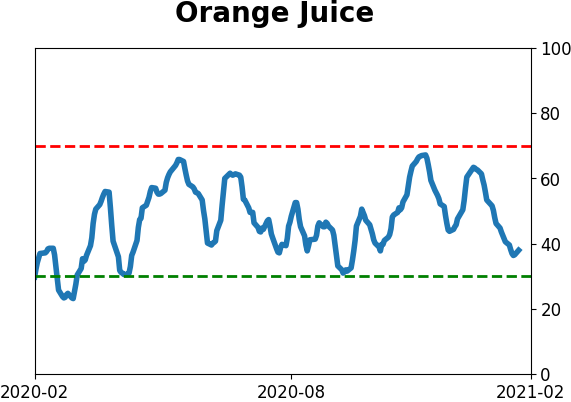
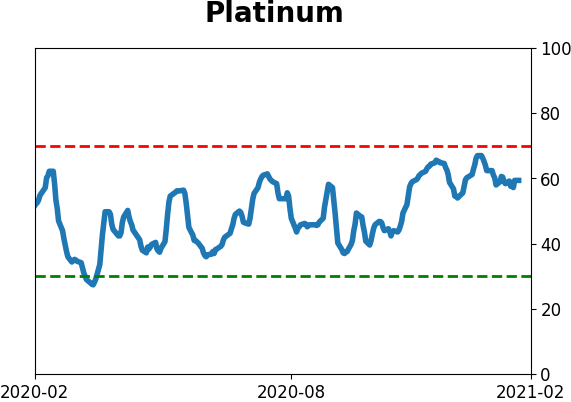
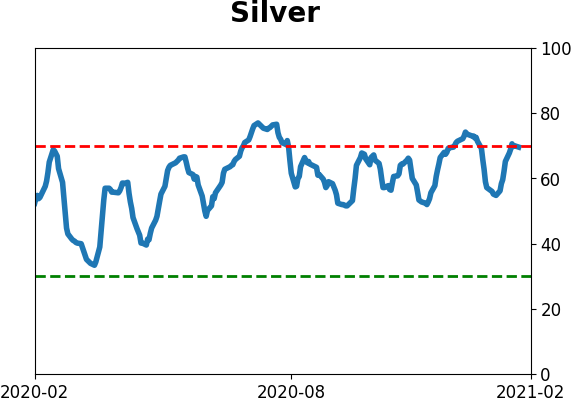
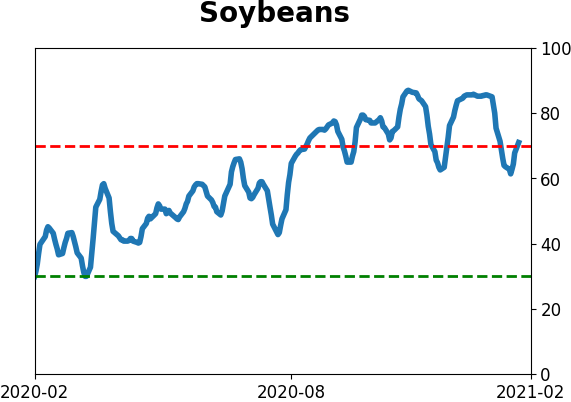
Commodity ETF's - 5-Day Moving Average
|
|