Headlines
|
|
More tech stocks try to make longer-term recoveries:
A little less than half of Technology stocks are holding above their 200-day moving averages. That's much improved from a couple of weeks ago when fewer than 25% of them were in uptrends. Similar reversals preceded positive returns but it would be better if we witnessed a surge in buying interest, so far missing from this move.
|
Smart / Dumb Money Confidence
|
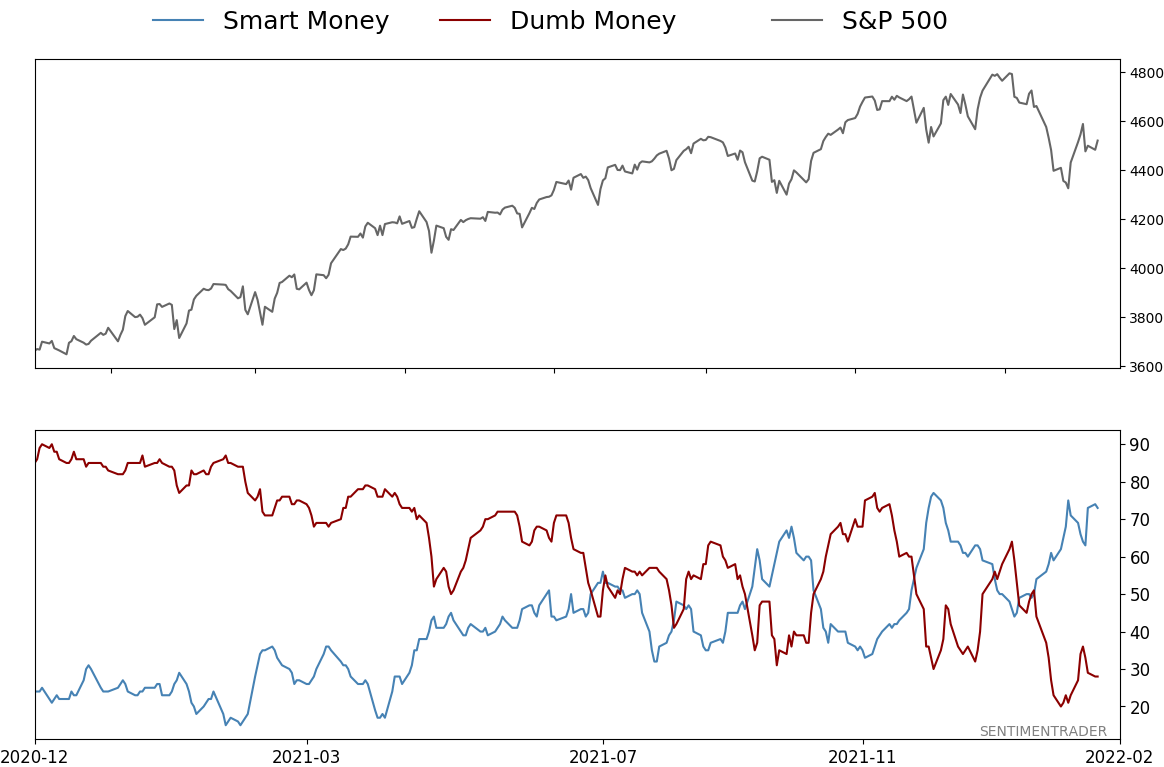
Smart Money Confidence: 73%
Dumb Money Confidence: 28%
|
|
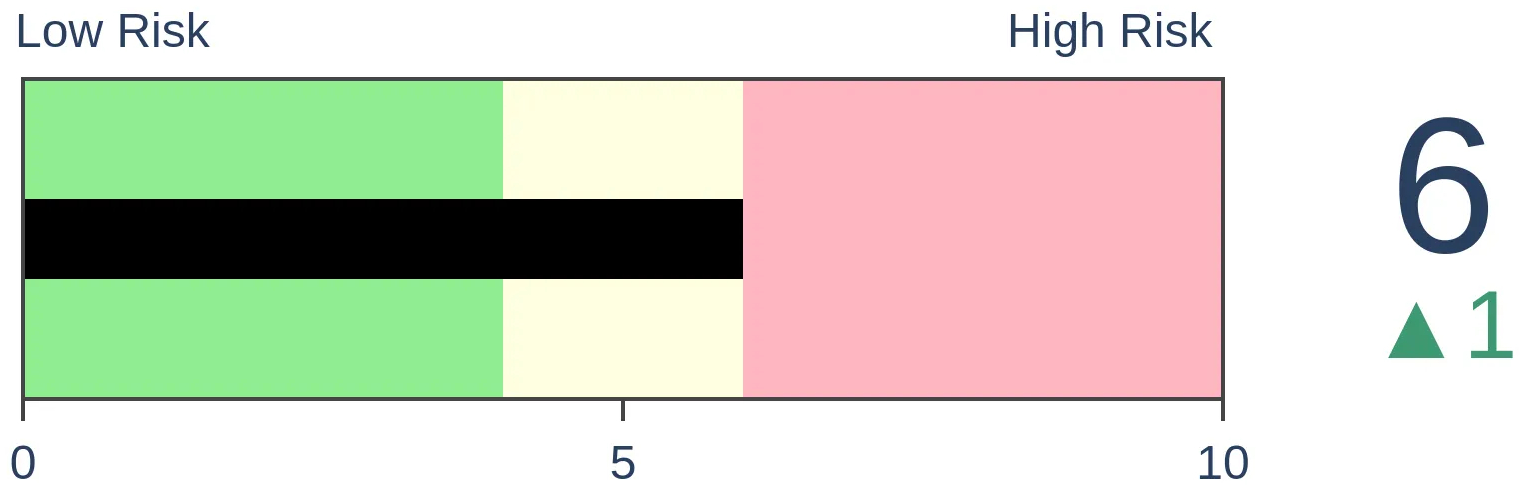
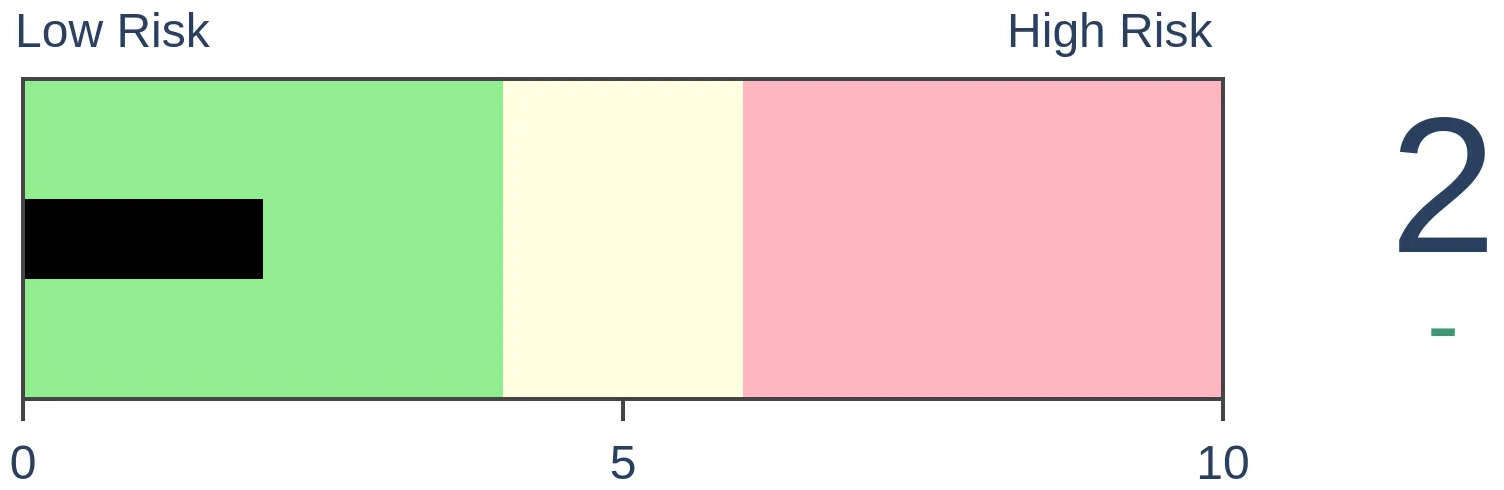
Risk Levels
Stocks Short-Term
|
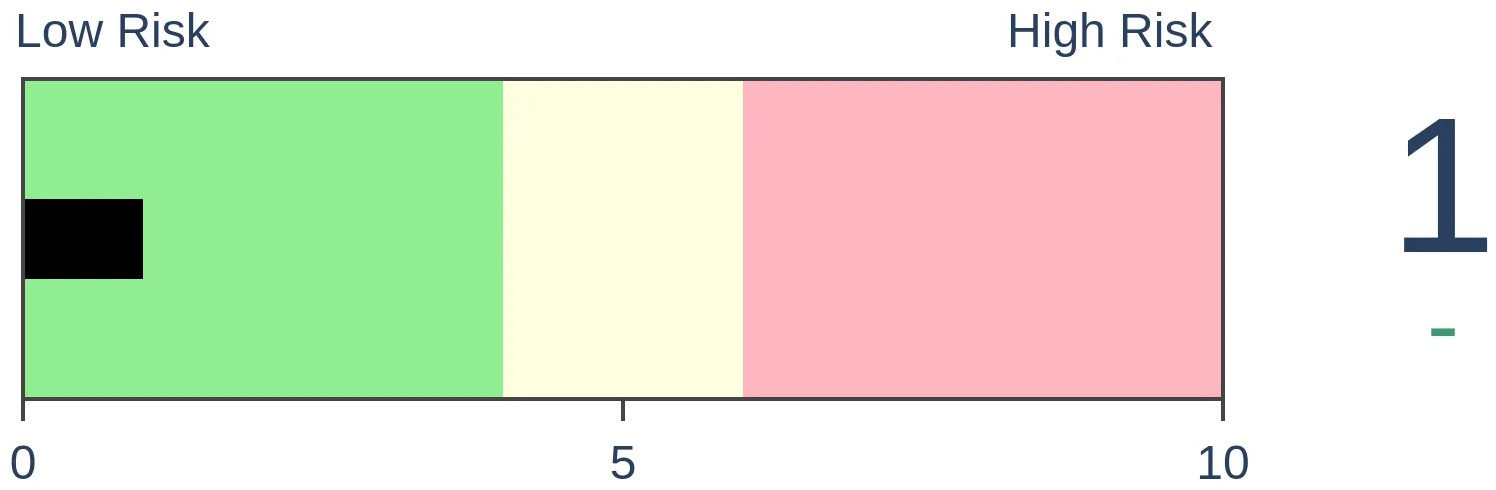
Stocks Medium-Term
|
|
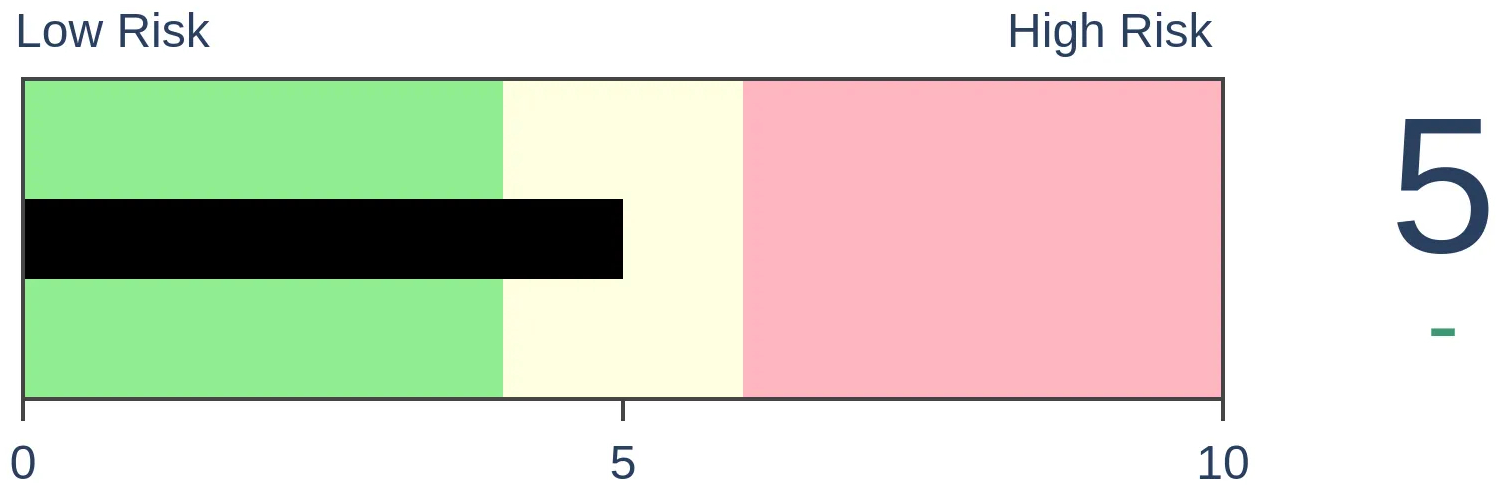
Bonds
|
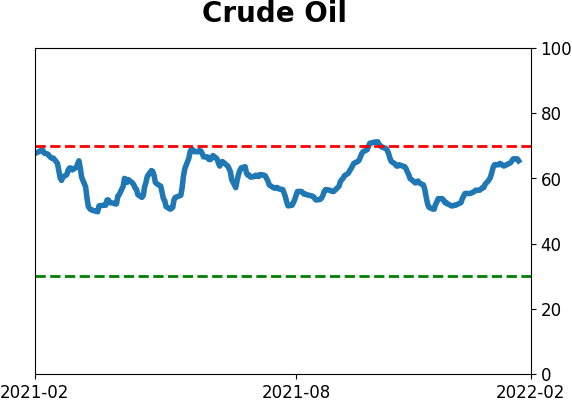
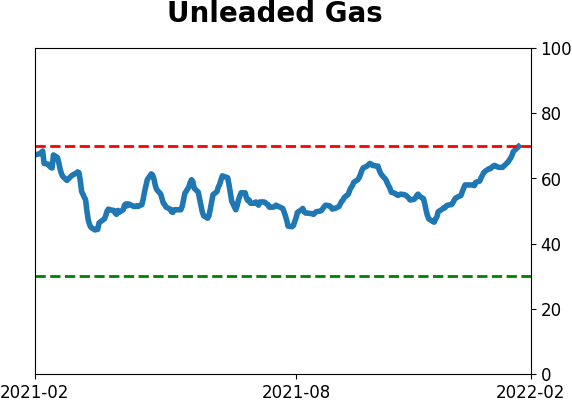
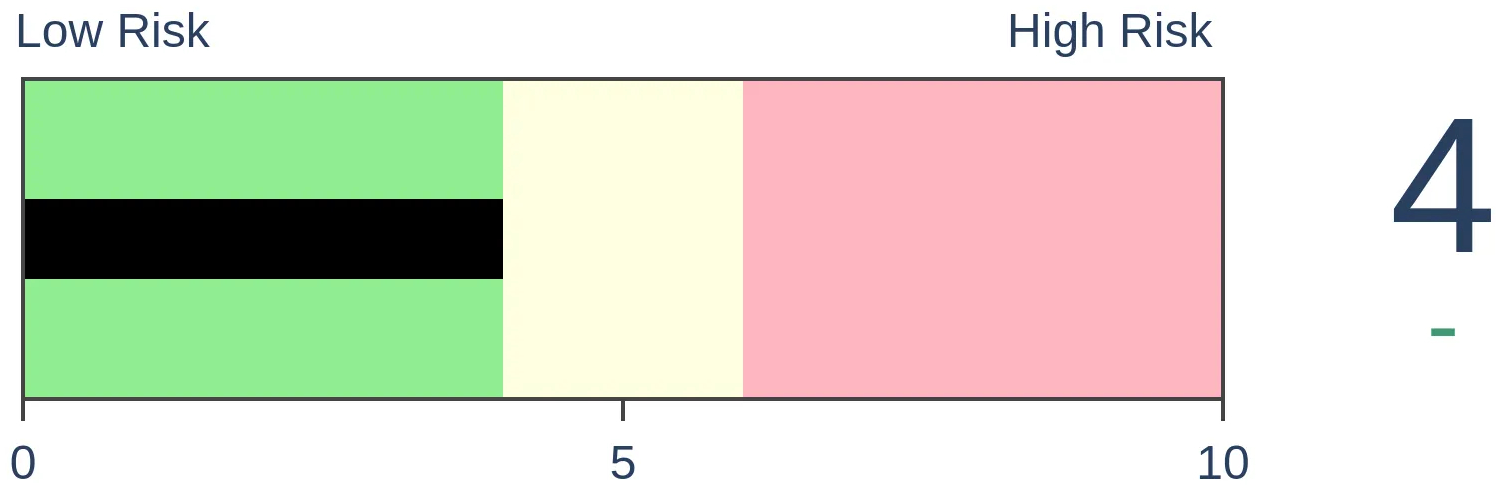
Crude Oil
|
|
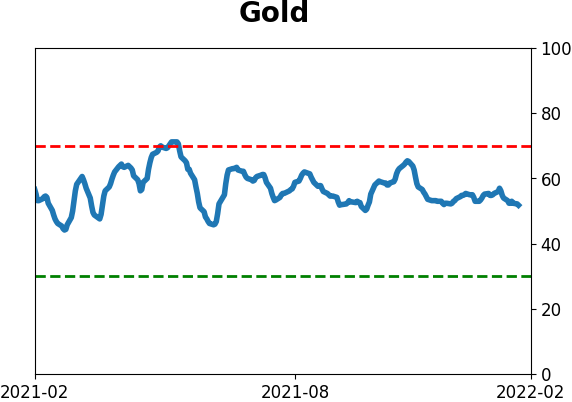
Gold

|
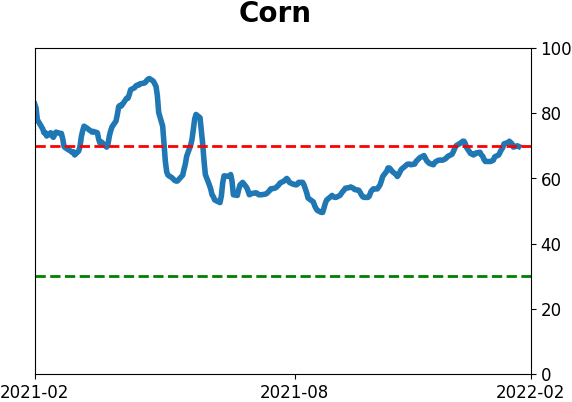
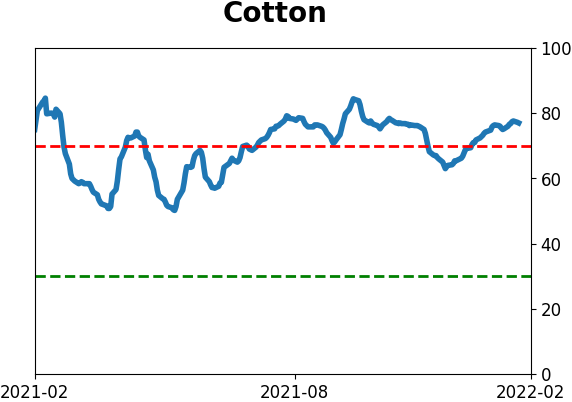
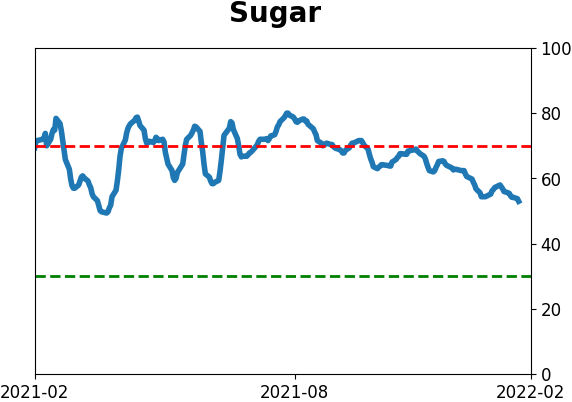
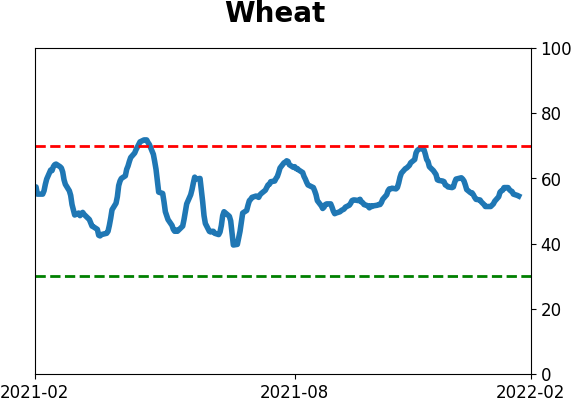
Agriculture
|
|
Research
By Jason Goepfert
BOTTOM LINE
A little less than half of Technology stocks are holding above their 200-day moving averages. That's much improved from a couple of weeks ago when fewer than 25% of them were in uptrends. Similar reversals preceded positive returns but it would be better if we witnessed a surge in buying interest, so far missing from this move.
FORECAST / TIMEFRAME
XLK -- Up, Long-Term
|
Key points:
- A few weeks ago, fewer than 25% of Technology stocks held above their 200-day moving averages
- That has since recovered to neutral territory
- Similar reversals preceded consistently positive returns, but it would be better if we saw a thrust in buying interest
Tech stocks struggling to hold long-term uptrends
Last week, we saw that Nasdaq stocks had staged a recovery, at least in terms of the percentage of them rising to 52-week highs versus those falling to 52-week lows.
While the Nasdaq is considered a tech index, that's not entirely accurate. Even so, there has been a recovery in long-term trends, specifically among Technology stocks. After fewer than 25% of Technology sector stocks were trading above their 200-day moving averages, enough recovered so that most of them were above their averages.
Part of the reason why we've seen a quick change is because so many of the stocks have been hovering right around their 200-day averages. As stocks have gyrated in recent months, those averages have flattened out, and more stocks are popping above and below them as prices whip back and forth.
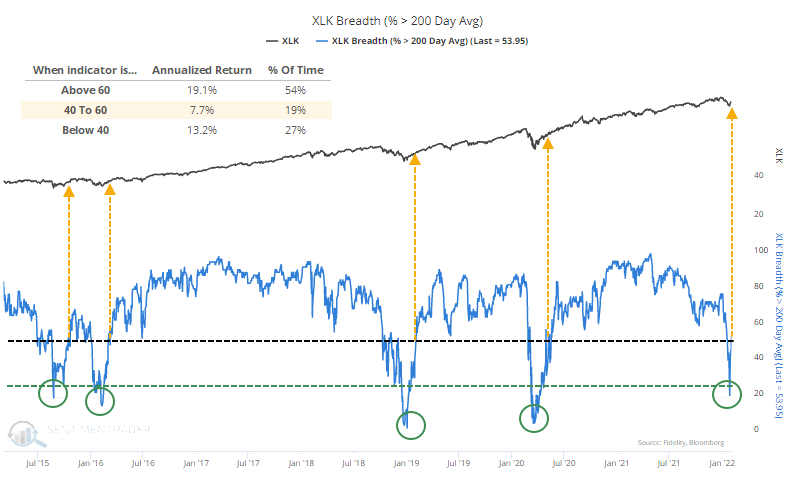
It's generally better for Tech stocks if we see a thrust with more than 60% of them trading above their 200-day averages. So far, it's been hovering below 60%, which is what an unhealthy market does. We can see from the chart above that the total return on Technology stocks since 1952 was only 7.7% when the percentage of members was neutral, between 40% - 60%.
When it was below 40%, we got the opportunity to enjoy oversold snapbacks. When it was above 60%, the zone where the stocks saw their best annualized returns, it coincided with periods of positive momentum. We have neither right now.
Still, let's take a look to see how the sector performed when there was a quick cycle from fewer than 25% of members above their long-term averages to more than 50%. The table below shows every signal over the past 70 years. Returns in the table use the total return (including price gains and dividends).
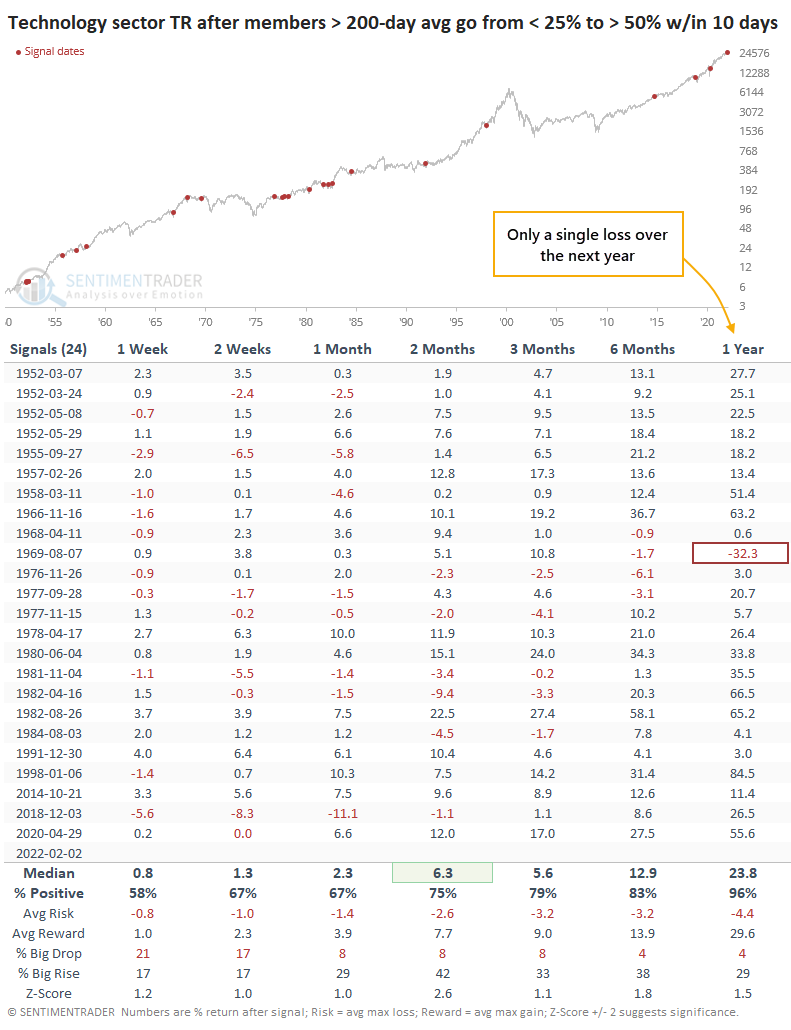
The fact that we just cycled up from an oversold extreme helped forward returns significantly. The Tech sector's median return over the next 2 months was more than 2 standard deviations above random, and its consistency improved with each time frame. Over the next year, the sector saw a positive return after 23 out of 24 signals, though the exception was an extreme one.
What the research tells us...
The selling pressure this year, especially in stocks that inhabit the Nasdaq exchange, including Technology stocks, has been extreme. We've now seen a modest recovery, suggesting the worst could be over. But it's not a strong signal. We haven't seen an opposing reaction, a multi-day move with an overwhelming amount of buying interest. So far, it looks like an oversold relief rally, and while returns after similar moves were positive, it would be better if we see more of a surge in interest among buyers.
Active Studies
| Time Frame | Bullish | Bearish | | Short-Term | 3 | 0 | | Medium-Term | 17 | 2 | | Long-Term | 14 | 5 |
|
Indicators at Extremes
Portfolio
| Position | Description | Weight % | Added / Reduced | Date | | Stocks | RSP | 21.4 | Added 10.2% | 2022-01-28 | | Bonds | 32.7% BND, 7.1% SCHP | 40.1 | Added 8.3% | 2021-10-26 | | Commodities | GCC | 2.4 | Reduced 2.1%
| 2020-09-04 | | Precious Metals | GDX | 4.6 | Reduced 4.2% | 2021-05-19 | | Special Situations | 8.1% KWEB, 3.6% XLE, 1.7% PSCE | 13.4 | Reduced 3.9% | 2022-01-18 | | Cash | | 17.9 | | |
|
Updates (Changes made today are underlined)
With a typical time frame of several months in this account, I normally don't make changes so quickly. I've added back part of the stock exposure I took off earlier in January due to the washed-out conditions and extreme pessimism we're seeing across a wide array of metrics. The biggest issue is that the environment is unhealthy and we could be in the throes of a protracted bear market. Even so, the readings we've seen recently have a good record at preceding relief rallies, so we'll have to see how that pans out. Bond sentiment is trying to recover from a recent bout of pessimism, and gold stocks are doing their thing which is not much at all. They've been flat for six months. Chinese tech stocks were doing exactly what they're supposed to do, then did *not* by plunging to new lows. This is troubling on a shorter-term time frame, but this was never meant for a trade, rather a multi-year investment. Recent behavior is troubling and I will not be adding any exposure as long as that's the case. RETURN YTD: +0.1% 2021: +8.7%, 2020: +8.1%, 2019: +12.6%, 2018: +0.6%, 2017: +3.8%, 2016: +17.1%, 2015: +9.2%, 2014: +14.5%, 2013: +2.2%, 2012: +10.8%, 2011: +16.5%, 2010: +15.3%, 2009: +23.9%, 2008: +16.2%, 2007: +7.8%
|
|
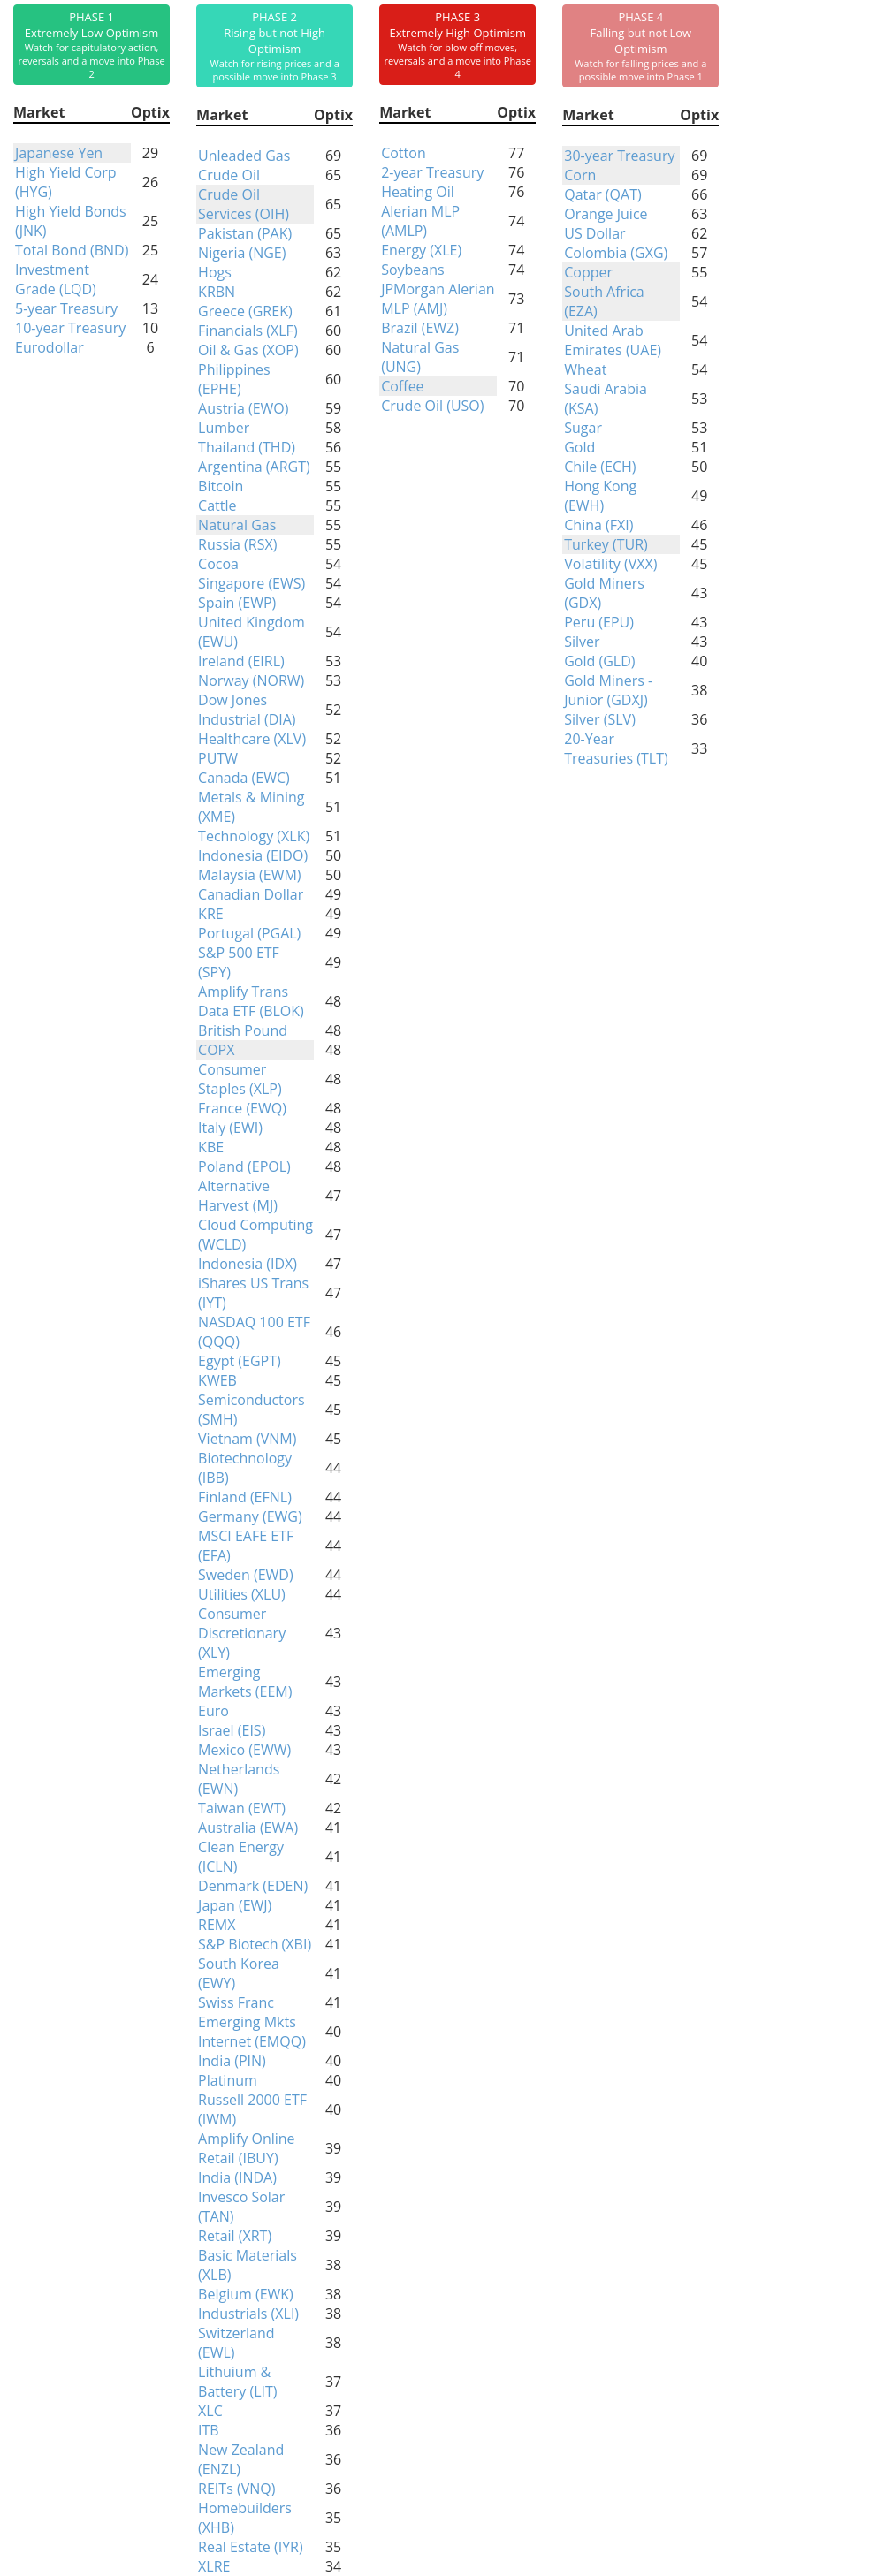
Phase Table
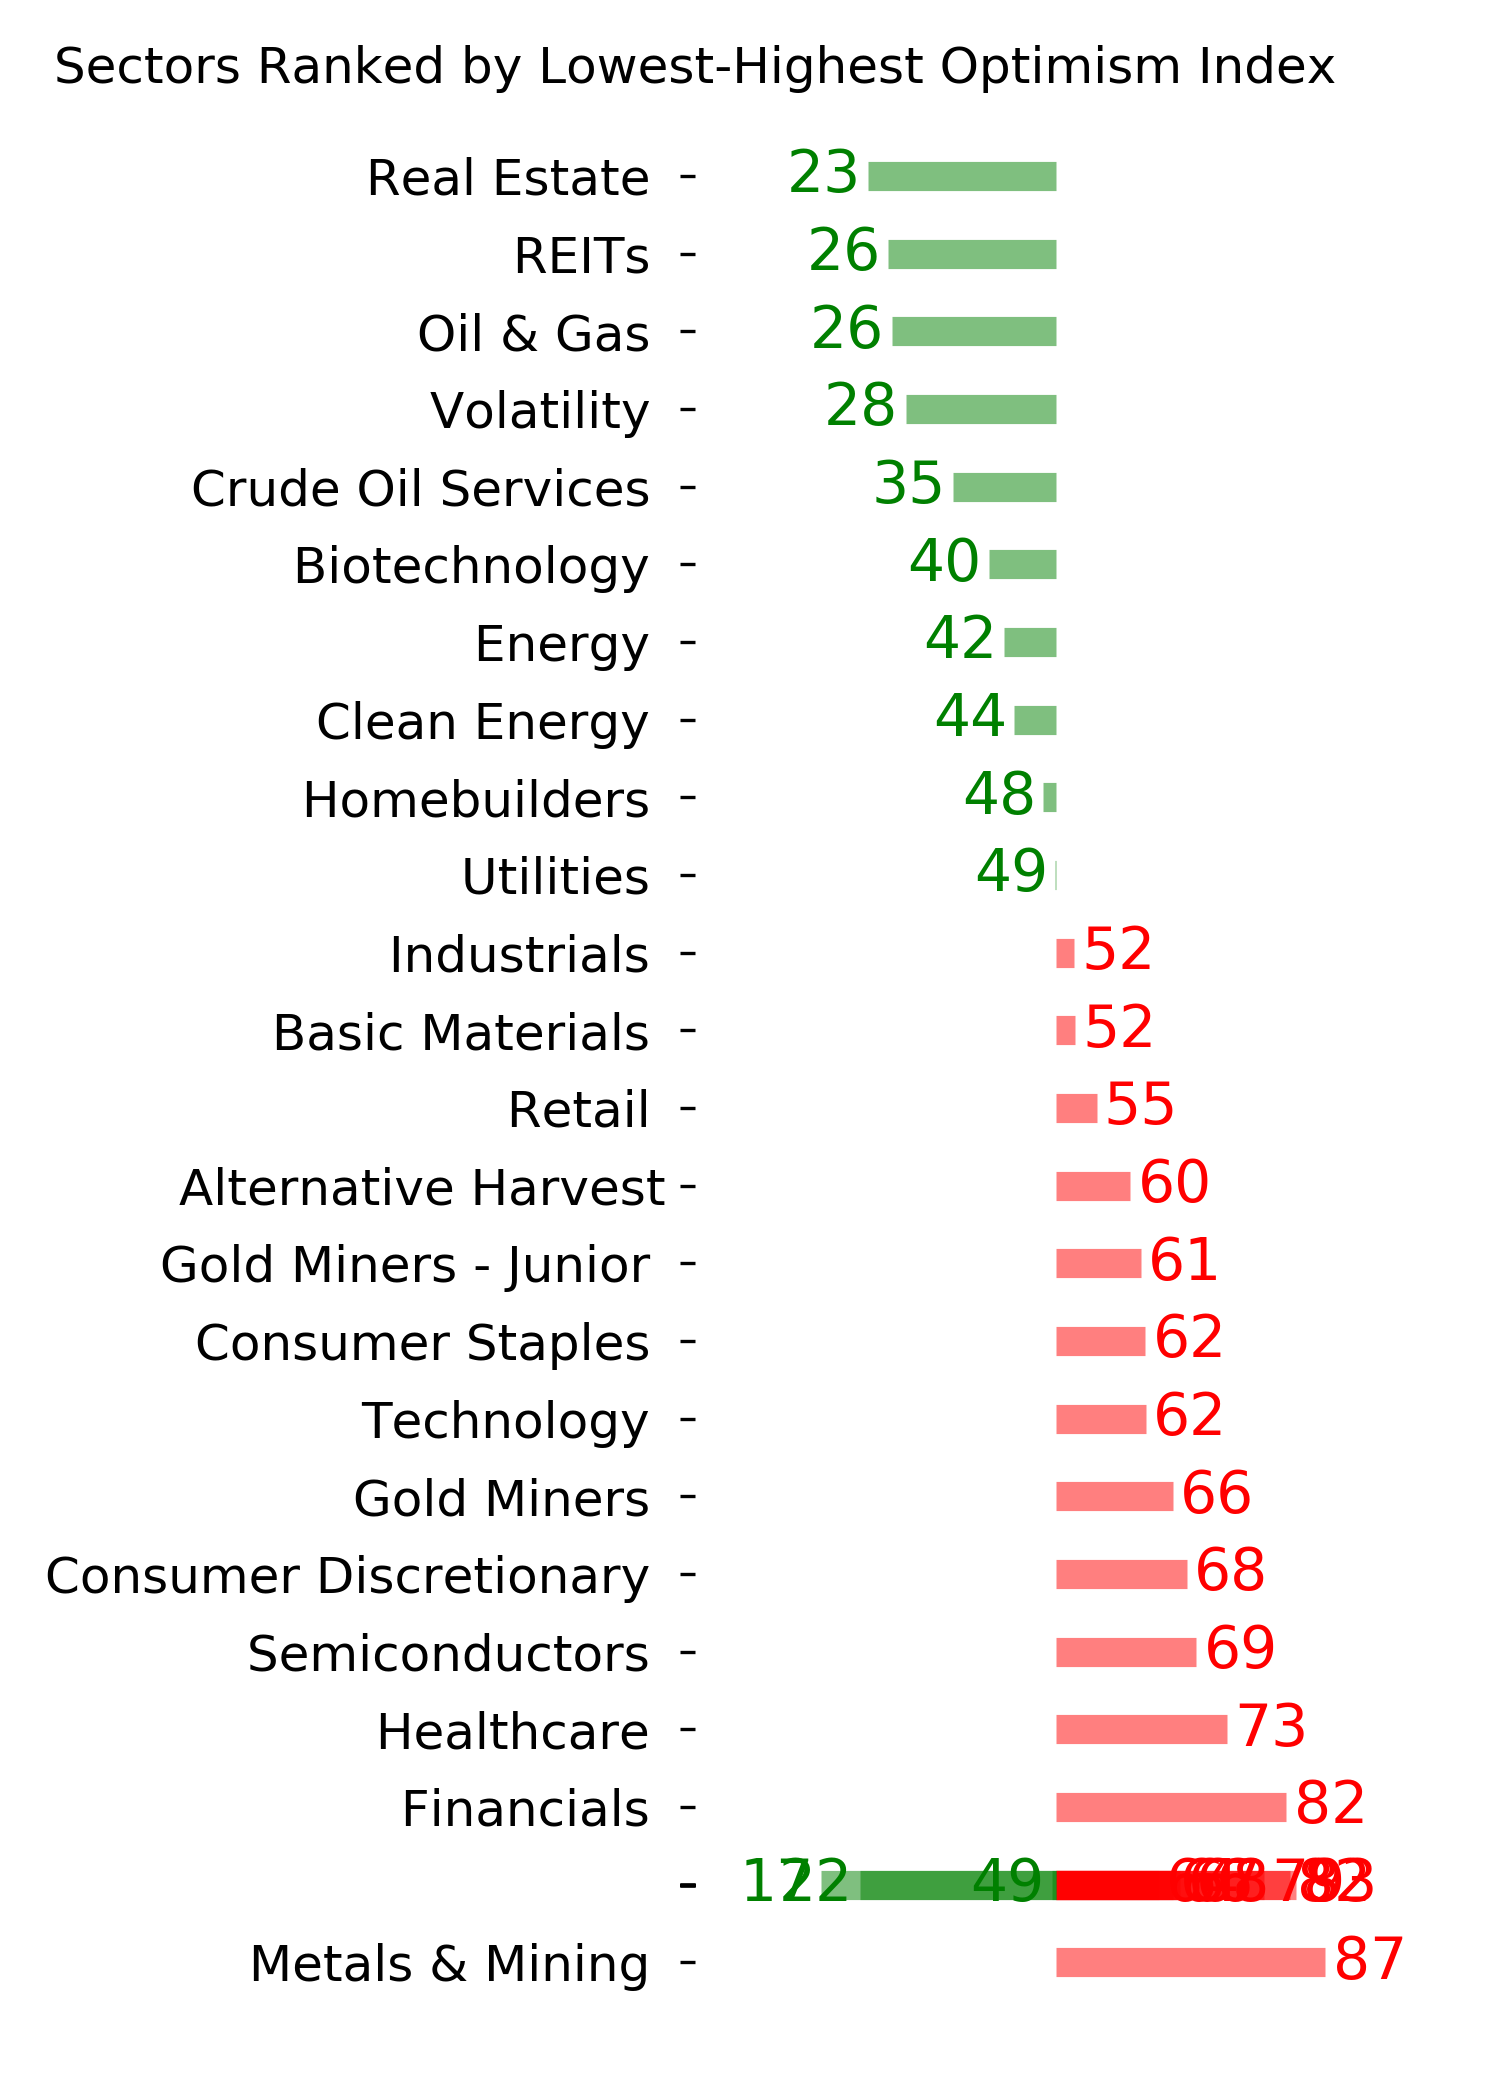
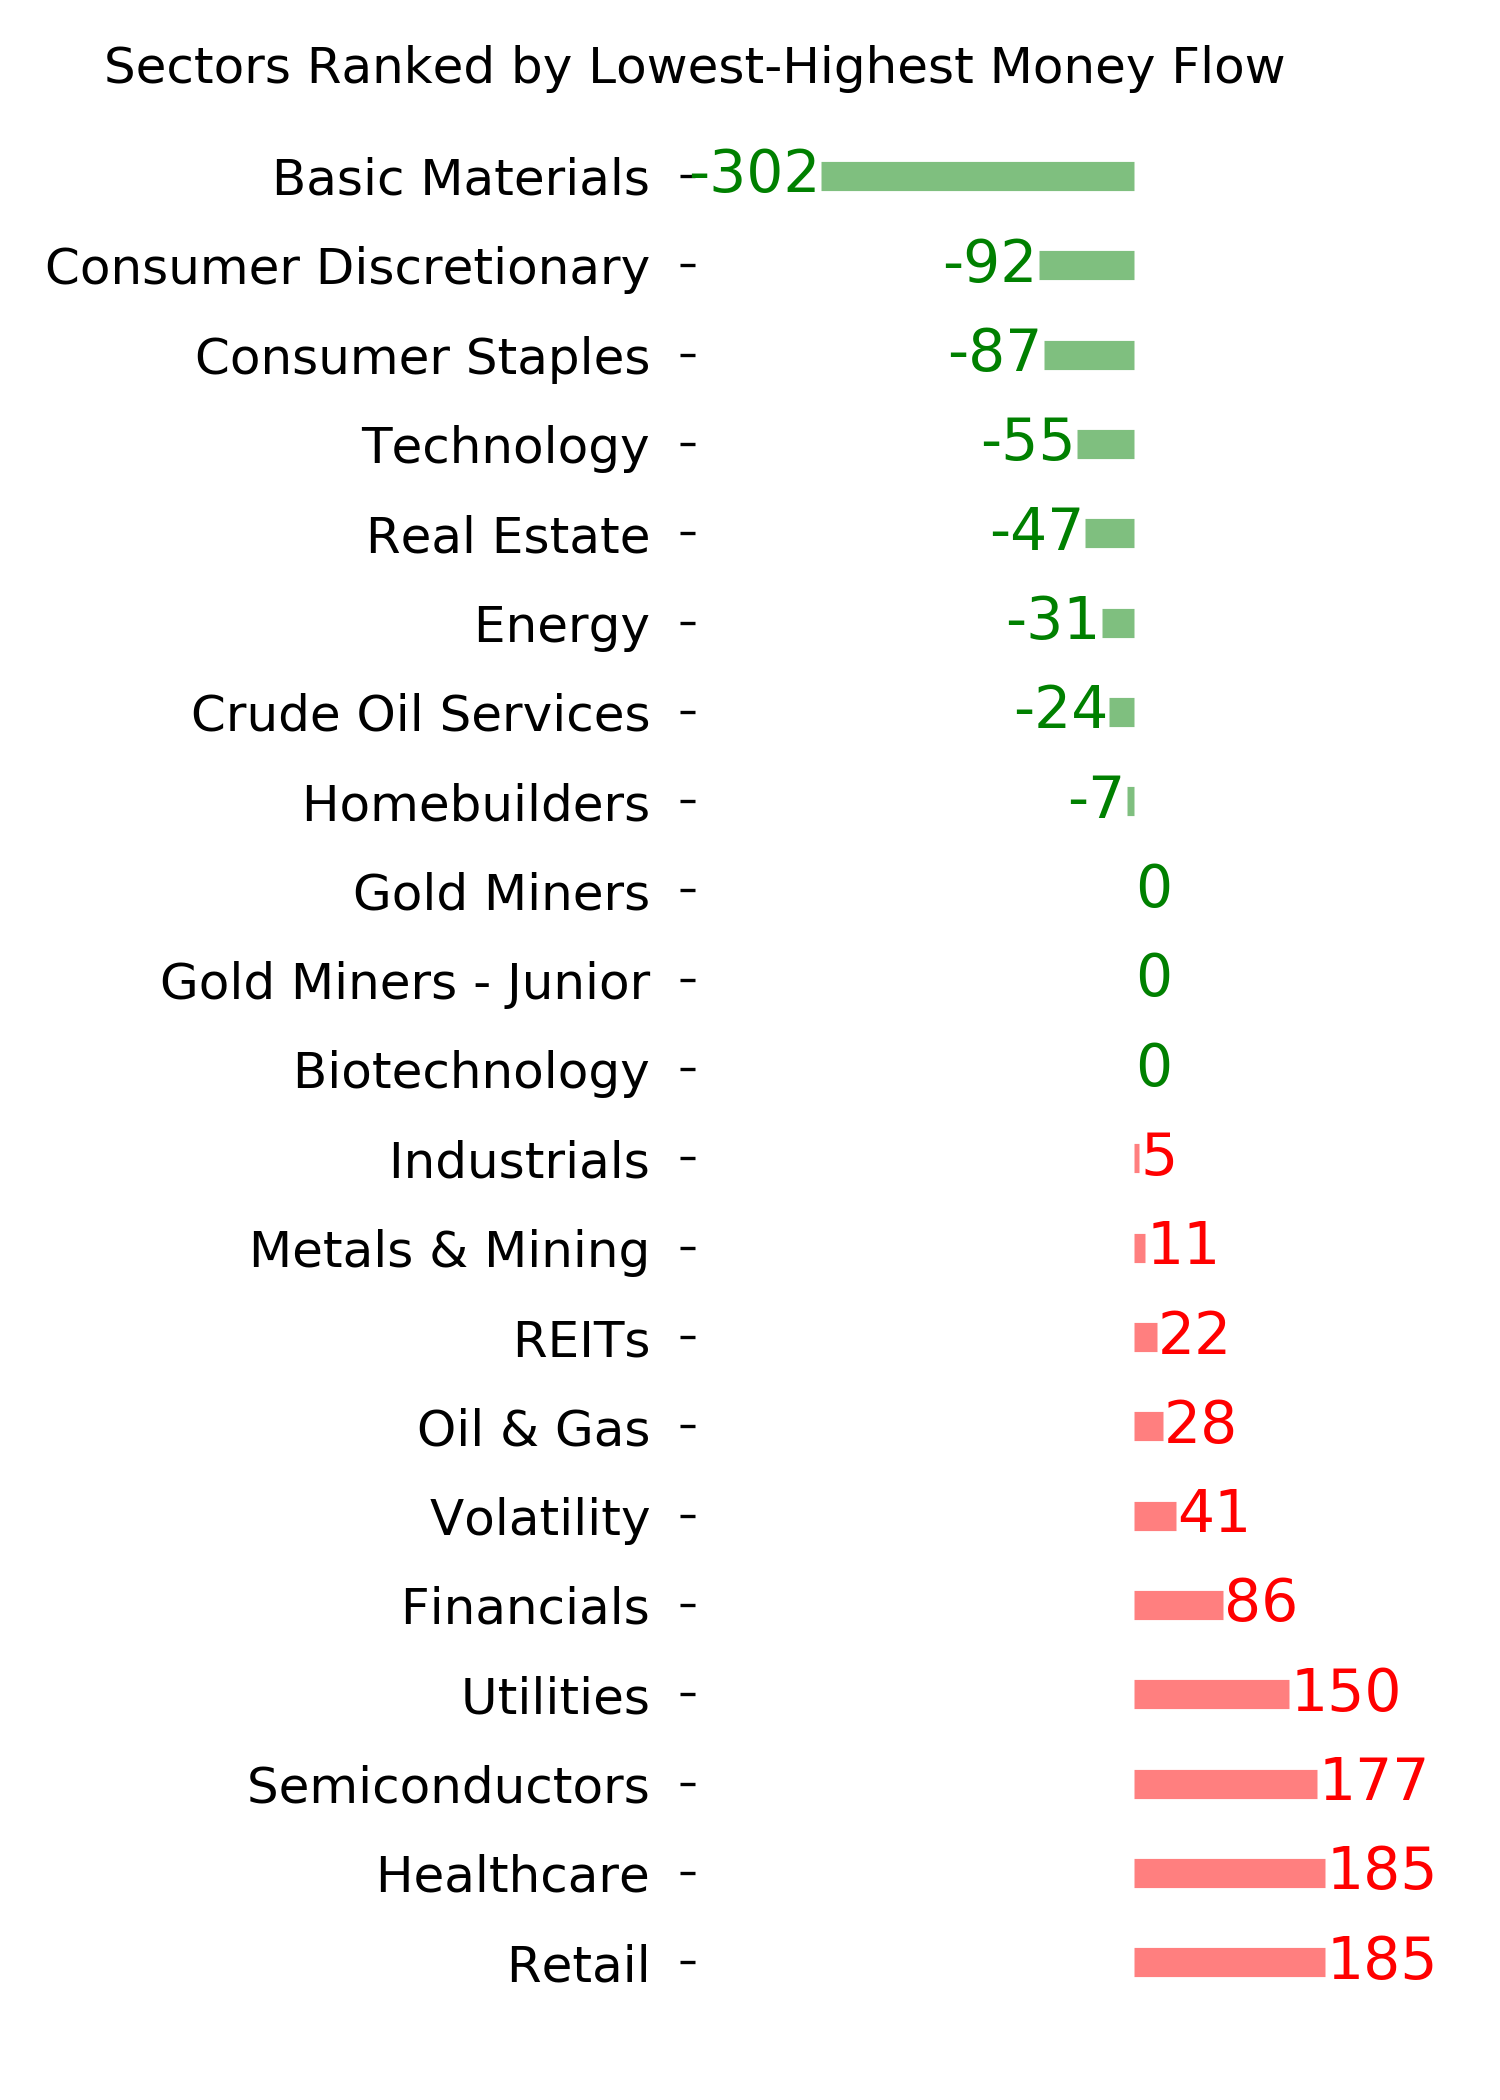
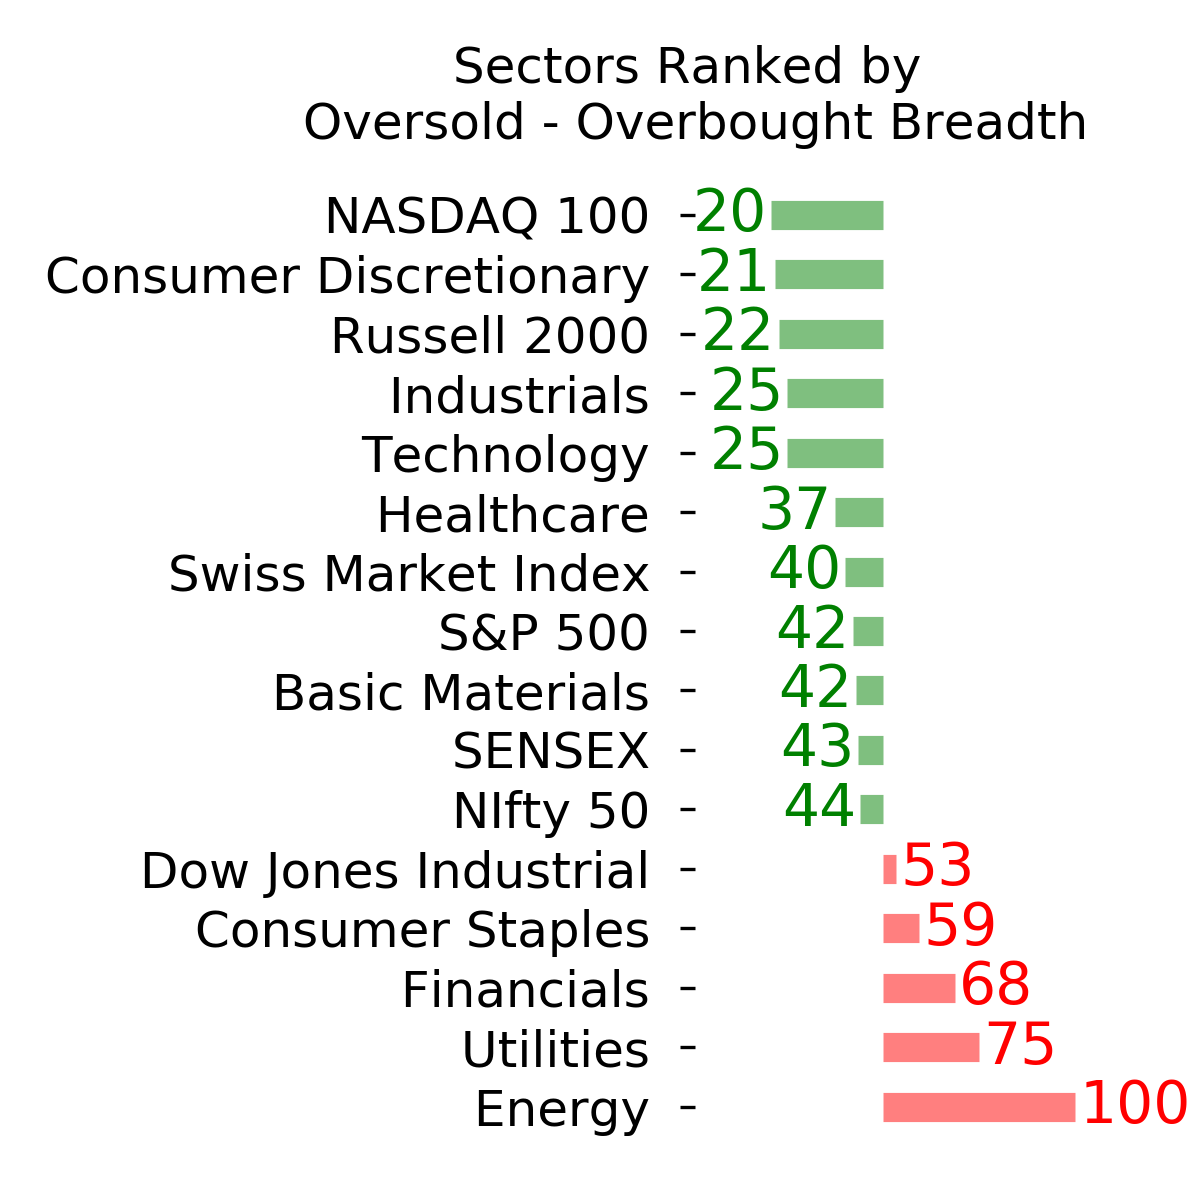
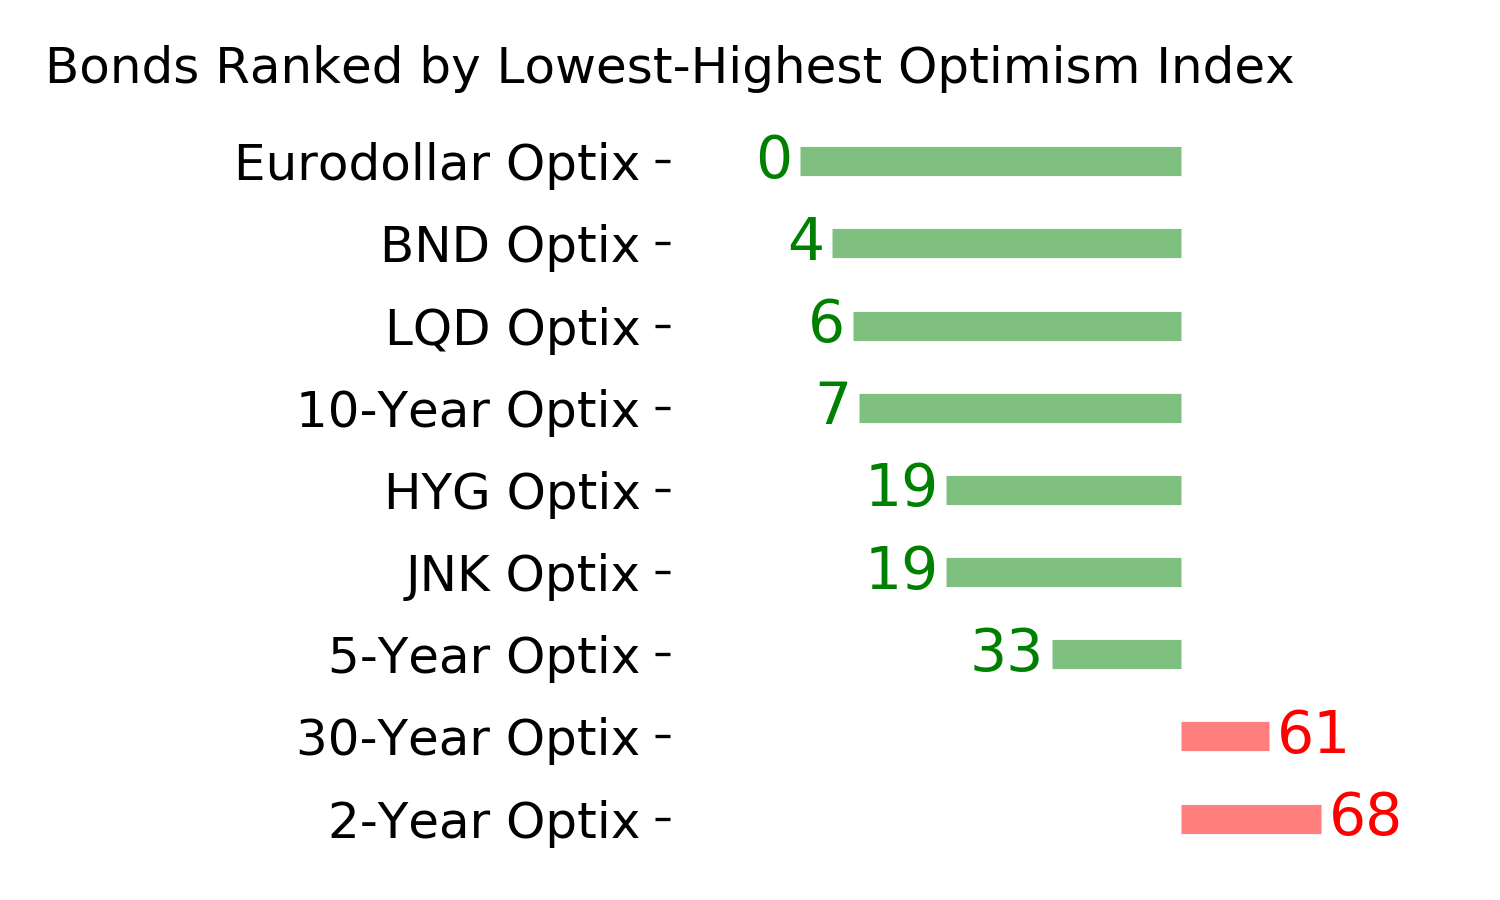
Ranks
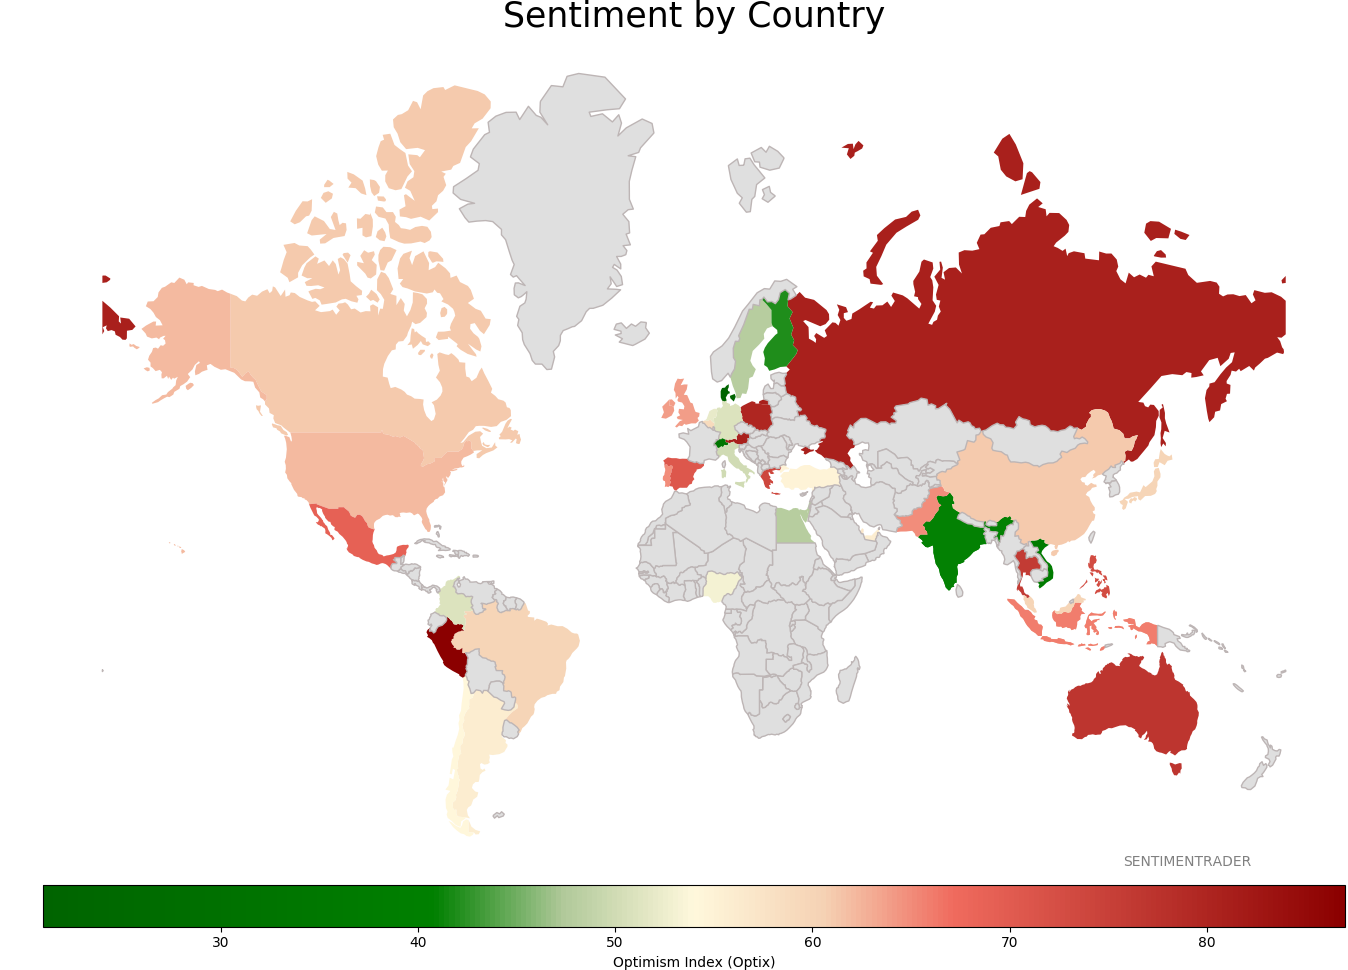
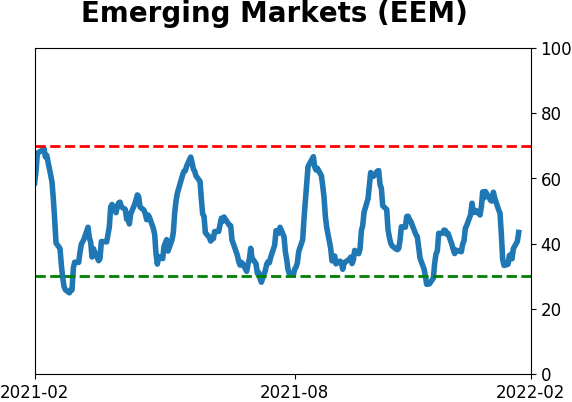
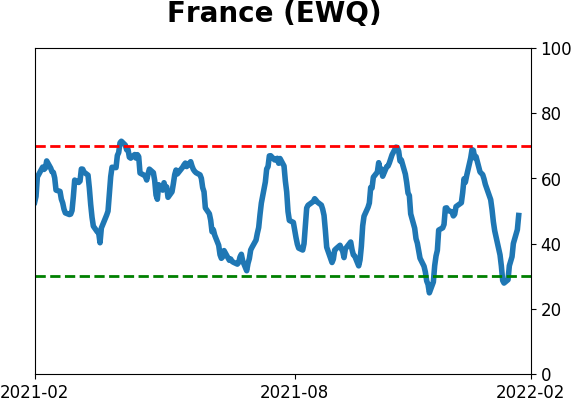
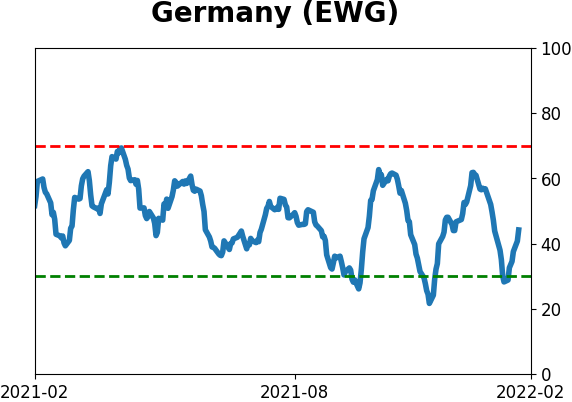
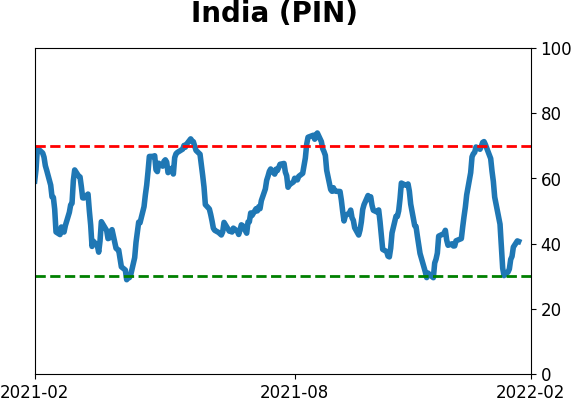
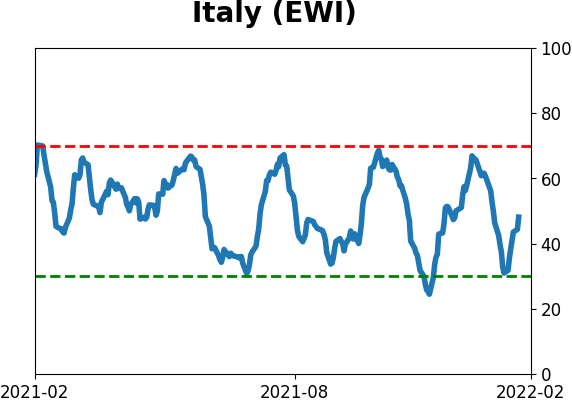
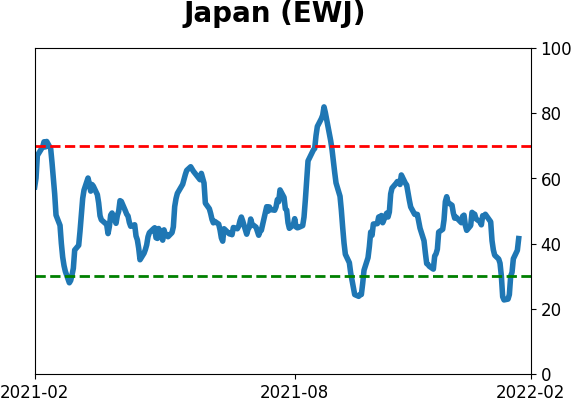
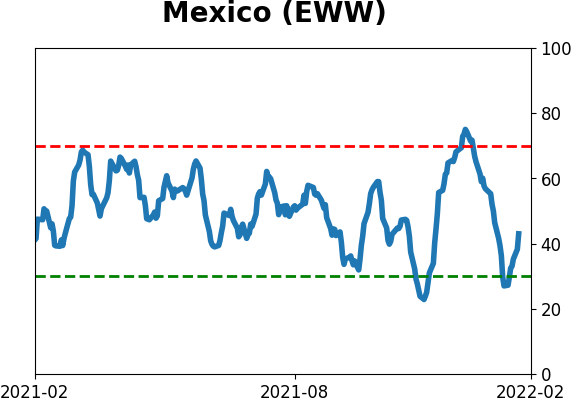
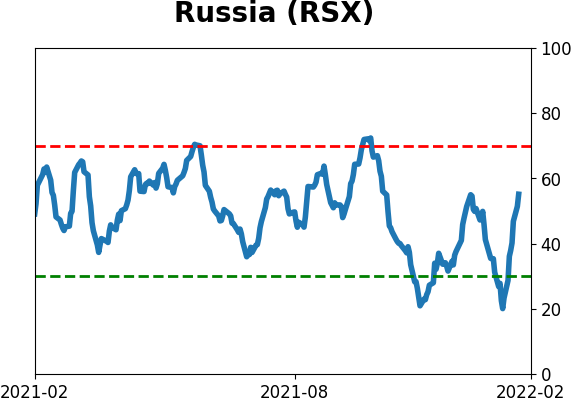
Sentiment Around The World
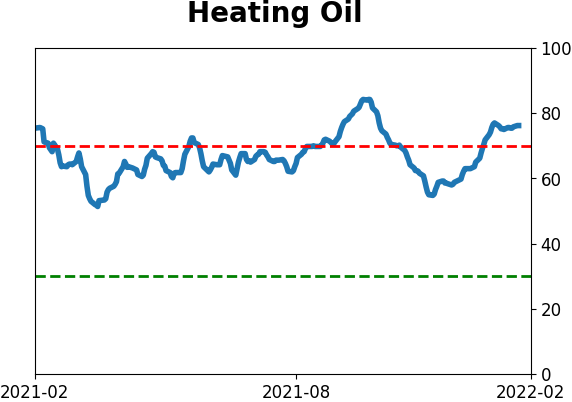
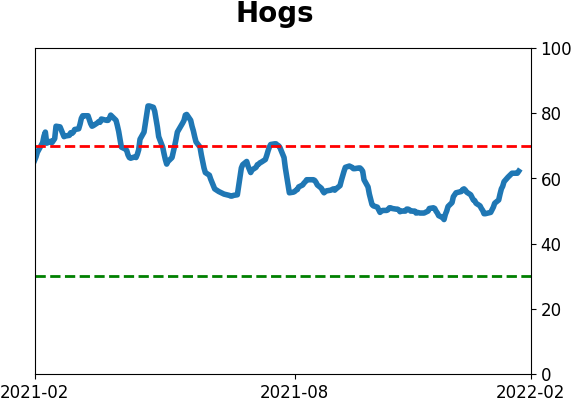
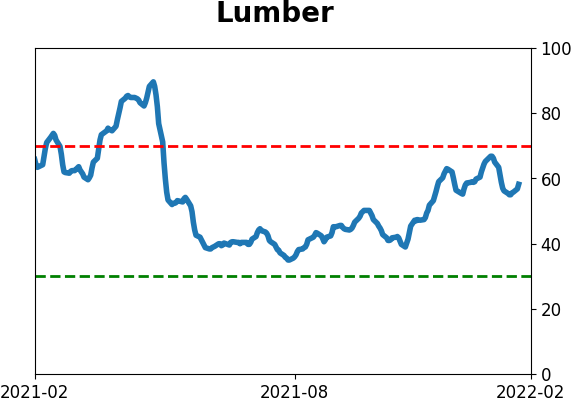
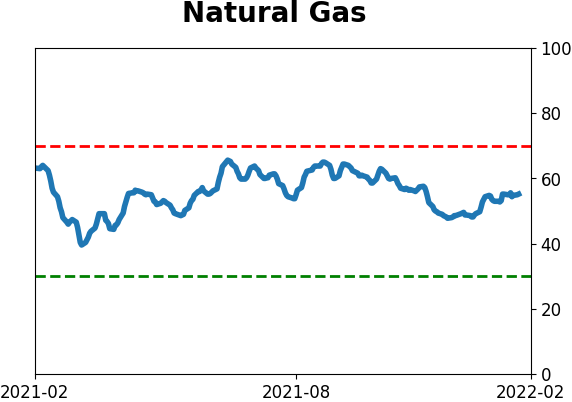
Optimism Index Thumbnails
|
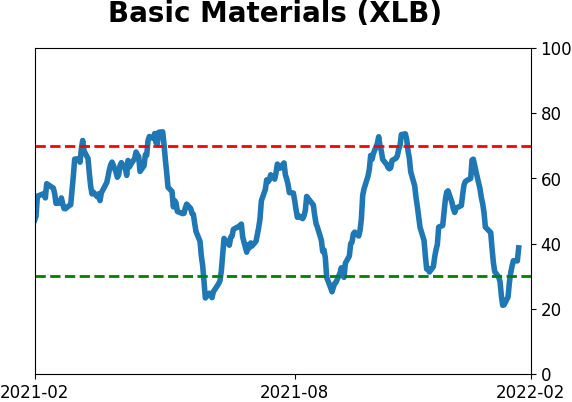
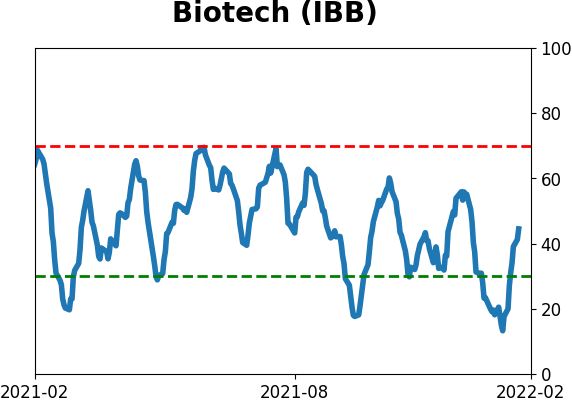
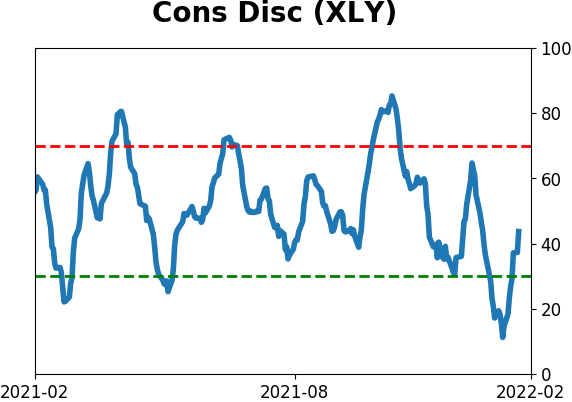
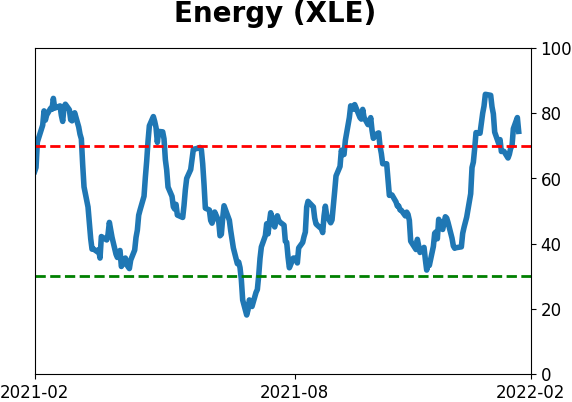
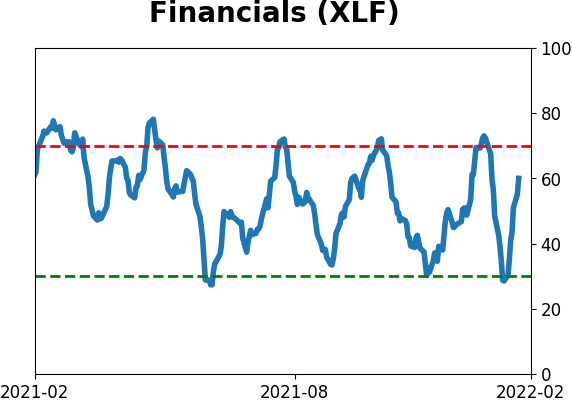
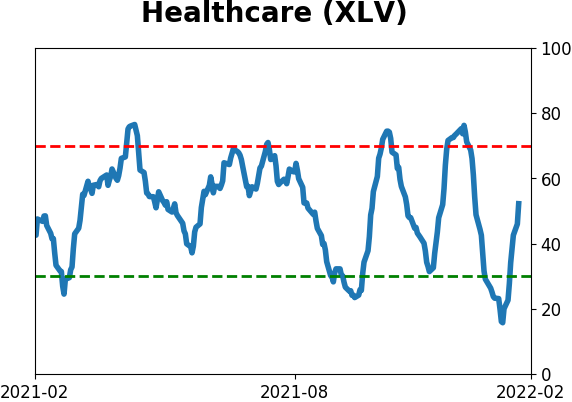
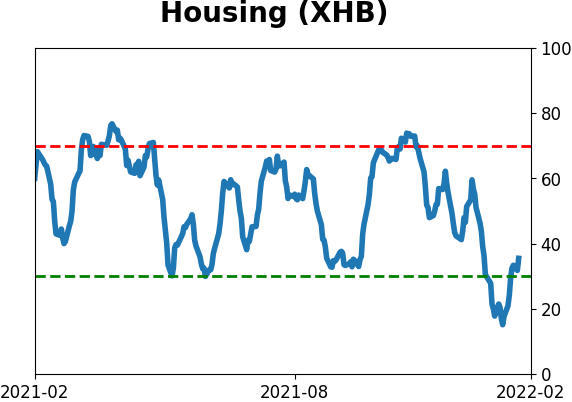
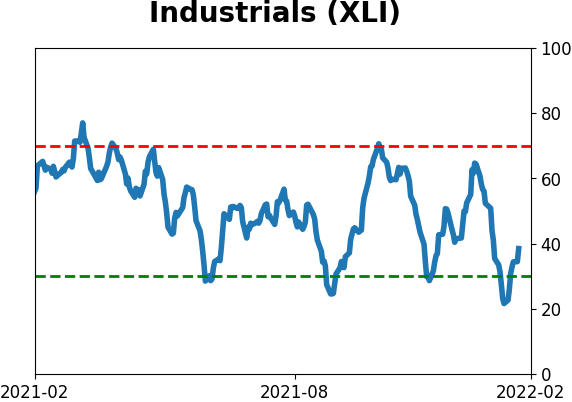
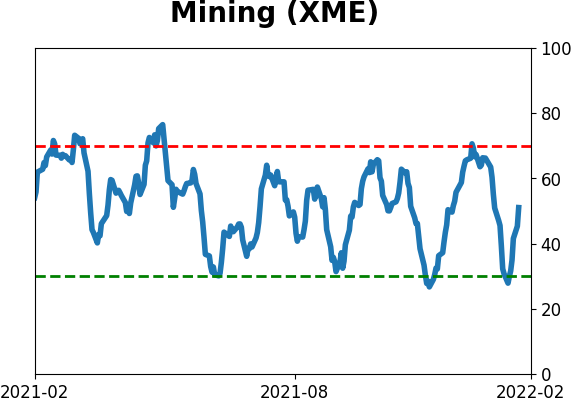
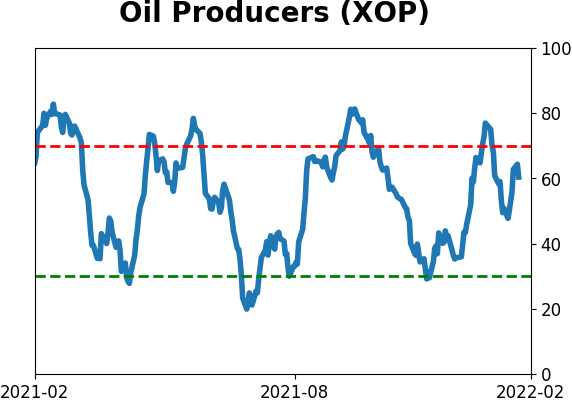
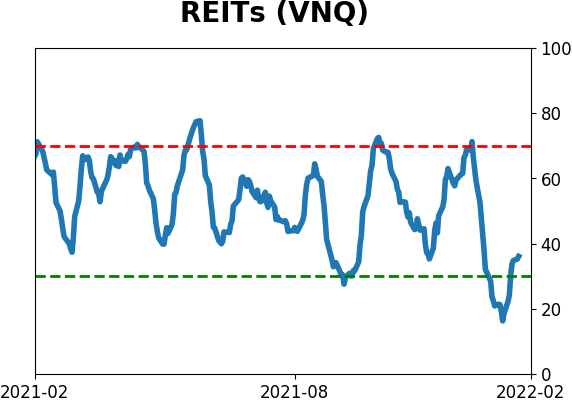
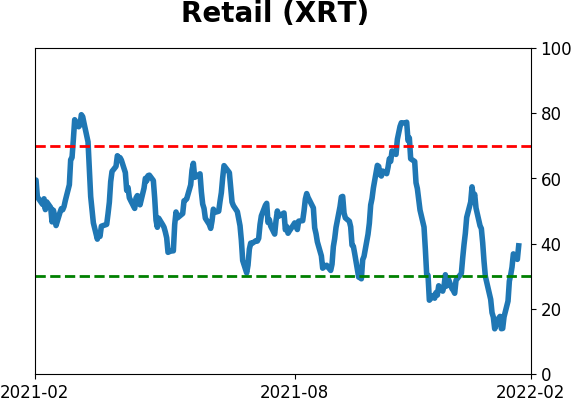
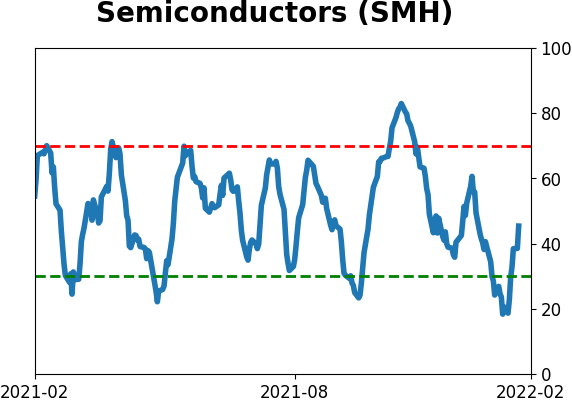
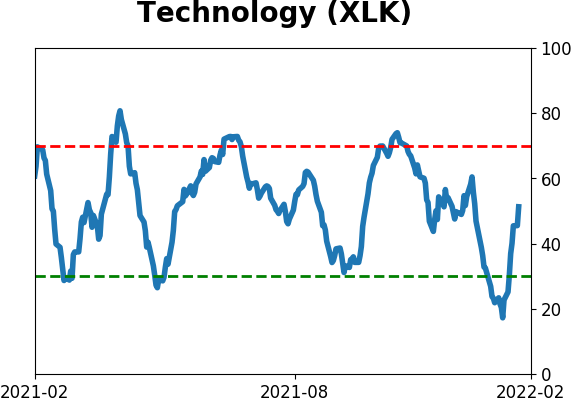
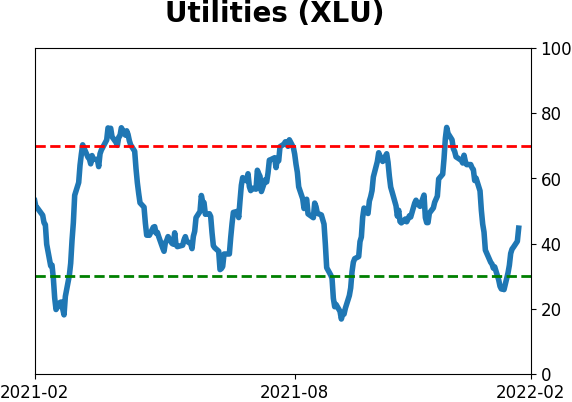
Sector ETF's - 10-Day Moving Average
|
|
|
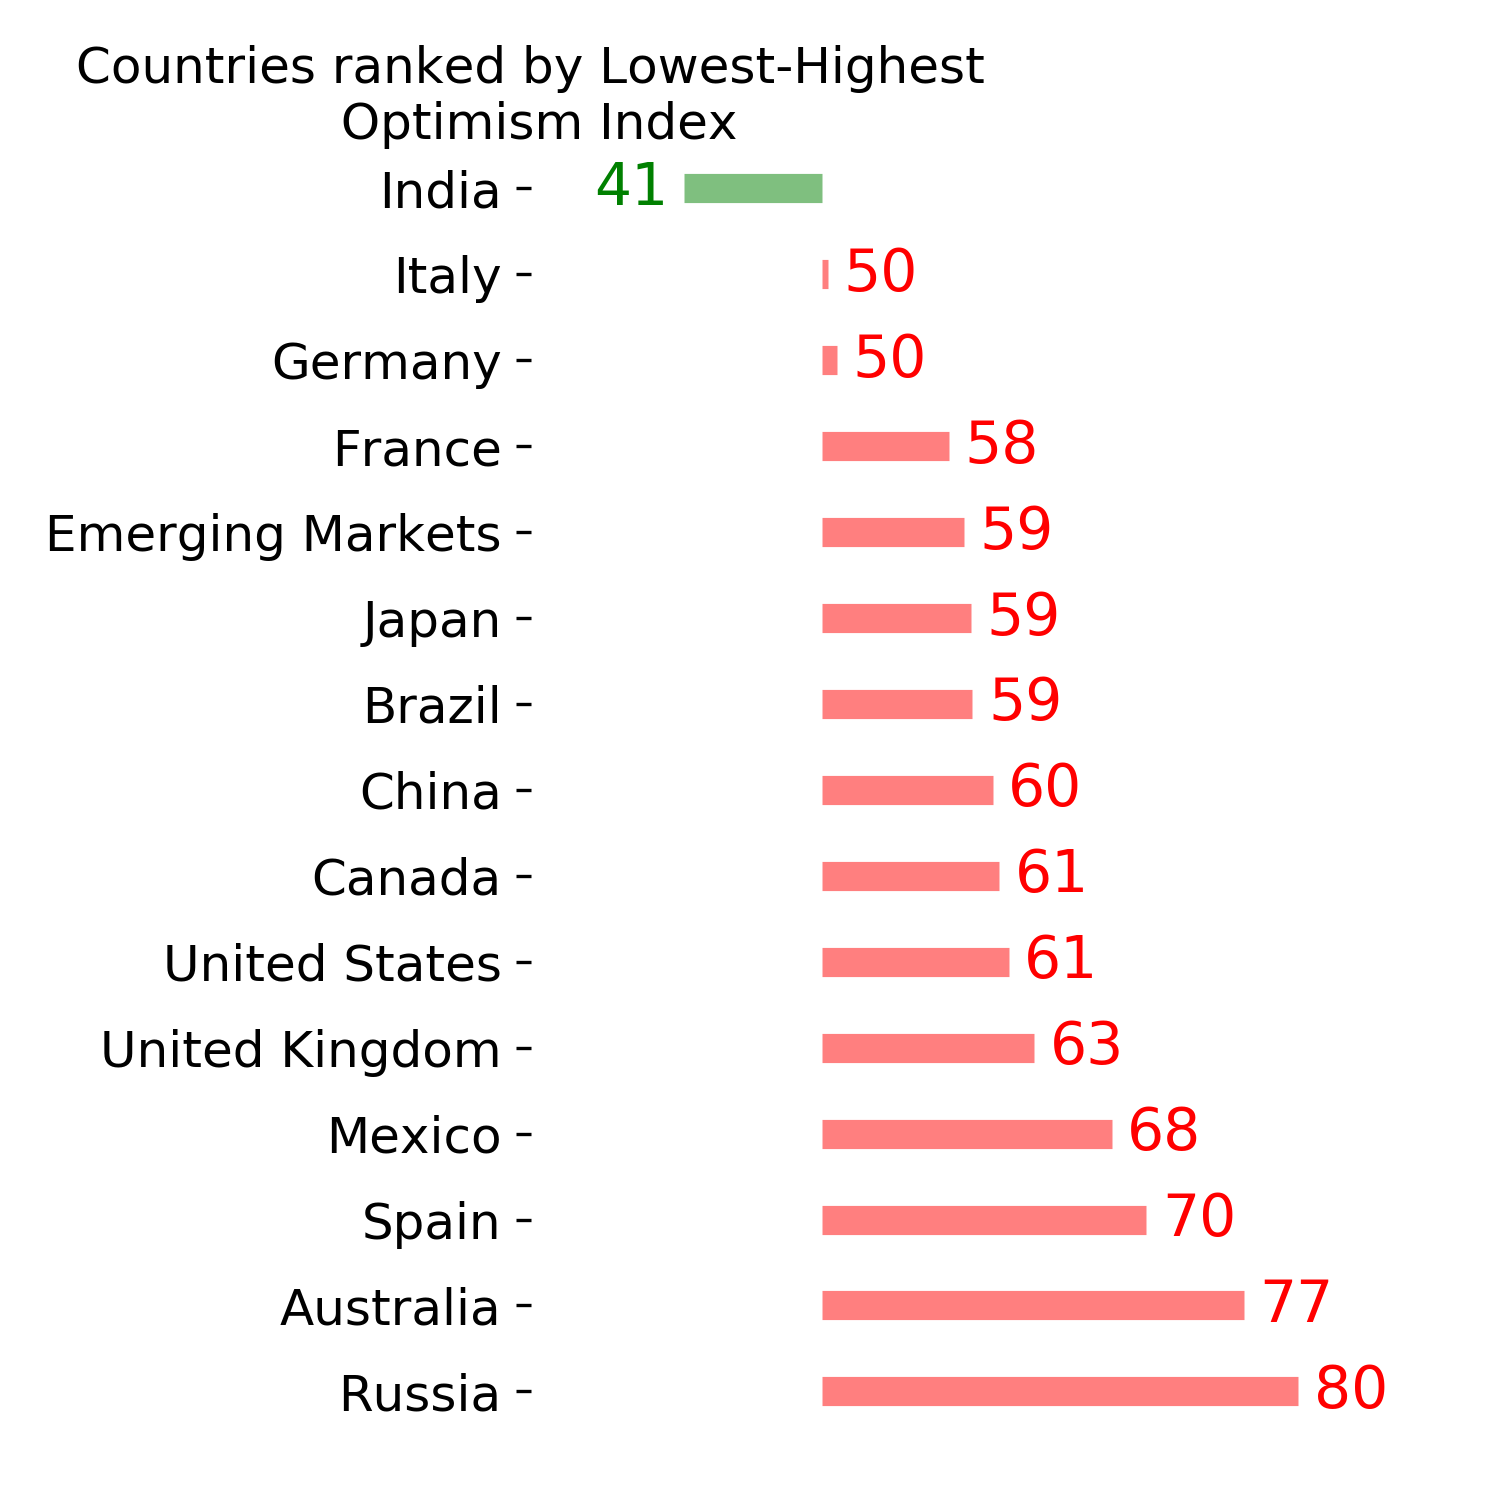
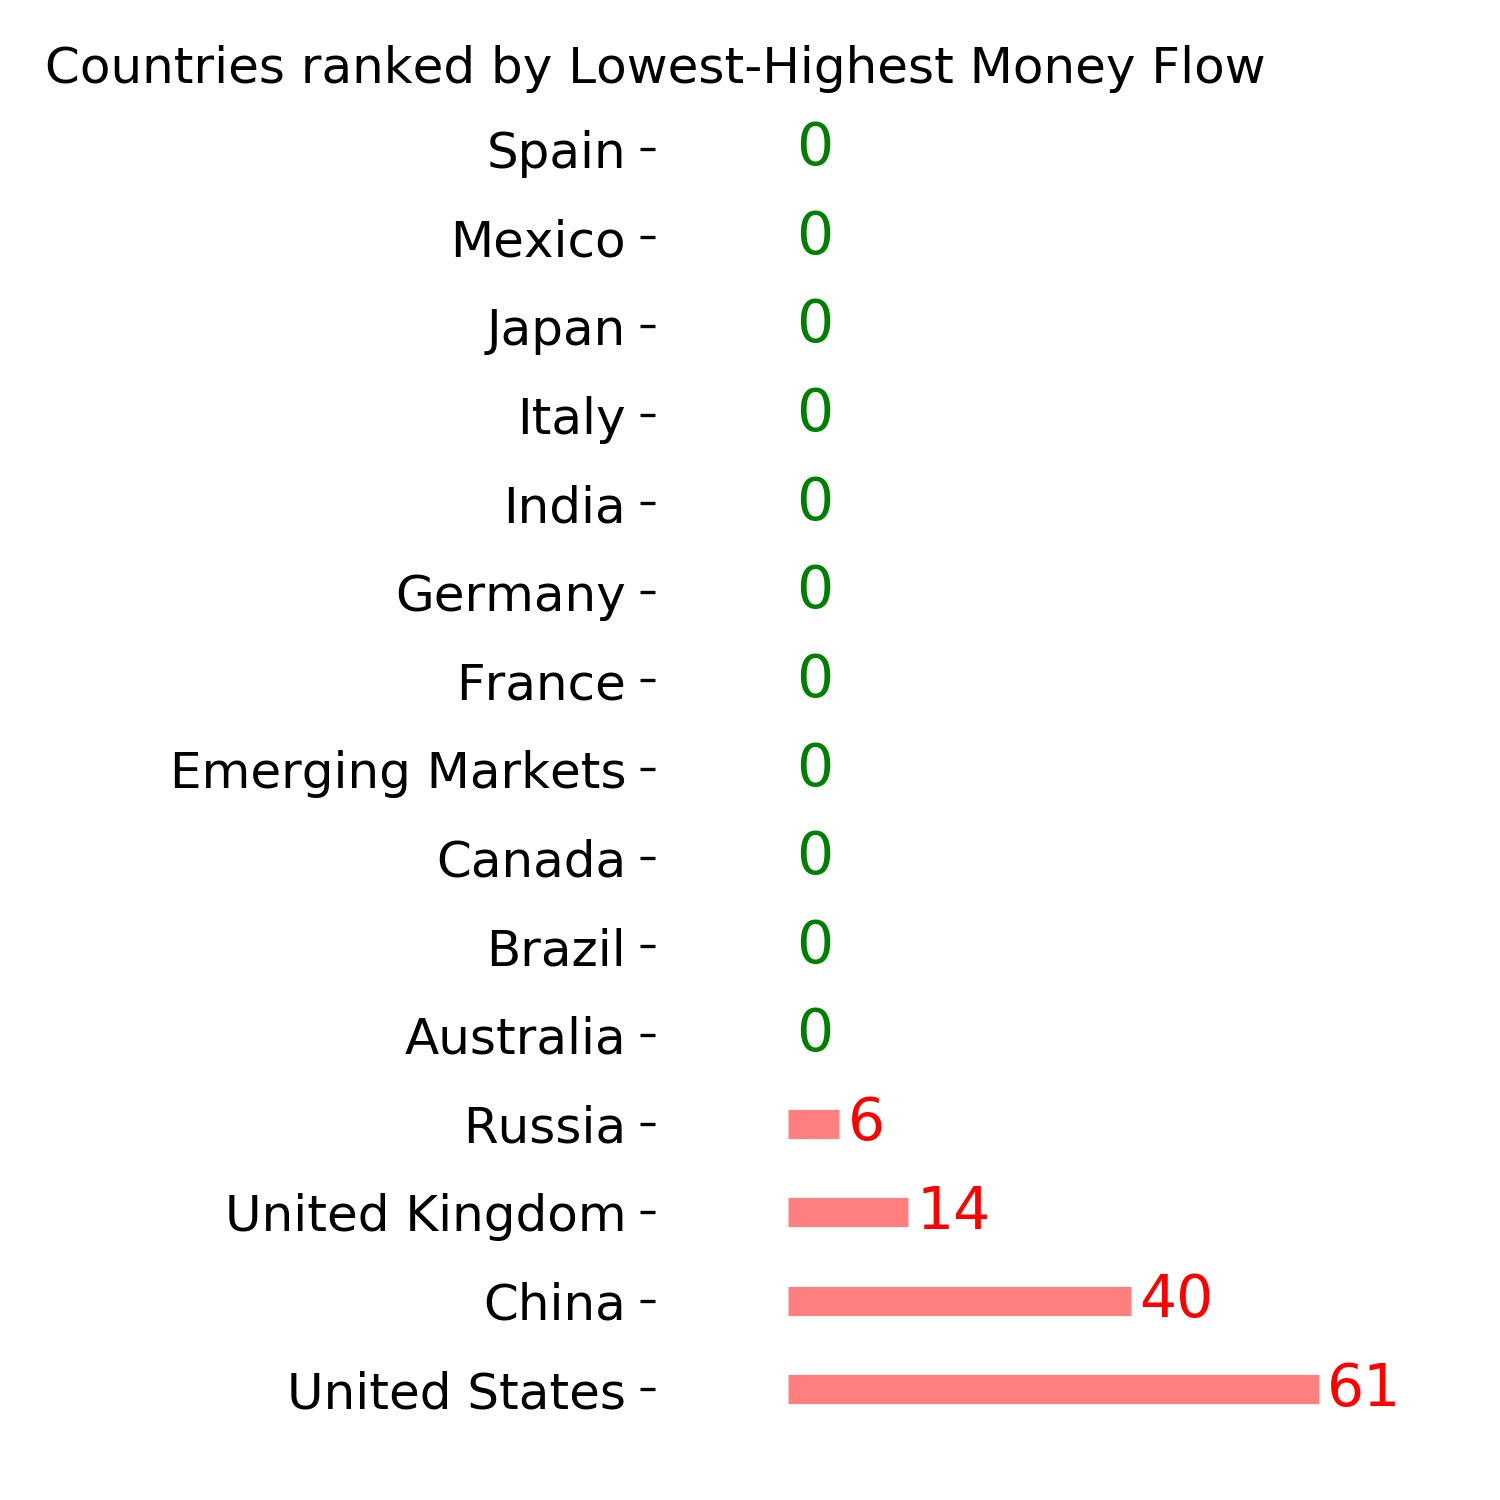
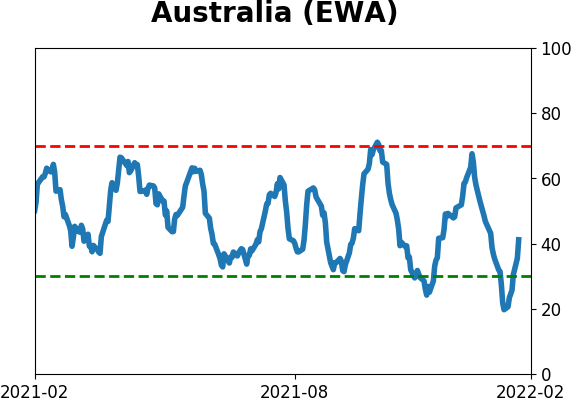
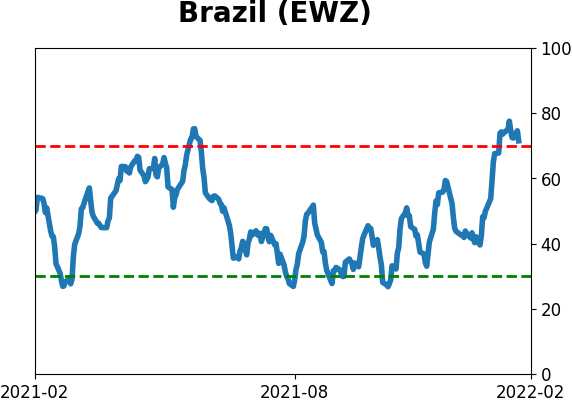
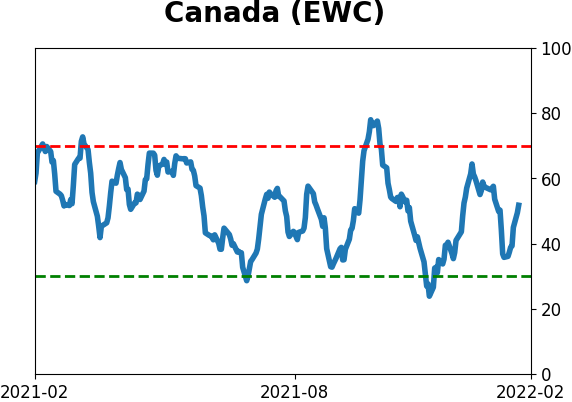
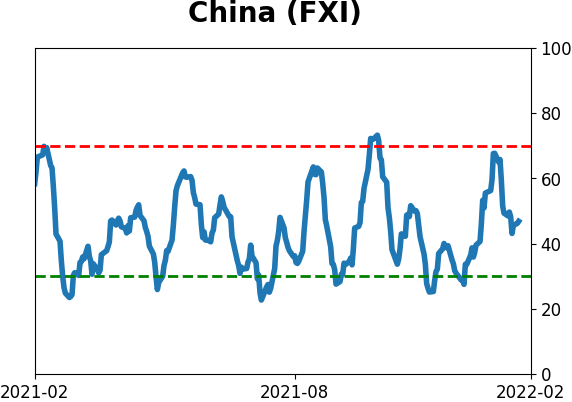
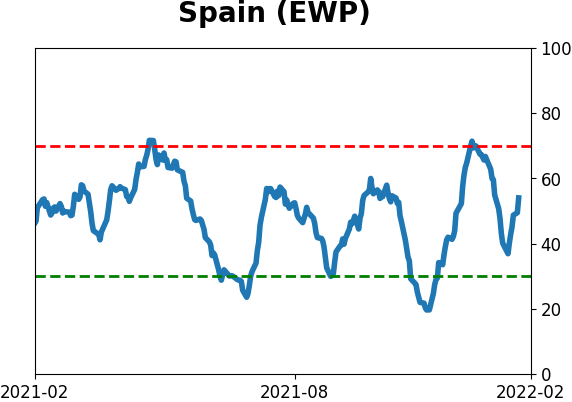
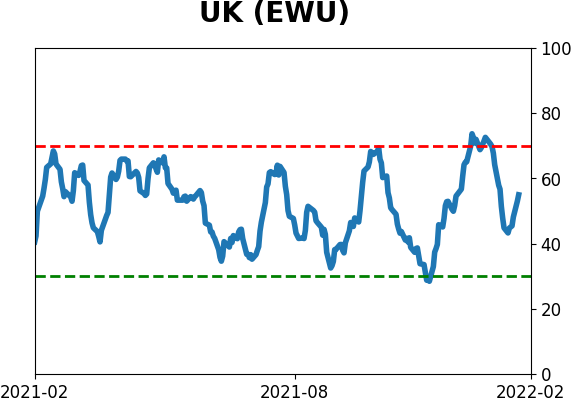
Country ETF's - 10-Day Moving Average
|
|
|
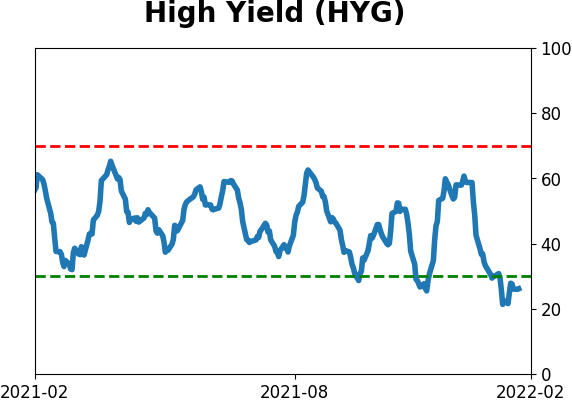
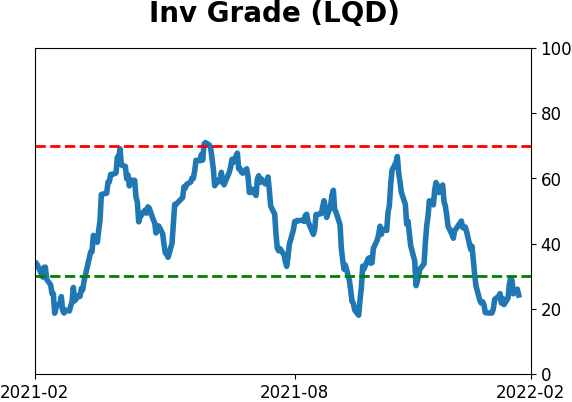
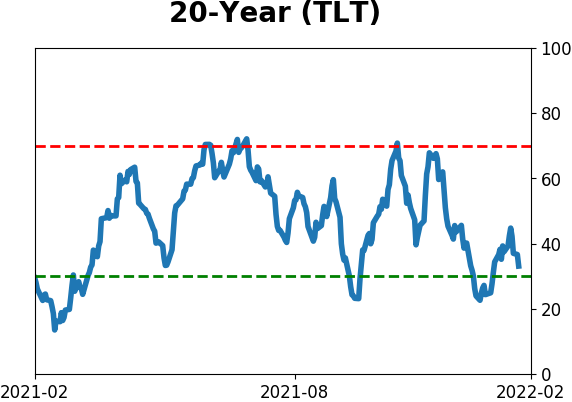
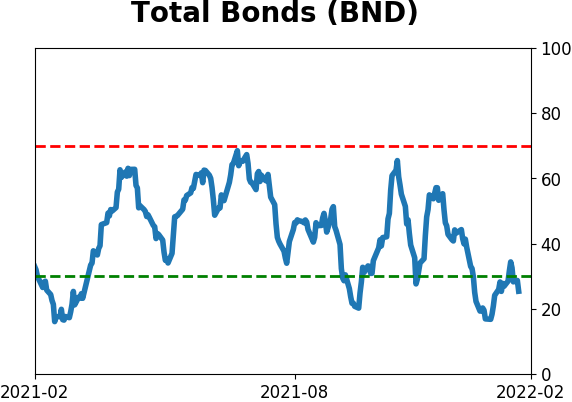
Bond ETF's - 10-Day Moving Average
|
|
|
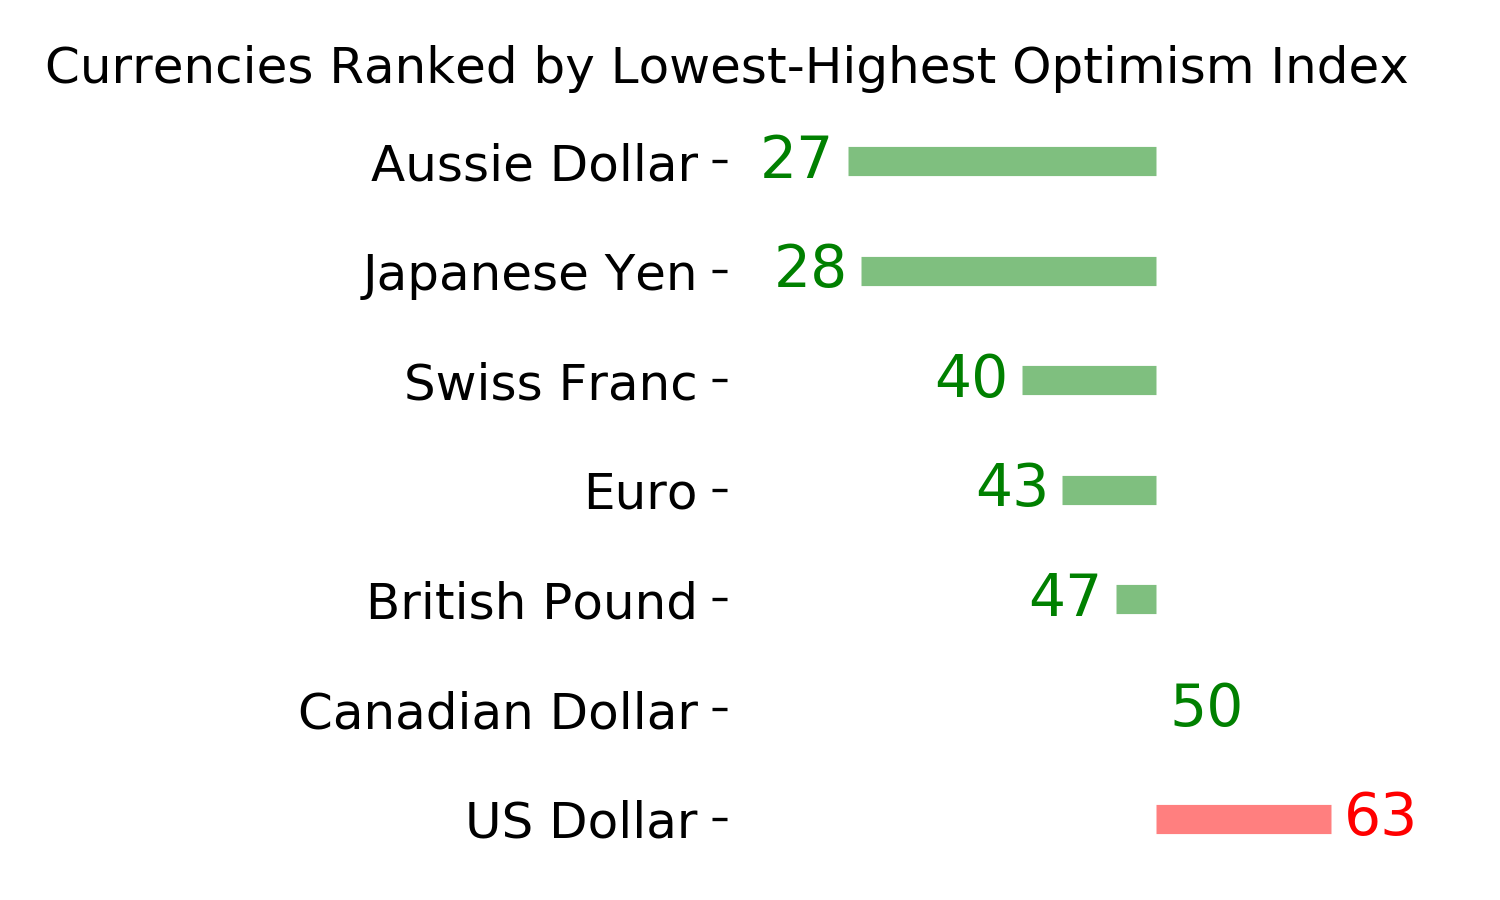
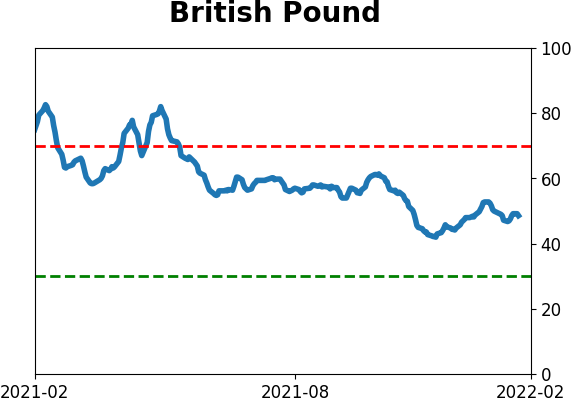
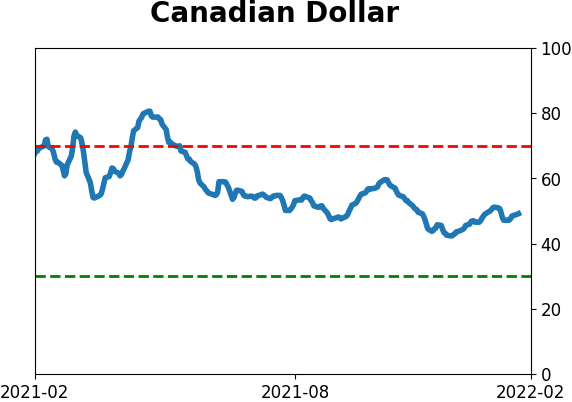
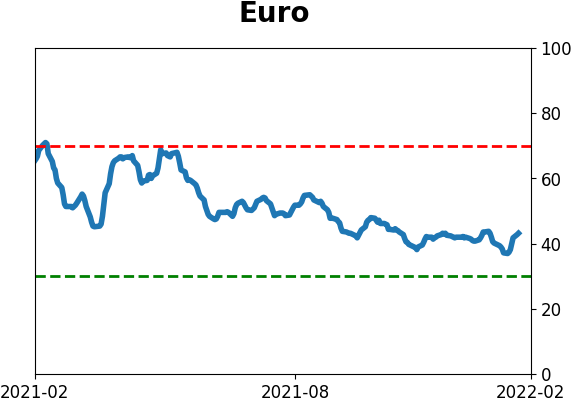
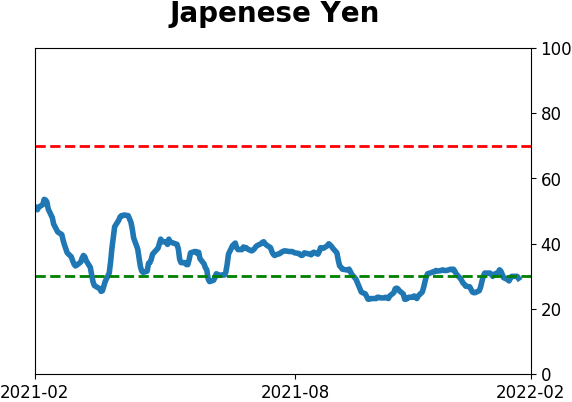
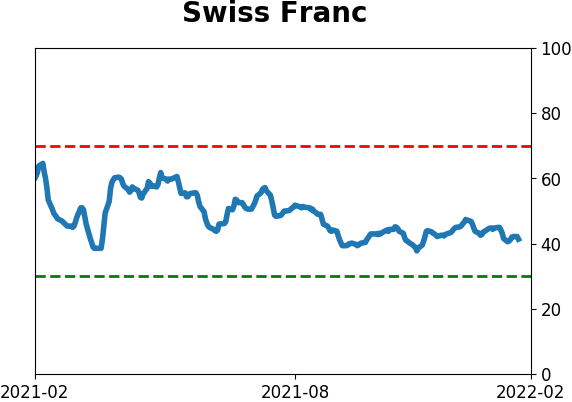
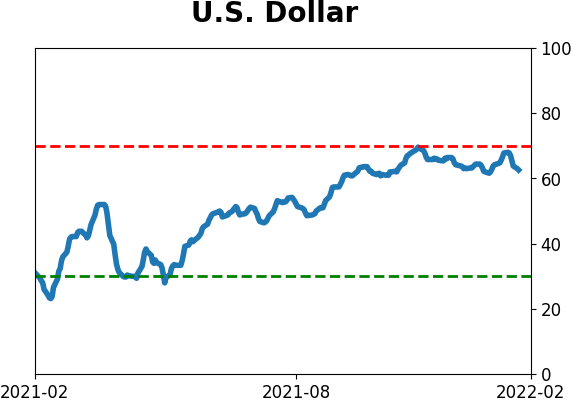
Currency ETF's - 5-Day Moving Average
|
|
|
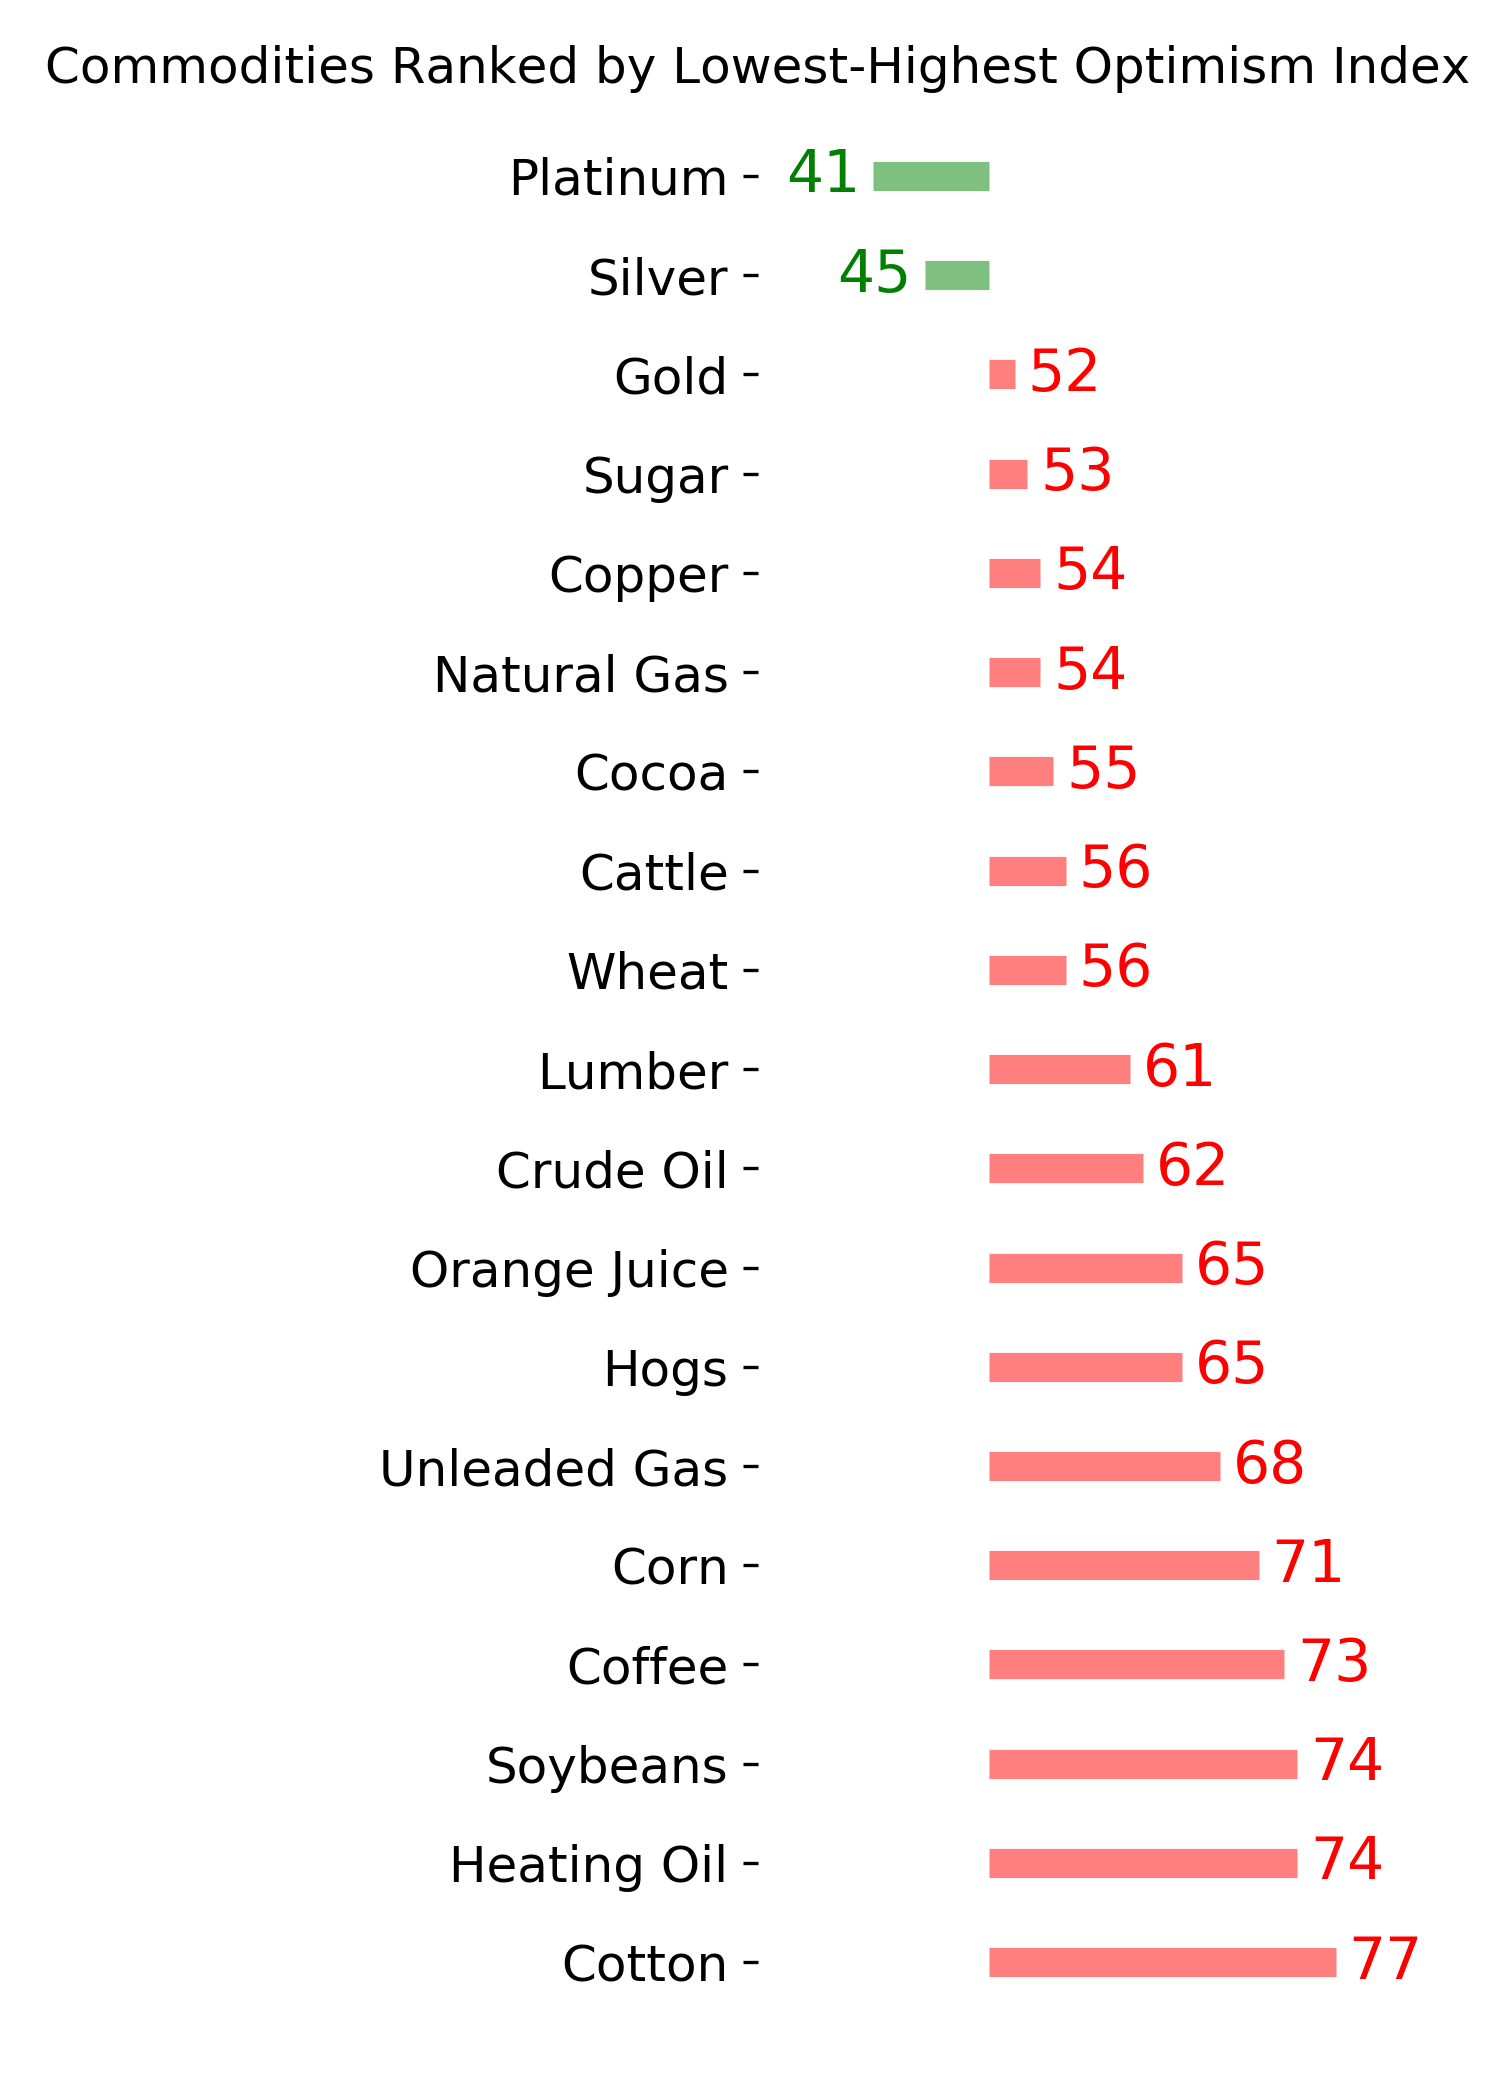
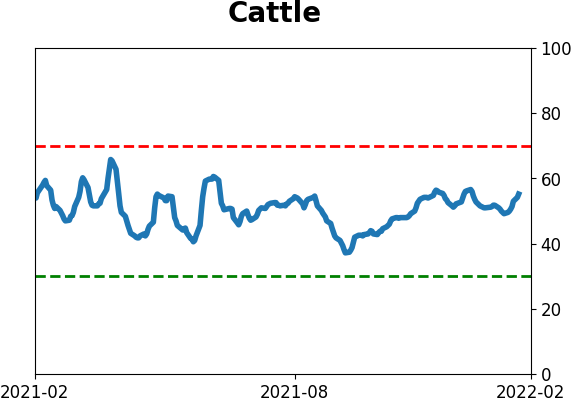
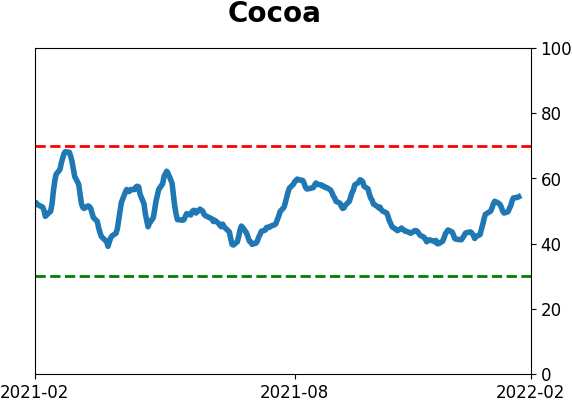
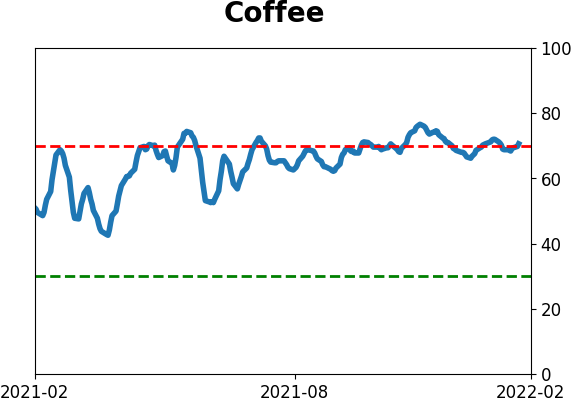
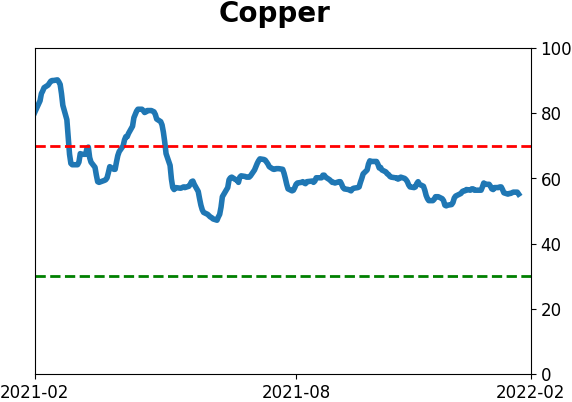
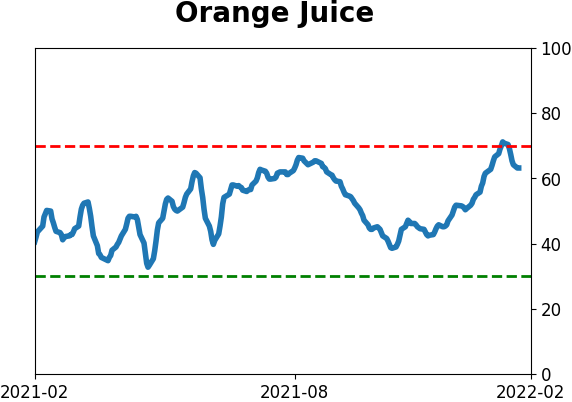
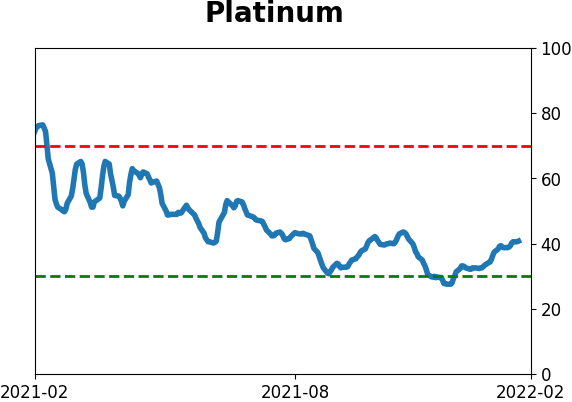
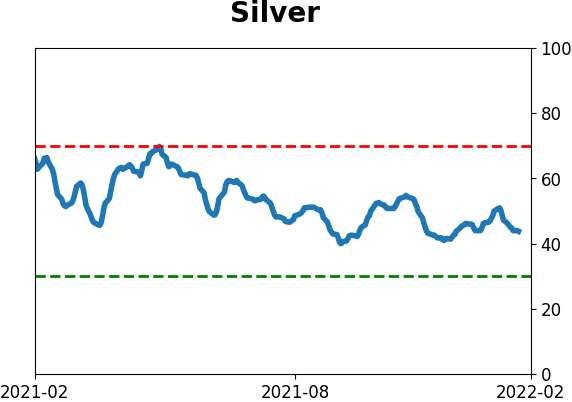
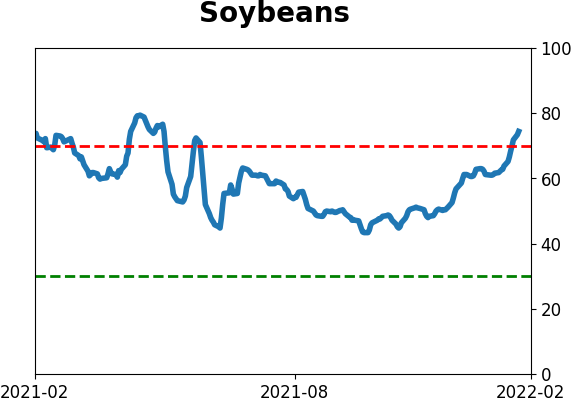
Commodity ETF's - 5-Day Moving Average
|
|