Headlines
|
|
Most technical warnings since 2021 as S&P stocks lose their uptrends:
Over the past three weeks, technical warning signs have been triggering on the Nasdaq exchange. The Hindenburg Omen and Titanic Syndrome have triggered the most since December 2021. Historically, these many warnings have preceded poor returns. Within the S&P 500, fewer stocks are holding above their moving averages, another warning.
|
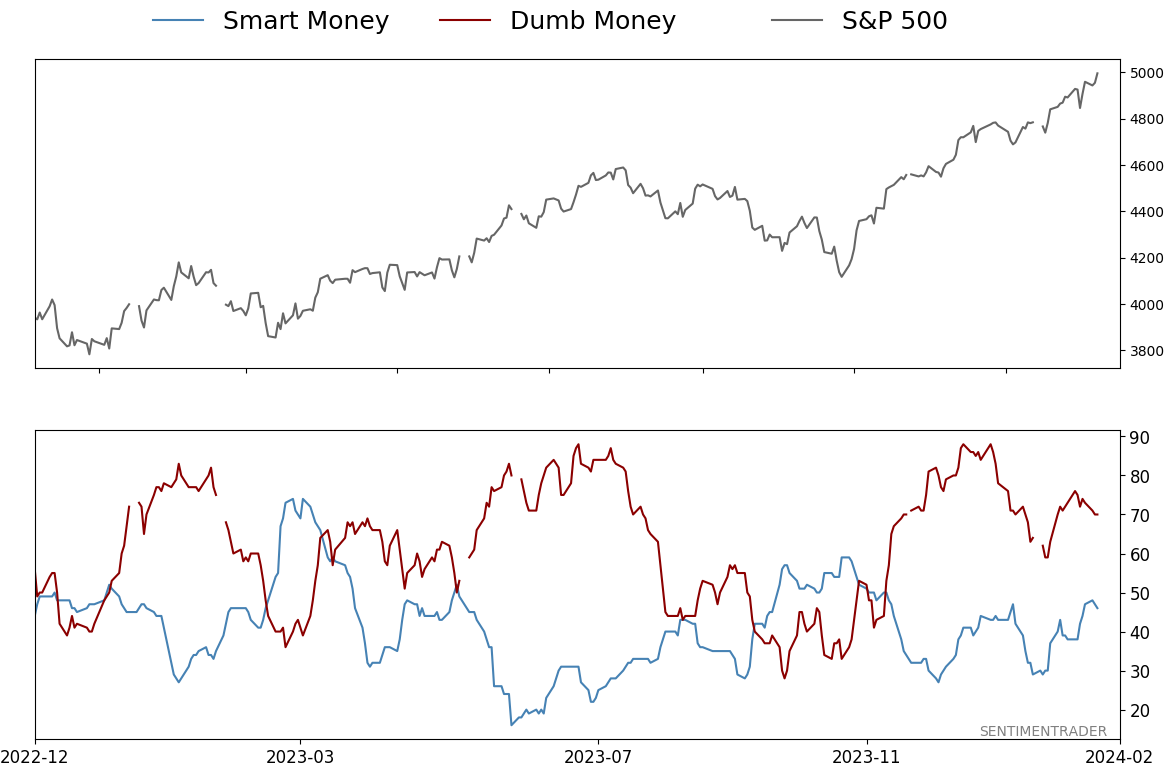
Smart / Dumb Money Confidence
|
Smart Money Confidence: 46%
Dumb Money Confidence: 70%
|
|
Risk Levels
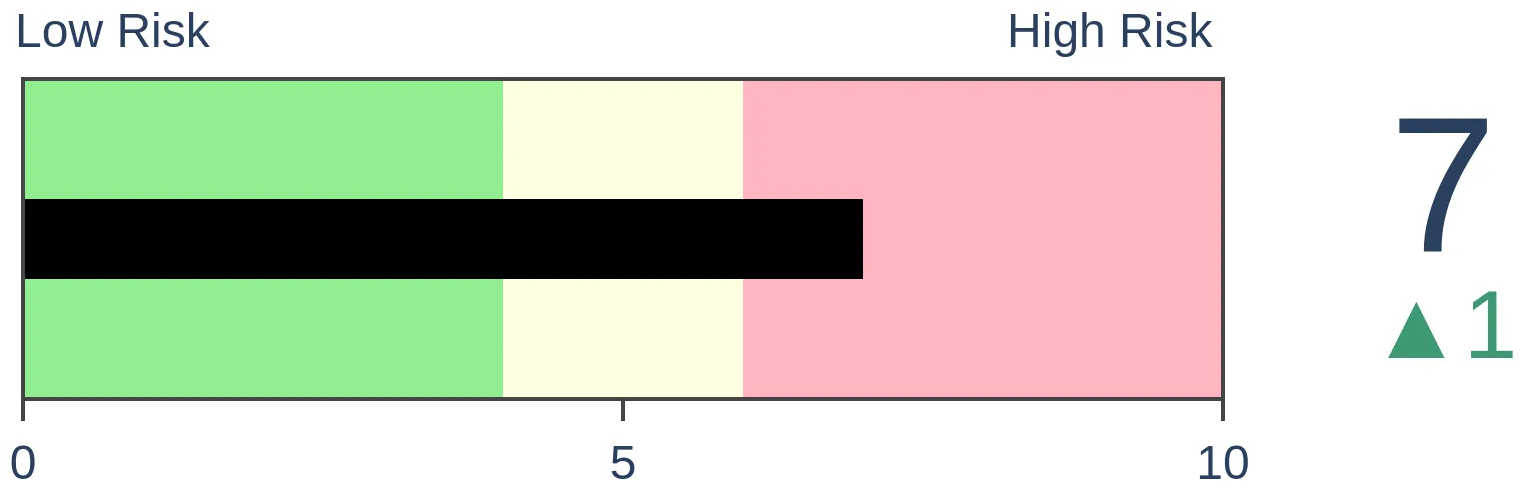
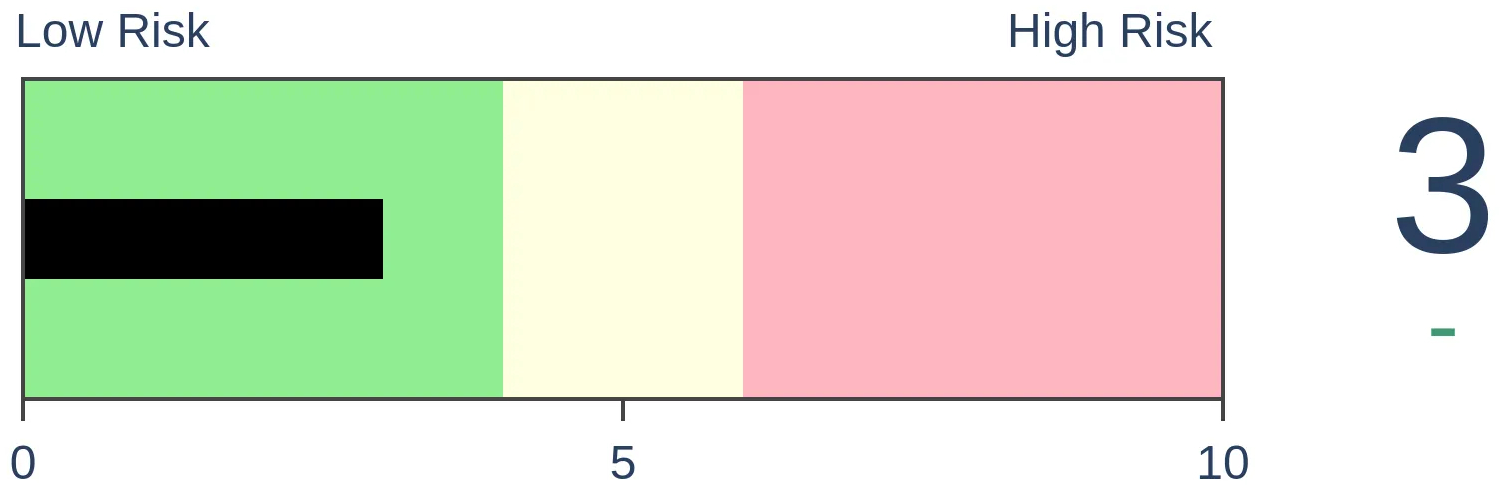
Stocks Short-Term
|
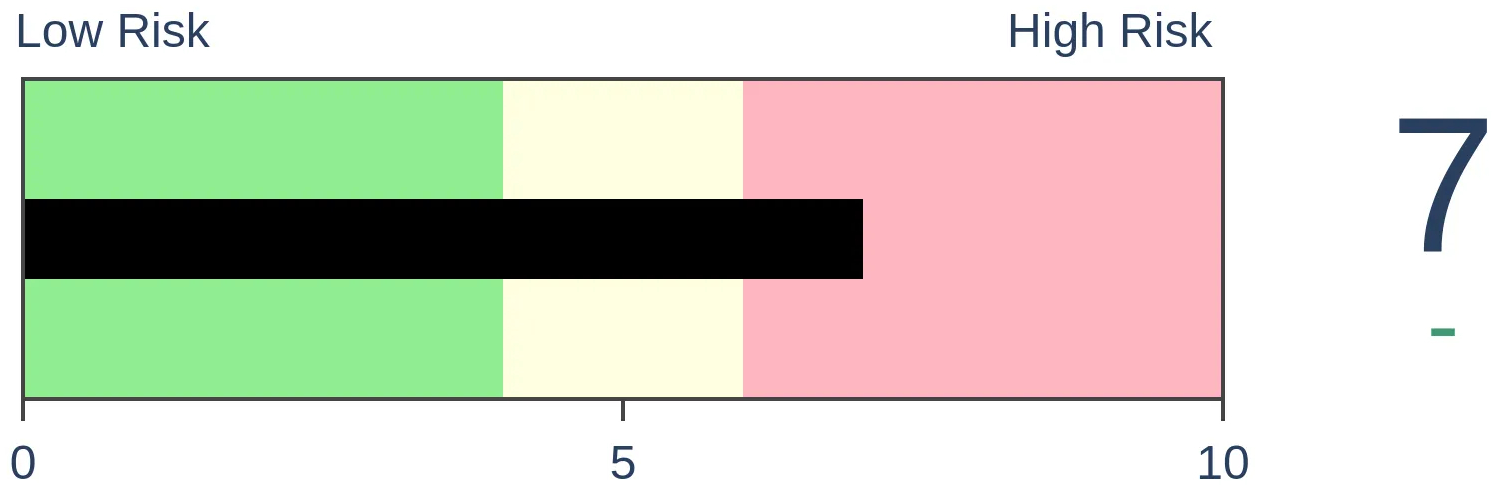
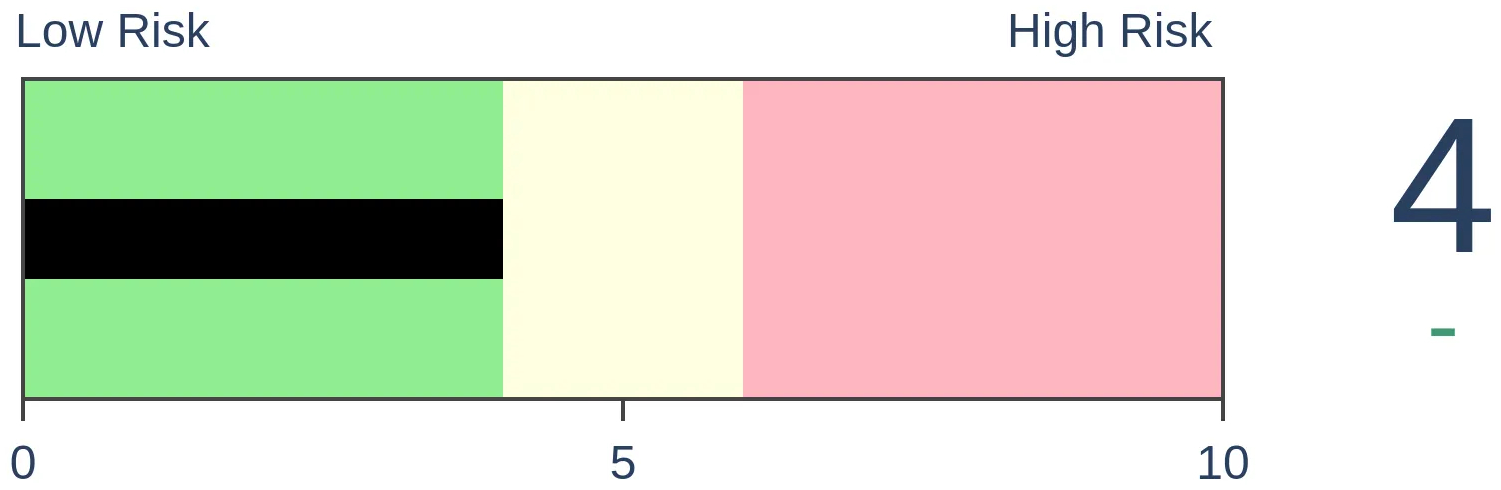
Stocks Medium-Term
|
|
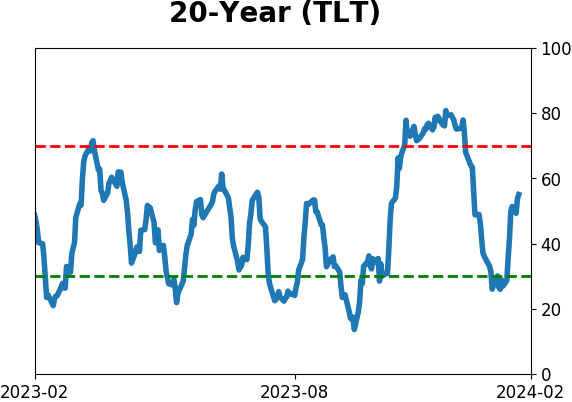
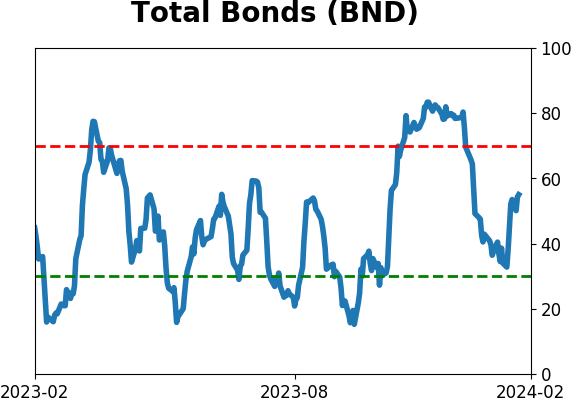
Bonds
|
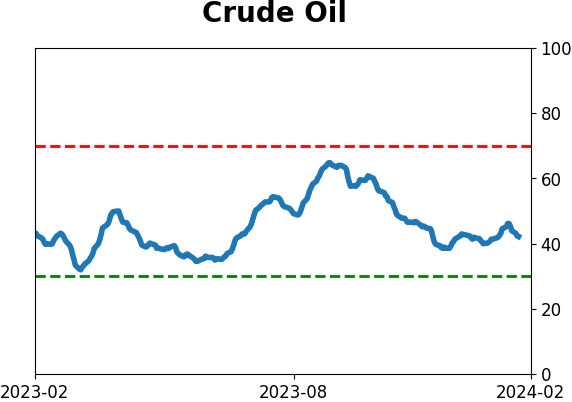
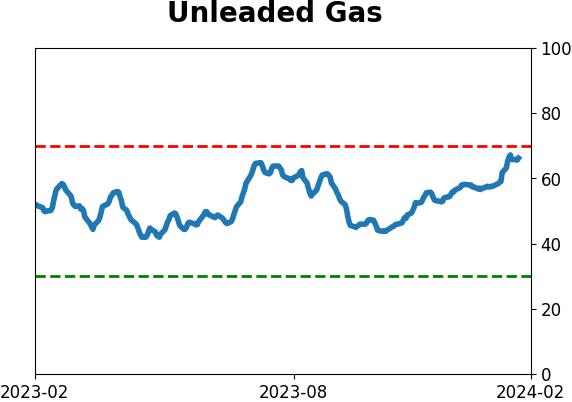
Crude Oil

|
|
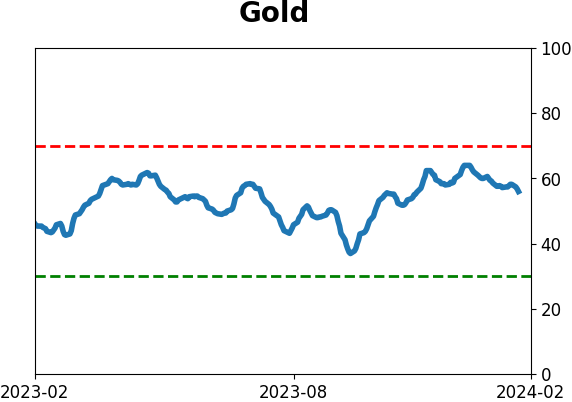
Gold
|
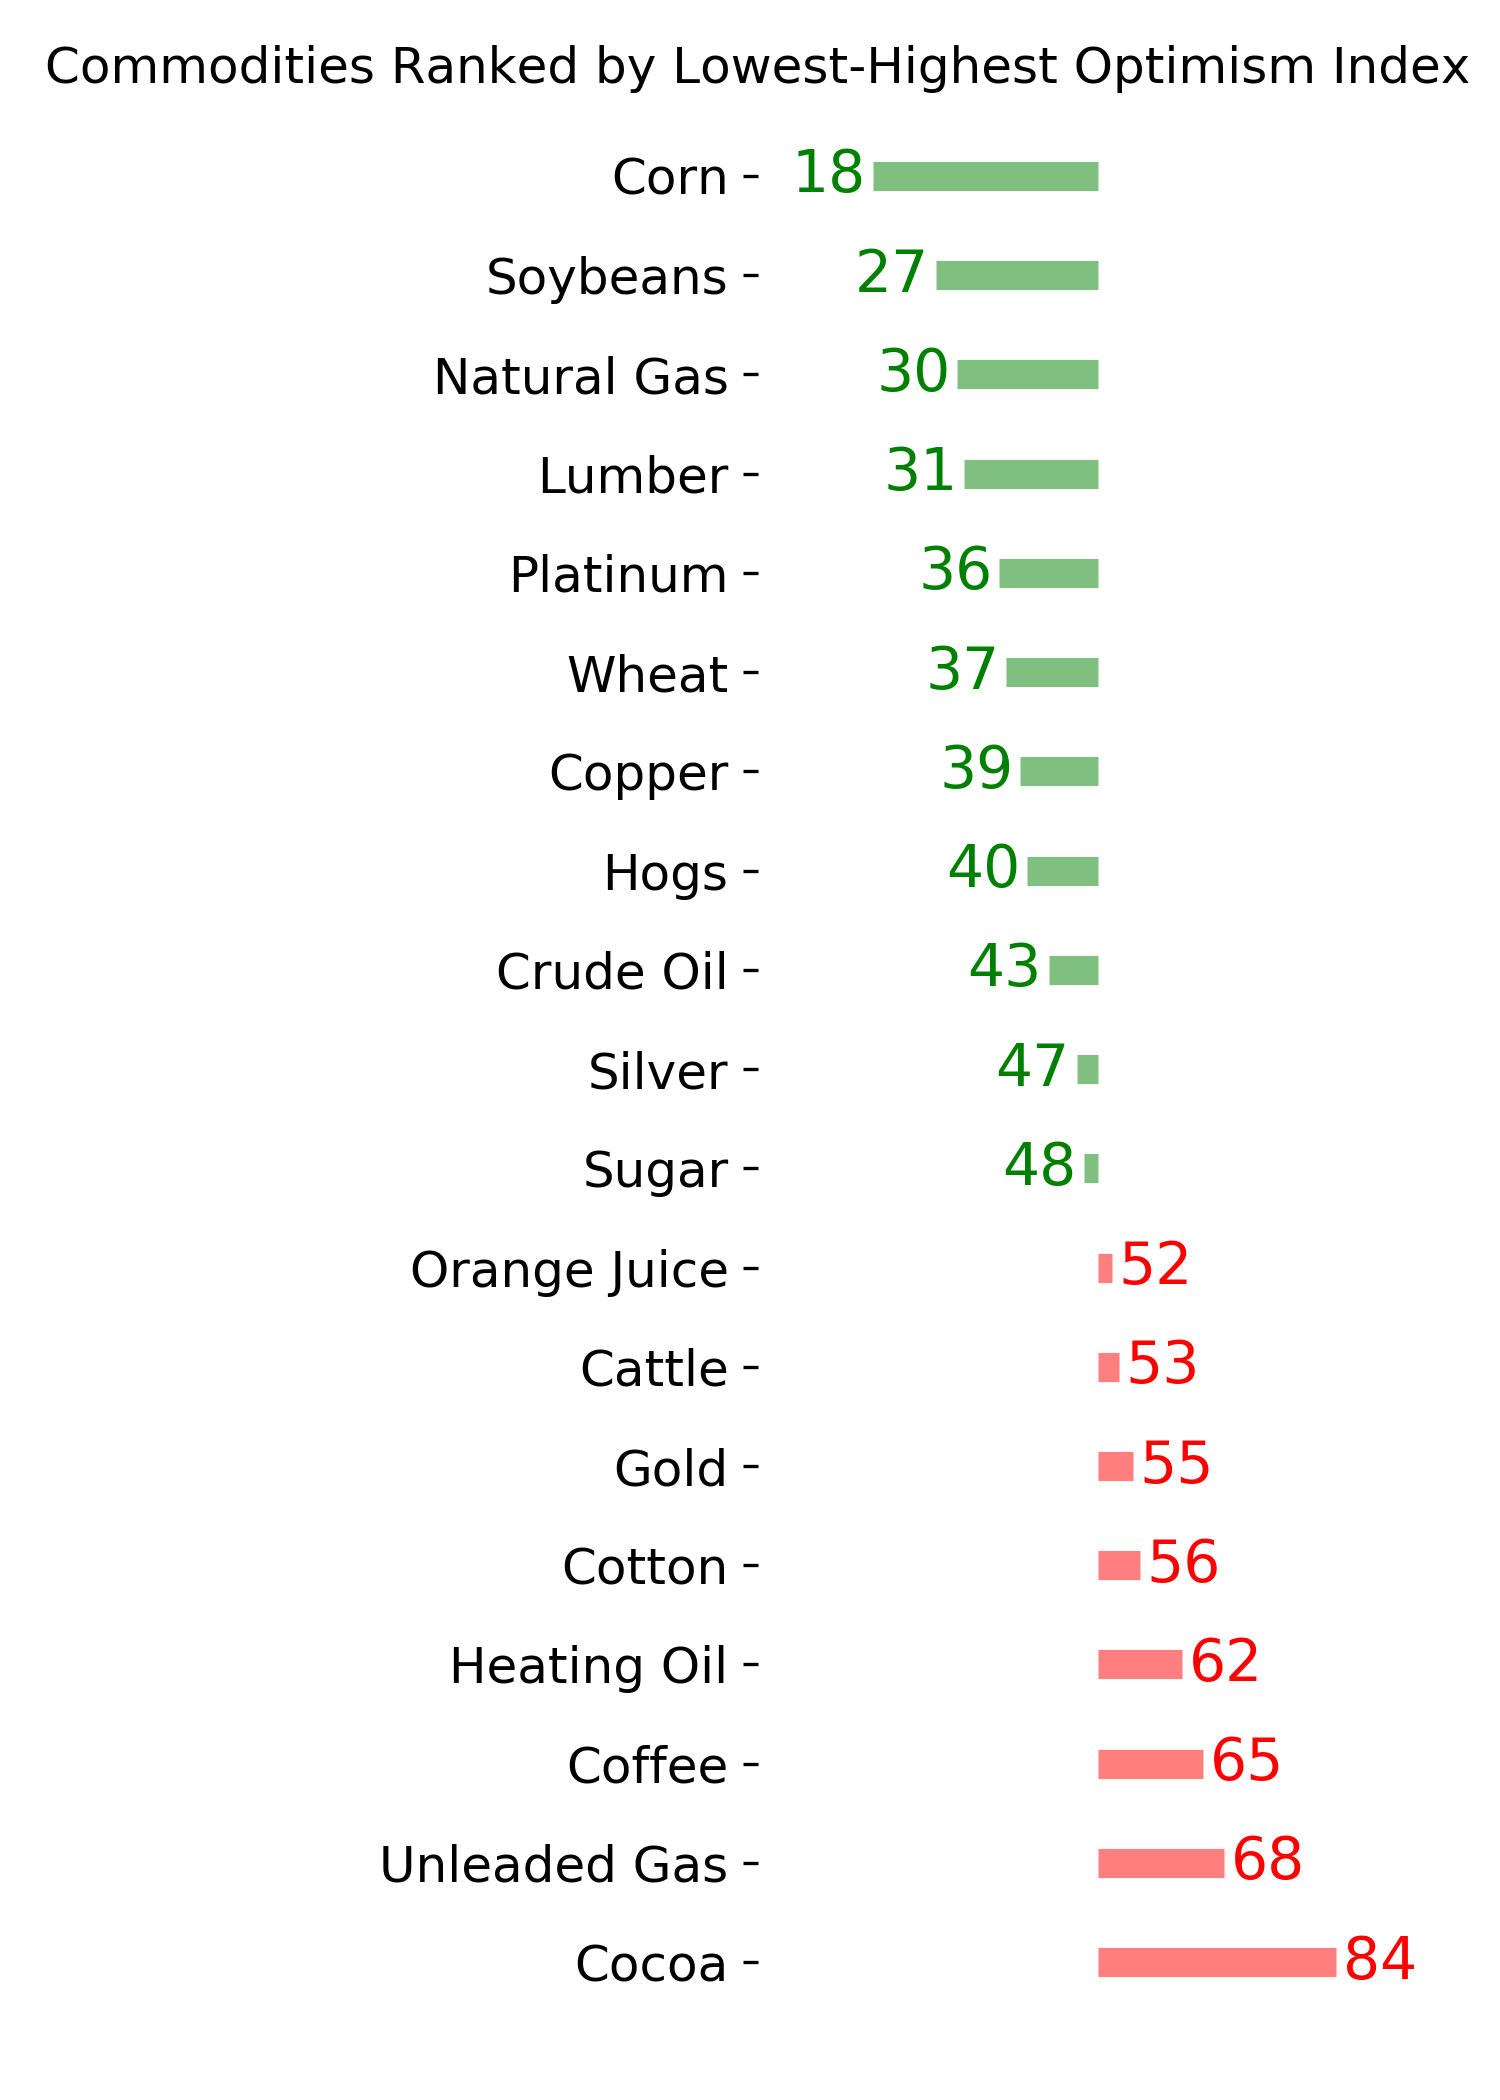
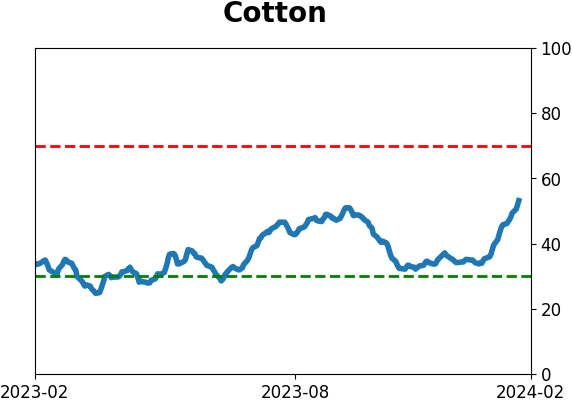
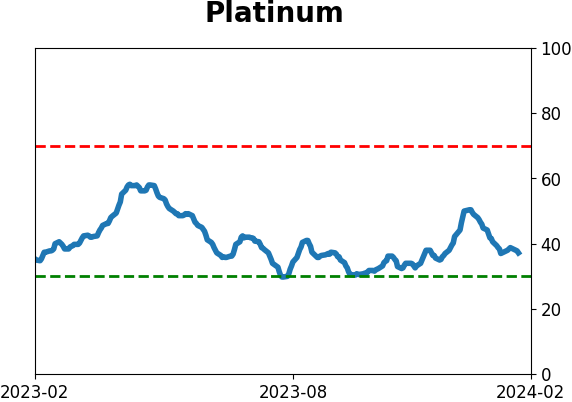
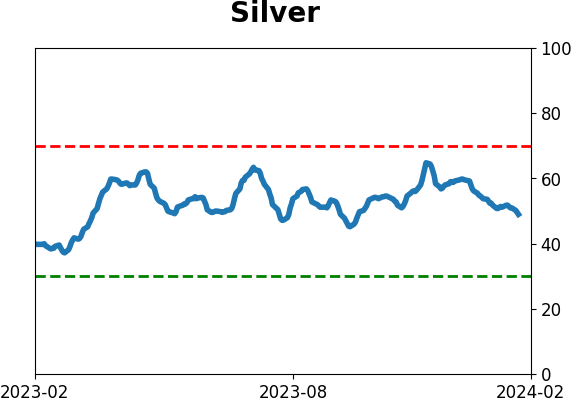
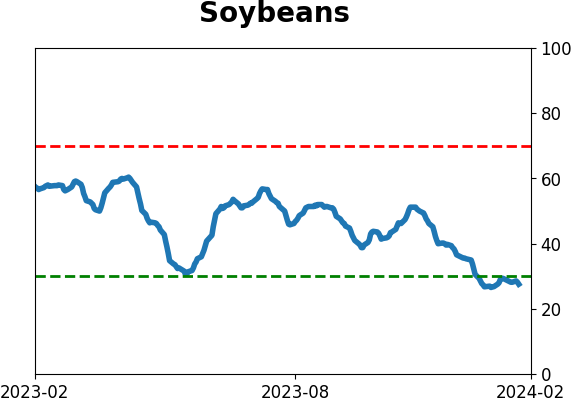
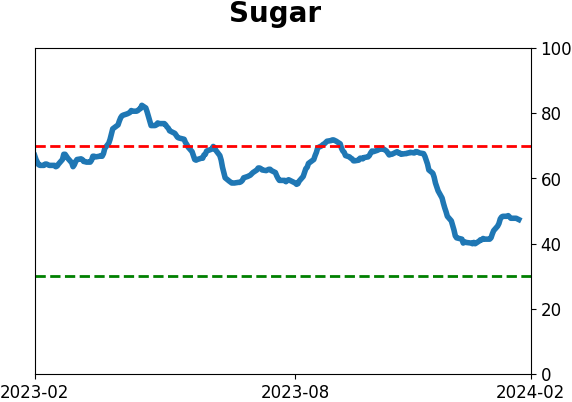
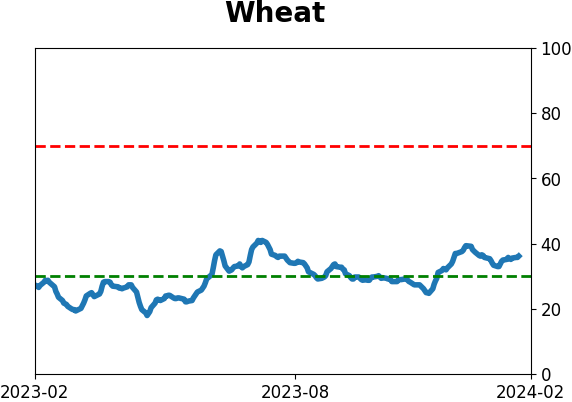
Agriculture
|
|
Research
By Jason Goepfert
BOTTOM LINE
Over the past three weeks, technical warning signs have been triggering on the Nasdaq exchange. The Hindenburg Omen and Titanic Syndrome have triggered the most since December 2021. Historically, these many warnings have preceded poor returns. Within the S&P 500, fewer stocks are holding above their moving averages, another warning.
FORECAST / TIMEFRAME
None
|
Key points:
- Technical warnings on the Nasdaq have spiked over the past 3 weeks, rising to the most since December 2021
- When warnings were this numerous, the Nasdaq Composite had difficulty holding upside momentum
- Even within the S&P 500, participation has waned to a worrying degree
Technical warning signs have spiked
On Tuesday, we saw that there have been some technical warning signs on the Nasdaq. Among those are the Hindenburg Omen and Titanic Syndrome, which have been stacking up lately.
If you can get past the hyperbolic names, they provide helpful insight into what's happening below the surface of the major stock market indexes. When these signals trigger, they highlight conditions when not everything is in gear. And they've both been triggering consistently on the Nasdaq over the past few weeks.
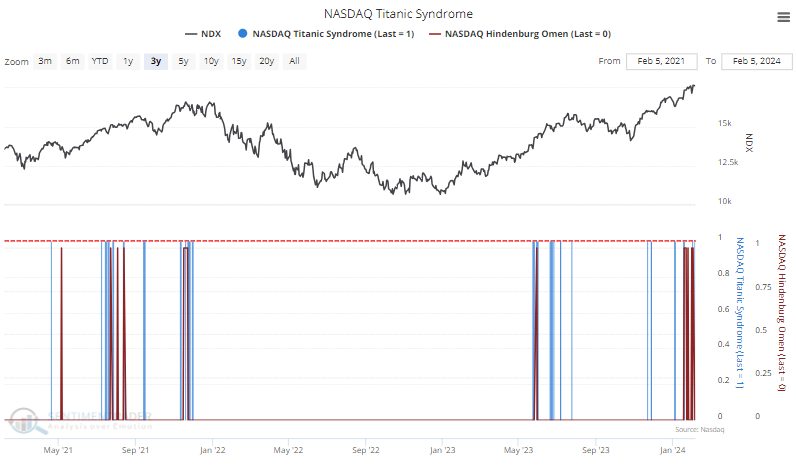
During the past three weeks, the two indicators have triggered a combined eight signals. That's the most since December 2021. We can see from the chart below that when eight or more signals were triggered, the Nasdaq Composite's annualized return was a horrid -29.3%.
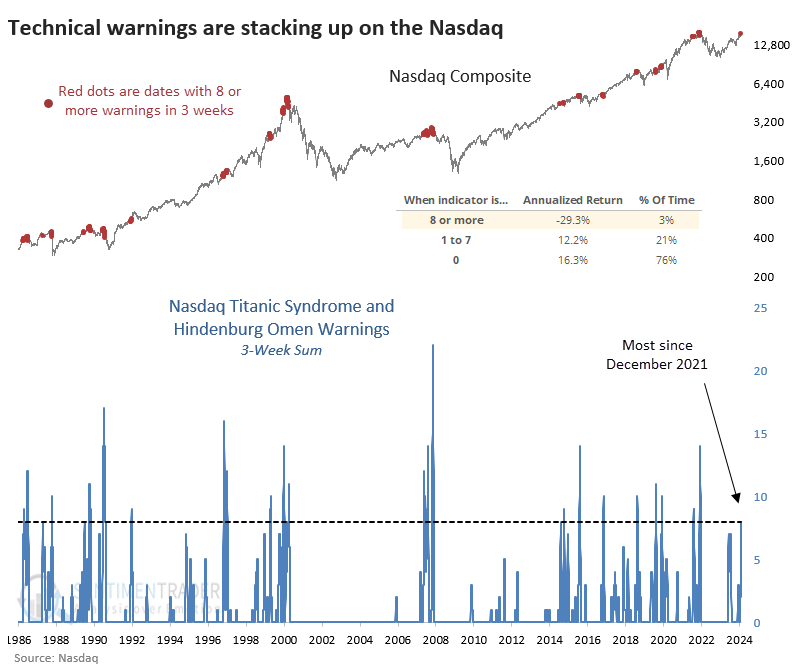
The table below takes a signal-based approach. It shows returns for the Composite after any date when the three-week sum of combined warnings cycled from zero to eight or more. A few times, the Nasdaq escaped unscathed over the medium term. But several of the gains ended up being given back in the months following. Overall, risk in the index was higher than reward, which is not a condition we see often.
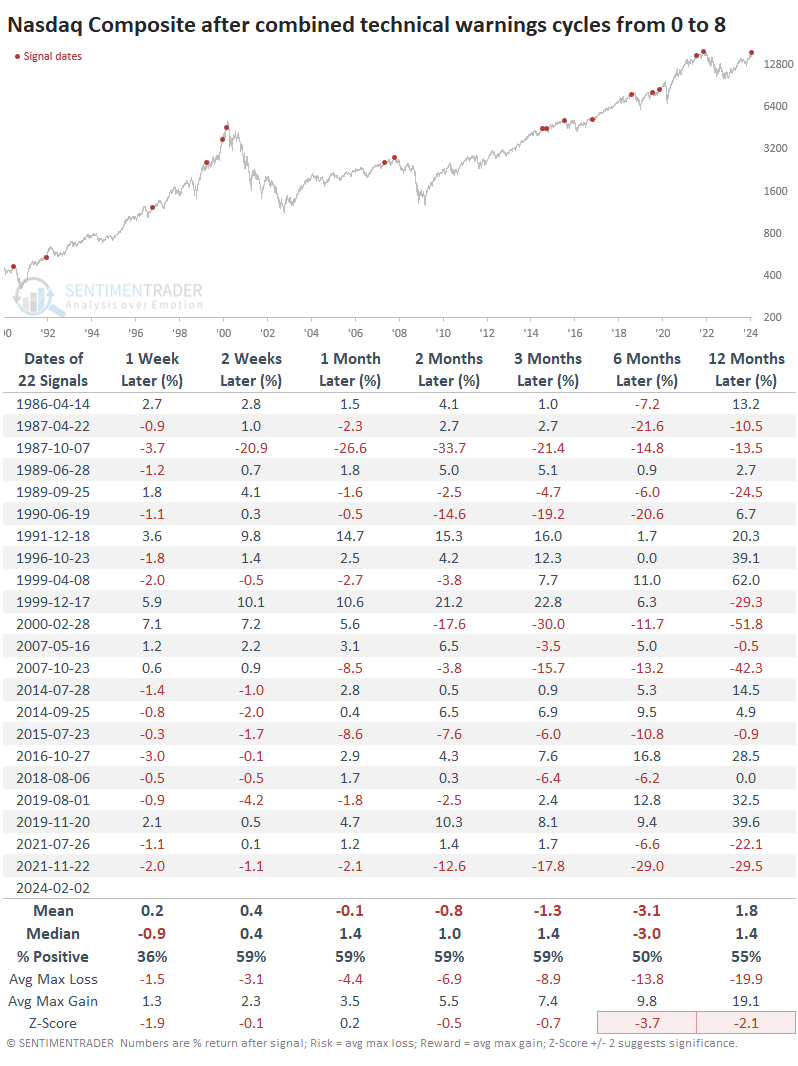
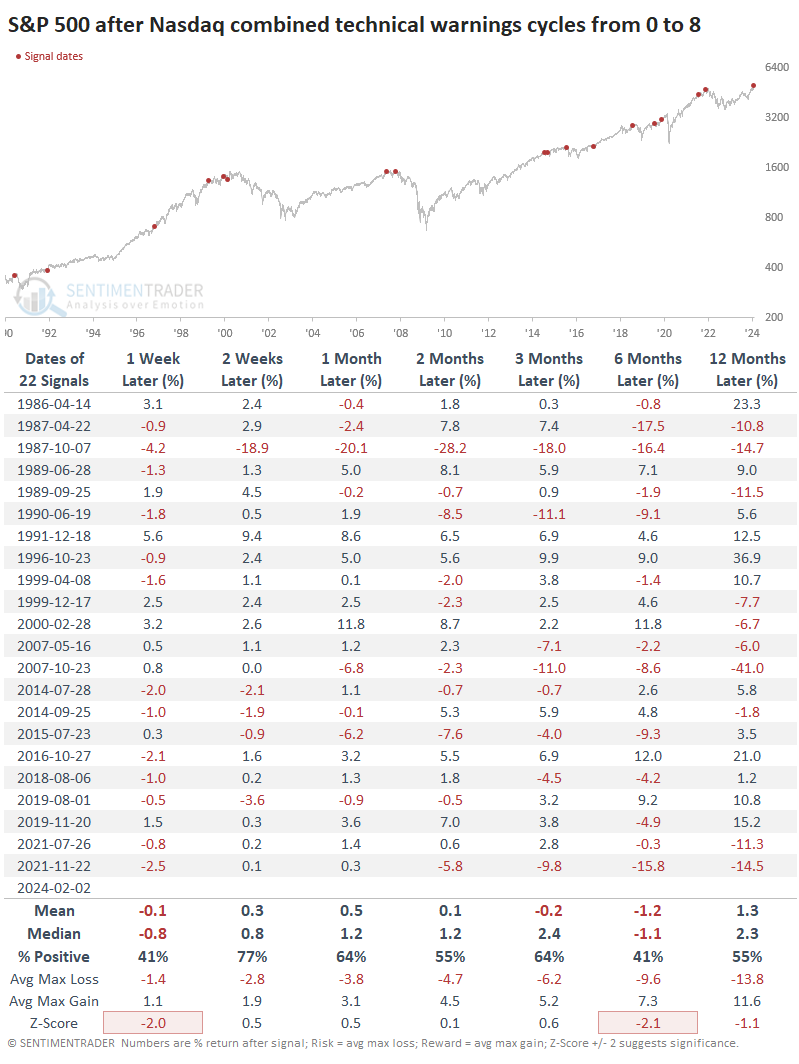
These warnings were actually a worse sign for the S&P 500 over the next six months. It showed a gain only 41% of the time, with a negative average return and more risk than reward. Again, this is unusual to see.
Even within the S&P 500, participation in waning
Recent behavior has been odd, even if we ignore some speculative issues that trade on the Nasdaq. Within the S&P 500, fewer and fewer stocks have been participating in its most recent gains. The percentage of stocks within the index holding above their 10-day, 50-day, and 200-day moving averages has been decreasing for weeks.
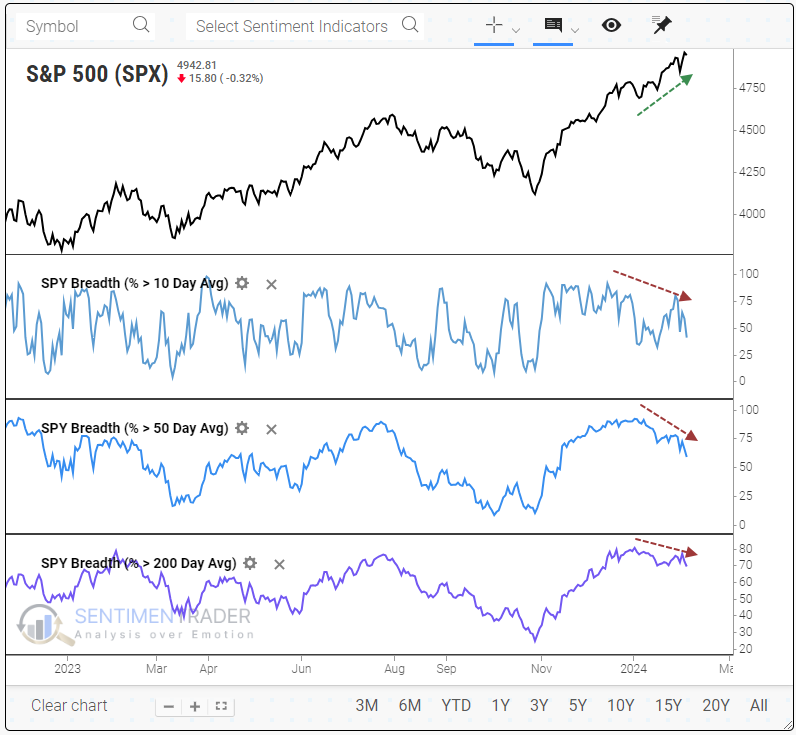
Going back to 1928, this is only the 2nd time we've seen anything like this comprehensive of a divergence between the index and its component stocks (the other was in August 1929).
We have to relax the parameters to get any kind of sample size, so the table below shows dates when the S&P index was within 0.5% of a 3-year high, yet fewer than 50% of its member stocks were above their 10-day average, fewer than 60% were above their 50-day average, and fewer than 70% above their 200-day average.
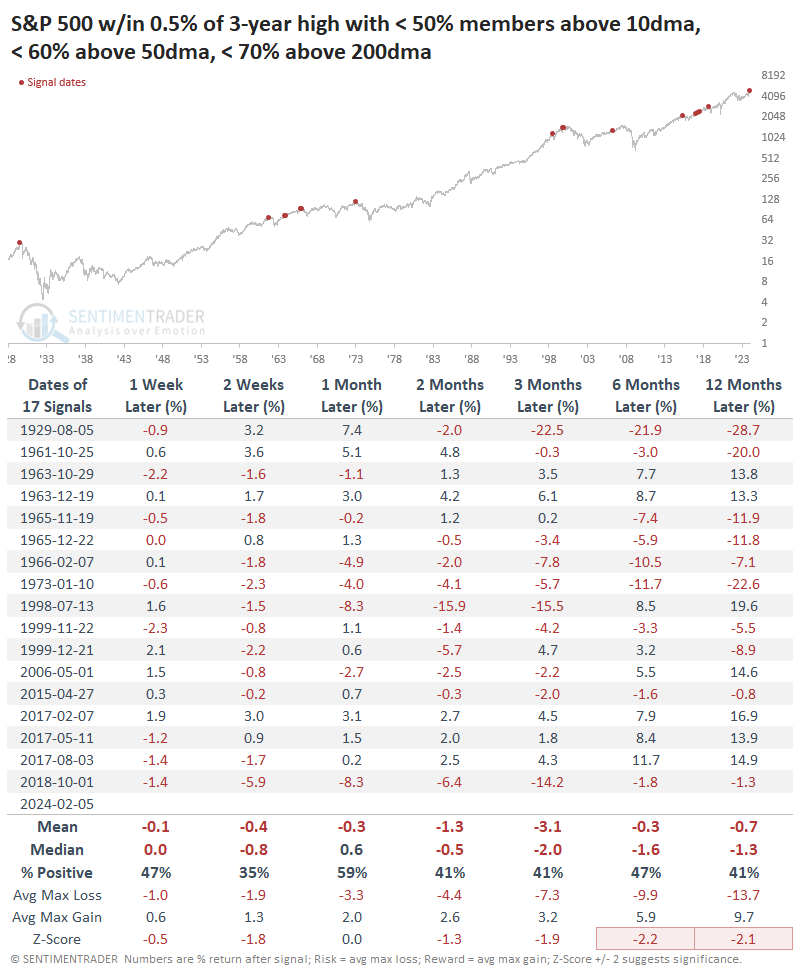
The results were not encouraging for bulls. Across almost all time frames, the S&P's returns were woeful, consistently negative, and with a terrible ratio of risk to reward. Buyers shrugged off the warnings in 1963 and 2017, but other than that, it was trouble.
What the research tells us...
Almost without exception since October 2022, market performance has been in line with or better than what studies suggested, given the level of pessimism at the time. Follow-through was excellent, and participation was broad. All of that was well and good and helped the rally extend to where we are today. For really the first time since then, however, we're seeing a relatively large number of warning signs. It's not to a point of ridiculousness like it was in 2021, but it's enough to be worrisome for bulls.
Indicators at Extremes
Phase Table
Ranks
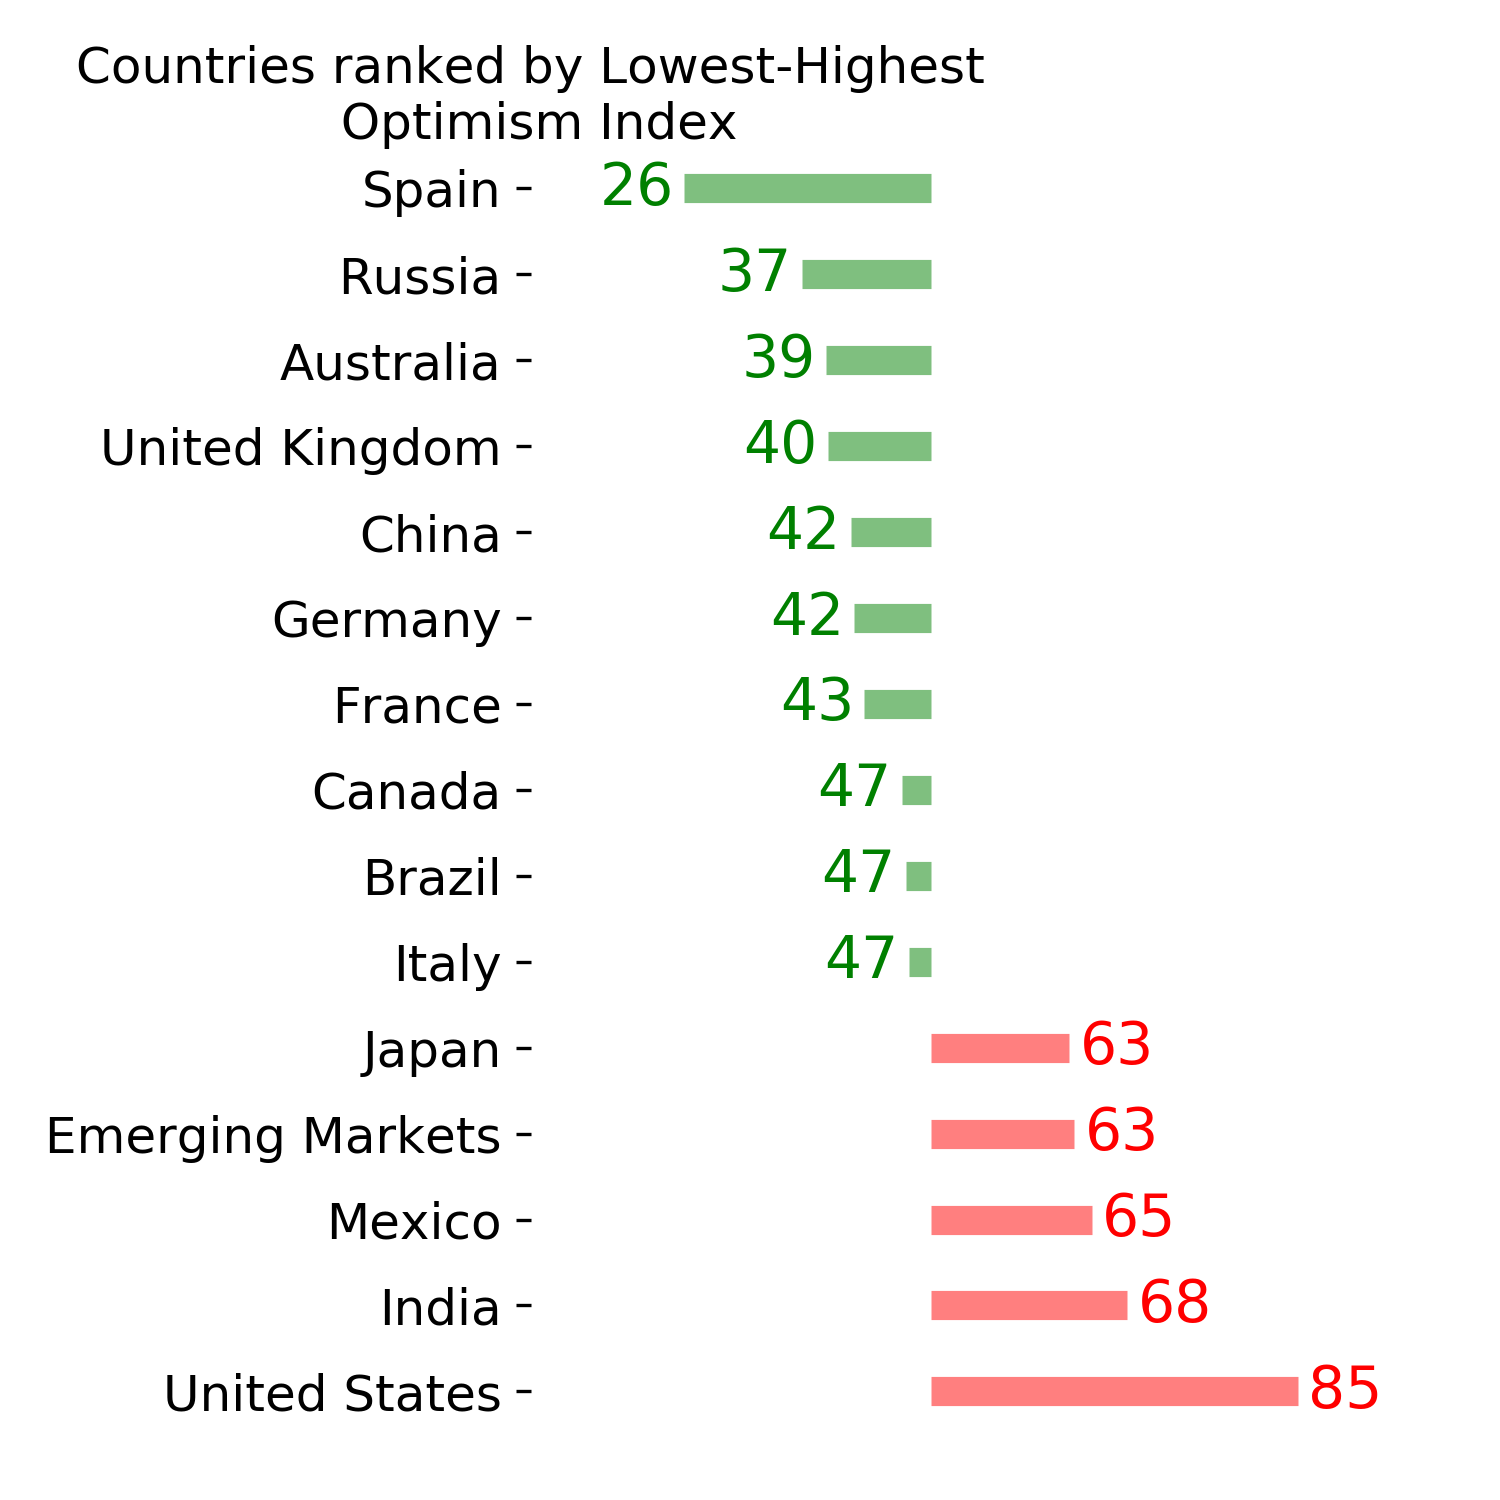
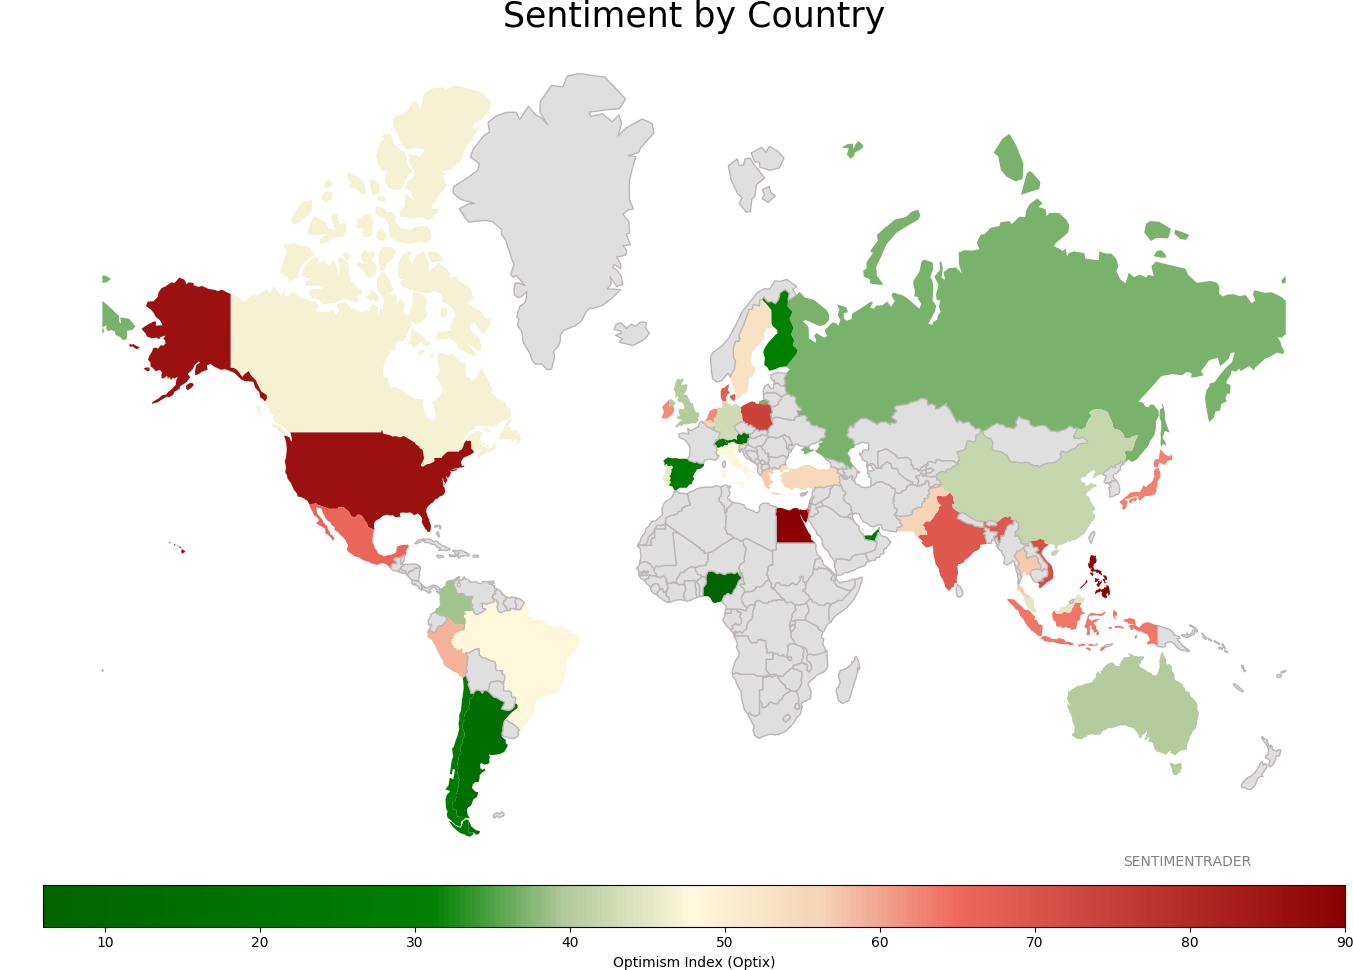
Sentiment Around The World
Optimism Index Thumbnails
|
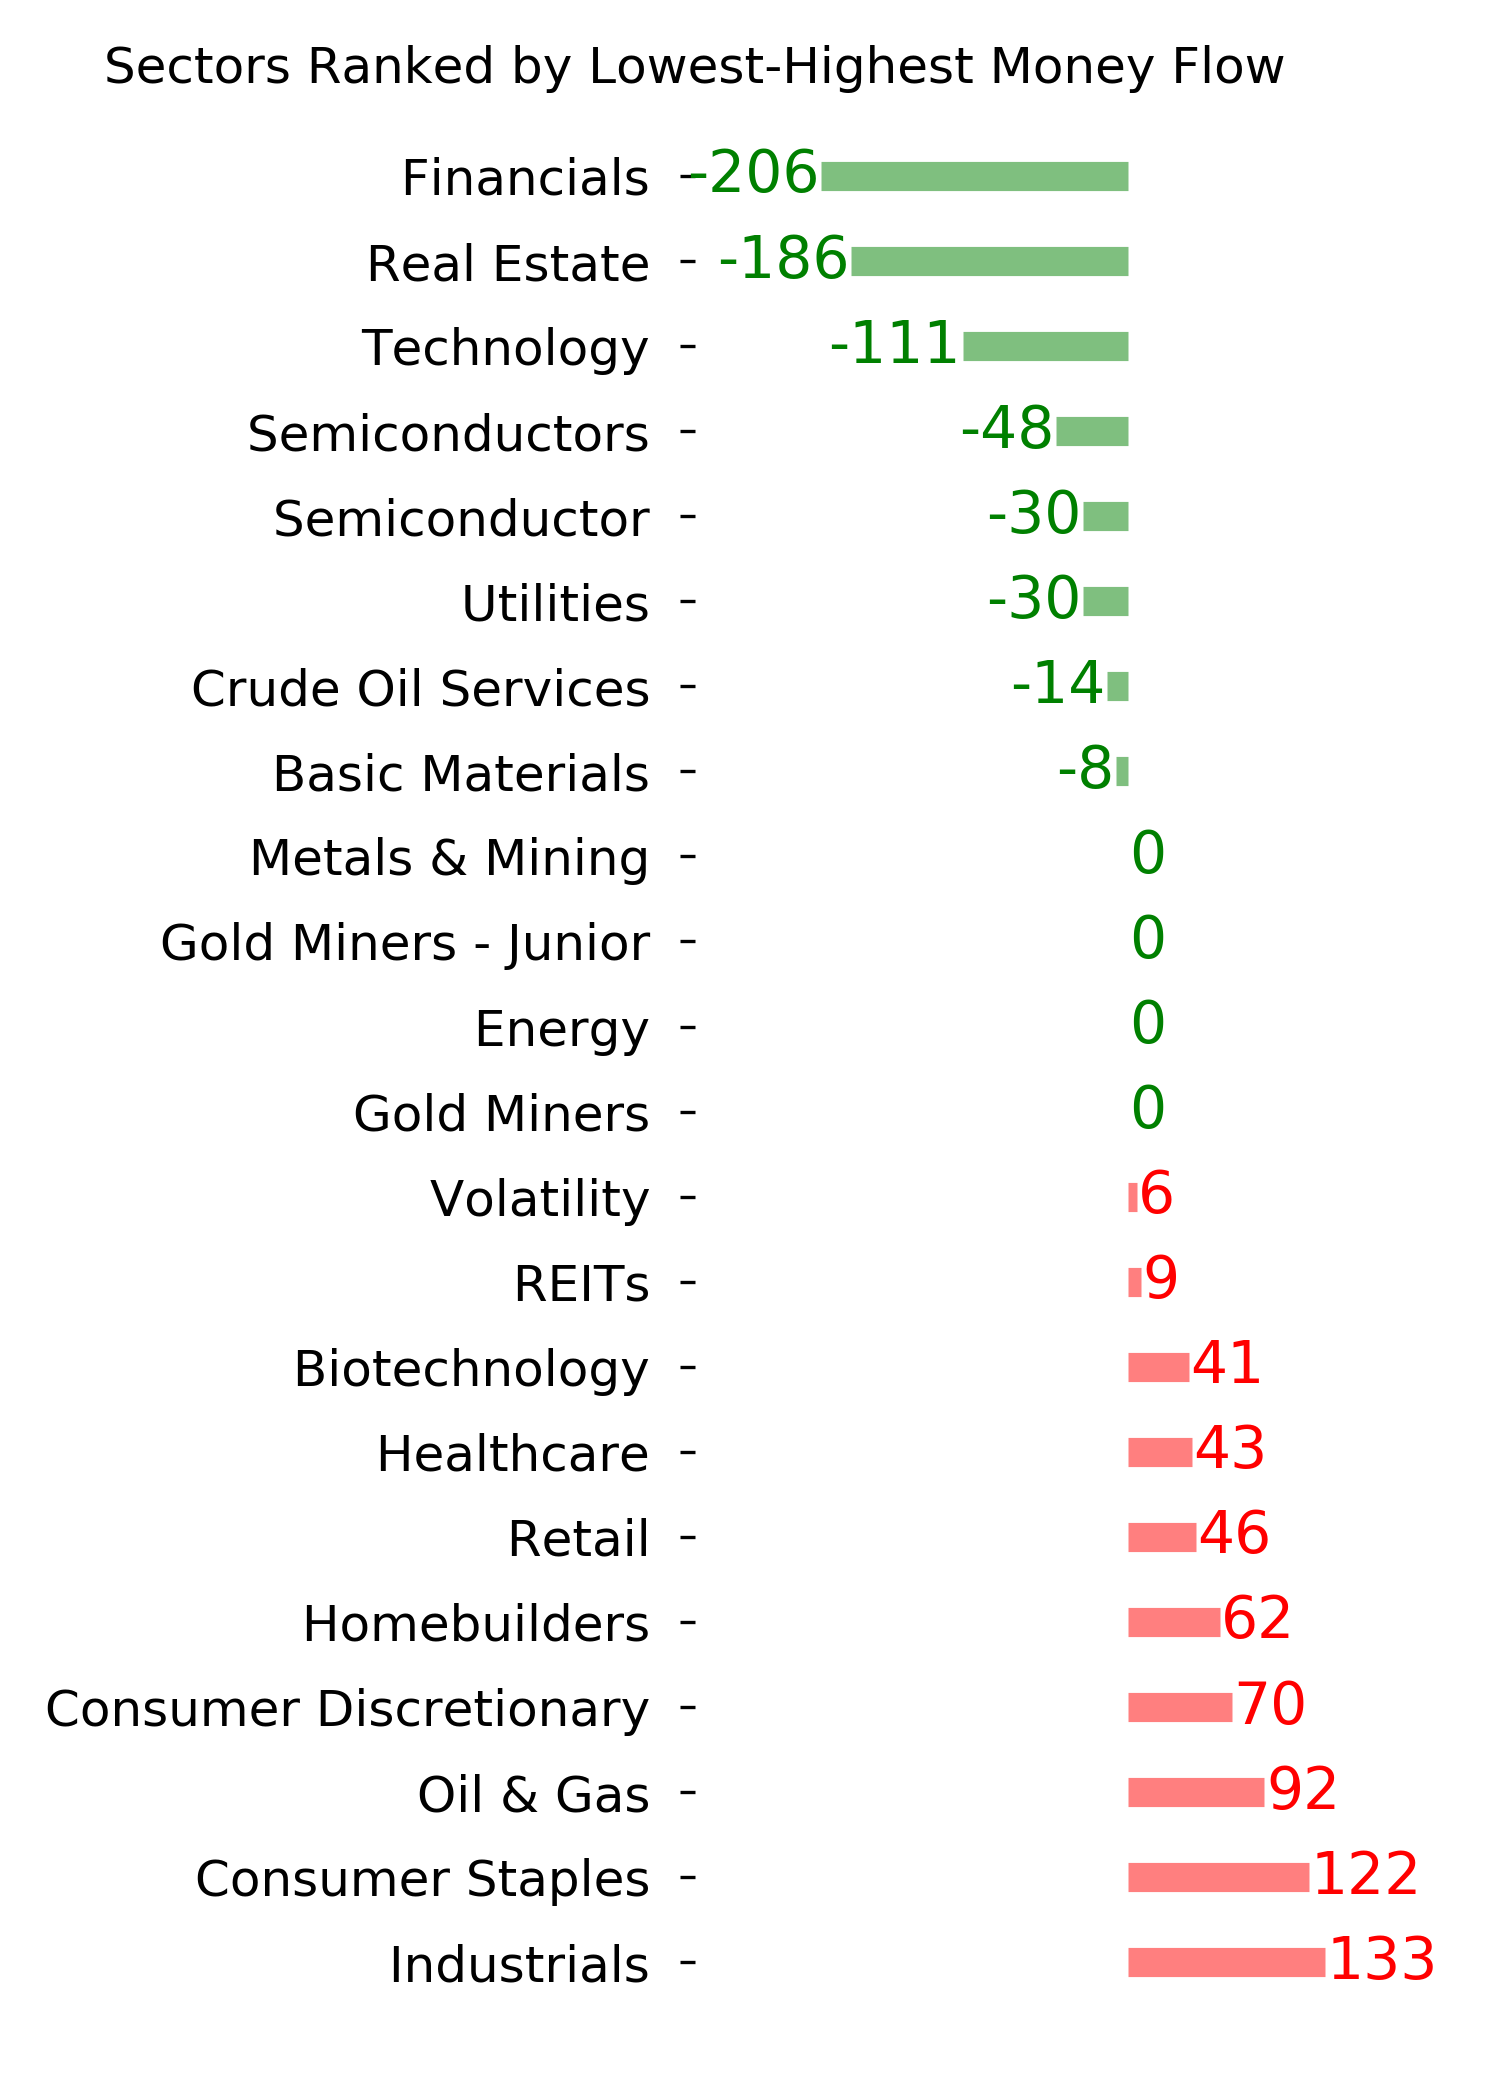
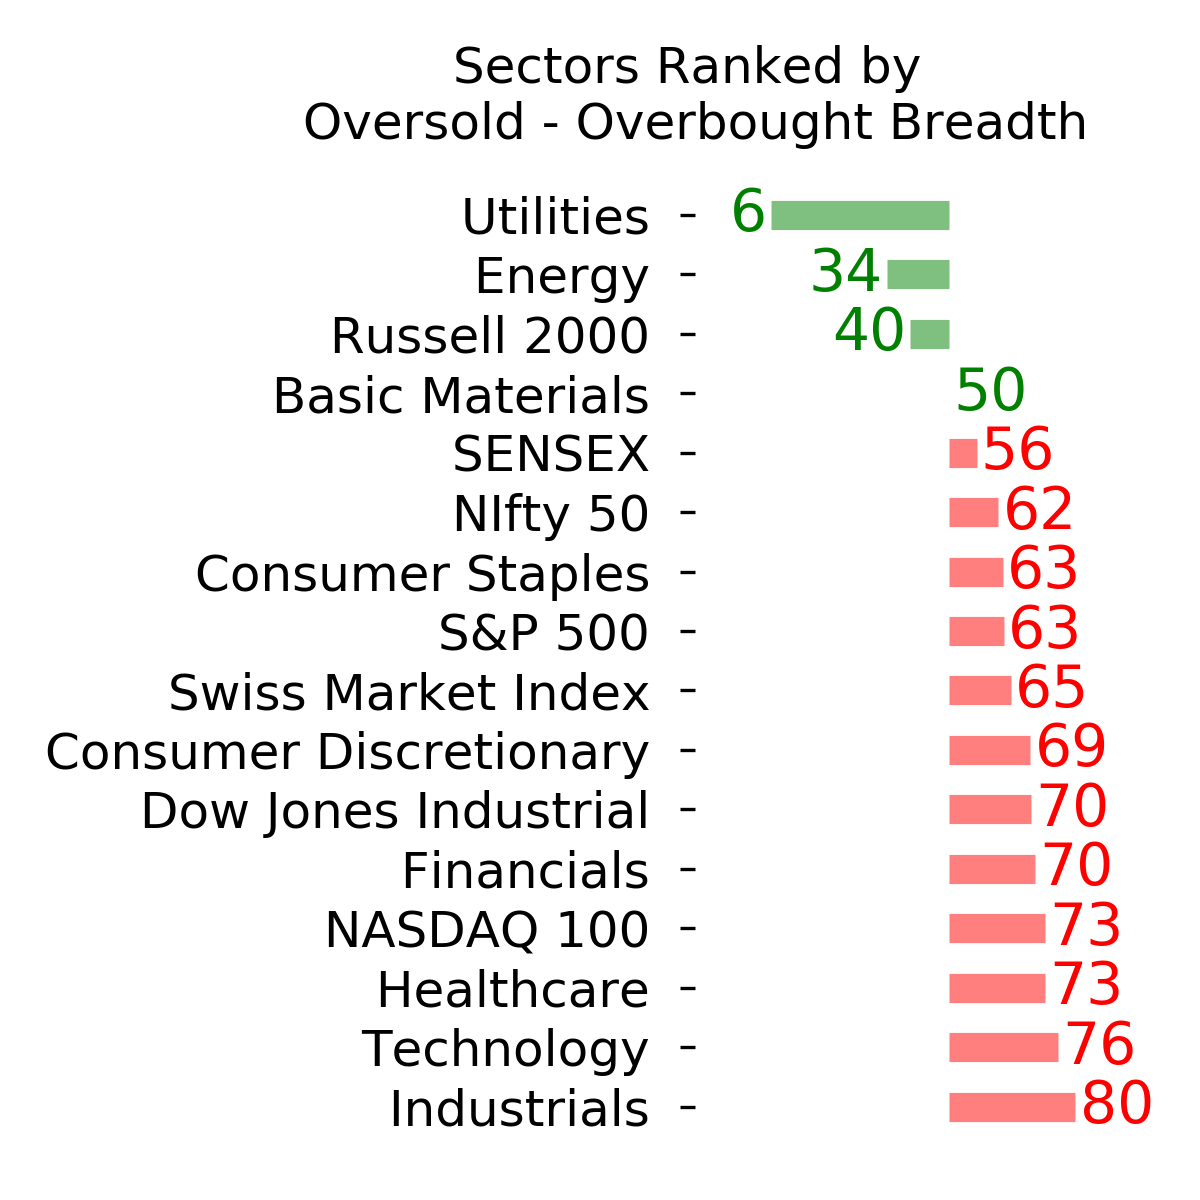
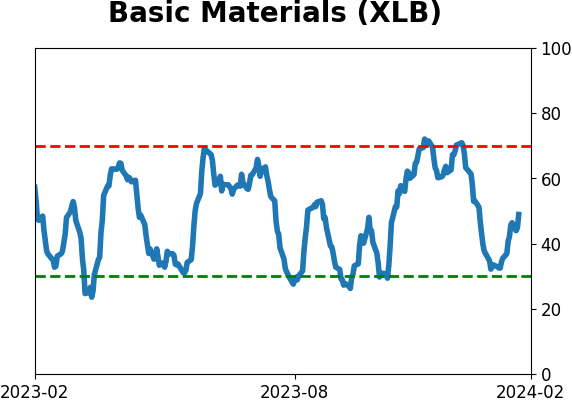
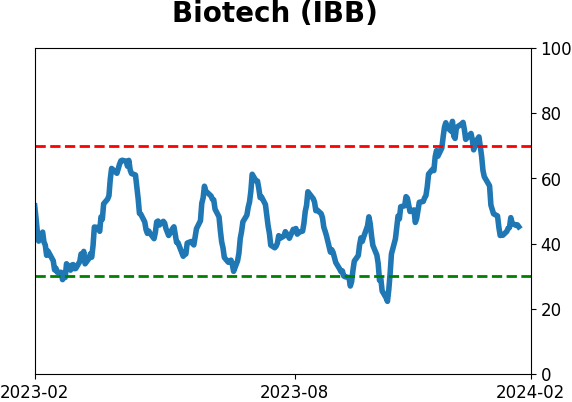
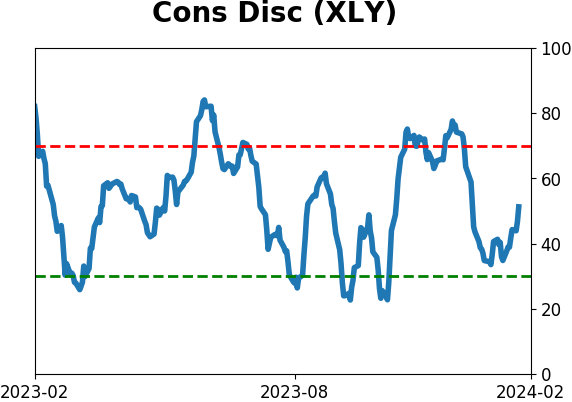
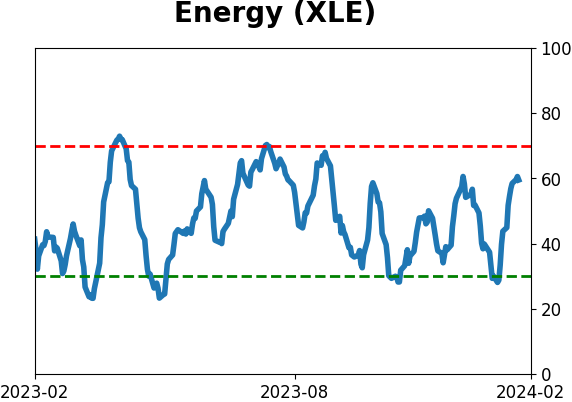
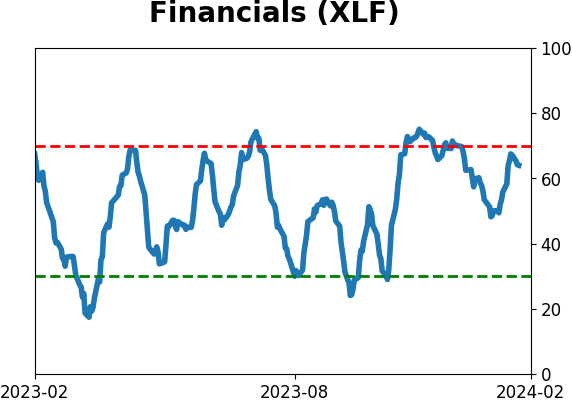
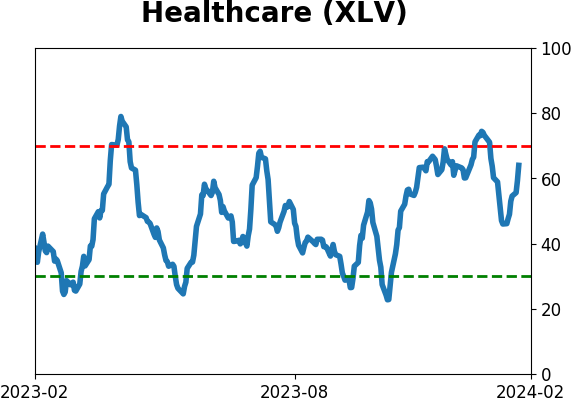
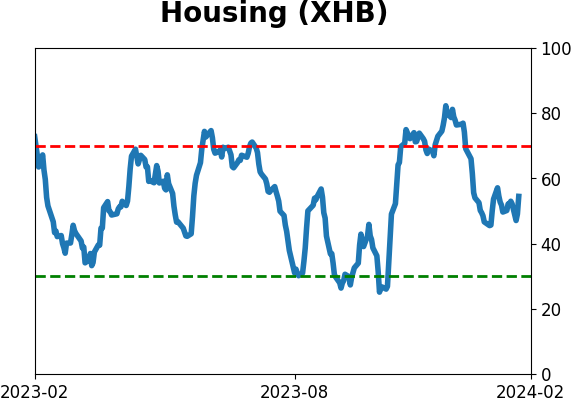
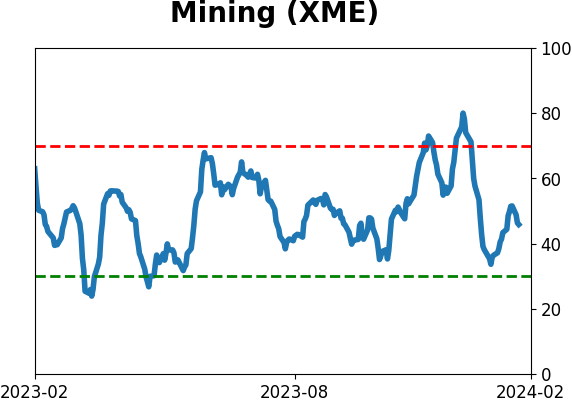
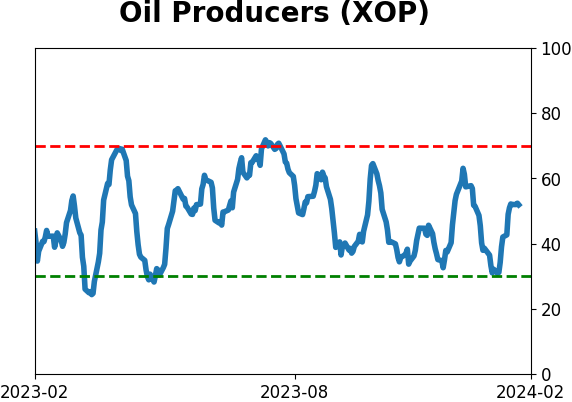
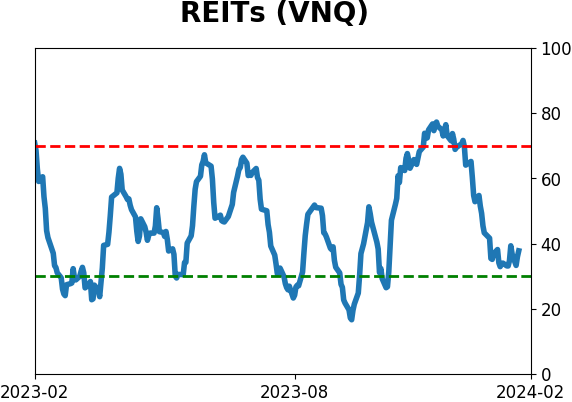
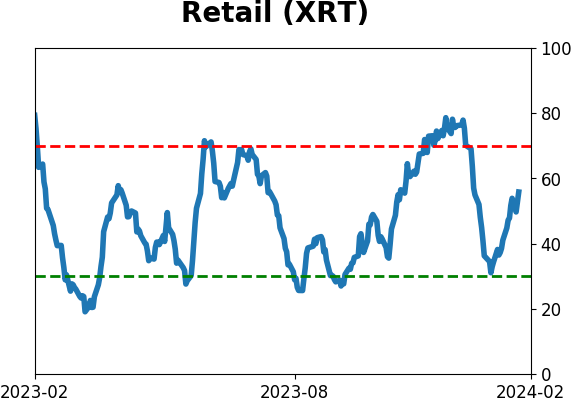
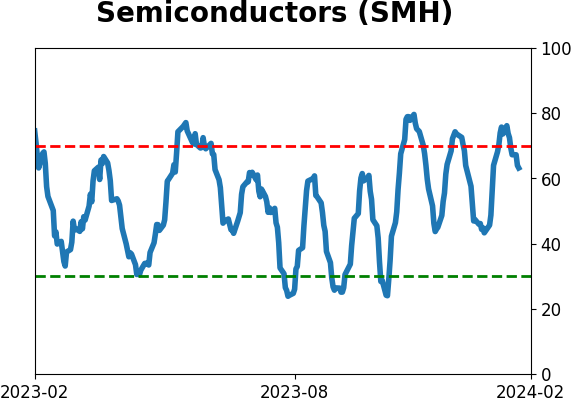
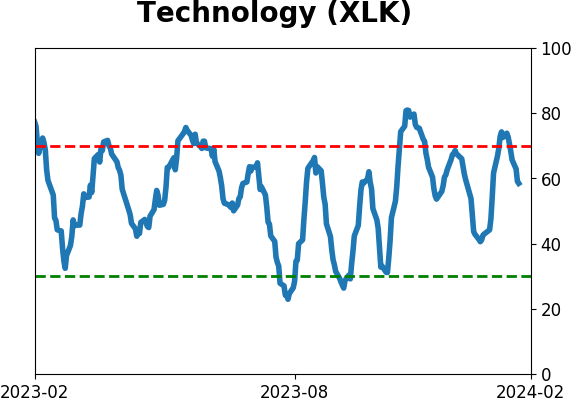
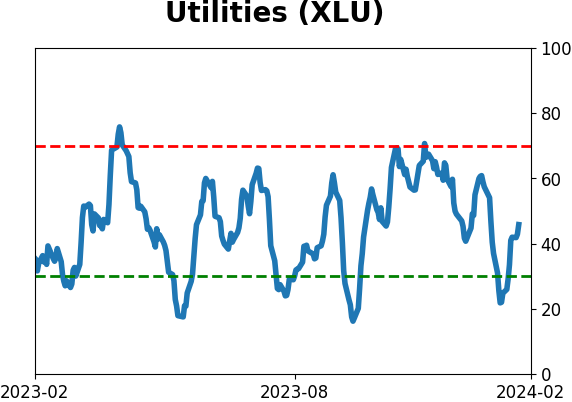
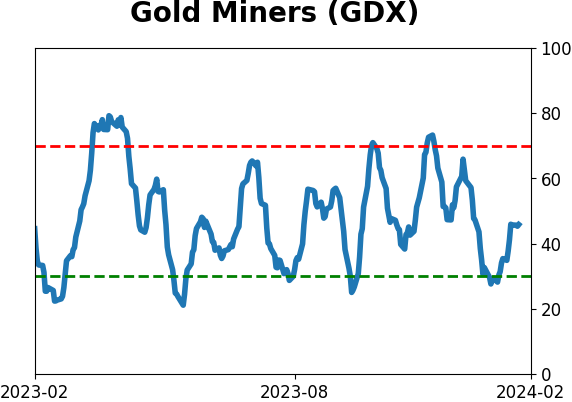
Sector ETF's - 10-Day Moving Average
|
|
|
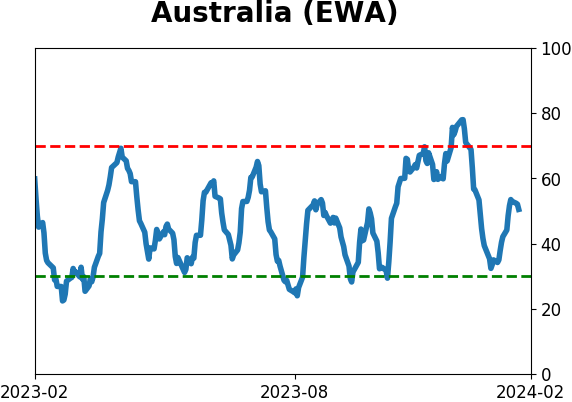
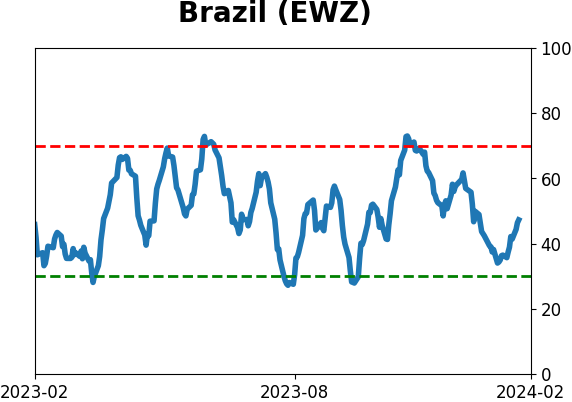
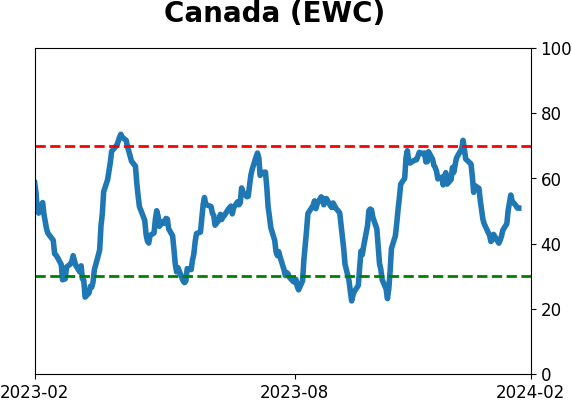
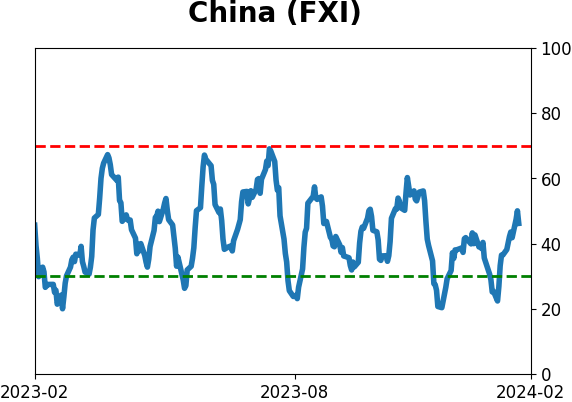
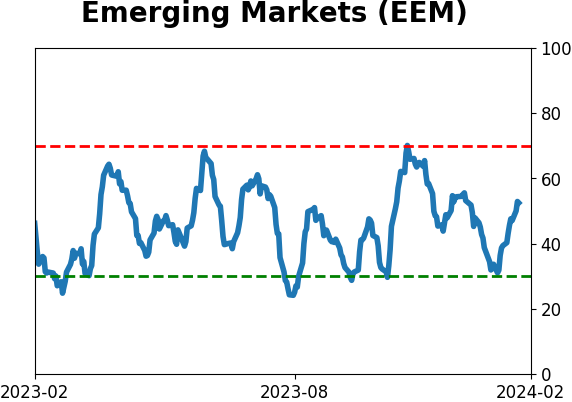
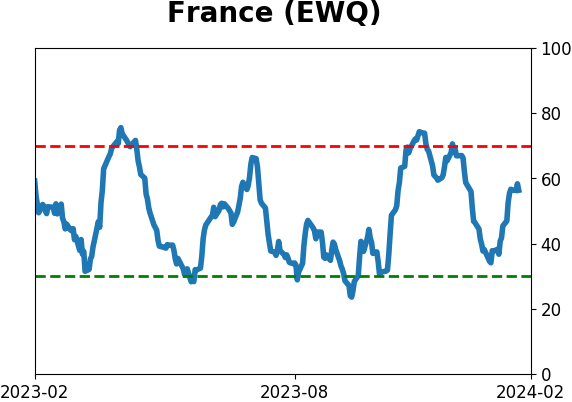
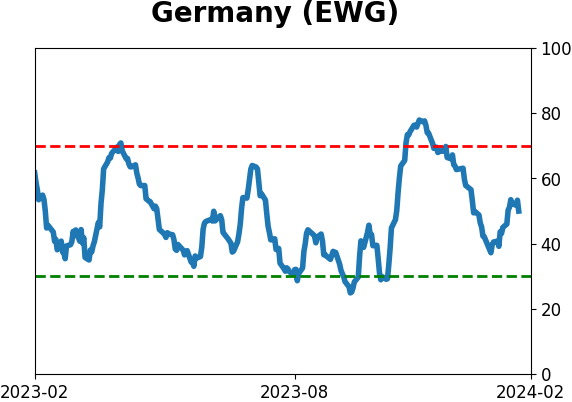
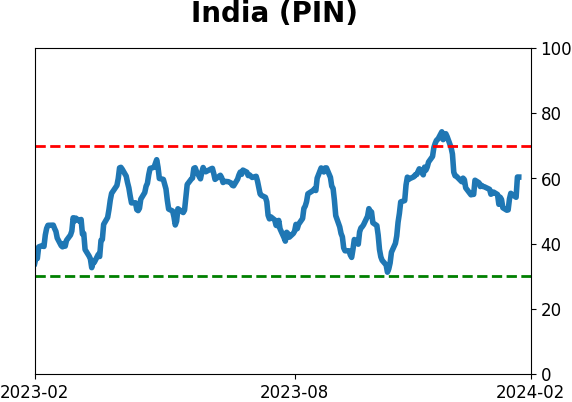
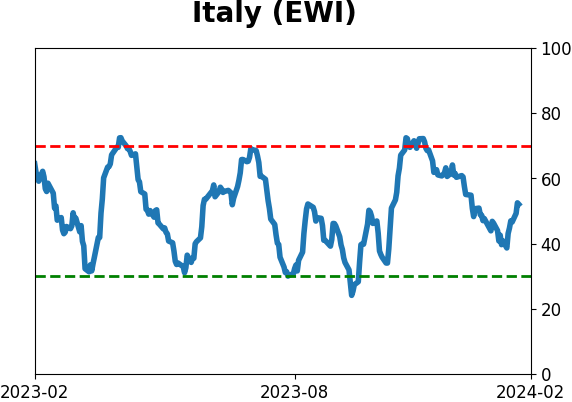
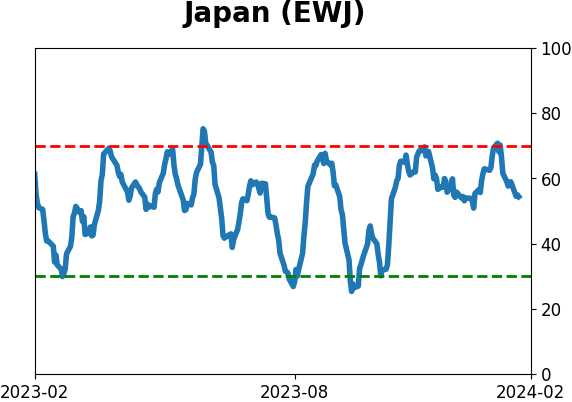
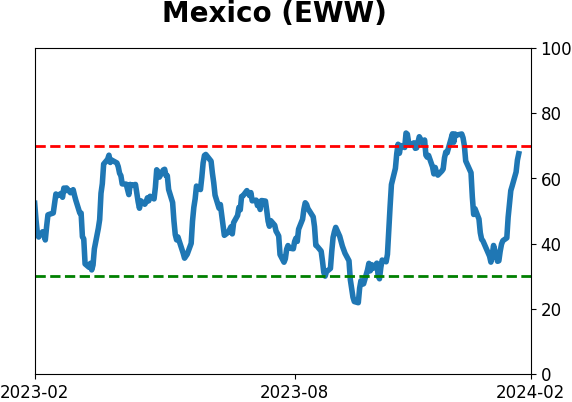
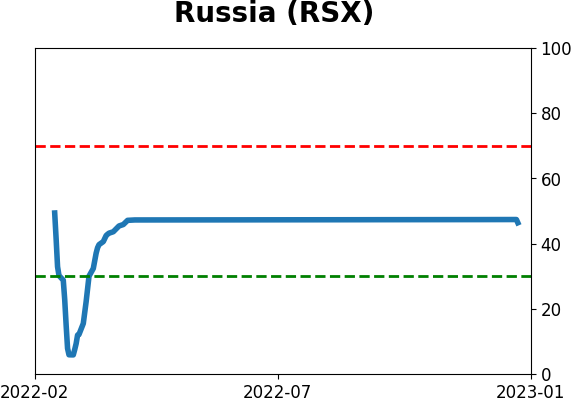
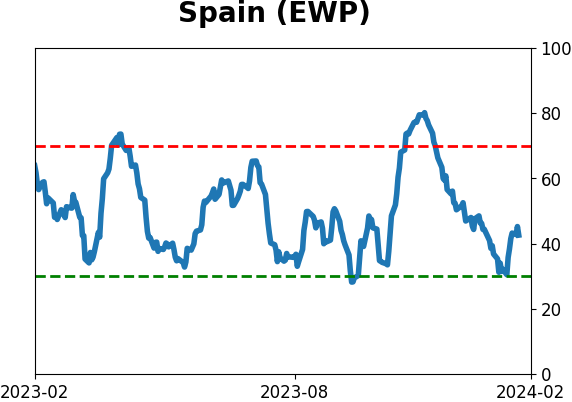
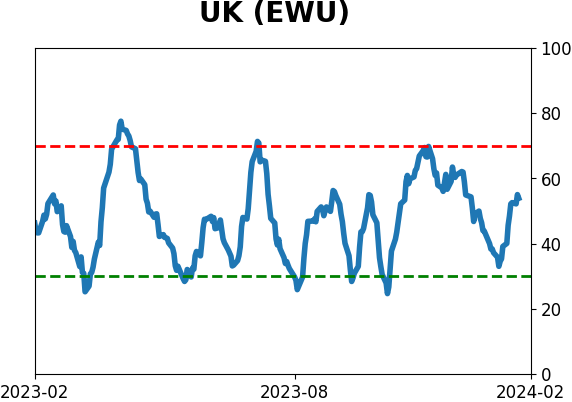
Country ETF's - 10-Day Moving Average
|
|
|
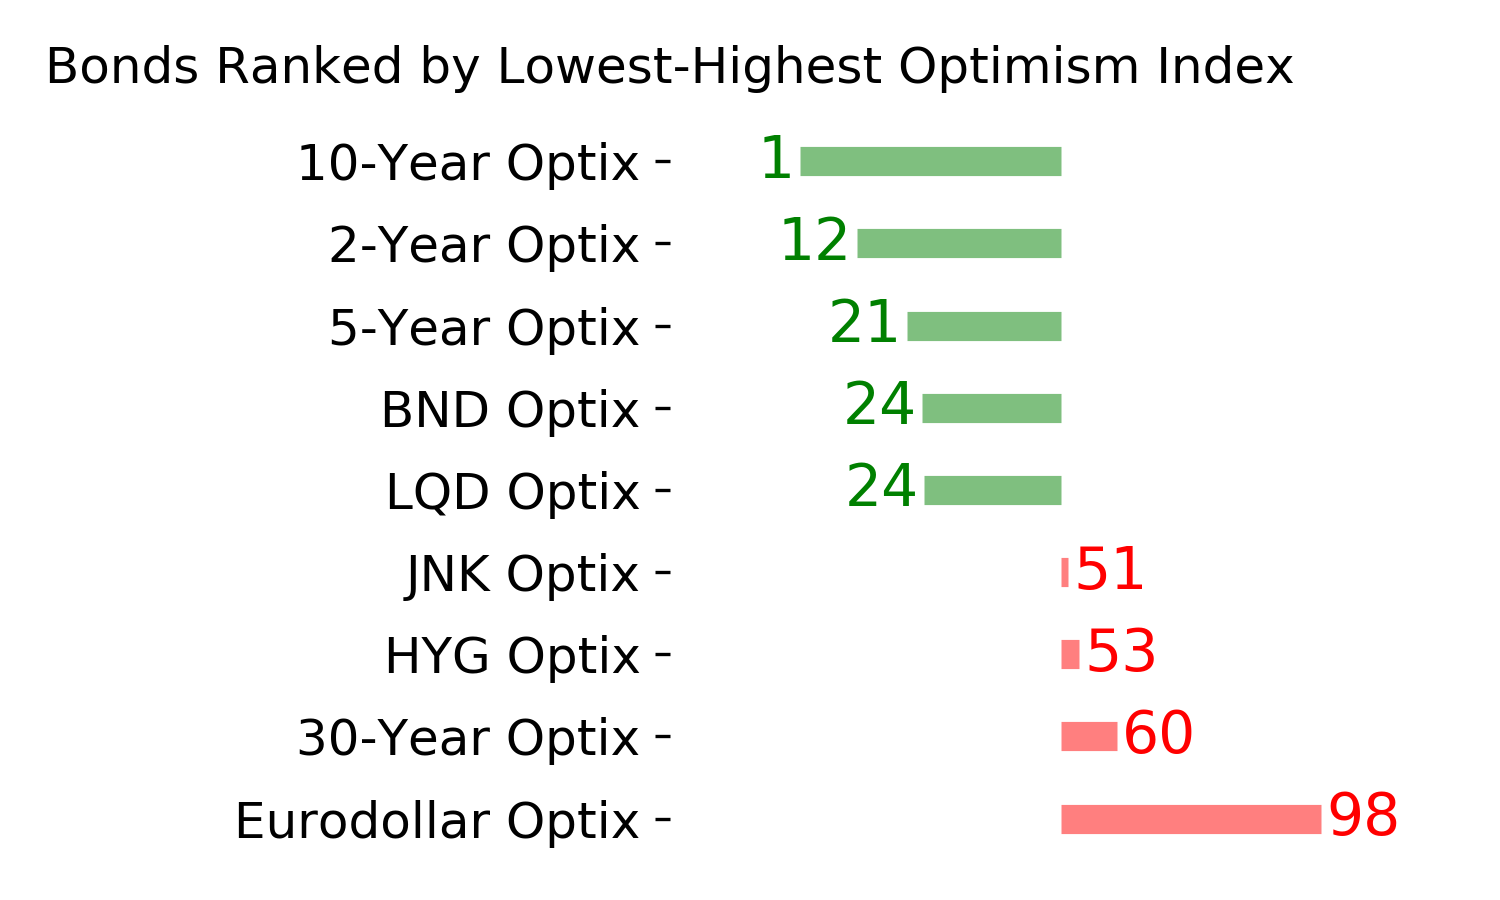
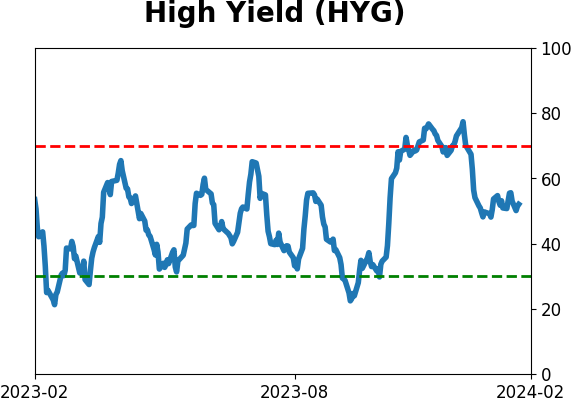
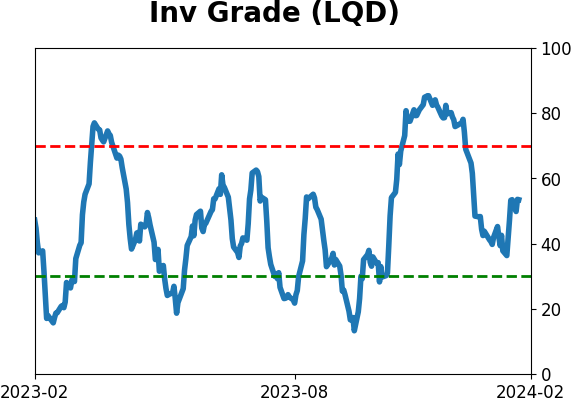
Bond ETF's - 10-Day Moving Average
|
|
|
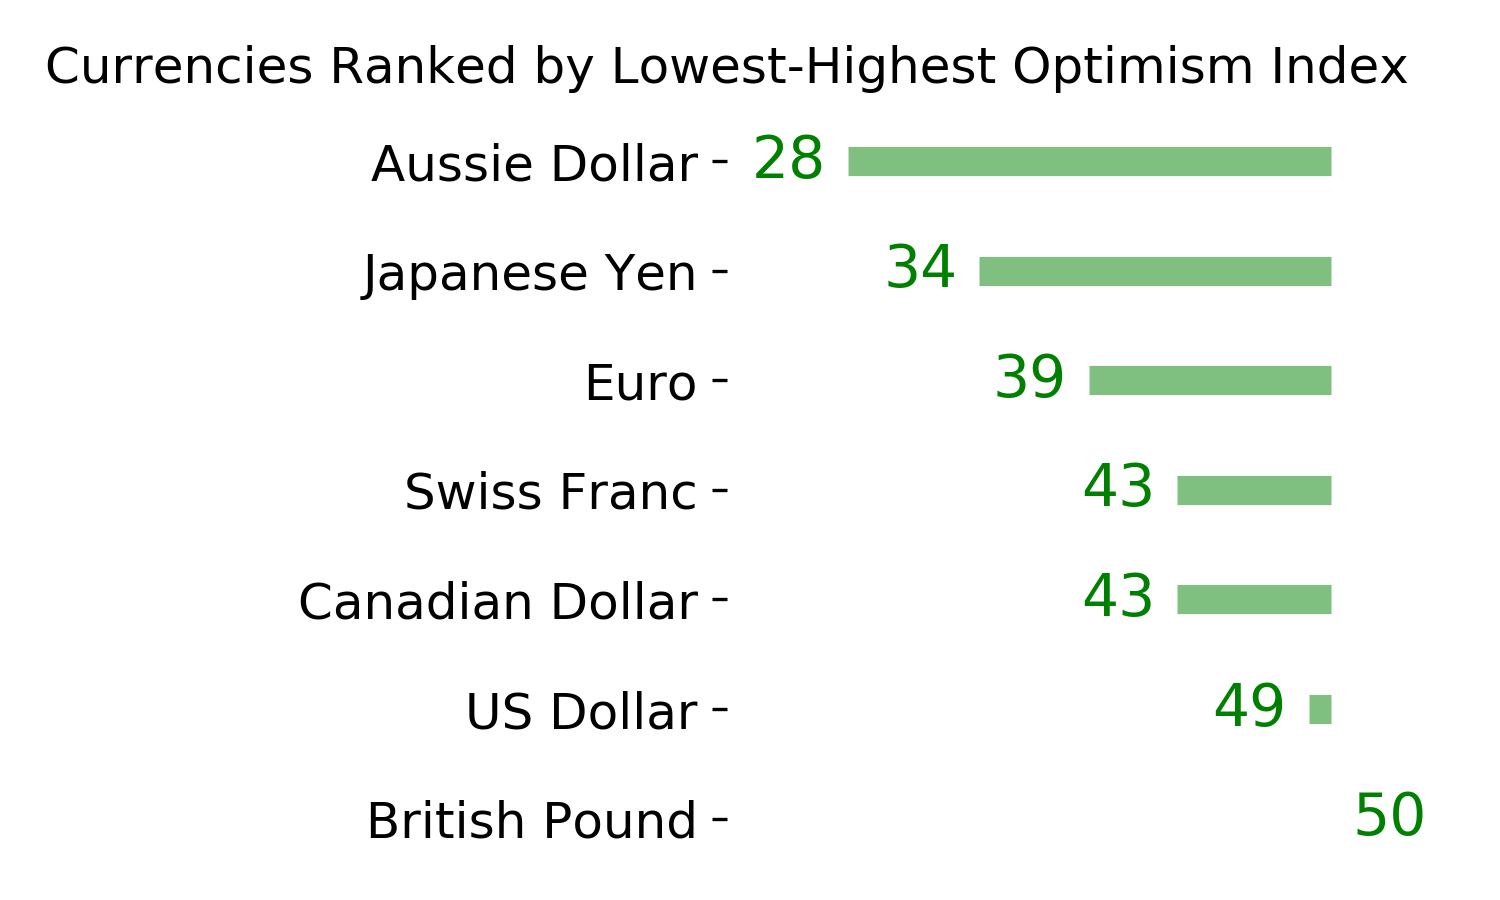
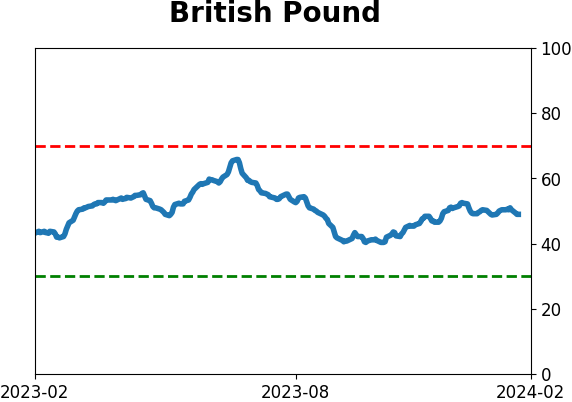
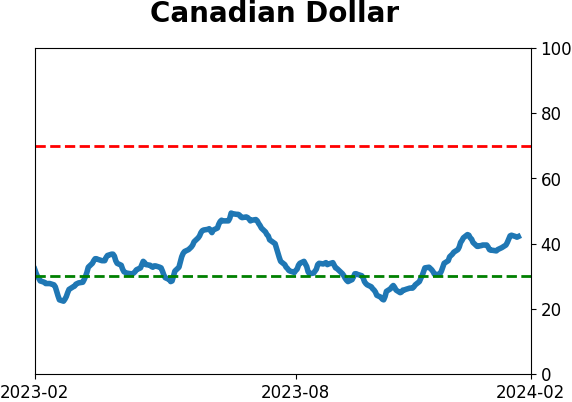
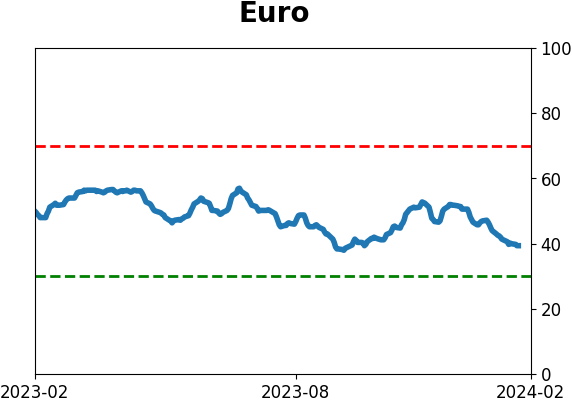
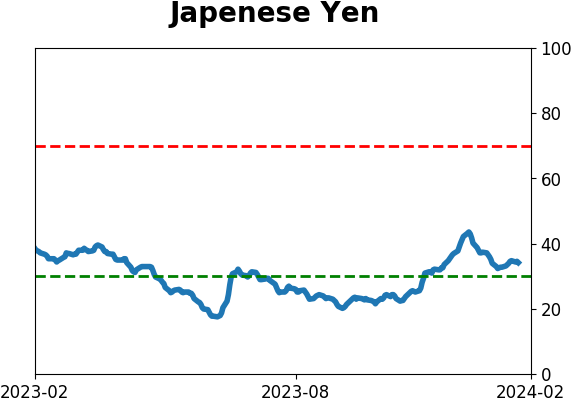
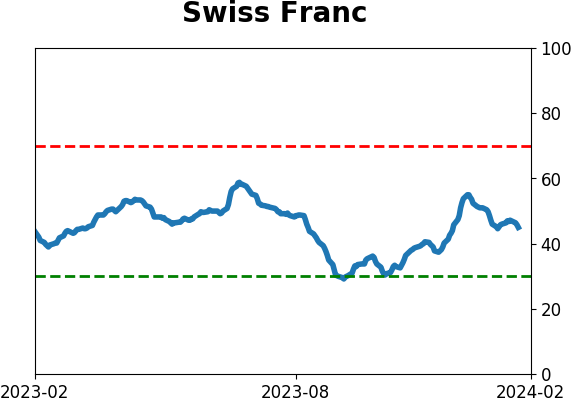
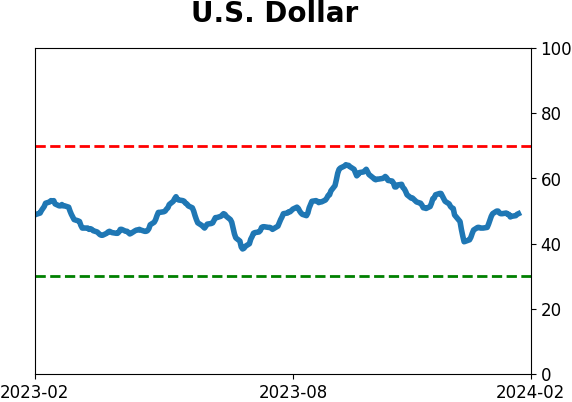
Currency ETF's - 5-Day Moving Average
|
|
|
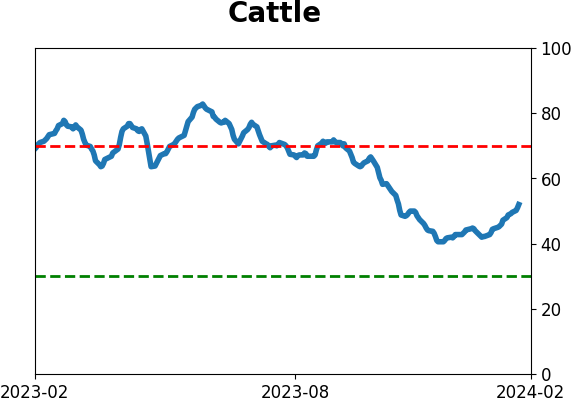
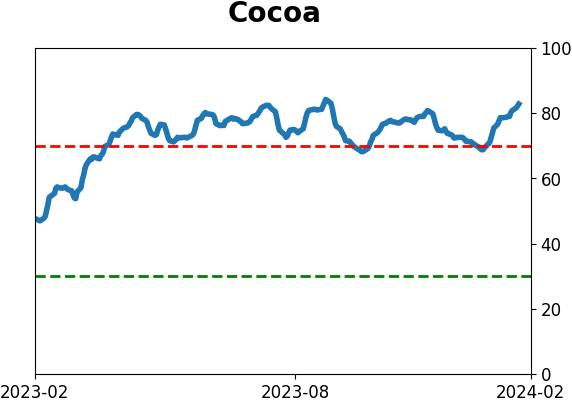
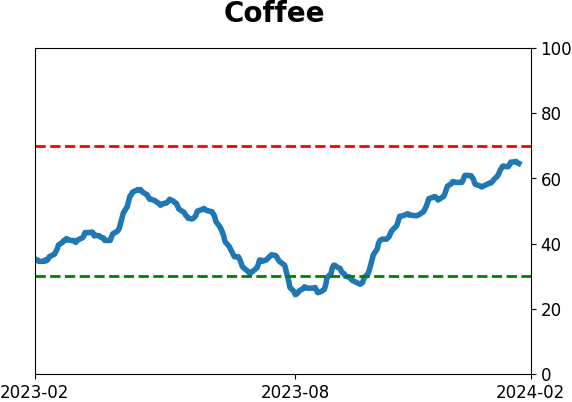
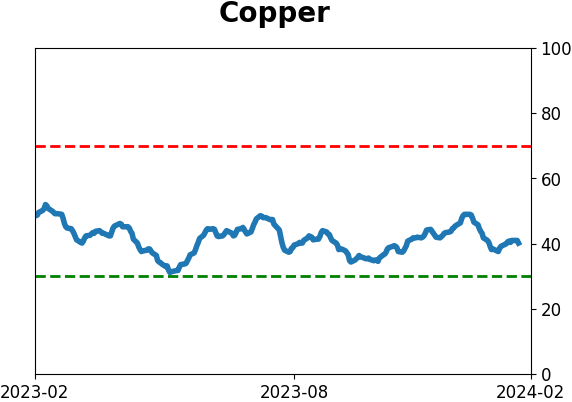
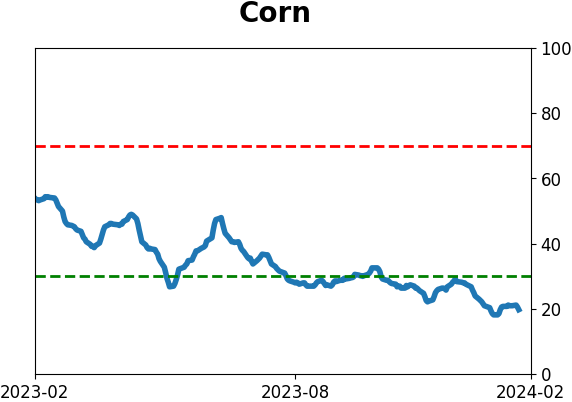
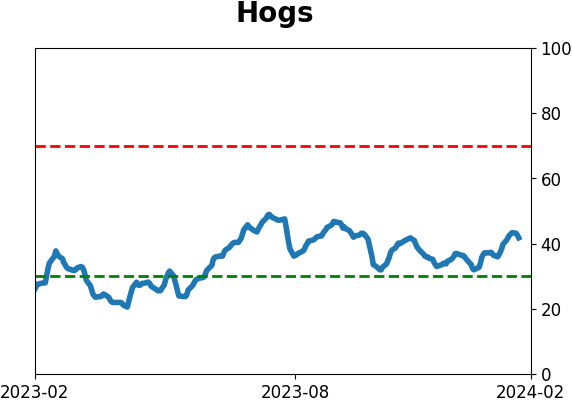
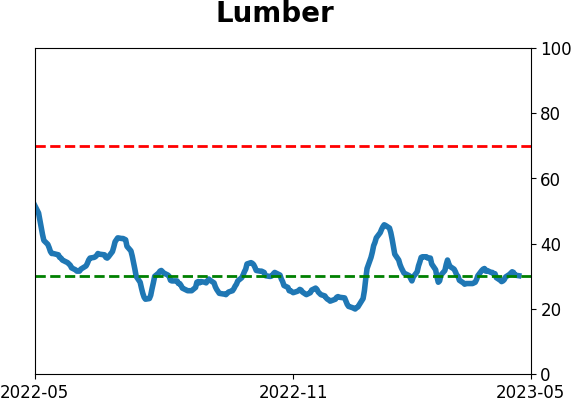
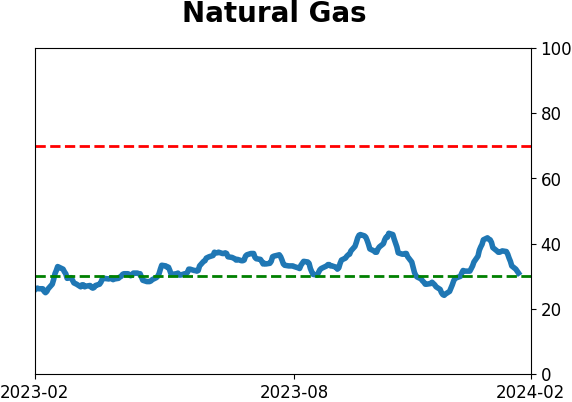
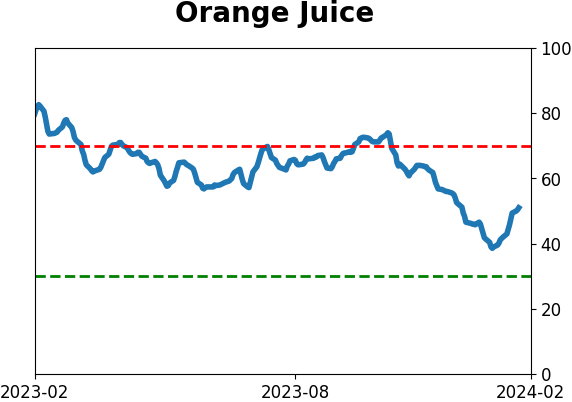
Commodity ETF's - 5-Day Moving Average
|
|