Headlines
|
|
Industry uptrends have recovered from the depths:
Last fall, all sectors and industries were in downtrends. Now more than 90% of them are trading above their 200-day moving averages. Similar cycles in uptrends among industries preceded gains in the S&P 500 every time over the next 3-6 months.
|
Smart / Dumb Money Confidence
|
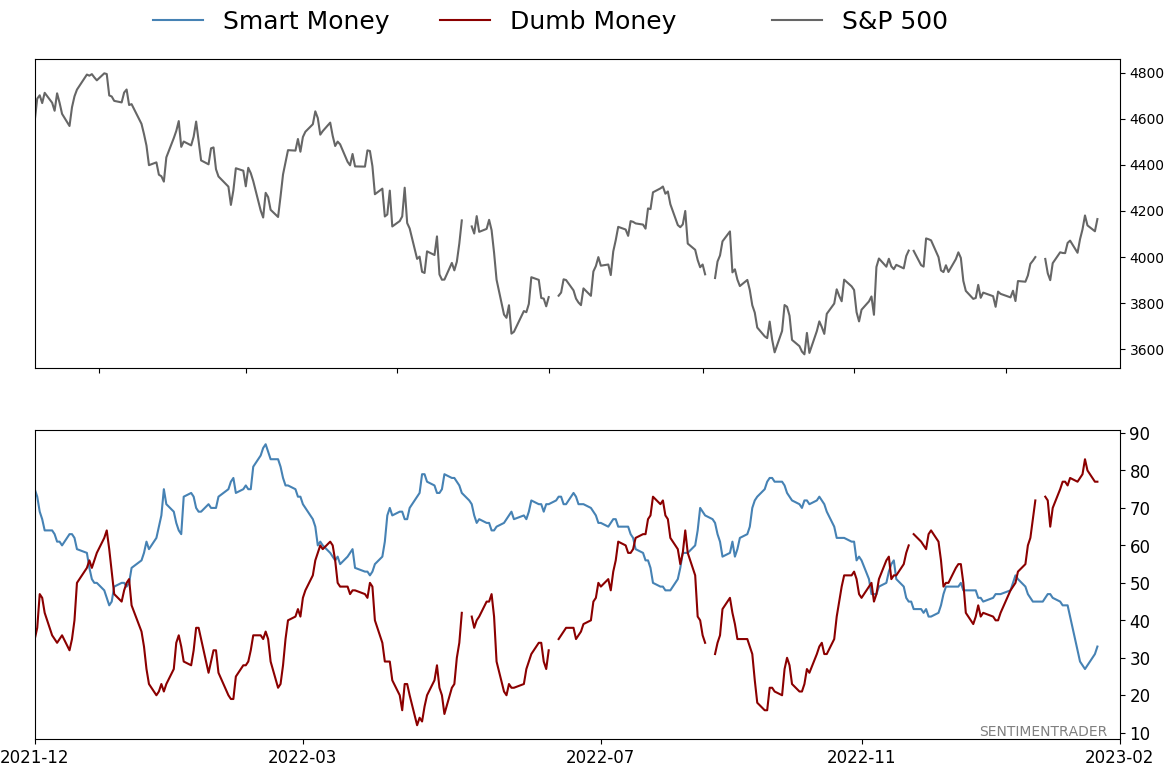
Smart Money Confidence: 33%
Dumb Money Confidence: 77%
|
|
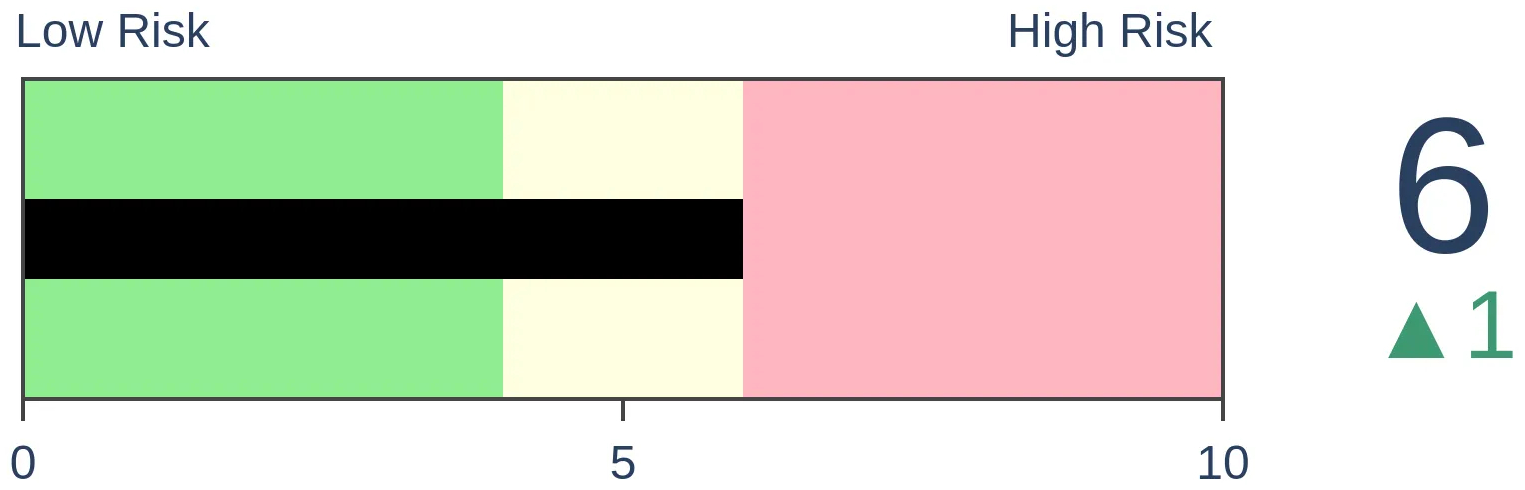
Risk Levels
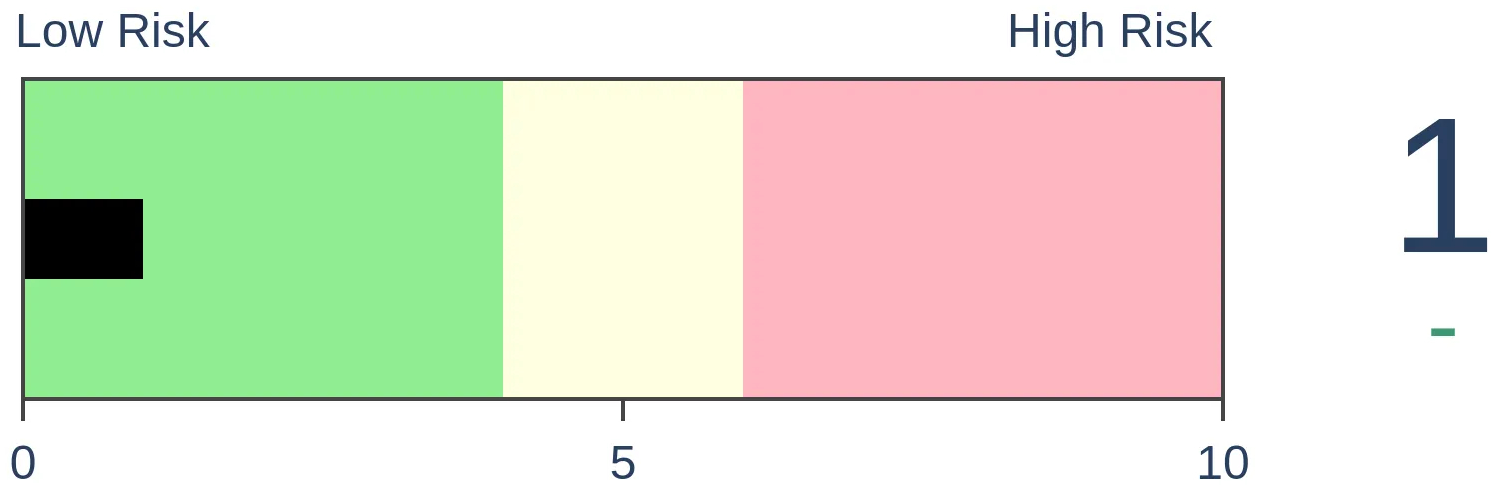
Stocks Short-Term
|
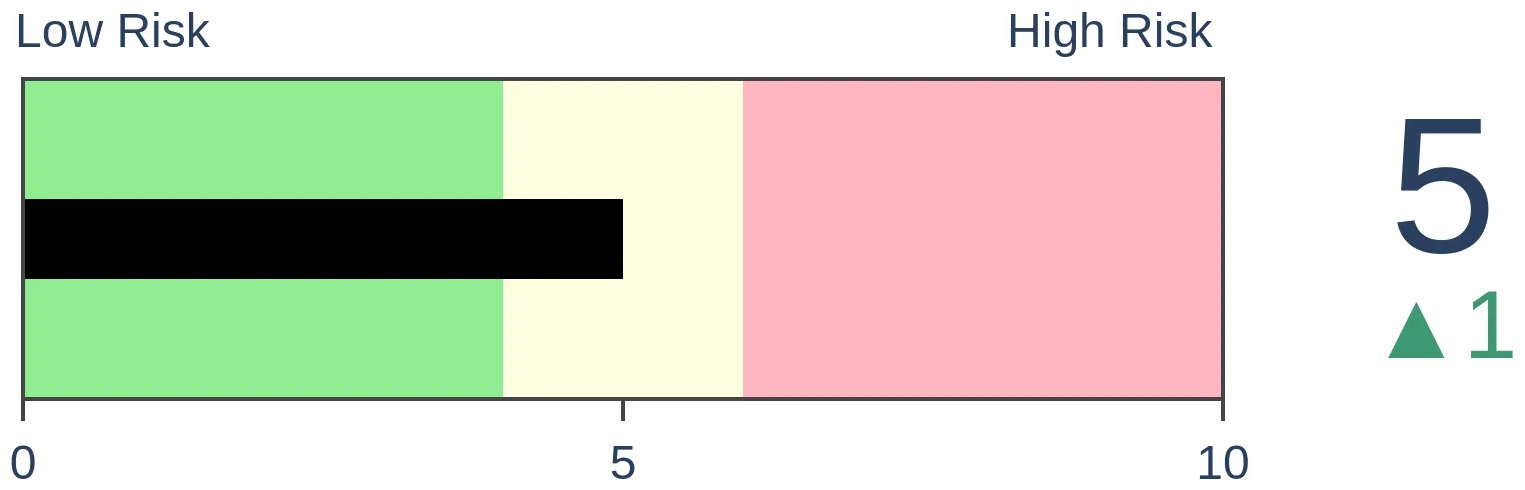
Stocks Medium-Term
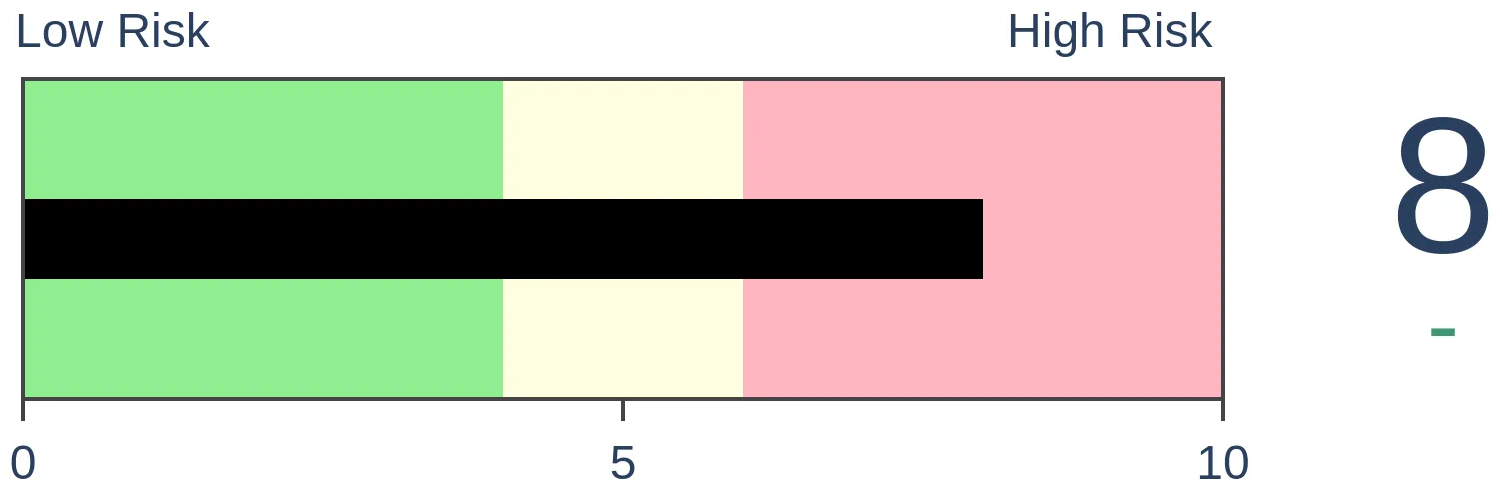
|
|
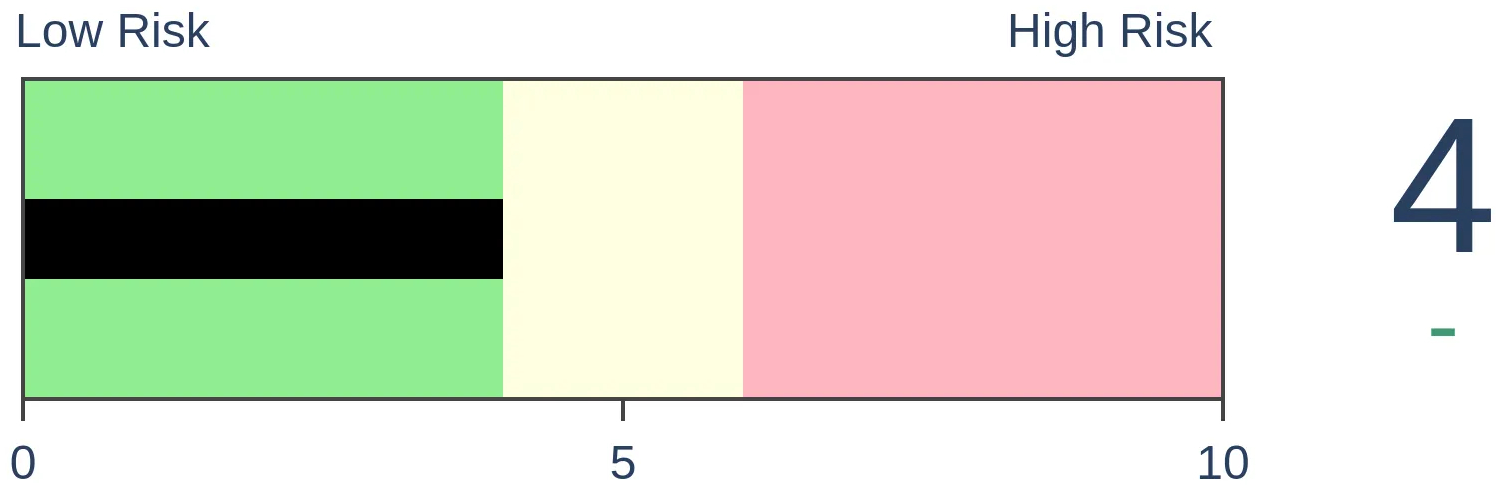
Bonds
|
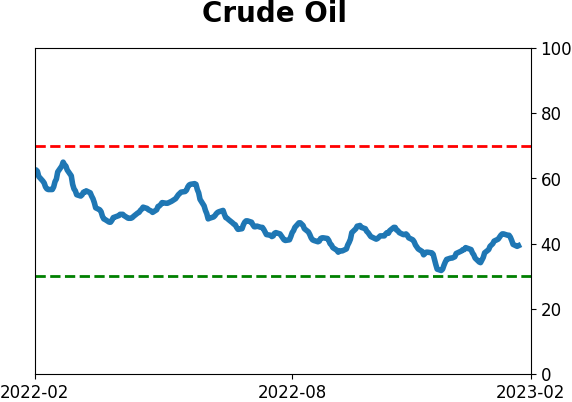
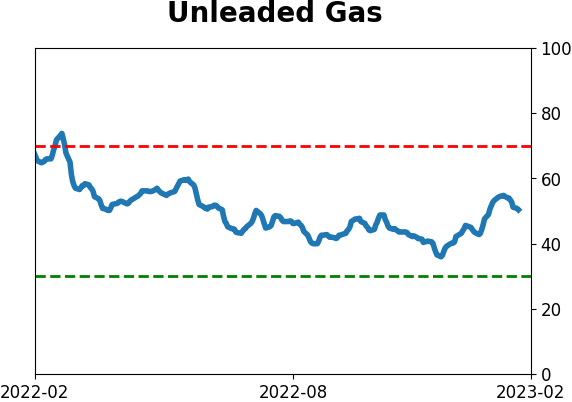
Crude Oil
|
|
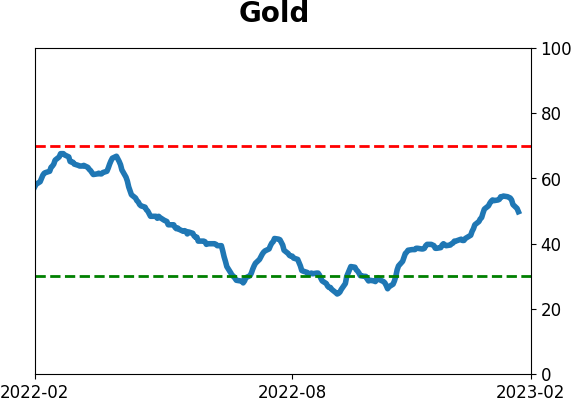
Gold
|
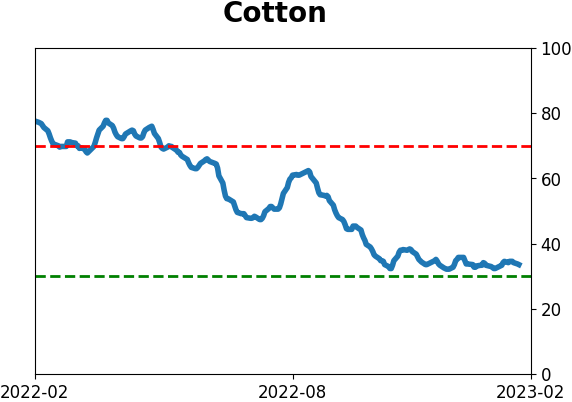
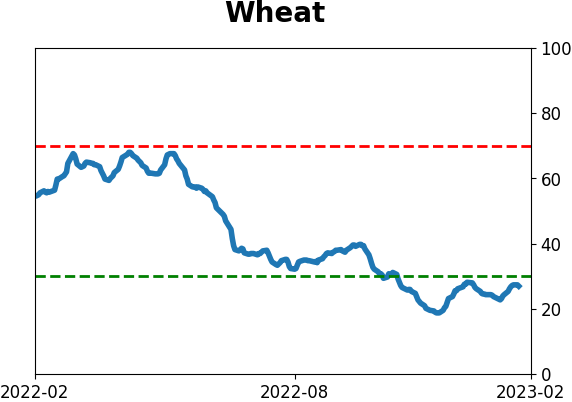
Agriculture

|
|
Research
By Jason Goepfert
BOTTOM LINE
Last fall, all sectors and industries were in downtrends. Now more than 90% of them are trading above their 200-day moving averages. Similar cycles in uptrends among industries preceded gains in the S&P 500 every time over the next 3-6 months.
FORECAST / TIMEFRAME
SPY -- Up, Medium-Term
|
Key points:
- More than 90% of sectors and industries are trading above their 200-day moving averages
- This comes on the heels of what had been few, if any, uptrends
- Similar cycles in industry trends led to higher prices in the S&P 500 over the next 3-6 months every time
Almost all sectors and industries are now in uptrends
We've seen in recent weeks how broad-based and persistent the rally over the past few months have been. It's now enough to have pushed more than 90% of sectors and industries above their 200-day moving averages. The last few times when sector trends cycled like this, it preceded further gains. Dean touched on something similar to this last week.
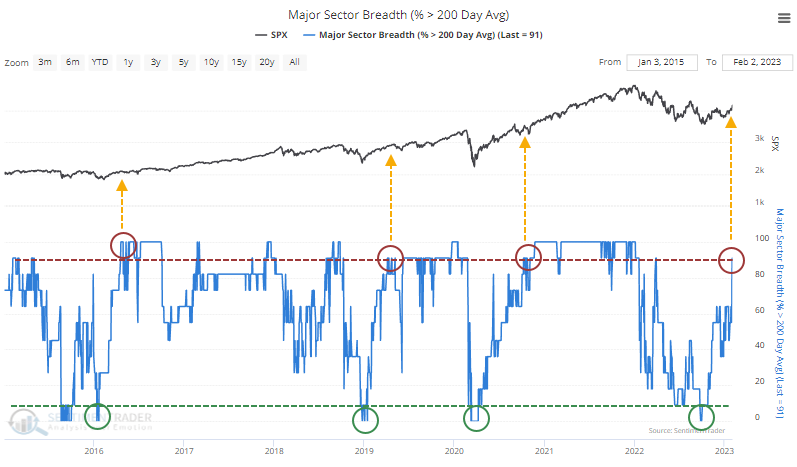
The same thing has happened with industries. This is much broader than the sector data and ostensibly more meaningful as it should be less prone to false signals. We'll focus on the industry cycles because they were pretty similar to the dates of the sector ones and are more comprehensive.
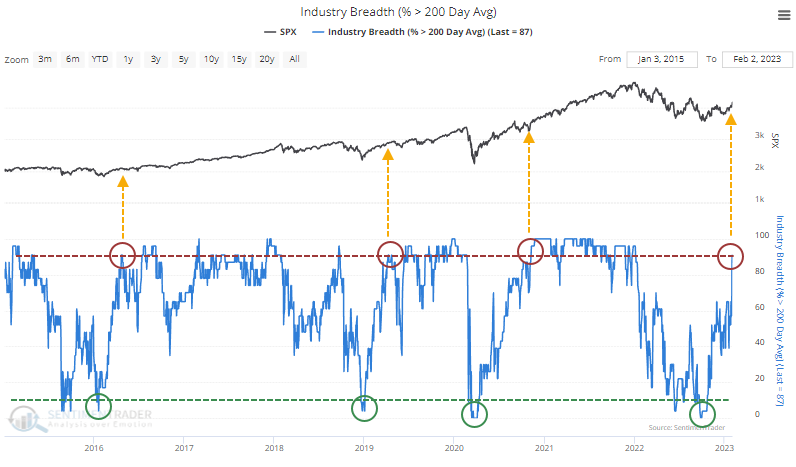
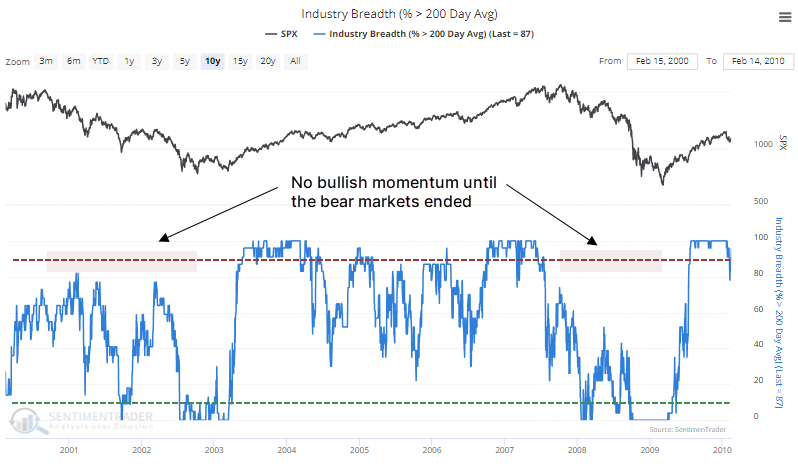
If we concentrate on the percentage of industries trading above their 200-day averages, which just exceeded 90%, this figure never exceeded 82% during the 2000-2002 and 2007-2008 bear markets. This is another data point suggesting investors' behavior now is different than it was amid the last two protracted declines.
Industry uptrends cycling from a very low to a very high level lead to gains
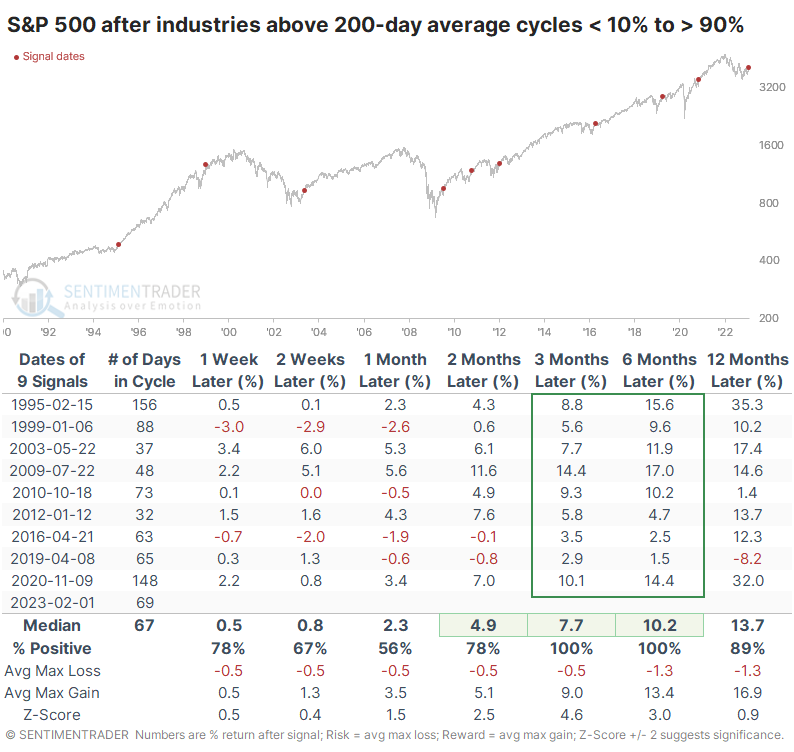
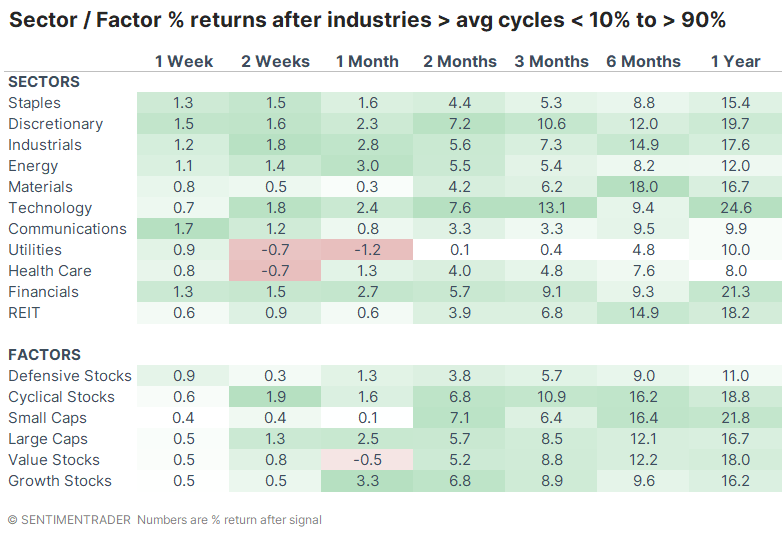
Whenever the percentage of industries above their long-term averages cycled from fewer than 10% to more than 90%, the S&P 500 never showed a negative return over the next three or six months. Its average returns were well above average, with low risk.
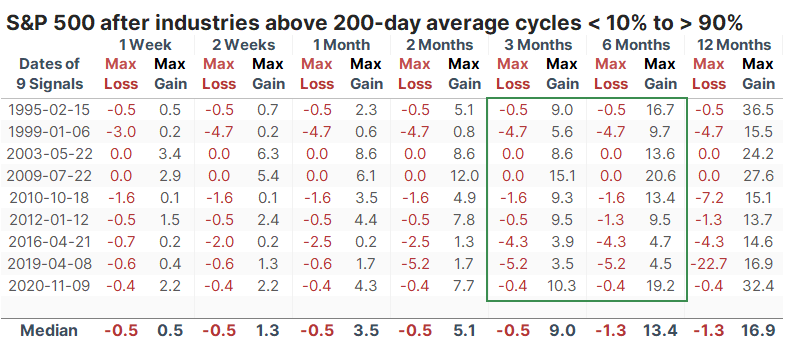
The table of maximum losses and gains over each time frame shows how limited the former was. At no point within the next six months did any signal lose more than 5.2%.
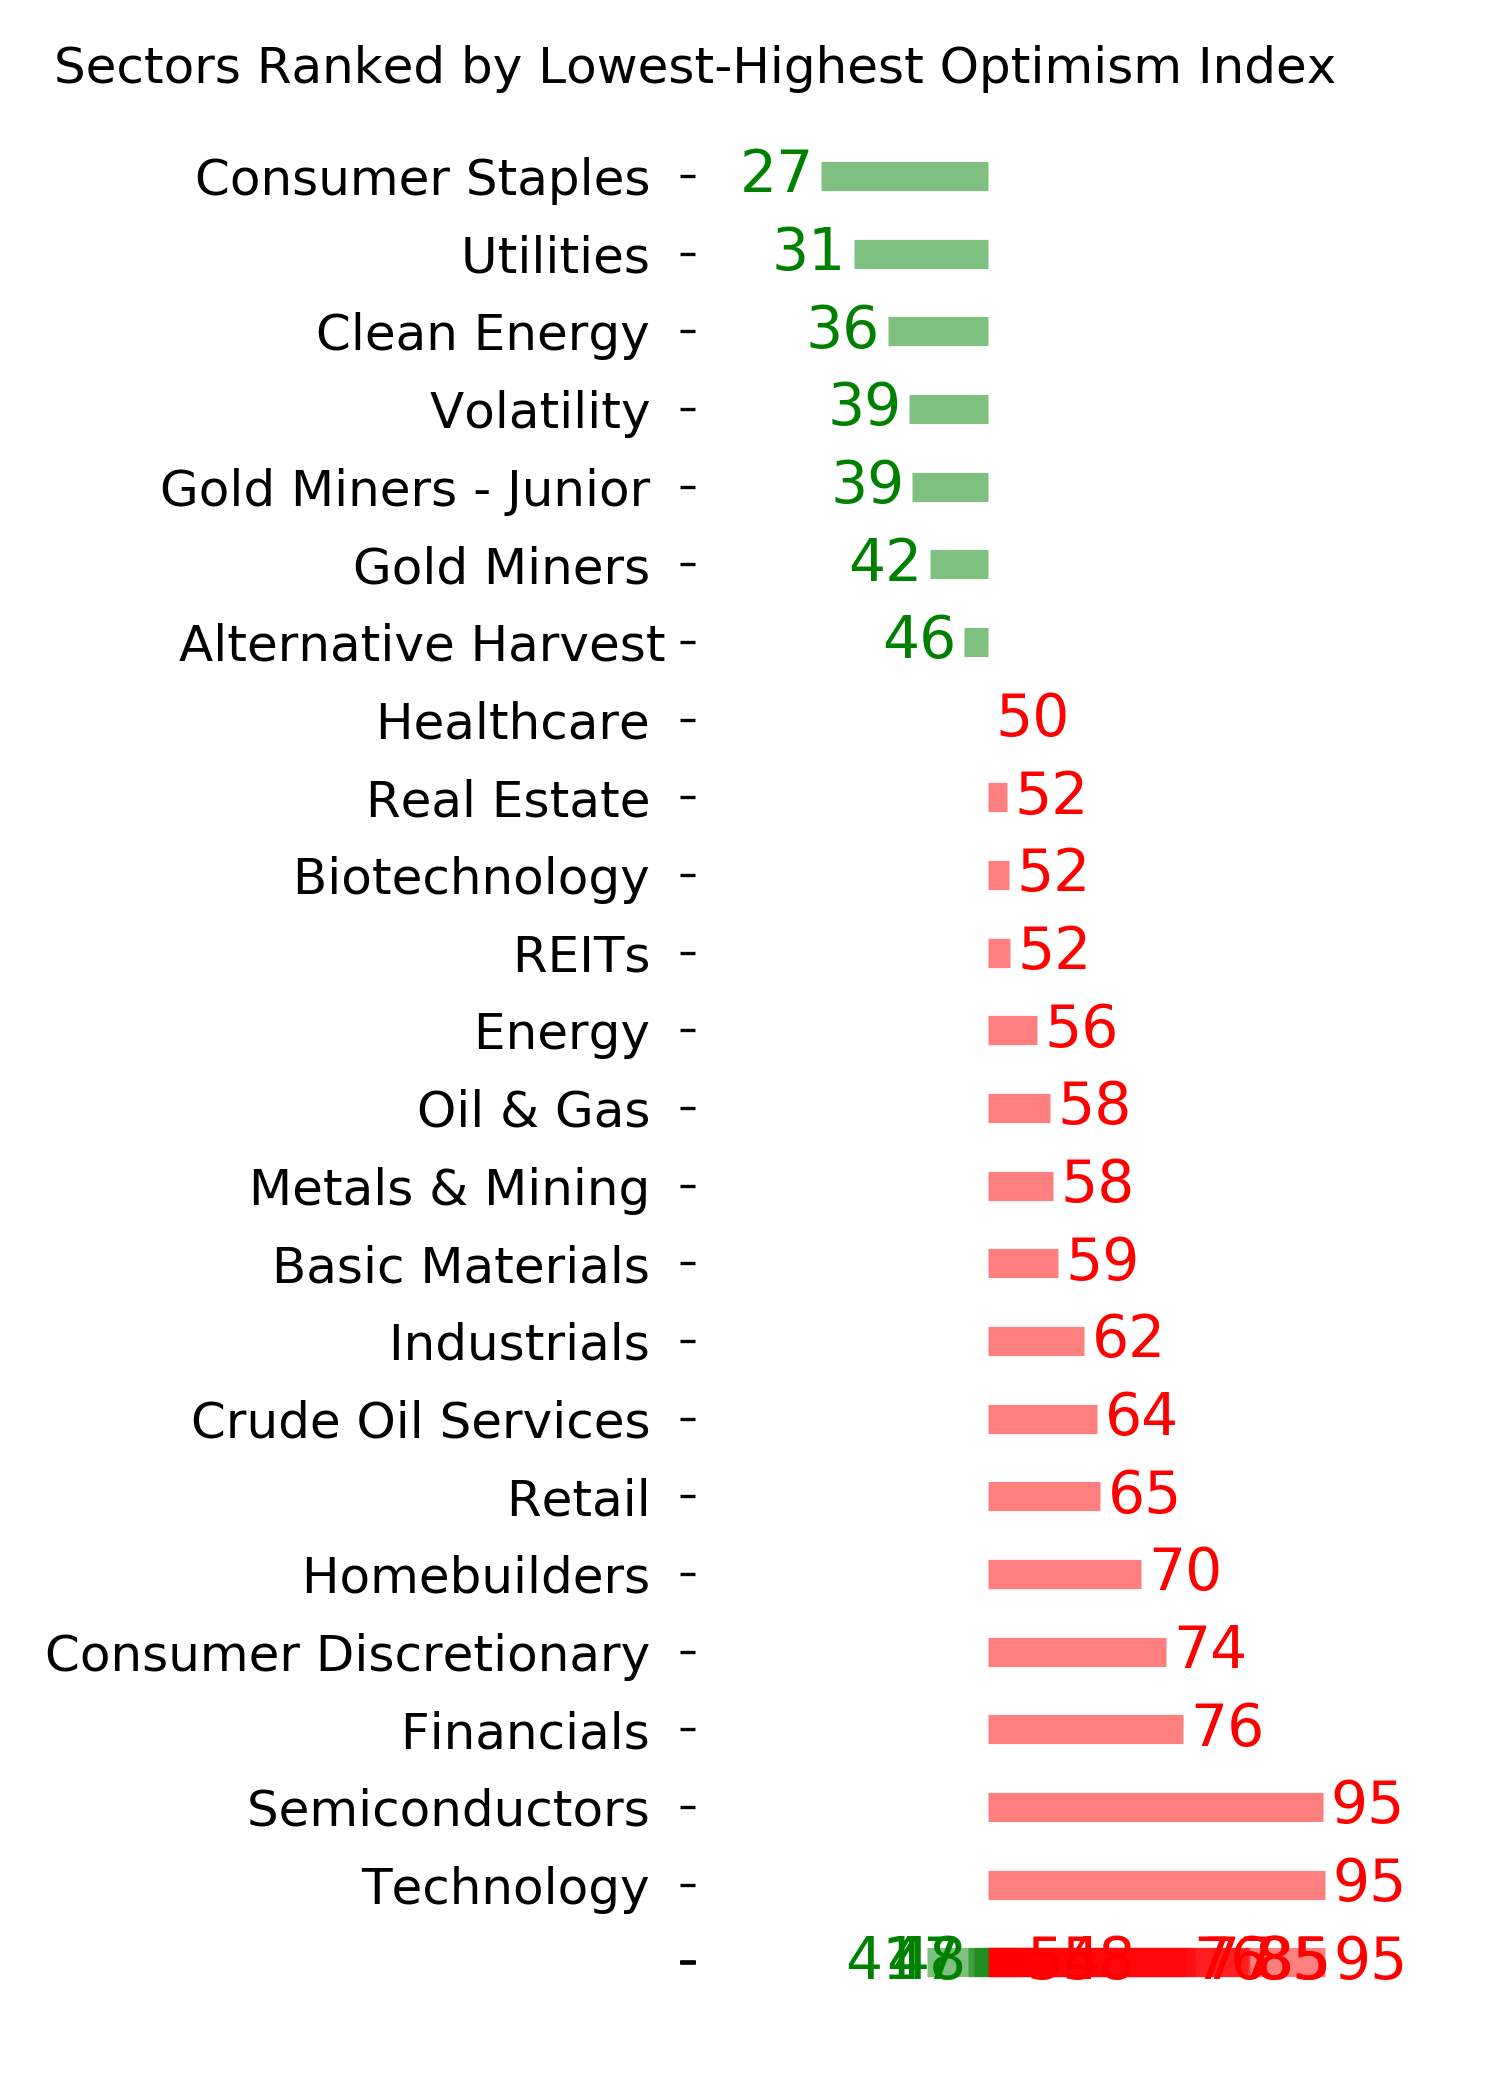
After these signals, defensive sectors were not the place to be. Utilities and Health Care show the lowest average returns, while Technology, Financial, Discretionary (and Cyclical stocks in general), and Small-Caps enjoyed the largest average returns.
What the research tells us...
For good reason, much ink has been spilled on breadth thrusts over the past month. While there are reasons to suspect the data, including 2022 failures and their increasing popularity, the types of internal participation we've witnessed across indexes, sectors, and even bonds, have never occurred during protracted bear markets. This time could obviously be the first time, but we prefer to use history to guide how investors behaved in the past and will likely repeat in the future.
Indicators at Extremes
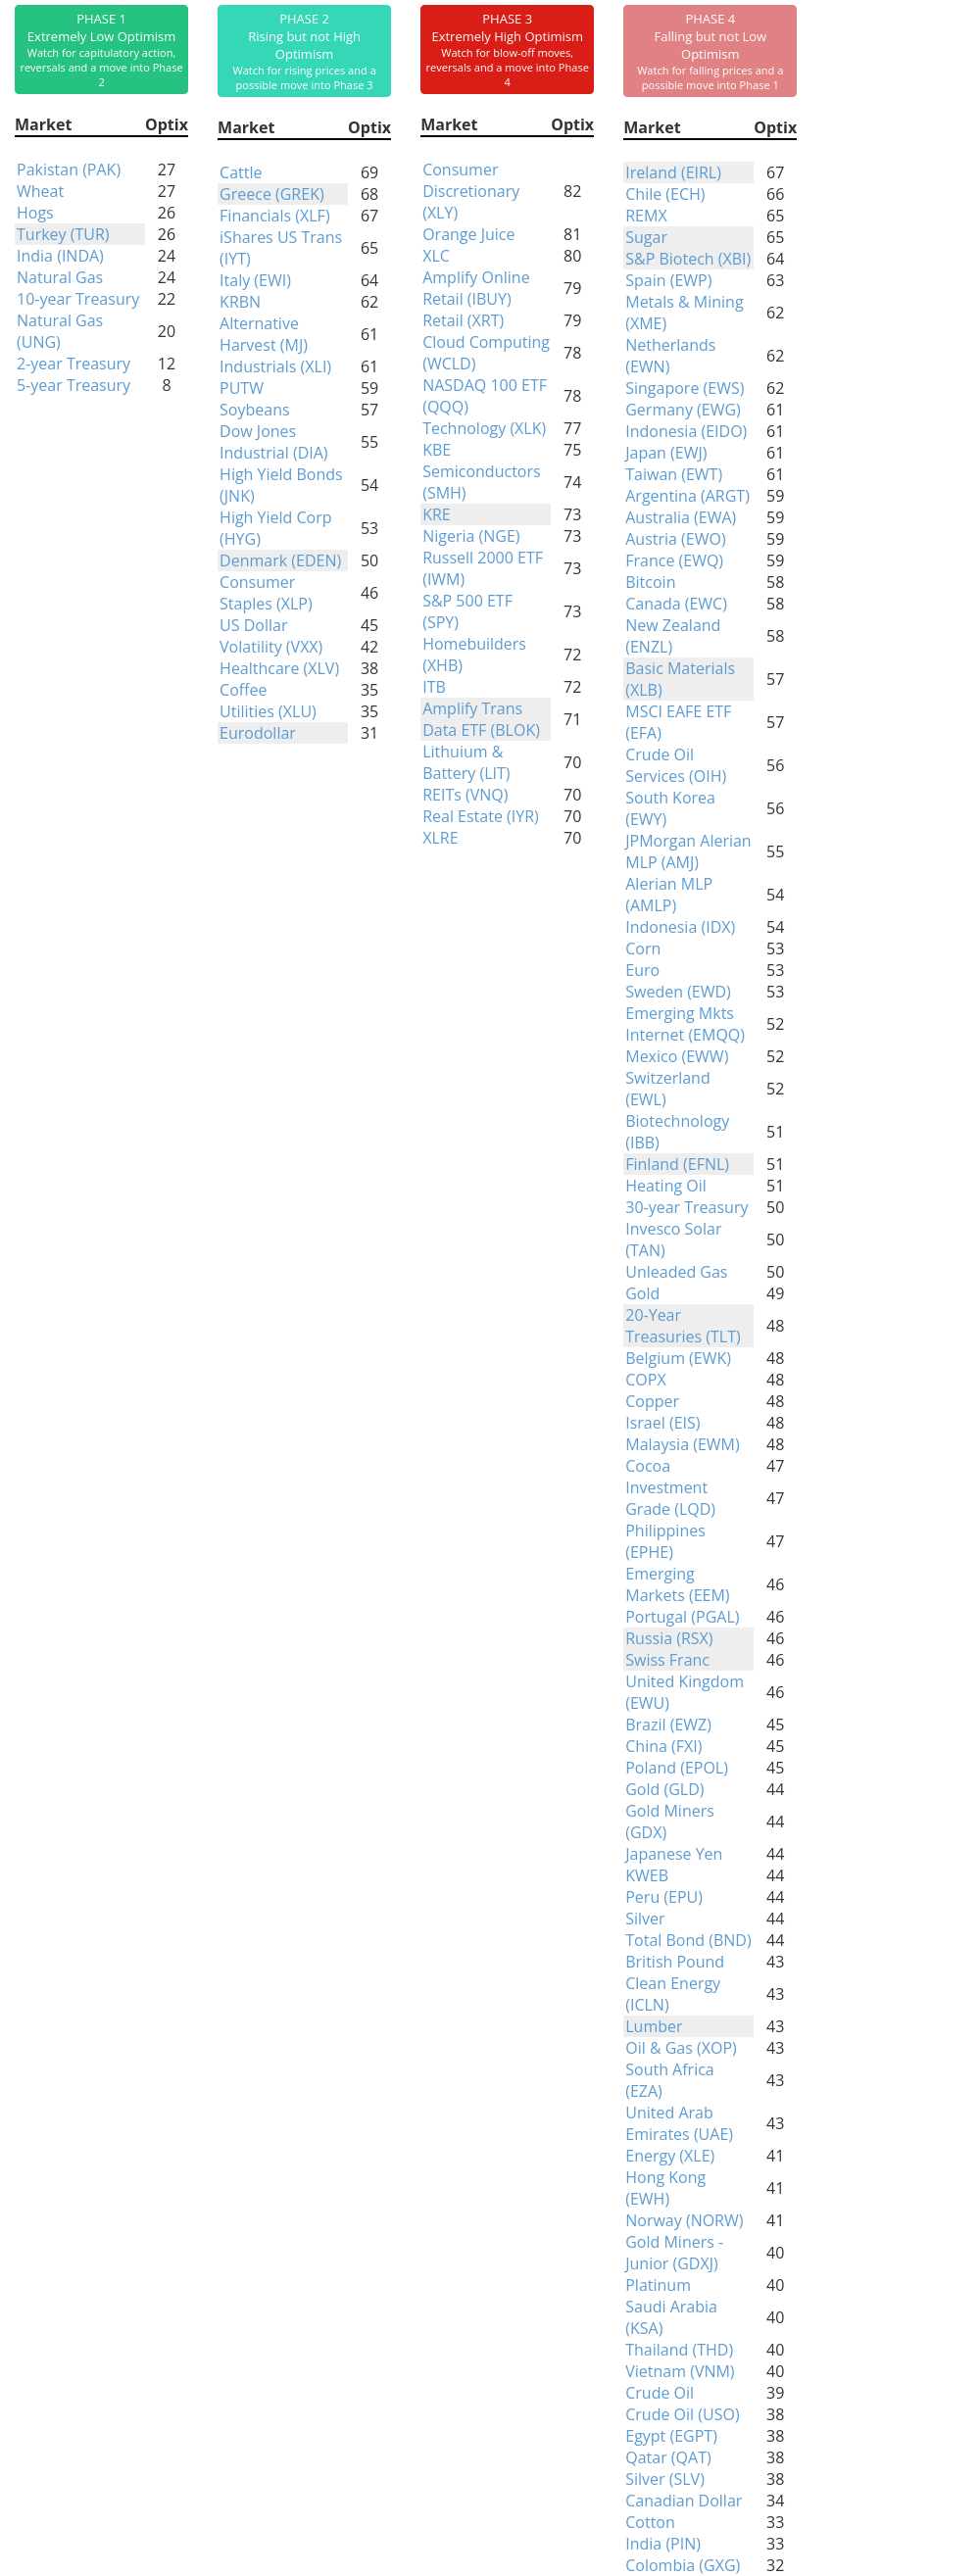
Phase Table
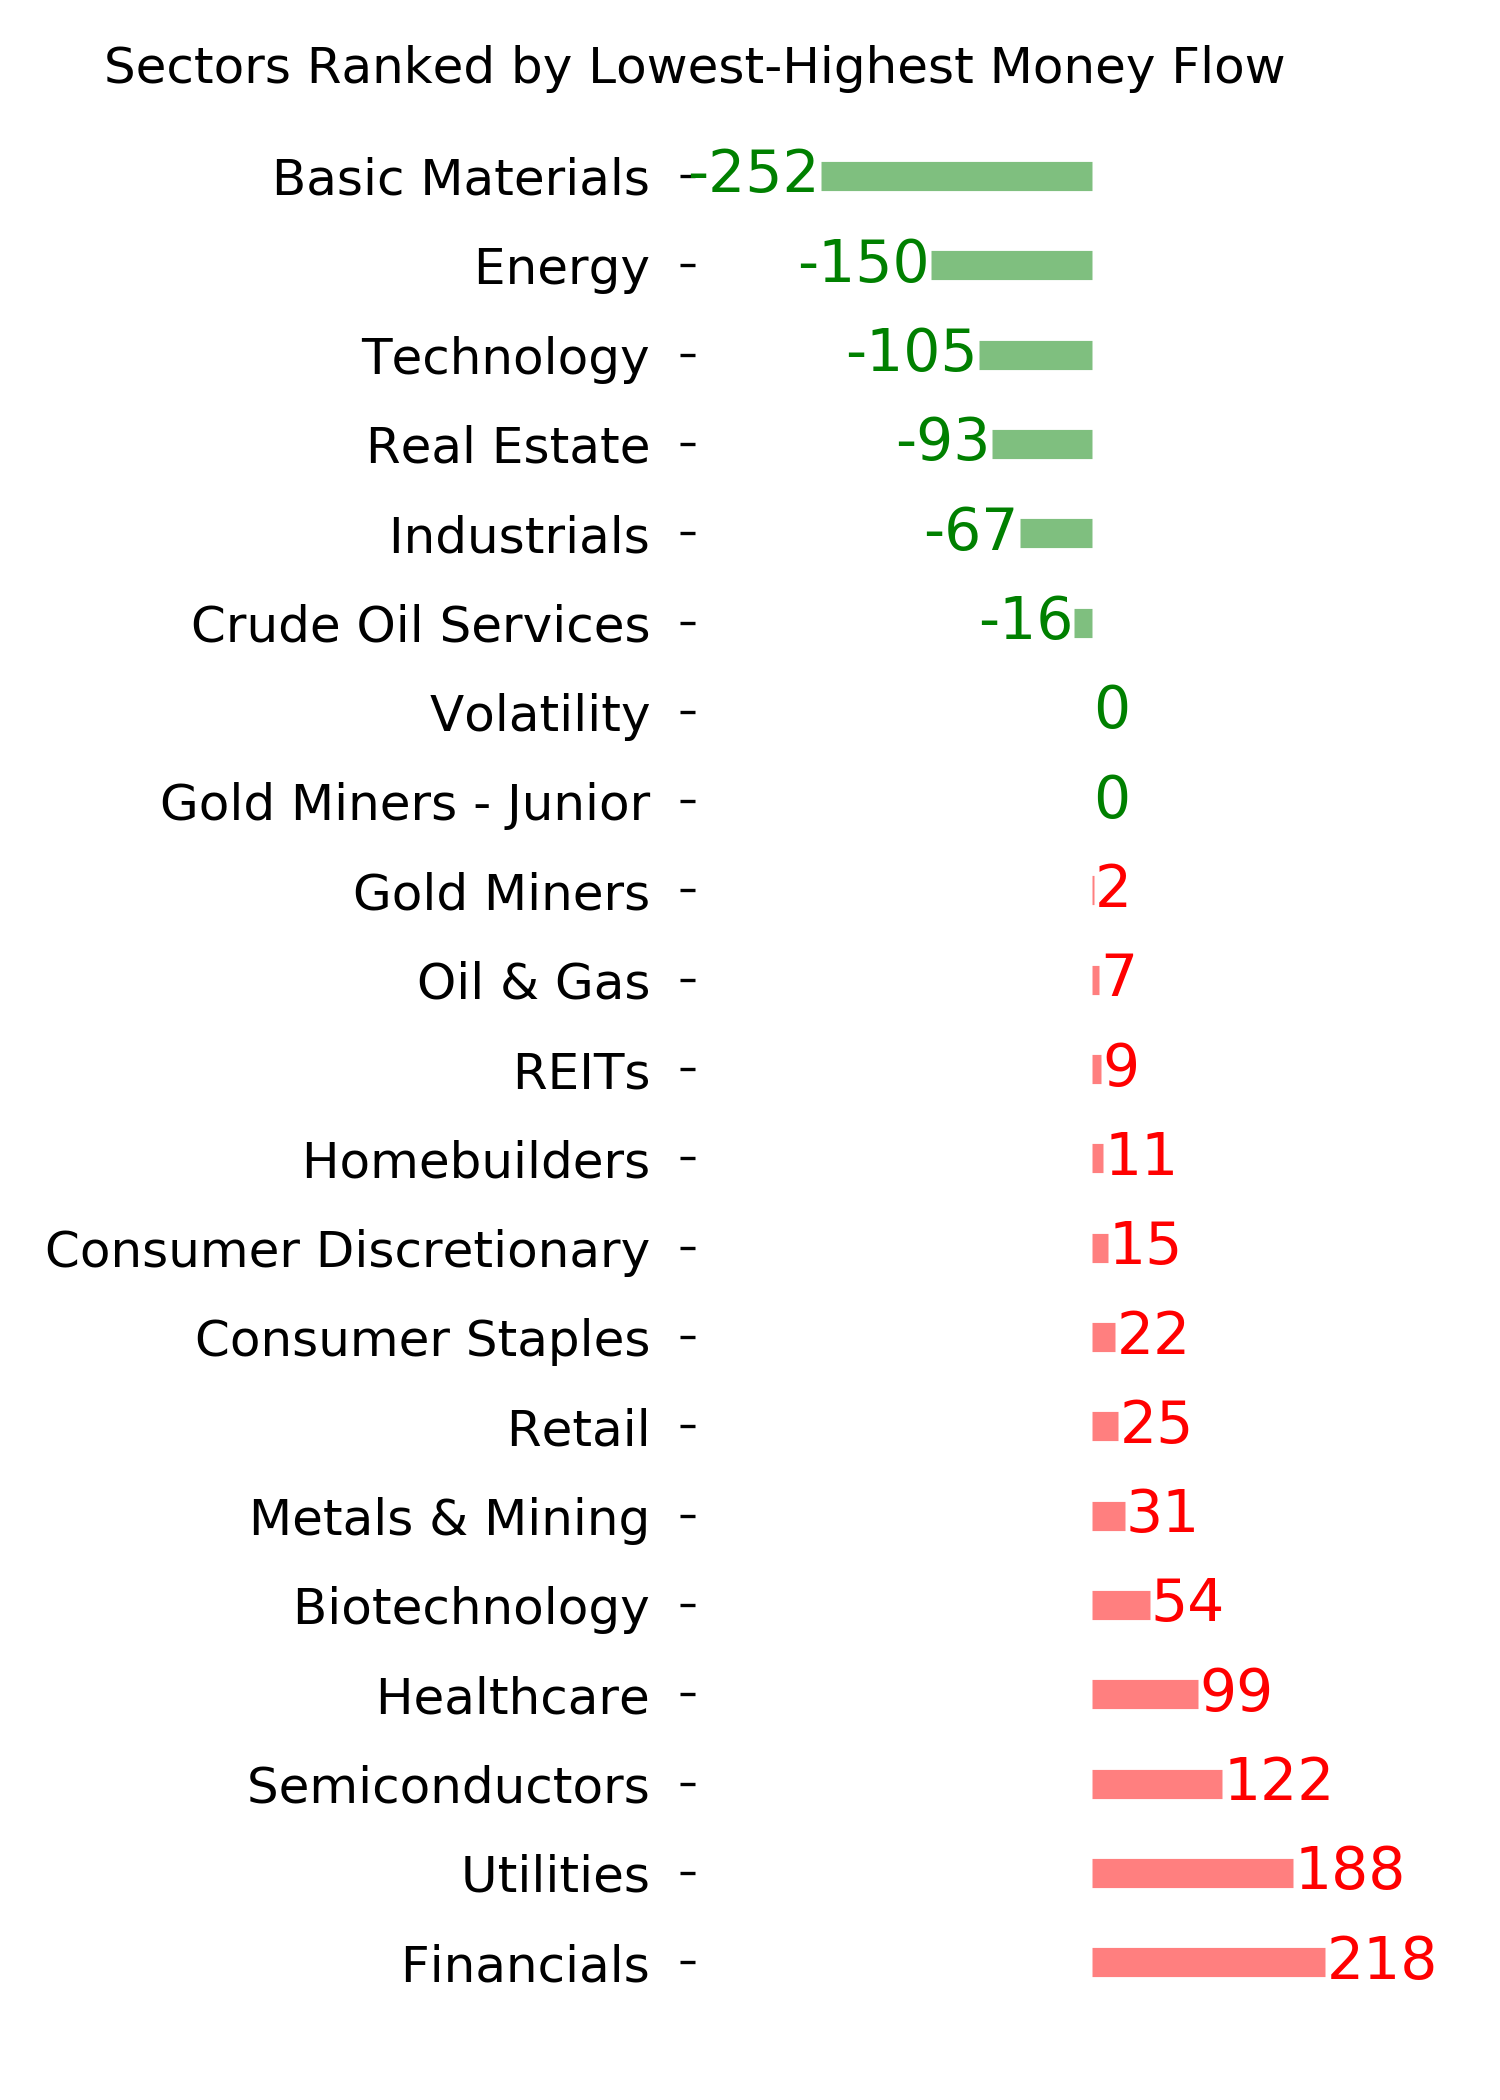
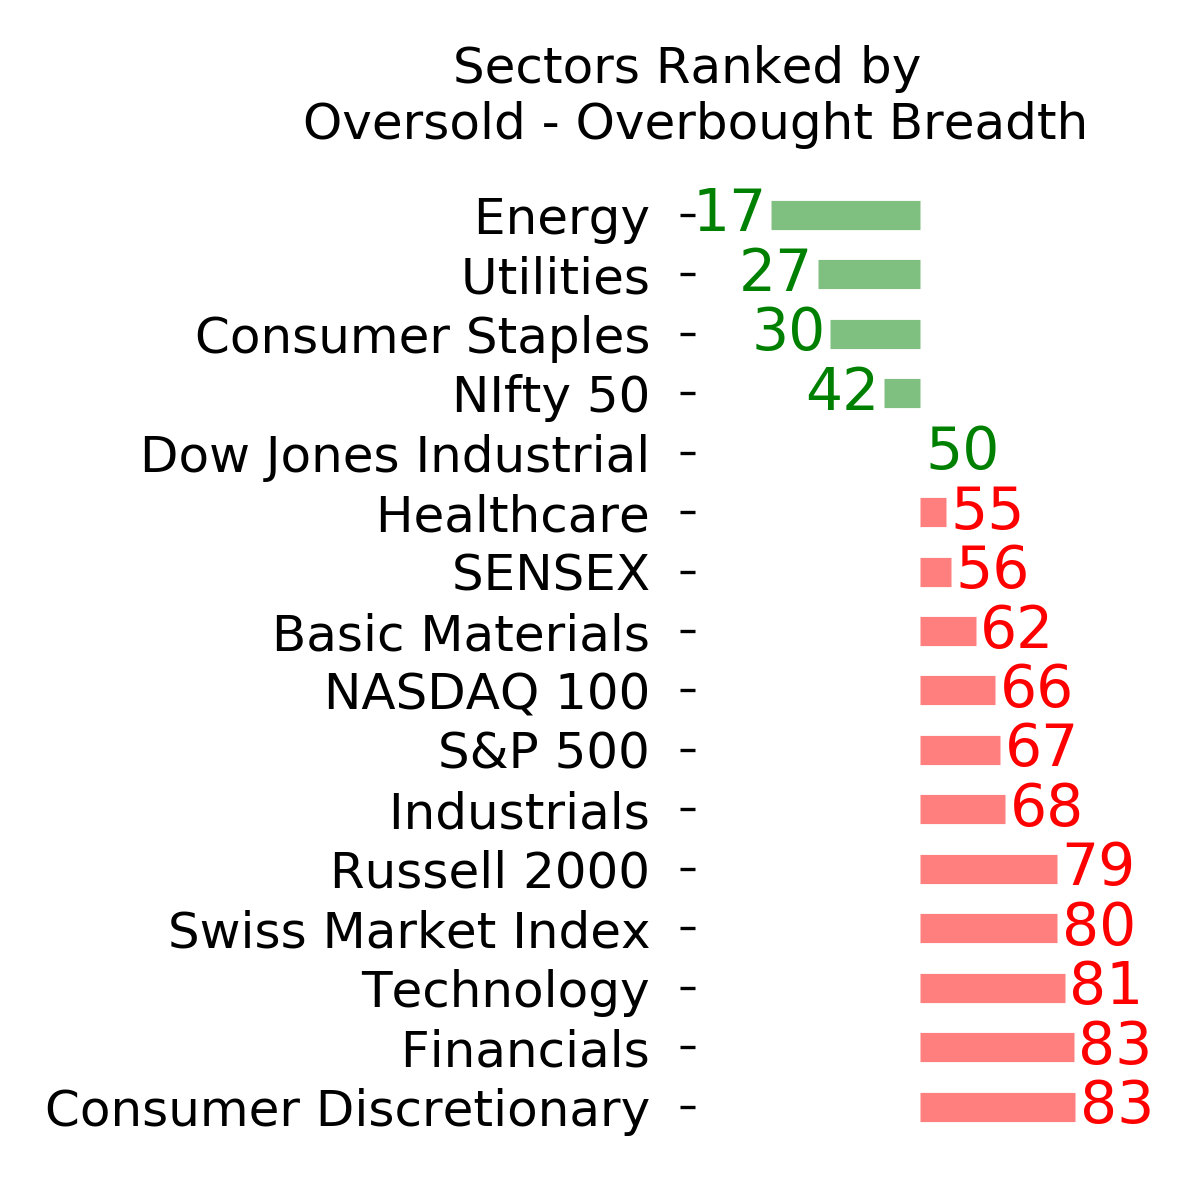
Ranks
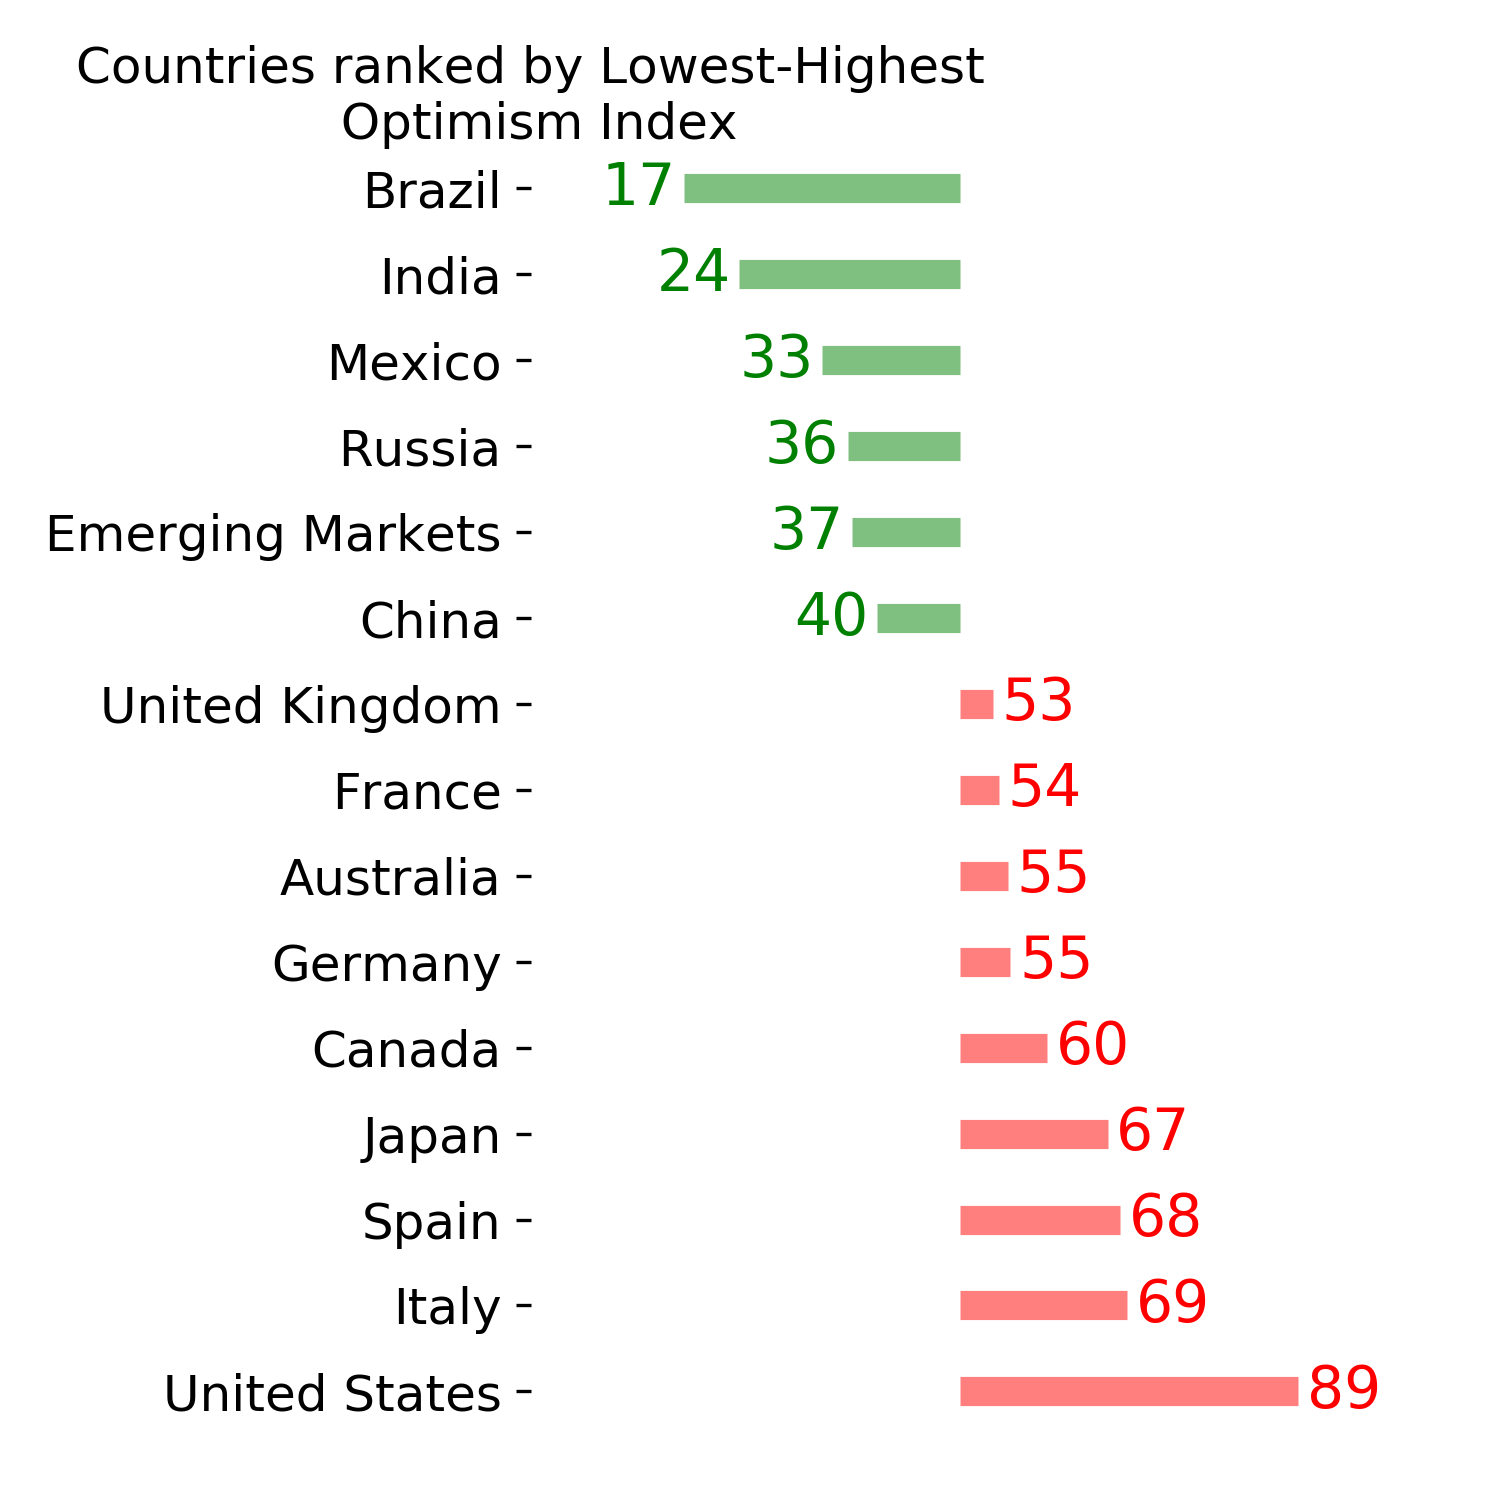
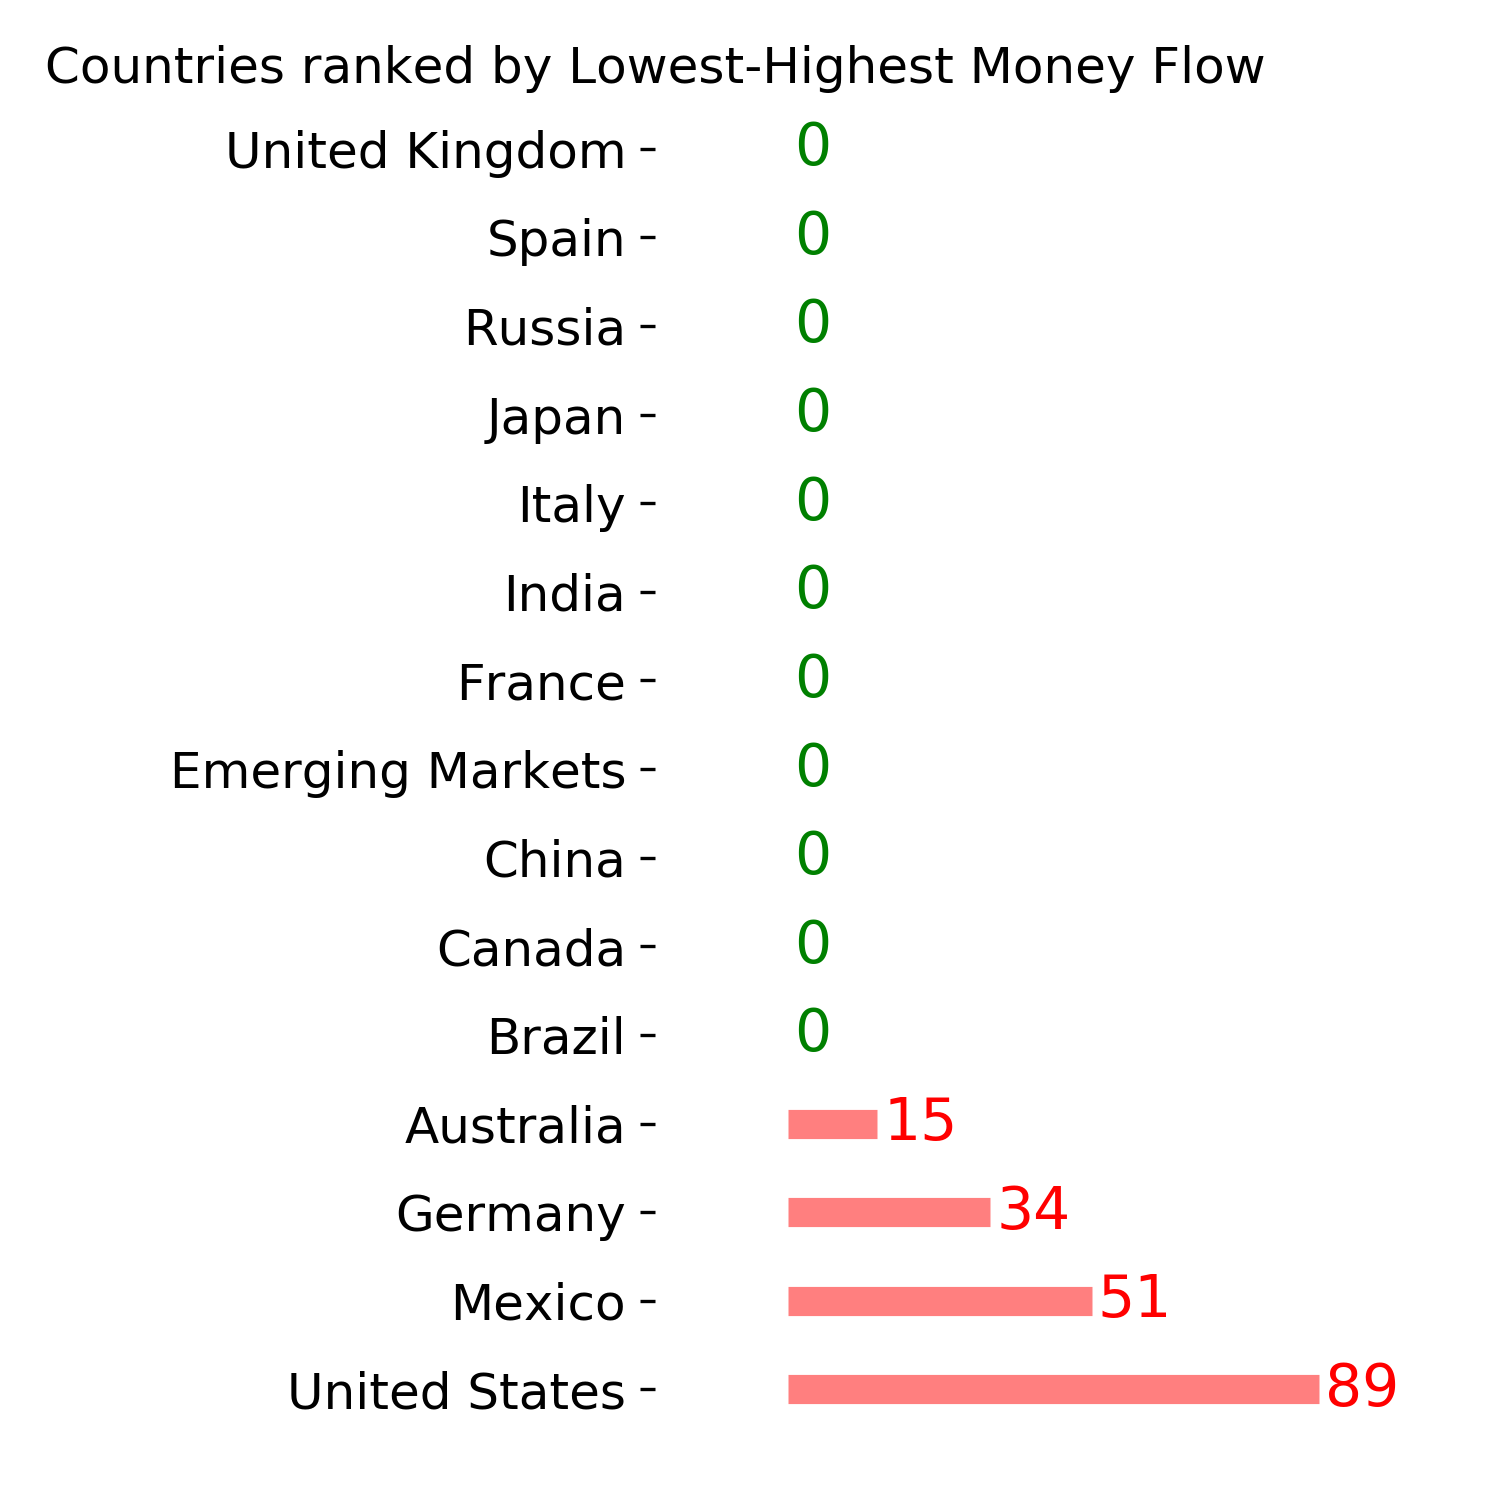
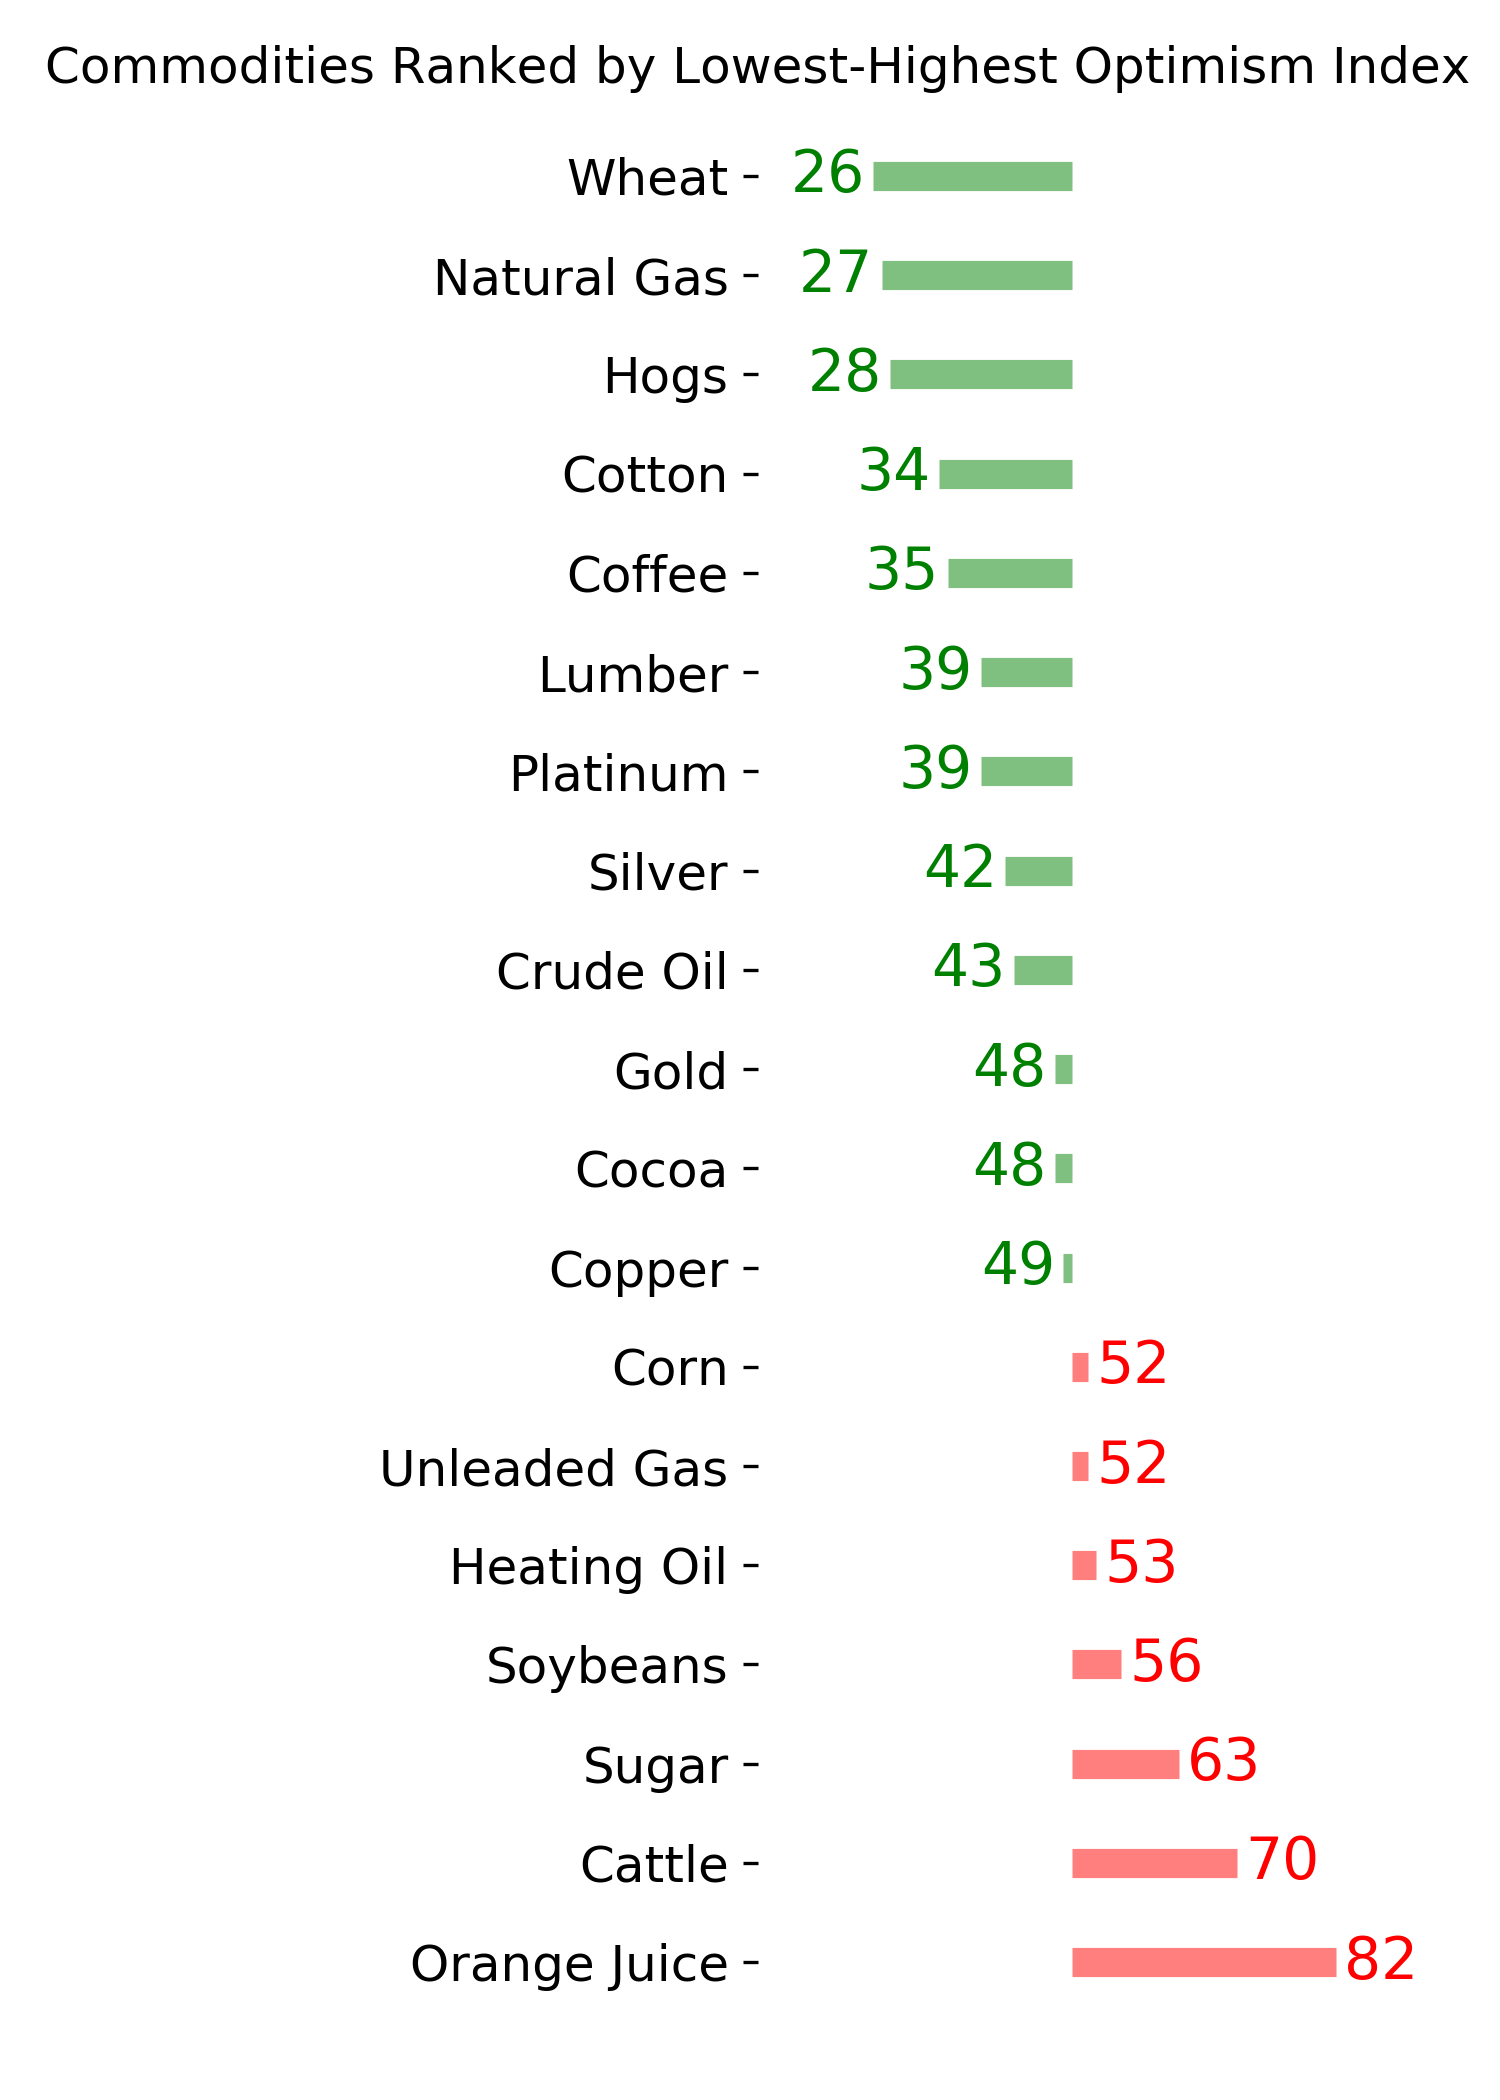
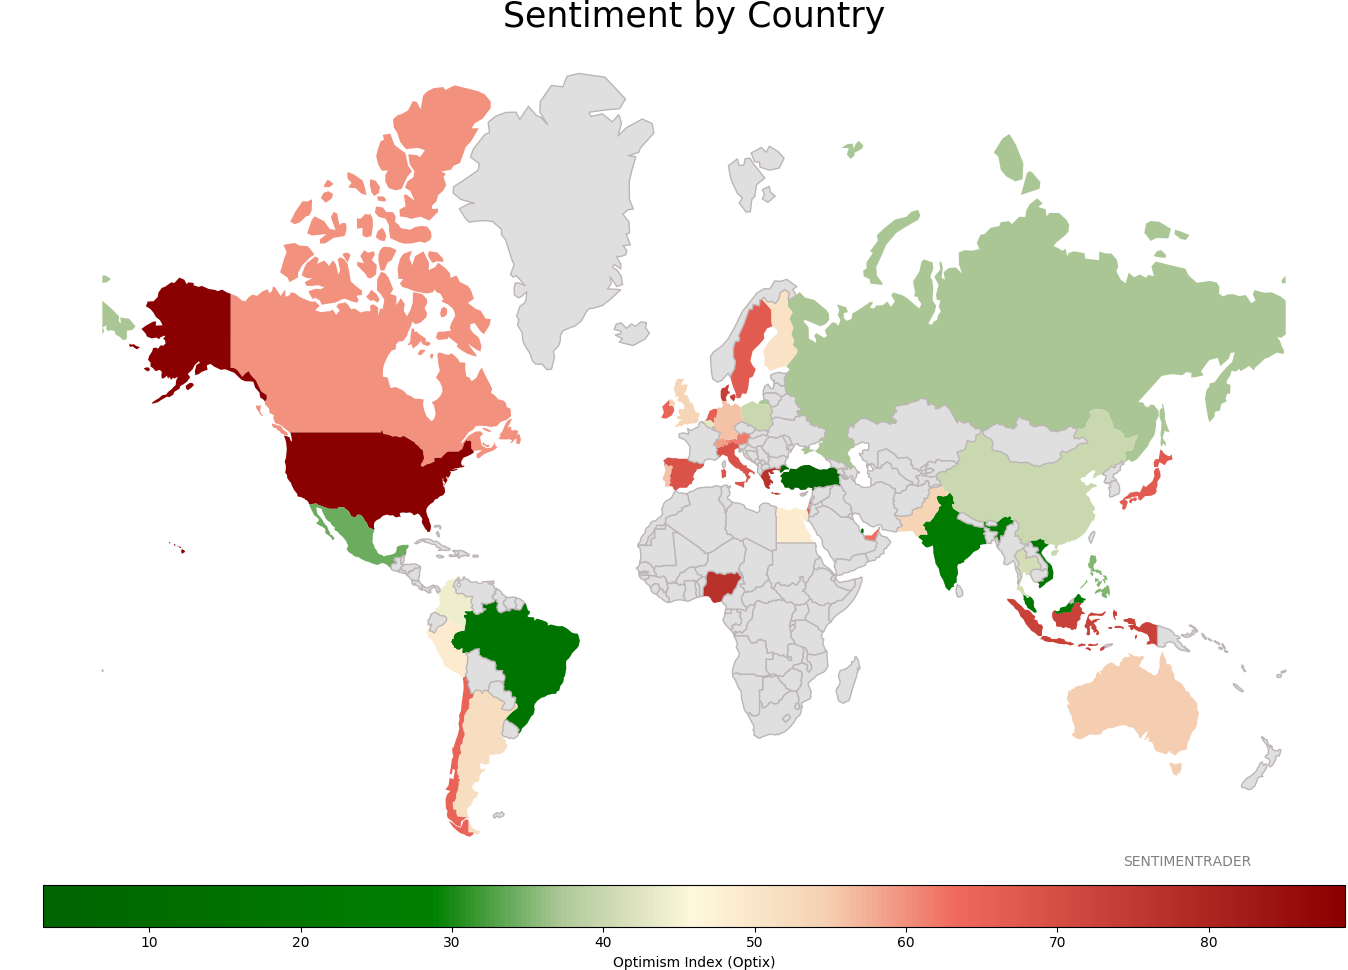
Sentiment Around The World
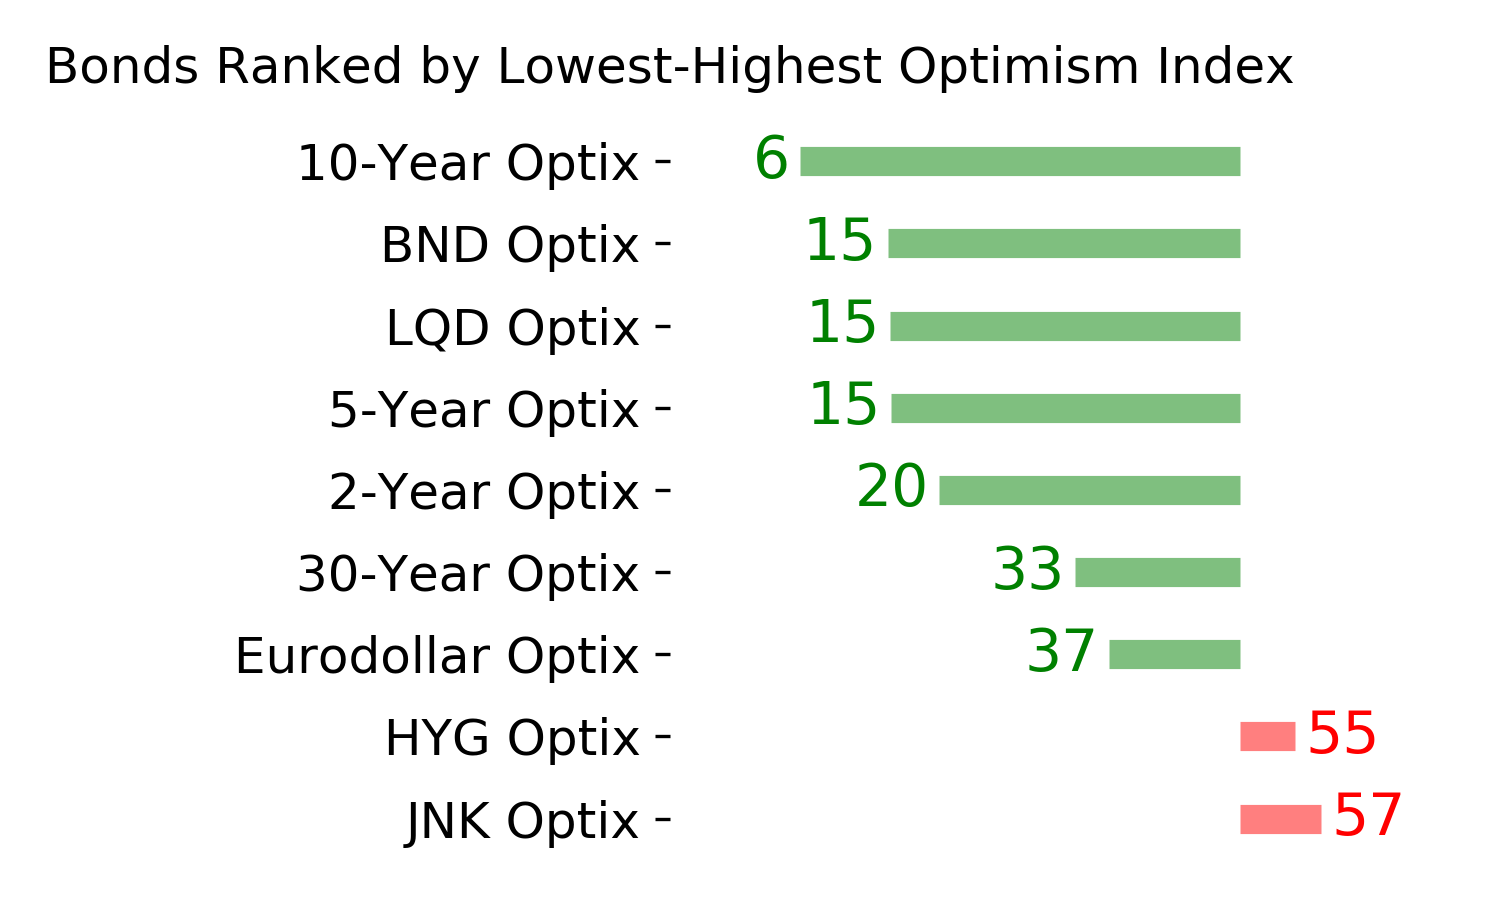
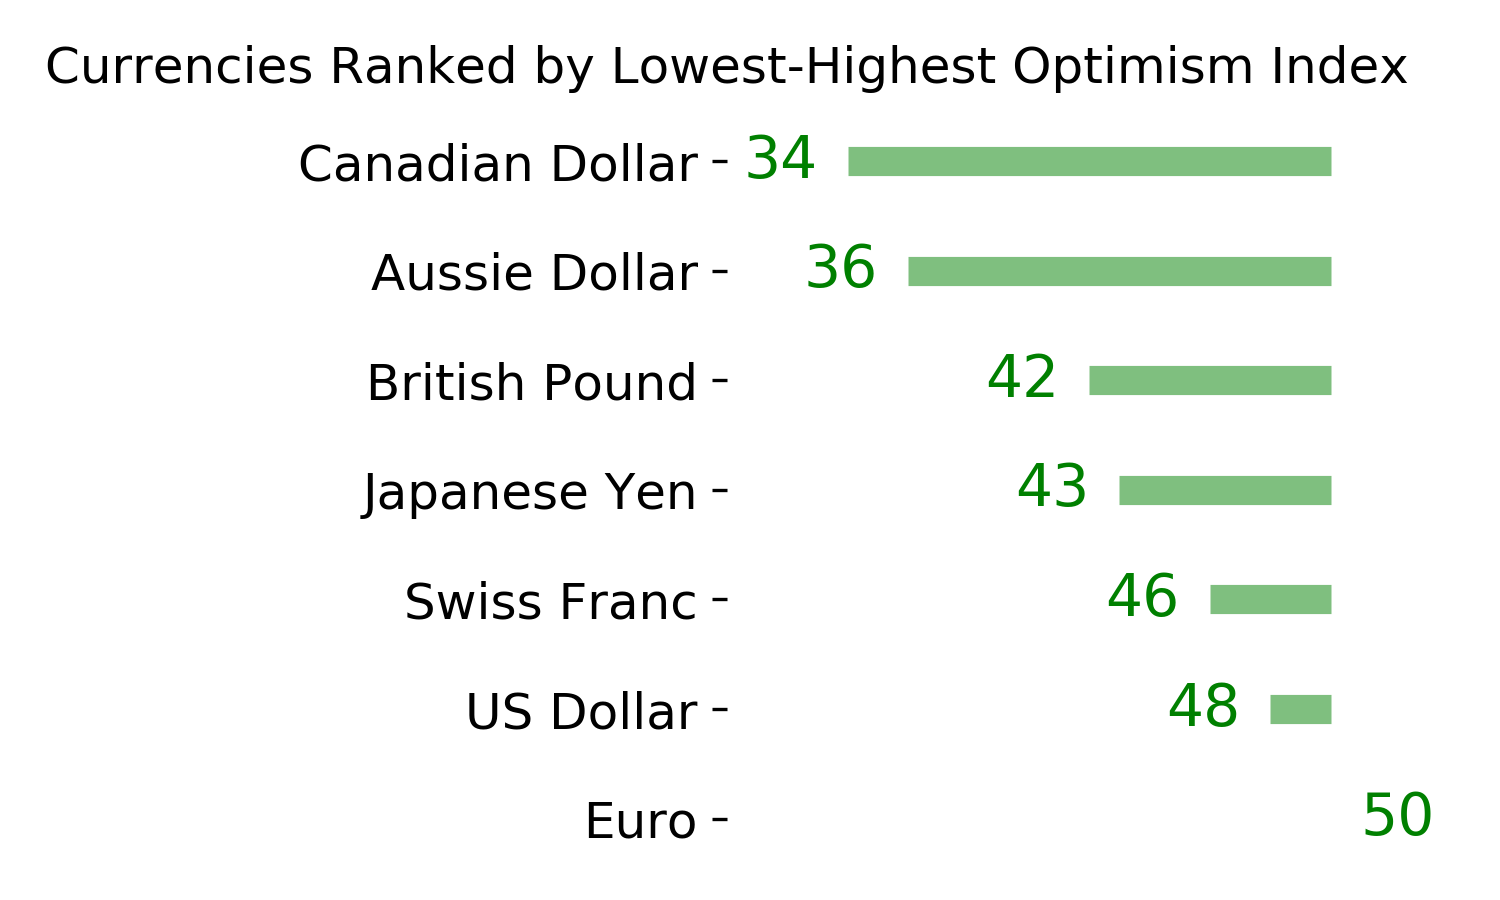
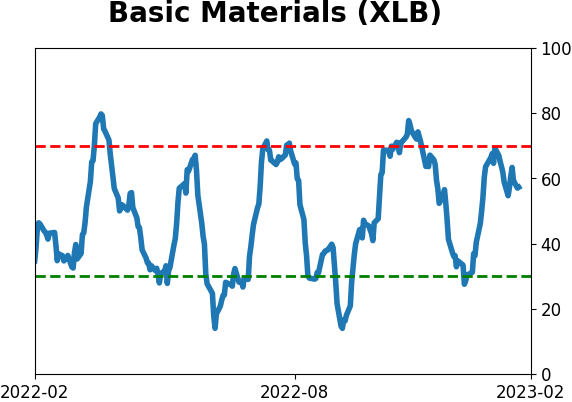
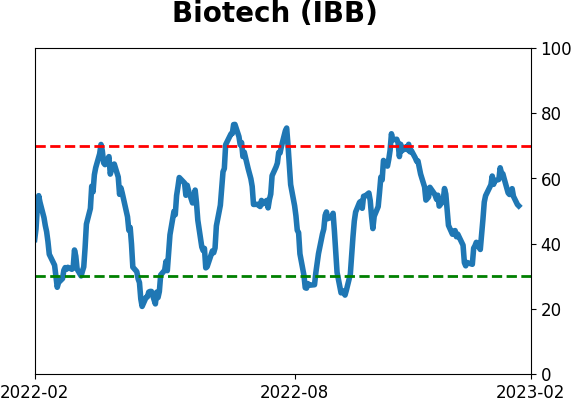
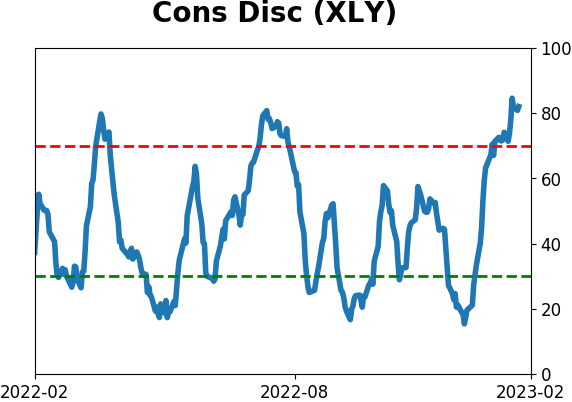
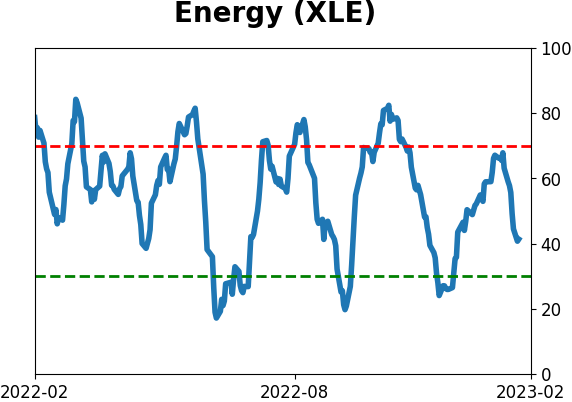
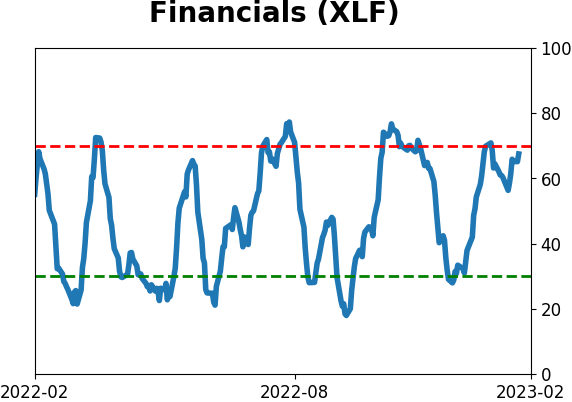
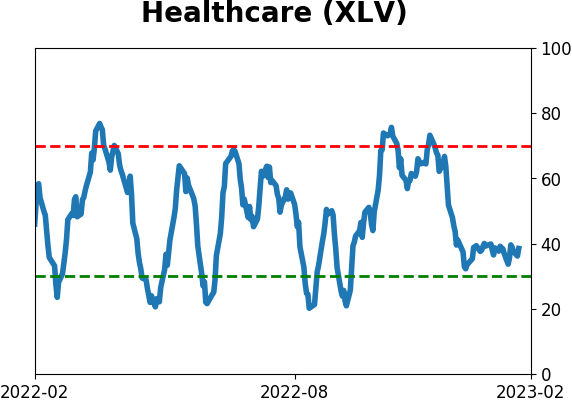
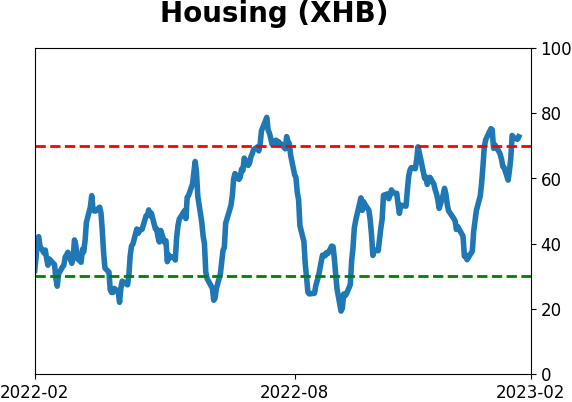
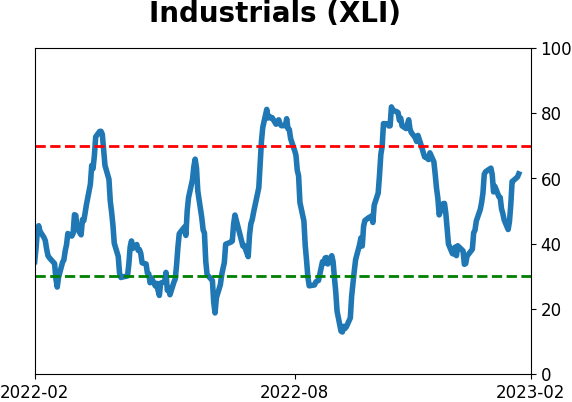
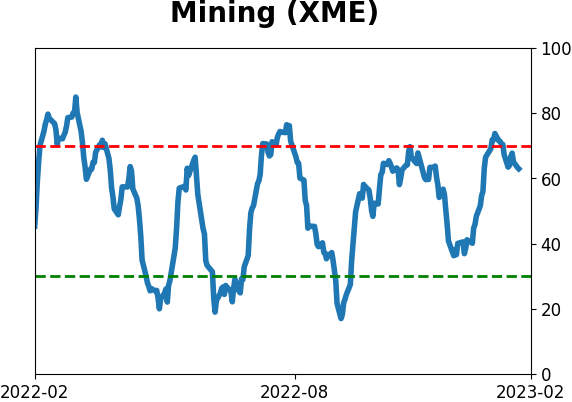
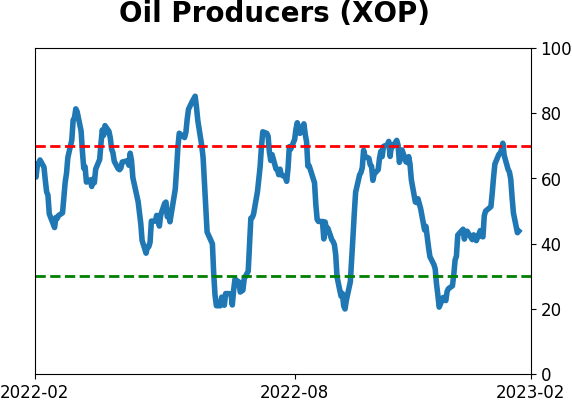
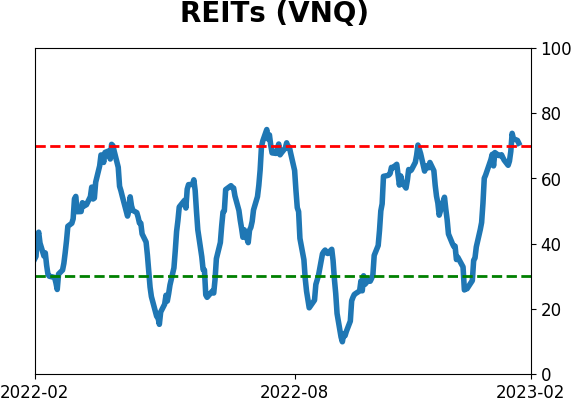
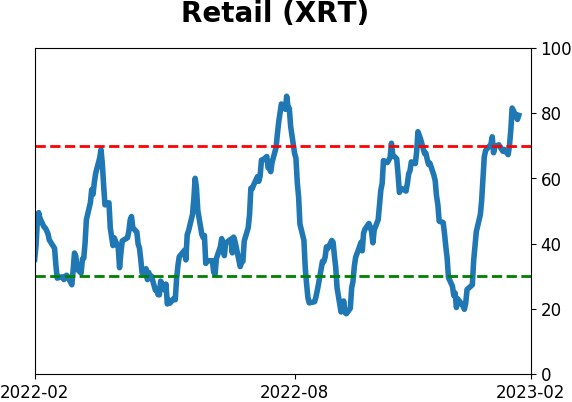
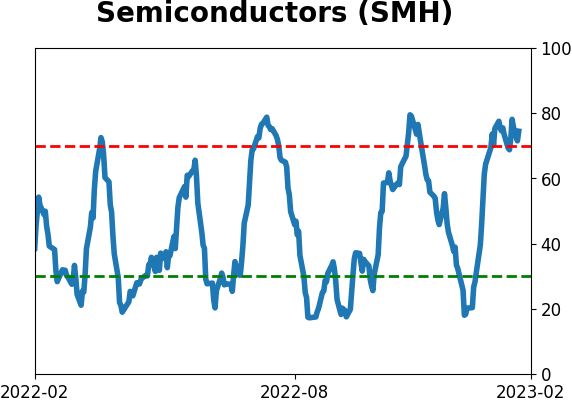
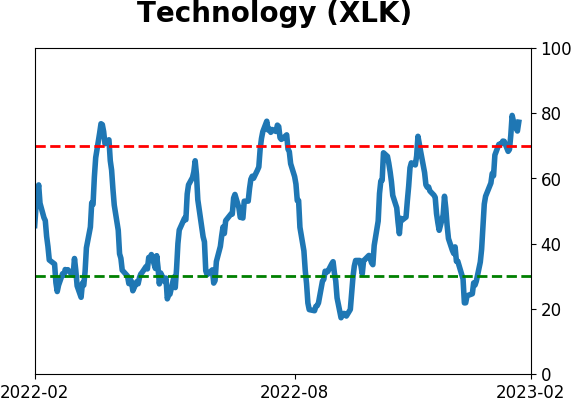
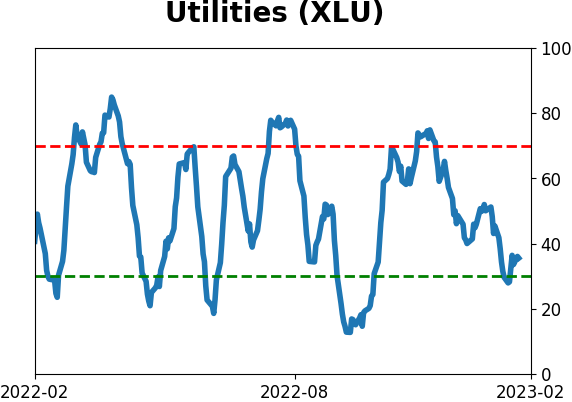
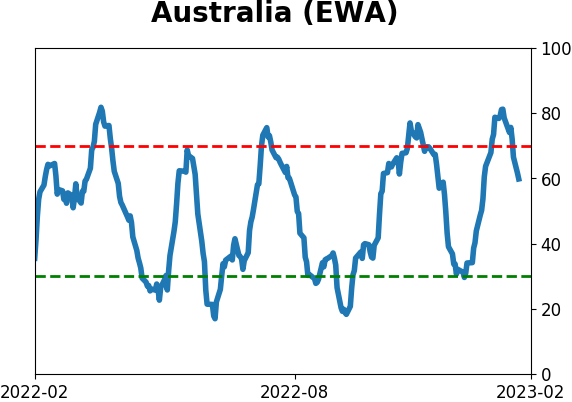
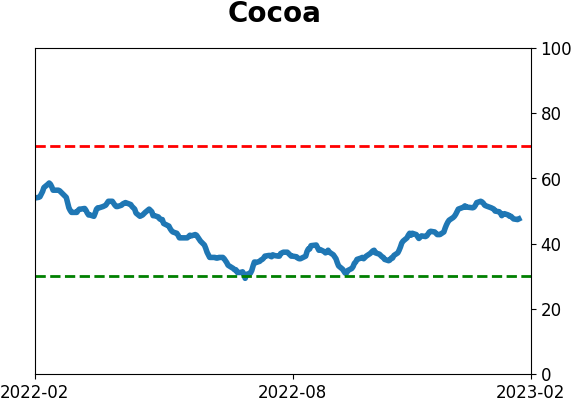
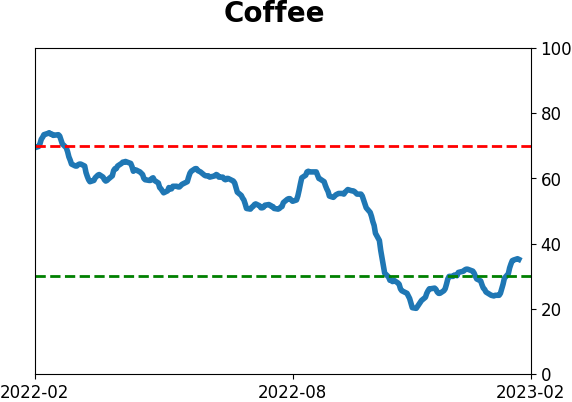
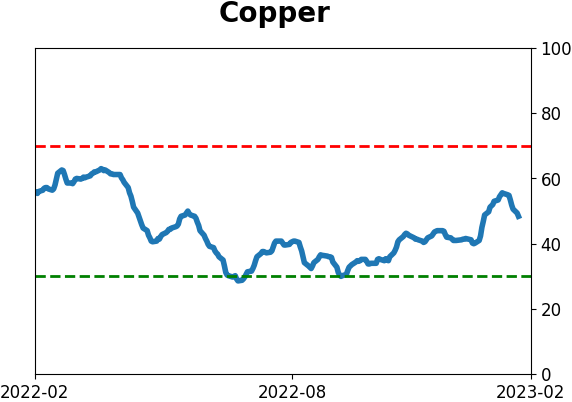
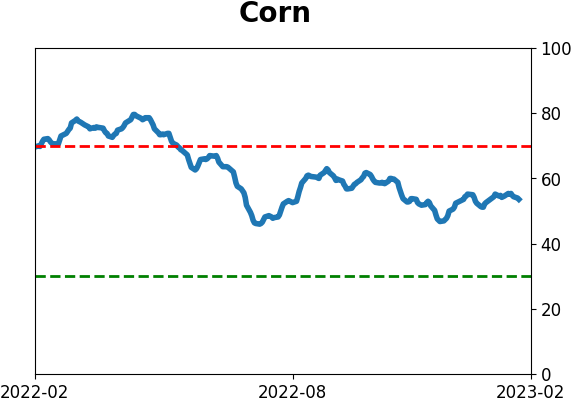
Optimism Index Thumbnails
|
Sector ETF's - 10-Day Moving Average
|
|
|
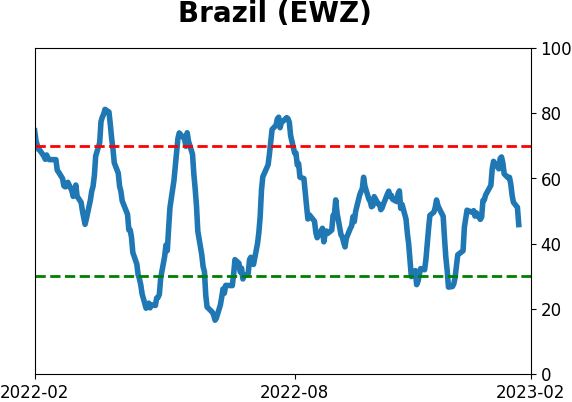
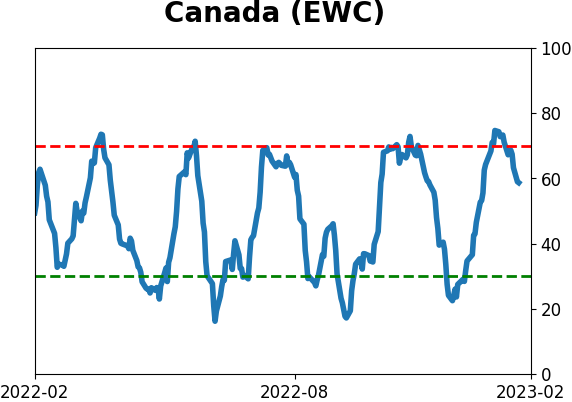
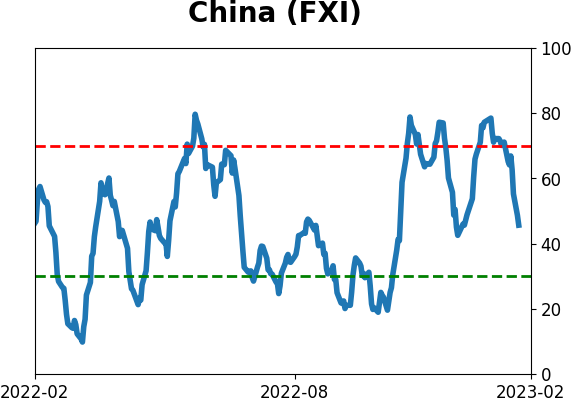
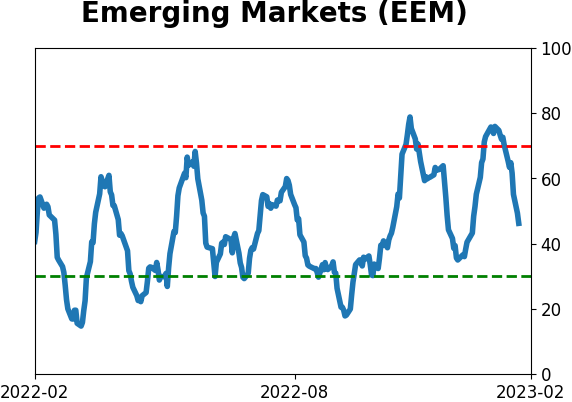
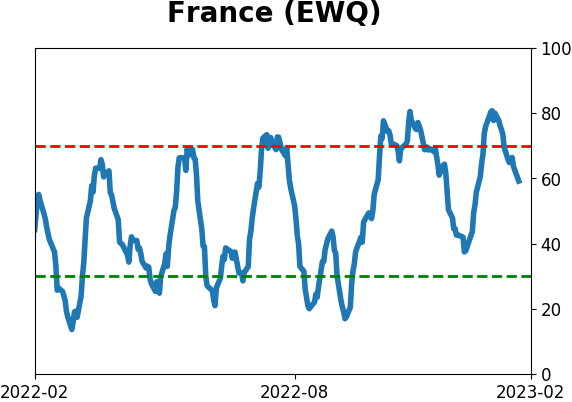
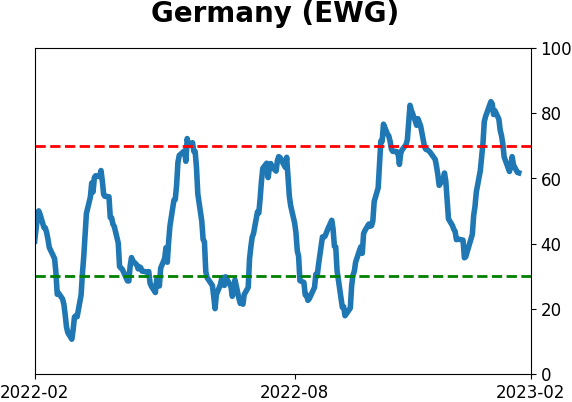
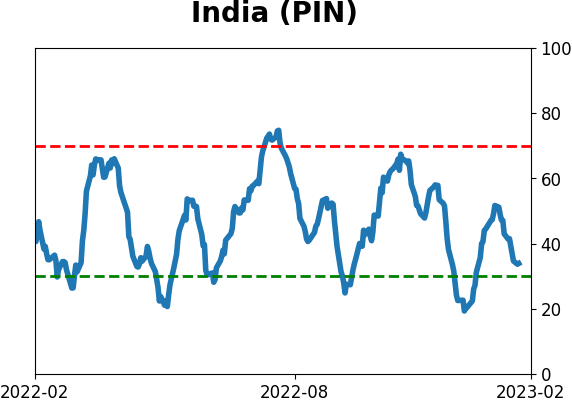
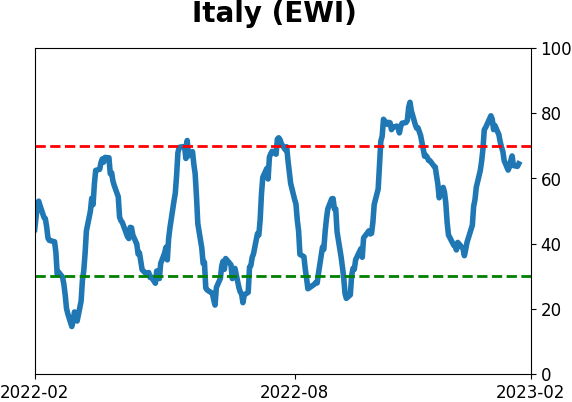
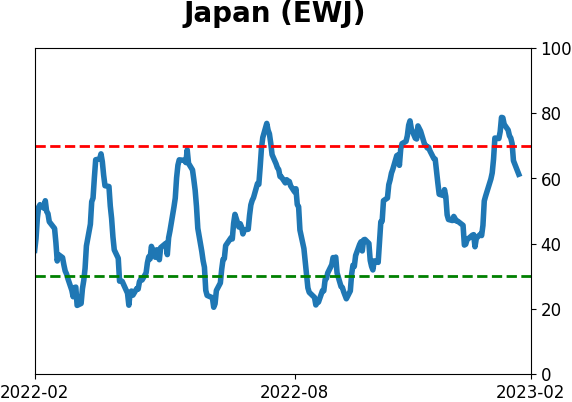
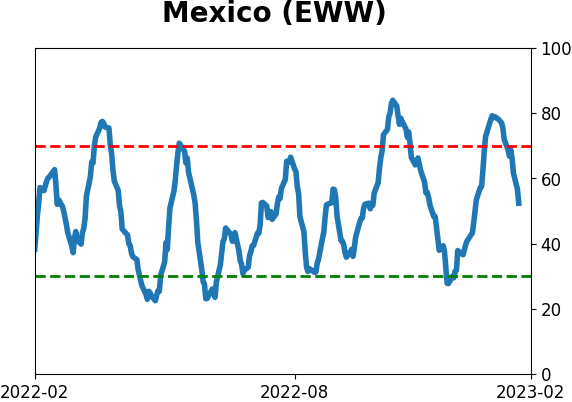
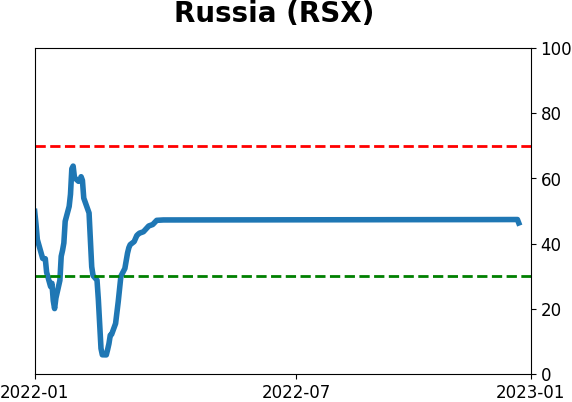
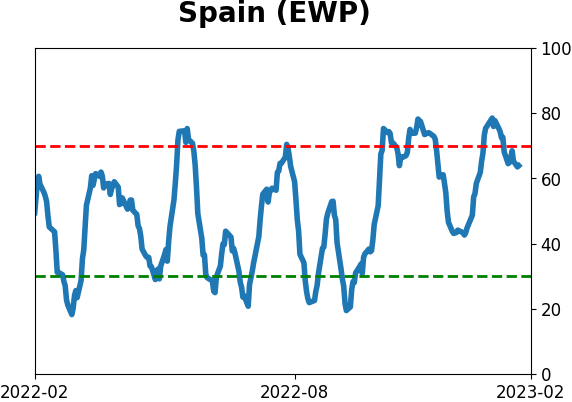
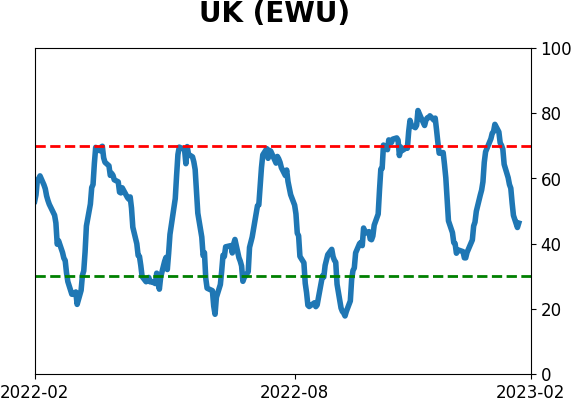
Country ETF's - 10-Day Moving Average
|
|
|
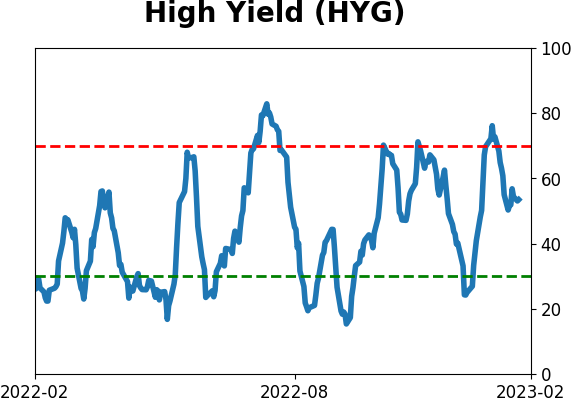
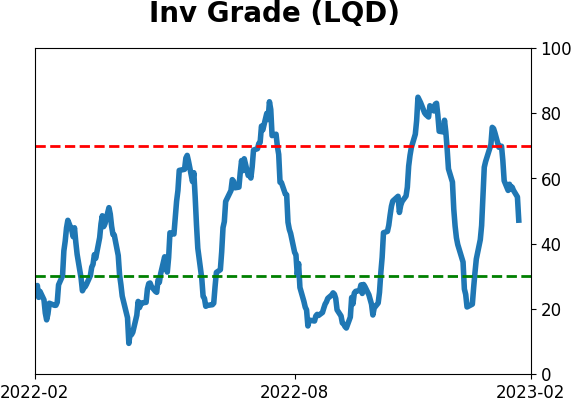
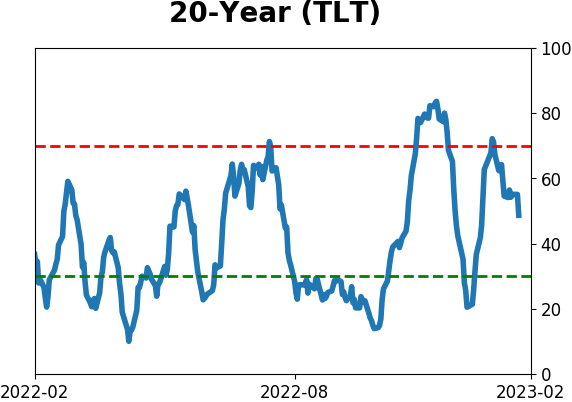
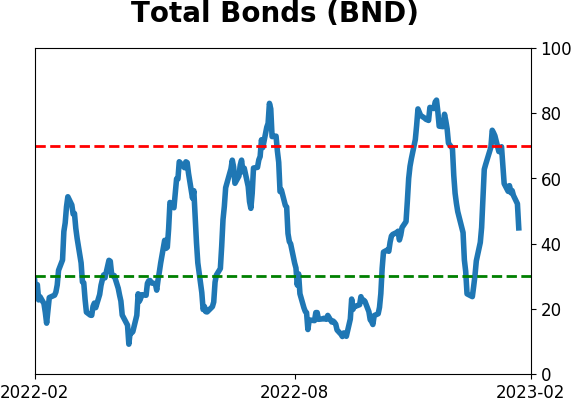
Bond ETF's - 10-Day Moving Average
|
|
|
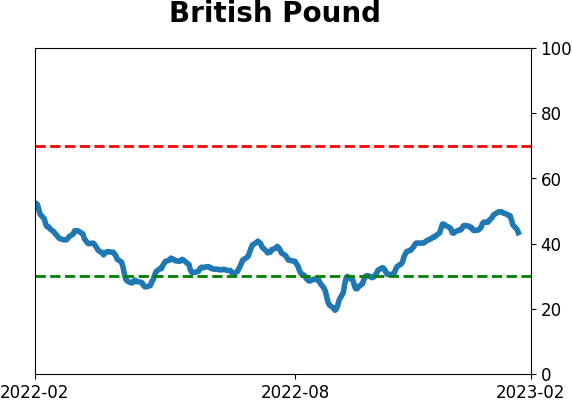
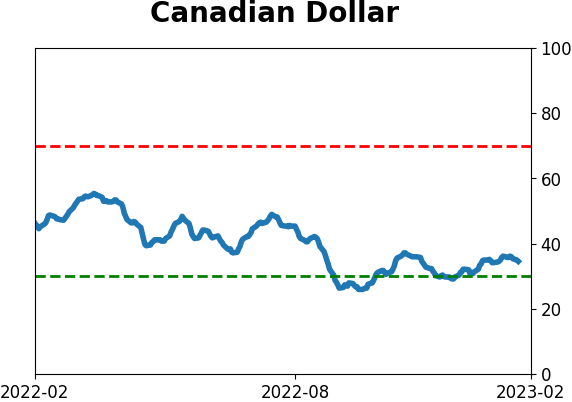
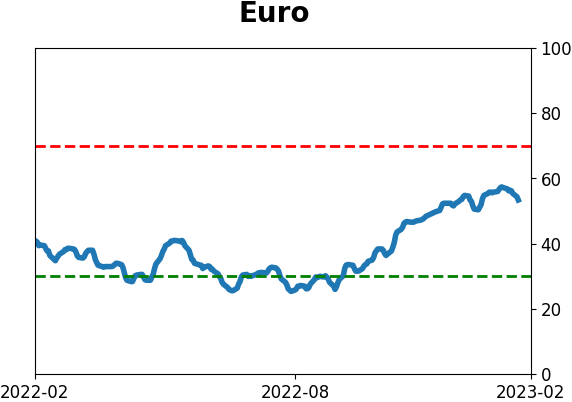
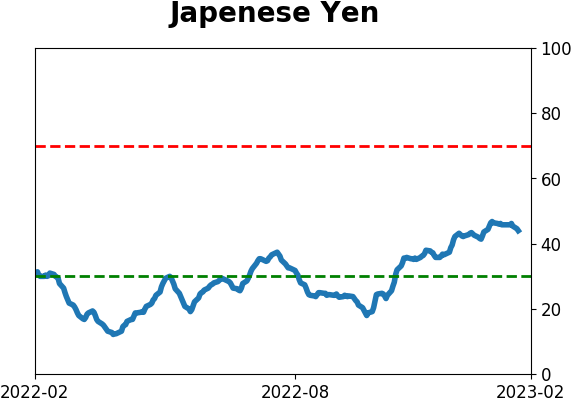
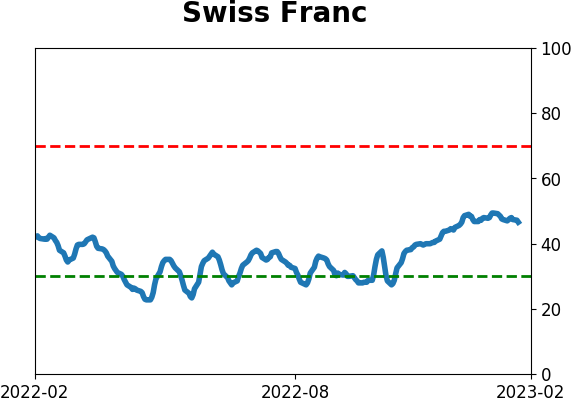
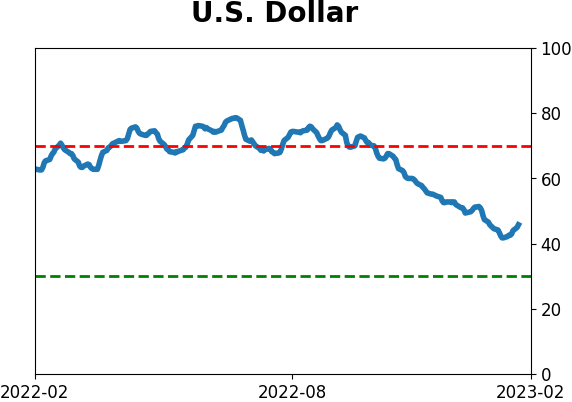
Currency ETF's - 5-Day Moving Average
|
|
|
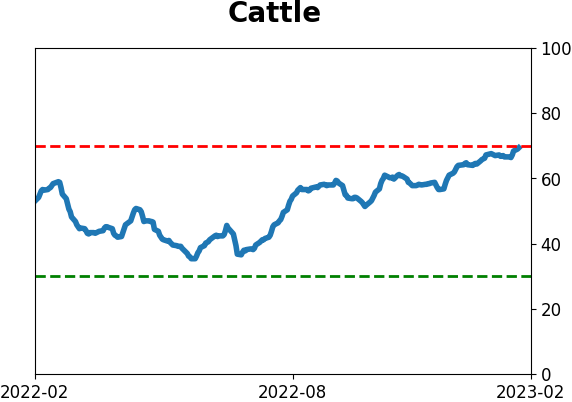
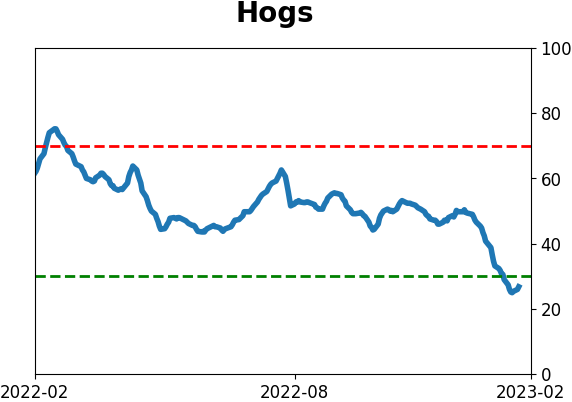
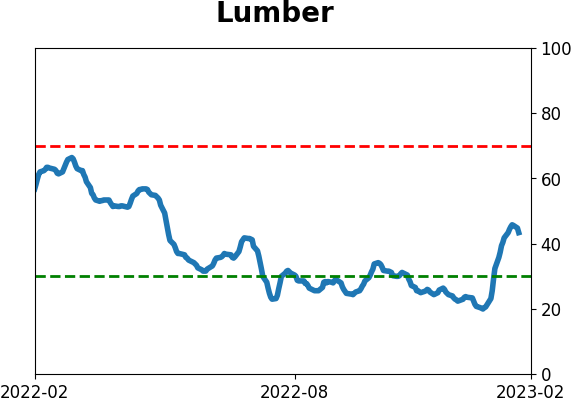
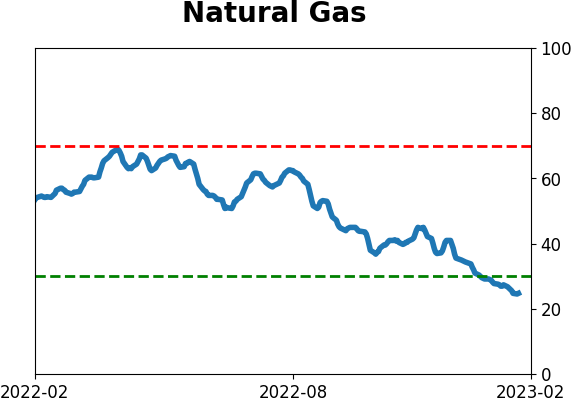
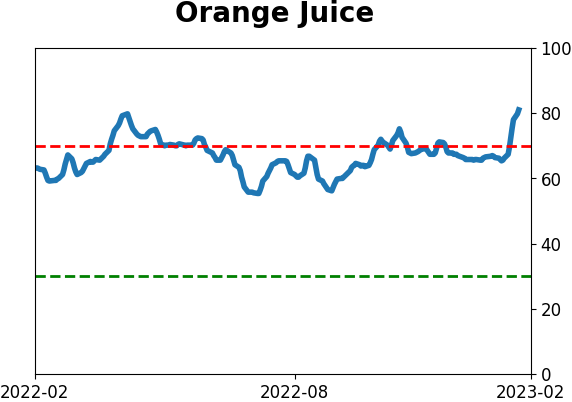
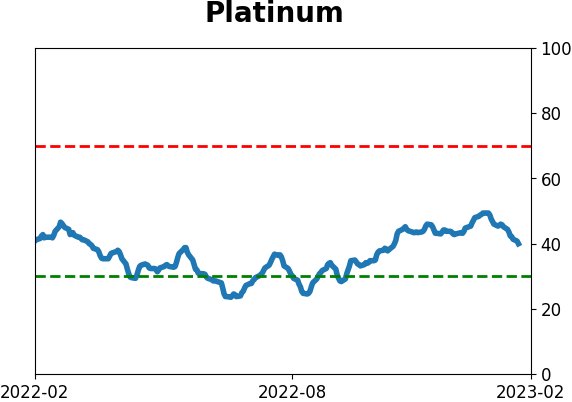
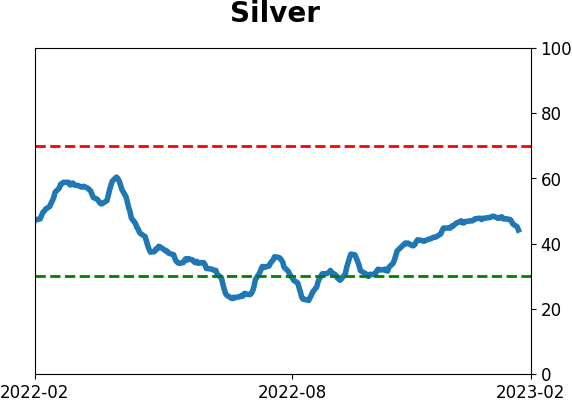
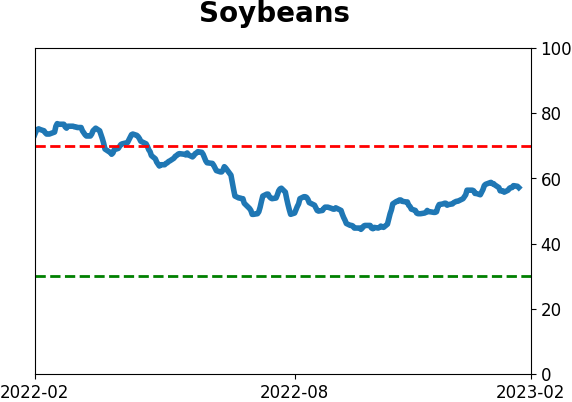
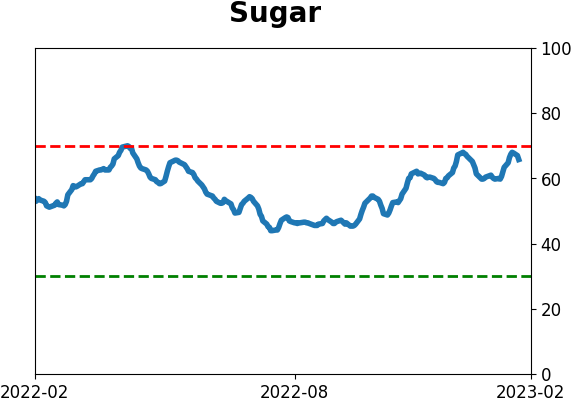
Commodity ETF's - 5-Day Moving Average
|
|