Headlines
|
|
Hedging activity rises to highest level in almost 2 years:
Investors increased their hedging activity once again last week, across a wide variety of products. That pushed the Equity Hedging Activity to an extreme level, which tends to precede a bounce in stocks over the next couple of months.
|
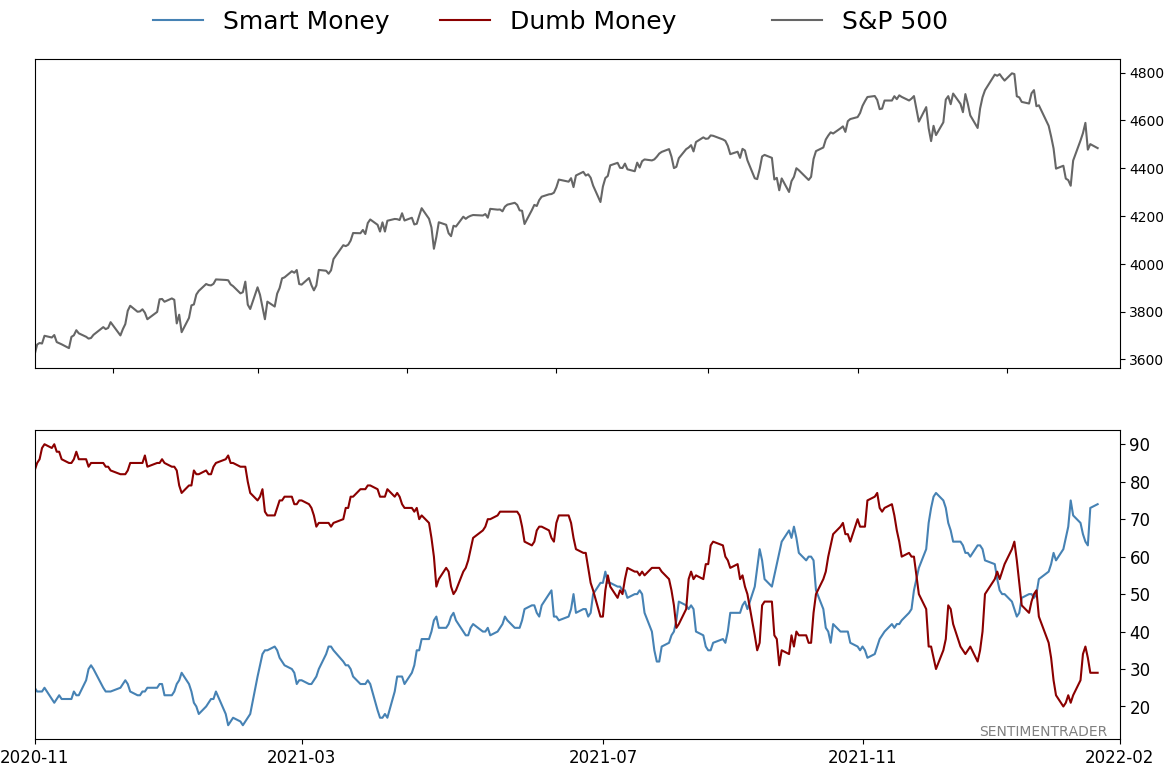
Smart / Dumb Money Confidence
|
Smart Money Confidence: 74%
Dumb Money Confidence: 29%
|
|
Risk Levels
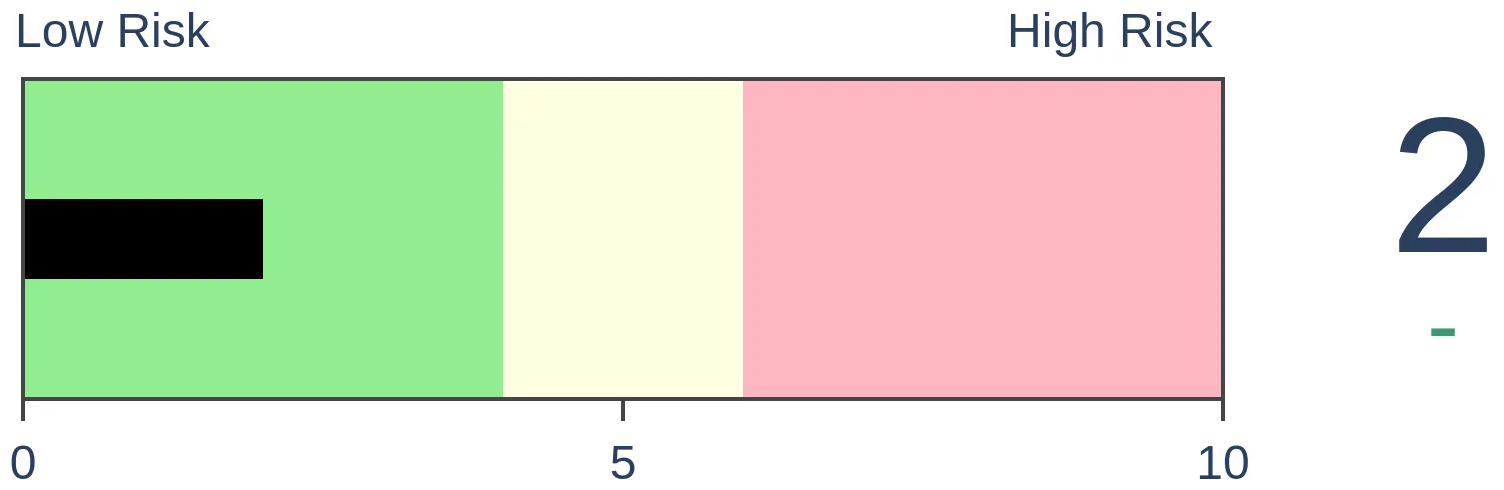
Stocks Short-Term
|
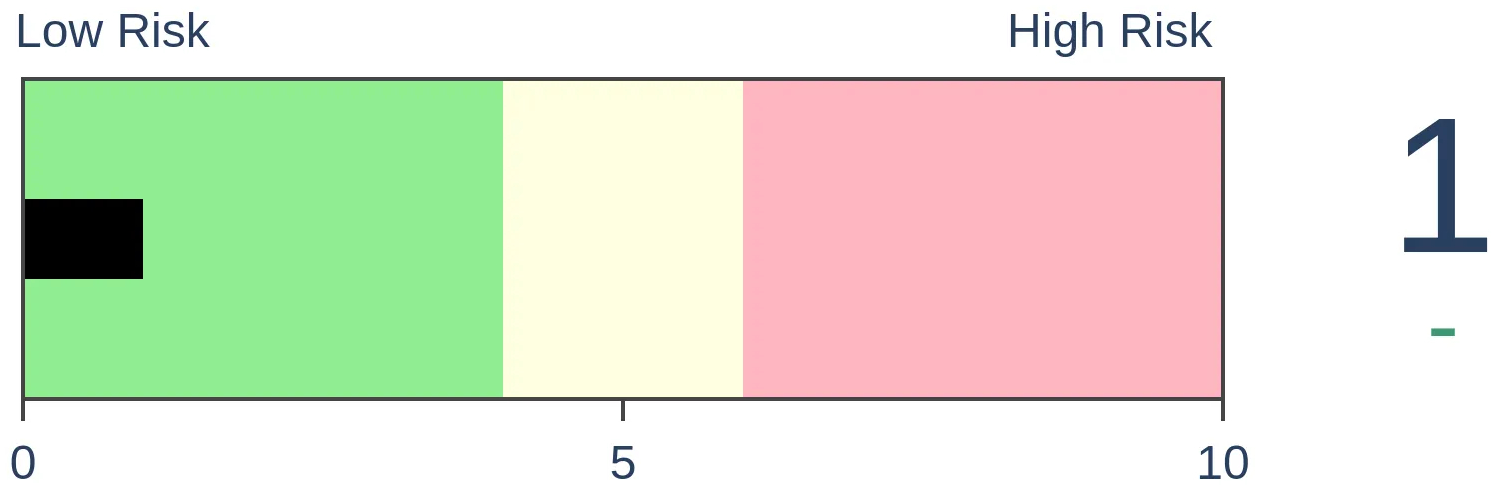
Stocks Medium-Term
|
|
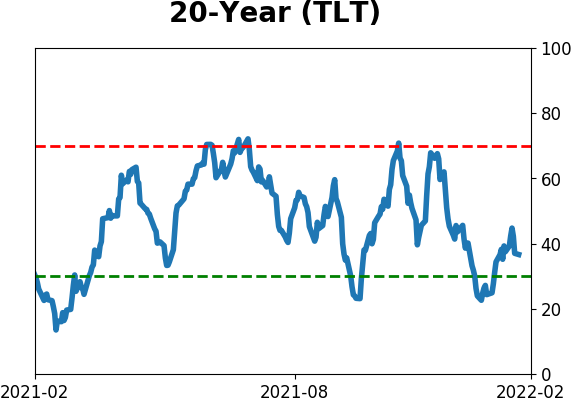
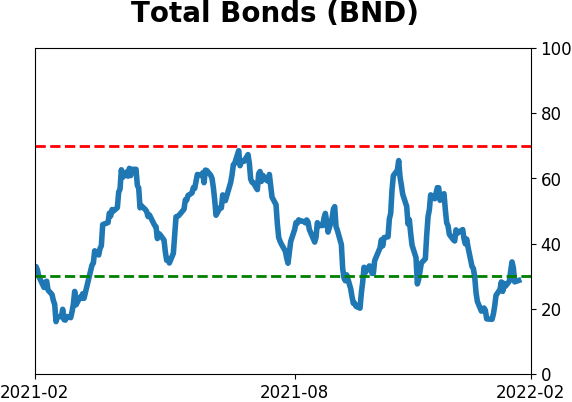
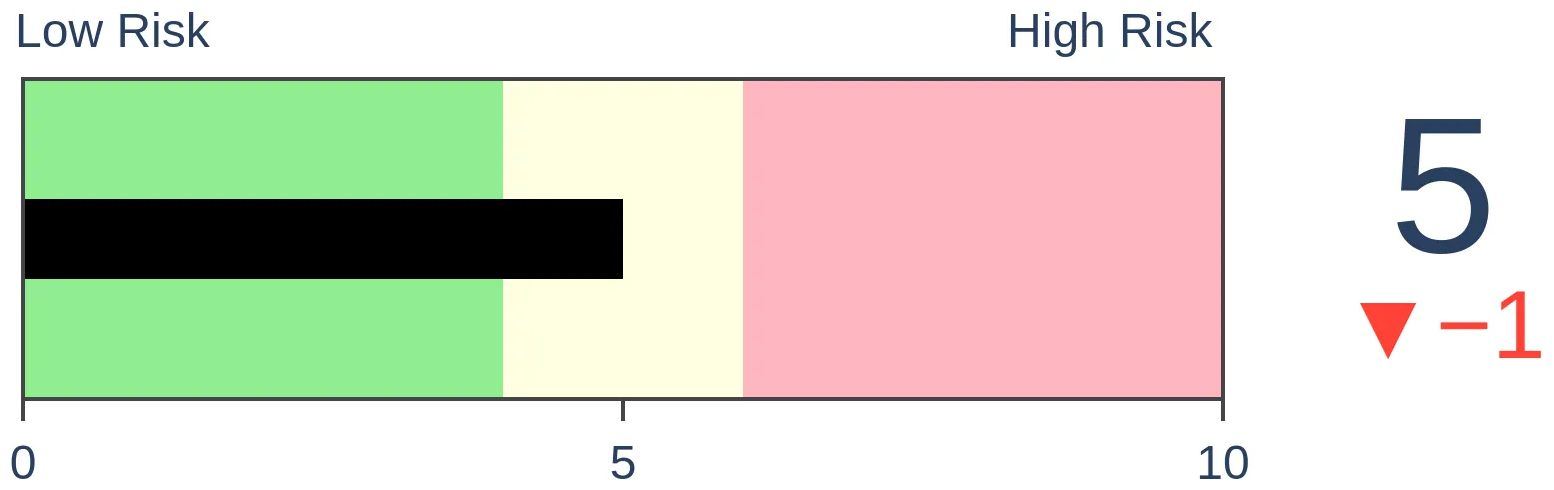
Bonds
|
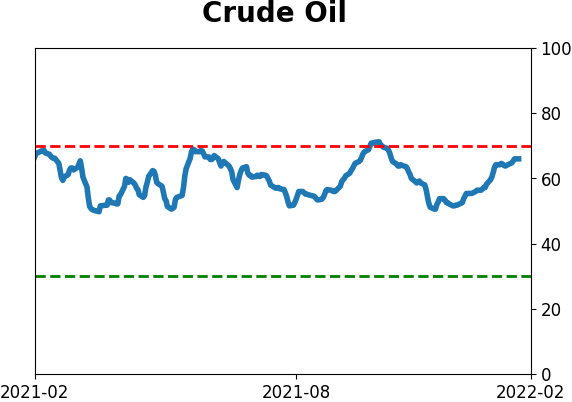
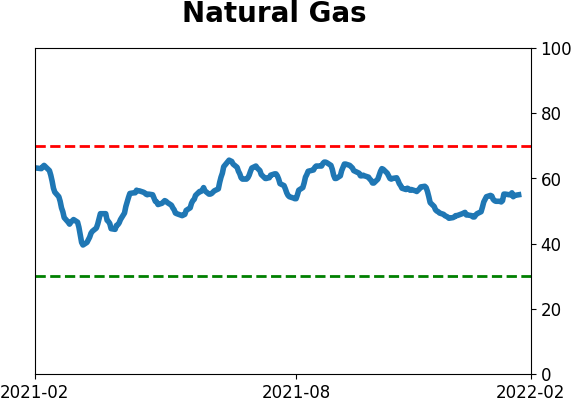
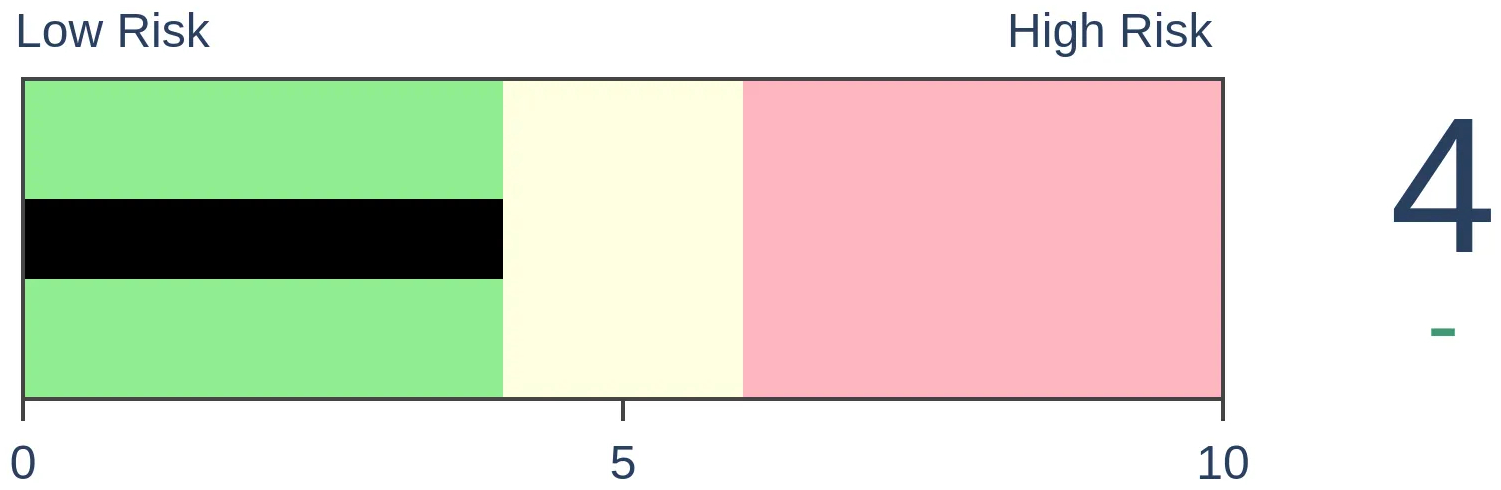
Crude Oil
|
|
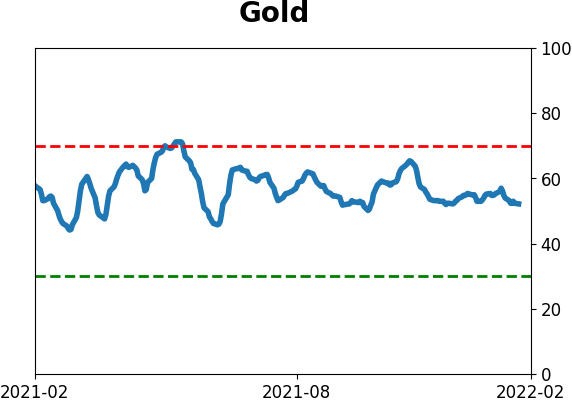
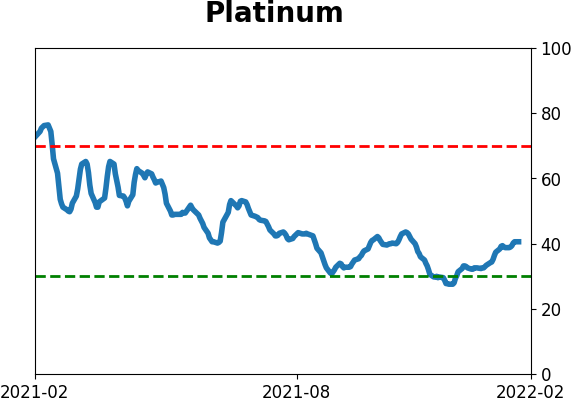
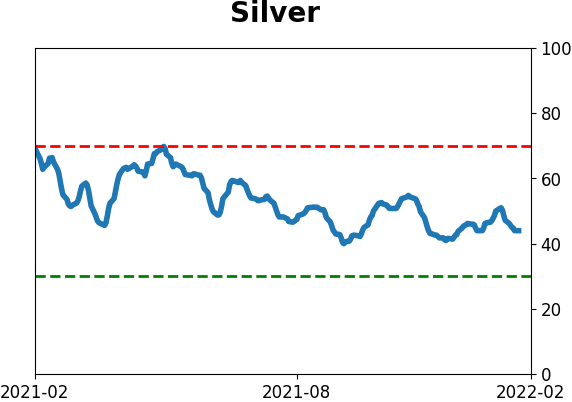
Gold

|
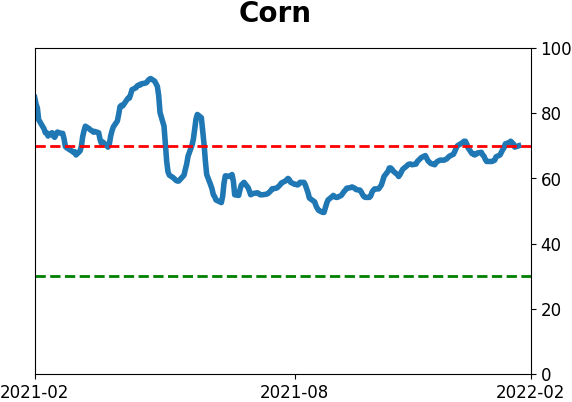
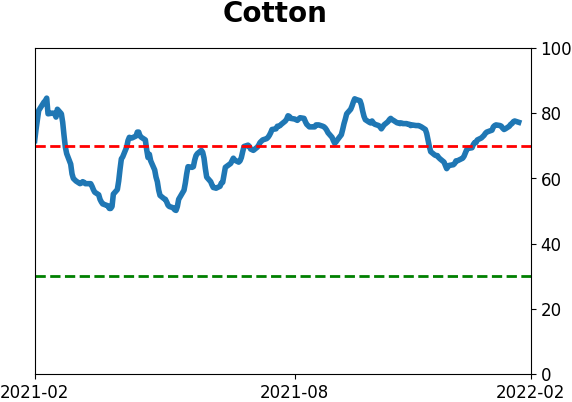
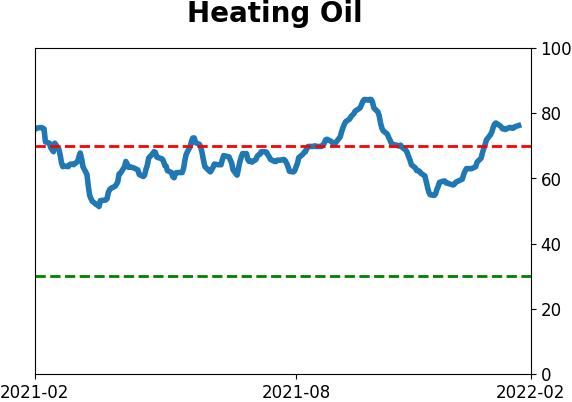
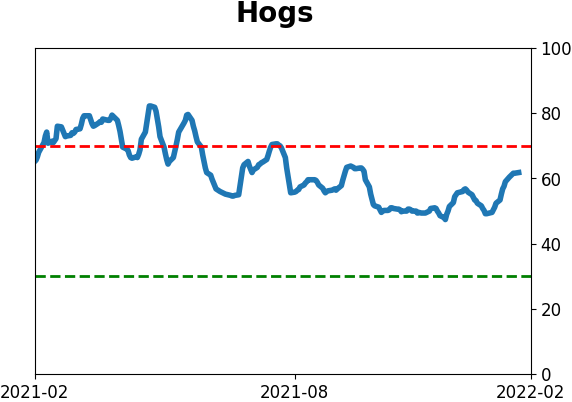
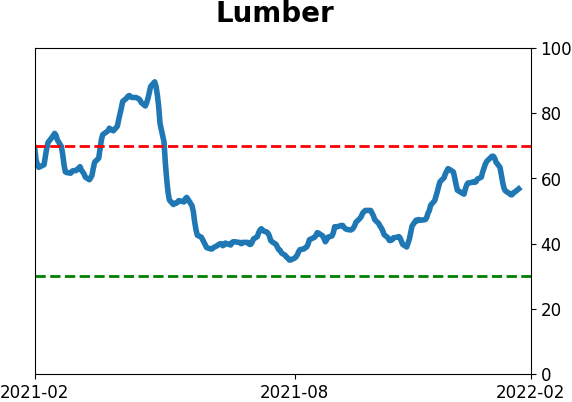
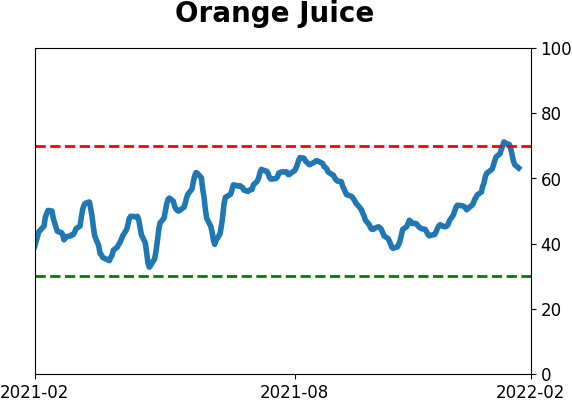
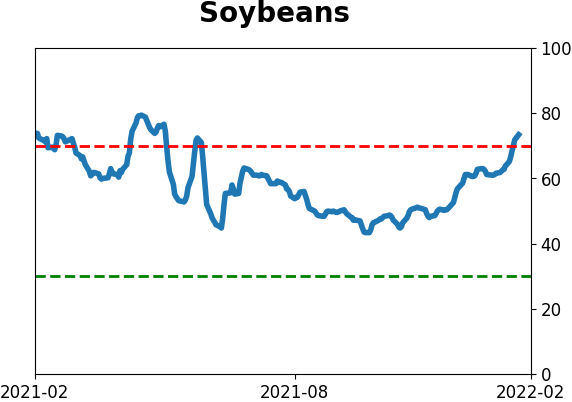
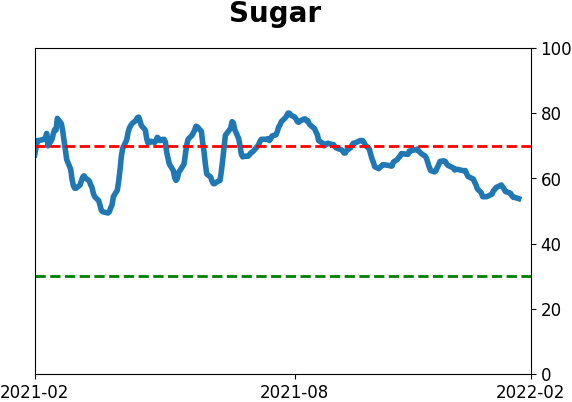
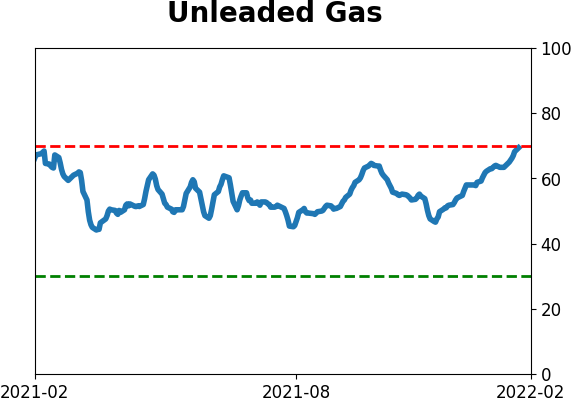
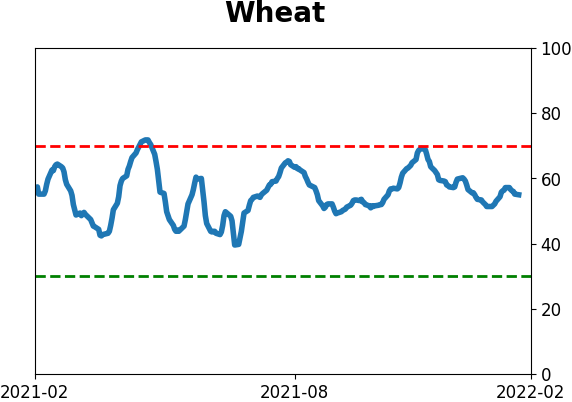
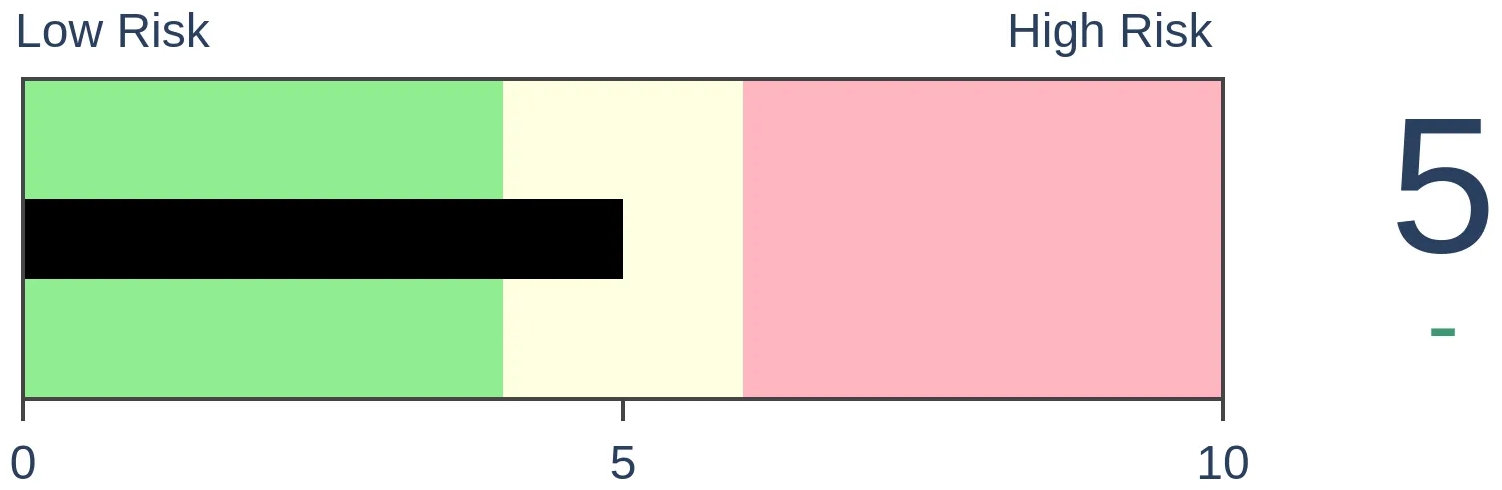
Agriculture
|
|
Research
By Jason Goepfert
BOTTOM LINE
Investors increased their hedging activity once again last week, across a wide variety of products. That pushed the Equity Hedging Activity to an extreme level, which tends to precede a bounce in stocks over the next couple of months.
FORECAST / TIMEFRAME
None
|
Key points:
- Hedging activity across a wide variety of metrics rose again last week
- The Equity Hedging Index is above 80%, a rarely achieved threshold
- High levels of hedging activity tend to lead to a bounce in stocks over several months
Hedging activity rising to an extreme level
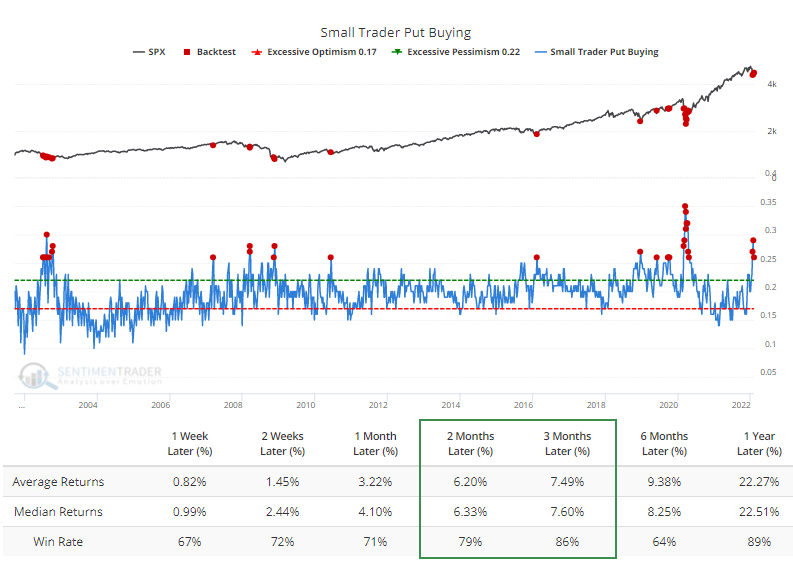
A week ago, we saw that small options traders suddenly had a change of heart. In January 2021, they were buying a record number of call options, but the week before last, they were buying a record number of puts.
Their inclination to bet heavily on more downside subsided a bit last week as stocks rallied, but small trader put buying remains historically high.

The Backtest Engine shows that whenever they spent 26% or more of their volume buying protective puts, the S&P 500 rallied during the next 3 months 24 out of 28 times.
It's not just small traders who are heading, however. Among the largest traders, put buying was popular again last week. For 2 weeks in a row, they've spent 30% of their volume on puts, the highest percentage since the pandemic.

Other hedging activity has spiked
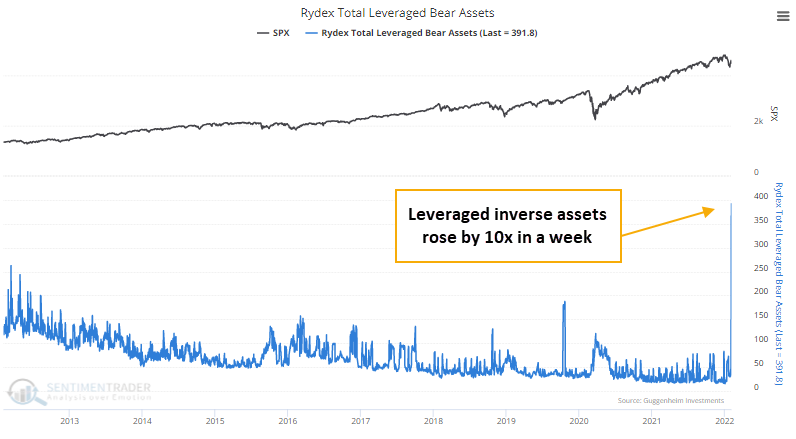
There are other ways to hedge. Traders can buy an inverse mutual fund that profits when stocks decline. In the Rydex family of funds, inverse index assets have skyrocketed, thanks to a 10x surge in the leveraged funds last week alone.
The jump in assets is almost certainly due to a medium-sized asset manager rushing to put on a hedge on the Nasdaq 100 and not a sudden panic for protection among a broad base of investors. Still, extreme moves in these funds have a reasonably consistent contrary track record dating back decades.
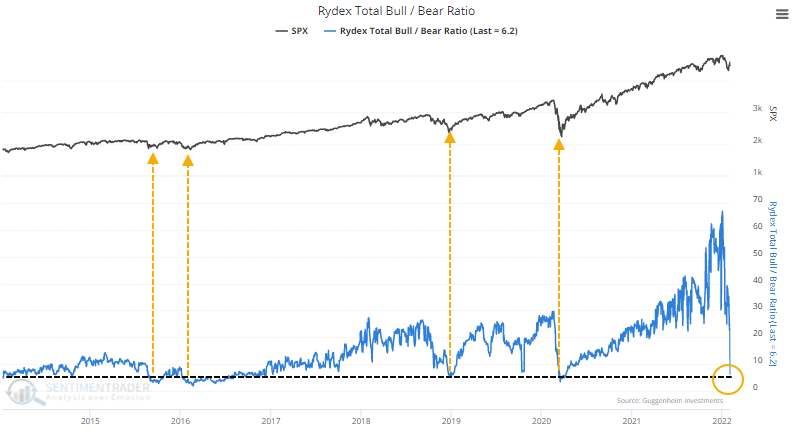
The skyrocketing amount of assets in inverse funds has pushed the Rydex Bull/Bear Ratio to one of its lowest levels since 2014. Granted, that's only starting to erase some of the extremes that built up last year as bullish assets overwhelming bearish ones.
It's not just mutual funds. Assets in leveraged inverse ETFs jumped to their highest in over a year, though they'd have to rise much more to challenge the all-time highs from the spring of 2020.

Traders can also hedge by buying credit default swaps. As the bond market suffers some paroxysms, the amount that traders are willing to pay to protect against an adverse effect has also jumped to the level in over a year.

As interest rates rise, one of the best - and increasingly popular - ways to hedge is to sell stocks and simply hold the proceeds in cash. Retail investors have been doing just that, with money market assets rising as a percentage of stock market capitalization.
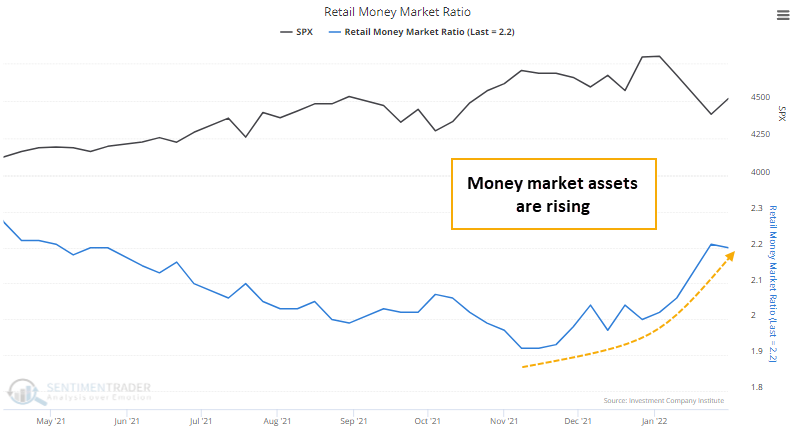
Long-term, this increase in money market assets is just a tiny blip. It has a looooong way to go to reach the heights of panic in 2020, much less those from 2008 or other panics over the past 40 years.

The behavior of scrambling for hedges across various products is a new development.
It was enough to push the Equity Hedging Index above 80% last week for the first time since early April 2020. According to the Backtest Engine, this is only the 33rd week in 22 years that it's been above that threshold. After 27 of those weeks, the S&P 500 rallied during the next couple of months.

The biggest failure was October 2018, when the jump in hedging activity preceded only a temporary slowdown in selling pressure before the final leg lower into December of that year. That was the only signal that showed any significant selling pressure over the next 2 months.
What the research tells us...
Long-term trend changes are among the trickiest markets for investors. They're relatively " easy " when transitioning from a bear market to a bull because we tend to see consistent warning signs that the bear market may be ending. Transitions from bull markets are less uniform.
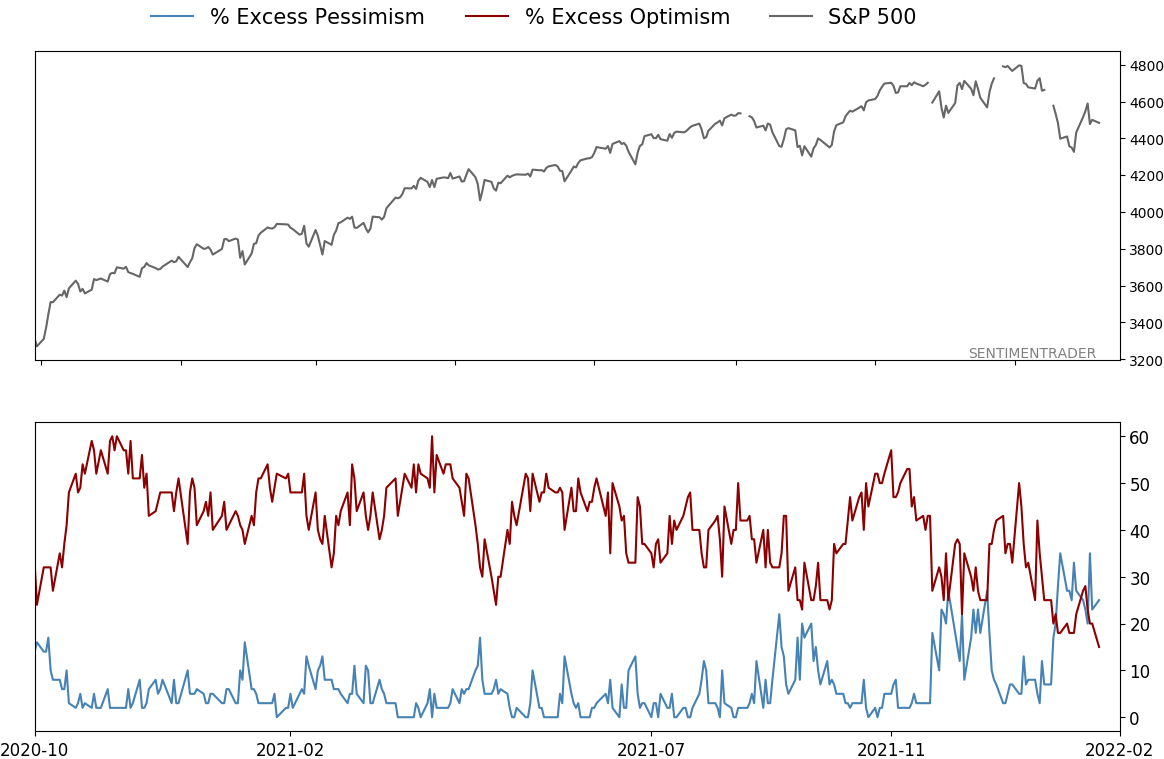
It's entirely possible that we won't enter a bear market, but the market environment is unhealthy. Almost every metric we watch is in negative territory, and investors are in risk-off mode. That is not a great combo. The only potential saving grace is that pessimism reached a high level, and as we saw above, they're hedging aggressively. Even in unhealthy market environments, that's usually enough to generate a multi-week to multi-month rebound.
Active Studies
| Time Frame | Bullish | Bearish | | Short-Term | 3 | 0 | | Medium-Term | 17 | 2 | | Long-Term | 14 | 5 |
|
Indicators at Extremes
Portfolio
| Position | Description | Weight % | Added / Reduced | Date | | Stocks | RSP | 21.4 | Added 10.2% | 2022-01-28 | | Bonds | 32.7% BND, 7.1% SCHP | 40.1 | Added 8.3% | 2021-10-26 | | Commodities | GCC | 2.4 | Reduced 2.1%
| 2020-09-04 | | Precious Metals | GDX | 4.6 | Reduced 4.2% | 2021-05-19 | | Special Situations | 8.1% KWEB, 3.6% XLE, 1.7% PSCE | 13.4 | Reduced 3.9% | 2022-01-18 | | Cash | | 17.9 | | |
|
Updates (Changes made today are underlined)
With a typical time frame of several months in this account, I normally don't make changes so quickly. I've added back part of the stock exposure I took off earlier in January due to the washed-out conditions and extreme pessimism we're seeing across a wide array of metrics. The biggest issue is that the environment is unhealthy and we could be in the throes of a protracted bear market. Even so, the readings we've seen recently have a good record at preceding relief rallies, so we'll have to see how that pans out. Bond sentiment is trying to recover from a recent bout of pessimism, and gold stocks are doing their thing which is not much at all. They've been flat for six months. Chinese tech stocks were doing exactly what they're supposed to do, then did *not* by plunging to new lows. This is troubling on a shorter-term time frame, but this was never meant for a trade, rather a multi-year investment. Recent behavior is troubling and I will not be adding any exposure as long as that's the case. RETURN YTD: -0.4% 2021: +8.7%, 2020: +8.1%, 2019: +12.6%, 2018: +0.6%, 2017: +3.8%, 2016: +17.1%, 2015: +9.2%, 2014: +14.5%, 2013: +2.2%, 2012: +10.8%, 2011: +16.5%, 2010: +15.3%, 2009: +23.9%, 2008: +16.2%, 2007: +7.8%
|
|
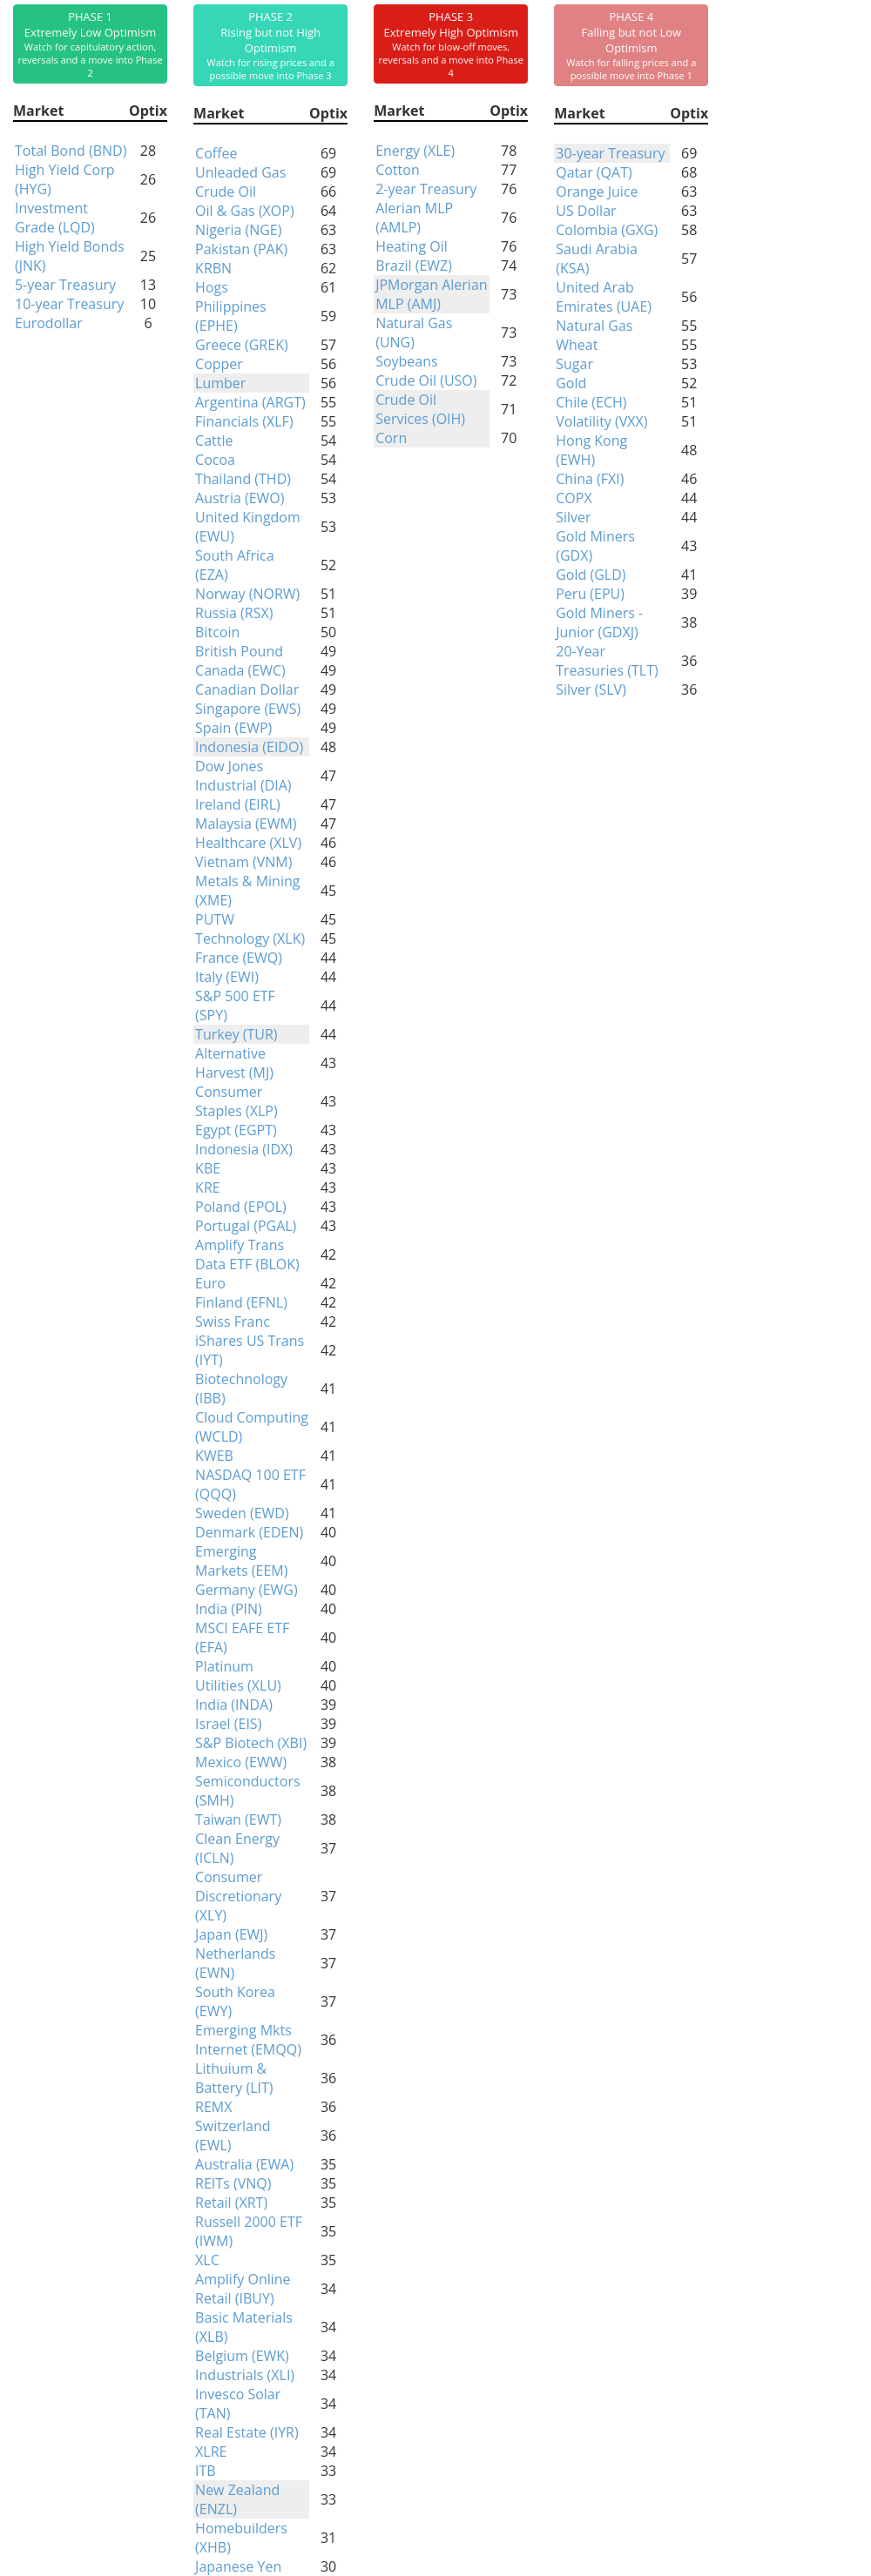
Phase Table
Ranks
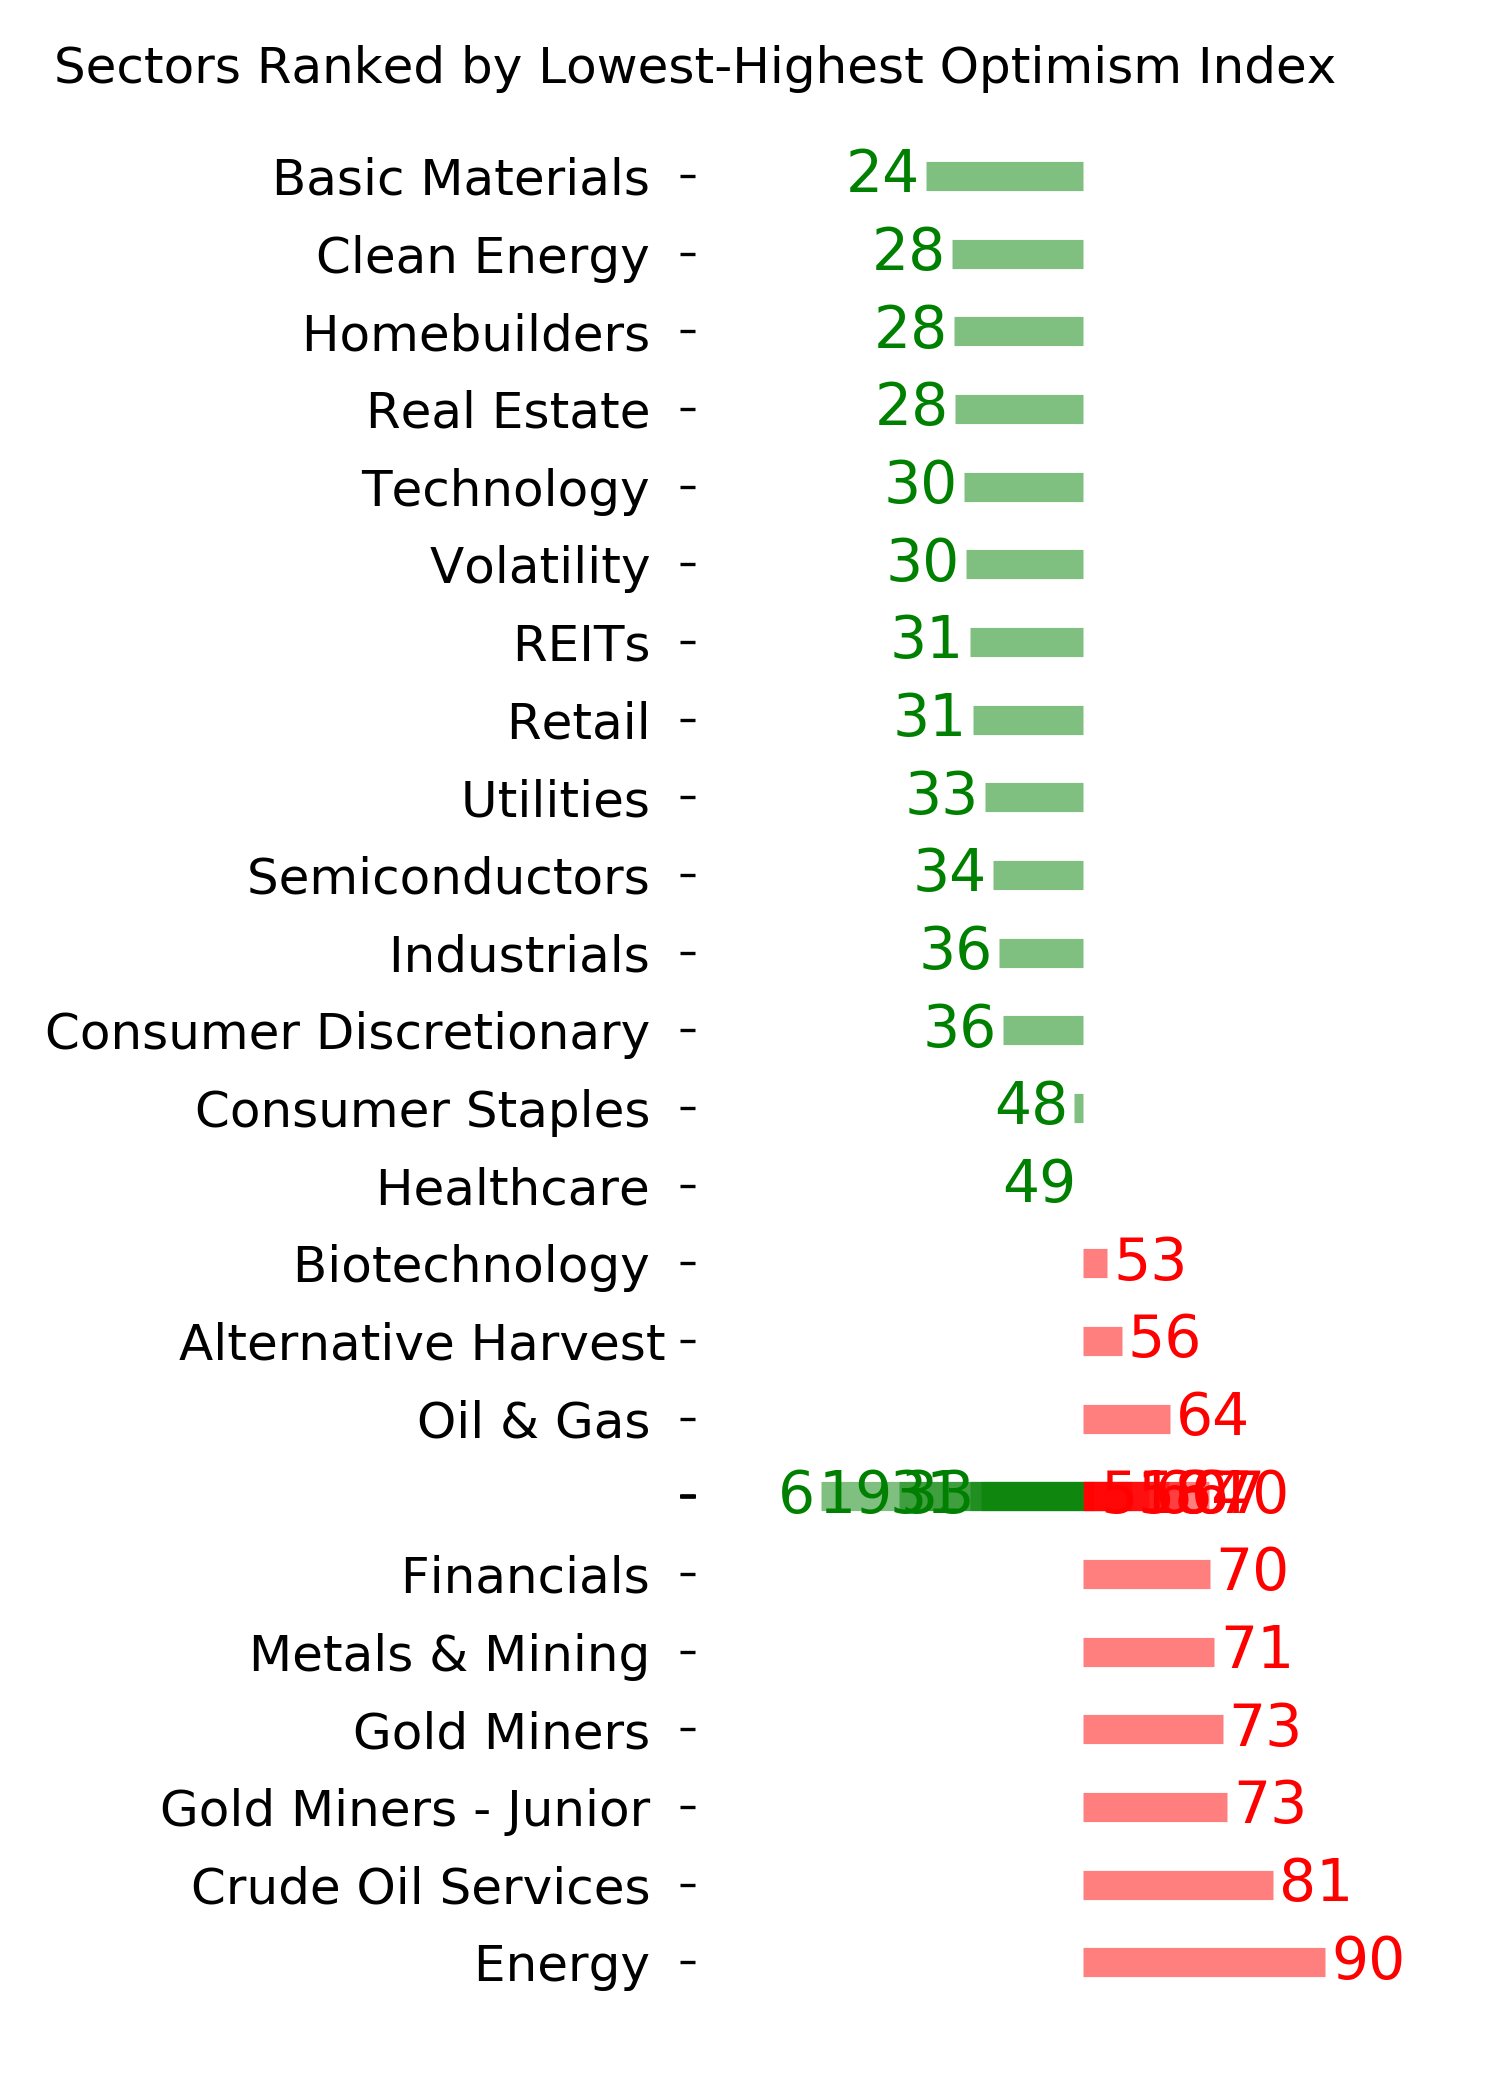
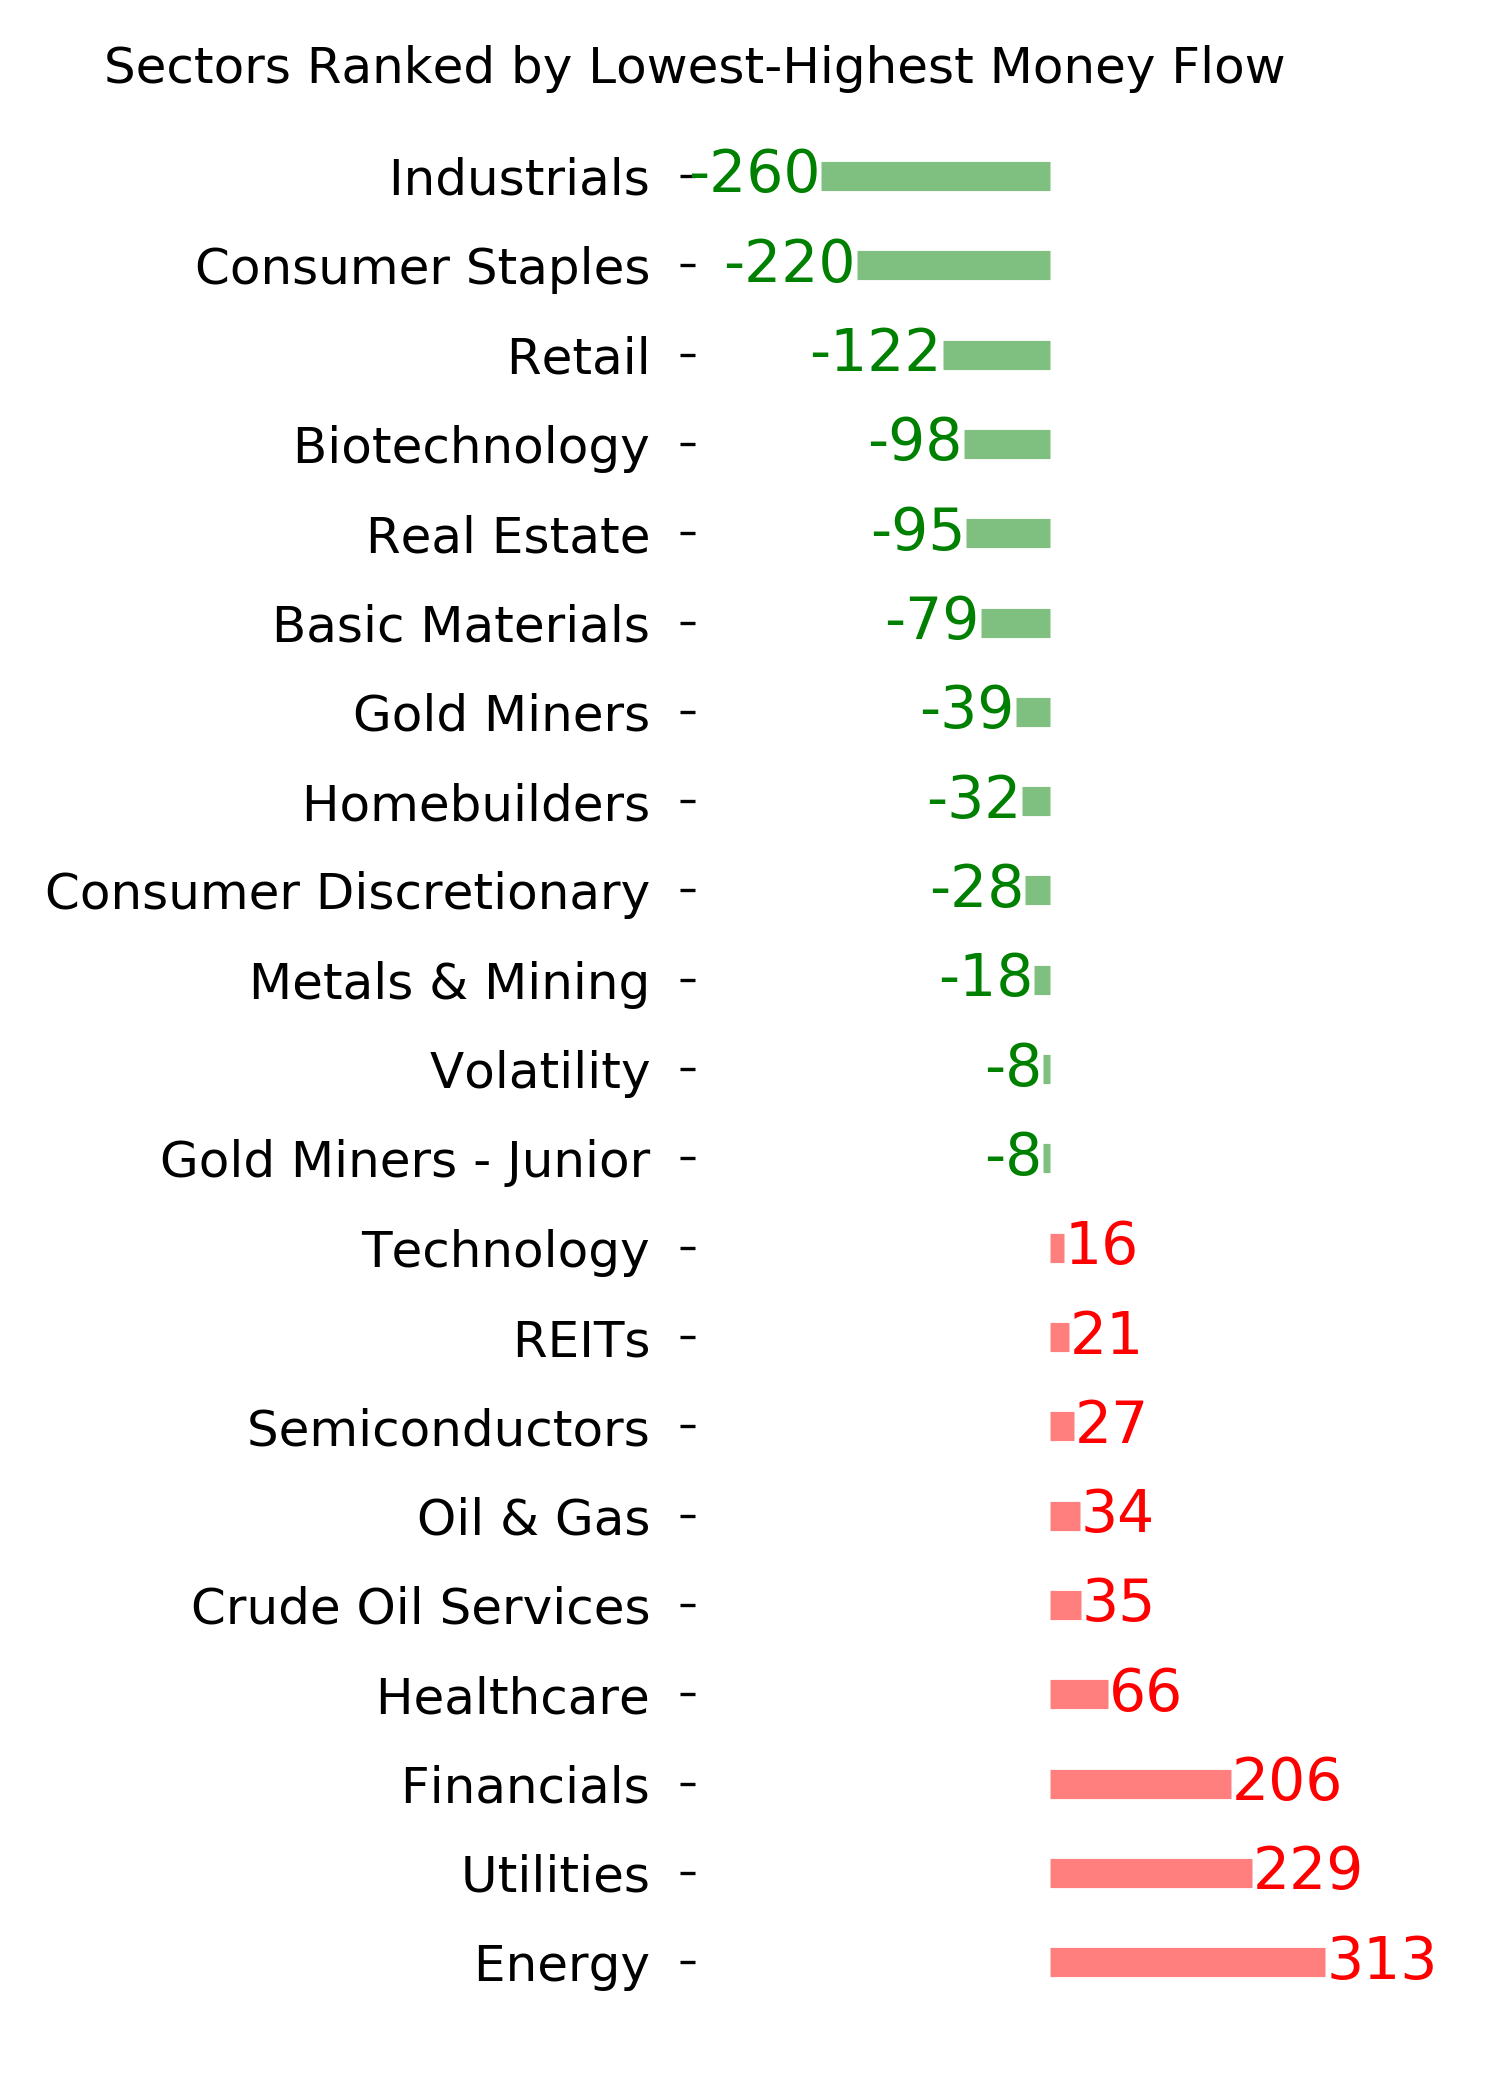
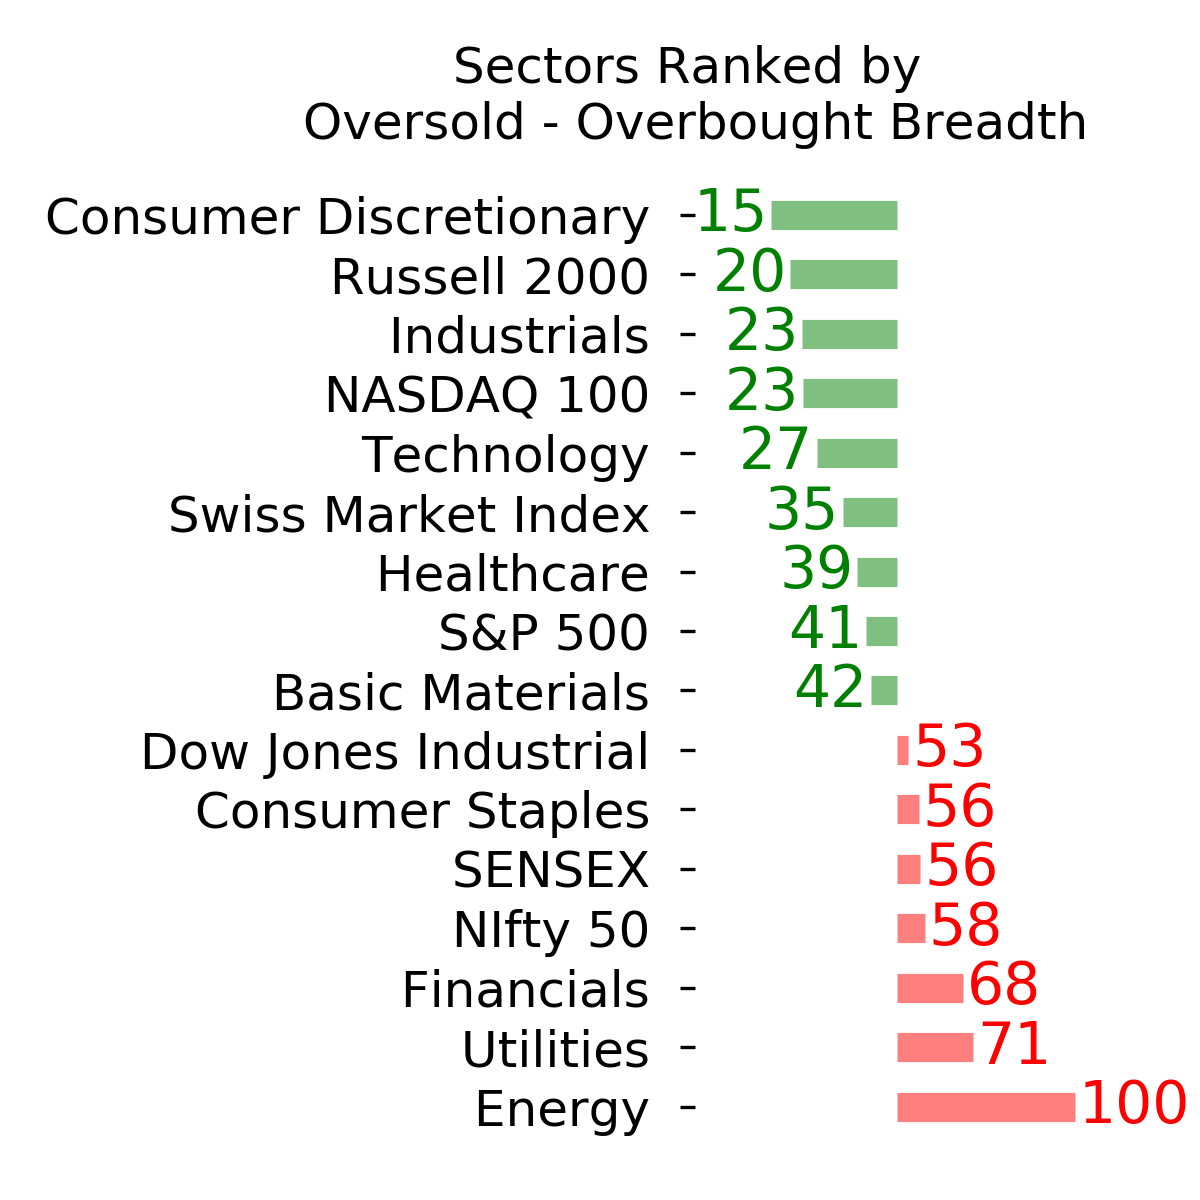
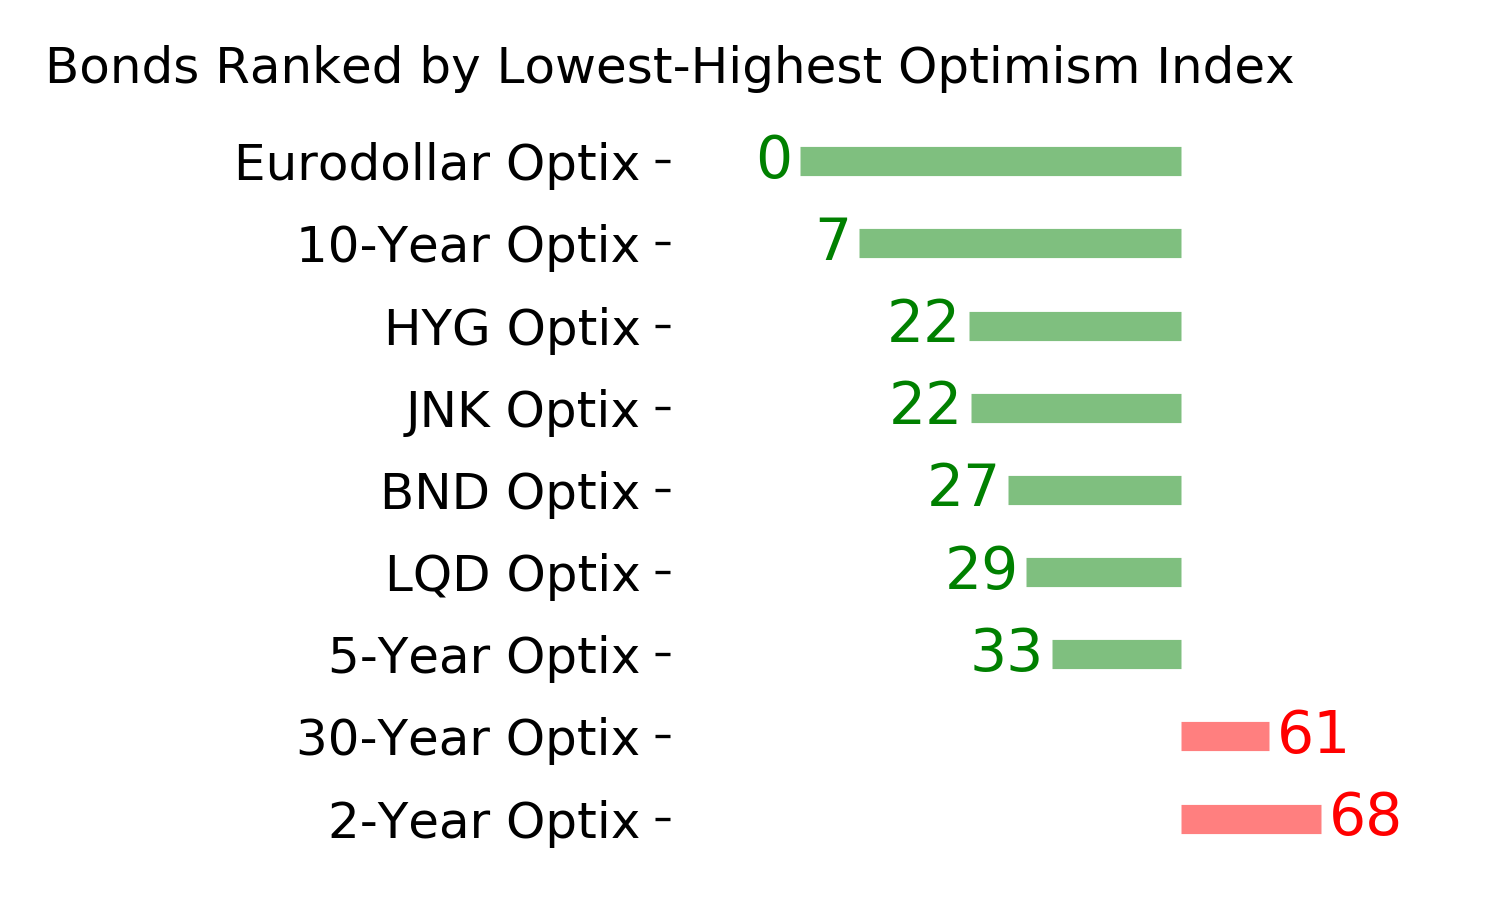
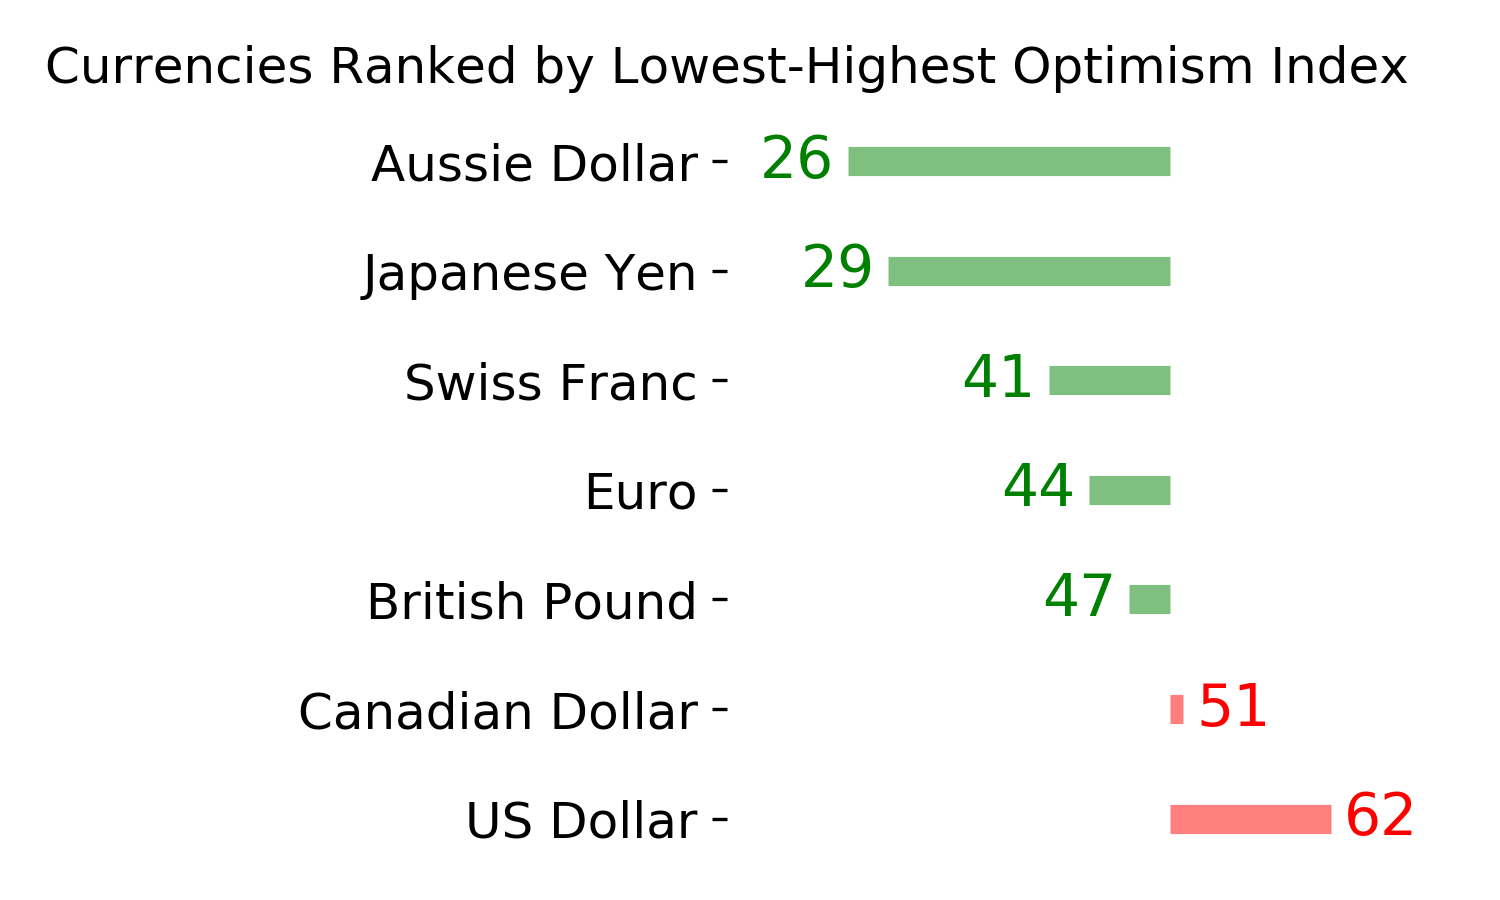
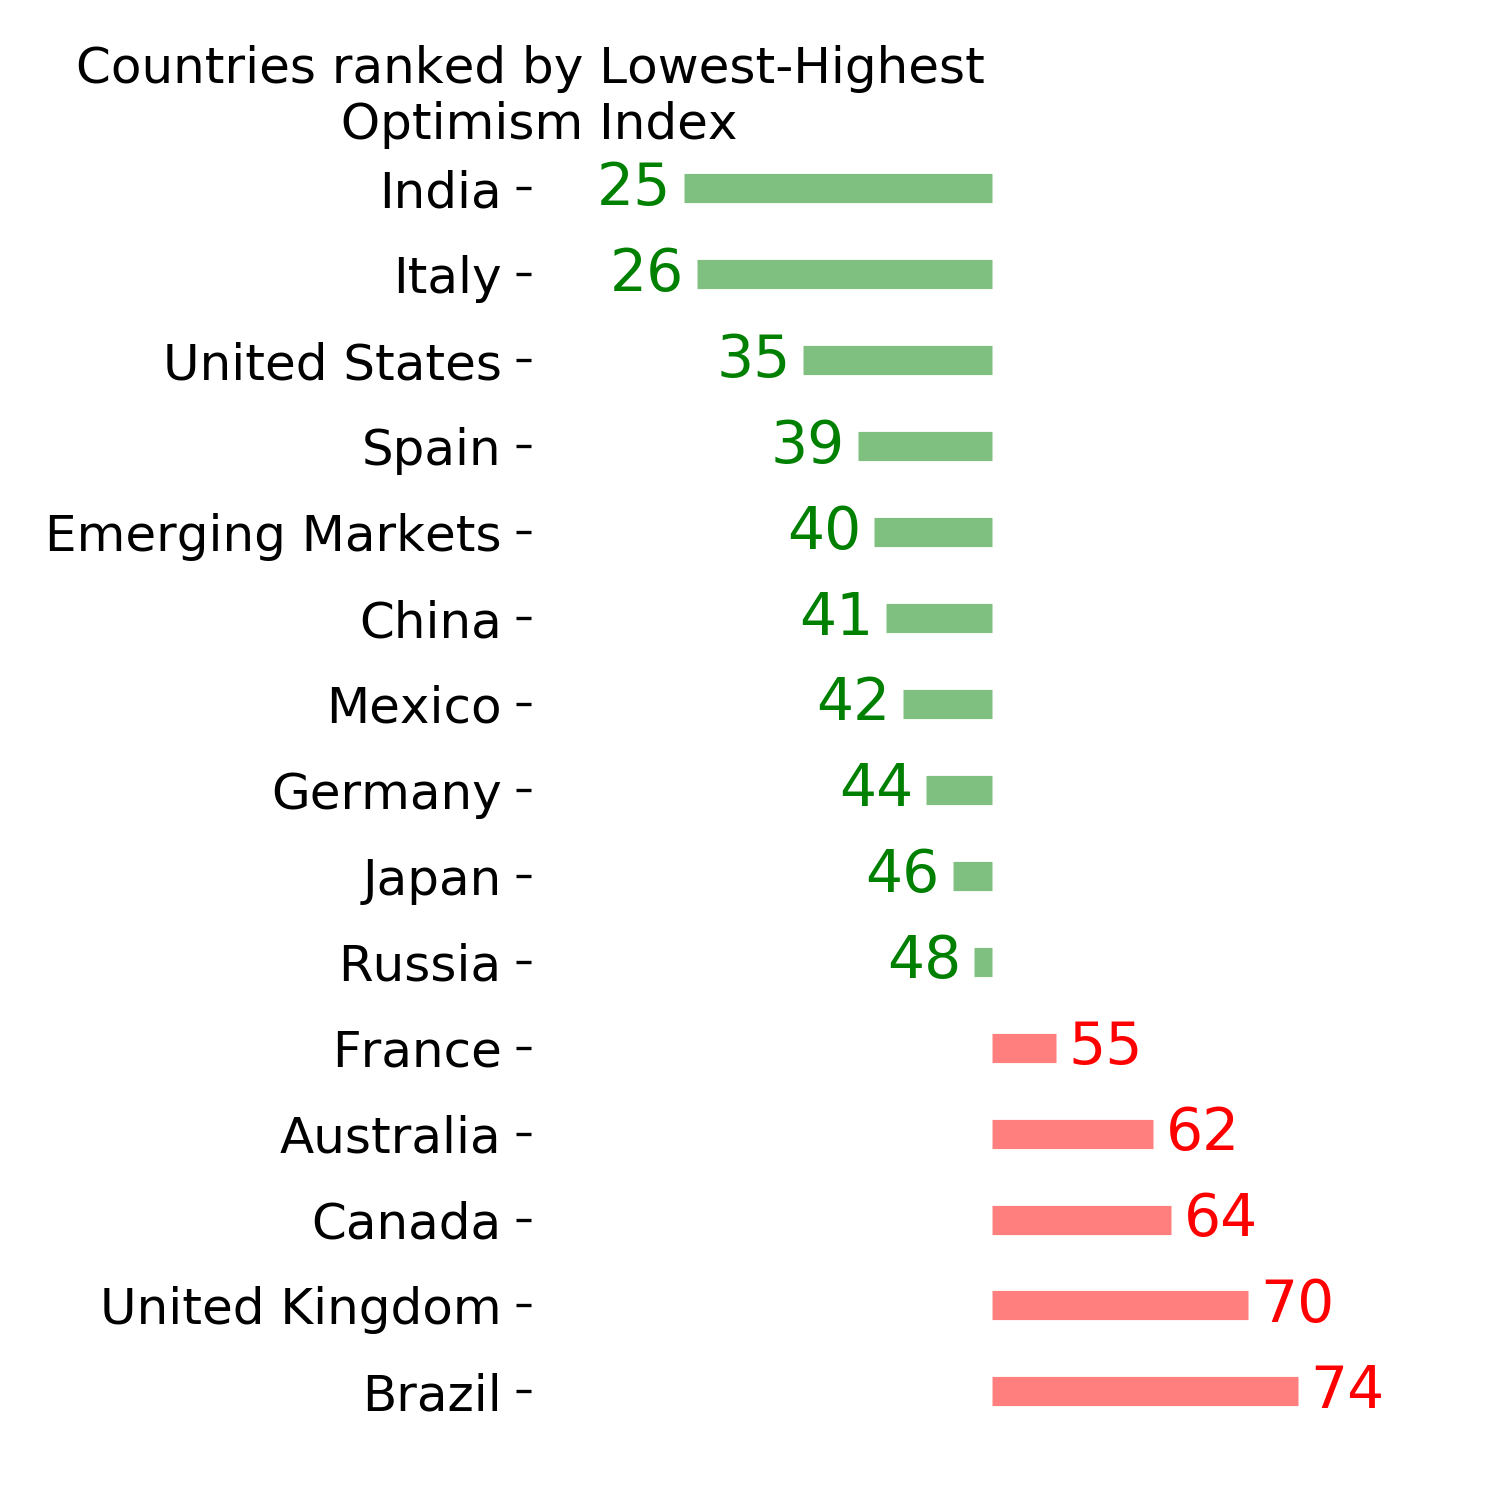
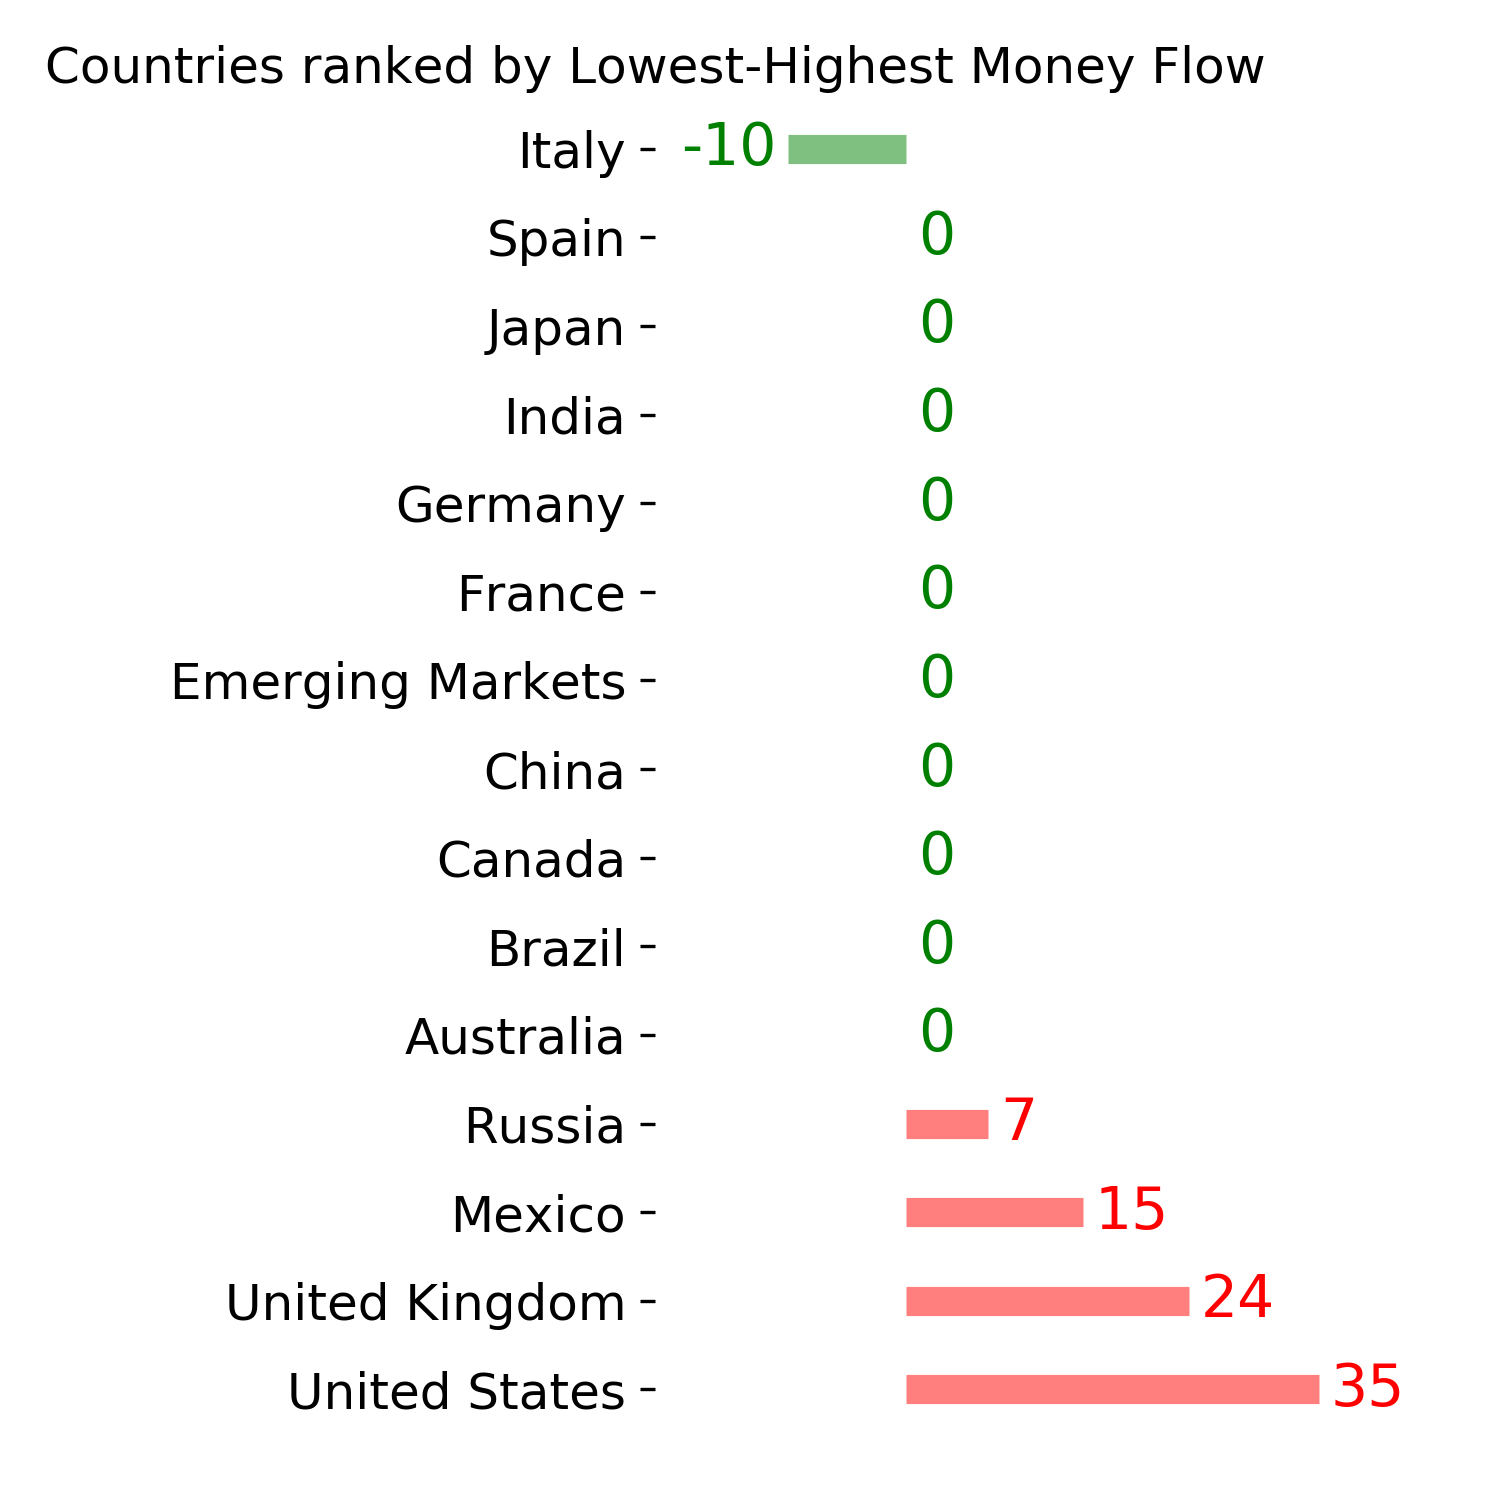
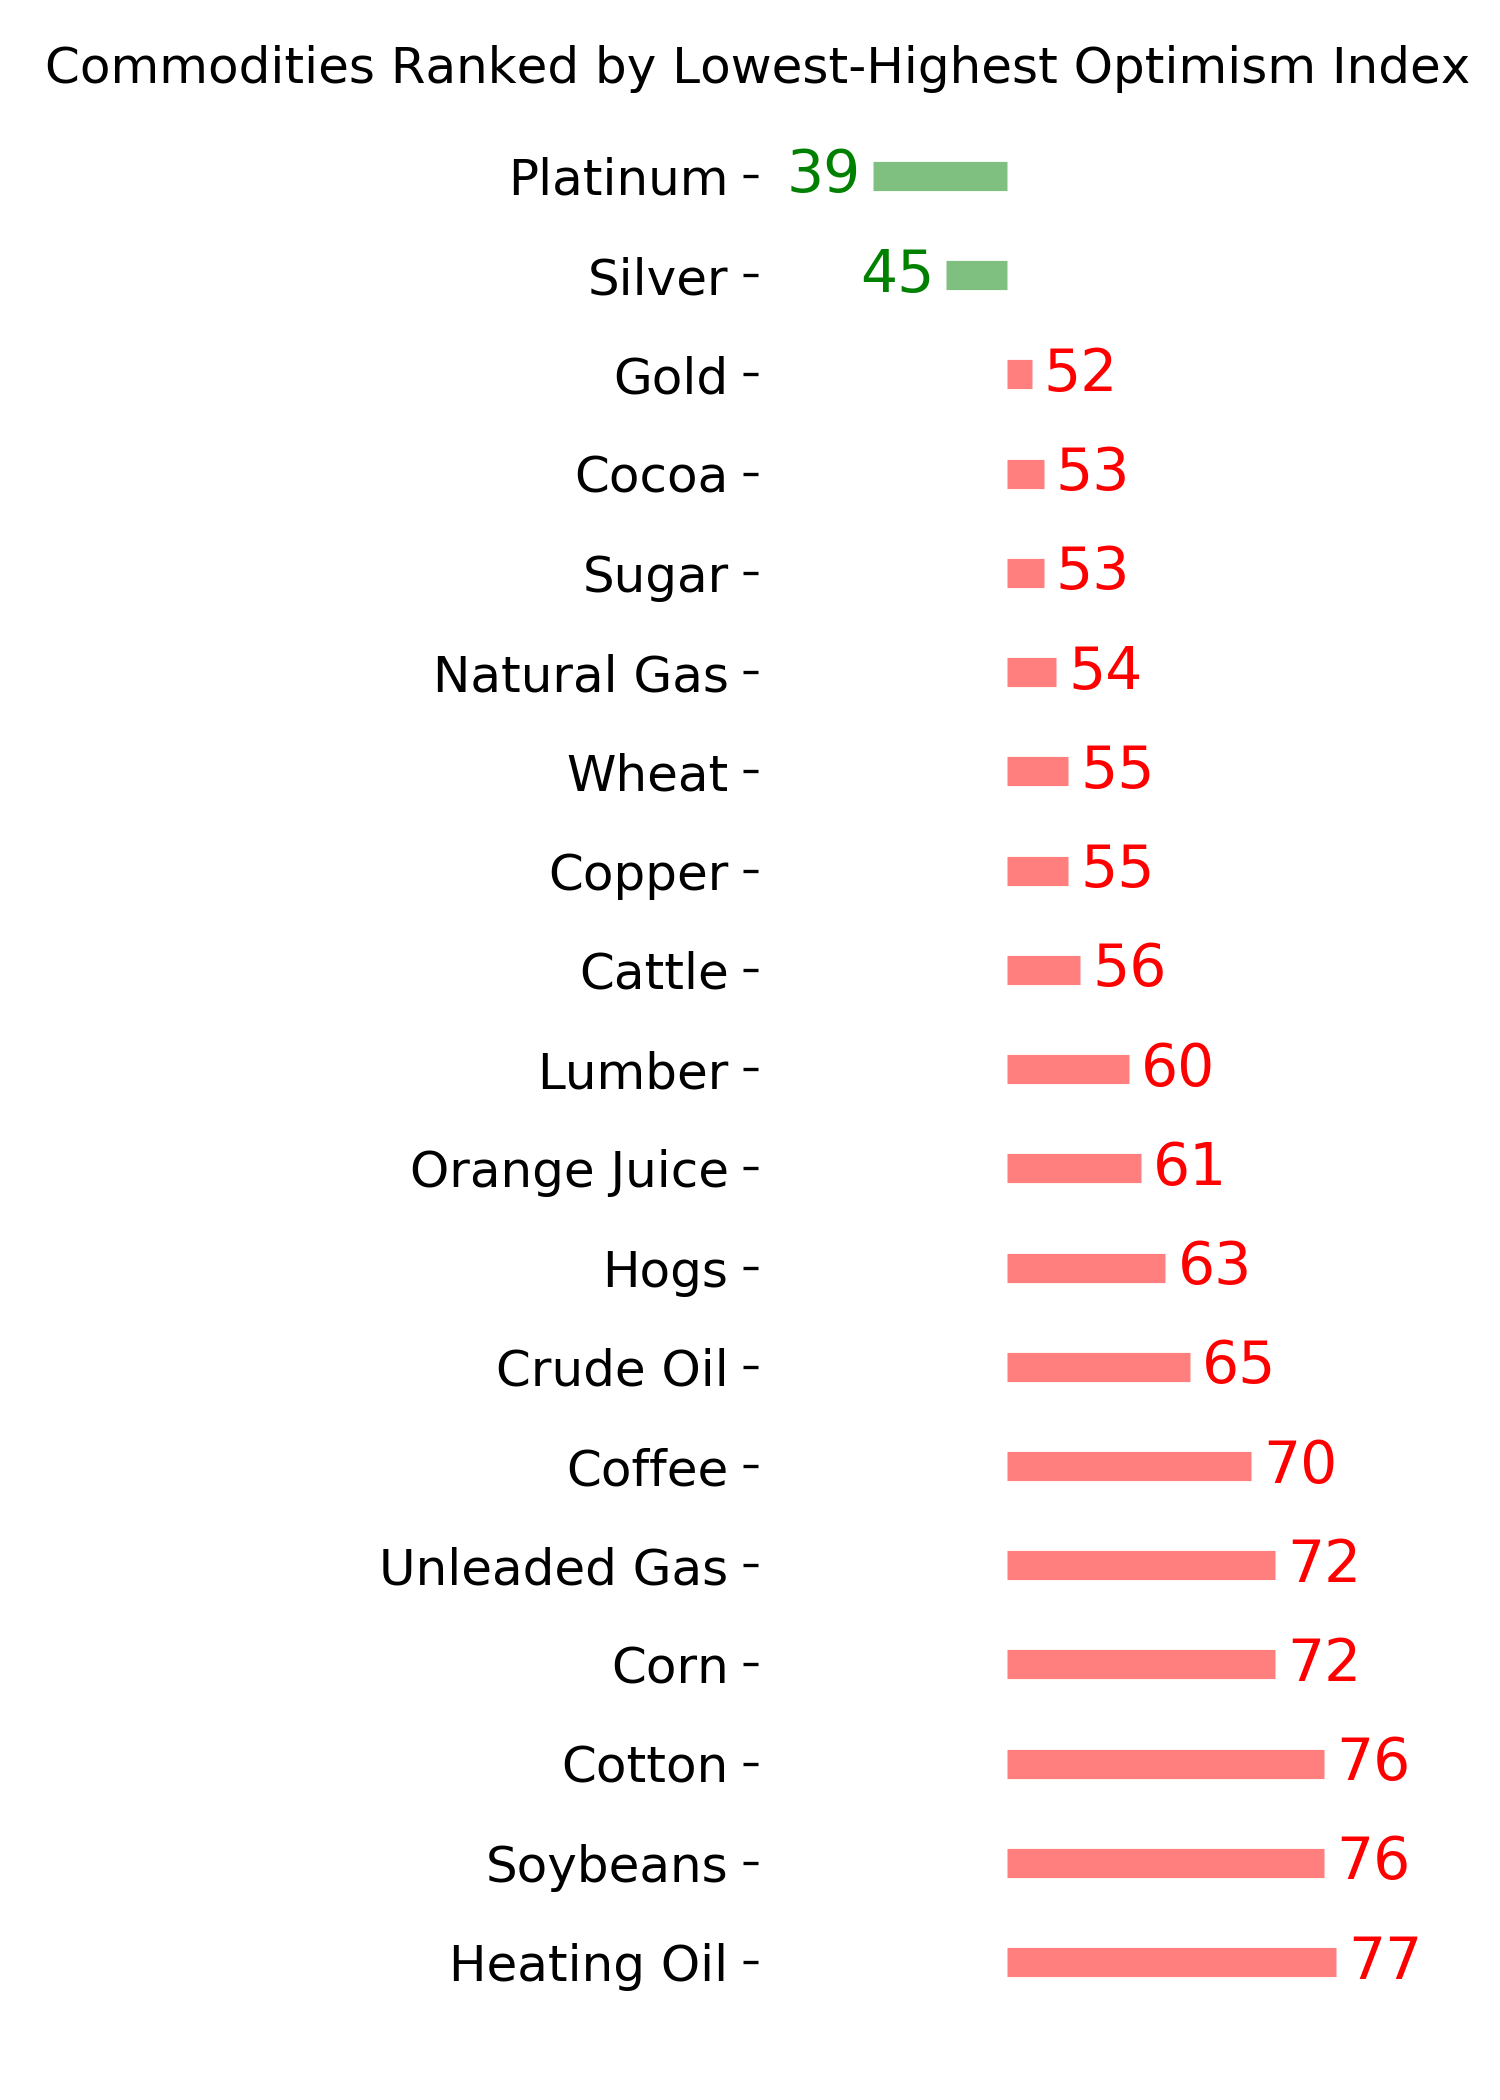
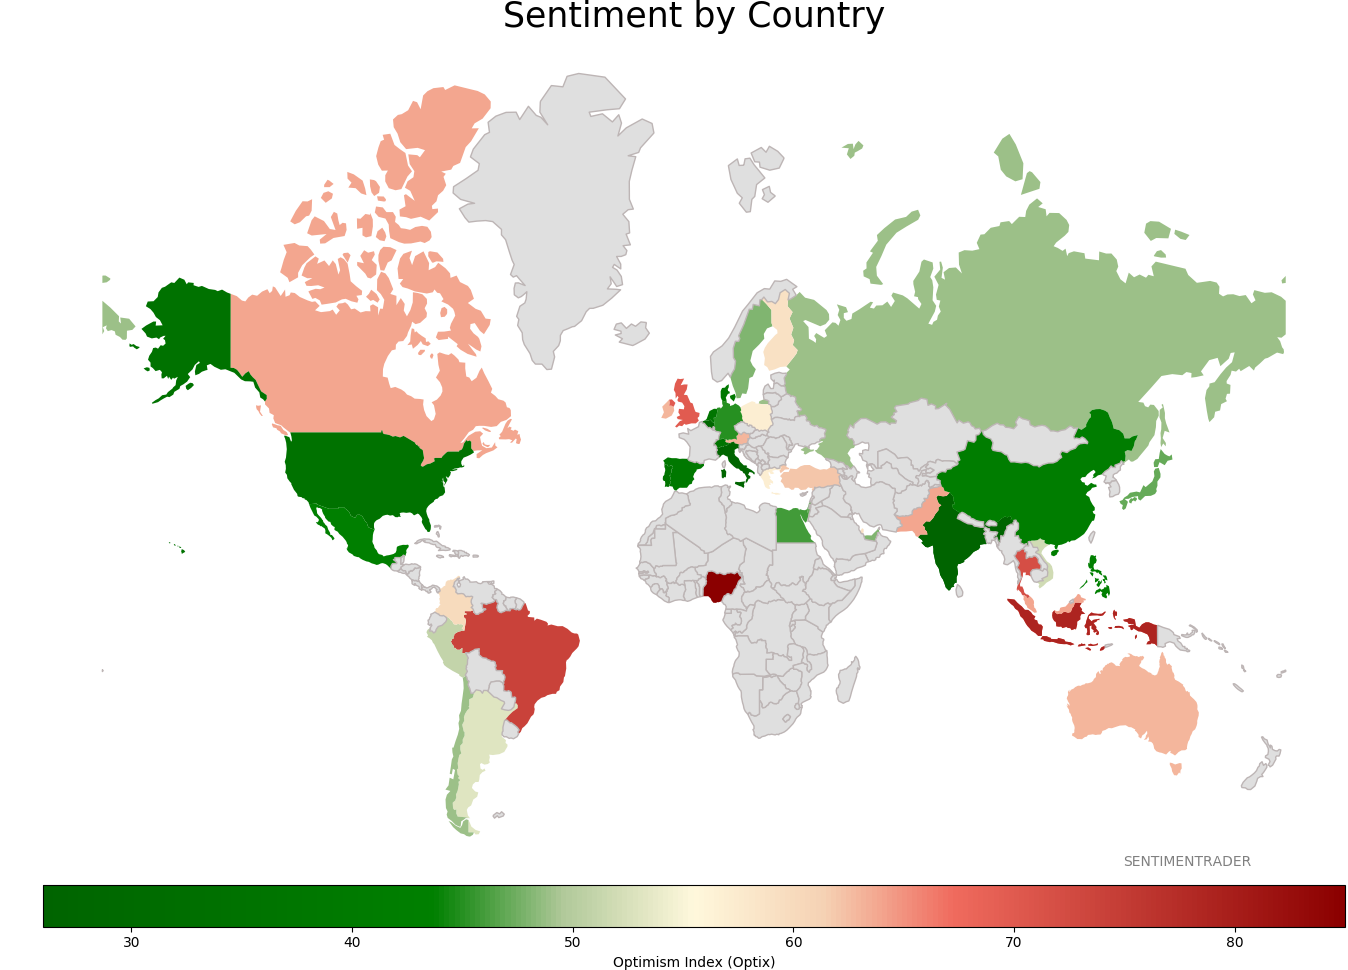
Sentiment Around The World
Optimism Index Thumbnails
|
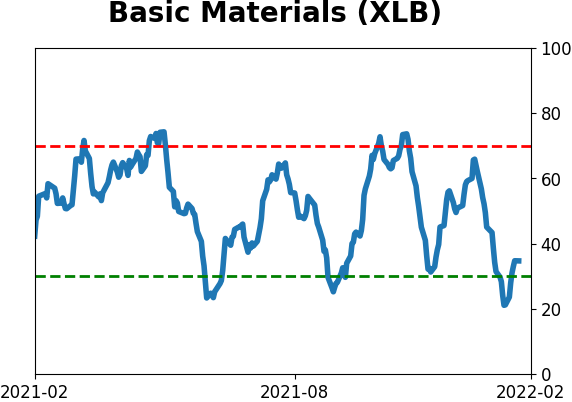
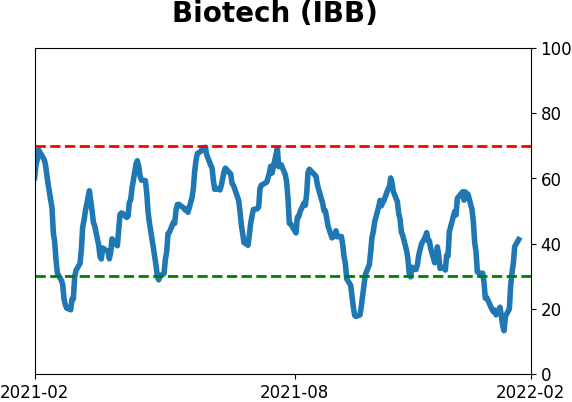
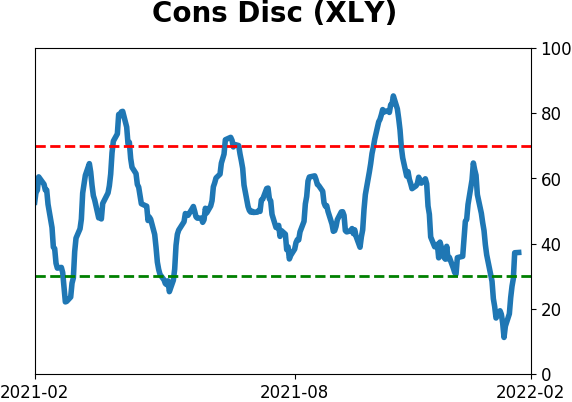
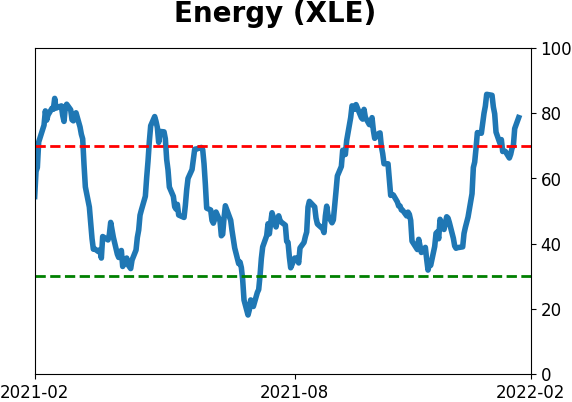
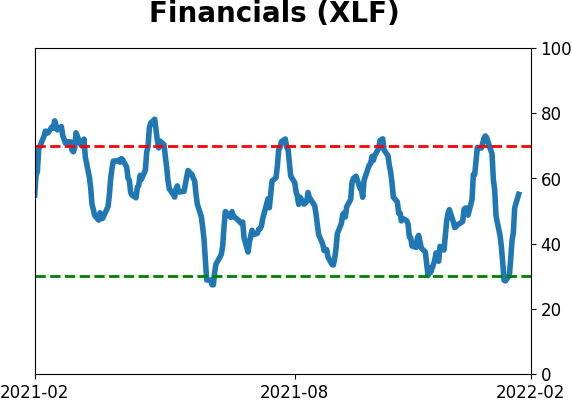
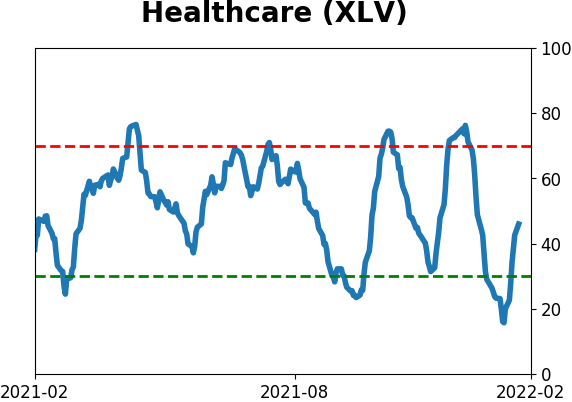
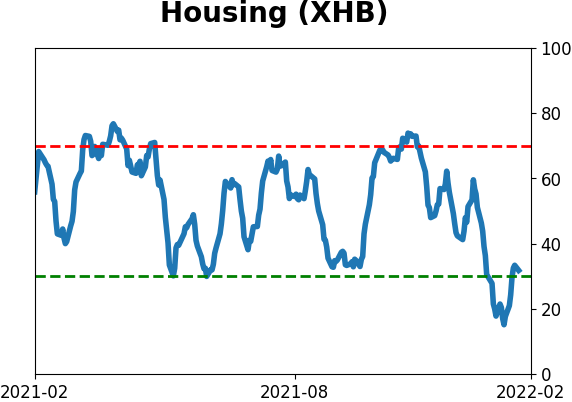
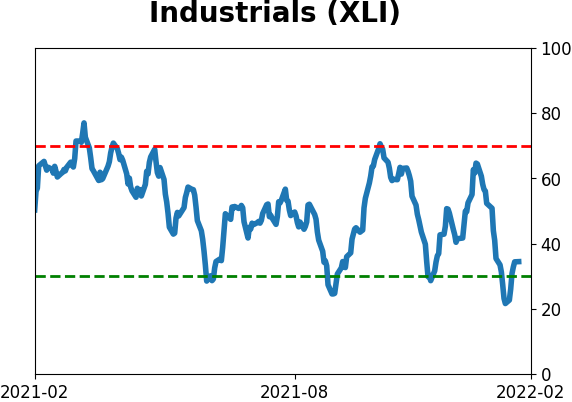
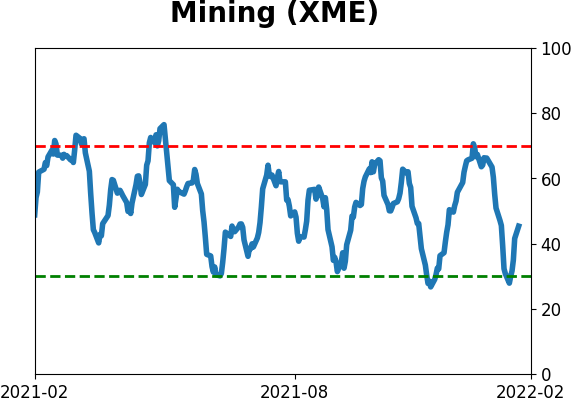
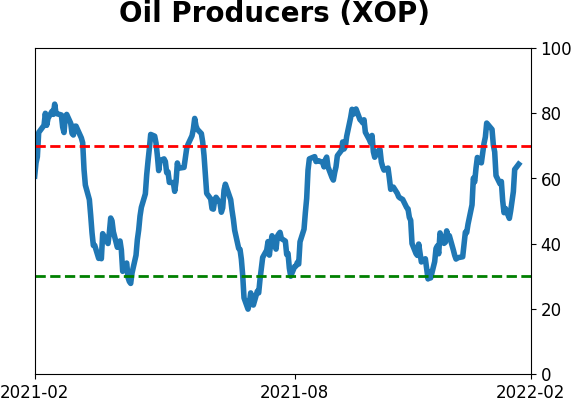
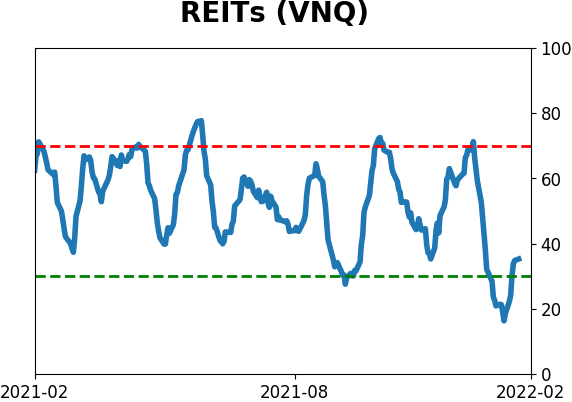
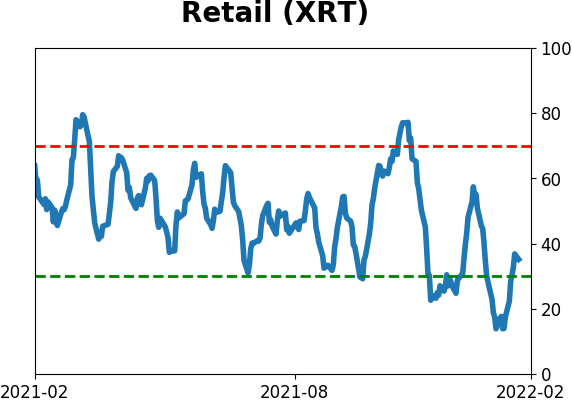
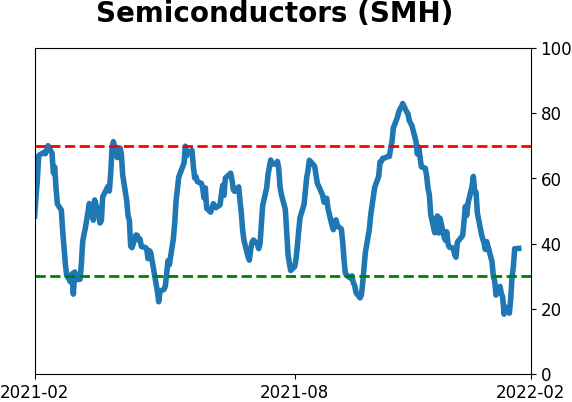
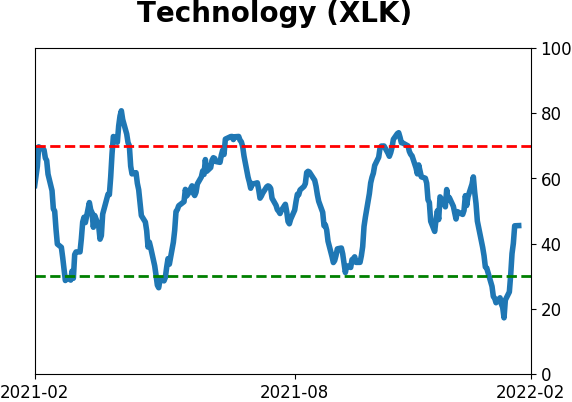
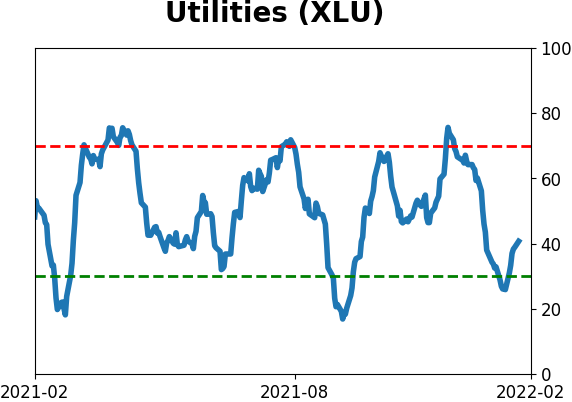
Sector ETF's - 10-Day Moving Average
|
|
|
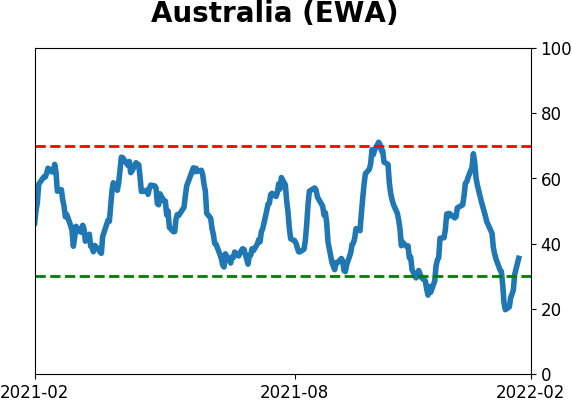
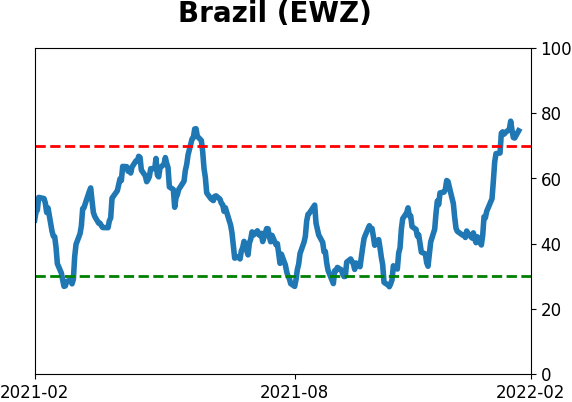
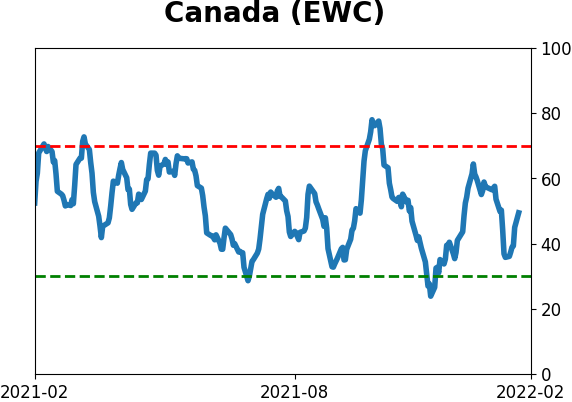
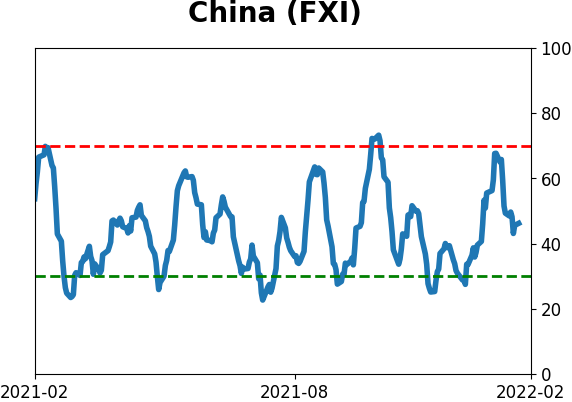
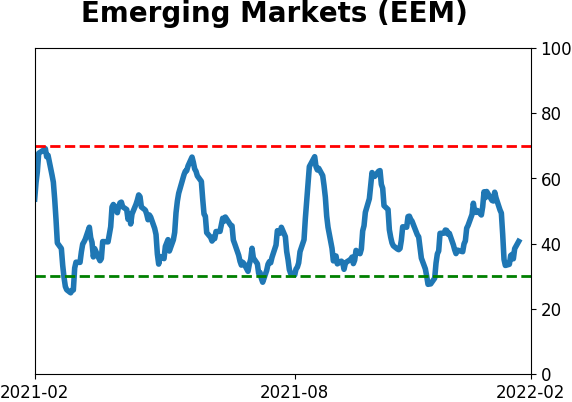
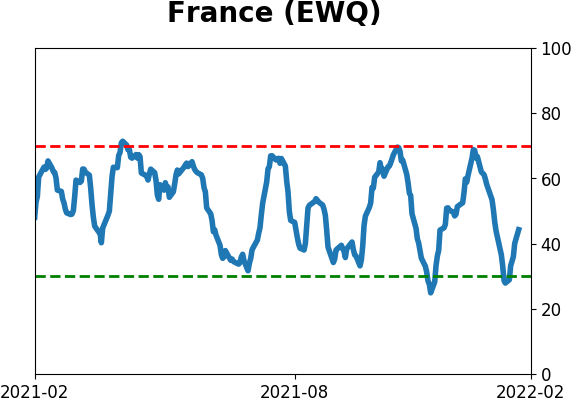
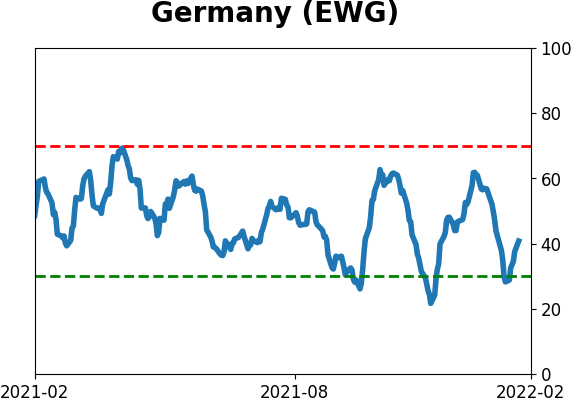
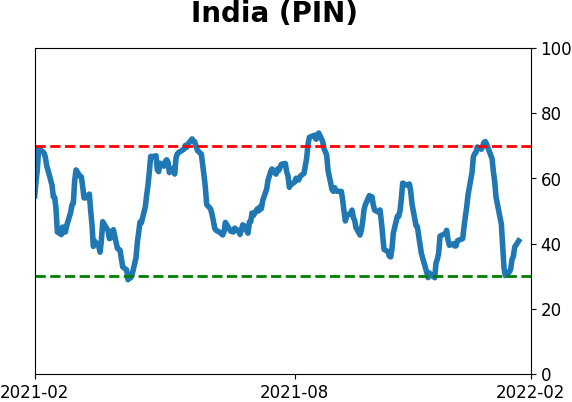
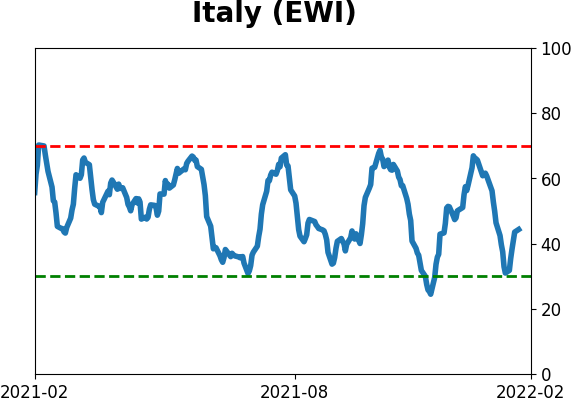
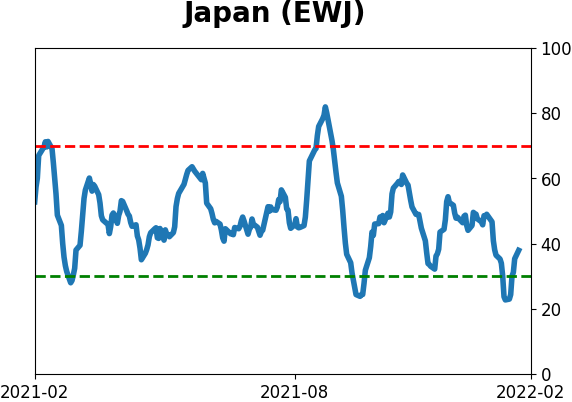
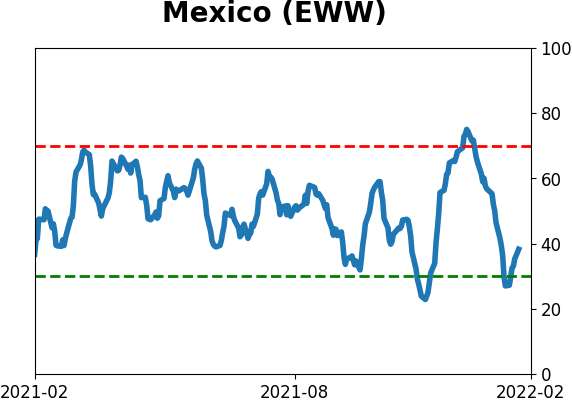
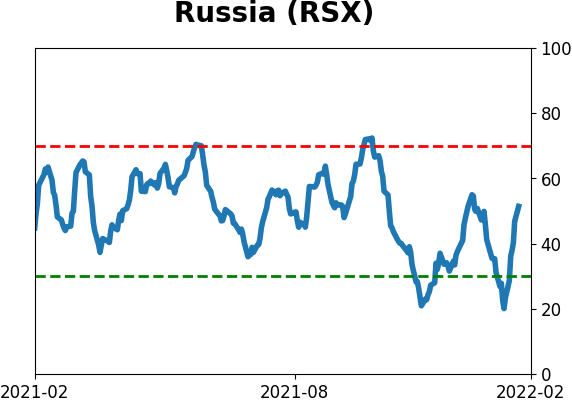
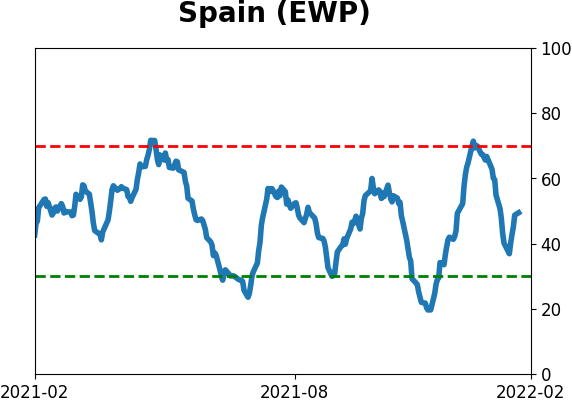
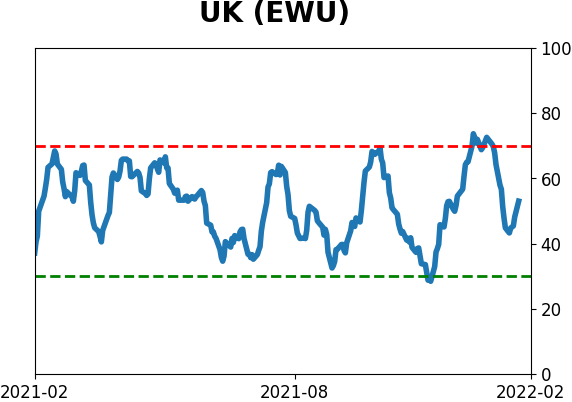
Country ETF's - 10-Day Moving Average
|
|
|
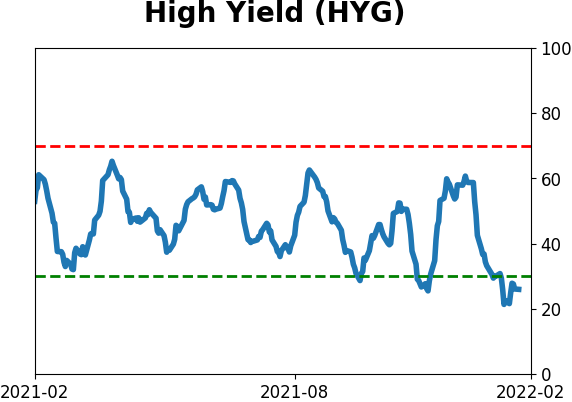
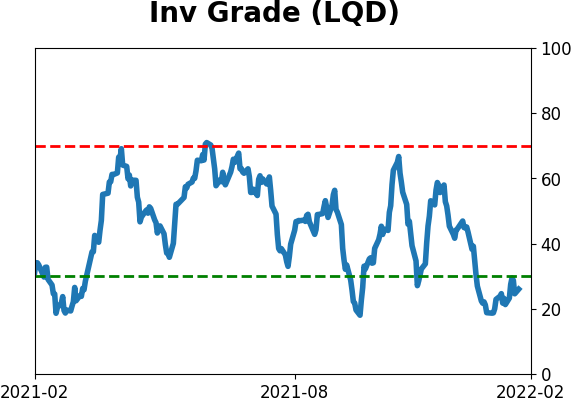
Bond ETF's - 10-Day Moving Average
|
|
|
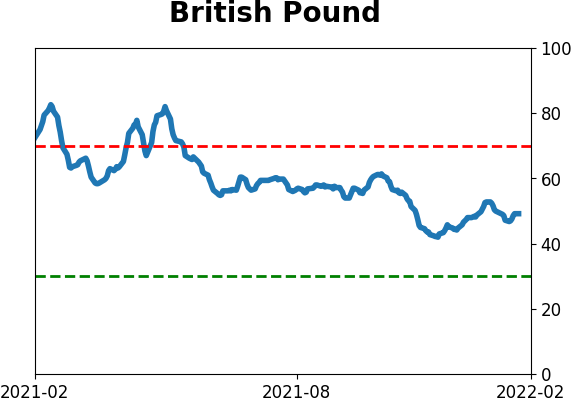
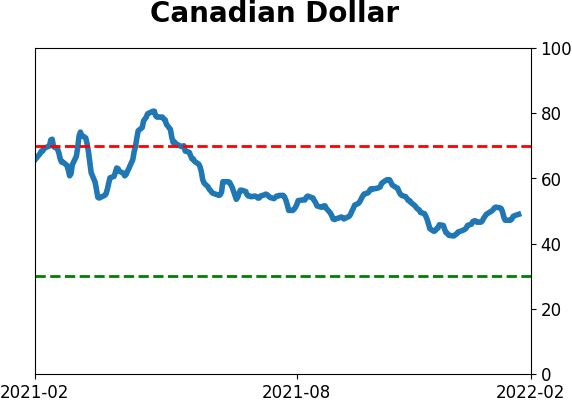
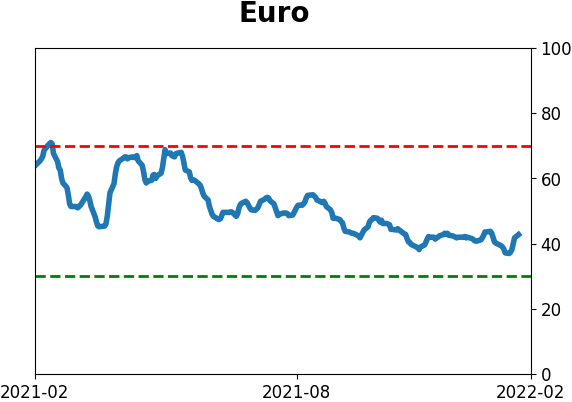
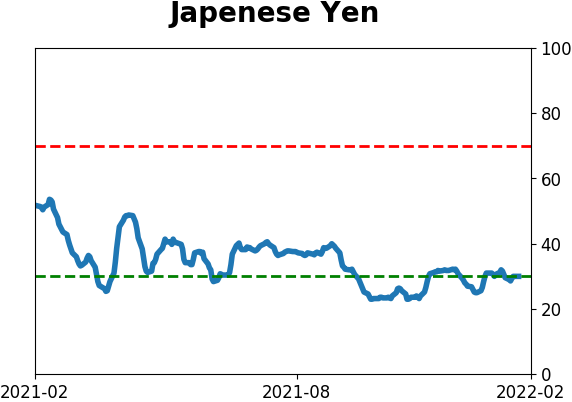
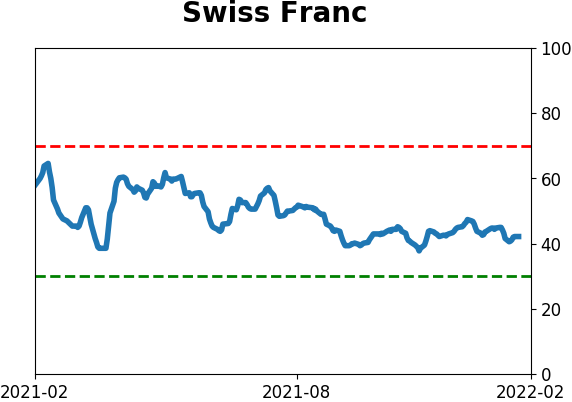
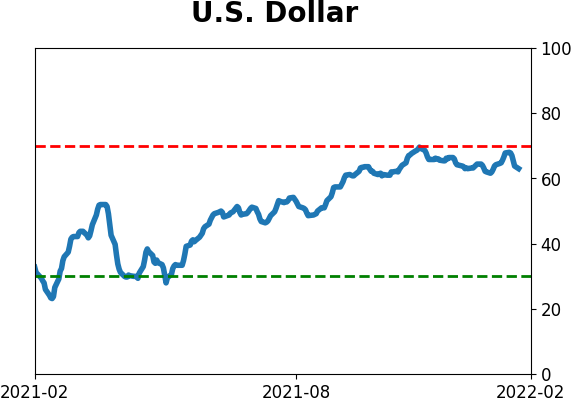
Currency ETF's - 5-Day Moving Average
|
|
|
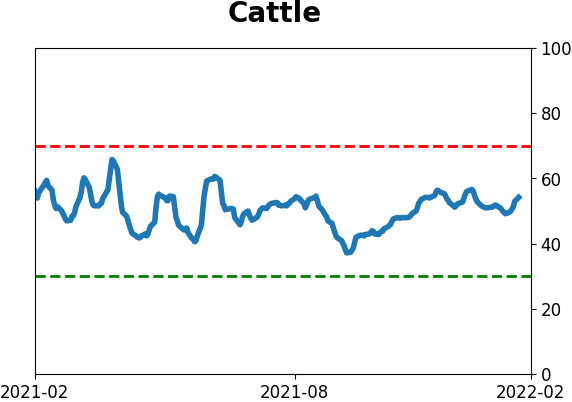
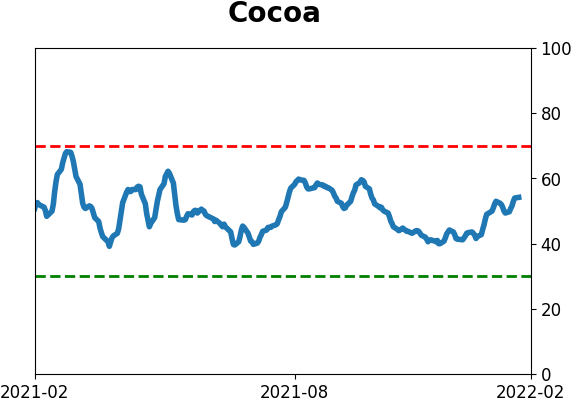
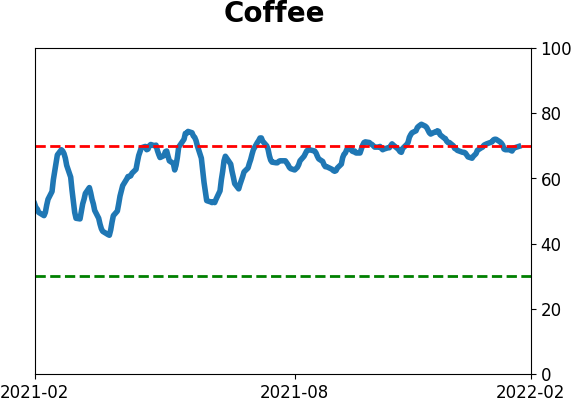
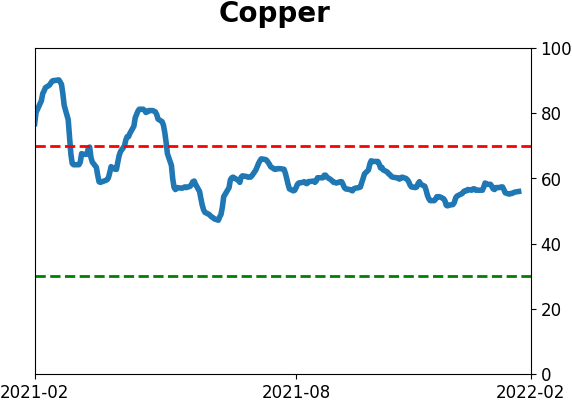
Commodity ETF's - 5-Day Moving Average
|
|