Headlines
|
|
The stock market is enjoying a period of eerie calm:
When traders are complacent, they don't price in any major changes to their expectations. We're seeing that now, as the 50-day standard deviation in the VIX "fear gauge" is among the lowest since 1990. Other times it got this low, volatility tended to rise but that didn't necessarily mean declines for stocks.
|
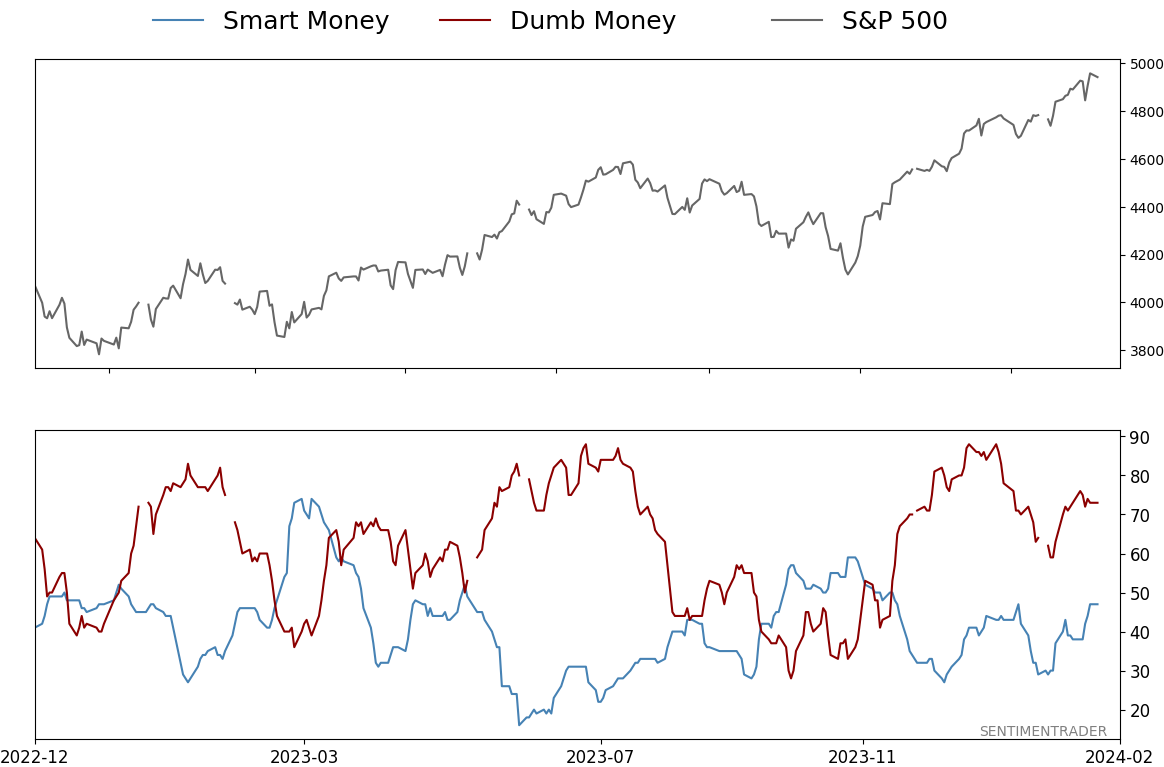
Smart / Dumb Money Confidence
|
Smart Money Confidence: 47%
Dumb Money Confidence: 73%
|
|
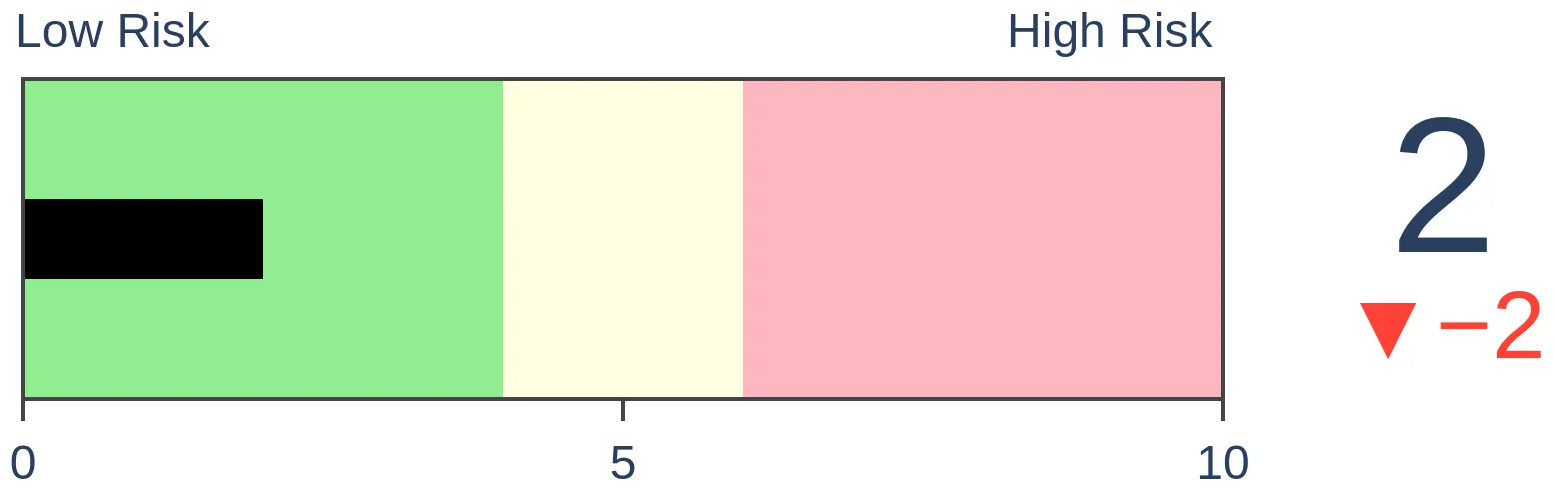
Risk Levels
Stocks Short-Term
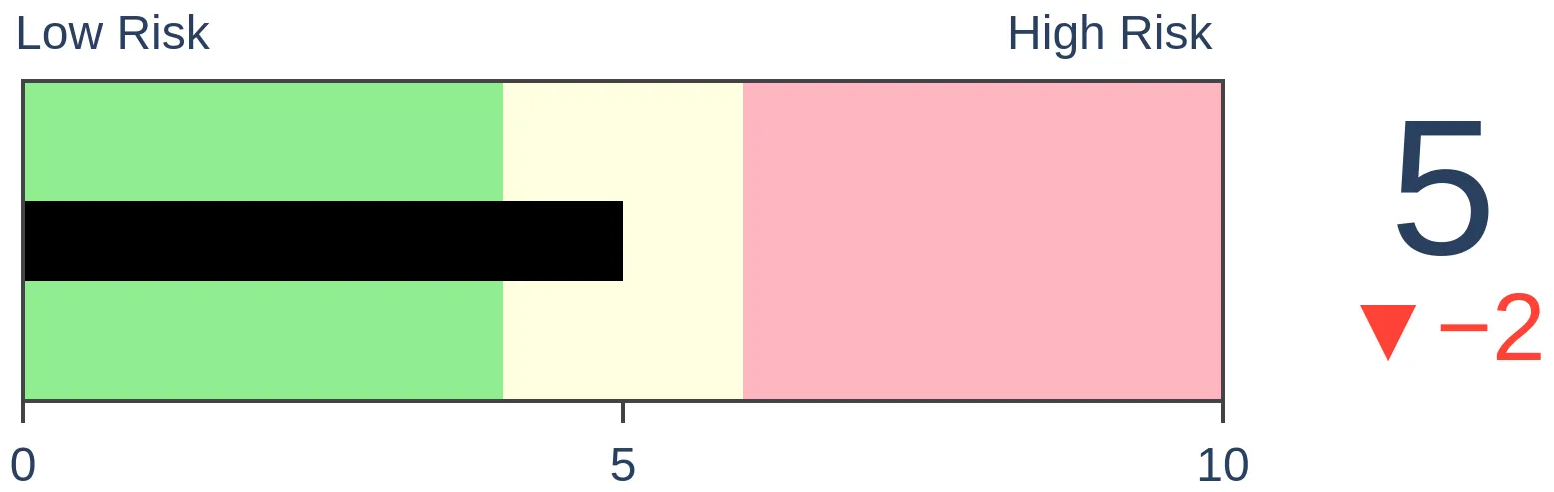
|
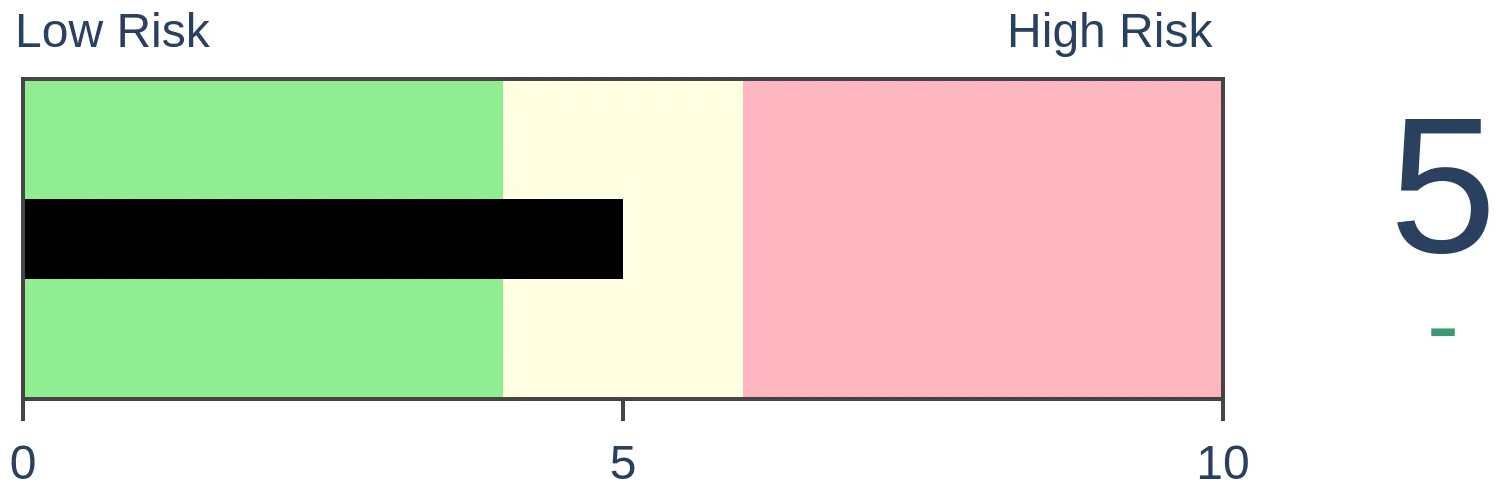
Stocks Medium-Term
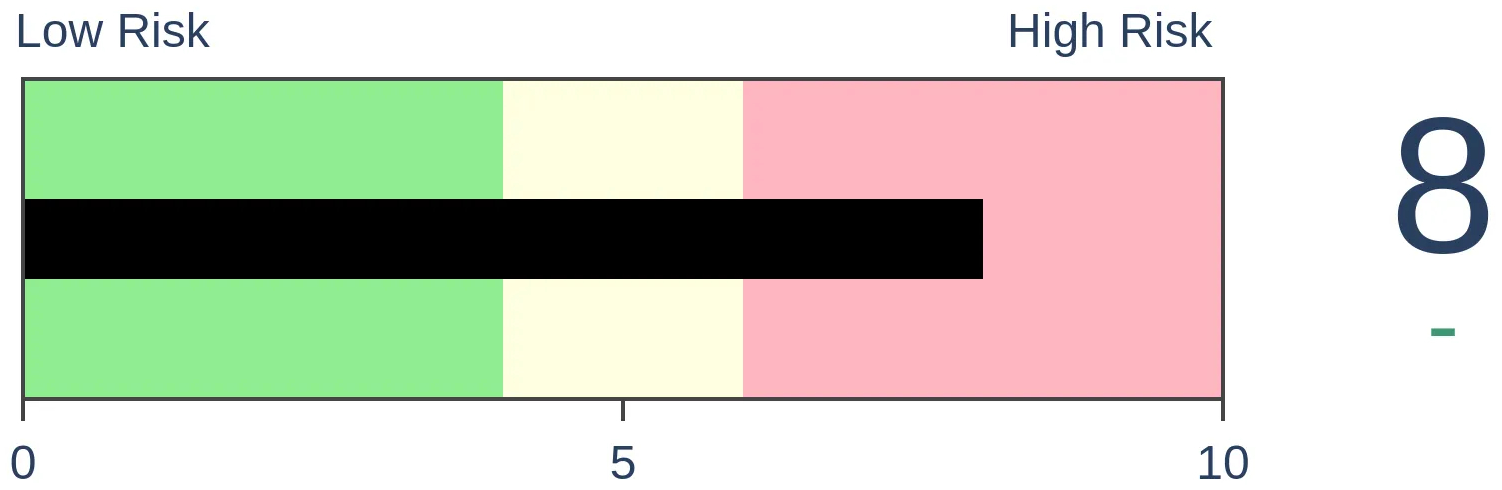
|
|
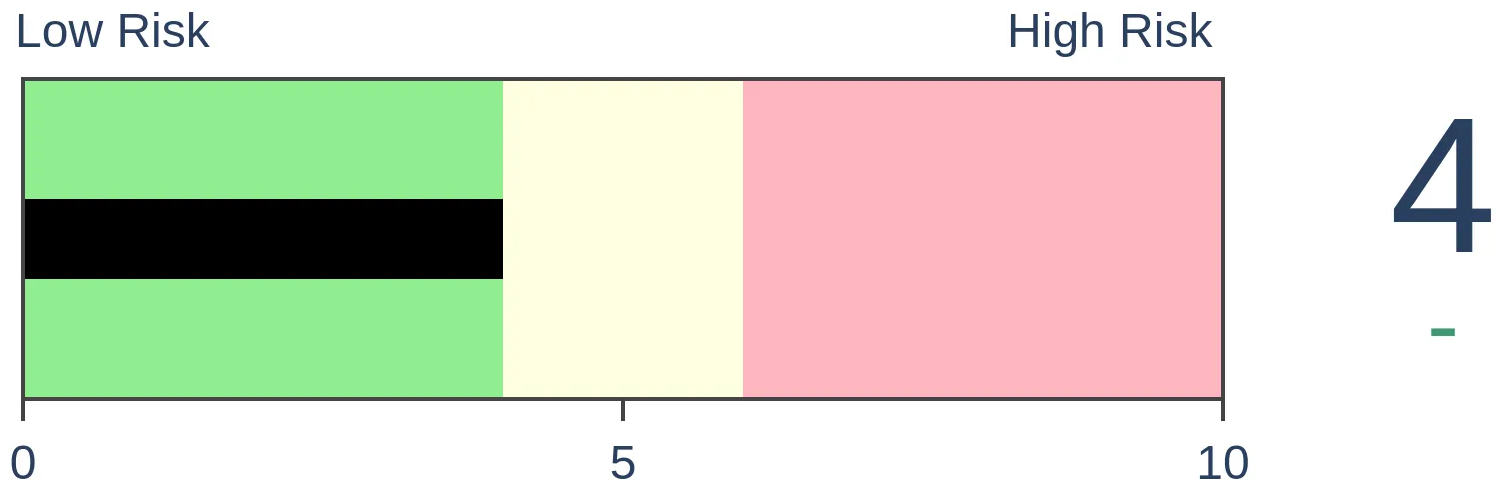
Bonds
|
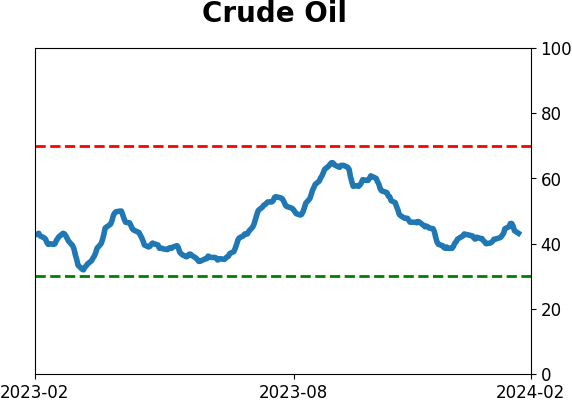
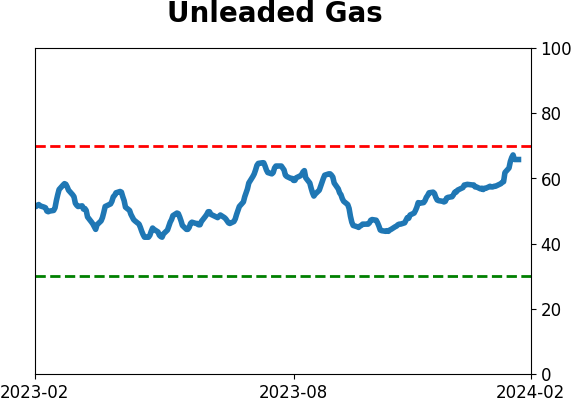
Crude Oil
|
|
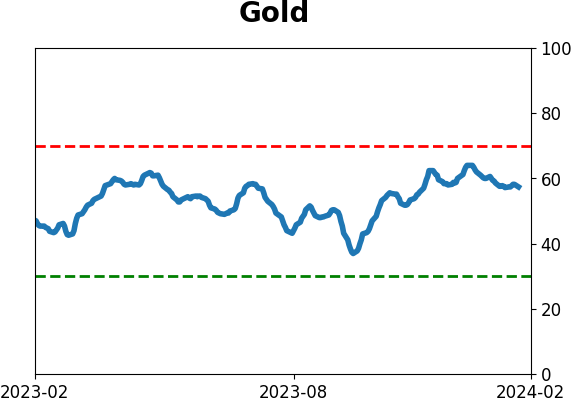
Gold
|
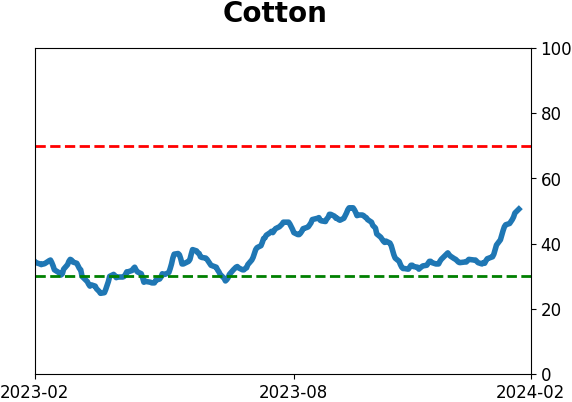
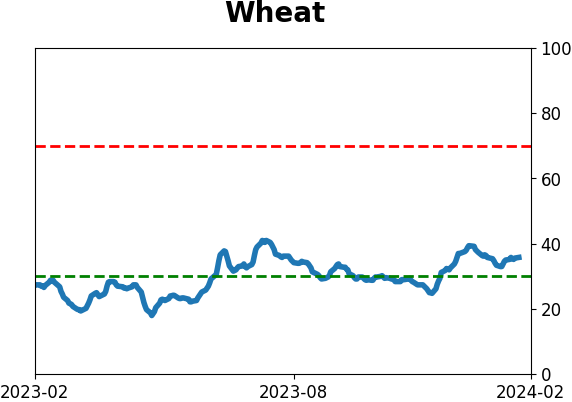
Agriculture

|
|
Research
By Jason Goepfert
BOTTOM LINE
When traders are complacent, they don't price in any major changes to their expectations. We're seeing that now, as the 50-day standard deviation in the VIX "fear gauge" is among the lowest since 1990. Other times it got this low, volatility tended to rise but that didn't necessarily mean declines for stocks.
FORECAST / TIMEFRAME
None
|
Key points:
- Over the past 50 days, the VIX "fear gauge" has barely moved
- Its standard deviation over that time span is now one of the lowest since 1990
- After similar behavior, volatility tended to rise, but that didn't have a consistent negative impact on stocks
The VIX has gone into hibernation
It's awfully quiet out there. Too quiet, if you ask some. And that always makes contrarians twitchy.
The VIX "fear gauge" of S&P 500 implied volatility has settled at a low level for months, and it hasn't moved all that much from day to day. This reflects a sense of complacency among options traders as they haven't felt the need to dramatically change their view of the S&P's likely swings over the next 30 days.
As a result, the standard deviation of daily price changes (not the deviation of the price itself or percentage changes) for the VIX over the past 50 sessions has plunged to one of the lowest readings on record.
When it has been exceptionally low, the VIX has tended to show abnormally large positive changes in the days afterward. Since it is a mean-reverting data series, it also shows significant daily declines when the standard deviation is abnormally high.
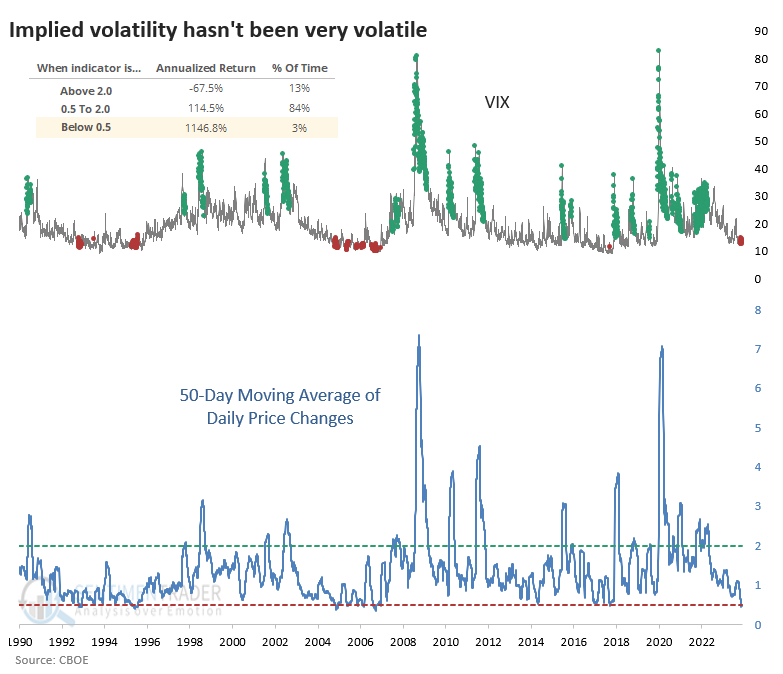
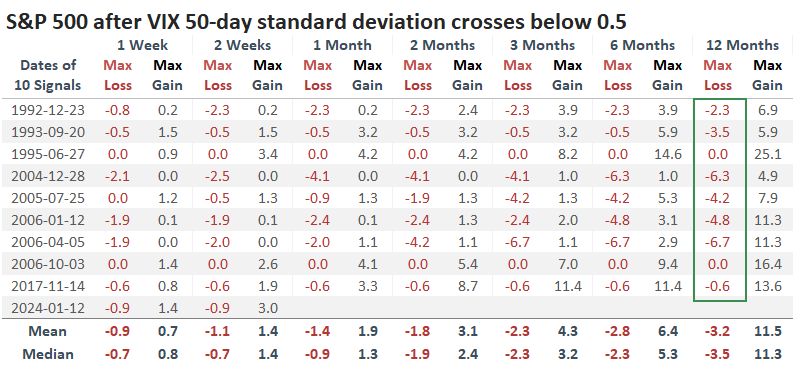
The table below shows every time since 1990 when the 50-day standard deviation of the VIX fell below 0.5. Note that it dropped below this level a few weeks ago and has remained suppressed since then. Overall, the VIX tended to show its most consistent rebounds over the next 2-3 months. It was higher either 2 or 3 months later after nine out of ten signals.
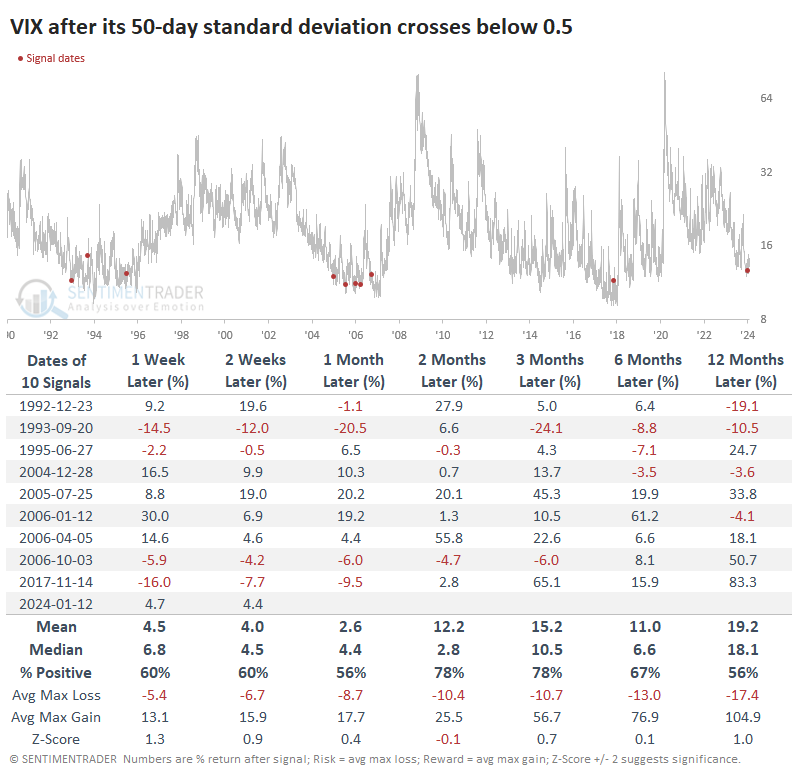
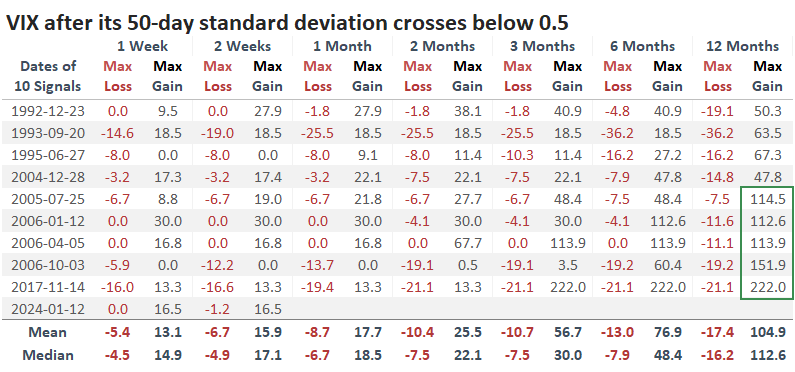
It's interesting to note that after the last five signals, the VIX at least doubled at some point within the following year. For those who don't trade options, it's difficult to capitalize on this phenomenon directly, as volatility ETFs are terrible investments. They might make decent trading vehicles, but they're disastrous for holding any longer than a few days.
Lower returns for stocks, but not outright declines
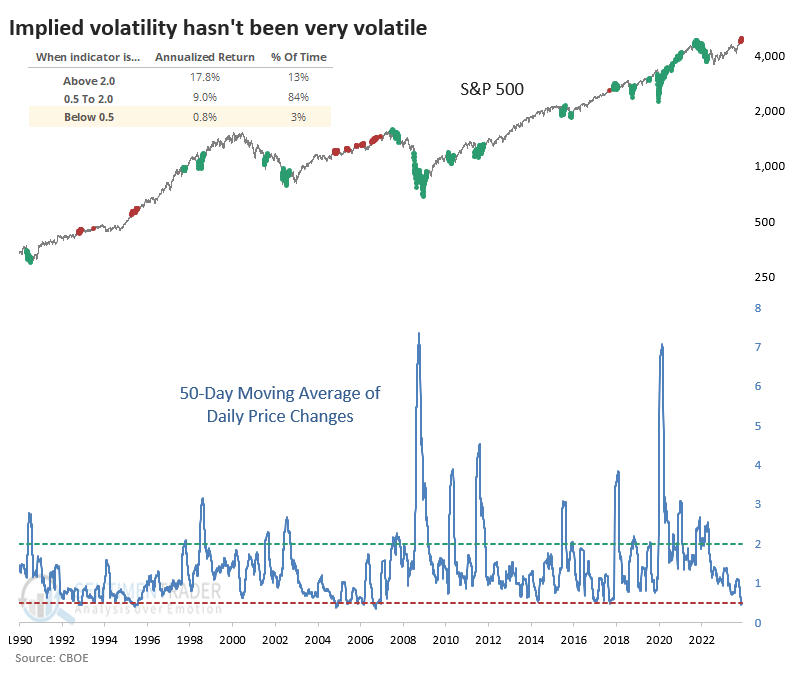
Let's look at the impact on the S&P 500 after suppressed daily movements in the VIX. We can see from the chart that the annualized returns in the S&P have been meager when complacency was so high.
Just because annualized returns were low doesn't mean the S&P often declined. It was quite the opposite. While returns weren't highly positive, they still tended to be positive. And over the next year, the index showed a gain after all ten signals.
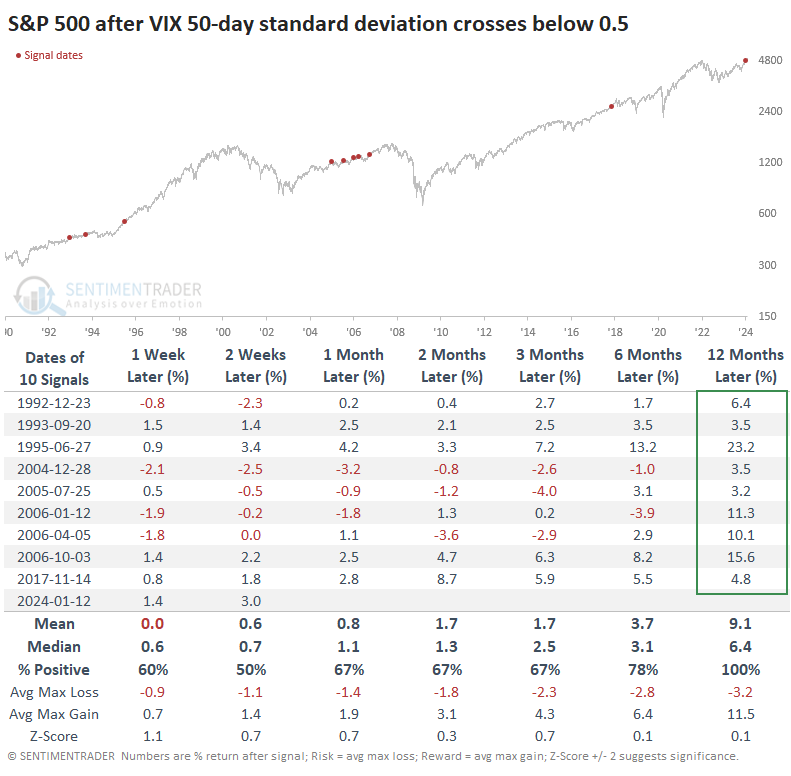
The table of maximum gains and losses across time frames shows us that the S&P didn't decline more than -6.7% at any point within the next year after any signal.
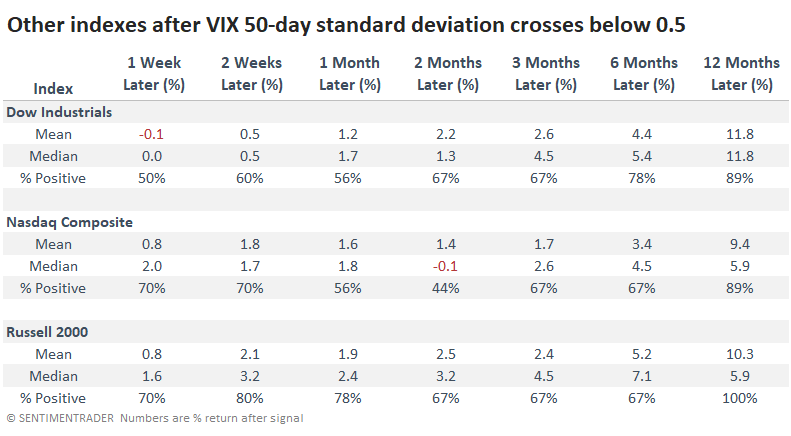
The other major stock indexes also showed mostly positive behavior. The Nasdaq Composite was the worst of the lot over the next two months, with a negative median return. Small caps were the most positive over the next year.
What the research tells us...
The VIX isn't moving much, and that's a pretty reliable signal that things will change soon. Implied volatility will likely get significantly more "twitchy" in the weeks and months ahead. That should benefit strategies that directly play on higher volatility, such as long straddles and strangles. But for investors who aren't betting directly on volatility, it hasn't proved to be a good reason to sell in and of itself. While forward returns did show a consistent tendency to be lower than average, it wasn't successful at preceding outright declines.
Indicators at Extremes
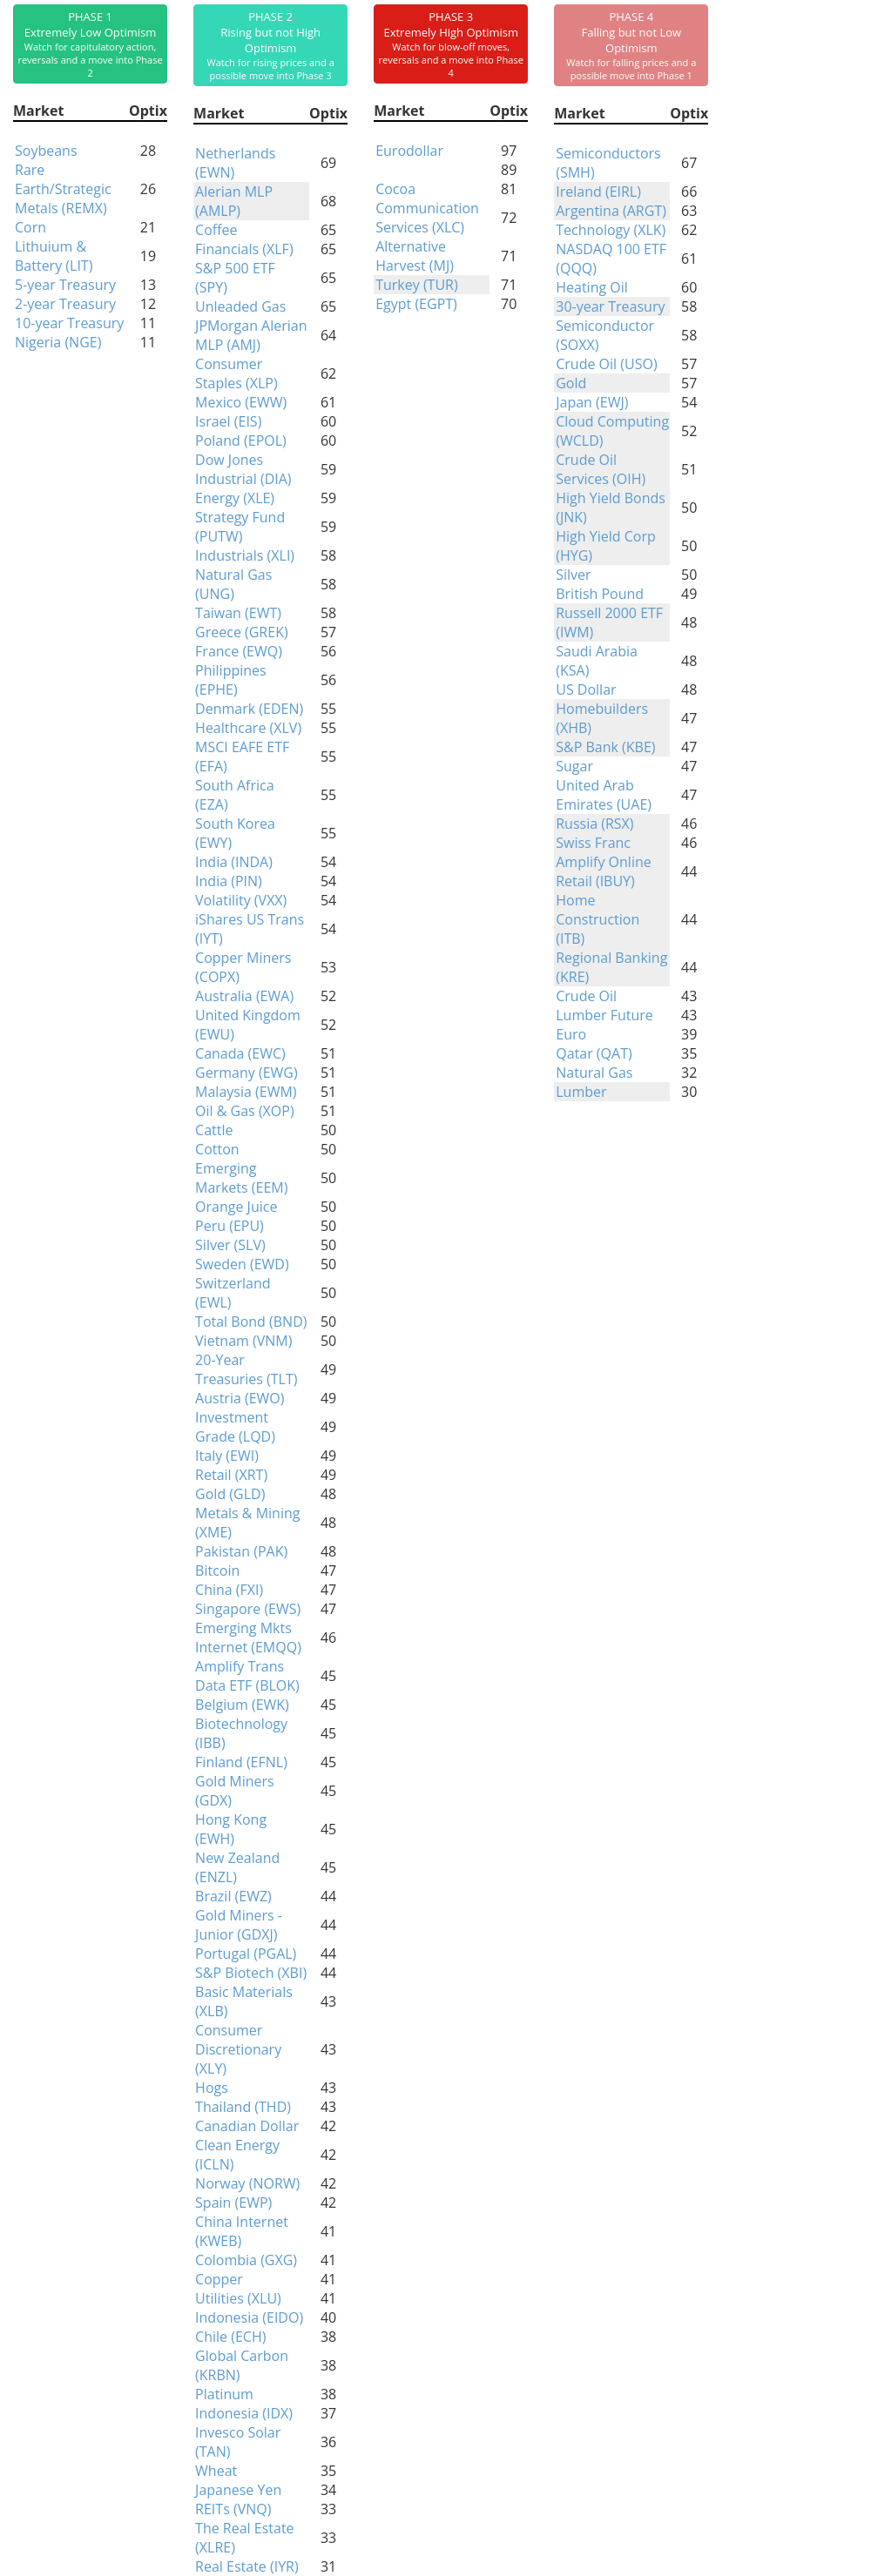
Phase Table
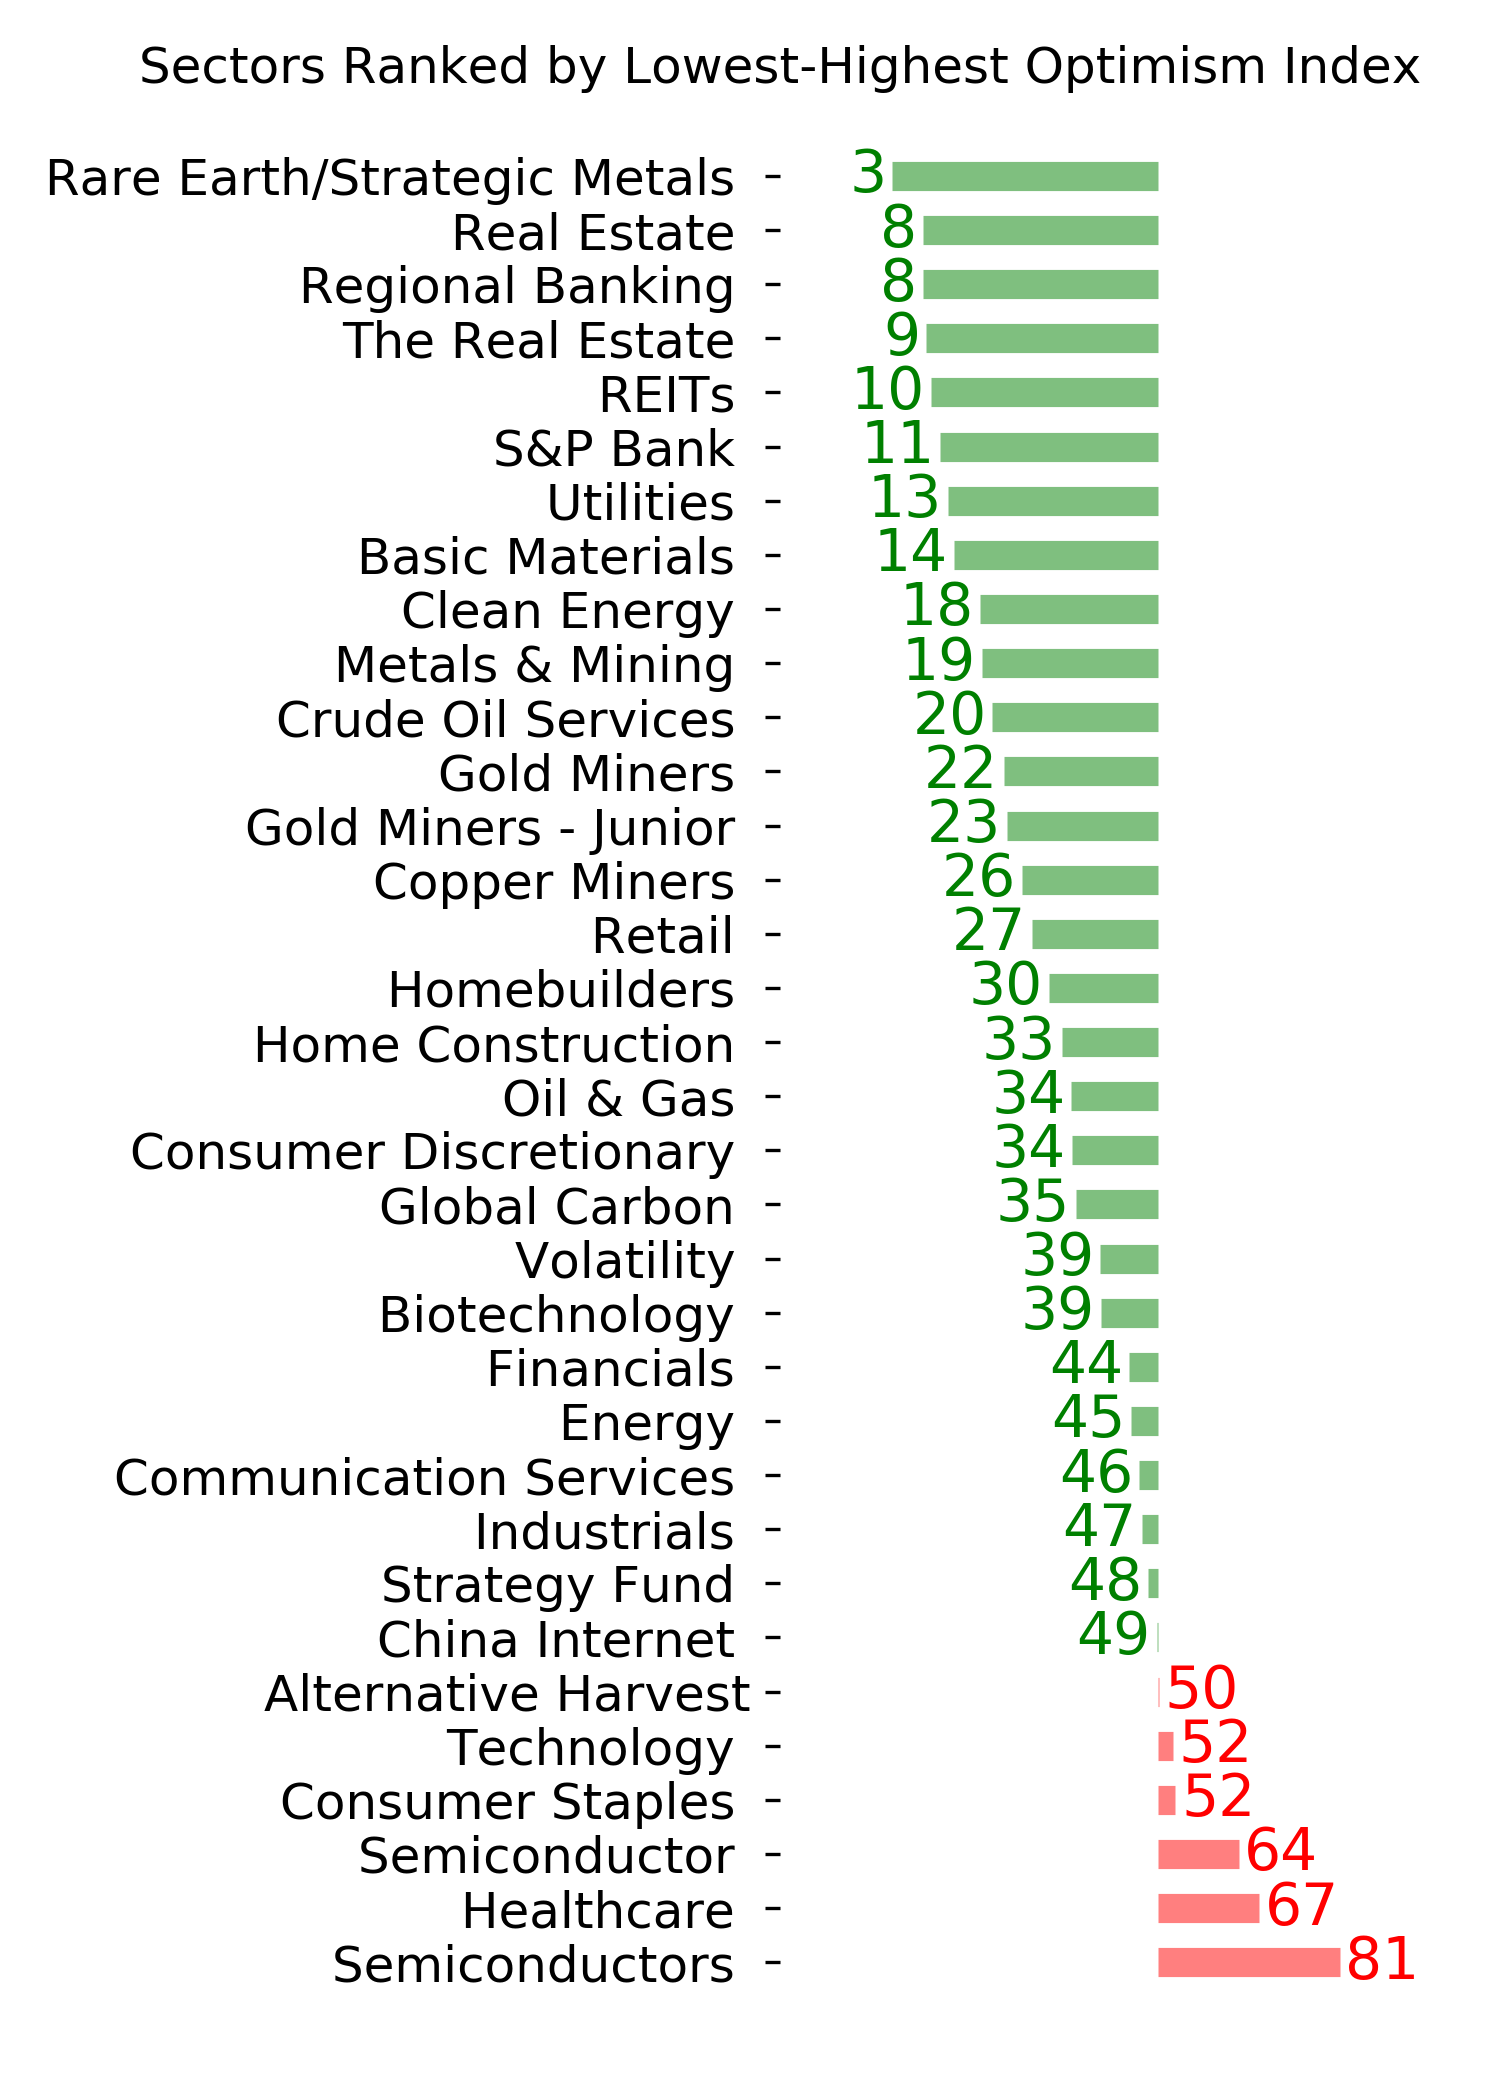
Ranks
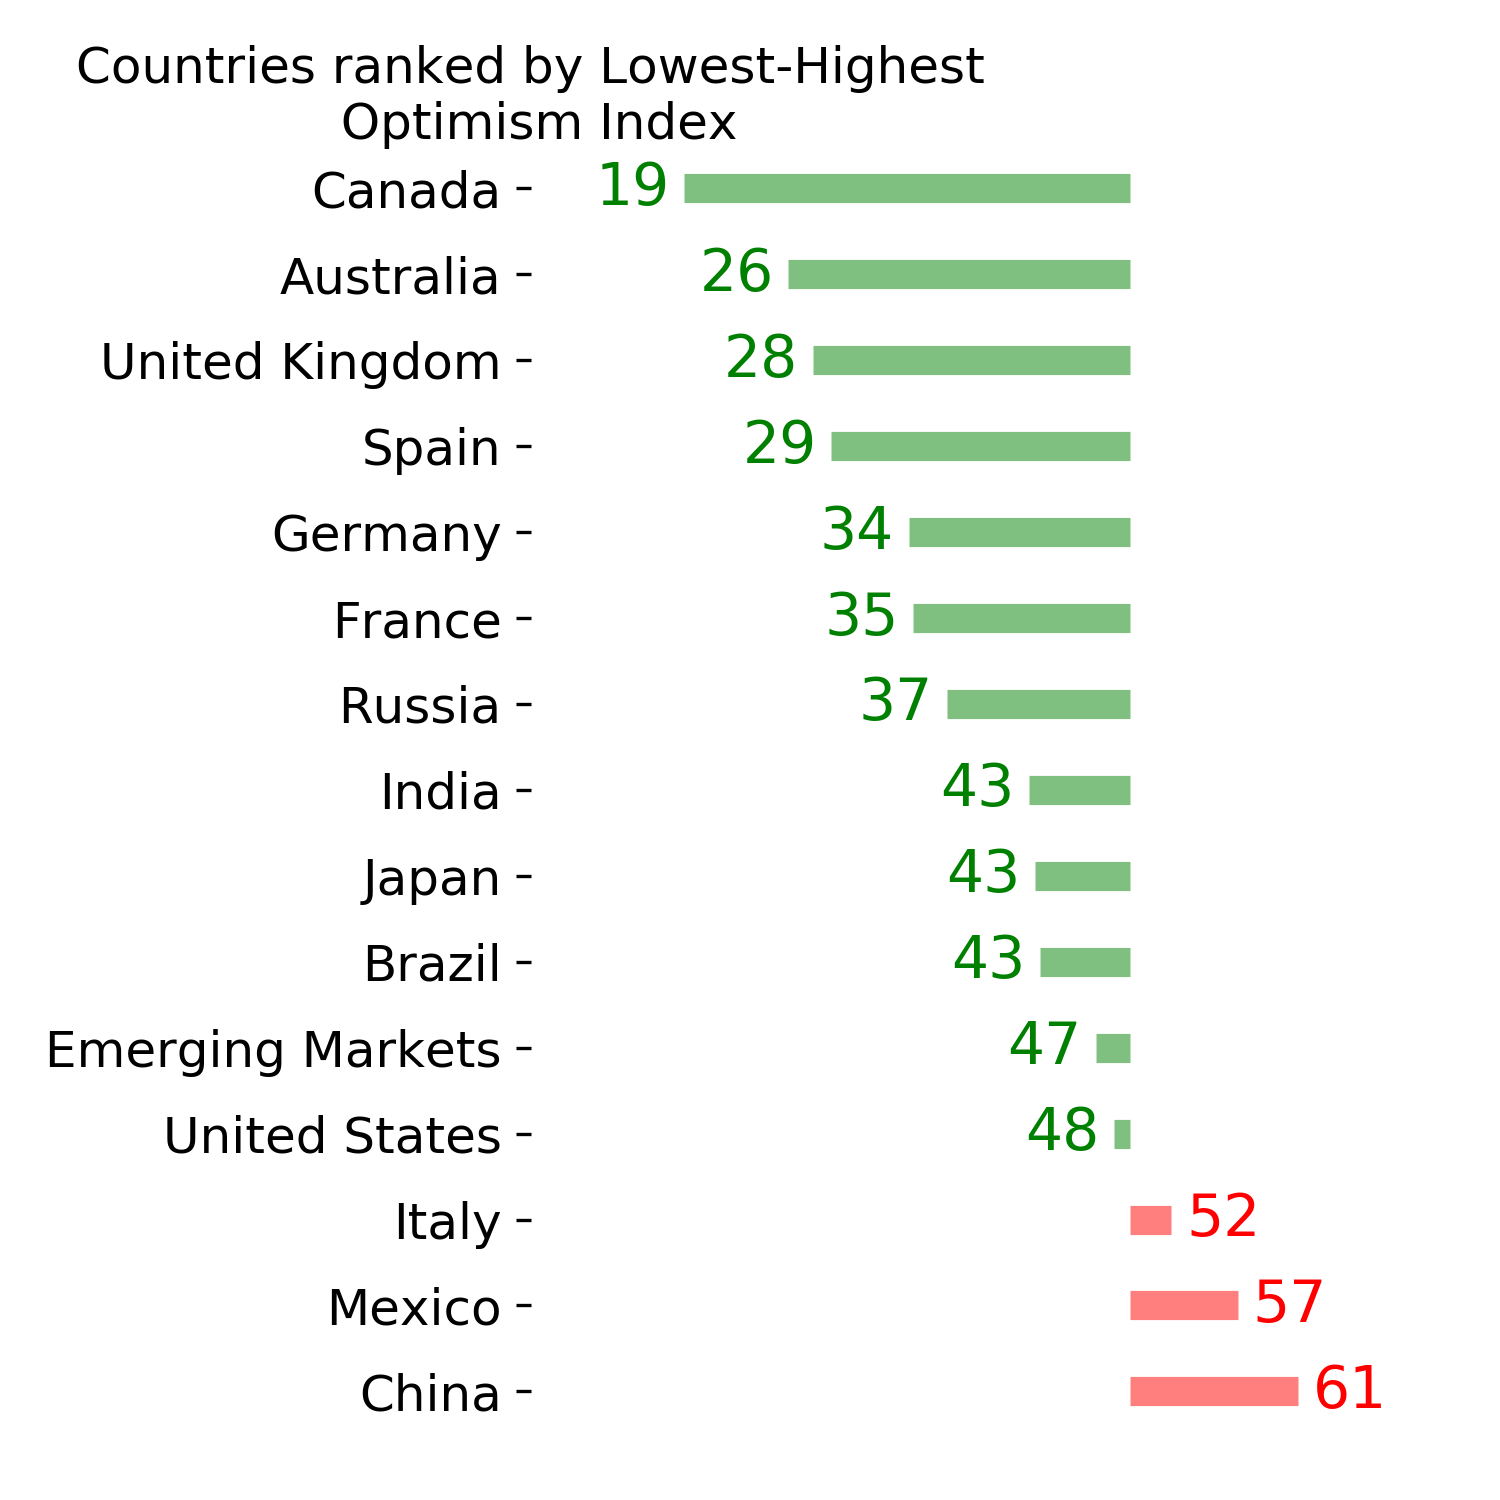
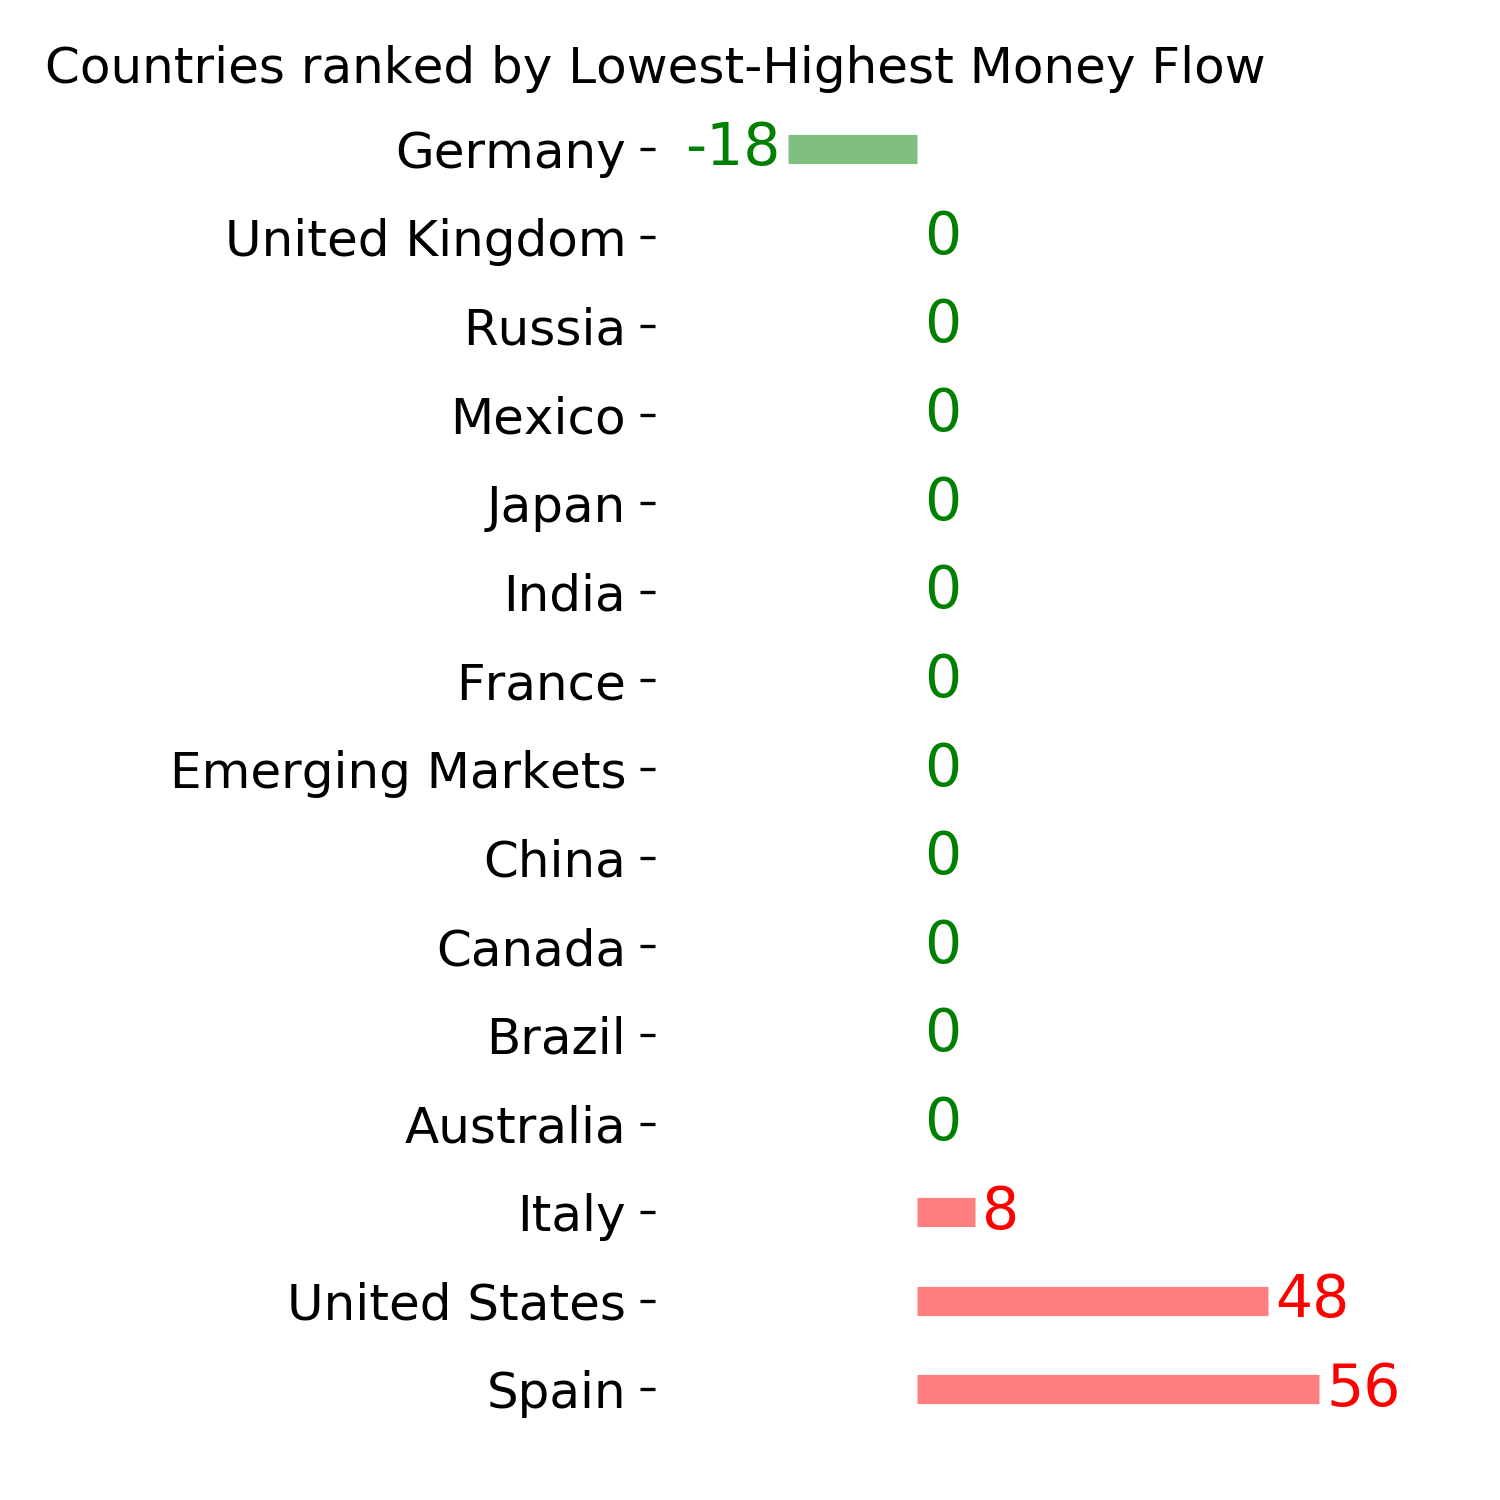
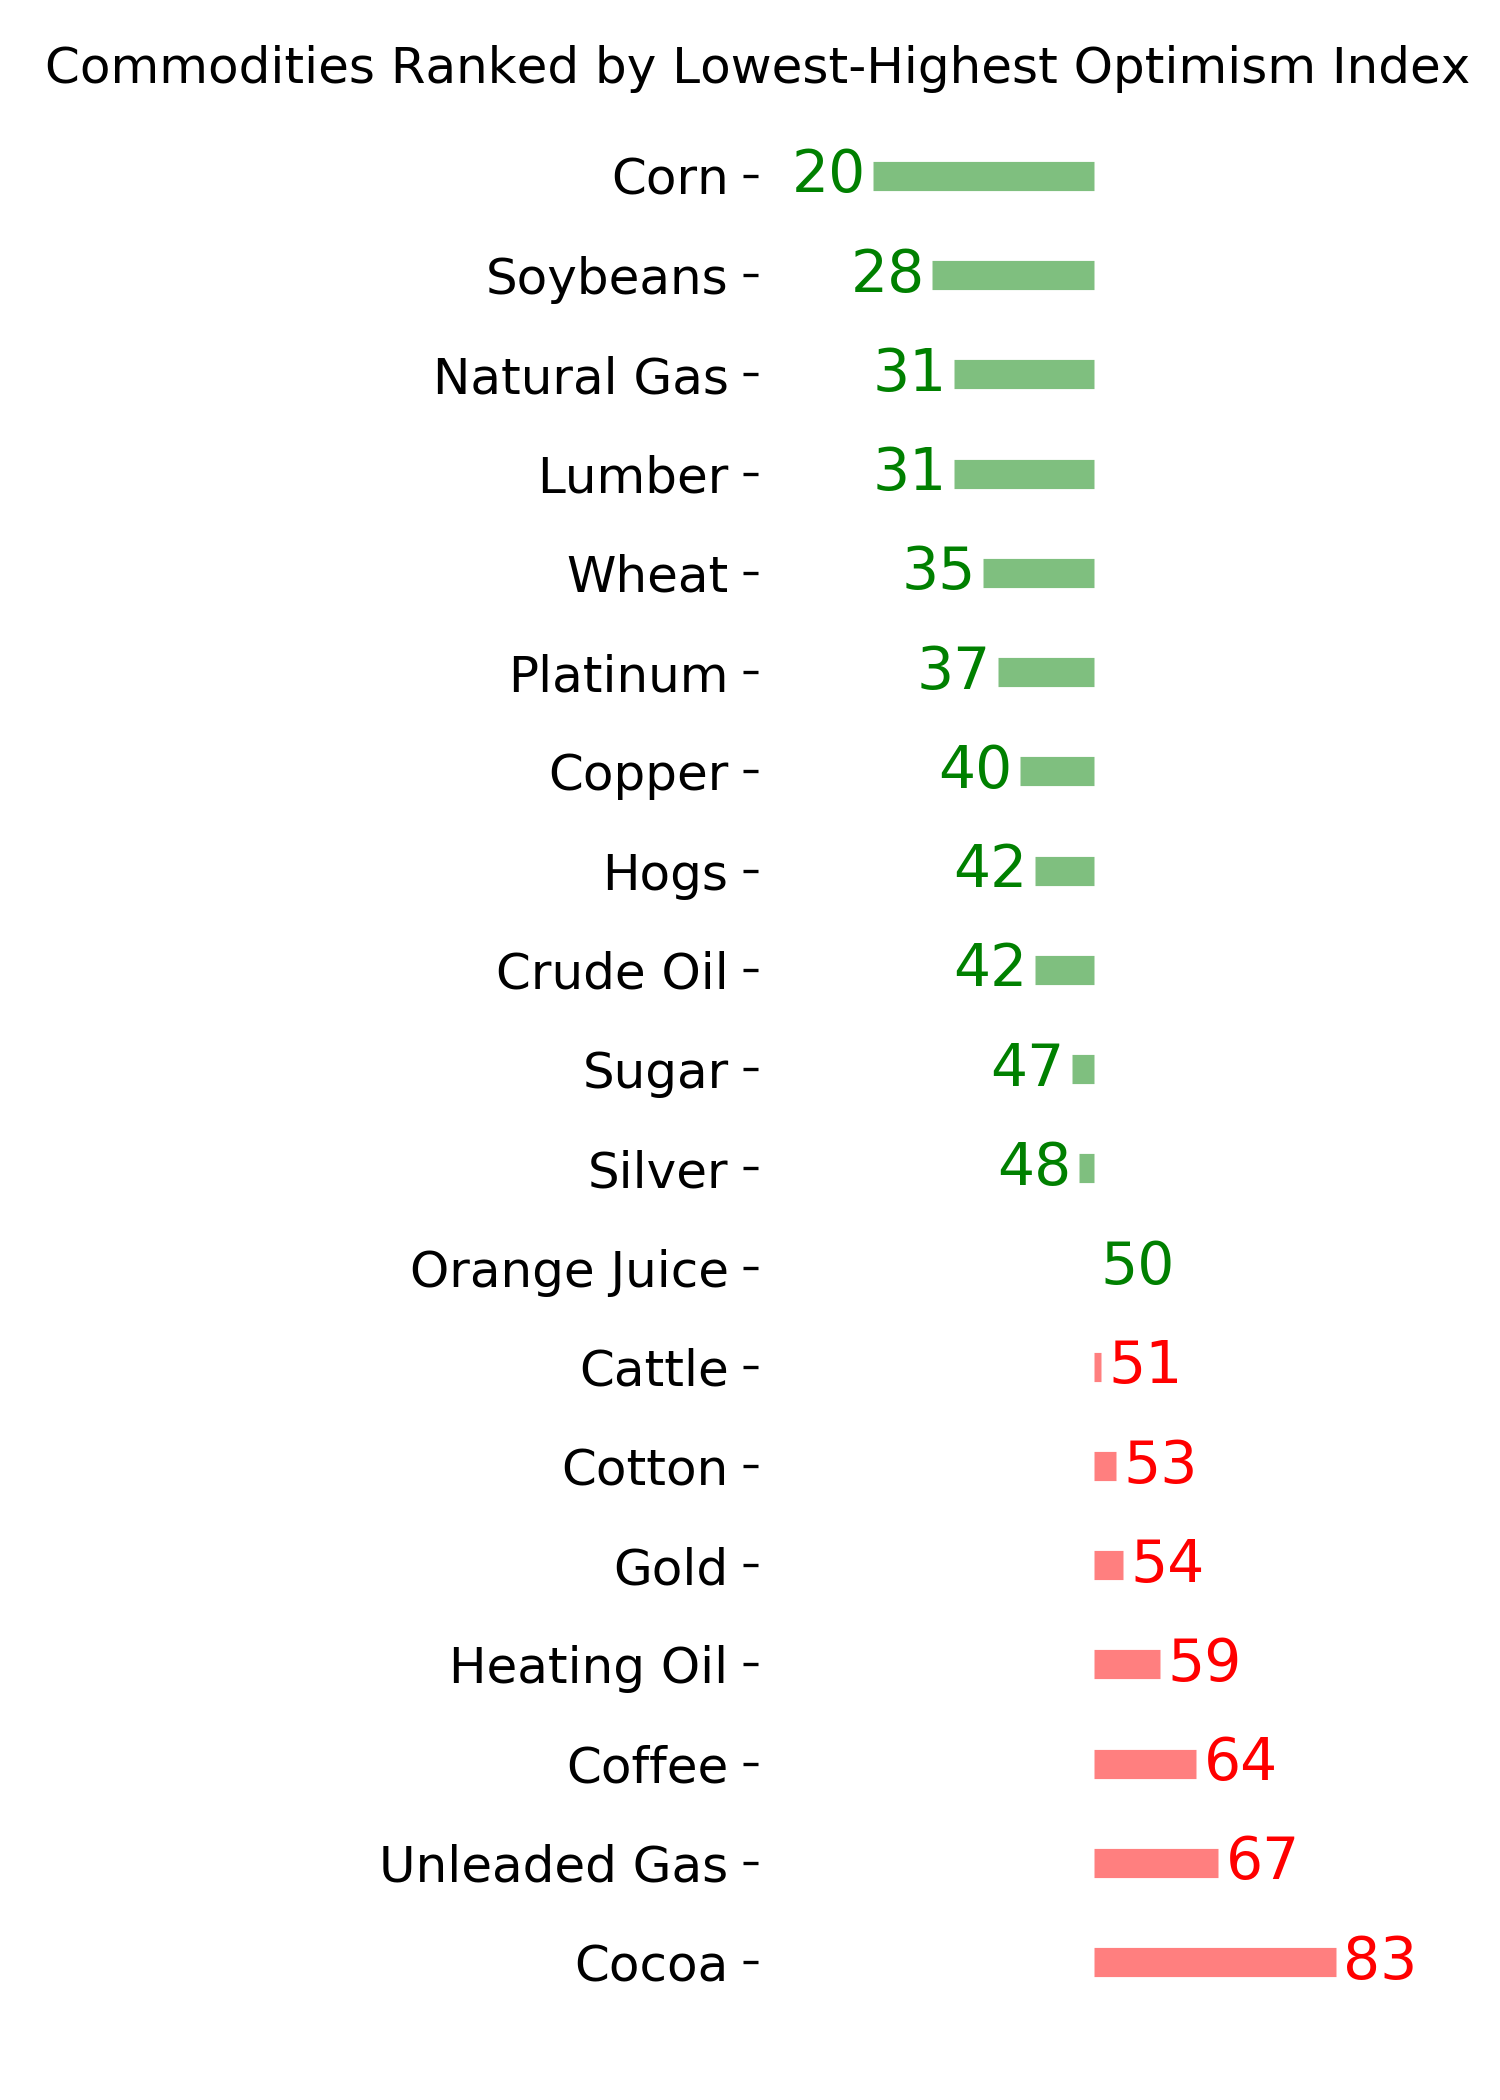
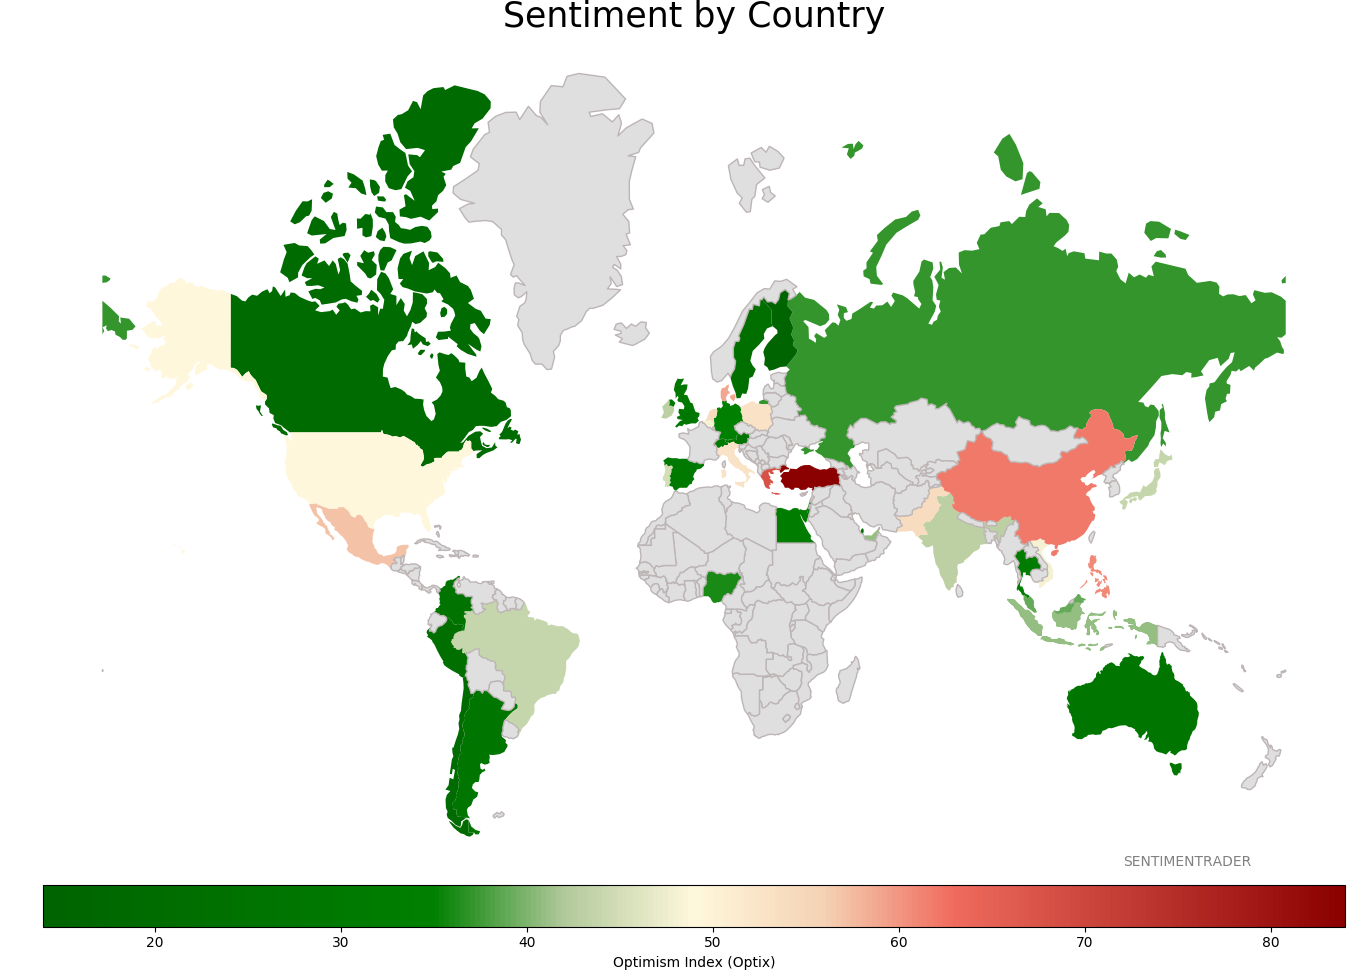
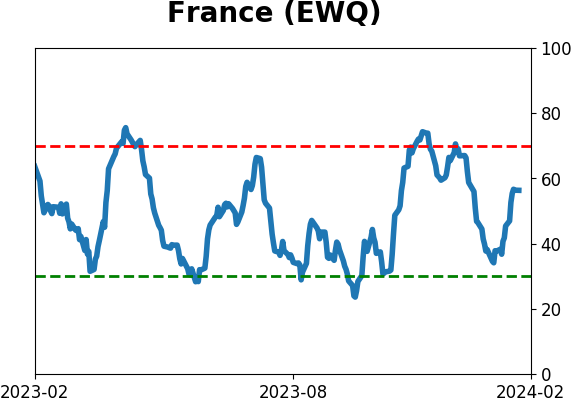
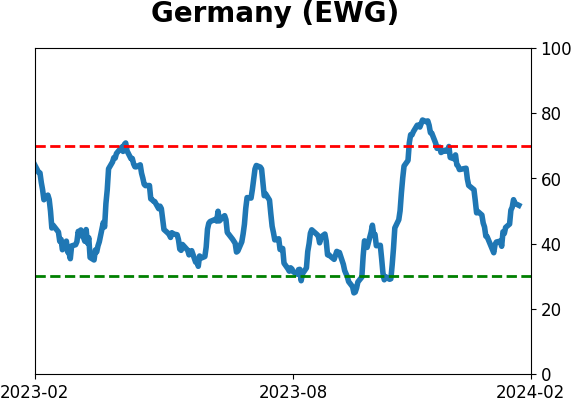
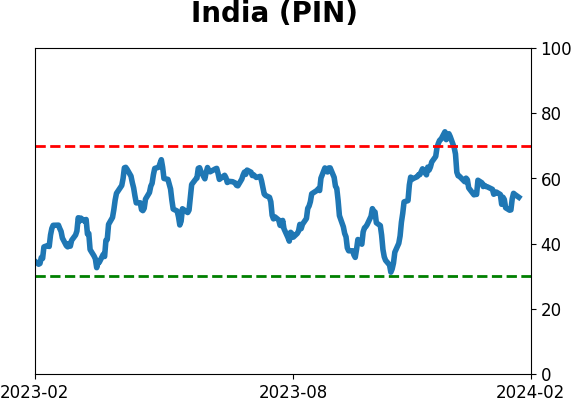
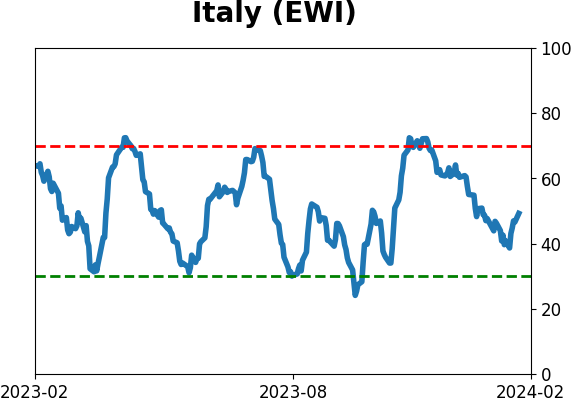
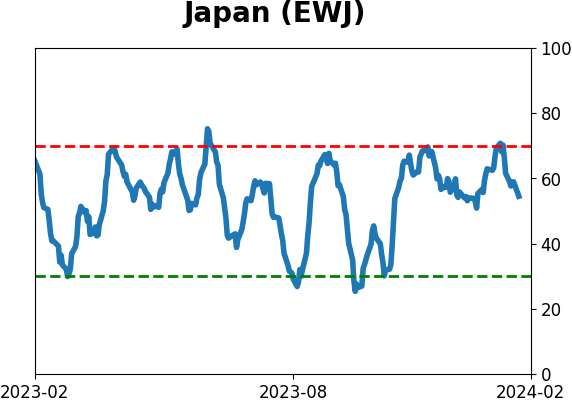
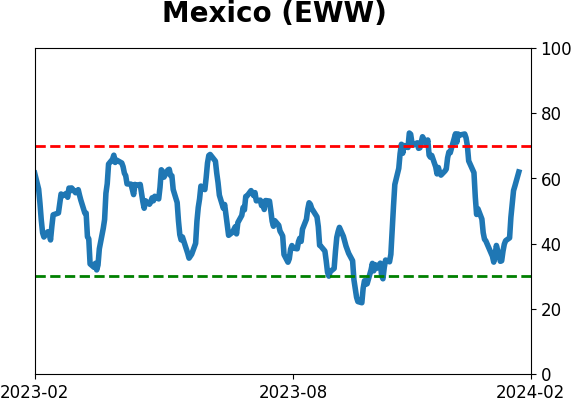
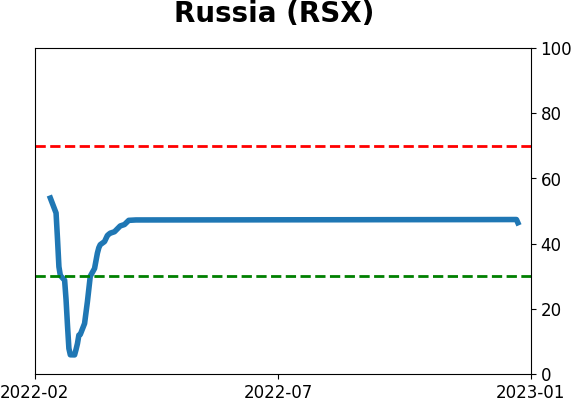
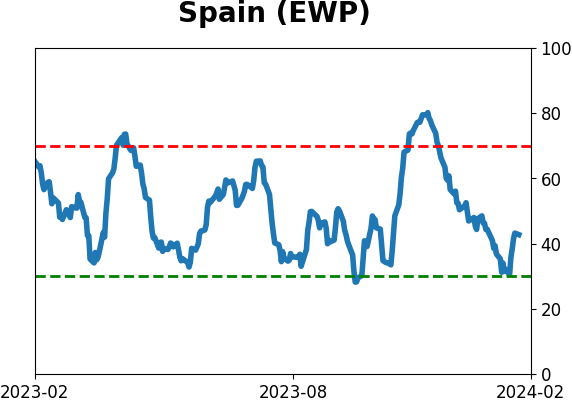
Sentiment Around The World
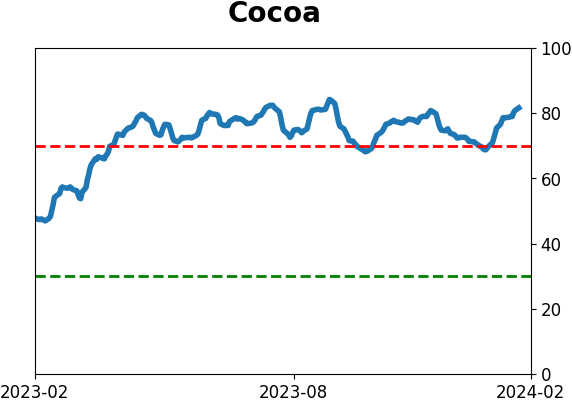
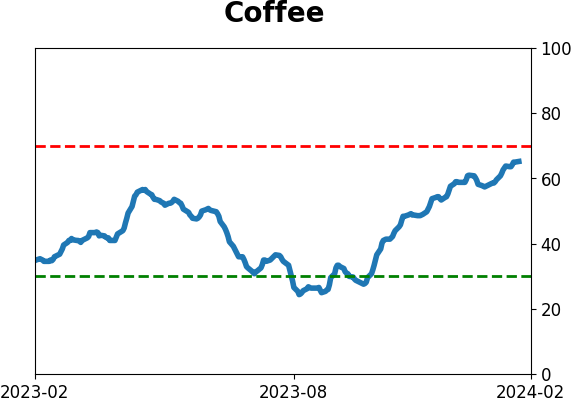
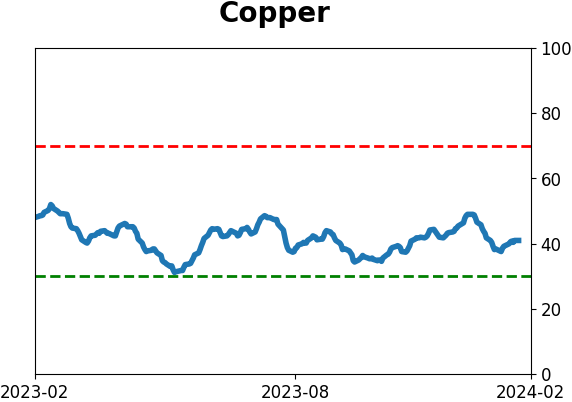
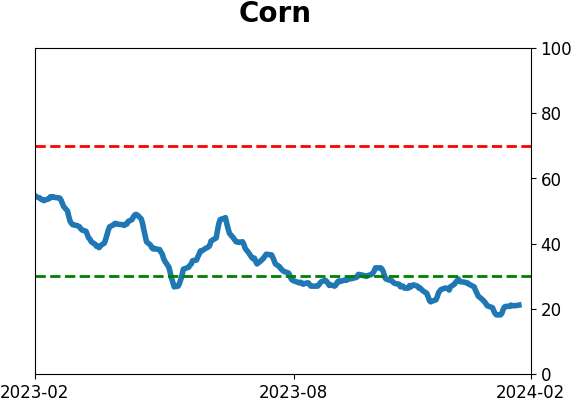
Optimism Index Thumbnails
|
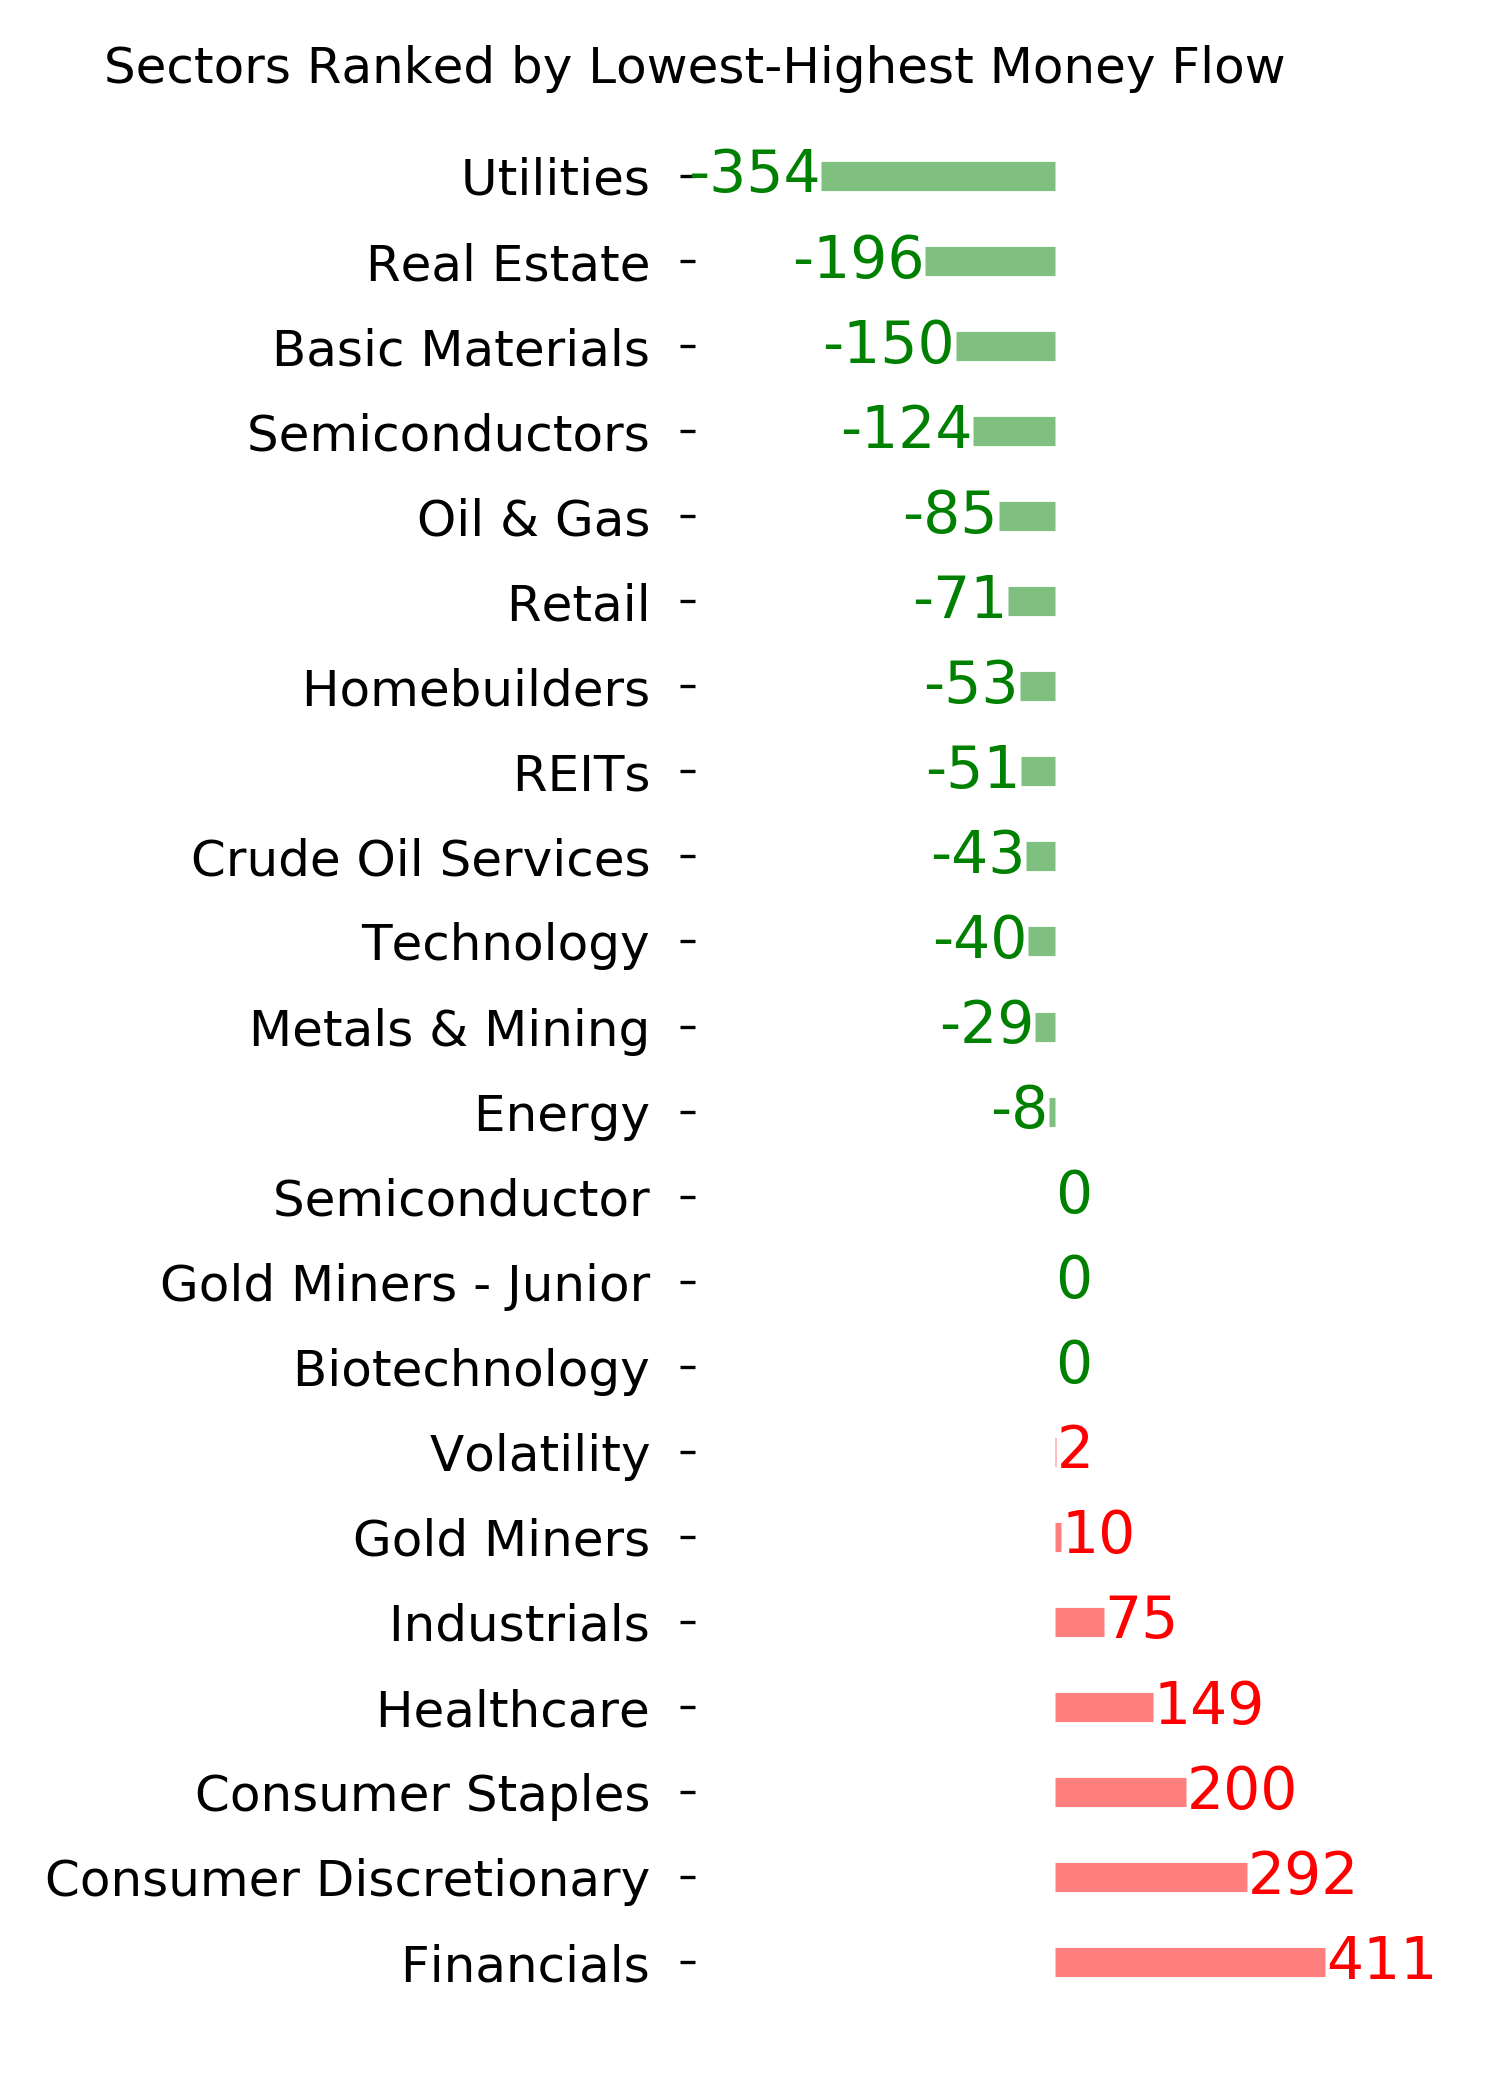
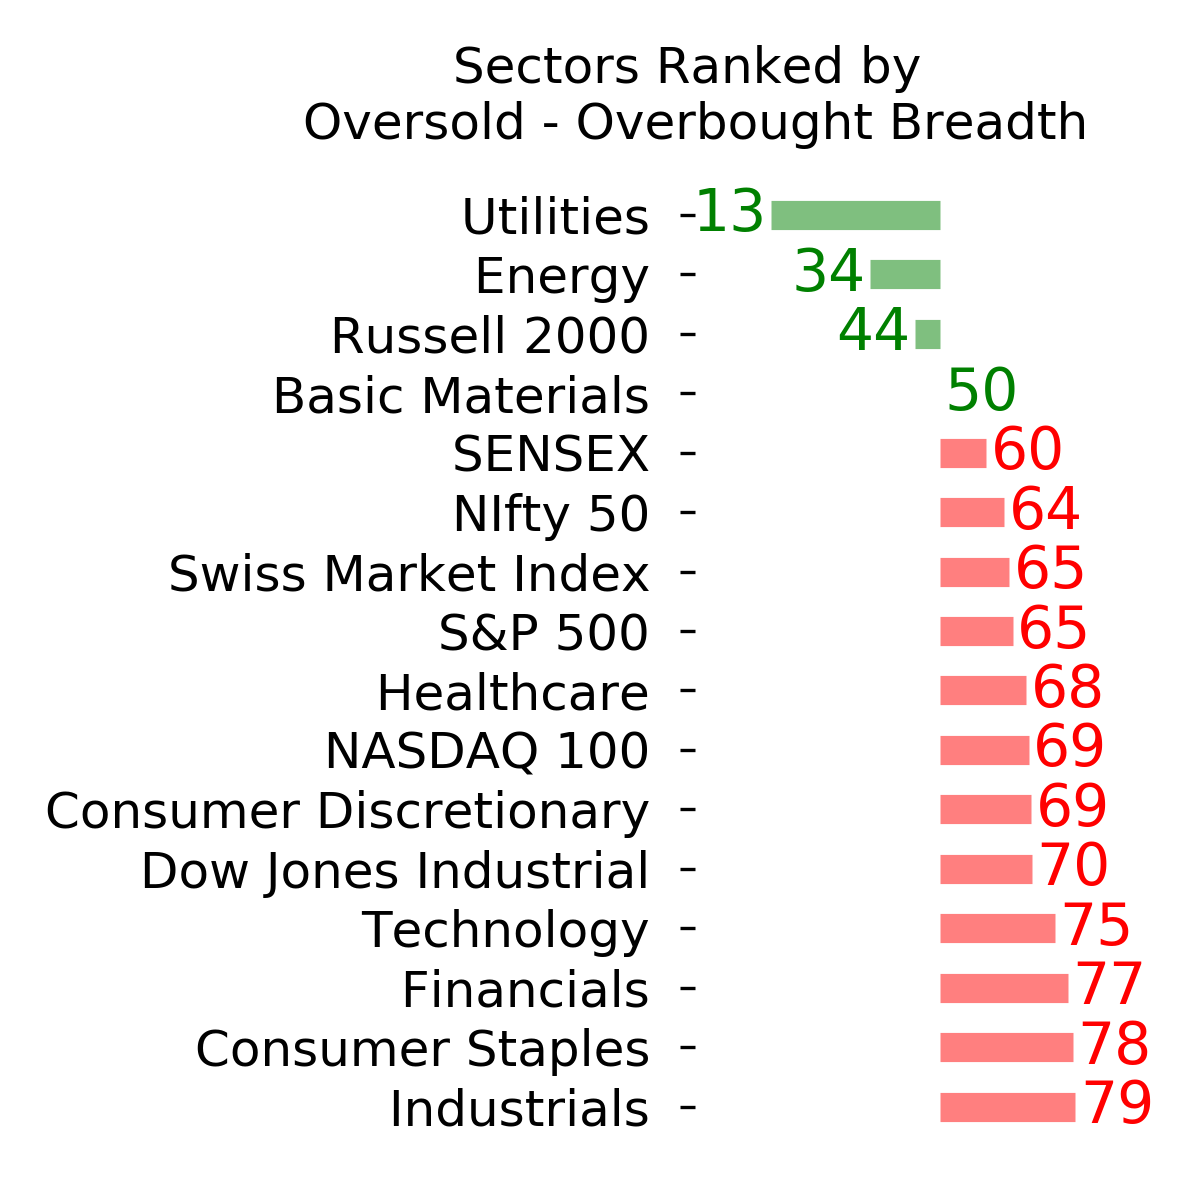
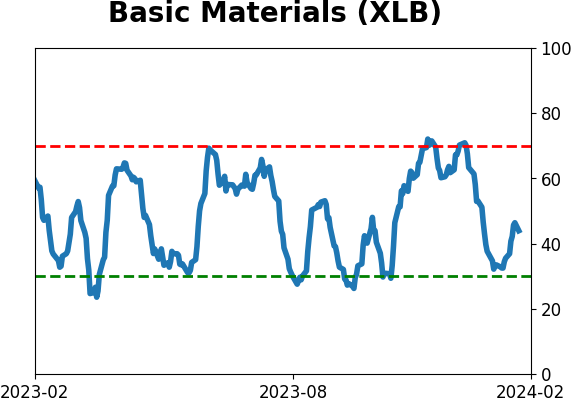
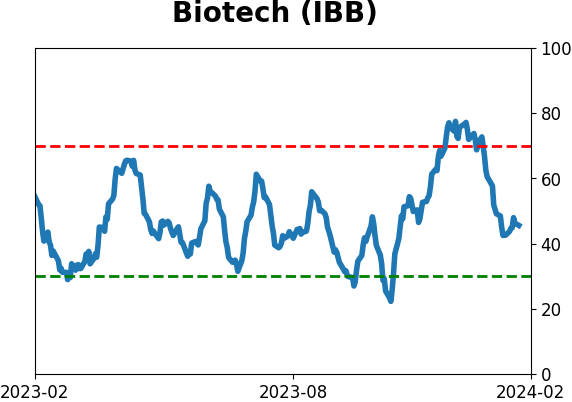
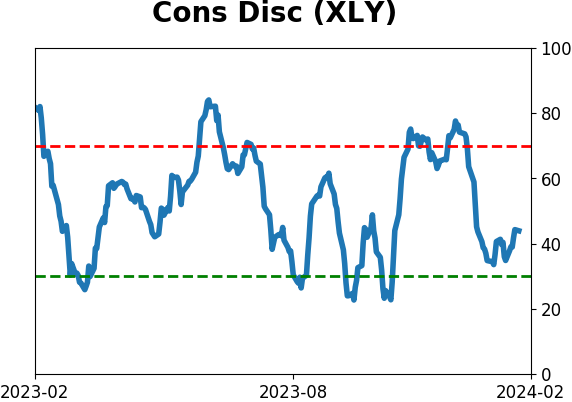
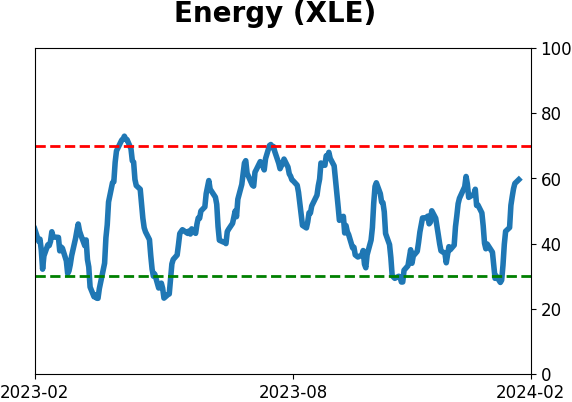
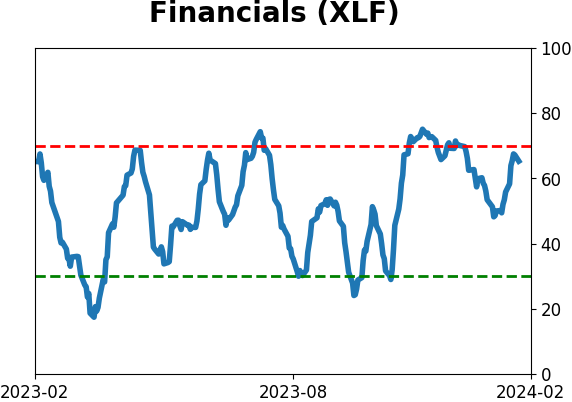
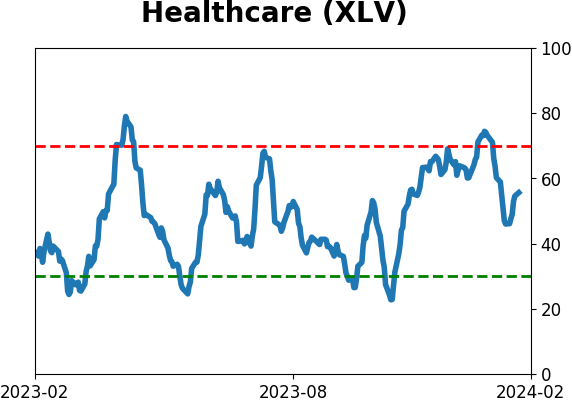
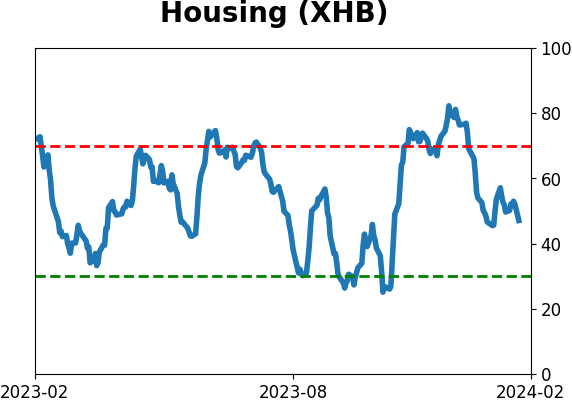
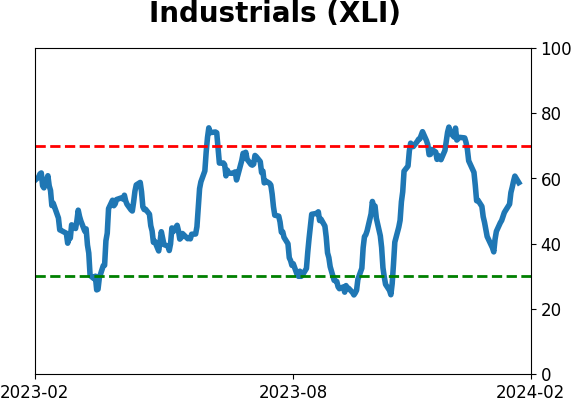
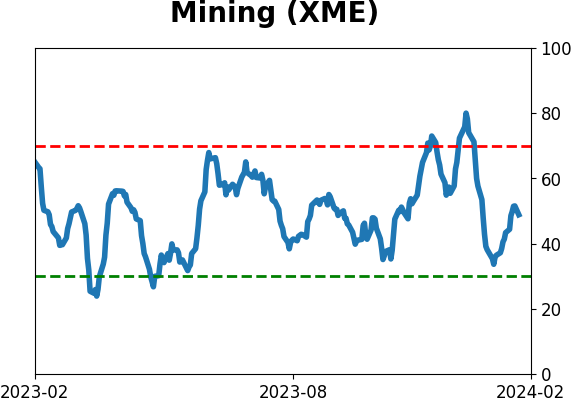
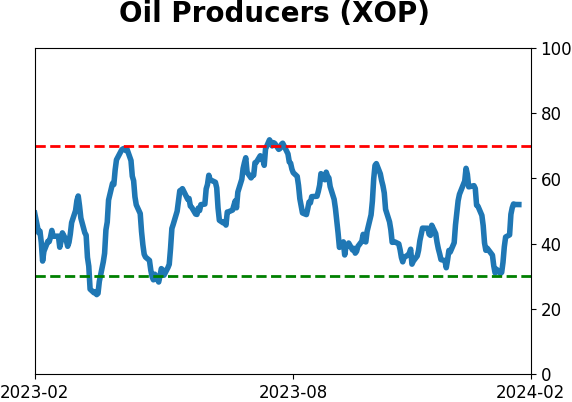
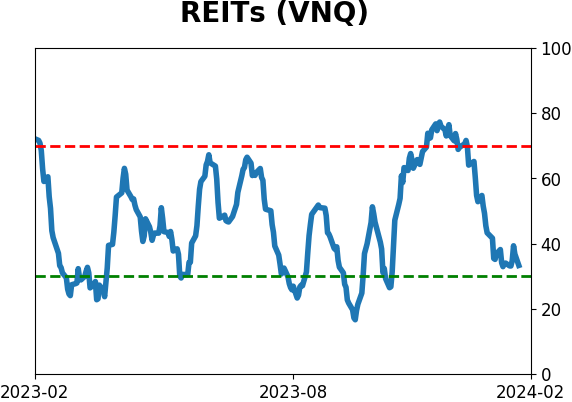
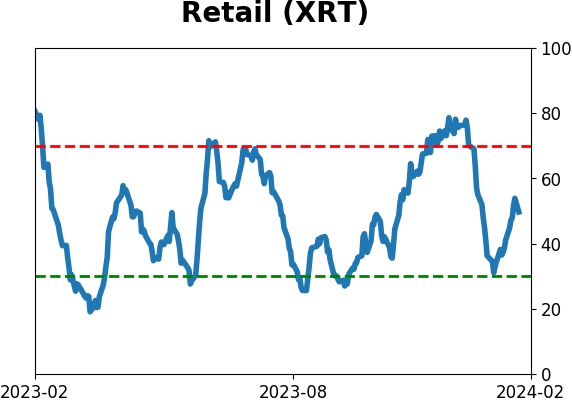
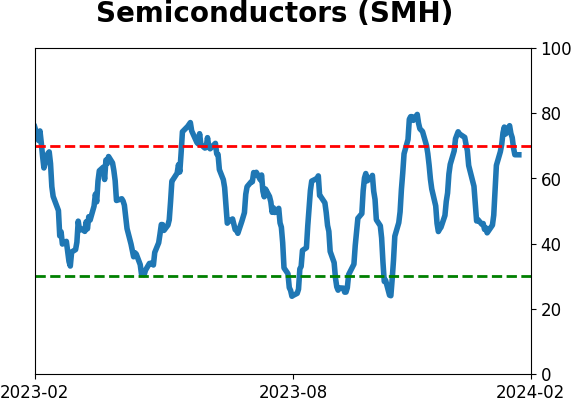
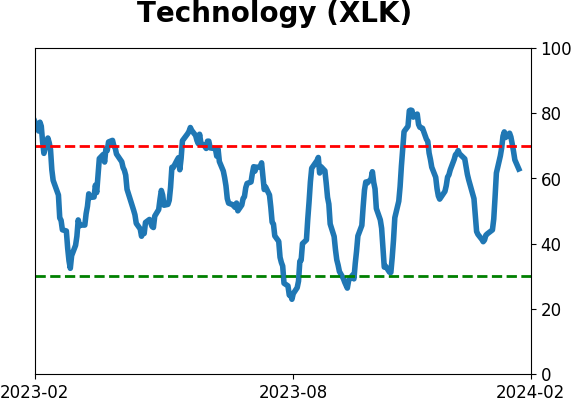
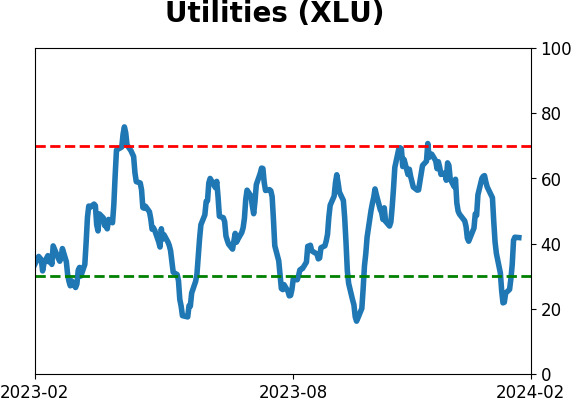
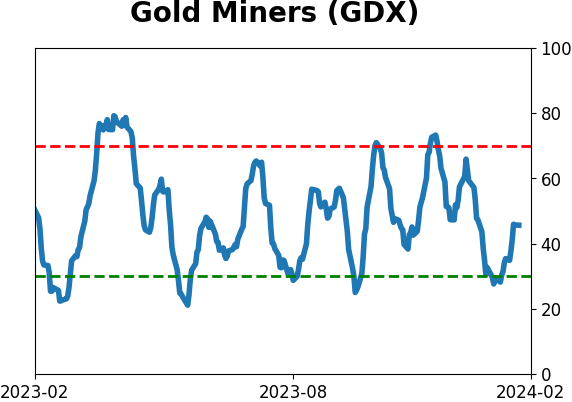
Sector ETF's - 10-Day Moving Average
|
|
|
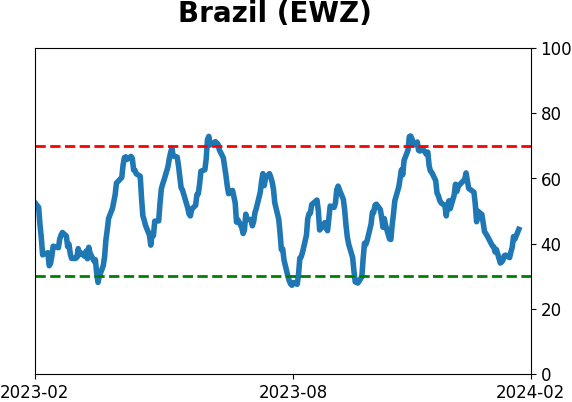
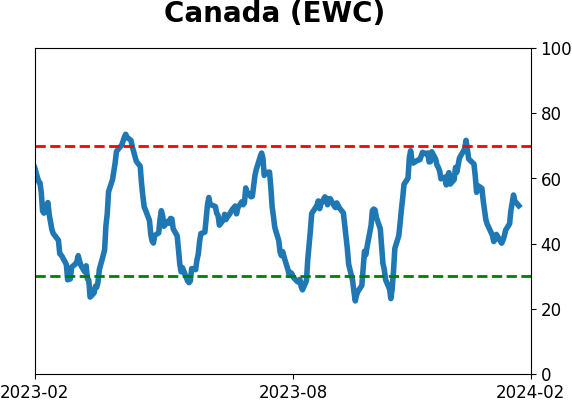
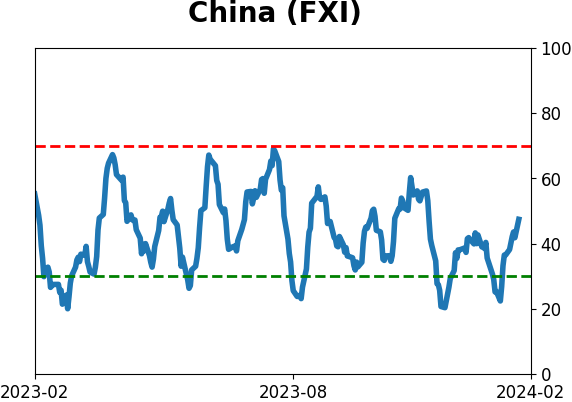
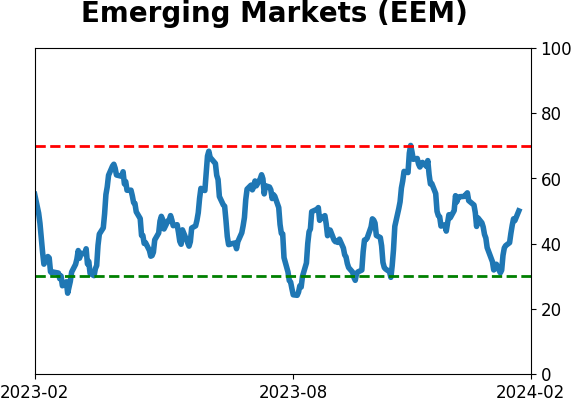
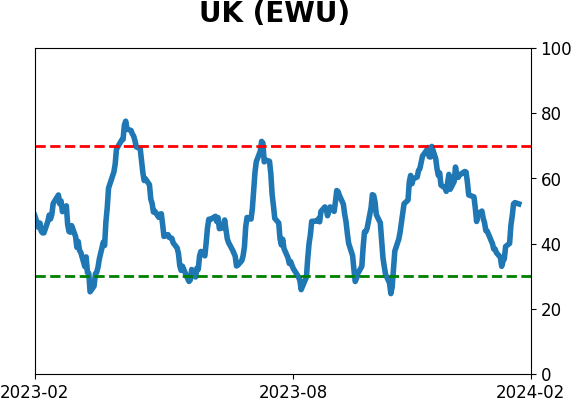
Country ETF's - 10-Day Moving Average
|
|
|
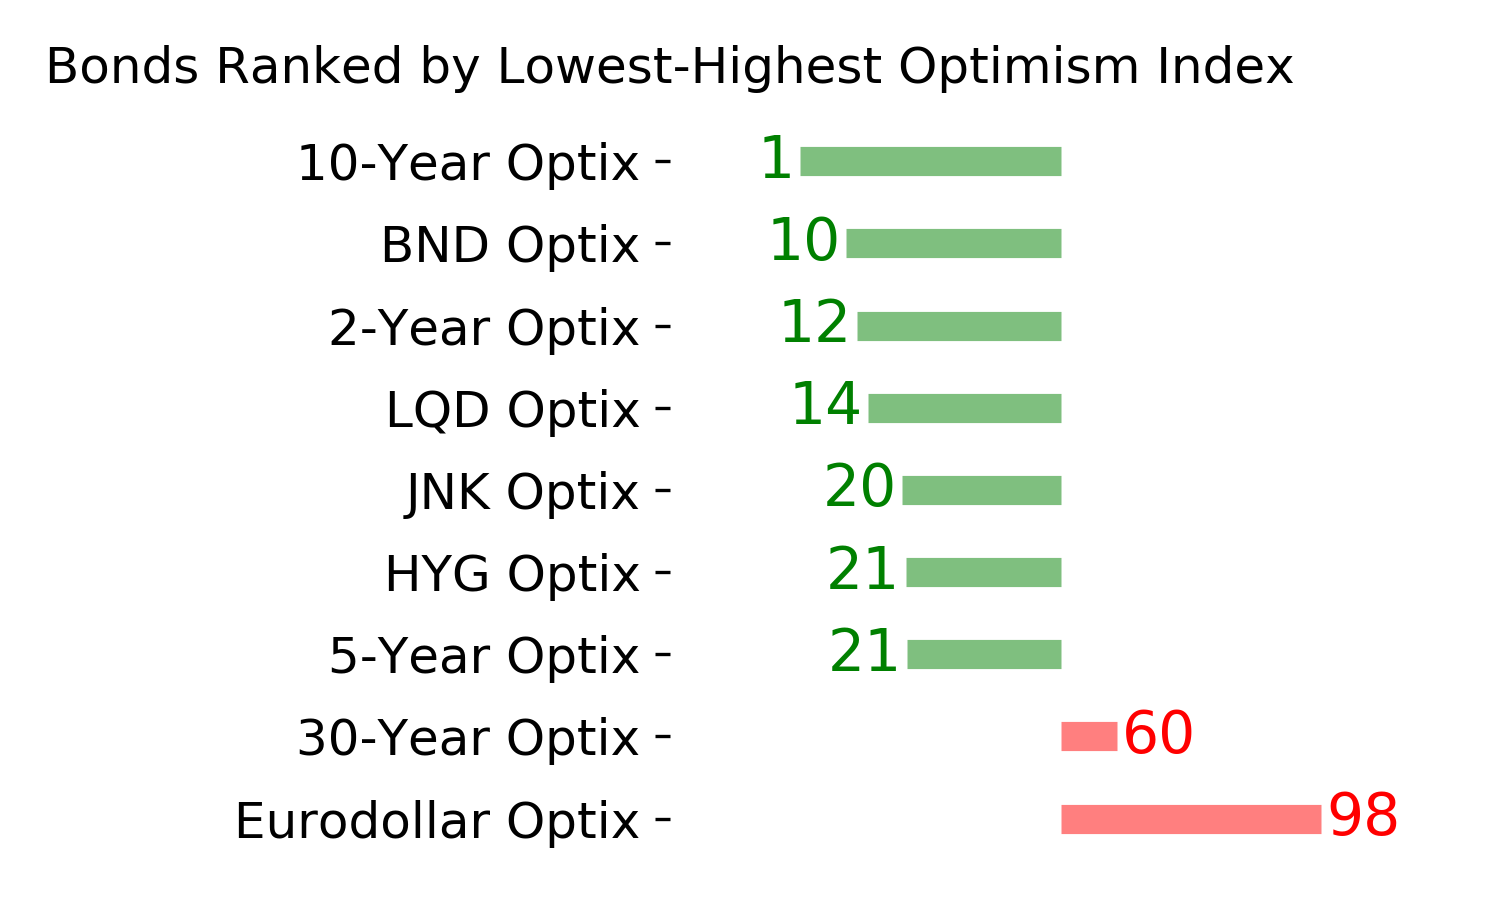
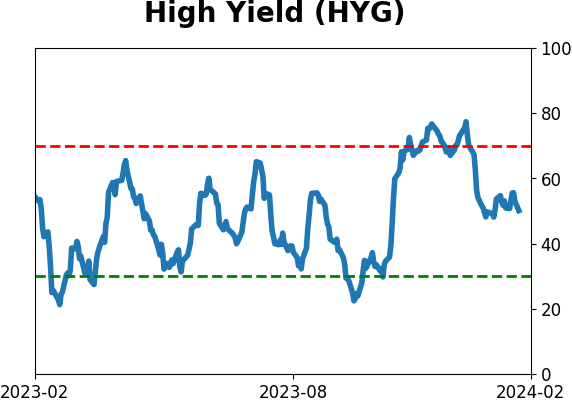
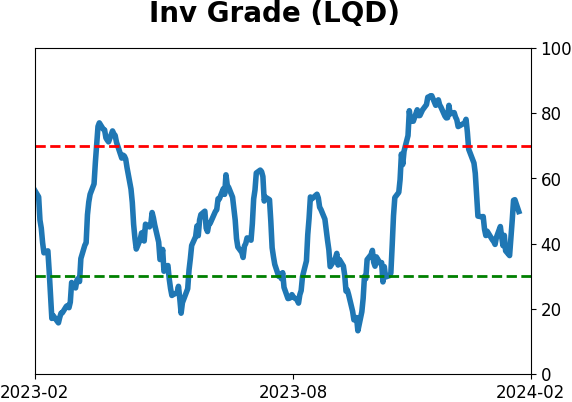
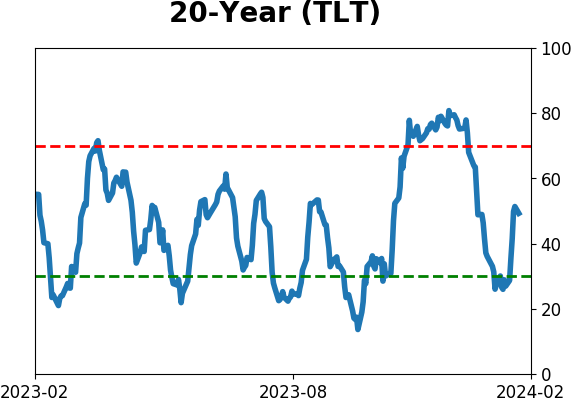
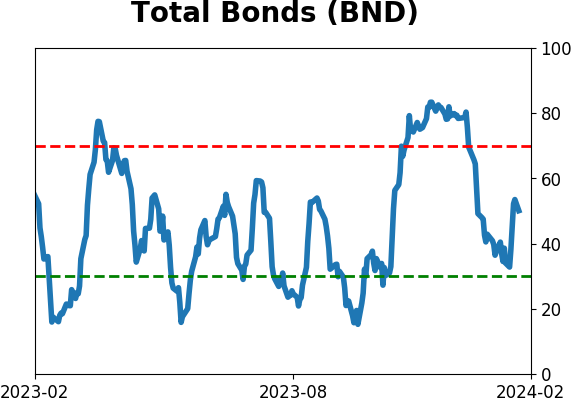
Bond ETF's - 10-Day Moving Average
|
|
|
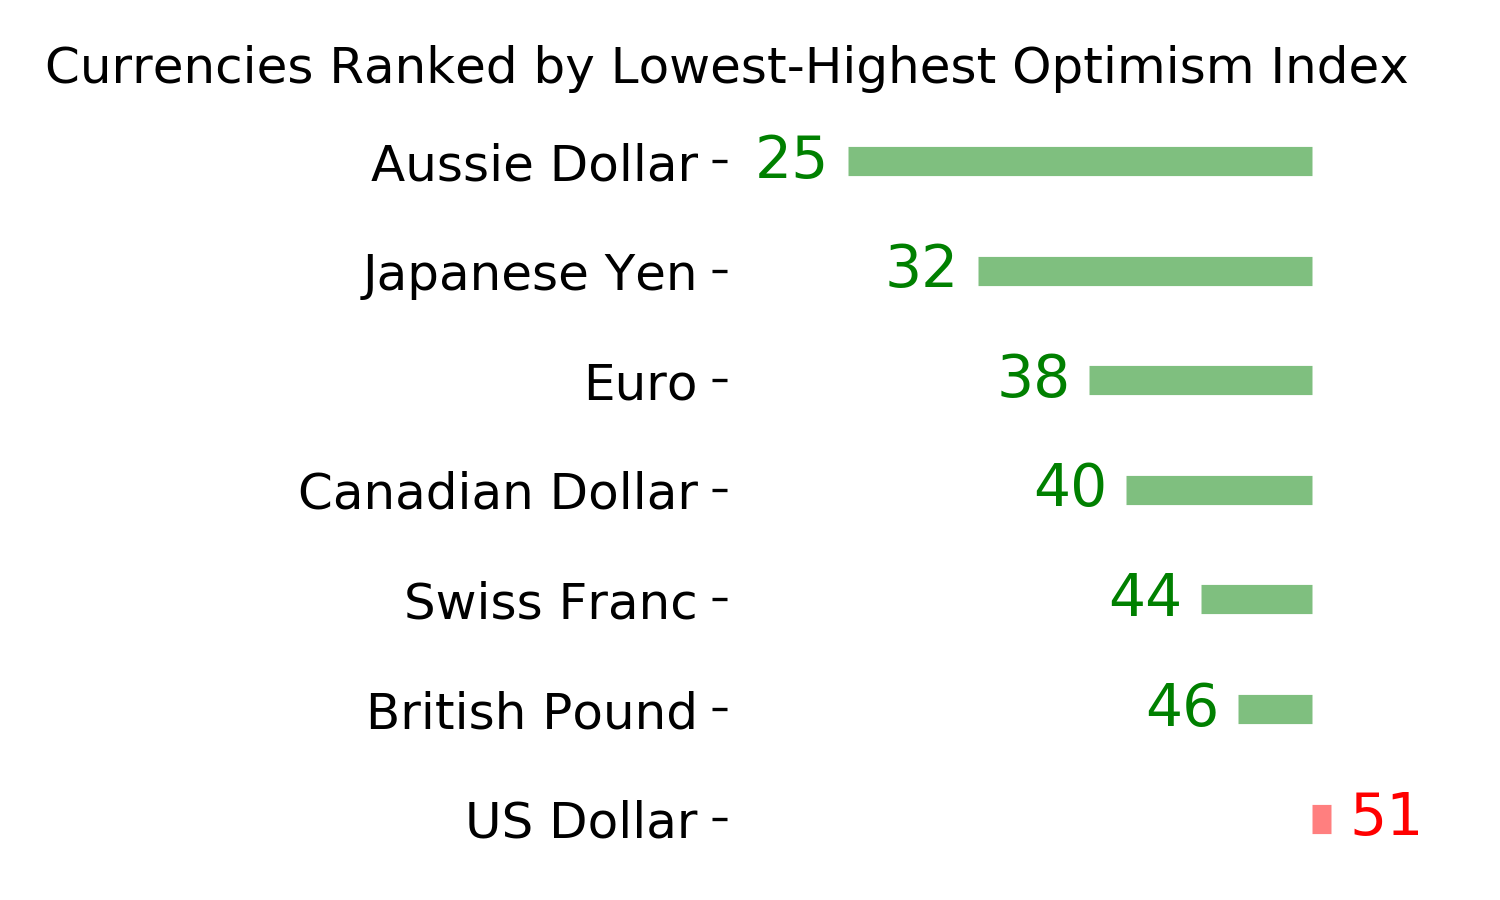
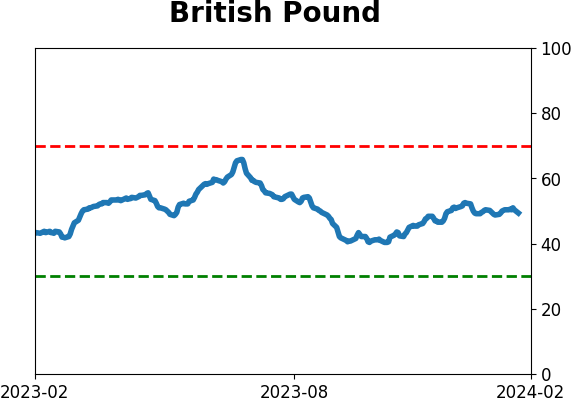
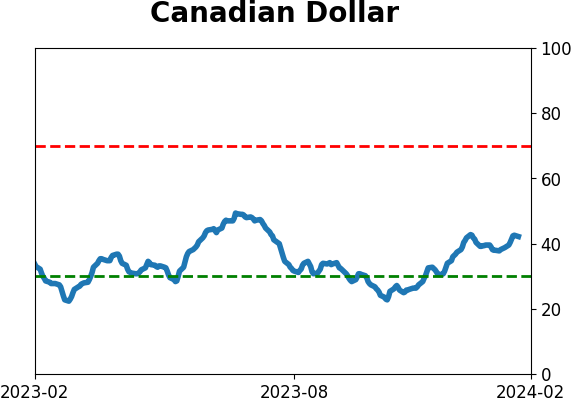
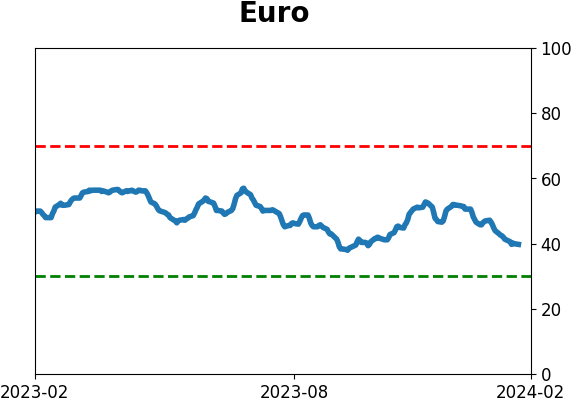
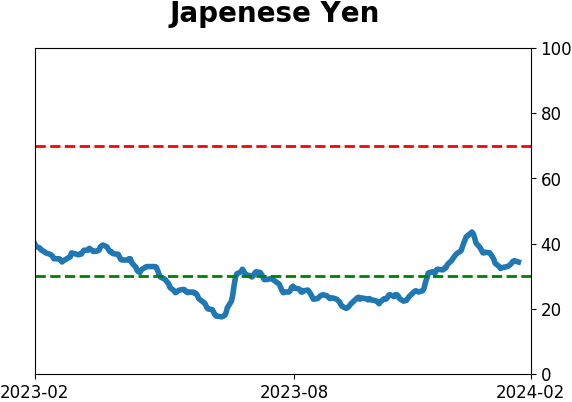
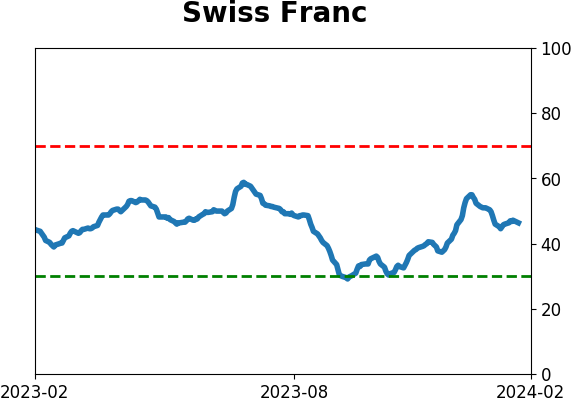
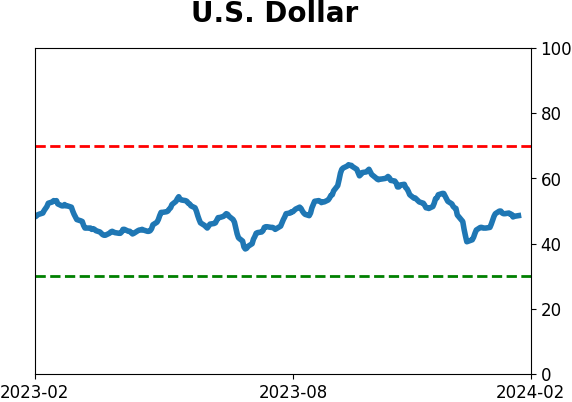
Currency ETF's - 5-Day Moving Average
|
|
|
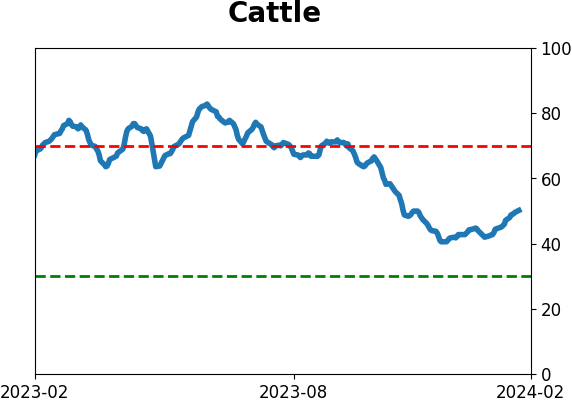
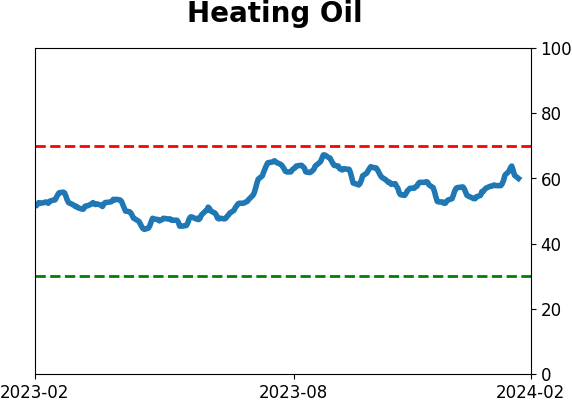
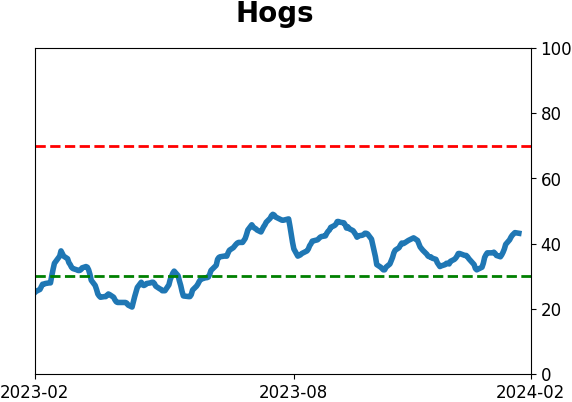
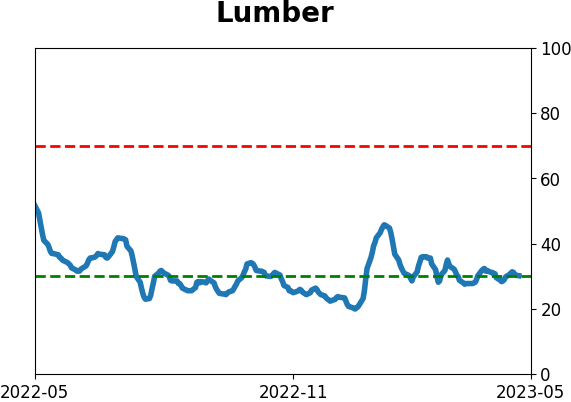
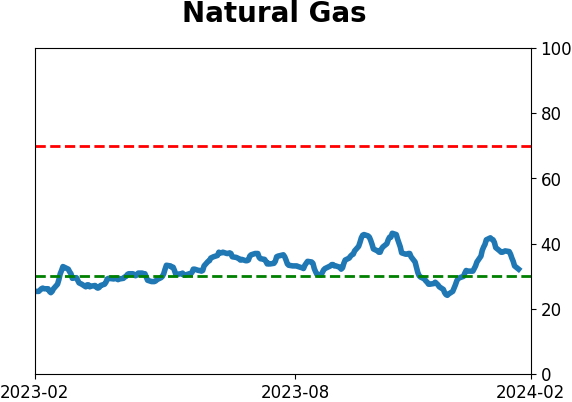
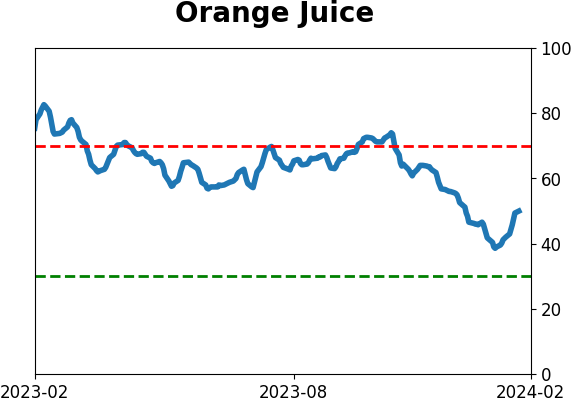
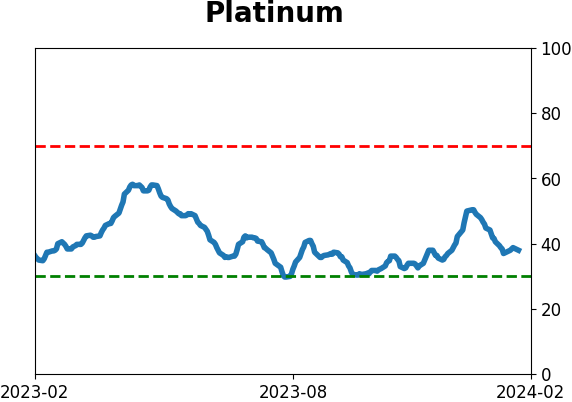
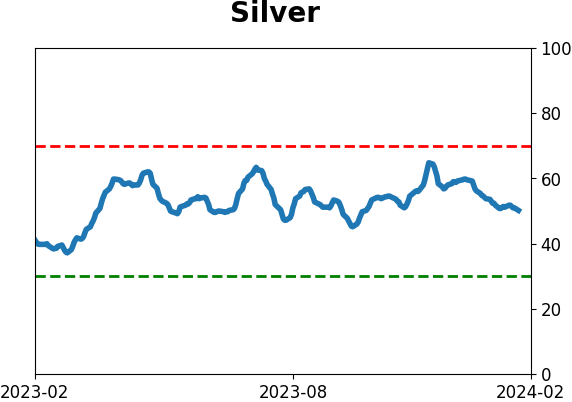
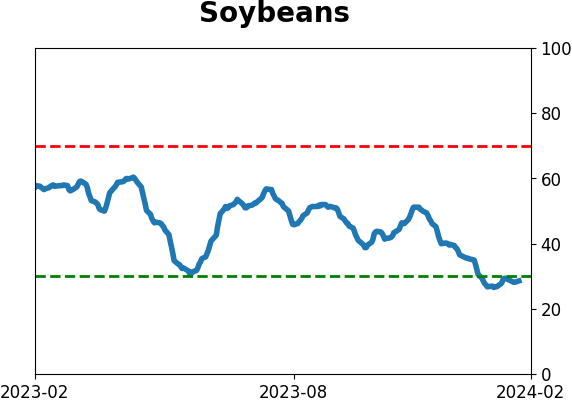
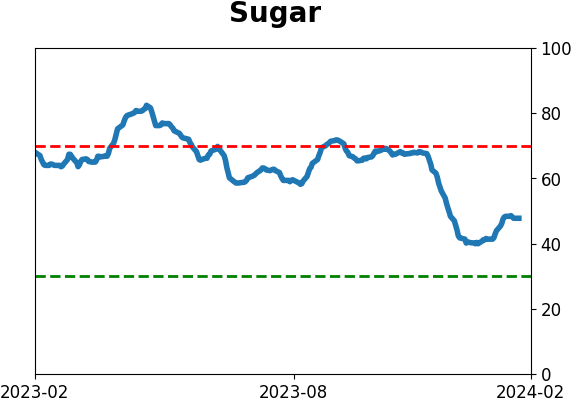
Commodity ETF's - 5-Day Moving Average
|
|