Products
SentimenTrader Trading Tools
‍
Backtest Engine
My Trading Toolkit
Correlation Analysis
Seasonality
Market Prediction
Indicators & Data API
‍
Proprietary Indicators & Charts
Market Data API
Strategies & Scanner
‍
50+ Trading Strategies
Smart Stock Scanner
Smart Option Scanner
Research Reports
‍
Research Solutions
Reports Library
Free Resources
Simple Backtest Calculator
Simple Seasonality Calculator
The Kelly Criterion Calculator
Sentiment Geo Map
Public Research Reports
Education
Sentiment Indicators
Technical Indicators
Pricing
Company
About
In the News
Testimonials
Client Success Stories
Contact
Log inLoginSign up
< BACK TO ALL REPORTS

Daily Report : Investors get comfortable trading stocks on their own merits

Jason Goepfert
2021-02-04
The correlation among member stocks of the S&P 500 has declined to the lowest level in a year, and is more than a standard deviation below average. This signals complacency among investors.
View/Print a PDF version of this Report

Headlines


Investors get comfortable trading stocks on their own merits: The correlation among member stocks of the S&P 500 has declined to the lowest level in a year, and is more than a standard deviation below average. This signals complacency among investors.

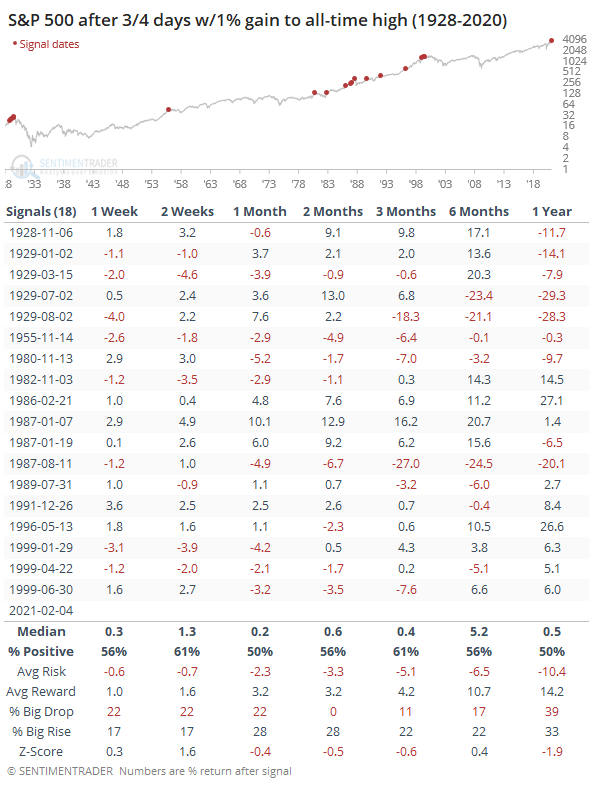
Unstoppable: The most benchmarked index in the world has been on a tear since the jump in fear last week. The S&P 500 has jumped 1% or more on 3 out of the past 4 sessions while closing at an all-time high. The last time it managed a run like this was 1999. Overall, forward returns were below random, with more risk than reward up to 3 months later.
Daily Report : Investors get comfortable trading stocks on their own merits

Bottom Line:

See the Outlook & Allocations page for more details on these summaries

STOCKS: Weak sell
We're in an extremely speculative environment that is enough to become defensive, especially with recent cracks showing in what had been pristine breadth conditions. The spike in fear from last week has already mostly dissipated and likely not enough to offset the negatives over a medium-term time frame.

BONDS: Weak buy
Various parts of the market have been hit in recent weeks, with mild oversold conditions. Treasuries have been hit hard and will likely start to register some extremes soon.

GOLD: Weak buy
A dollar trying to rebound from a severe short position has weighed on gold and miners. The types of signals they've given in recent weeks, within the context of their recent surge, have usually resulted in higher prices over a medium- to long-term time frame.

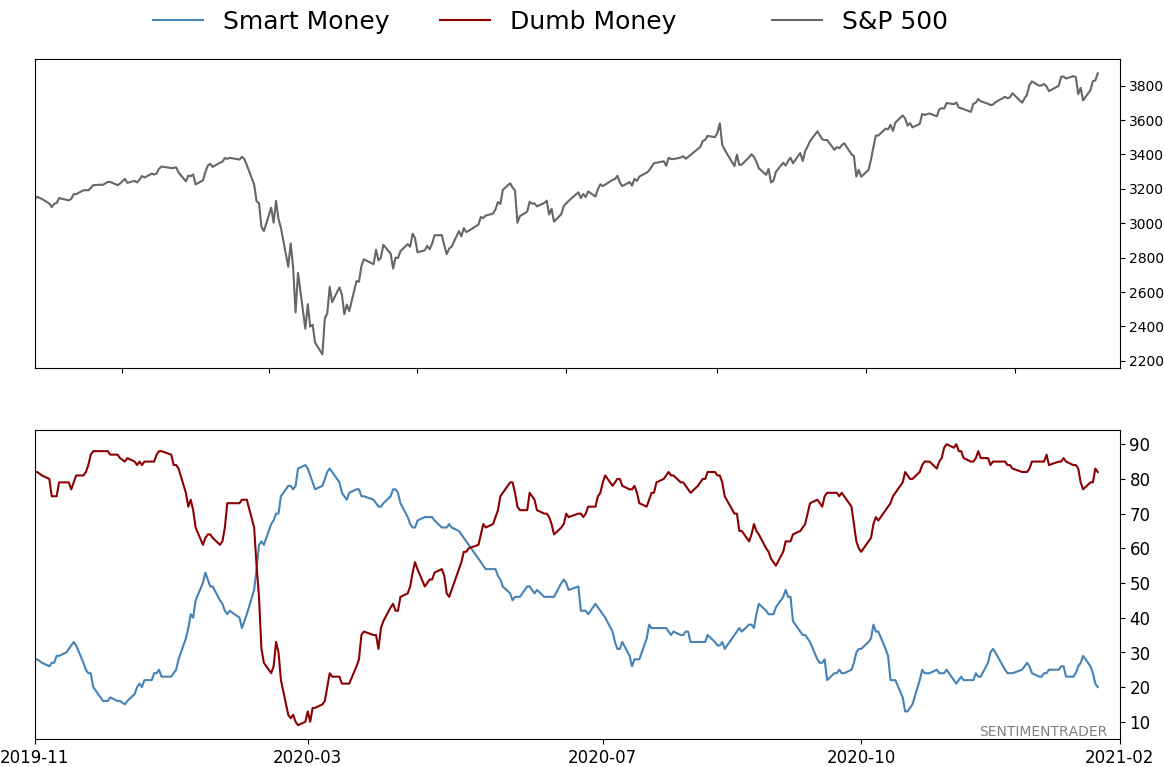
Smart / Dumb Money Confidence

Smart Money Confidence: 20% Dumb Money Confidence: 82%
Daily Report : Investors get comfortable trading stocks on their own merits

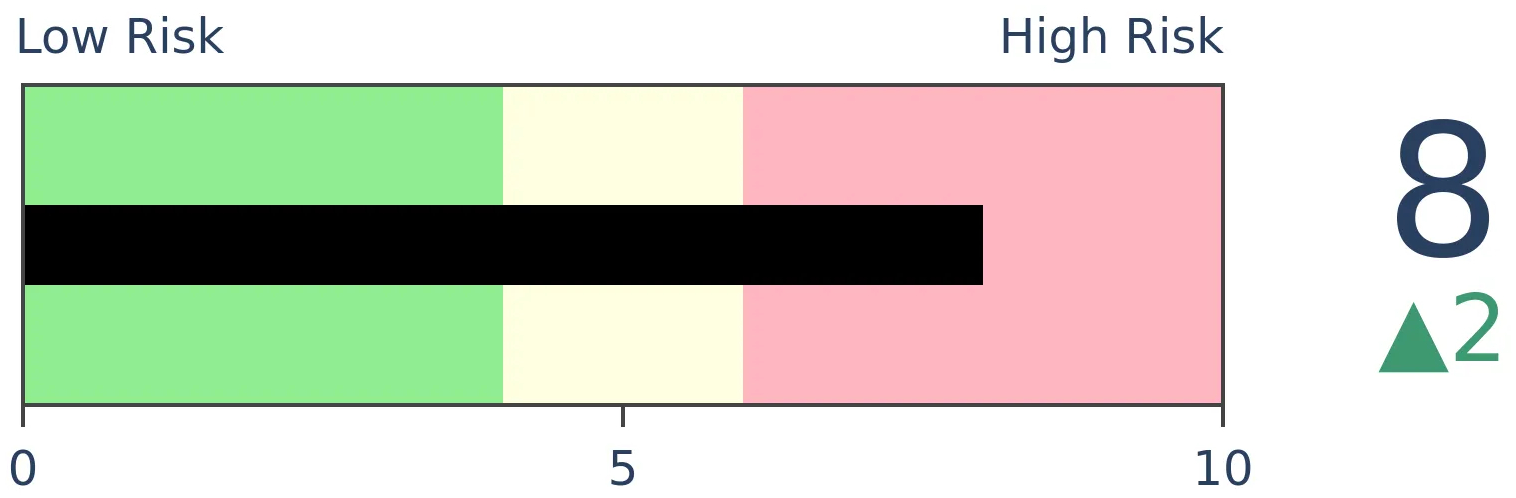
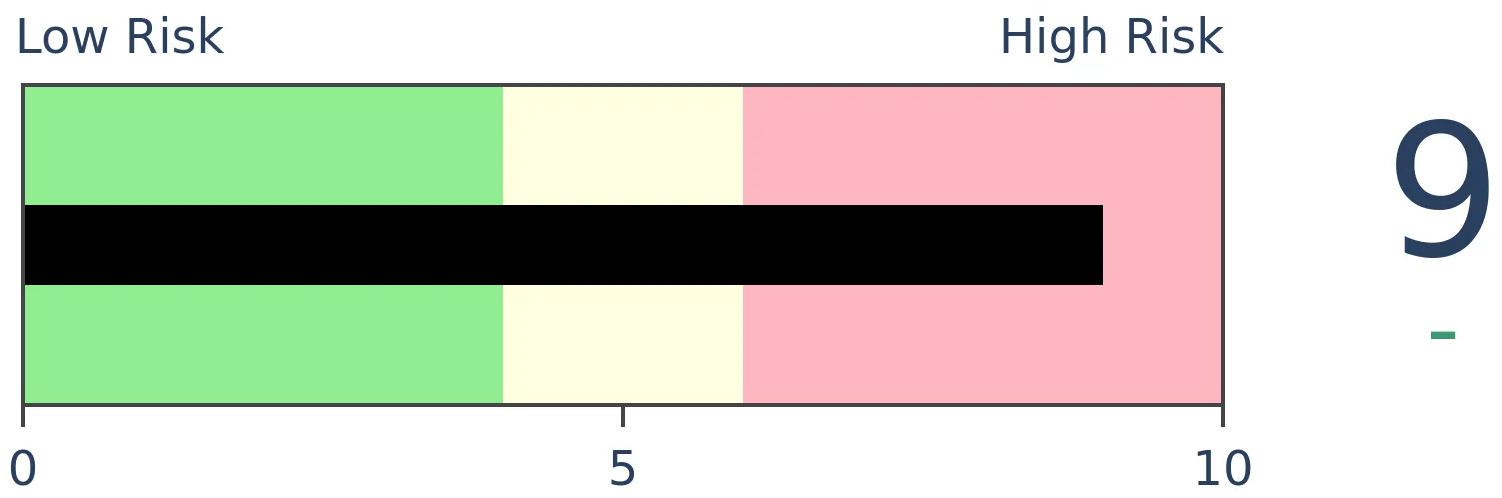
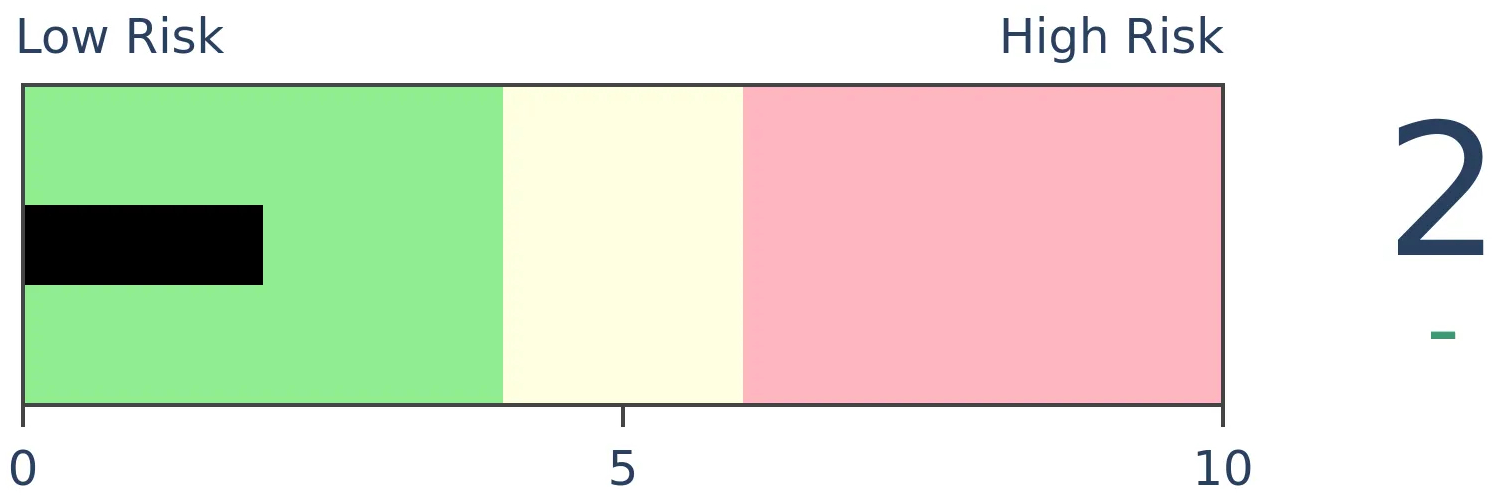
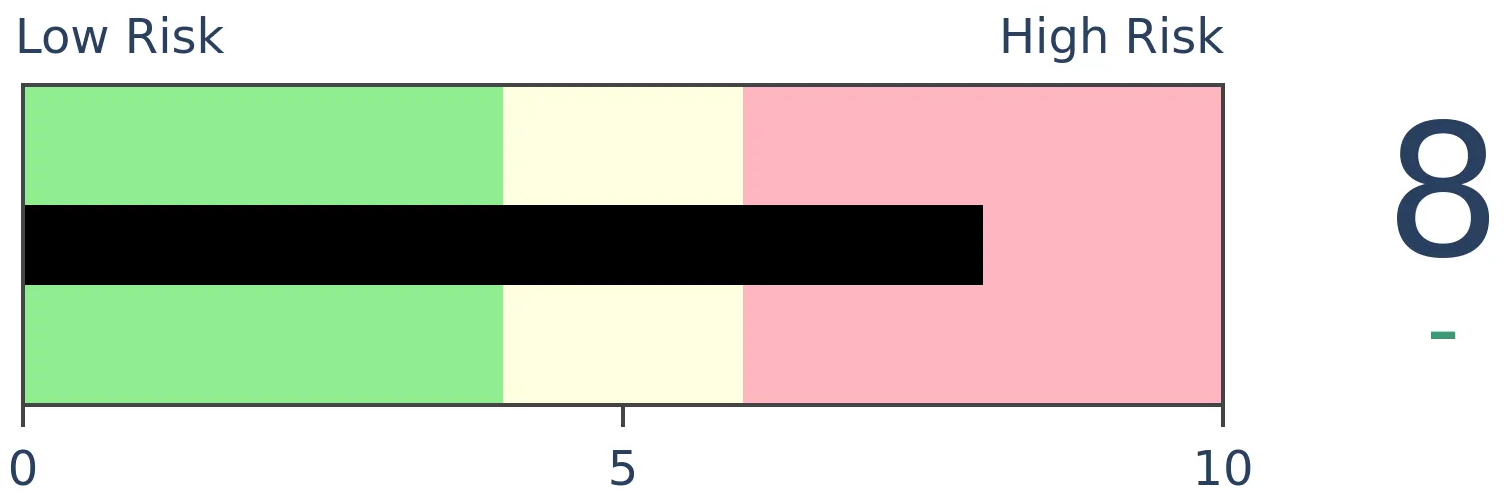
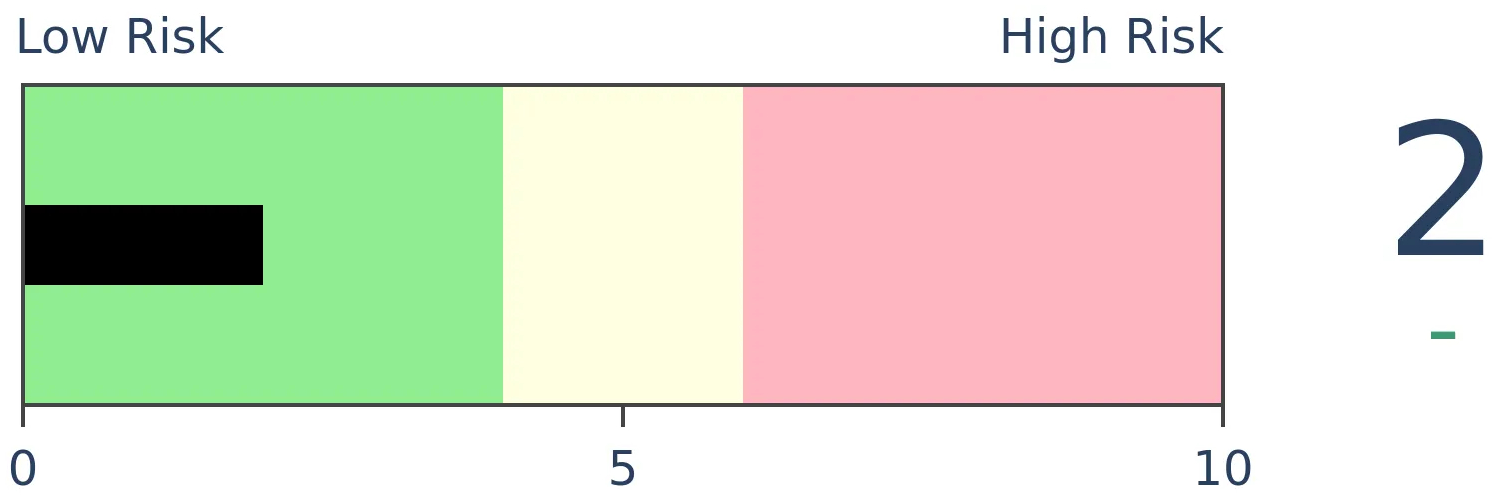
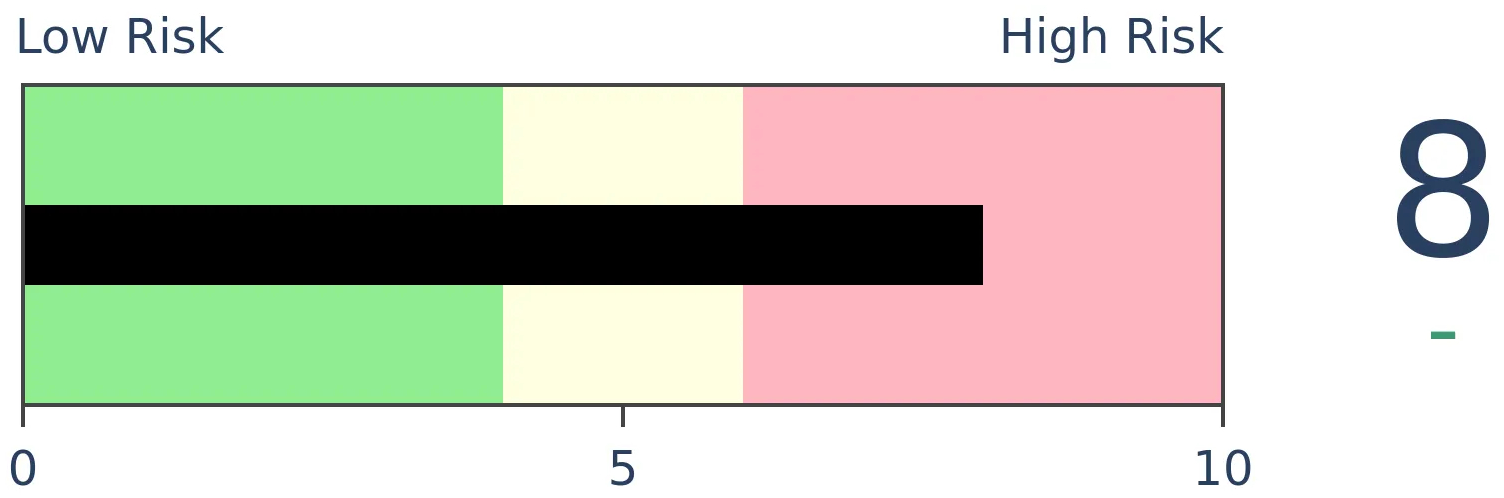
Risk Levels

Stocks Short-Term

Daily Report : Investors get comfortable trading stocks on their own merits

Stocks Medium-Term

Daily Report : Investors get comfortable trading stocks on their own merits

Bonds

Daily Report : Investors get comfortable trading stocks on their own merits

Crude Oil

Daily Report : Investors get comfortable trading stocks on their own merits

Gold

Daily Report : Investors get comfortable trading stocks on their own merits

Agriculture

Daily Report : Investors get comfortable trading stocks on their own merits

Research

Investors get comfortable trading stocks on their own merits

BOTTOM LINE
The correlation among member stocks of the S&P 500 has declined to the lowest level in a year, and is more than a standard deviation below average. This signals complacency among investors.

FORECAST / TIMEFRAME
SPY -- Down, Medium-Term

It's a truism of markets, lasting decades if not centuries, that when investors panic, they sell everything together. When they're comfortable, they buy and sell securities on their individual merits.

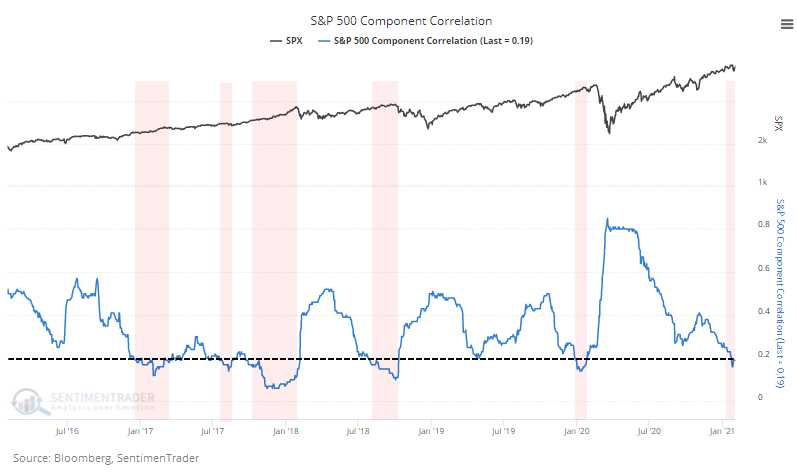
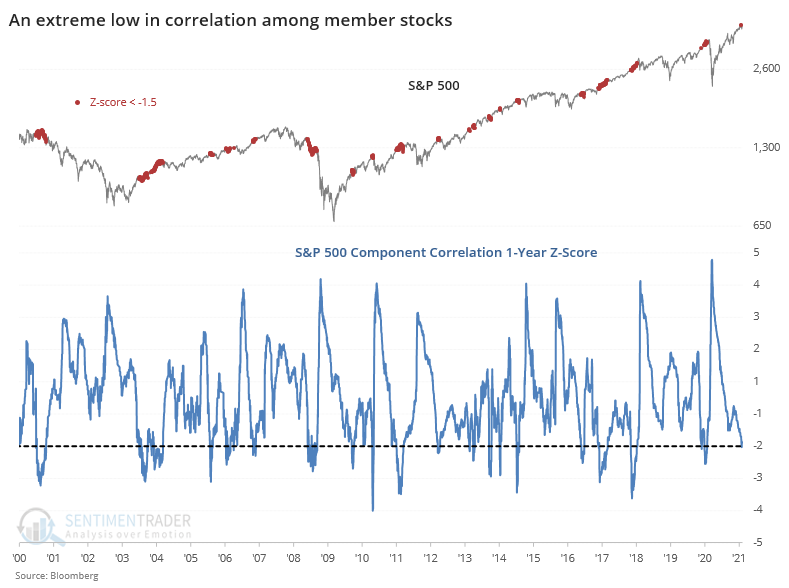
That's why we see correlations among stocks and other assets rise during times of anxiety and fall during periods of complacency. This is notable now because the correlation among stocks in the S&P 500 has plunged to the lowest level in over a year.
Daily Report : Investors get comfortable trading stocks on their own merits

Correlations have gyrated in a wider range in recent years, so we can transform the data series above into a z-score. This compares the current reading to the average over the past year and adjusts for the standard deviation among those readings. This measure dropped below -1.5 in late January and has stayed right around that level.
Daily Report : Investors get comfortable trading stocks on their own merits

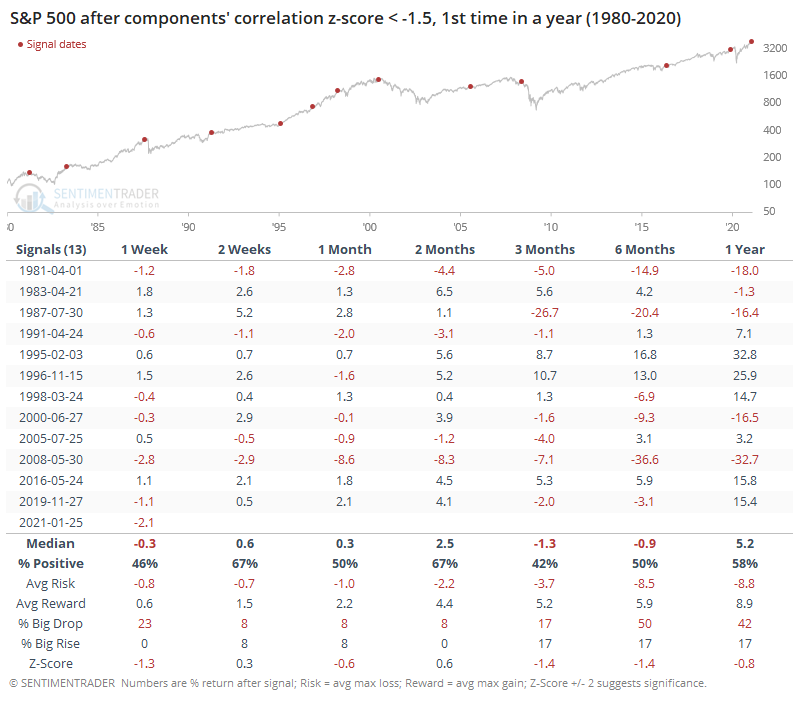
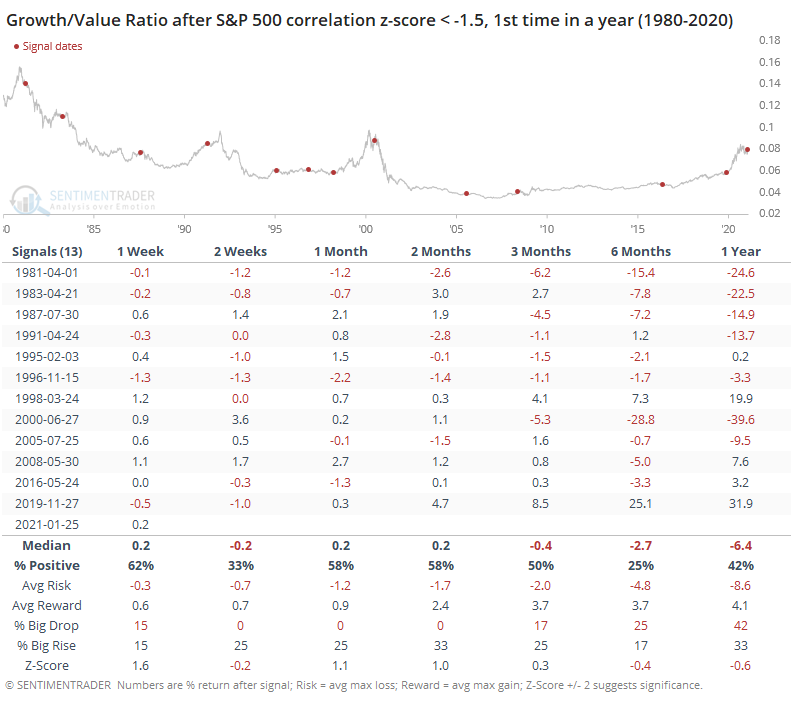
When the S&P 500 has been at or near a high and the correlation z-score drops below -1.5, the index has had some trouble holding its momentum.
Daily Report : Investors get comfortable trading stocks on their own merits

Over the next 3-6 months, it sported a negative average return. During the next 6 months, its average risk (maximum decline) was -8.5% while its average reward (maximum advance) was only +5.9%. It was also significantly more likely to see a big drop versus a big rise within those 6 months. See this Knowledge Base article for more details about the terms in the table.

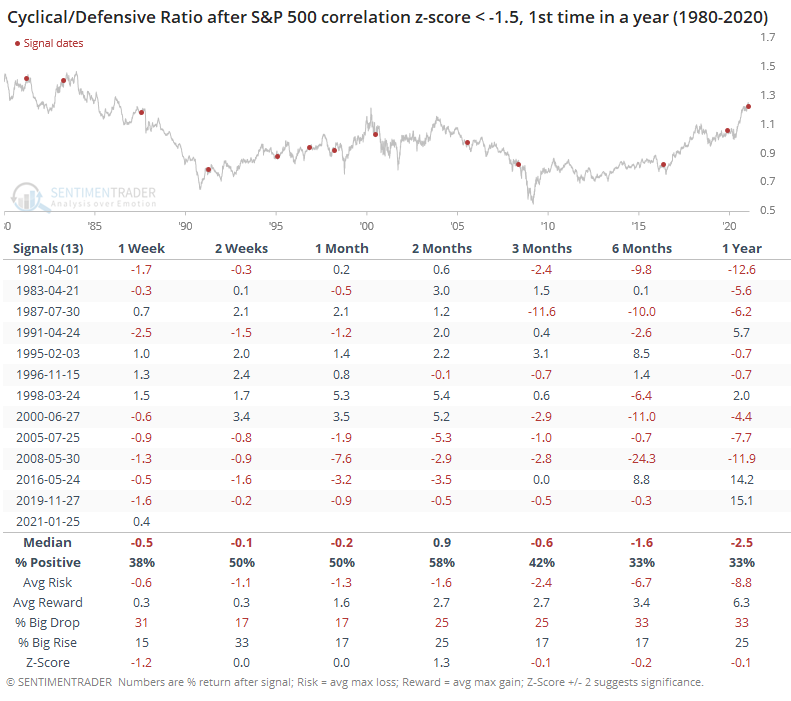
Looking at some factor ratios, cyclical stocks tended to underperform defensive ones after these signals.
Daily Report : Investors get comfortable trading stocks on their own merits

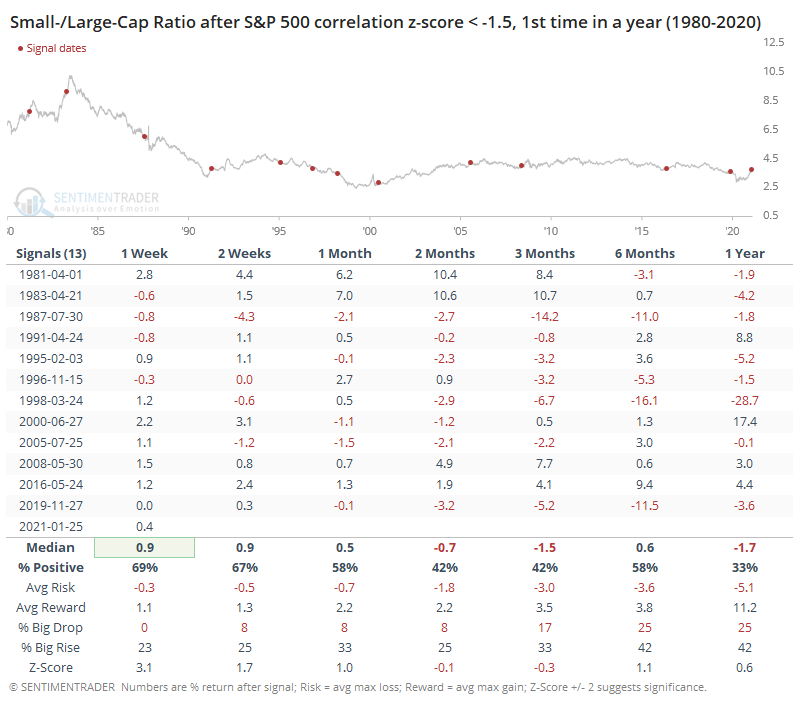
Small stocks underperformed large ones.
Daily Report : Investors get comfortable trading stocks on their own merits

And growth underperformed value, though that last signal was a doozy of an exception.
Daily Report : Investors get comfortable trading stocks on their own merits

There is no shortage of signals that most investors are somewhere on the spectrum between complacent and euphoric, perhaps even manic. This can go on for a while, but we've been seeing some cracks under the surface that bear watching. A hyper-speculative environment that's coupled with decaying internal momentum is a recipe for weeks or months of high risk.


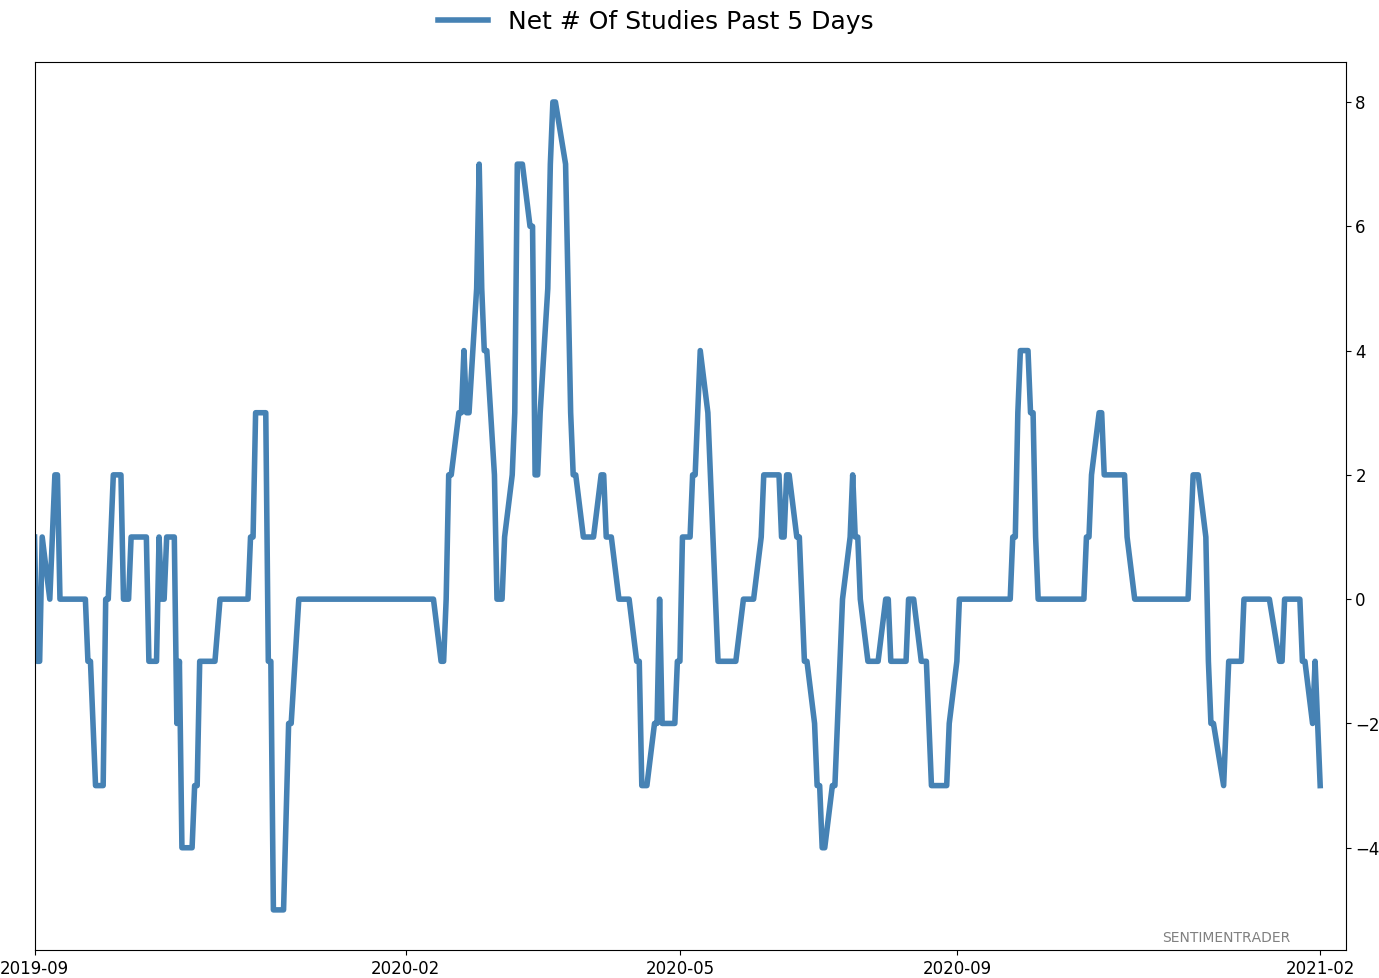
Active Studies

Click here to view the Active Research on the site.
Time FrameBullishBearish
Short-Term00
Medium-Term25
Long-Term153
Daily Report : Investors get comfortable trading stocks on their own merits

Indicators at Extremes

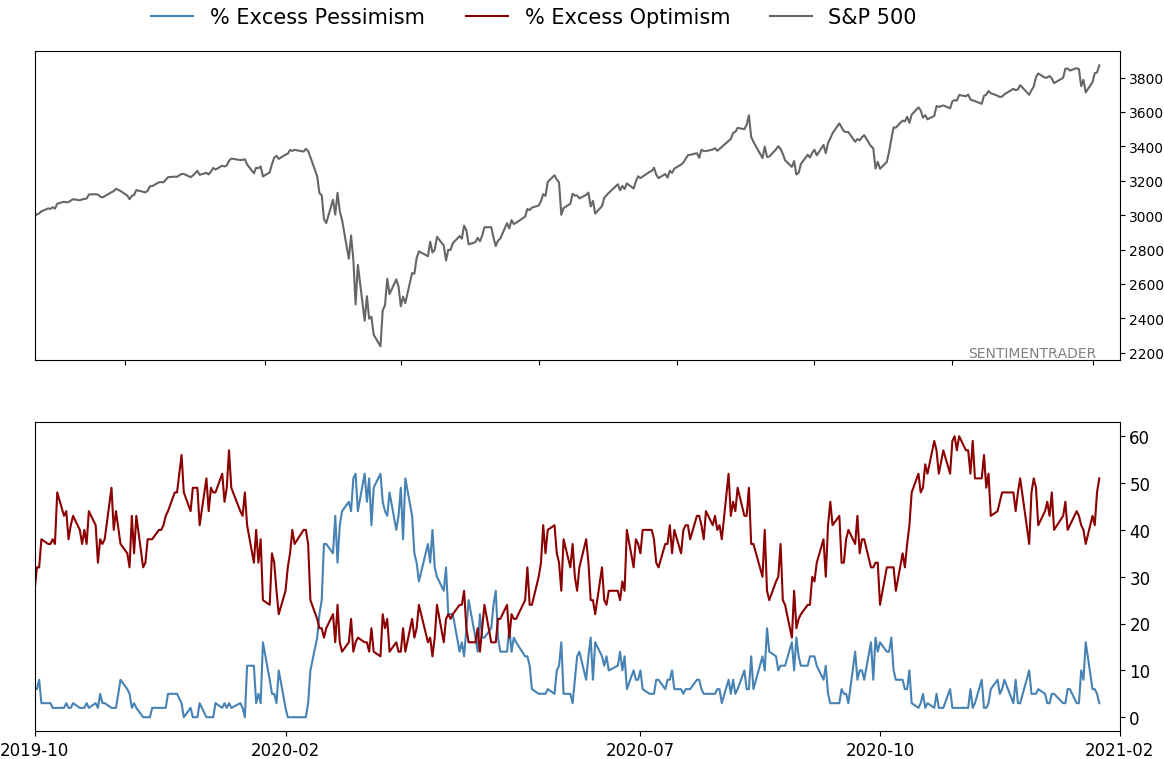
Click here to view on the site (% Extremes and "Excess" tabs on the dashboard).
Daily Report : Investors get comfortable trading stocks on their own merits
% Showing Pessimism: 3%
Bullish for Stocks

VIX
% Showing Optimism: 51%
Bearish for Stocks

AIM (Advisor and Investor Model)
Smart Money / Dumb Money Confidence Spread
Intermediate Term Optimism Index (Optix)
Smart Money Confidence
Short-term Optimism Index (Optix)
Dumb Money Confidence
% Showing Excess Pessimism
% Showing Excess Optimism
NYSE High/Low Ratio
Fidelity Funds Breadth
Rydex Ratio
Rydex Money Market %
NYSE Arms Index
OEX Put/Call Ratio
VIX Term Structure
OEX Determination Index
NYSE Up Volume Ratio
Equity Put/Call Ratio
OEX Open Interest Ratio
Risk Appetite Index
SKEW Index
Equity Hedging Index
Options Speculation Index
AAII Allocation - Stocks
ROBO Put/Call Ratio
LOBO Put/Call Ratio
NAAIM Exposure Index
Retail Money Market Ratio
NYSE Available Cash
Equity / Money Market Asset Ratio
Mutual Fund Cash Level

Portfolio

PositionDescriptionWeight %Added / ReducedDate
Stocks8.7% RSP8.7Reduced 28.8%2021-01-26
Bonds9.5% ANGL, 9.1% SCHP, 9.0% BND27.6Reduced 0.2%2021-01-26
CommoditiesGCC2.3Reduced 2.1%
2020-09-04
Precious MetalsGDX8.9Added 4.8%2020-12-01
Special Situations10.3% XLE, 8.9% PSCE19.2Added 19.2%2021-01-26
Cash33.4
Updates (Changes made today are underlined)

With a market that has seen the kinds of broad participation and big breath thrusts like we did in the fall, it's hard to become too negative. Those kinds of conditions have consistently preceded higher returns over the next 6-12 months.

It's the interim that's more of an issue. Even conditions like that haven't prevented some shorter-term pullbacks. And when we combine an environment where speculation is rampant and recent days have seen an increase in cracks under the surface of the indexes, it's enough to become more defensive over a short- to medium-term time frame. We still don't have much confirmation from the price action in the indexes, so those who are more conservative would likely wait before increasing cash levels.

In a bid to more closely align the portfolio with what most of our members consider "stocks", we have moved any sector-specific investments to the "special situations" category instead of "stocks." This way, the "stocks" category is essentially the most benchmarked index in the world, the S&P 500.

RETURN YTD:  3.7%

2020: 8.1%, 2019: 12.6%, 2018: 0.6%, 2017: 3.8%, 2016: 17.1%, 2015: 9.2%, 2014: 14.5%, 2013: 2.2%, 2012: 10.8%, 2011: 16.5%, 2010: 15.3%, 2009: 23.9%, 2008: 16.2%, 2007: 7.8%

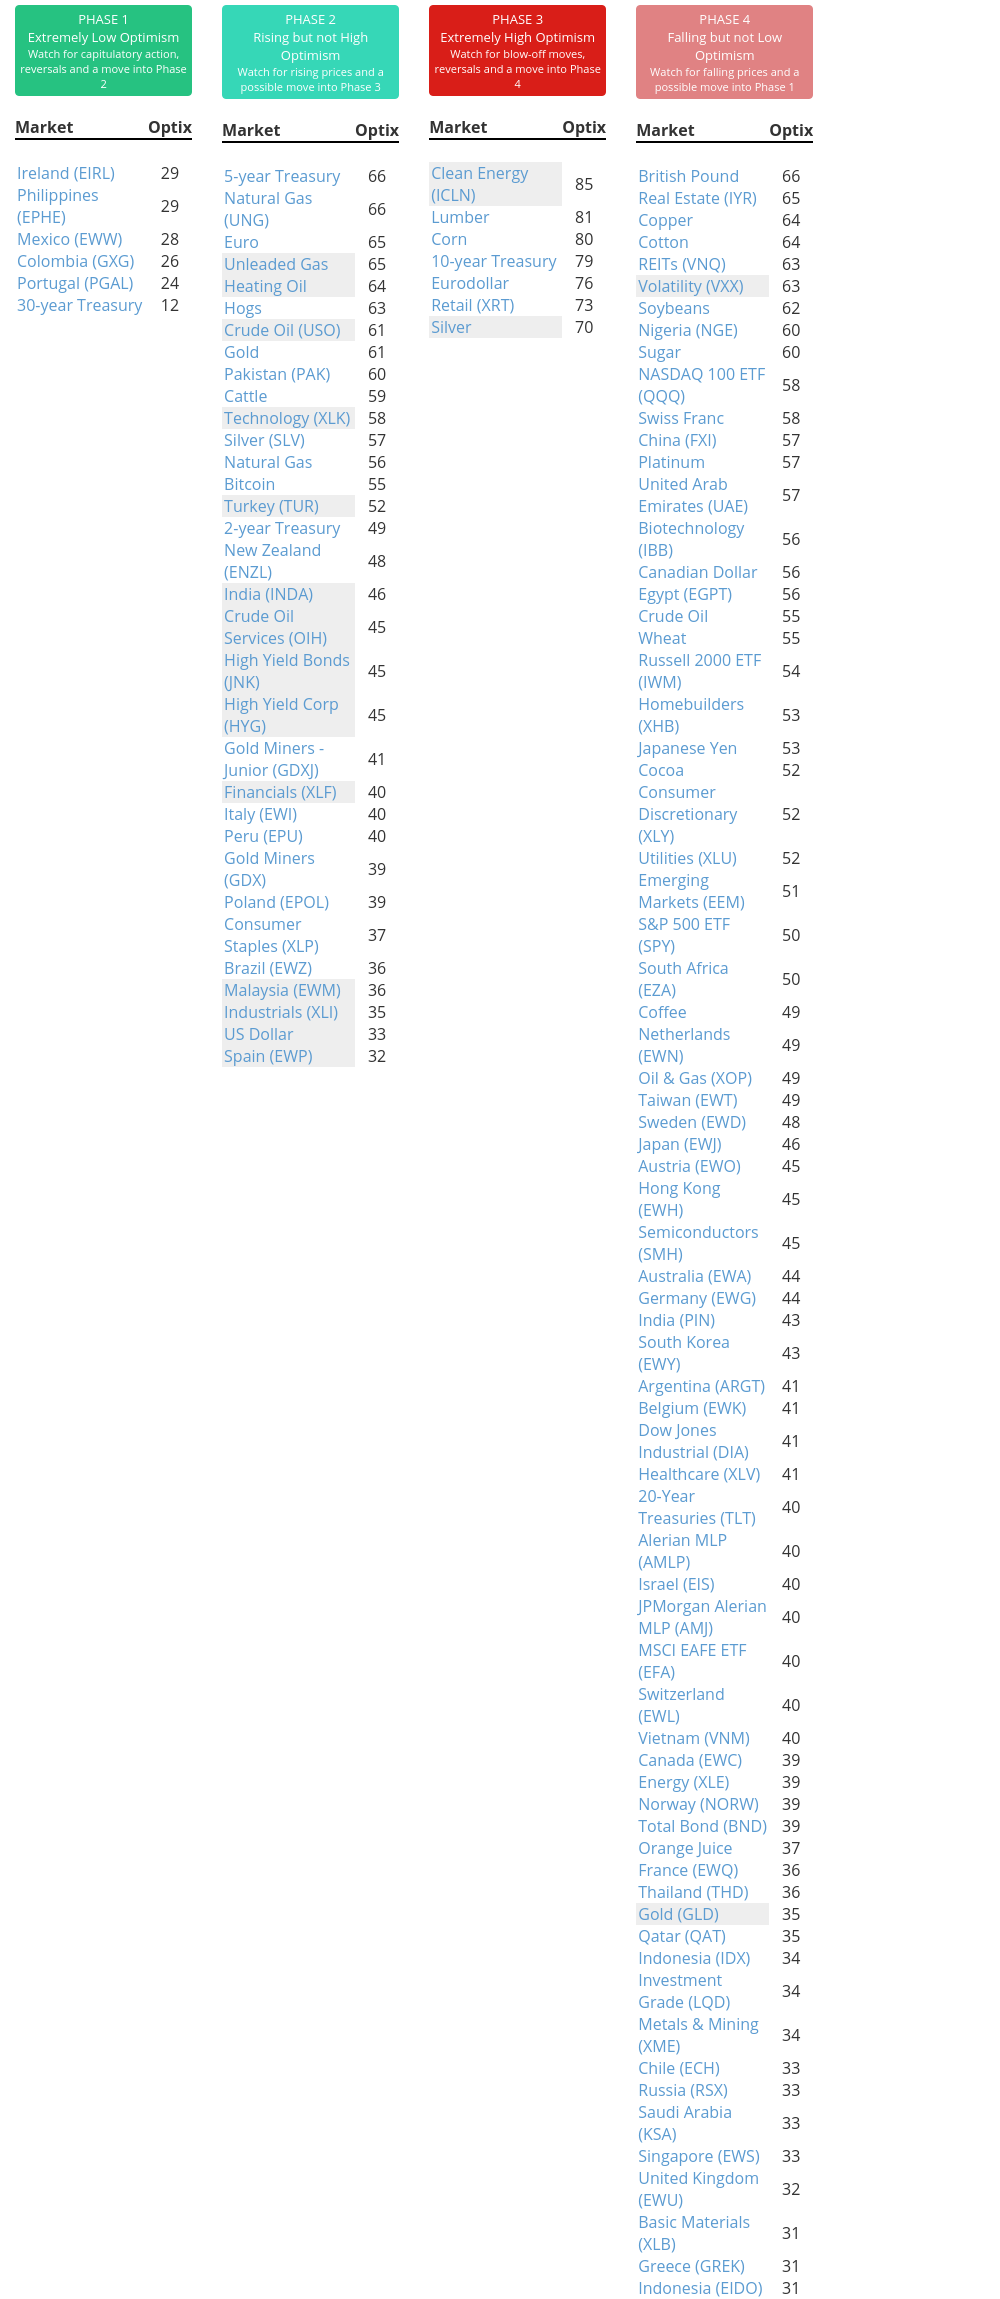
Phase Table

Click here to view the Phase Table on the site.
Daily Report : Investors get comfortable trading stocks on their own merits

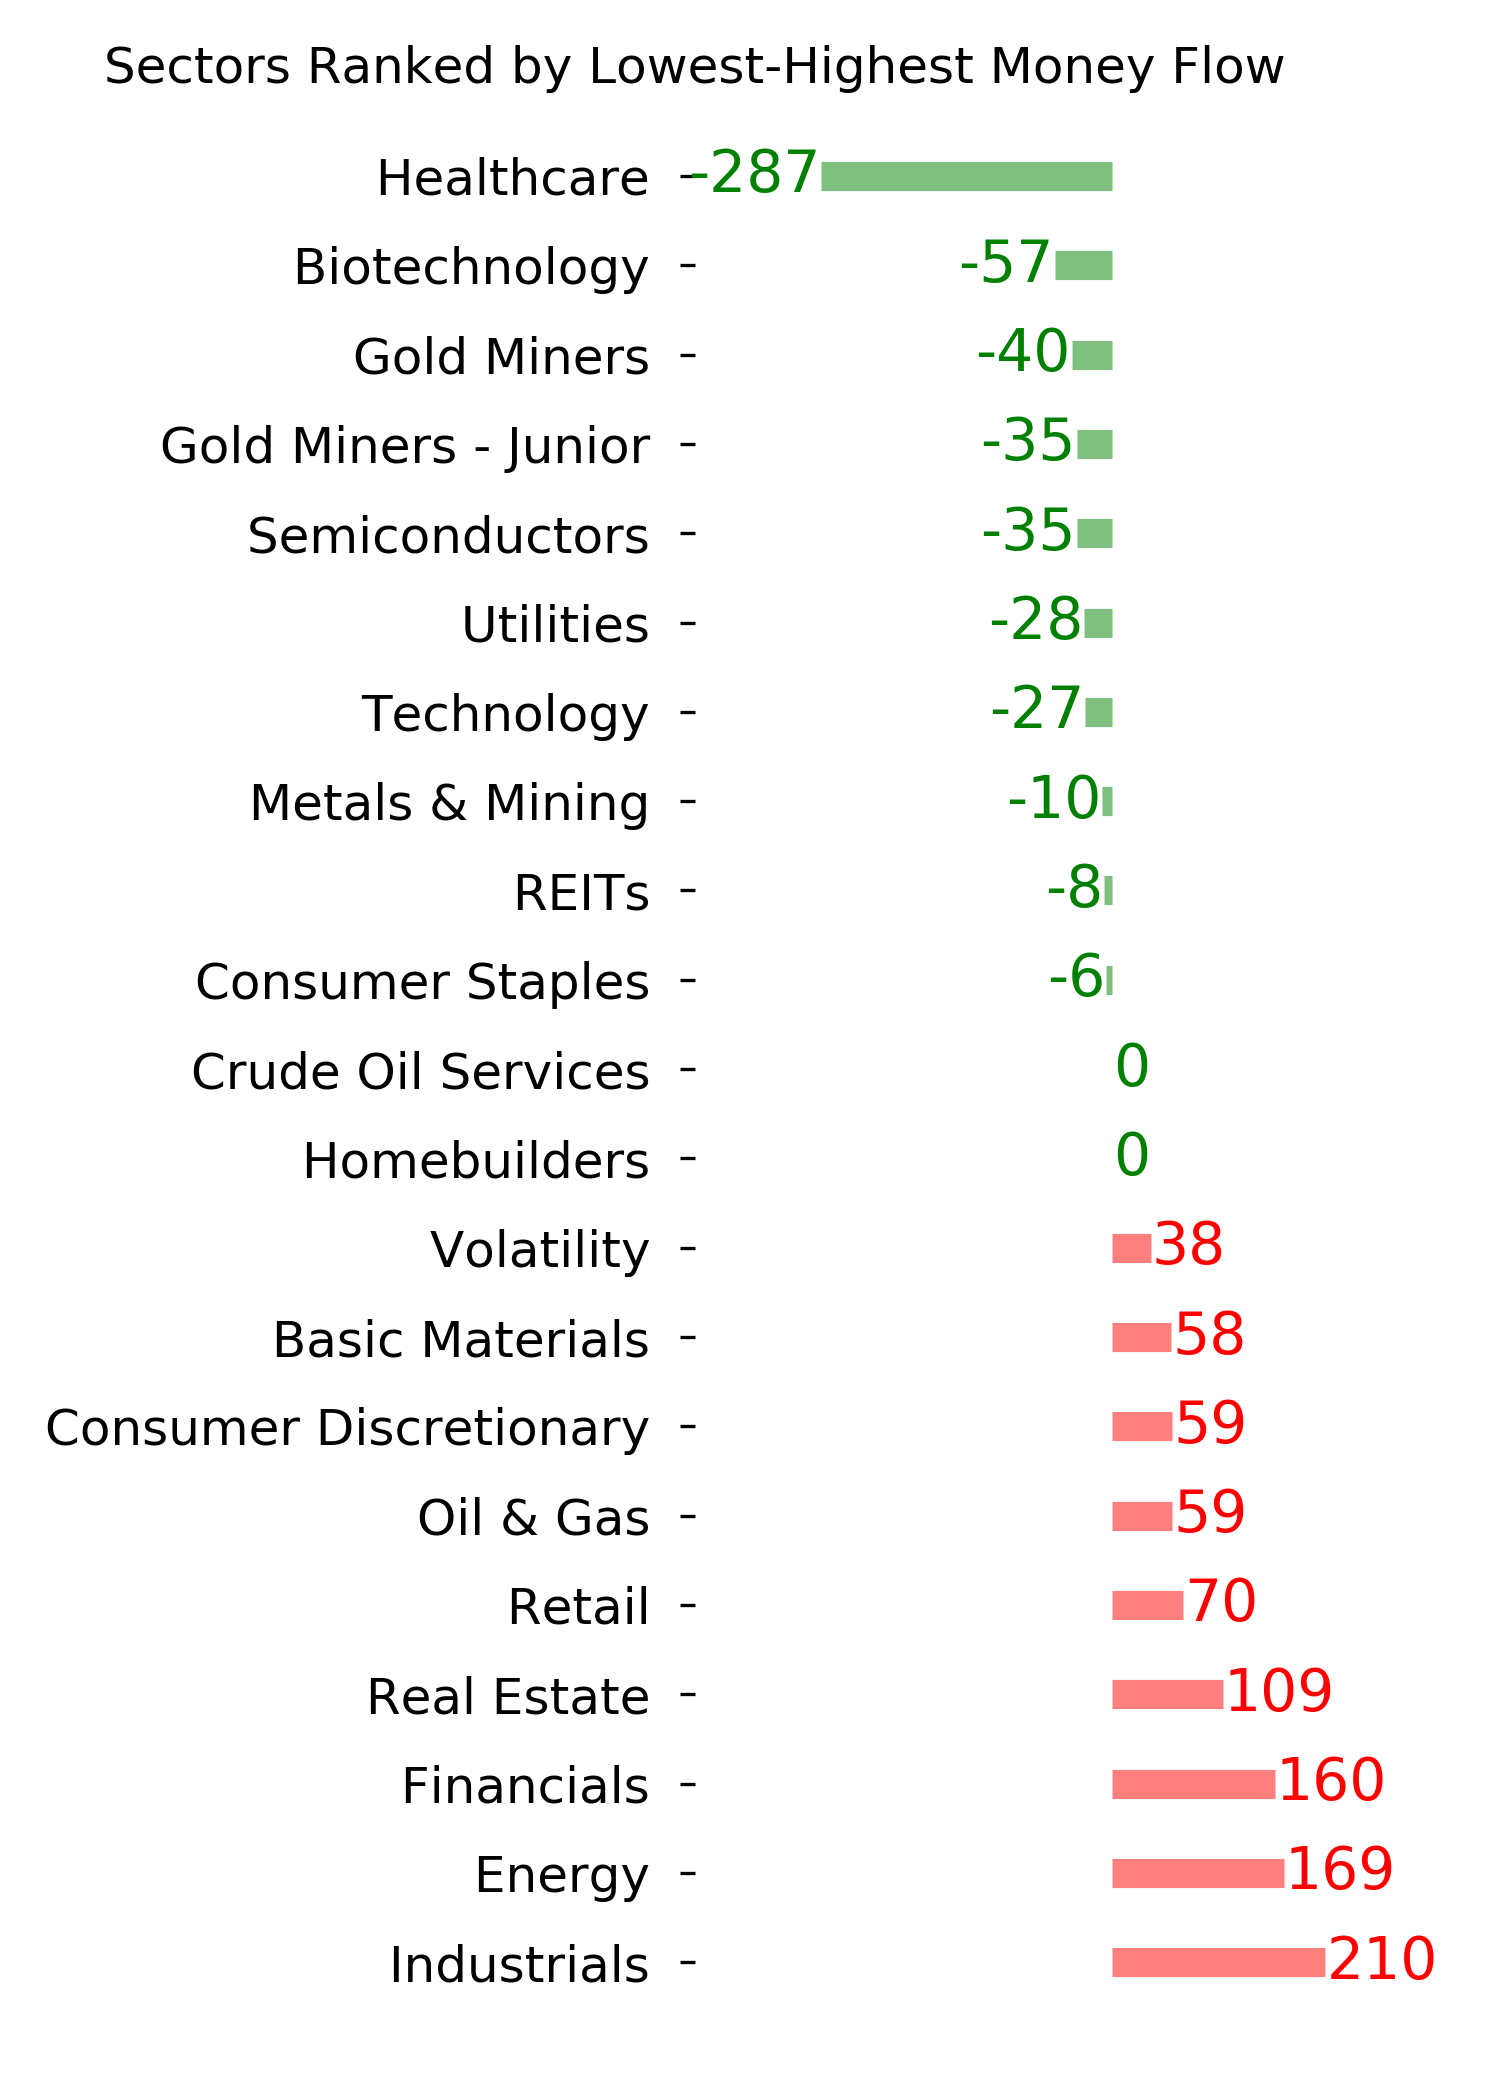
Ranks

Click here to view on the site (Ranks tab on the Dashboard).
Daily Report : Investors get comfortable trading stocks on their own merits

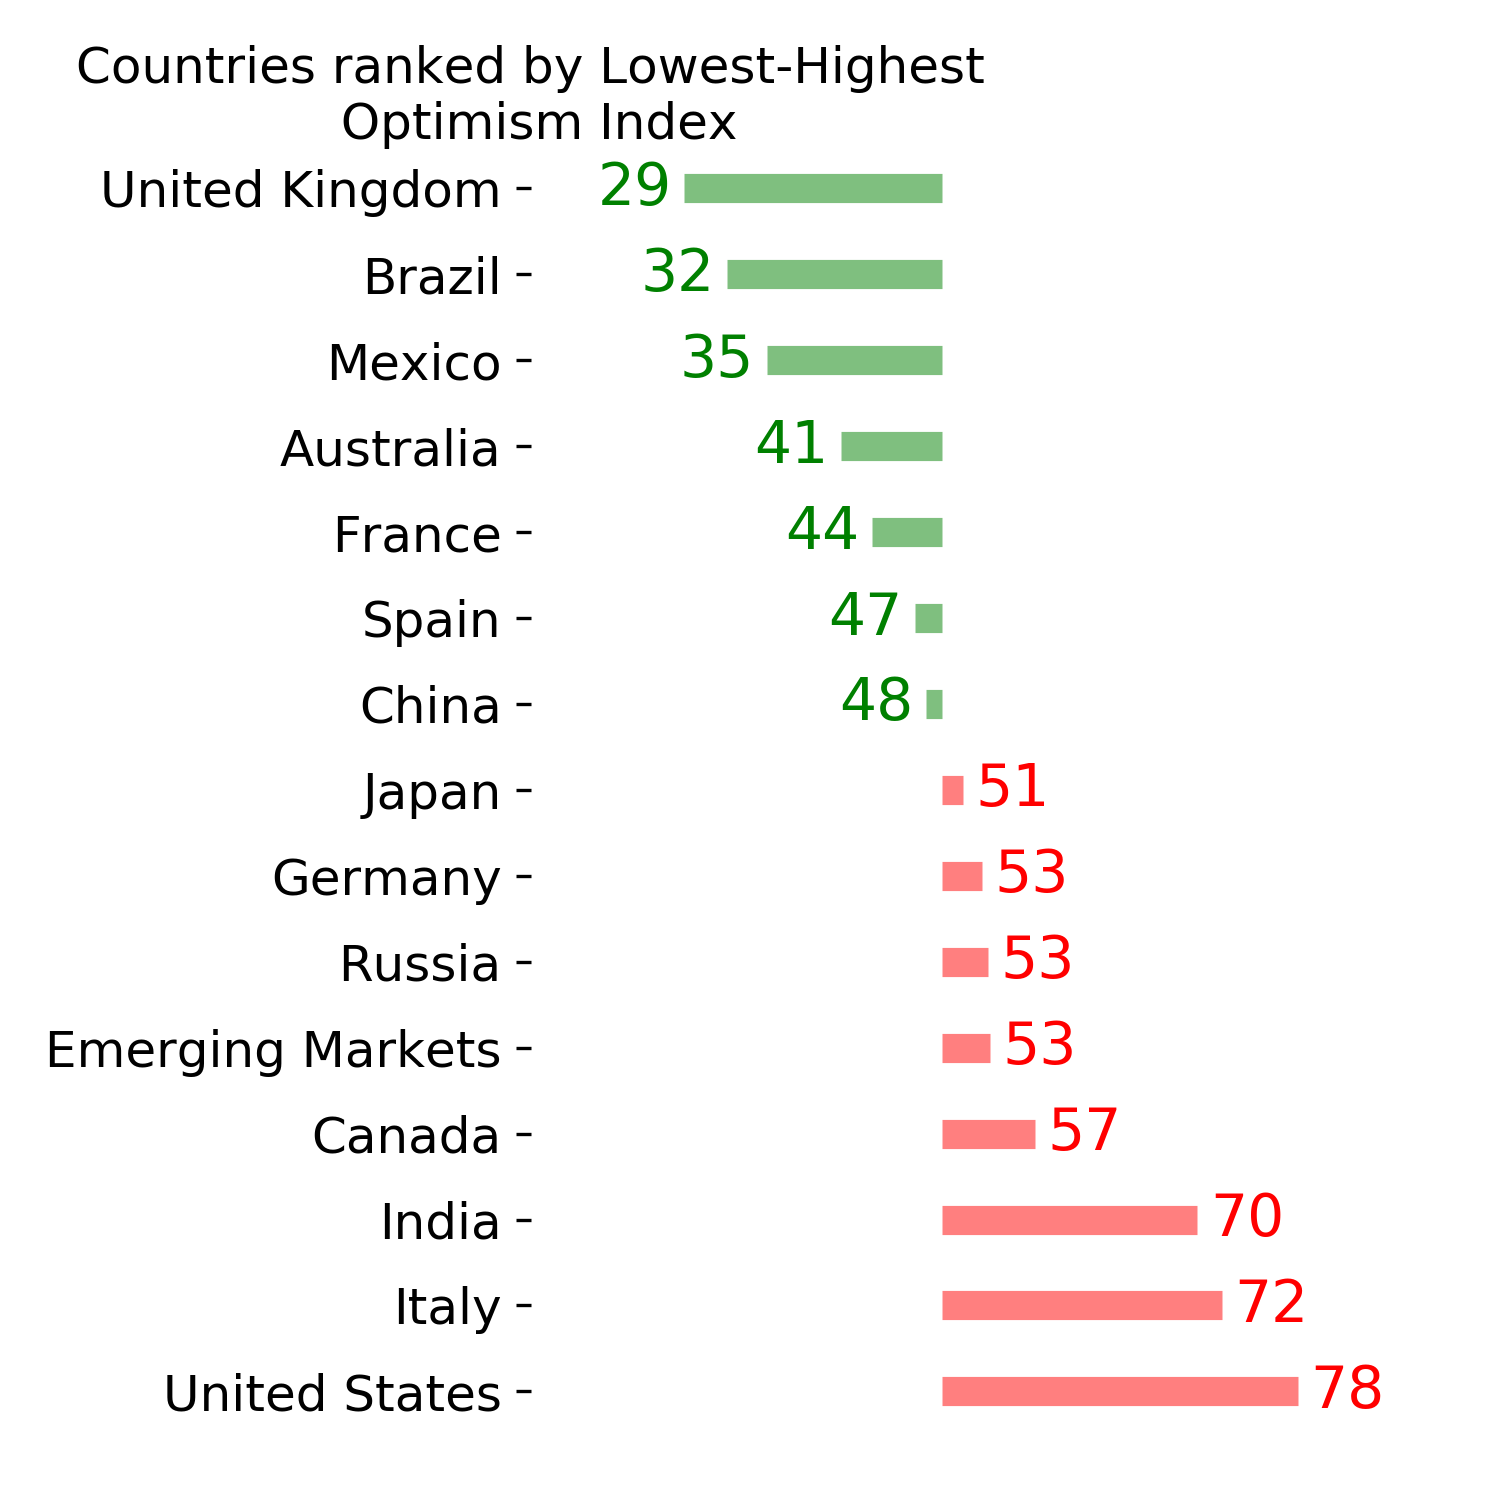
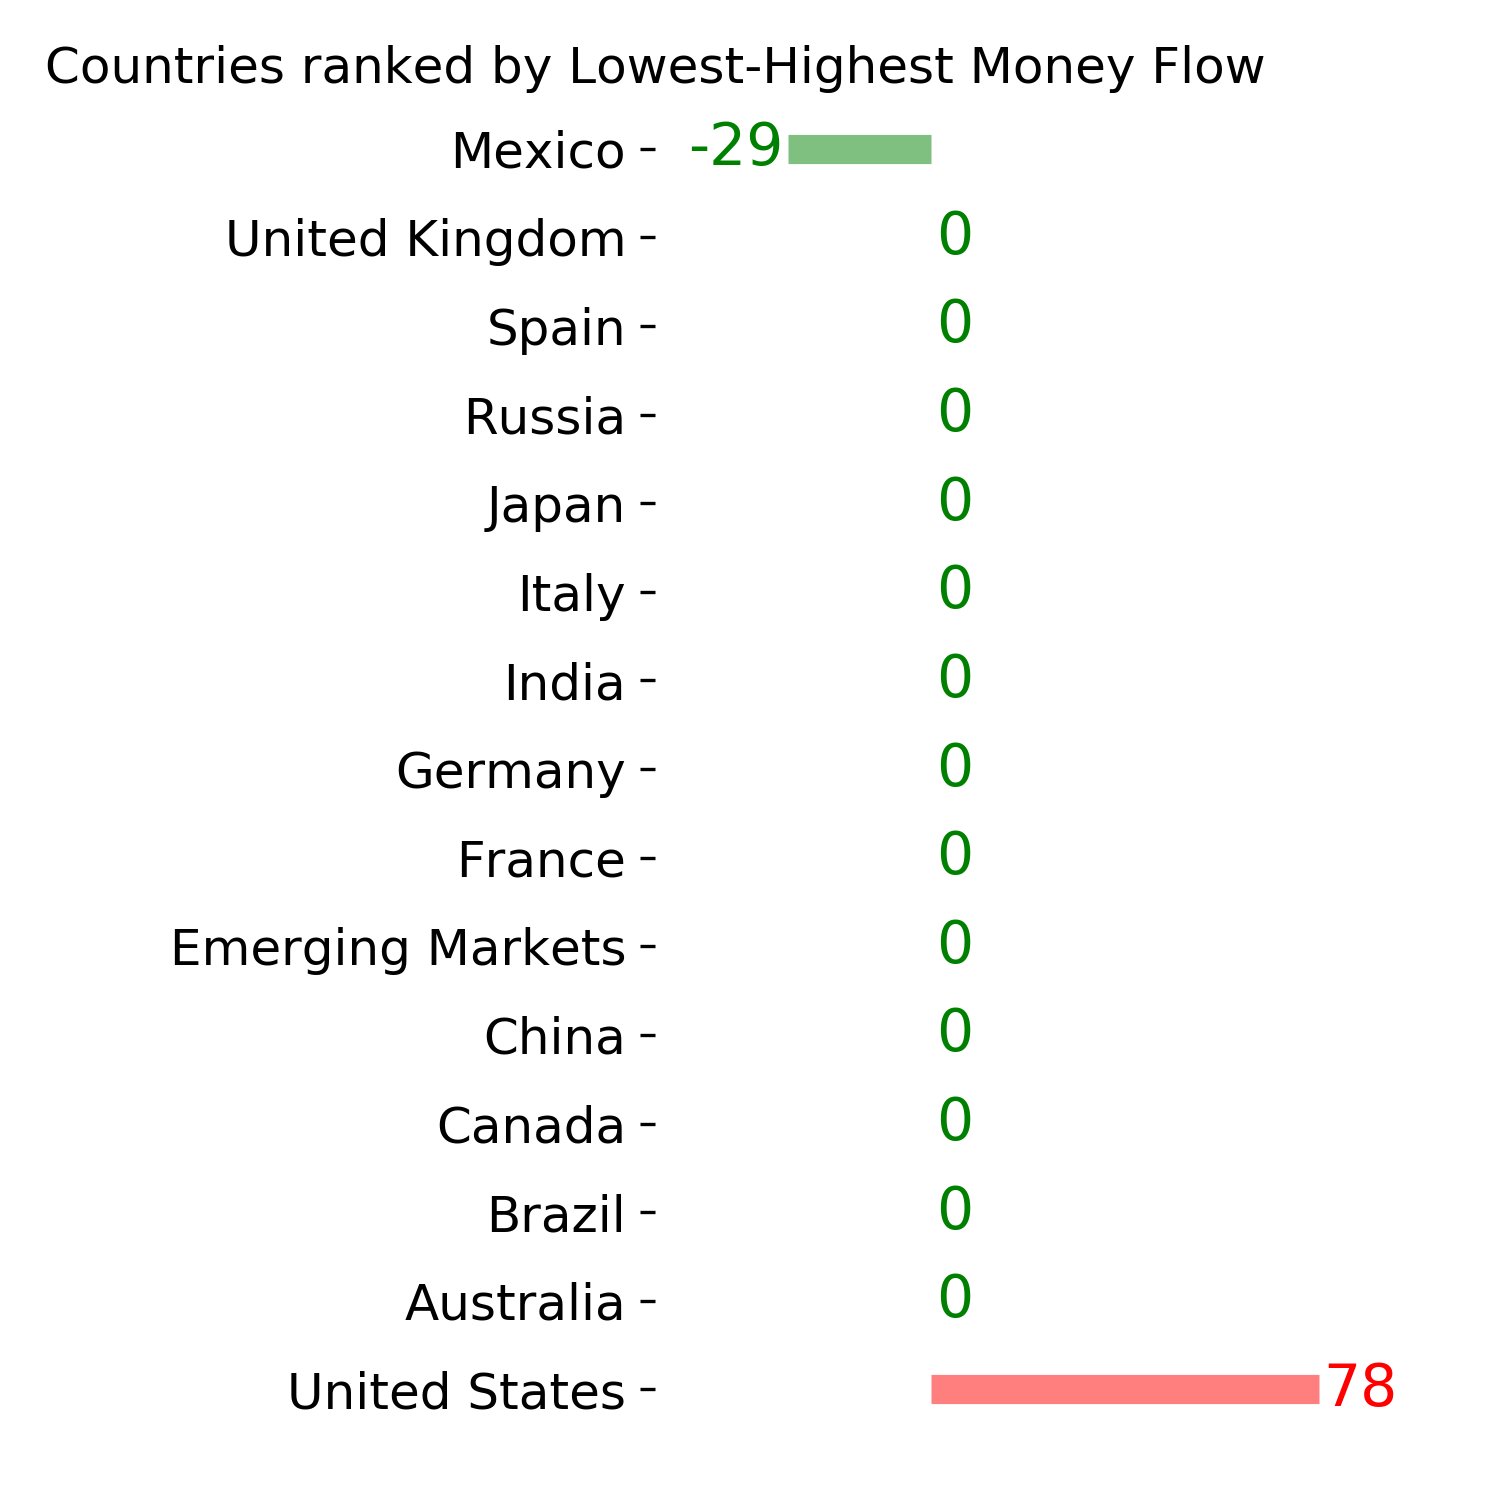
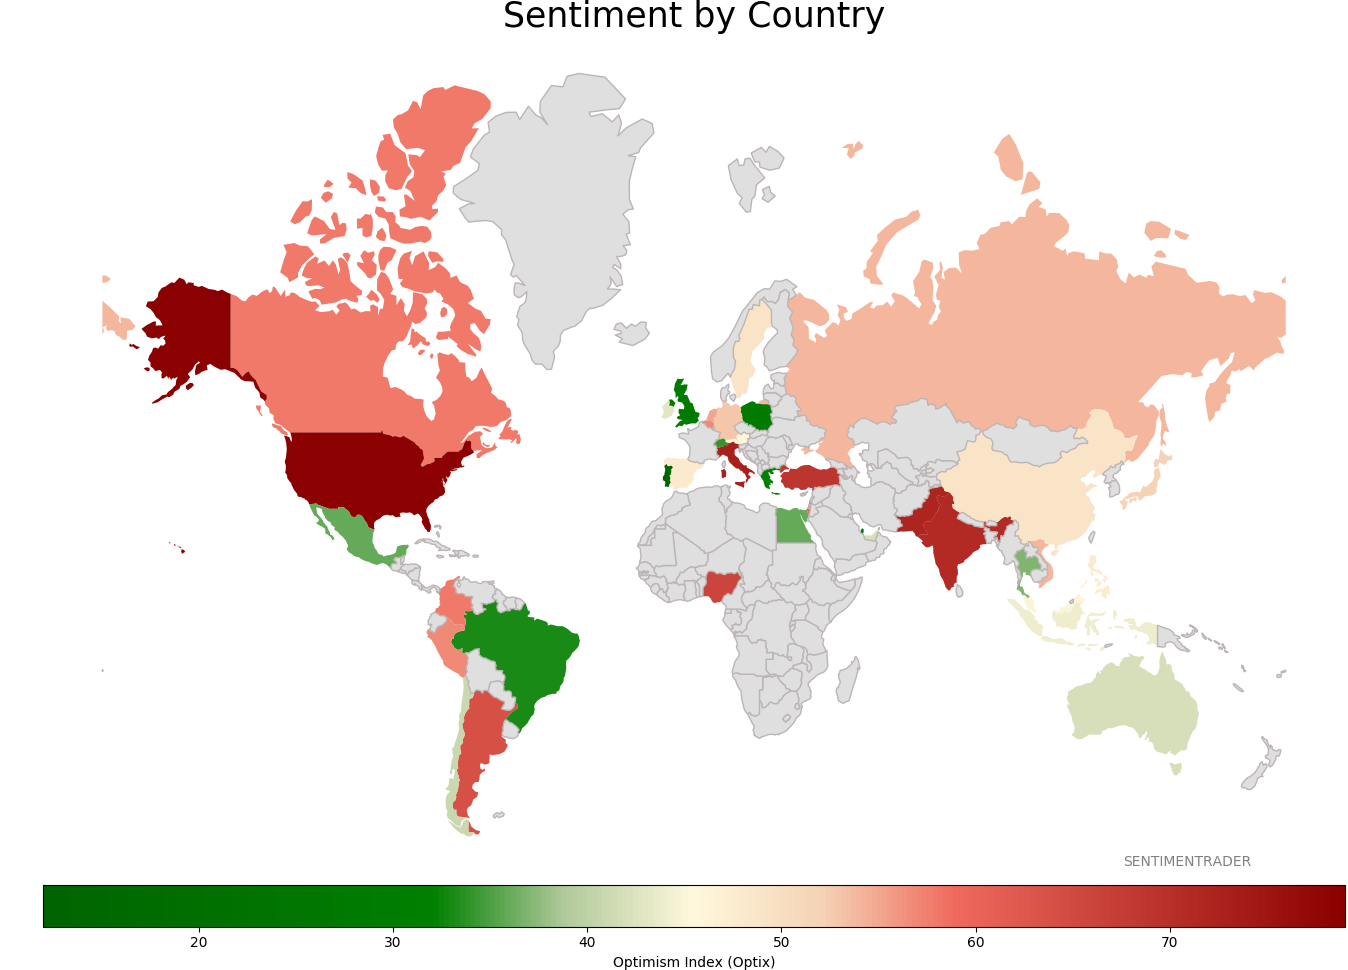
Sentiment Around The World

Click here to view on the site.
Daily Report : Investors get comfortable trading stocks on their own merits

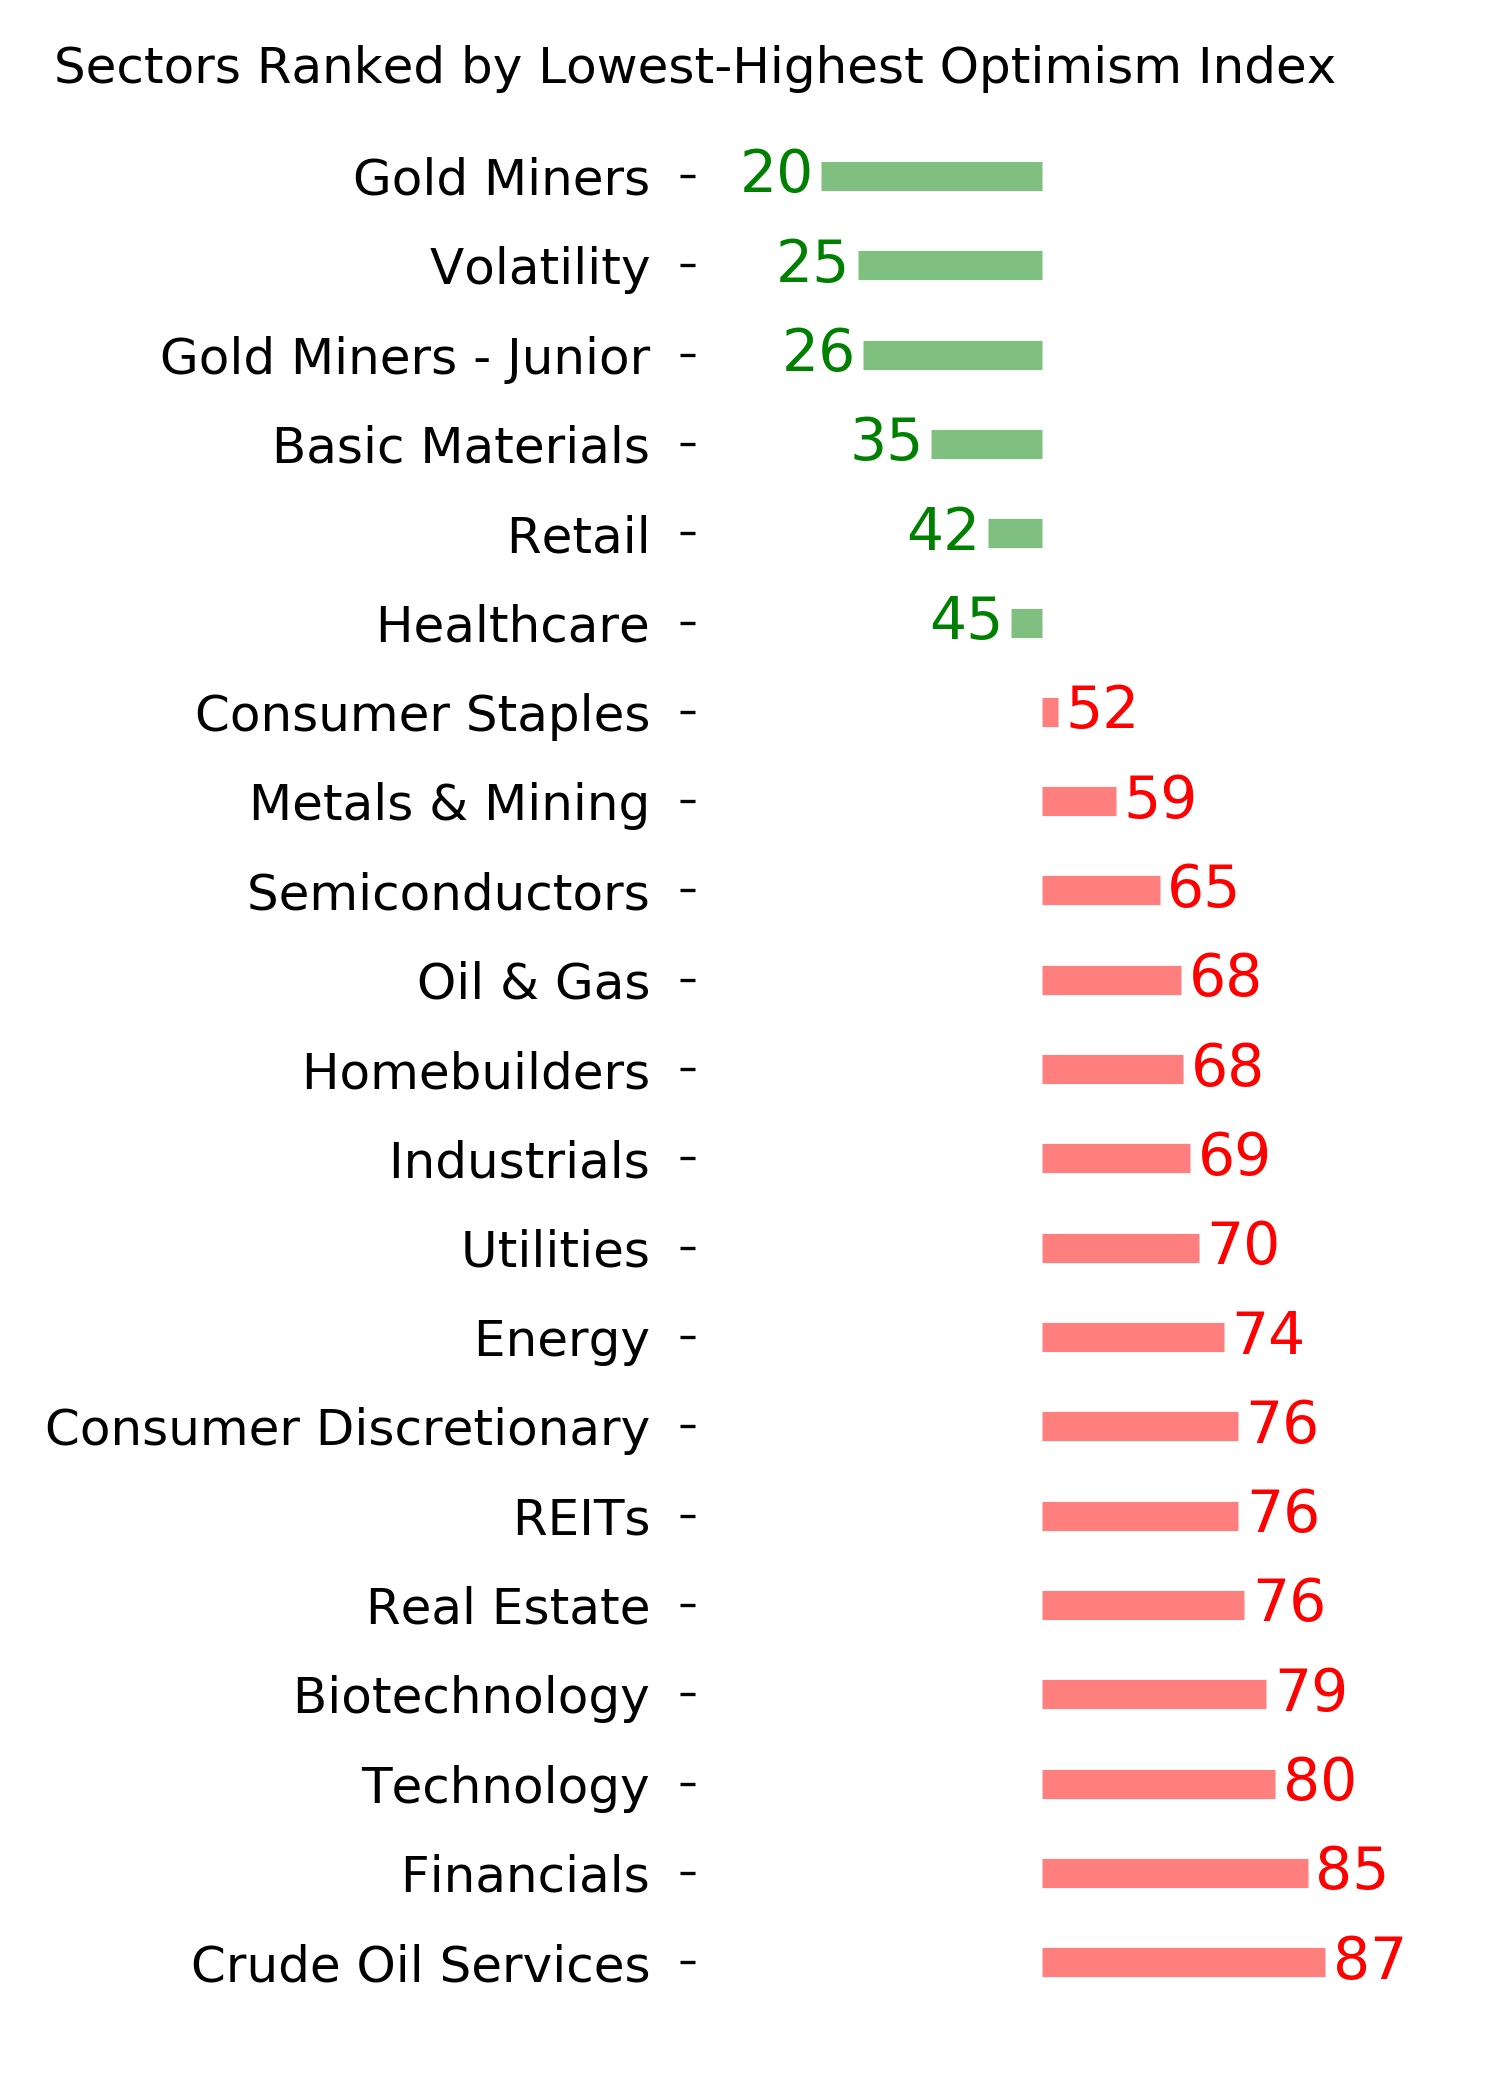
Optimism Index Thumbnails

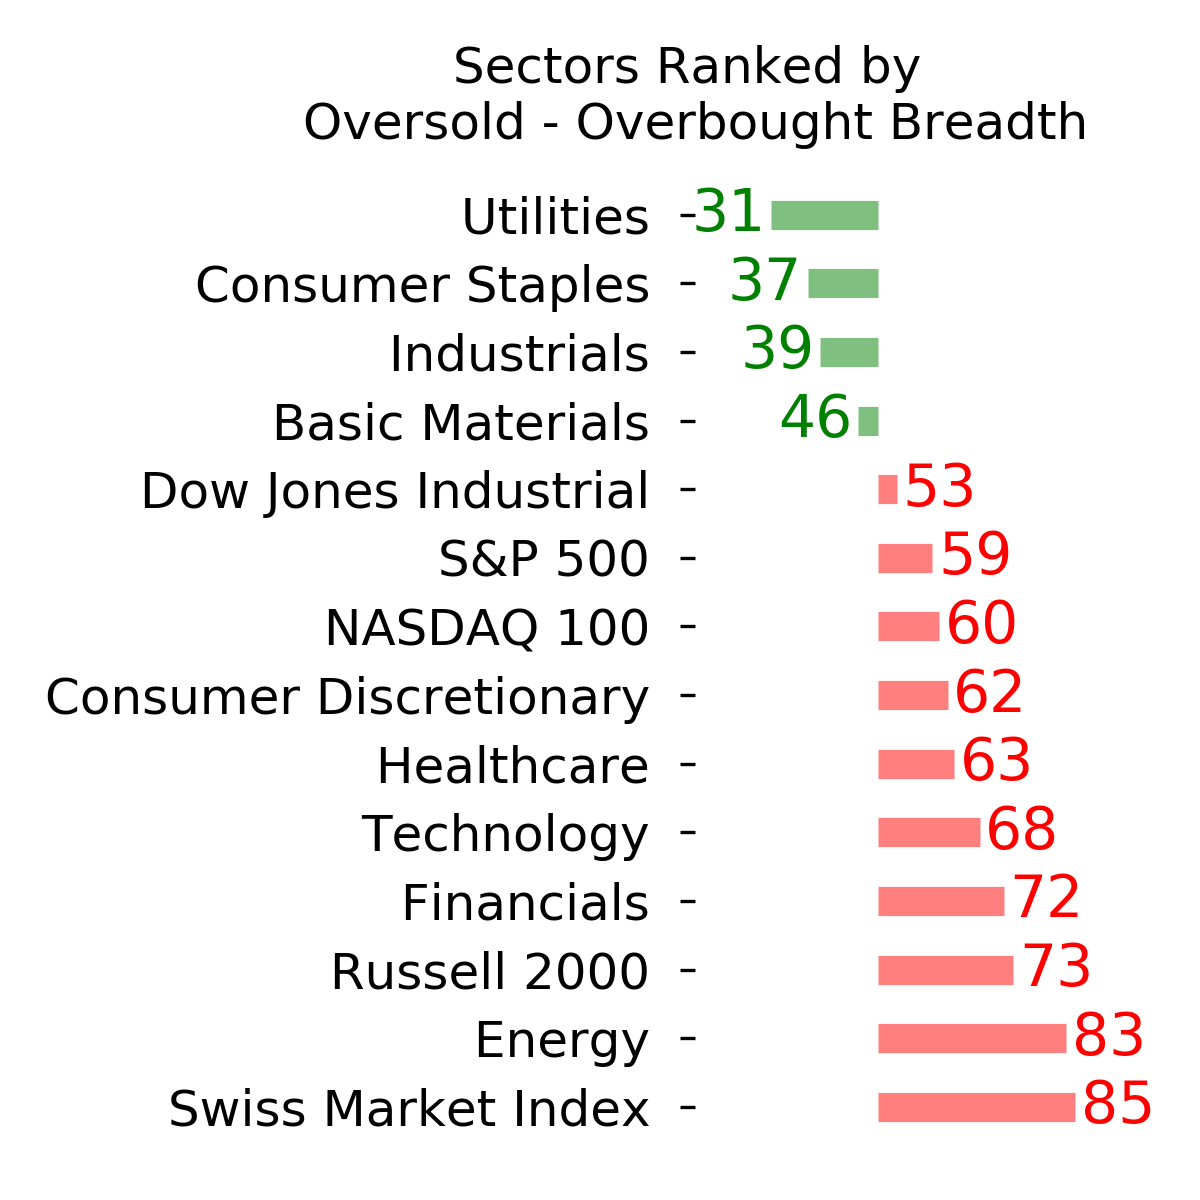
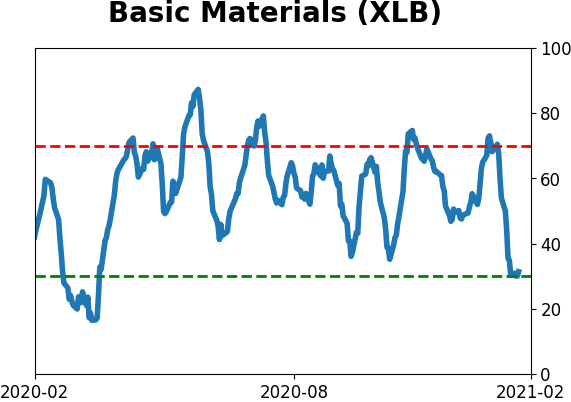
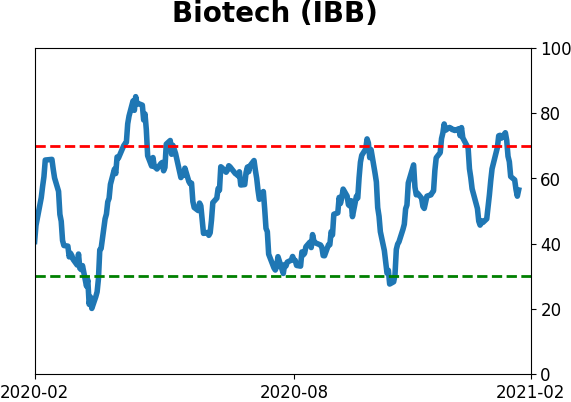
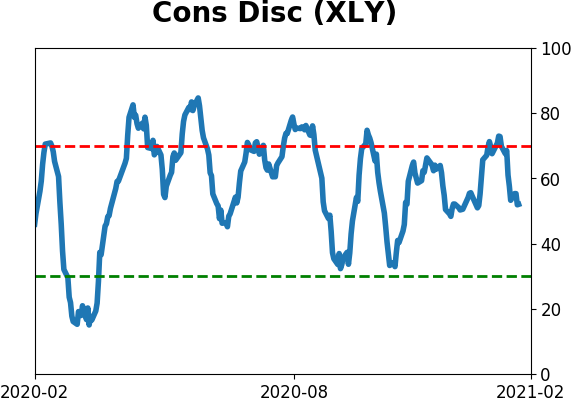
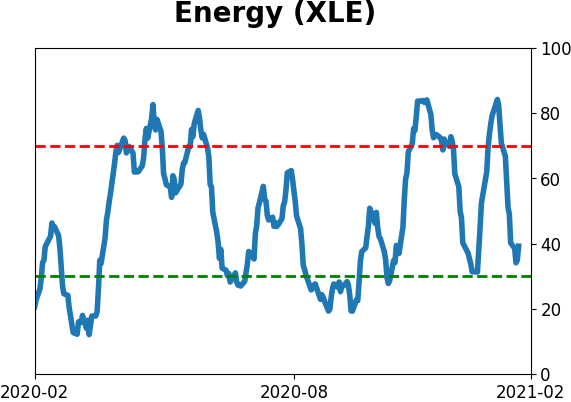
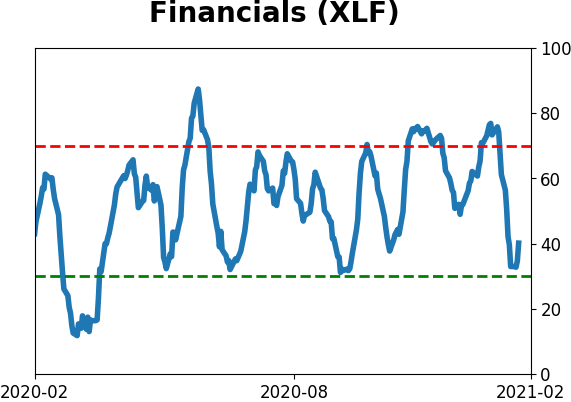
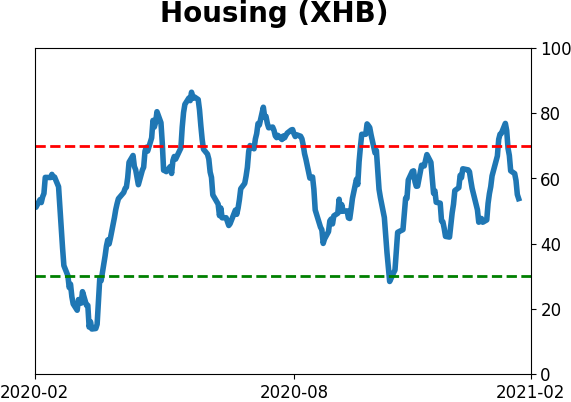
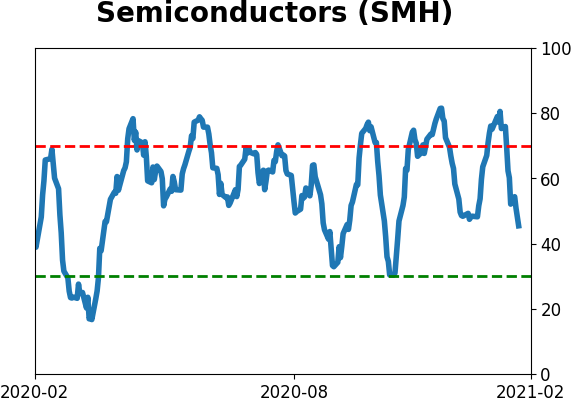
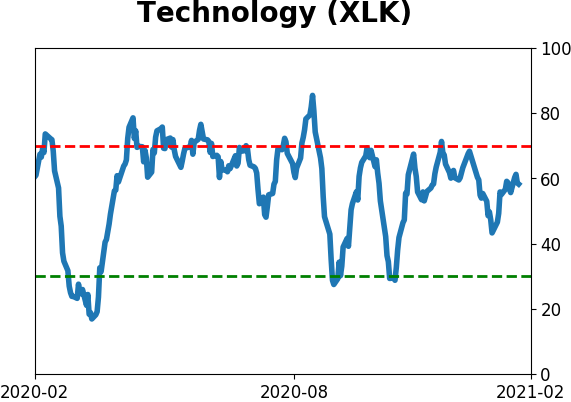
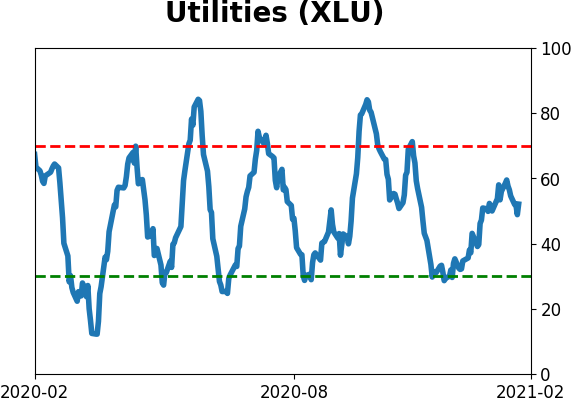
Sector ETF's - 10-Day Moving Average
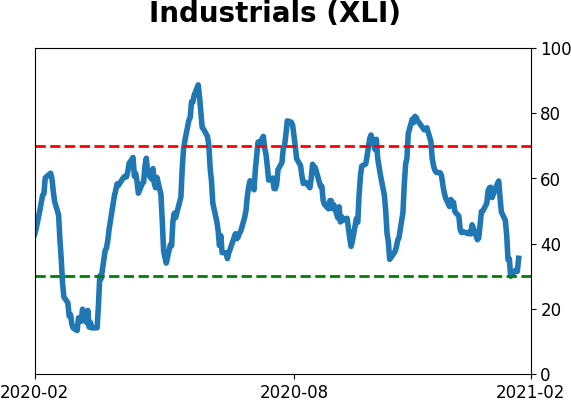
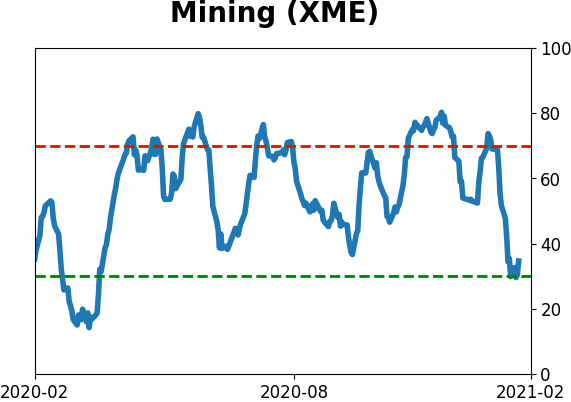
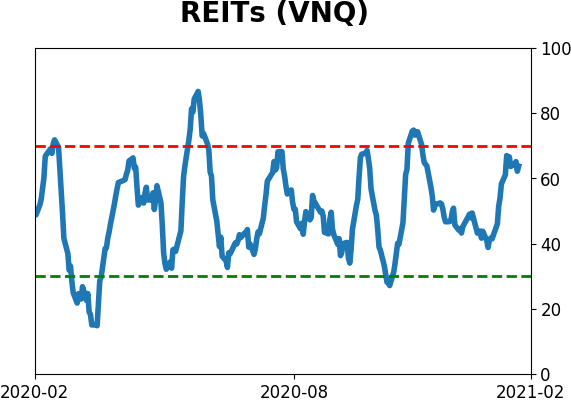
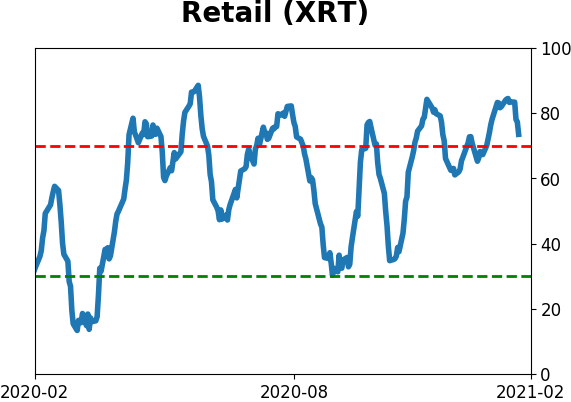
Daily Report : Investors get comfortable trading stocks on their own merits Daily Report : Investors get comfortable trading stocks on their own merits Daily Report : Investors get comfortable trading stocks on their own merits Daily Report : Investors get comfortable trading stocks on their own merits
Daily Report : Investors get comfortable trading stocks on their own merits Daily Report : Investors get comfortable trading stocks on their own merits Daily Report : Investors get comfortable trading stocks on their own merits
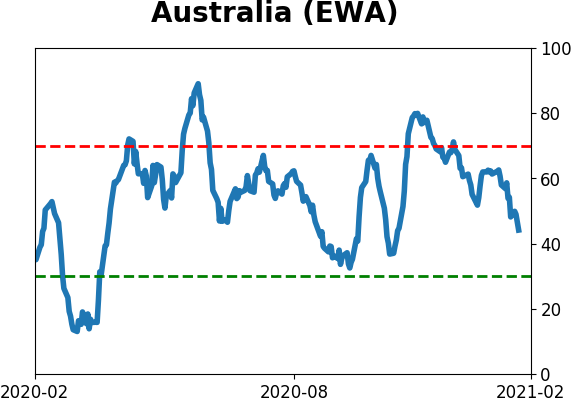
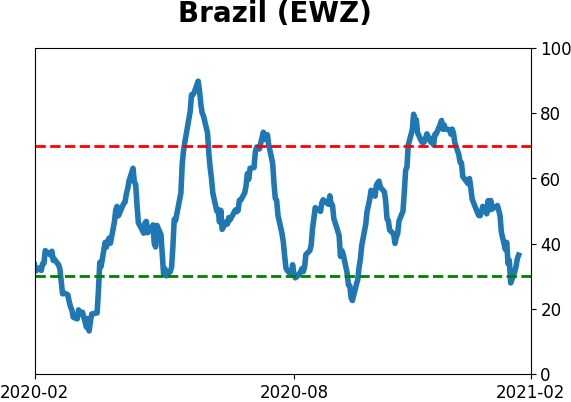
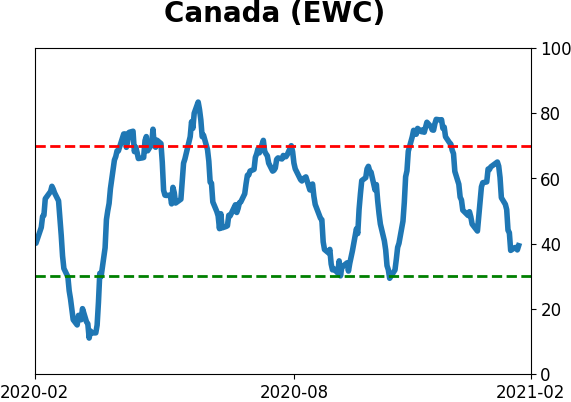
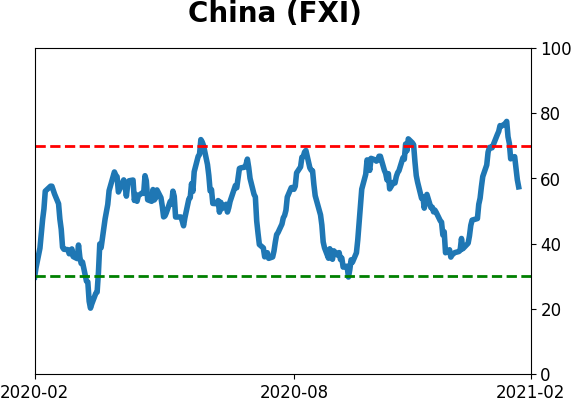
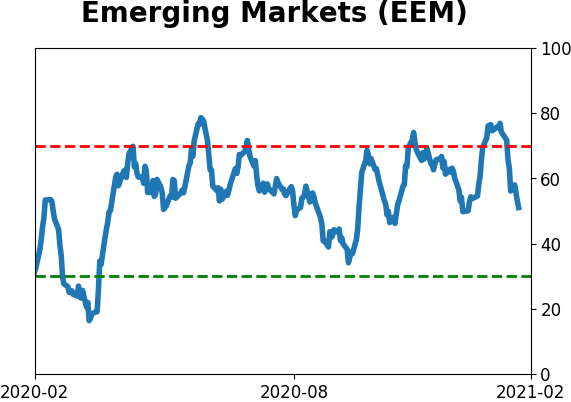
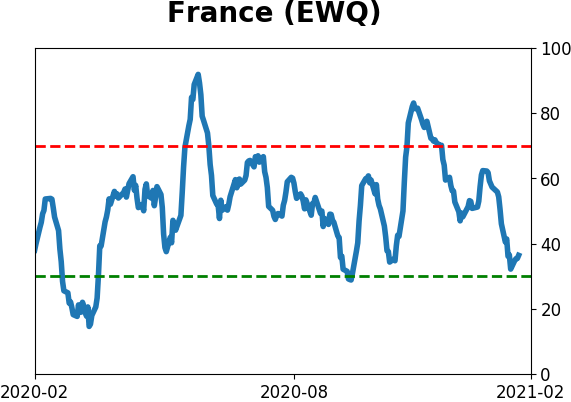
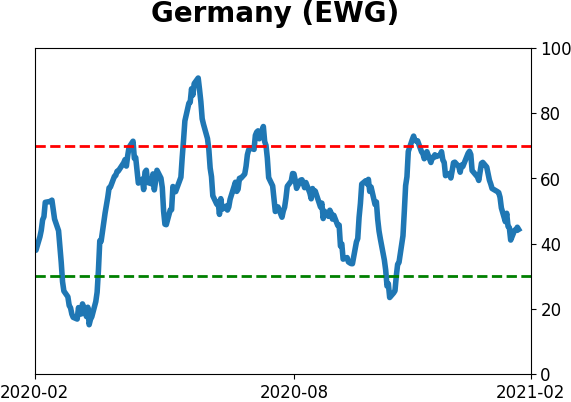
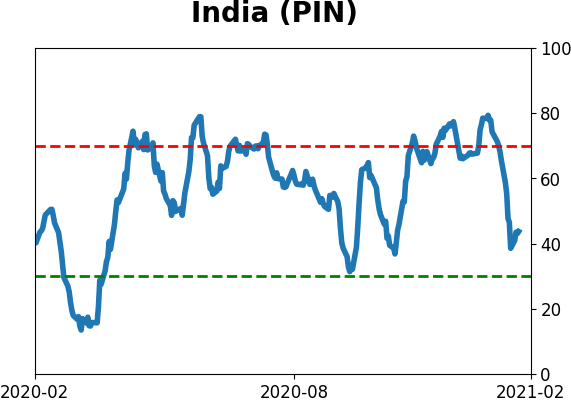
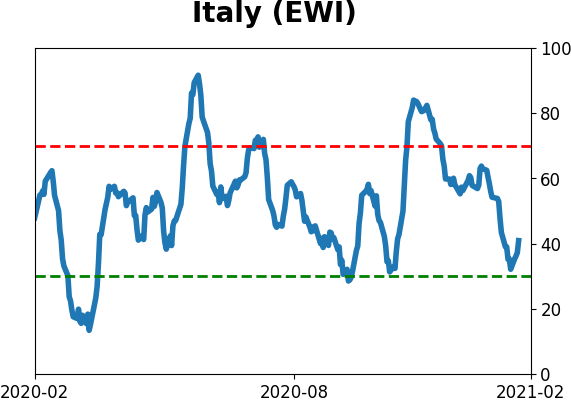
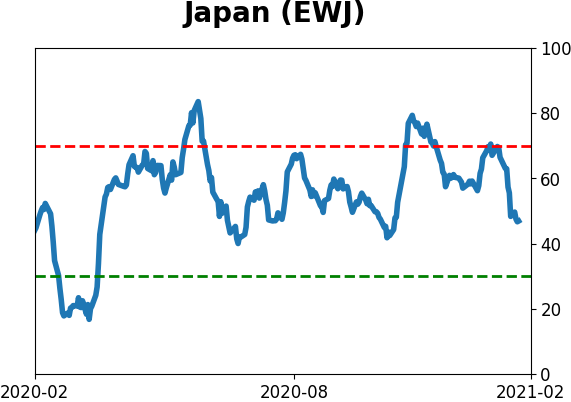
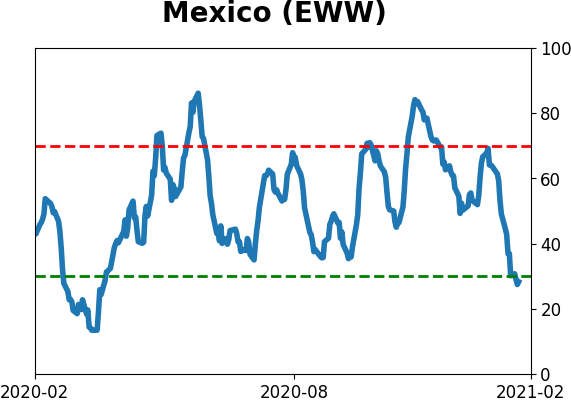
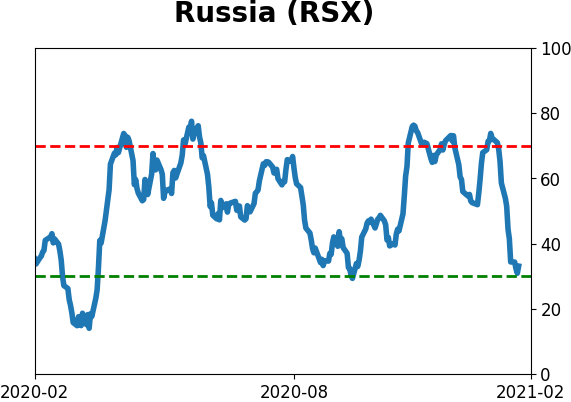
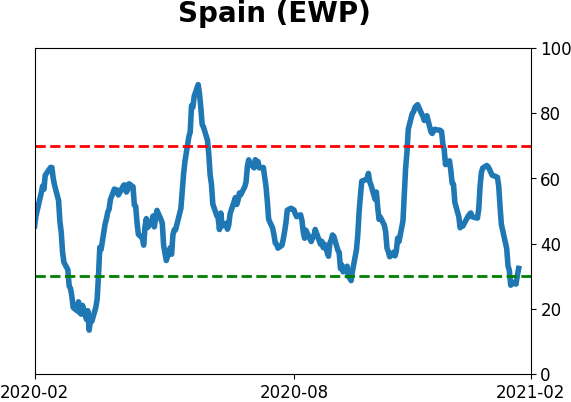
Country ETF's - 10-Day Moving Average
Daily Report : Investors get comfortable trading stocks on their own merits Daily Report : Investors get comfortable trading stocks on their own merits Daily Report : Investors get comfortable trading stocks on their own merits Daily Report : Investors get comfortable trading stocks on their own merits
Daily Report : Investors get comfortable trading stocks on their own merits Daily Report : Investors get comfortable trading stocks on their own merits
Bond ETF's - 10-Day Moving Average
Daily Report : Investors get comfortable trading stocks on their own merits Daily Report : Investors get comfortable trading stocks on their own merits Daily Report : Investors get comfortable trading stocks on their own merits Daily Report : Investors get comfortable trading stocks on their own merits
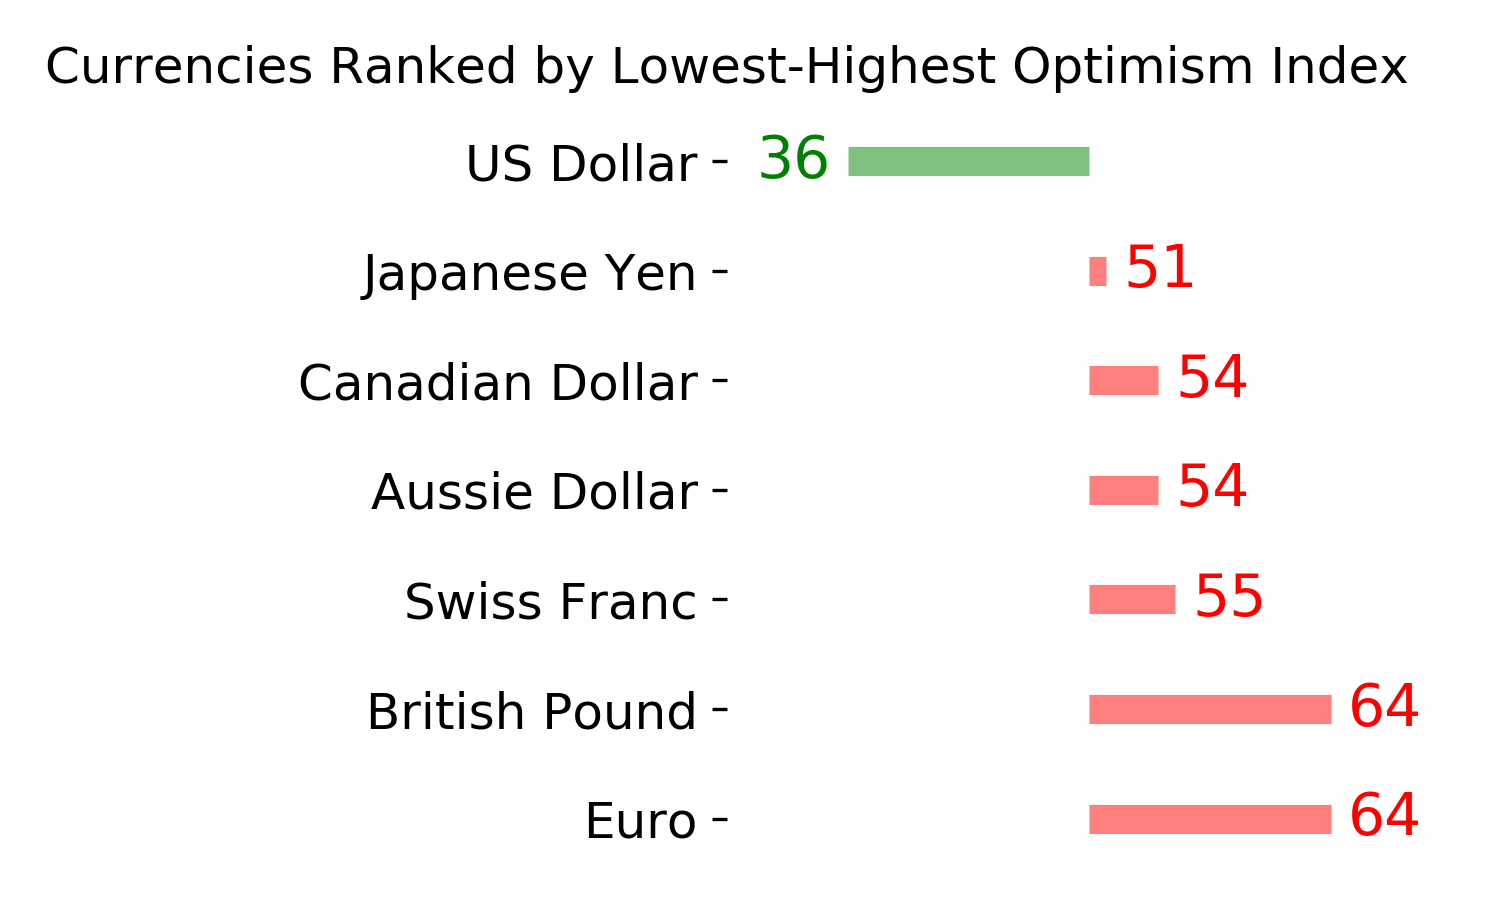
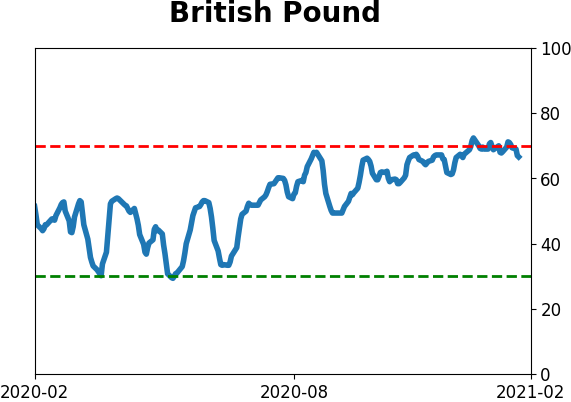
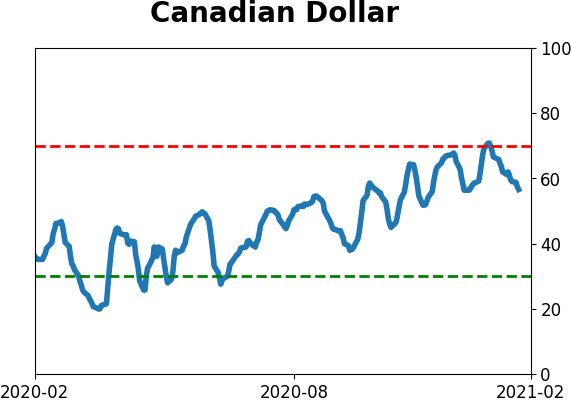
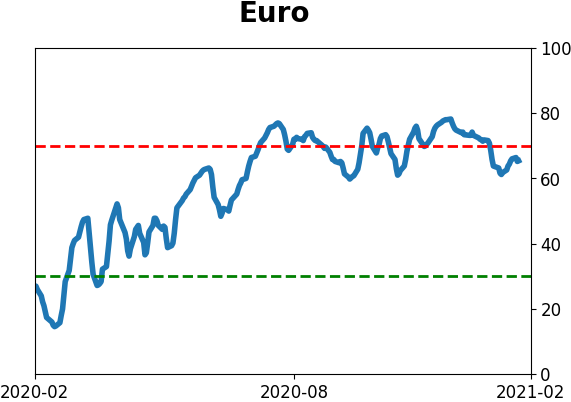
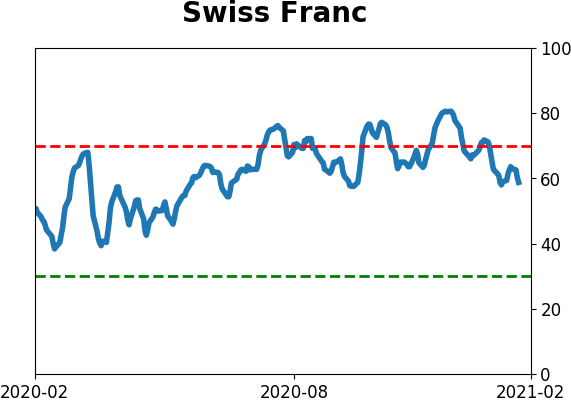
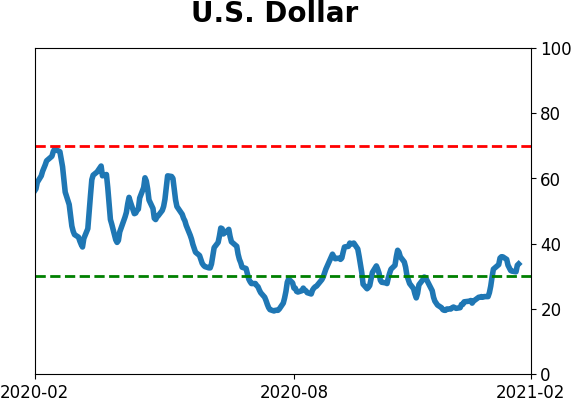
Currency ETF's - 5-Day Moving Average
Daily Report : Investors get comfortable trading stocks on their own merits Daily Report : Investors get comfortable trading stocks on their own merits Daily Report : Investors get comfortable trading stocks on their own merits Daily Report : Investors get comfortable trading stocks on their own merits
Daily Report : Investors get comfortable trading stocks on their own merits Daily Report : Investors get comfortable trading stocks on their own merits
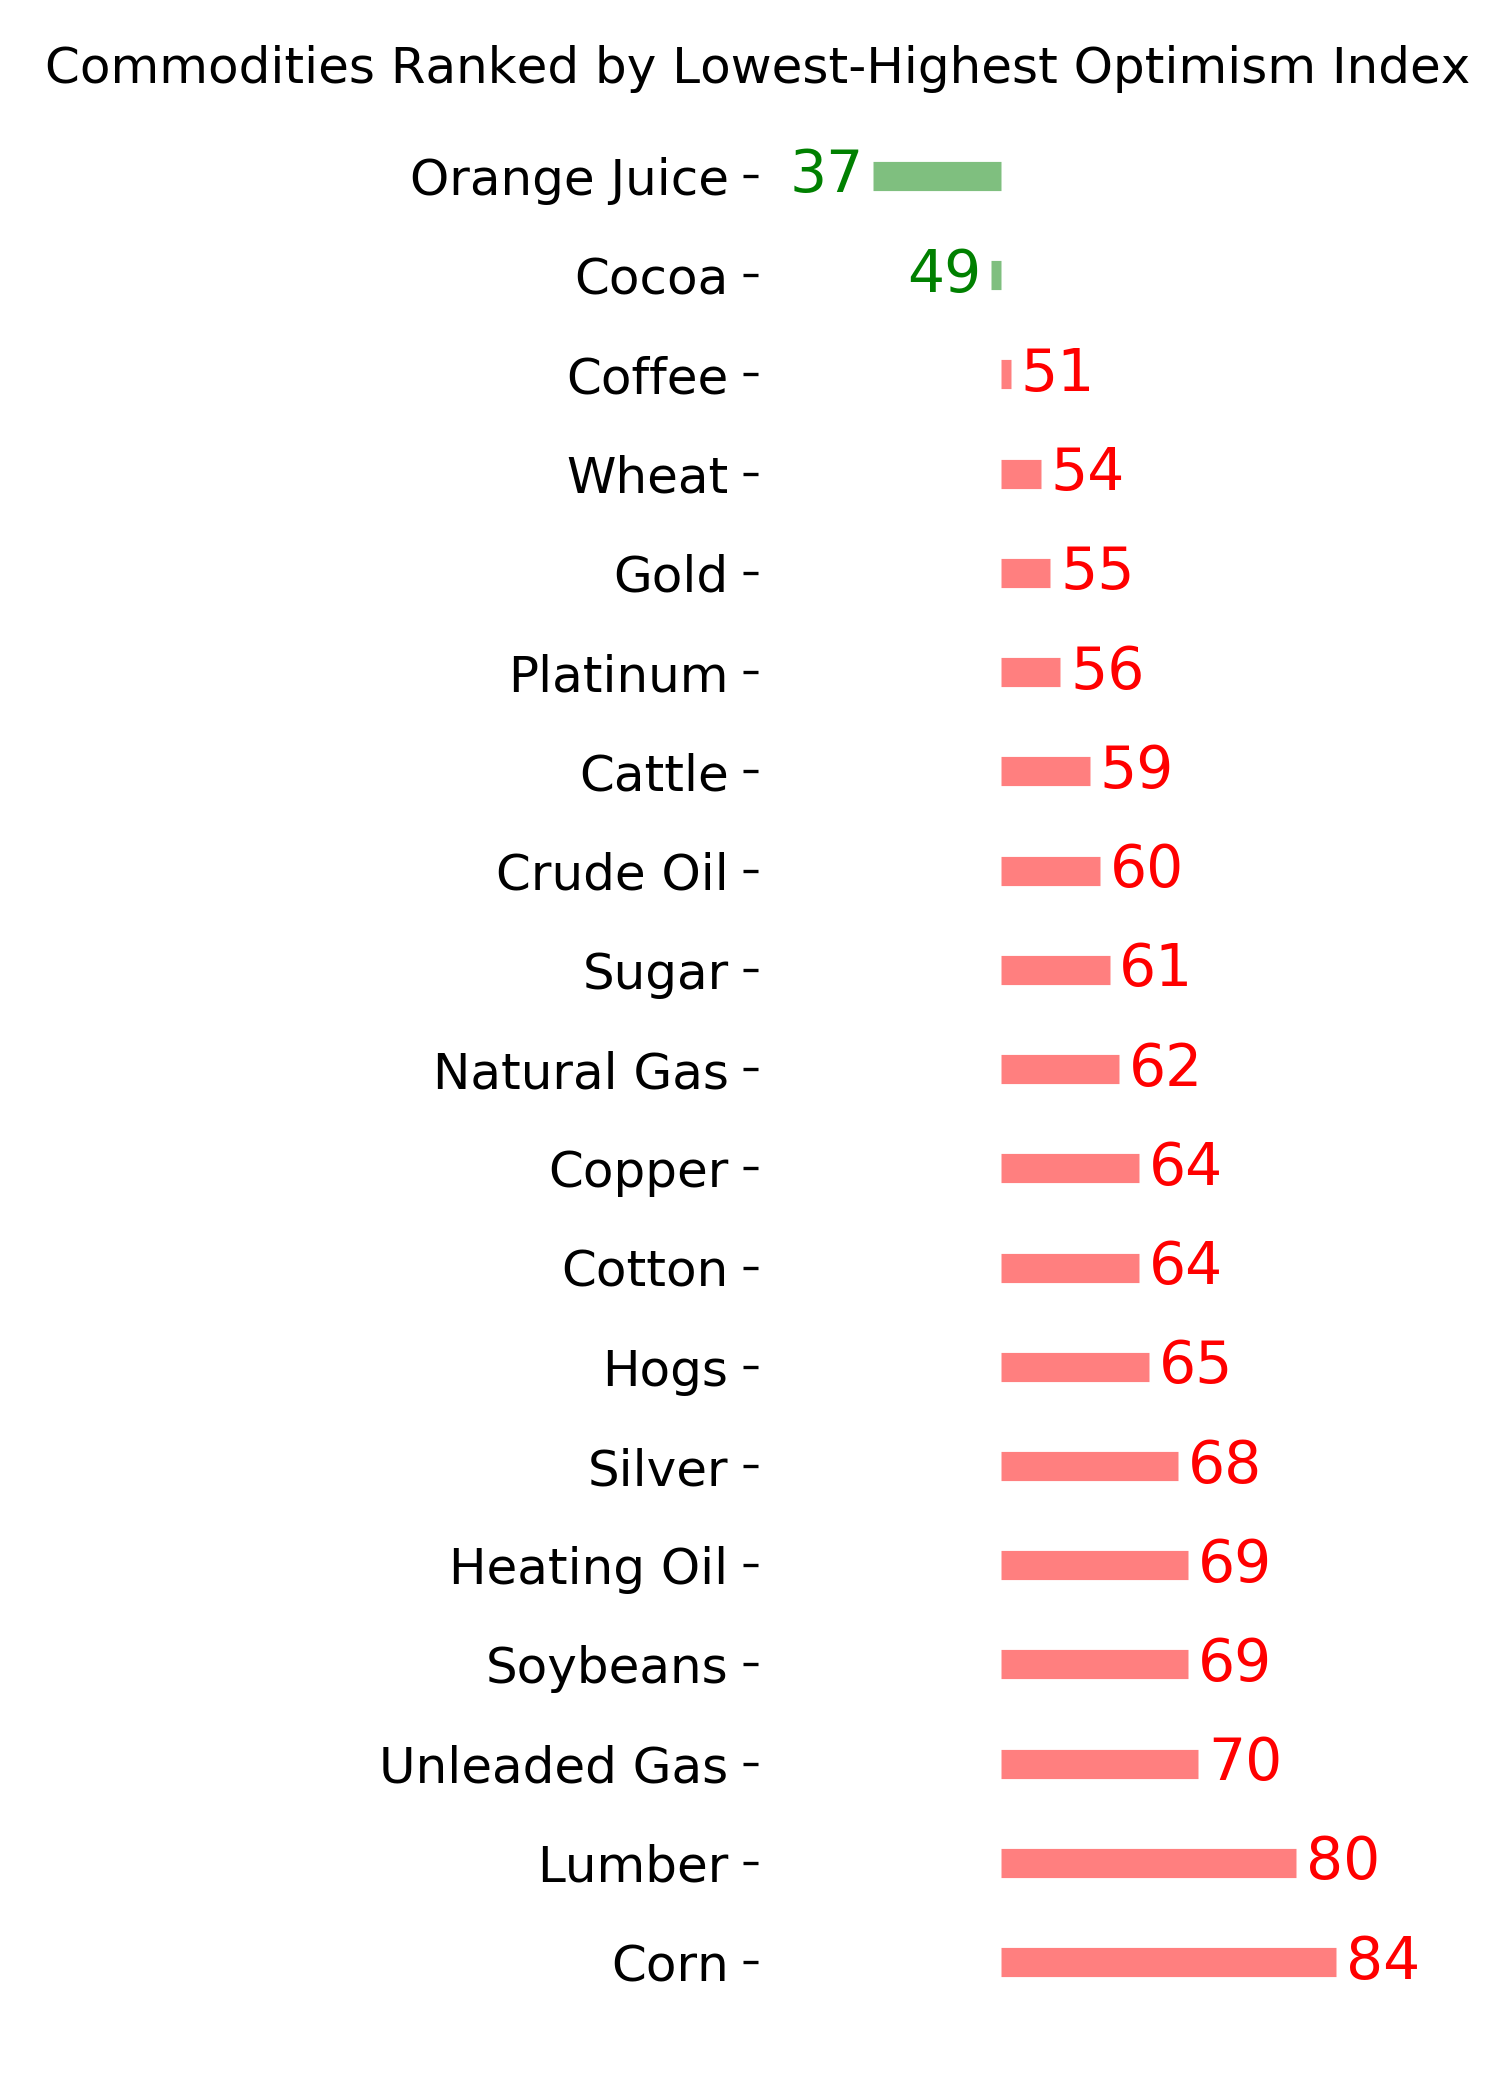
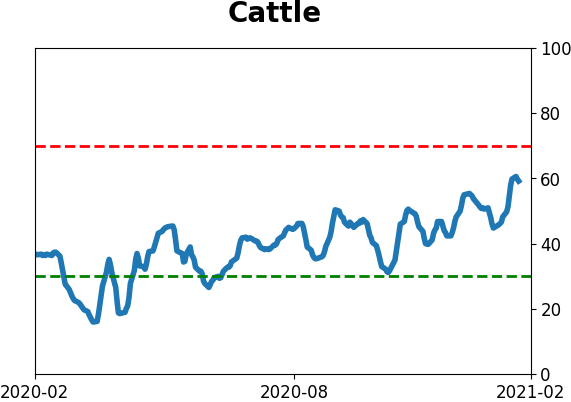
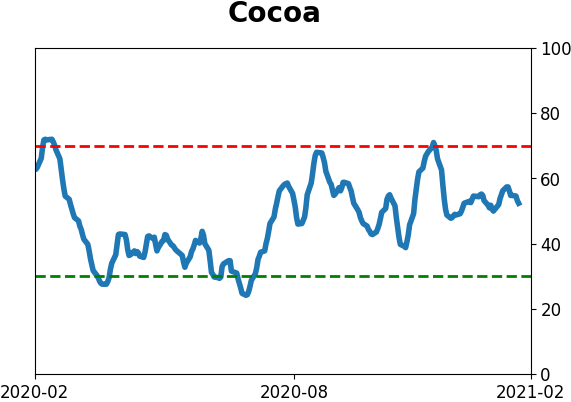
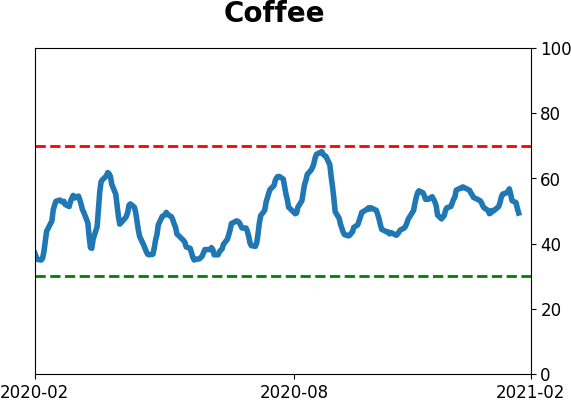
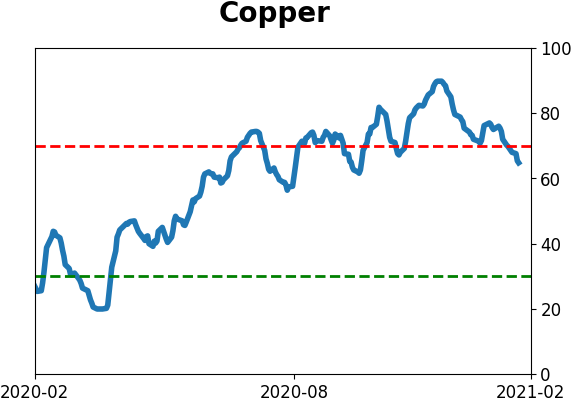
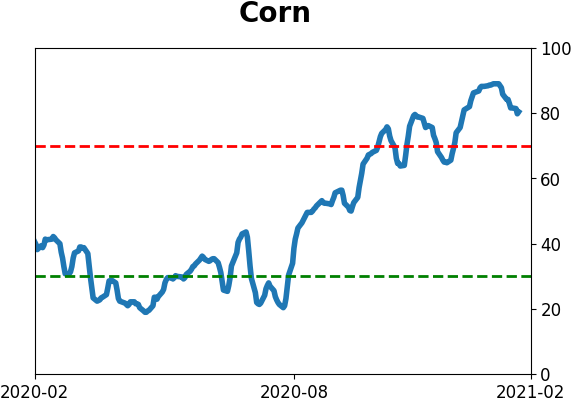
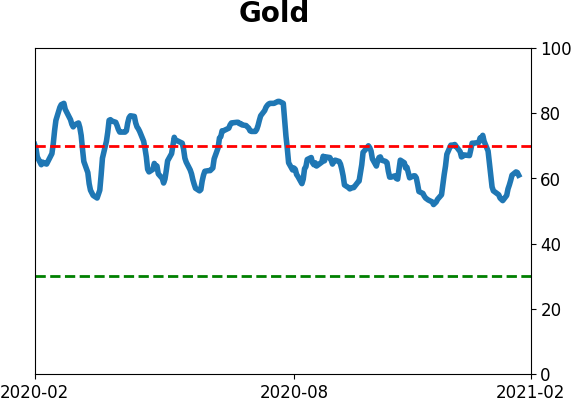
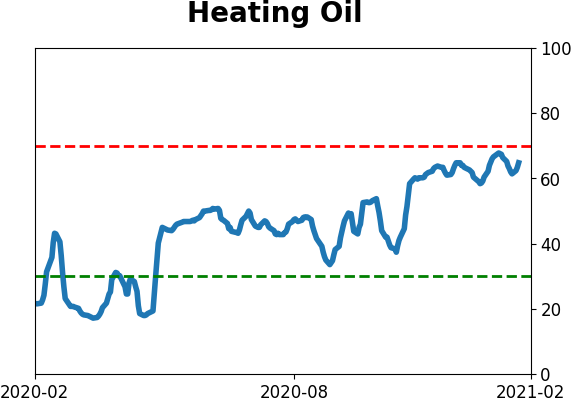
Commodity ETF's - 5-Day Moving Average
Daily Report : Investors get comfortable trading stocks on their own merits Daily Report : Investors get comfortable trading stocks on their own merits Daily Report : Investors get comfortable trading stocks on their own merits Daily Report : Investors get comfortable trading stocks on their own merits
Daily Report : Investors get comfortable trading stocks on their own merits Daily Report : Investors get comfortable trading stocks on their own merits Daily Report : Investors get comfortable trading stocks on their own merits
PRODUCTS
SentimenTrader
Trading Tools
Indicators & Data API
‍
Strategies & Scanner
‍
Research Reports
FREE
RESOUrCES
Simple Backtest
Calculator
Simple Seasonality
Calculator
The Kelly Criterion
Calculator
Sentiment Geo Map
‍
Public Research Reports
‍
Education
Sentiment Indicators
‍
Technical Indicators
‍
Pricing
Bundle pricing
‍
FAQ
‍
Announcements
‍
COMPANY
‍
About
‍
In the News
‍
Testimonials
‍
Client Success Stories
CONTACT
‍
General Inquiries
‍
Media Inquiries
‍
Financial Professionals Inquiries
‍
© 2026 Sundial Capital Research Inc. All rights reserved.
Setsail Marketing
TermsPrivacyAffiliate Program
Risk Disclosure: The information and tools provided are for research and analytical purposes only and are not intended as investment advice. Market analysis involves uncertainty, and outcomes may differ from expectations. Users should conduct their own due diligence and consider their individual circumstances before making any financial decisions. Past performance is not necessarily indicative of future results.

Hypothetical Performance Disclosure: Hypothetical performance results have many inherent limitations, some of which are described below. No representation is being made that any account will or is likely to achieve profits or losses similar to those shown; in fact, there are frequently sharp differences between hypothetical performance results and the actual results subsequently achieved by any particular trading program. One of the limitations of hypothetical performance results is that they are generally prepared with the benefit of hindsight. In addition, hypothetical trading does not involve financial risk, and no hypothetical trading record can completely account for the impact of financial risk of actual trading. for example, the ability to withstand losses or to adhere to a particular trading program in spite of trading losses are material points which can also adversely affect actual trading results. There are numerous other factors related to the markets in general or to the implementation of any specific trading program which cannot be fully accounted for in the preparation of hypothetical performance results and all which can adversely affect trading results.

Testimonial Disclosure: Testimonials appearing on this website may not be representative of other clients or customers and is not a guarantee of future performance or success.