Daily Report : TradingEdge Weekly for Feb 3 - Signs of momentum are everywhere, seasonal positives, struggling commodities

| View/Print a PDF version of this Report |
Headlines
|
TradingEdge Weekly for Feb 3 - Signs of momentum are everywhere, seasonal positives, struggling commodities: This week, we saw a continued surge in many momentum and trend-following buy signals. They have a good track record at preceding medium- to long-term gains for stocks. The pre-election seasonal bias is another tailwind, especially for certain sectors. Some have gotten a head start, like Homebuilders. Commodity trends are getting weaker. |
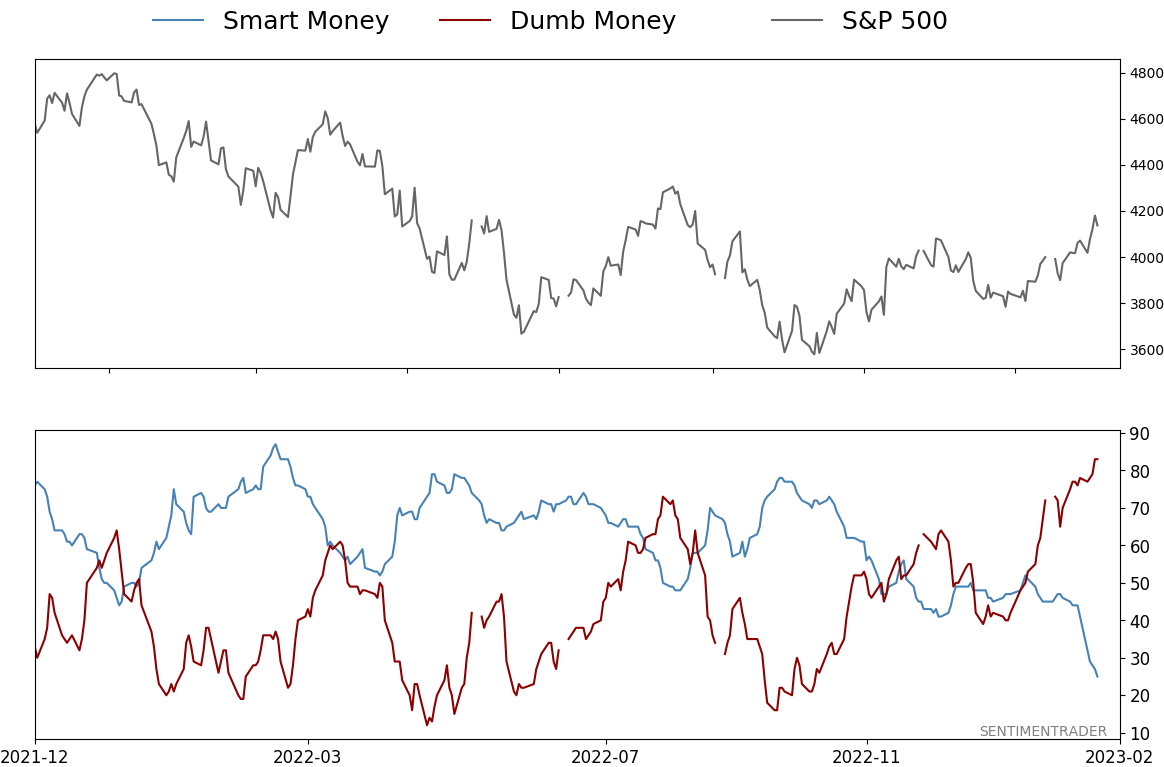
Smart / Dumb Money Confidence
|
|
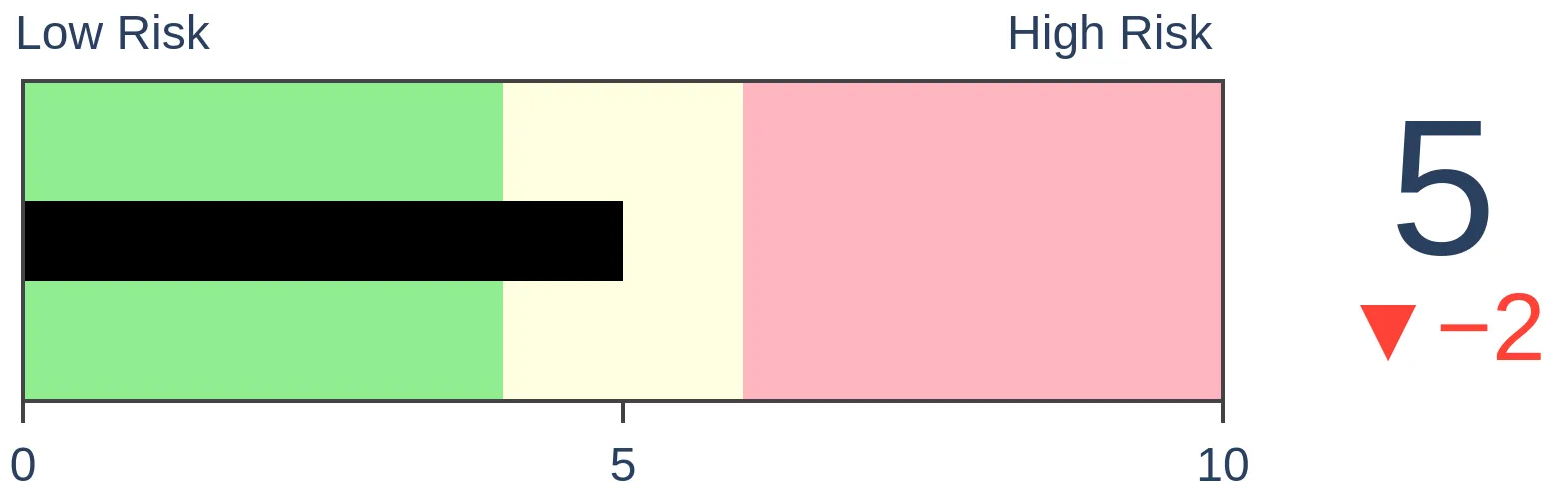
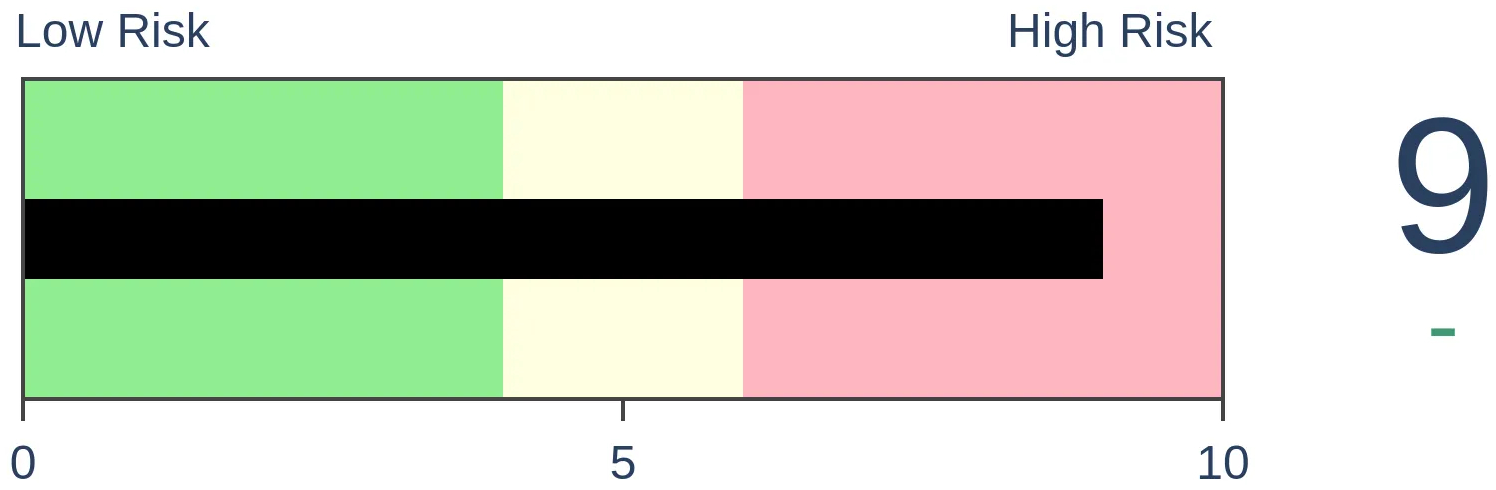
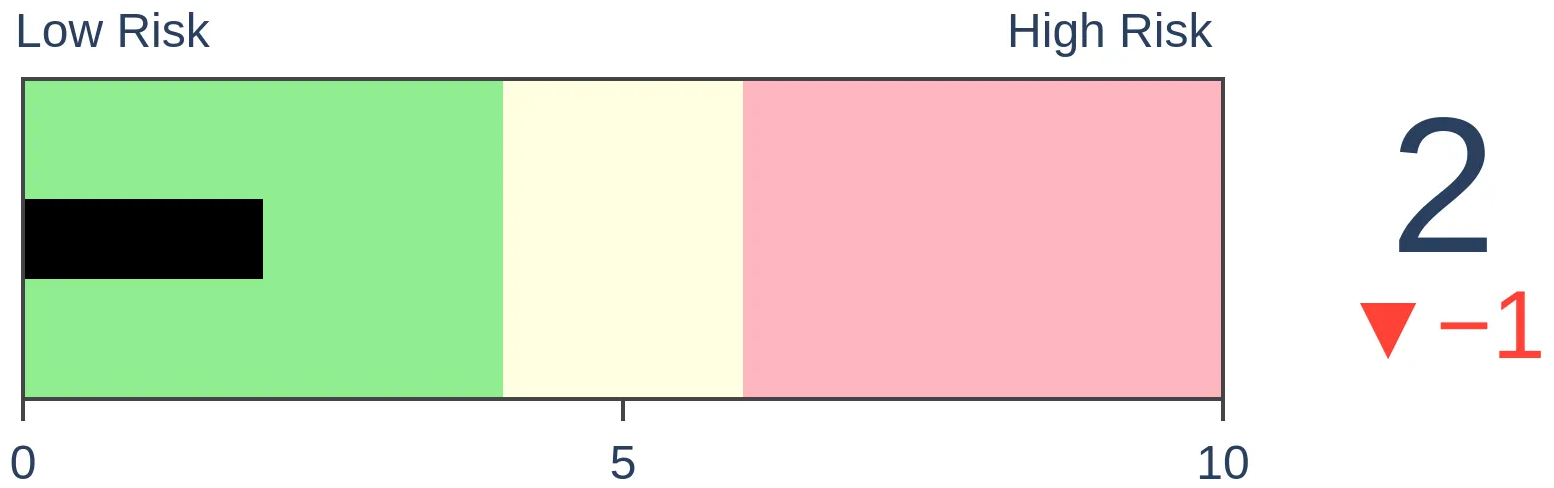
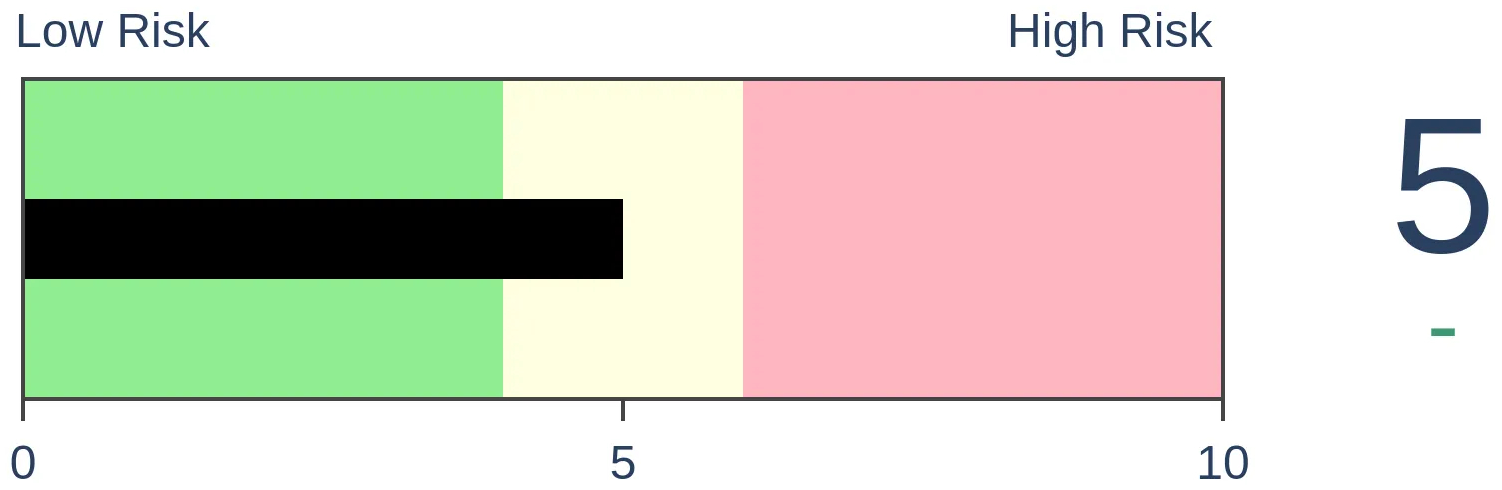
Risk Levels
|
|

|
Research
TradingEdge Weekly for Feb 3 - Signs of momentum are everywhere, seasonal positives, struggling commoditiesBy Jason GoepfertBOTTOM LINEThis week, we saw a continued surge in many momentum and trend-following buy signals. They have a good track record at preceding medium- to long-term gains for stocks. The pre-election seasonal bias is another tailwind, especially for certain sectors. Some have gotten a head start, like Homebuilders. Commodity trends are getting weaker. FORECAST / TIMEFRAME |
Key points:
- There are Golden Crosses galore across a wide range of equity indexes
- A long-term trend-following system has given a buy signal on the S&P 500
- So has a trend-following system created by Investor's Business Daily
- More than three out of every four sub-industries are now in a bull market
- Stocks are in the midst of a positive seasonal window during pre-election years
- Despite the potential positives, investors continue to pull back on leverage
- A few sectors tend to excel during this part of the calendar
- Homebuilders have gotten a head start on the rally and triggered a compelling long-term buy signal
- Discretionary stocks have soared relative to Staples
- Trends in commodities are getting weaker
- If soybeans are going to buck that trend, now is a good time
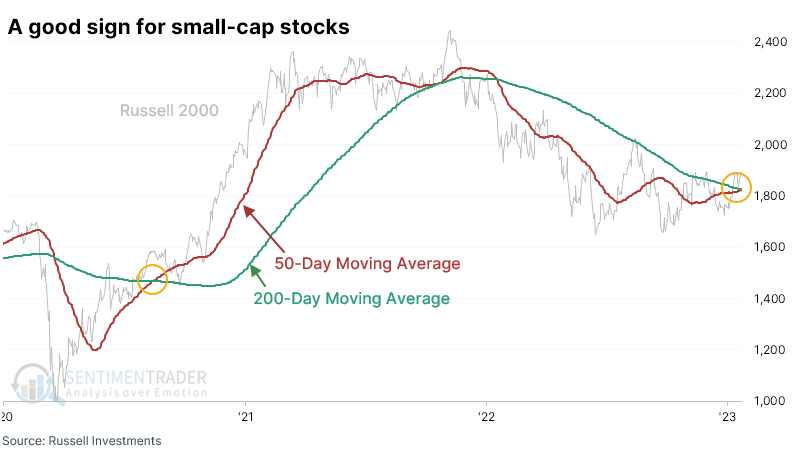
So many Golden Crosses
Small-cap stocks are often seen as a harbinger of the domestic economy or at least the prospect for its stocks. In that sense, last week proved to be a good omen. For the first time in over a year, the 50-day moving average of the Russell 2000 index crossed above its 200-day moving average.
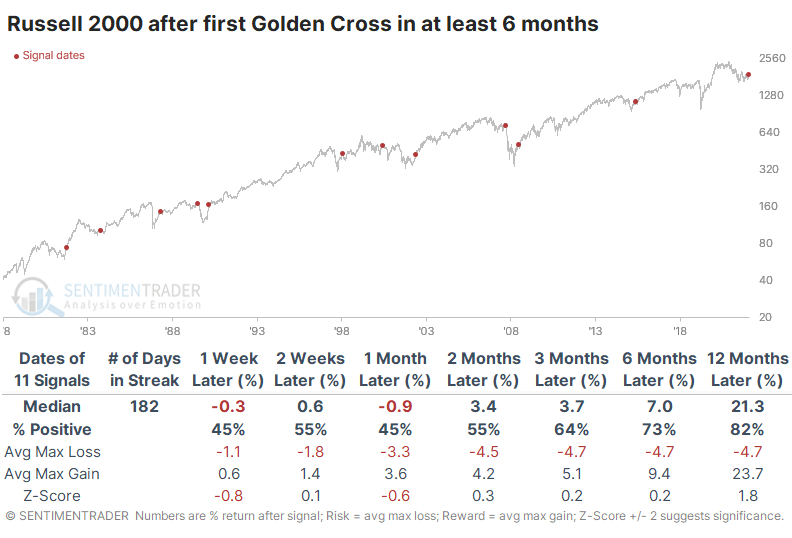
This ended the 3rd-longest streak without a positive medium- to long-term trend since the index's inception. After the longest streaks ended, the Russell tended to power higher, except for a miserable fakeout in 2008.
If we relax the parameters to the first Cross in at least six months, we expand the sample size, with mostly positive results. Like the 2008 signal, there was one in 1990 that preceded an almost immediate and substantial decline.
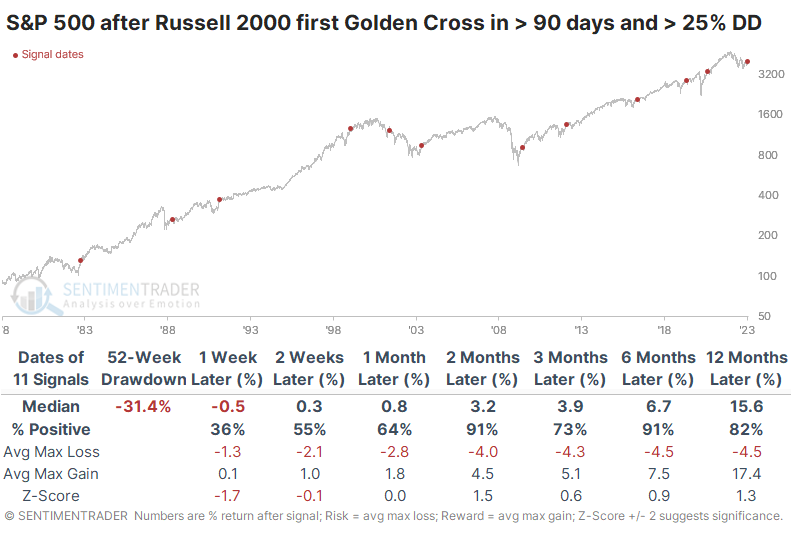
Context is important, and this signal came after small-cap stocks had been hammered over the past year. The Russell 2000 suffered a drawdown of more than 30%, one of its largest in more than 40 years. When these Golden Cross signals were triggered after a large drawdown of more than 25%, future returns in the index were excellent. These signals were also a positive sign for the broader market, with only a single loss in the S&P 500 over the next six months.
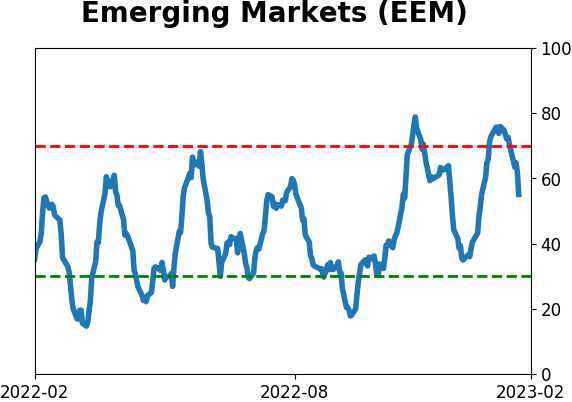
After being left on the rubbage heap in 2022, emerging market stocks have roared back in recent weeks. The MSCI Emerging Markets Index has, as well, now formed a Golden Cross.
After any streak of 200 days or more ended without a positive trend in those moving averages, emerging markets tended to do quite well, especially over the next three months. There was only a single loss, and it was limited.
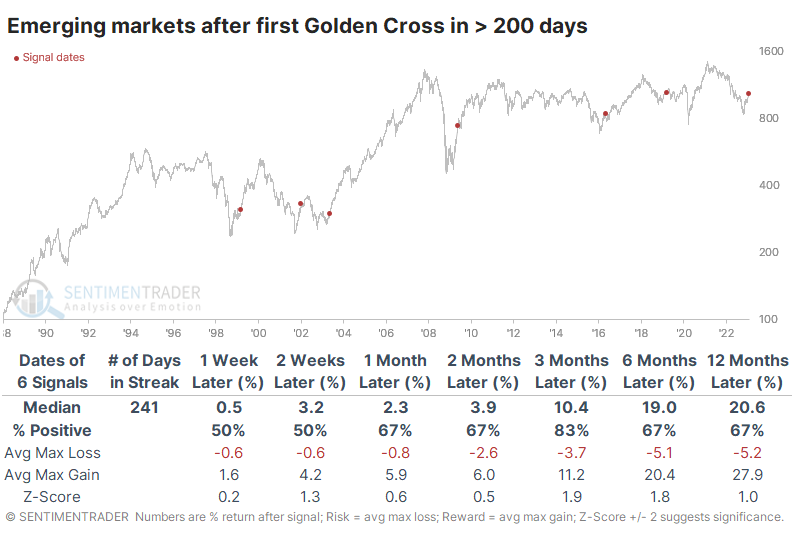
Recoveries in emerging markets tended to coincide with good markets across the globe. New Golden Crosses in those stocks tended to be positive signs for the S&P 500.
More signs of momentum
Momentum can often carry the stock market in a given direction for an extended period of time. Jay showed that one simple but highly effective momentum indicator flashed a new favorable signal at the end of January.
The indicator is very simple: The S&P 500 three-month moving average minus the ten-month moving average (both using month-end closing price). Jay refers to it as LBR Momentum after trader and analyst Linda Bradford Raschke.
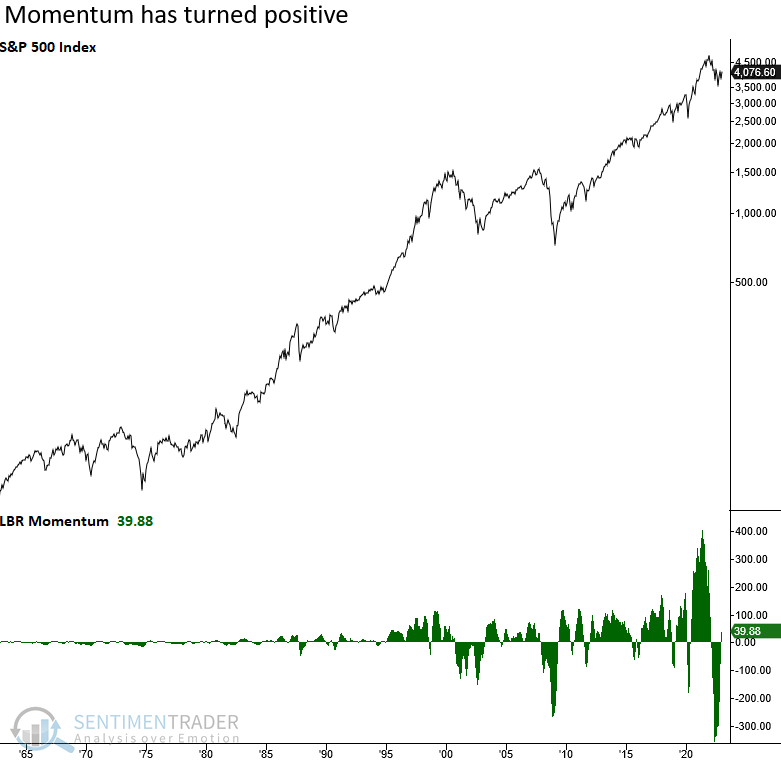
There are different ways to use this indicator, but in a nutshell, above zero is good, and below zero is bad.
Jay tested various methods, including buy and hold the S&P 500 Index for 12 months if LBR Momentum crosses above zero, regardless of how long it was below zero. The chart below the growth of $1 using this method on a logarithmic scale to highlight the relative favorable consistency.
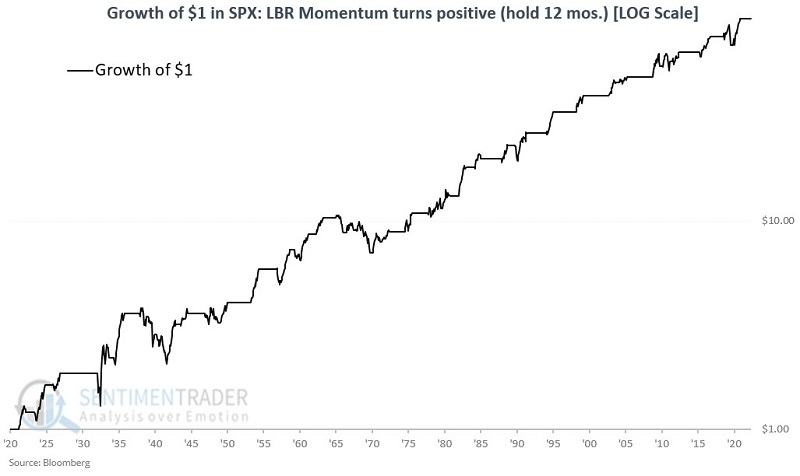
After these signals, the S&P showed a gain 79% of the time. More impressively, the average gain was about double the average loss, and it gained more than 20% eleven times while losing more than 20% only once.
Yet more momentum
Dean noted that the Investors Business Daily Power Trend strategy triggered a new buy signal for the Nasdaq Composite. After similar trend changes, the Nasdaq Composite showed an annualized return of 18.1%. It also registered bullish alerts for several hyper-growth ETFs.
The IBD system is an intermediate-term trend-following model. The key to trend-following or any other trading strategy is discipline. One must abide by the rules, or the probabilities of success diminish.
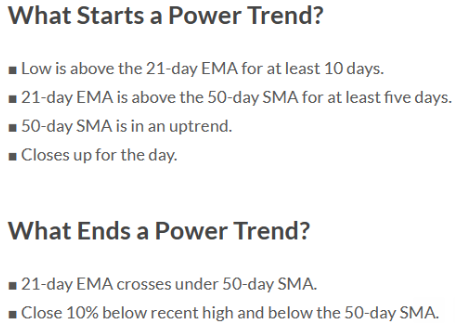
The Nasdaq Composite triggered its third buy signal since the S&P 500 peak in January 2022. While the two previous alerts turned out to be whipsaw signals, the composite annualizes at 18.1% when on a buy signal versus only 5.4% when a sell signal occurs.
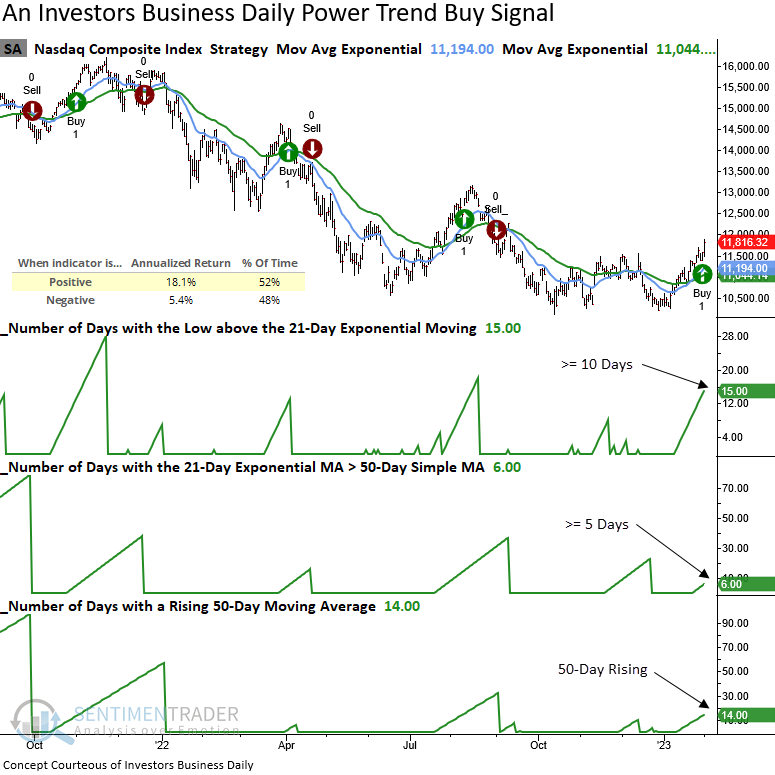
The ARK ETFs offer a reliable vehicle for the Power Trend signals as they tend to trend up or down versus moving sideways. Dean showed that several of those funds have also recently given buy signals.
And even more...
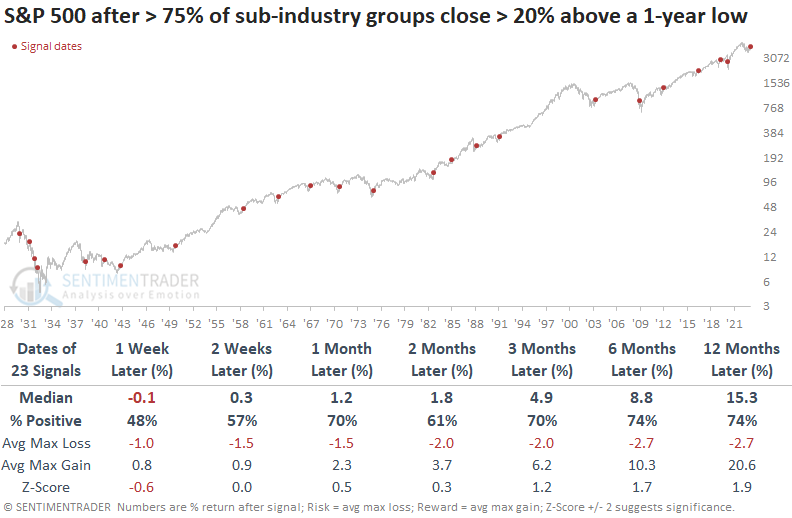
Dean further showed that more than 75% of sub-industry groups closed > 20% above their 1-year low. When industries surge from a 1-year low, the outlook for stocks is excellent. The recovery occurred after fewer than 10% closed 20% above their annual low.
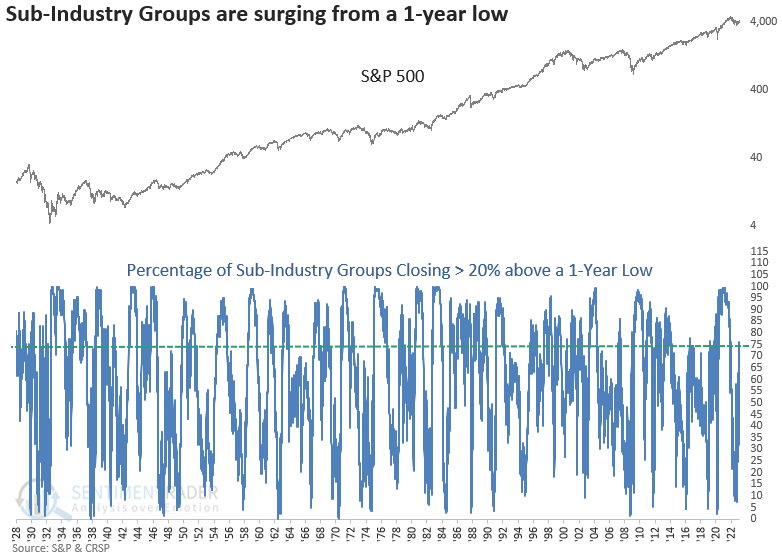
When 75% of sub-industry groups close greater than 20% above their 1-year low, the S&P 500 was higher at some point in the next year in every case since 1938. The signal experienced several whipsaw alerts during the 1929-32 bear market, which is not surprising given the volatility in that period.
Dean also likes to look at the percentage of issues trading 5% above the 200-day. When securities surge above a higher hurdle rate, the trend change is more likely to be sustained rather than failing around the average.
When 56% of sub-industry groups close greater than 5% above their 200-day average, the S&P 500 was higher at some point in the next year in all but one case. Consistency since 1949 is excellent, with no losses in the six or twelve-month windows.
Election cycle seasonality is another positive
Jay noted that pre-election years have tended to show early market strength. Pre-election year strength often extends through at least July.
Before we look at February S&P 500 performance during pre-election years, let's first establish a baseline. To do so, we will look first at February performance for all other years (i.e., post-election, mid-term, and election years). Those Februarys were positive only 46% of the time, with average losses greater than average gains, and a much higher tendency to see large declines.
Now, in contrast, let's focus solely on stock market performance only during the month of February during pre-election years.
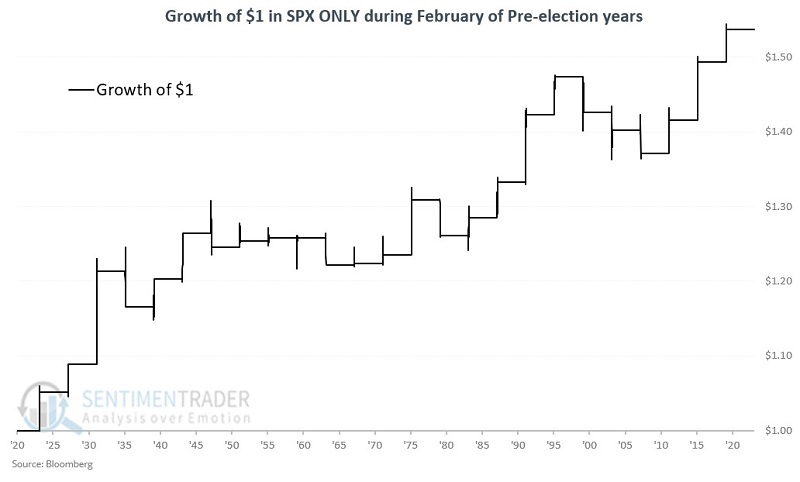
Those Februarys showed a gain 68% of the time, with average gains larger than average losses. They gained more than 6% six times, versus no losses of more than -6%.
Jay furthered the study to look at returns through April and also through July. The chart below displays the growth of $1 invested in the S&P 500 ONLY during the months of February through July of the pre-election years.
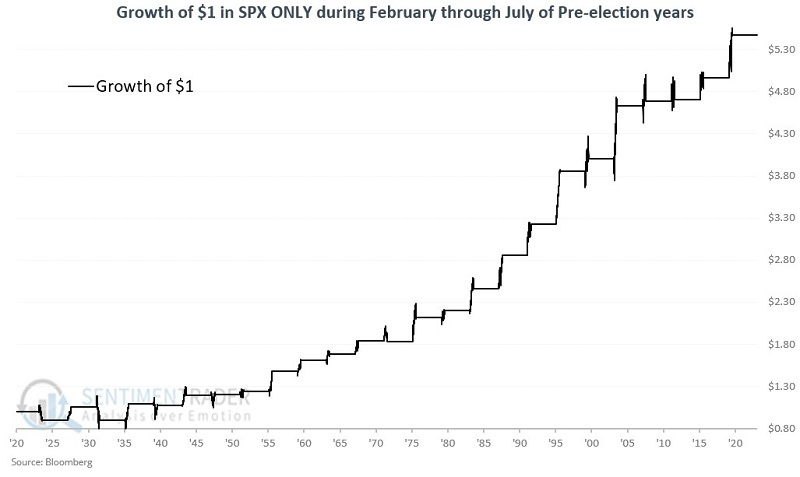
These windows gained 84% of the time, and were ten times more likely to show a large gain versus large loss.
The 1930s were awful overall for stocks as the Great Depression (and notably deflation) unfolded and cratered stocks. If we start the lookback period in 1940, then these seasonal windows rose 95% of the time (19 gains versus 1 loss), and nine of those were gains of more than 10%, versus no losses greater than -10%.
Despite potential positives, investors continue to pull back on leverage
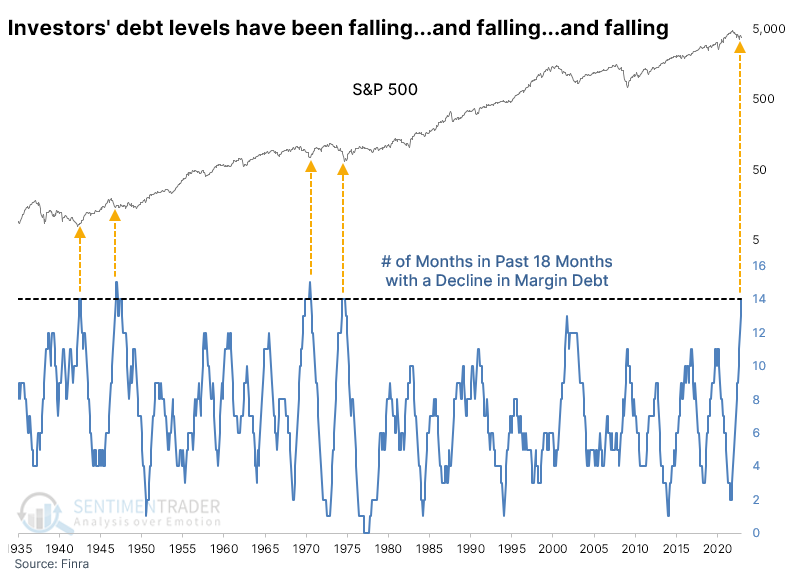
Last fall, we saw that margin debt was declining despite a jump in stock prices. That has been a modest positive in the past, but investors are still pulling back on leverage as margin debt keeps dropping.
These claims on investors' stock positions have now plunged 33% over the past year, one of the most severe year-over-year declines in history. It failed to coincide with a bottom in stocks in 1974 and 2001, but other dramatic declines in debt tended to occur roughly around troughs in optimism.
Remarkably, debt has dropped during 14 out of the past 18 months. That hasn't happened in nearly 40 years when it roughly coincided with the end of the terrible 70s decade.
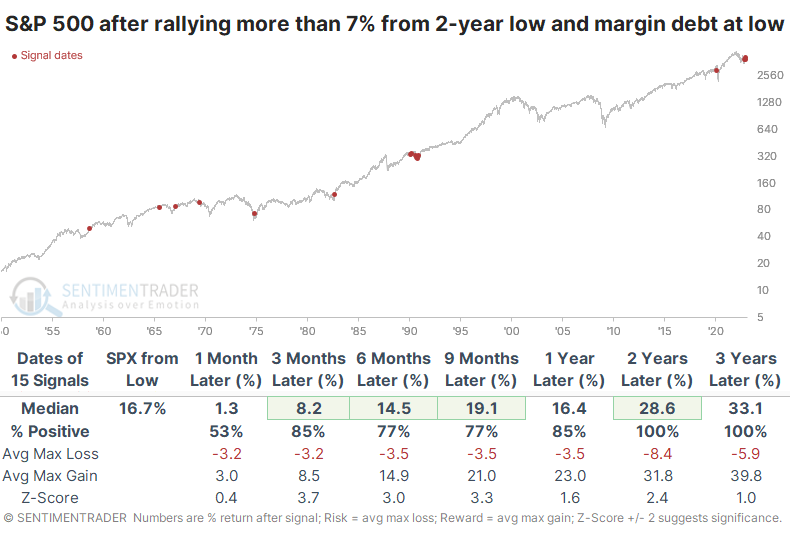
As we saw last fall, when stocks rally but investors continue to pull back on leverage, it tends to lead to above-average returns. Long-term returns when the S&P was more than 7% off it slow while margin debt was setting new lows were excellent.
This is the only period other than 1990 when there were multiple months with stocks rallying but investors stubbornly reducing their leverage.
During pre-election years, certain sectors excel
The stock market is beginning a seasonally favorable three-month period. Jay showed that three sectors have stood out as top performers during this favorable period.
February through April of pre-election years have a history of being quite favorable for stocks. The table below displays the cumulative gains for each sector if held only from February 1st through April 30th of each pre-election year starting in 1927.
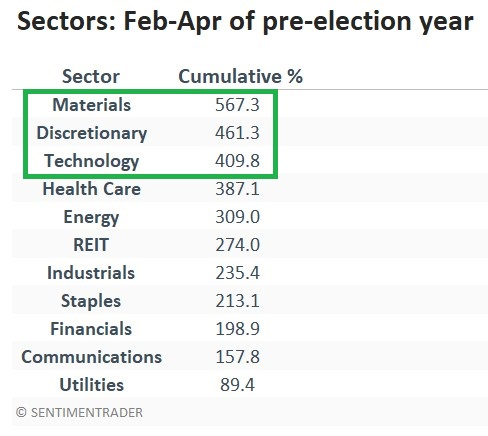
The top-performing sectors have been Materials, Consumer Discretionary, and Technology. Let's see what happens if we put these three together. The chart below displays the cumulative growth of $1 for the combined sector portfolio.
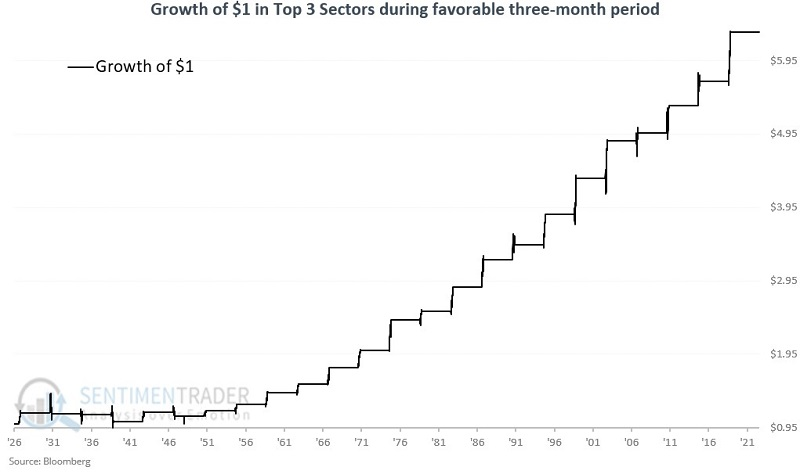
The most obvious thing to note is that performance was subpar prior to the 1950s and has been terrific thereafter. The portfolio lost ground four times out of six and registered a total gain of a mere +10.3% from 1927 through 1947. Since that time, it has reeled off eighteen consecutive gains. There were 12 gains of more than +10% compared to no losses greater than -10%.
The most obvious choices for a trader looking to play these sectors is via the use of SPYDER ETFs, namely:
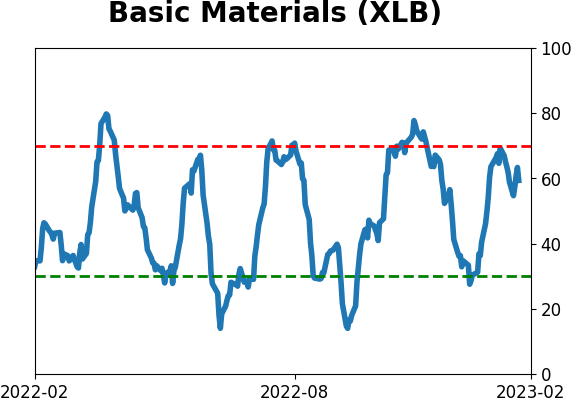
- Materials Select Sector SPDR Fund (XLB)
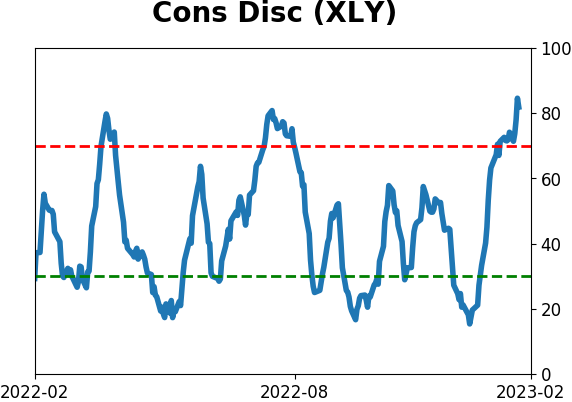
- Consumer Discretionary Select Sector SPDR Fund (XLY)
- Technology Select Sector SPDR Fund (XLK)
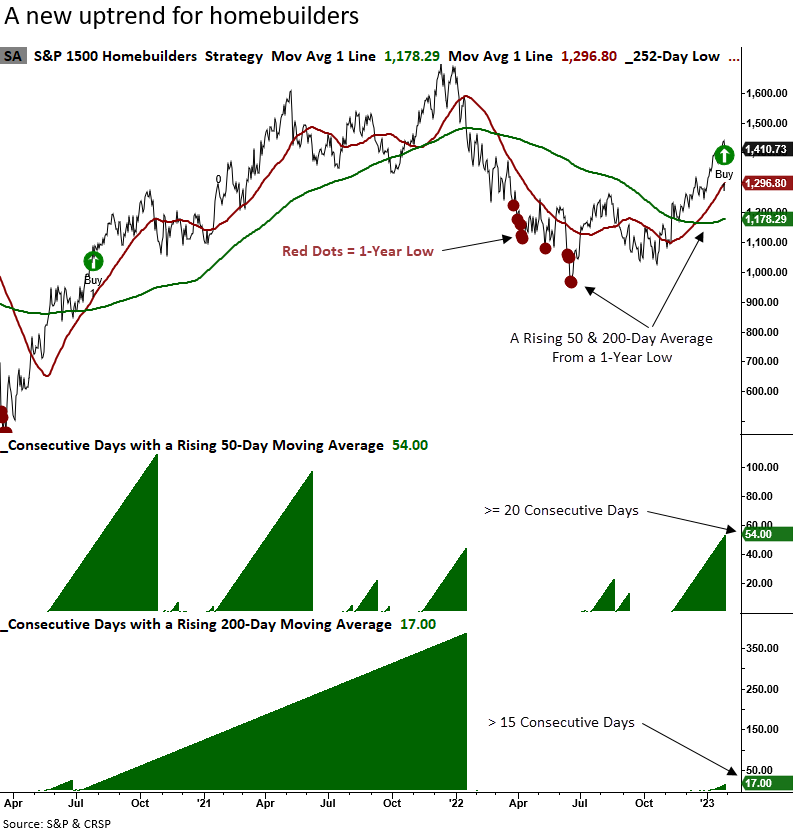
Homebuilders give a buy signal
Dean found that a medium-term moving average for Homebuilders increased for more than 20 consecutive days while a long-term moving average increased for at least 15 straight days. After similar trend conditions, Homebuilders and the S&P 500 enjoyed excellent returns.
For only the 14th time in over 50 years, the homebuilding sub-industry group cycled from a 1-year low to an established medium and long-term uptrend. The emergence of a new uptrend for a highly cyclical and capital-intensive industry bodes well for the homebuilders and the broad market.
When Homebuilders' 50 and 200-day moving averages rise consistently after a 1-year low, returns, win rates, and z-scores for the industry are excellent across all time frames. Three months later, the group was higher 100% of the time, with a max loss of -10.6%, which occurred in 1967.
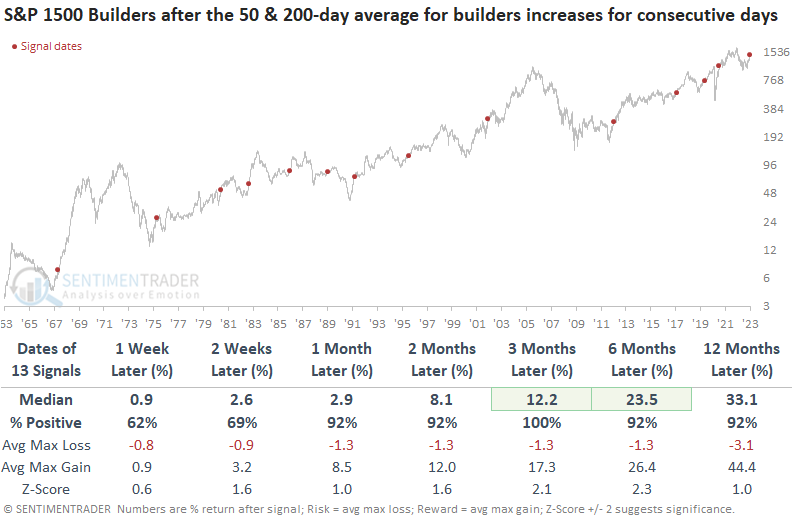
What's bullish for the homebuilders is bullish for the broad market. A year later, the S&P 500 was higher in all but one case, which occurred in the 2000-02 Dotcom bust. Among other sectors, Consumer Discretionary outperformed all others a year later.
Discretionary stocks soar relative to Staples
There are many ways to gauge whether investors are in a risk-on versus risk-off mood. Increasingly, a quick and easy way has been to monitor the ratio between the Consumer Discretionary and Consumer Staples sectors.
Discretionary stocks primarily reflect companies that provide consumers with their wants, while Staples stocks are populated with firms supplying consumers' needs. The more investors have a risk-on mentality, the more likely the ratio between those two sectors will rise.
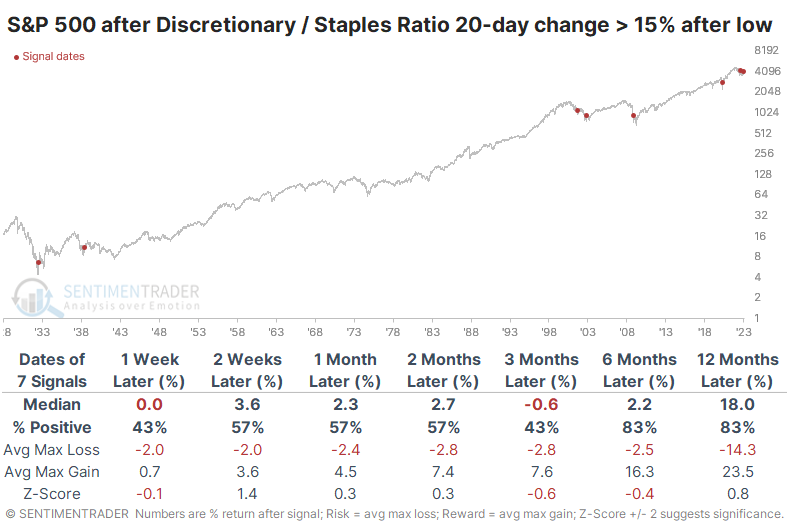
And rise it has. Over the past 20 sessions, the ratio of the total return between Discretionary and Staples soared nearly 20%, one of the largest changes in history.
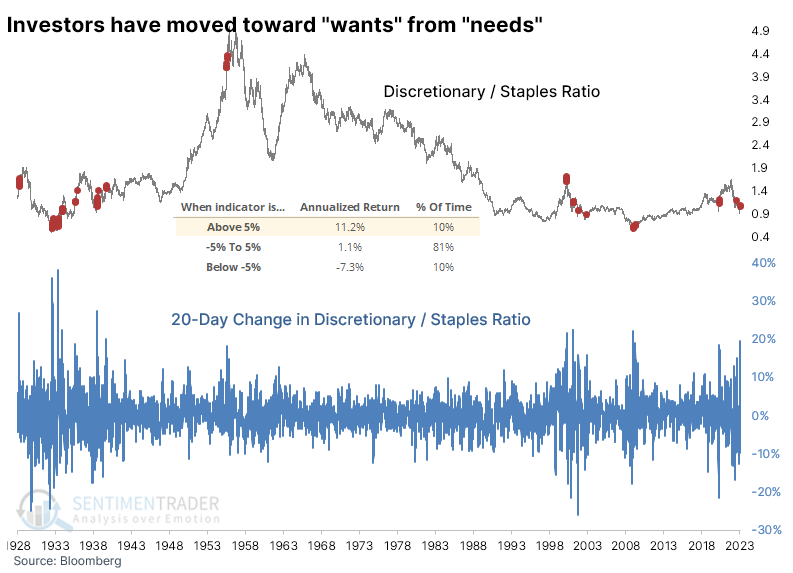
More recently, there were some false signals during the 2000-2002 bear market, but it also indicated the worst was over after the financial and pandemic crises.
For the broader S&P 500 index, modestly positive changes in the ratio were good for the index. When the 20-day change in the ratio was above +5%, the S&P returned an annualized +15.7%, compared to only +2.2% when the change in the ratio was below -5%.
One crucial piece of context is the behavior of investors before the surge in the ratio. When investors had pushed Discretionary stocks to at least a 2-year low relative to Staples, and then the ratio surged within the next few months, it tended to be a good sign for stocks. The sample size is tiny, of course, but over the next six months, the S&P 500 showed only one small loss that was erased immediately after.
Among sectors and factors, Discretionary, Financials, and Technology tended to do best, as well as Small-Caps and Cyclicals.
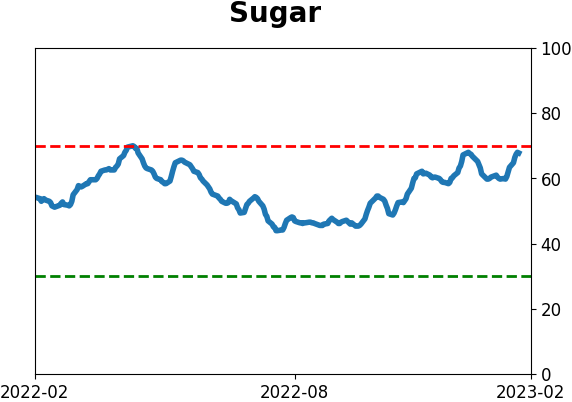
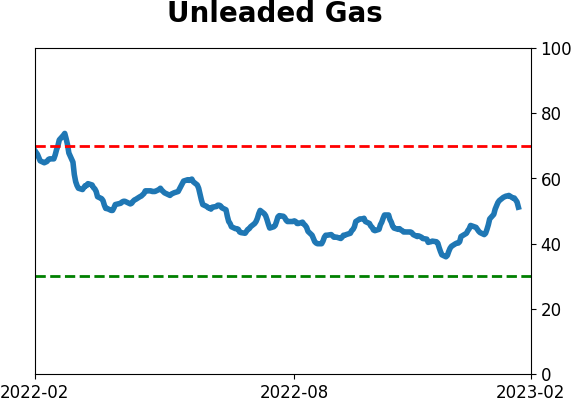
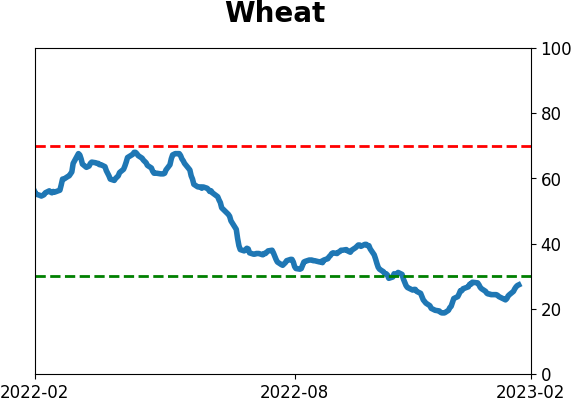
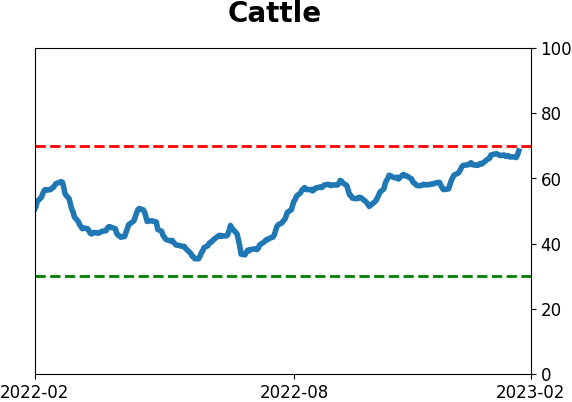
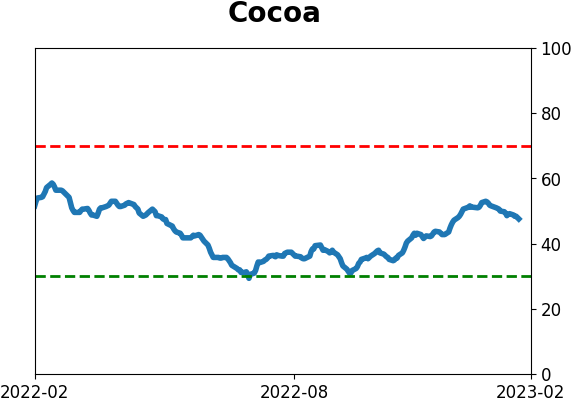
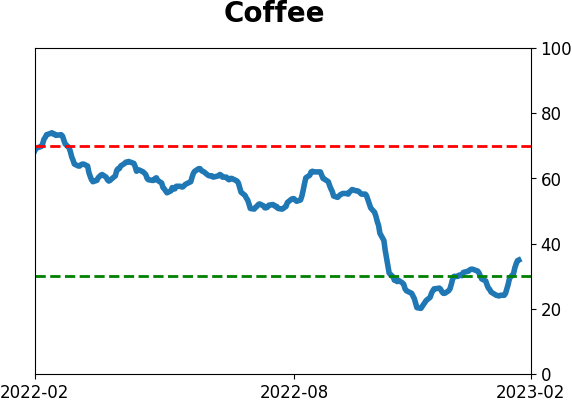
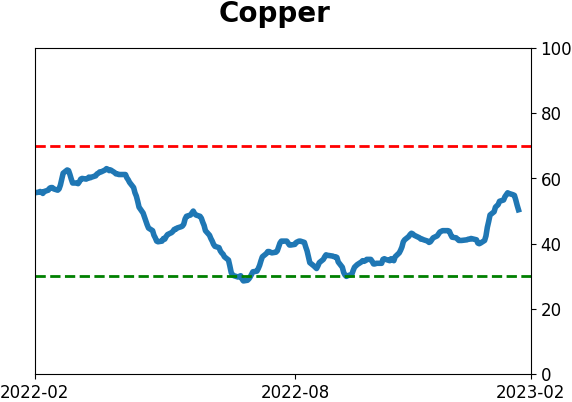
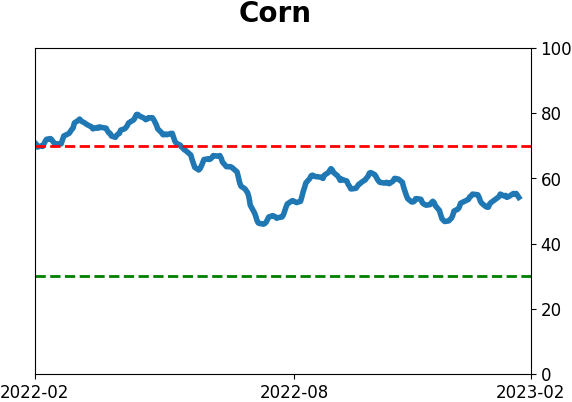
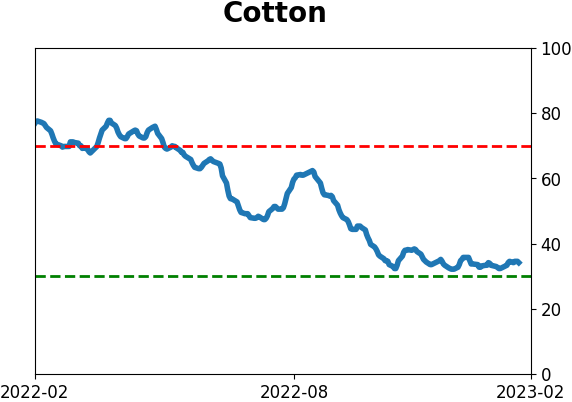
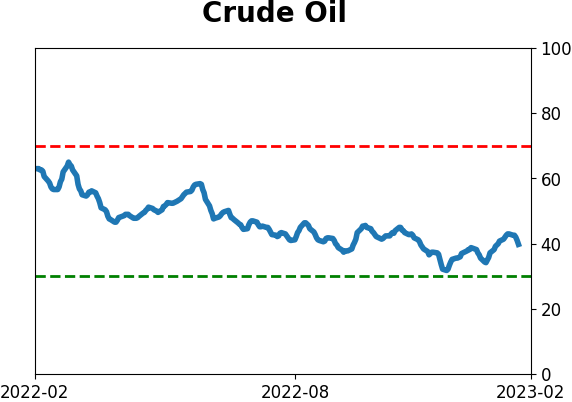
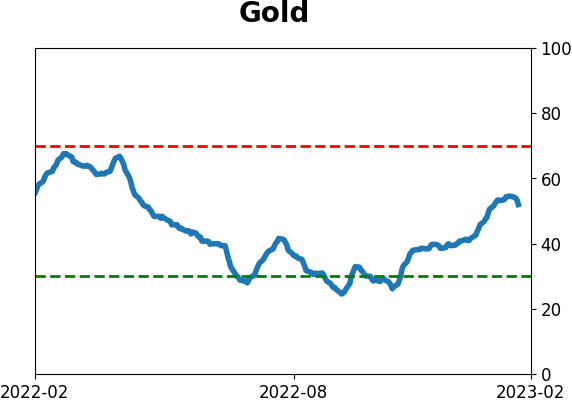
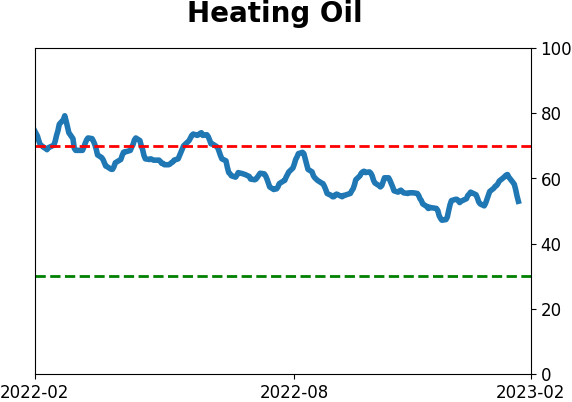
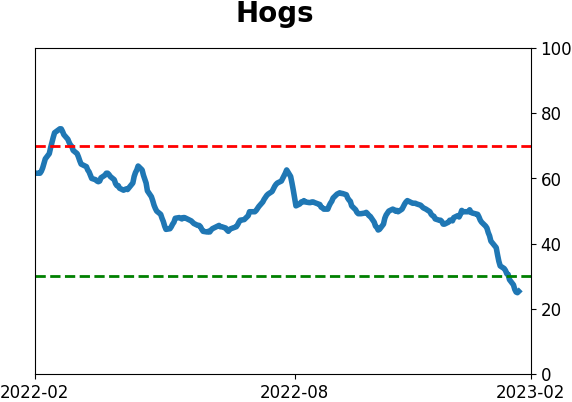
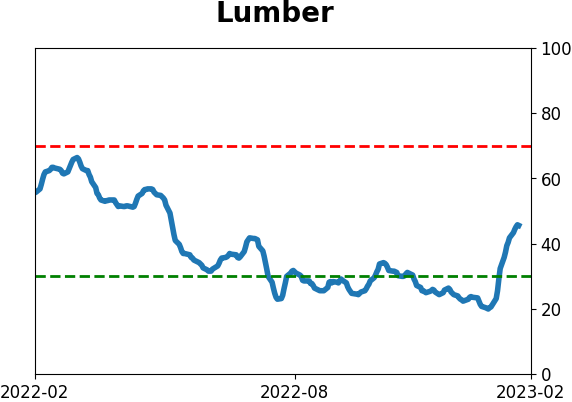
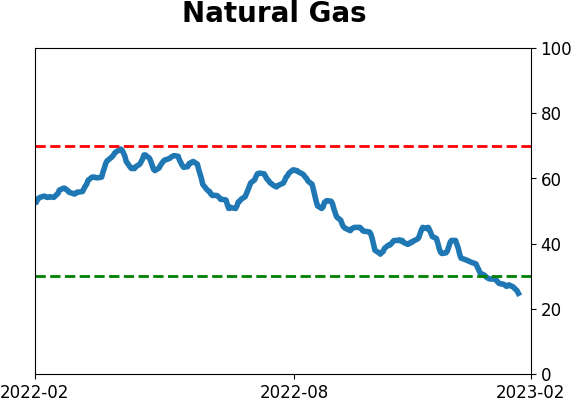
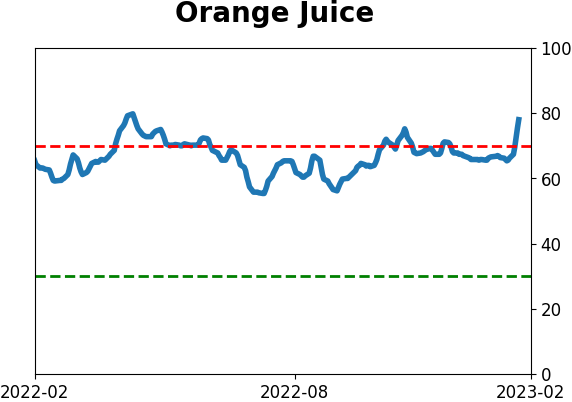
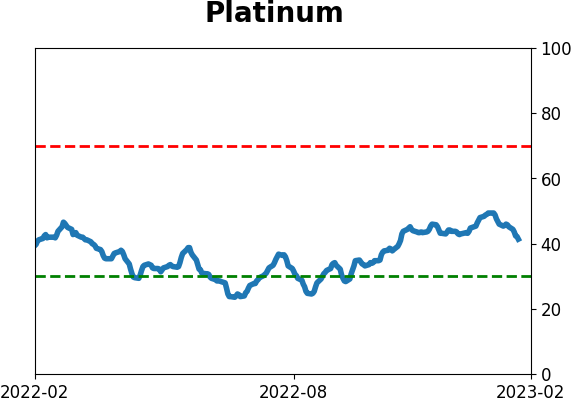
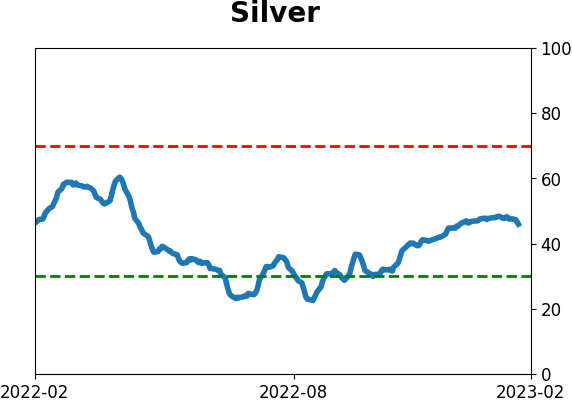
The commodity rally is fading
Dean showed that for only the eighth time in almost 80 years, the 1-year rate of change for a spot commodity index cycled from > 50% to < 0%.
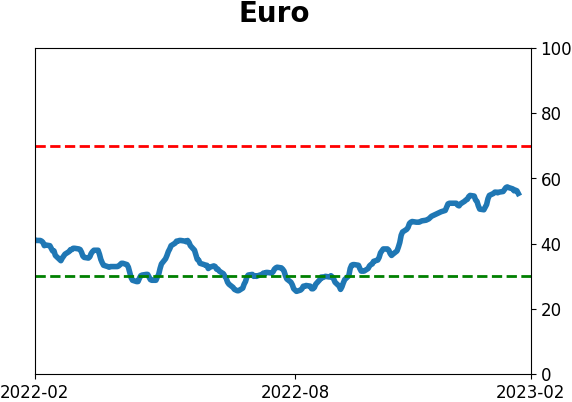
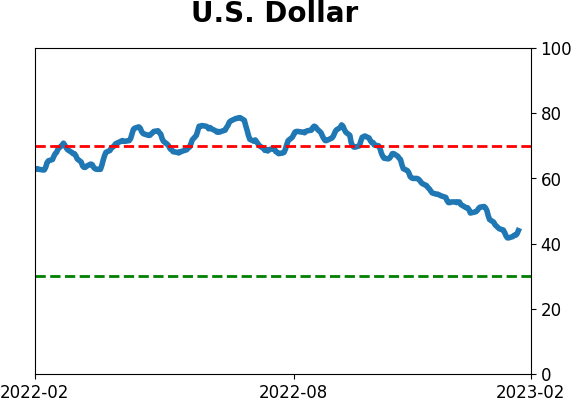
While commodities are highly susceptible to mean reversion, the shift in commodity momentum is interesting, given the nearly 11% decline in Dollar Index (DXY) over the last four months.
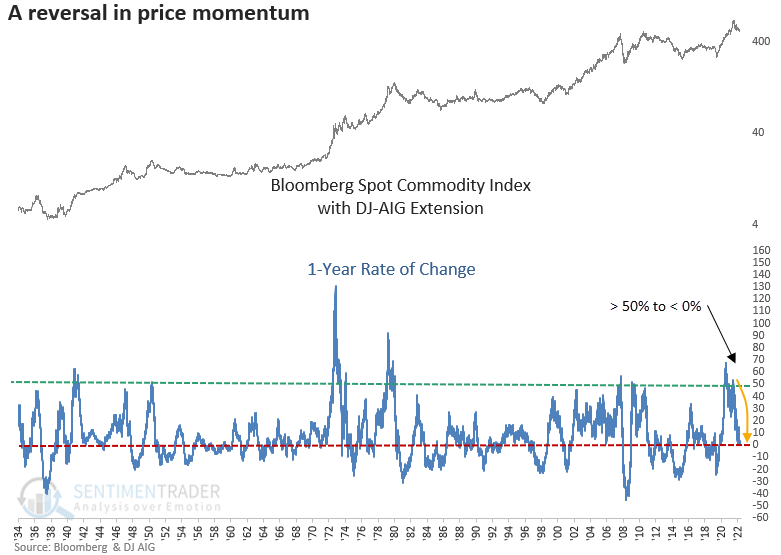
When the 1-year rate of change for a commodity index cycles from > 50% to < 0%, commodities struggle, especially six to twelve months later. While the sample size is small, recent signals tended to show a more negative outlook.
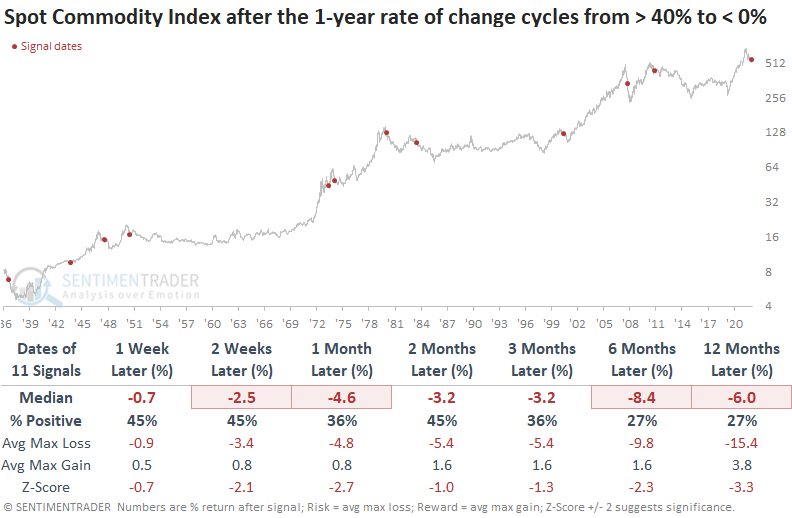
Let's lower the rate of change threshold. The reversal in price momentum from > 40% to < 0% looks even more unfavorable for commodities, as median returns were negative across all time frames.
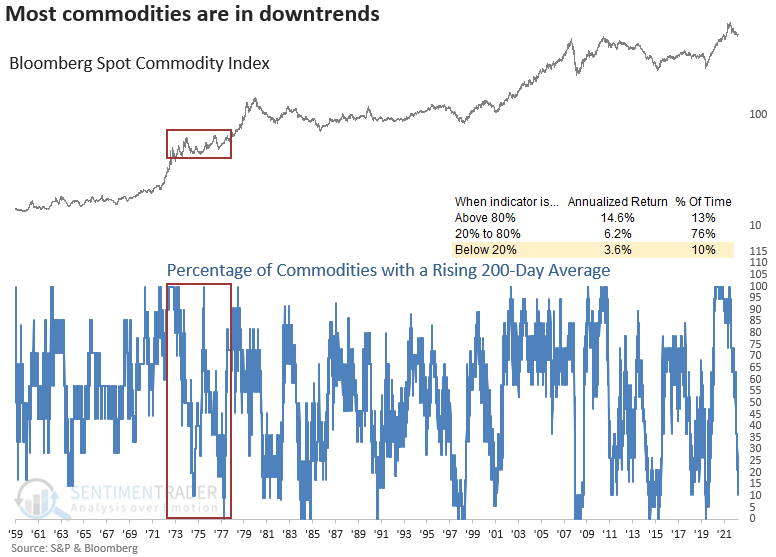
With price momentum reversing lower, it's not surprising to see so few commodities with a rising 200-day average. Historically, when 20% or fewer commodities maintain a long-term uptrend, annualized returns for a commodity index look less compelling.
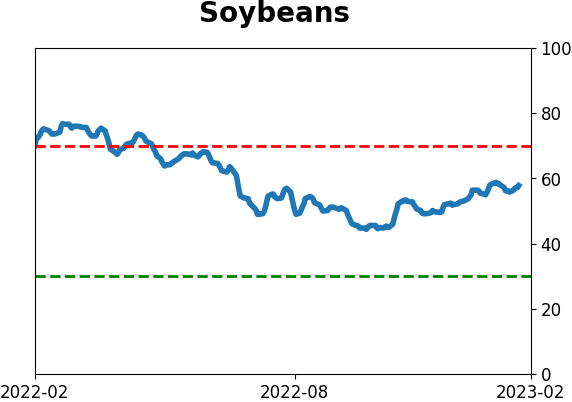
If soybeans are going to buck that trend, now is a good time
Due primarily to its unique planting cycle, soybeans are one of the most highly seasonal markets. Jay noted that this market is entering a typically favorable seasonal period.
The chart below displays the annual seasonal trend for soybean futures.
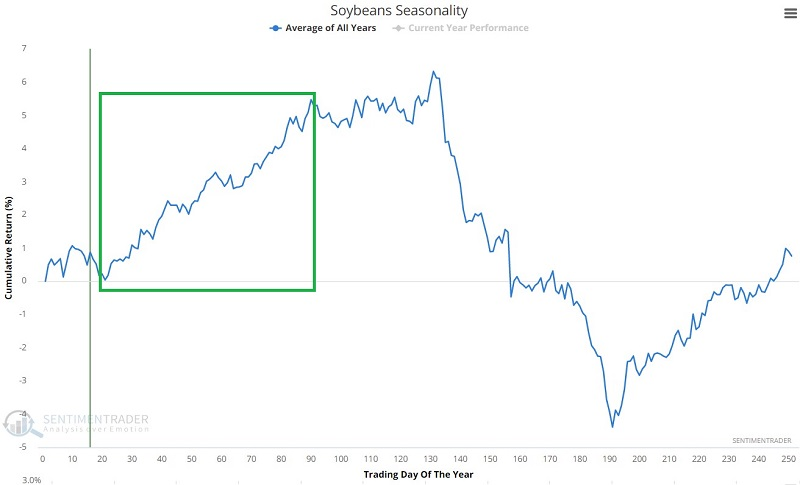
The most important thing to note is that soybeans are re-entering a typically favorable seasonal period from the close of TDY #21 through the close of TDY #90. For 2023, this period extends from the close on January 30 through March 2.
The chart below displays the cumulative hypothetical gain from holding long one soybeans futures contract during this window since 1937.
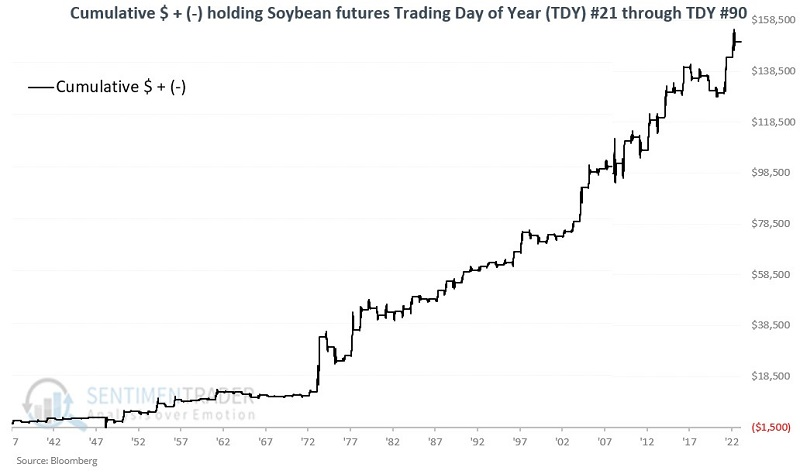
As with most viable seasonal trends, there is no guarantee that beans will rally during this supposedly favorable period during any given year but the long-term favorable bias is unmistakable. The contract rose 66% of the time, with an average gain more than double the average loss. It rose more than $6,000 twelve times compared to no losses greater than -$6,000.
The Teucrium Soybean Fund (SOYB) is an exchange-traded security that is designed to track in percentage terms the movements of soybeans futures prices. SOYB issues shares that may be bought and sold like shares of stock.
About TradingEdge Weekly...
The goal of TradingEdge Weekly is to summarize some of the research published to SentimenTrader over the past week. Sometimes there is a lot to digest and this summary is meant to highlight the highest conviction or most compelling ideas we discussed. This is NOT the full research that's published, rather it pulls out some of the most relevant parts. It includes links to the published research for convenience; if you don't subscribe to those products it will present the options for access.
Indicators at Extremes
|
|
|
Phase Table
|
|
|
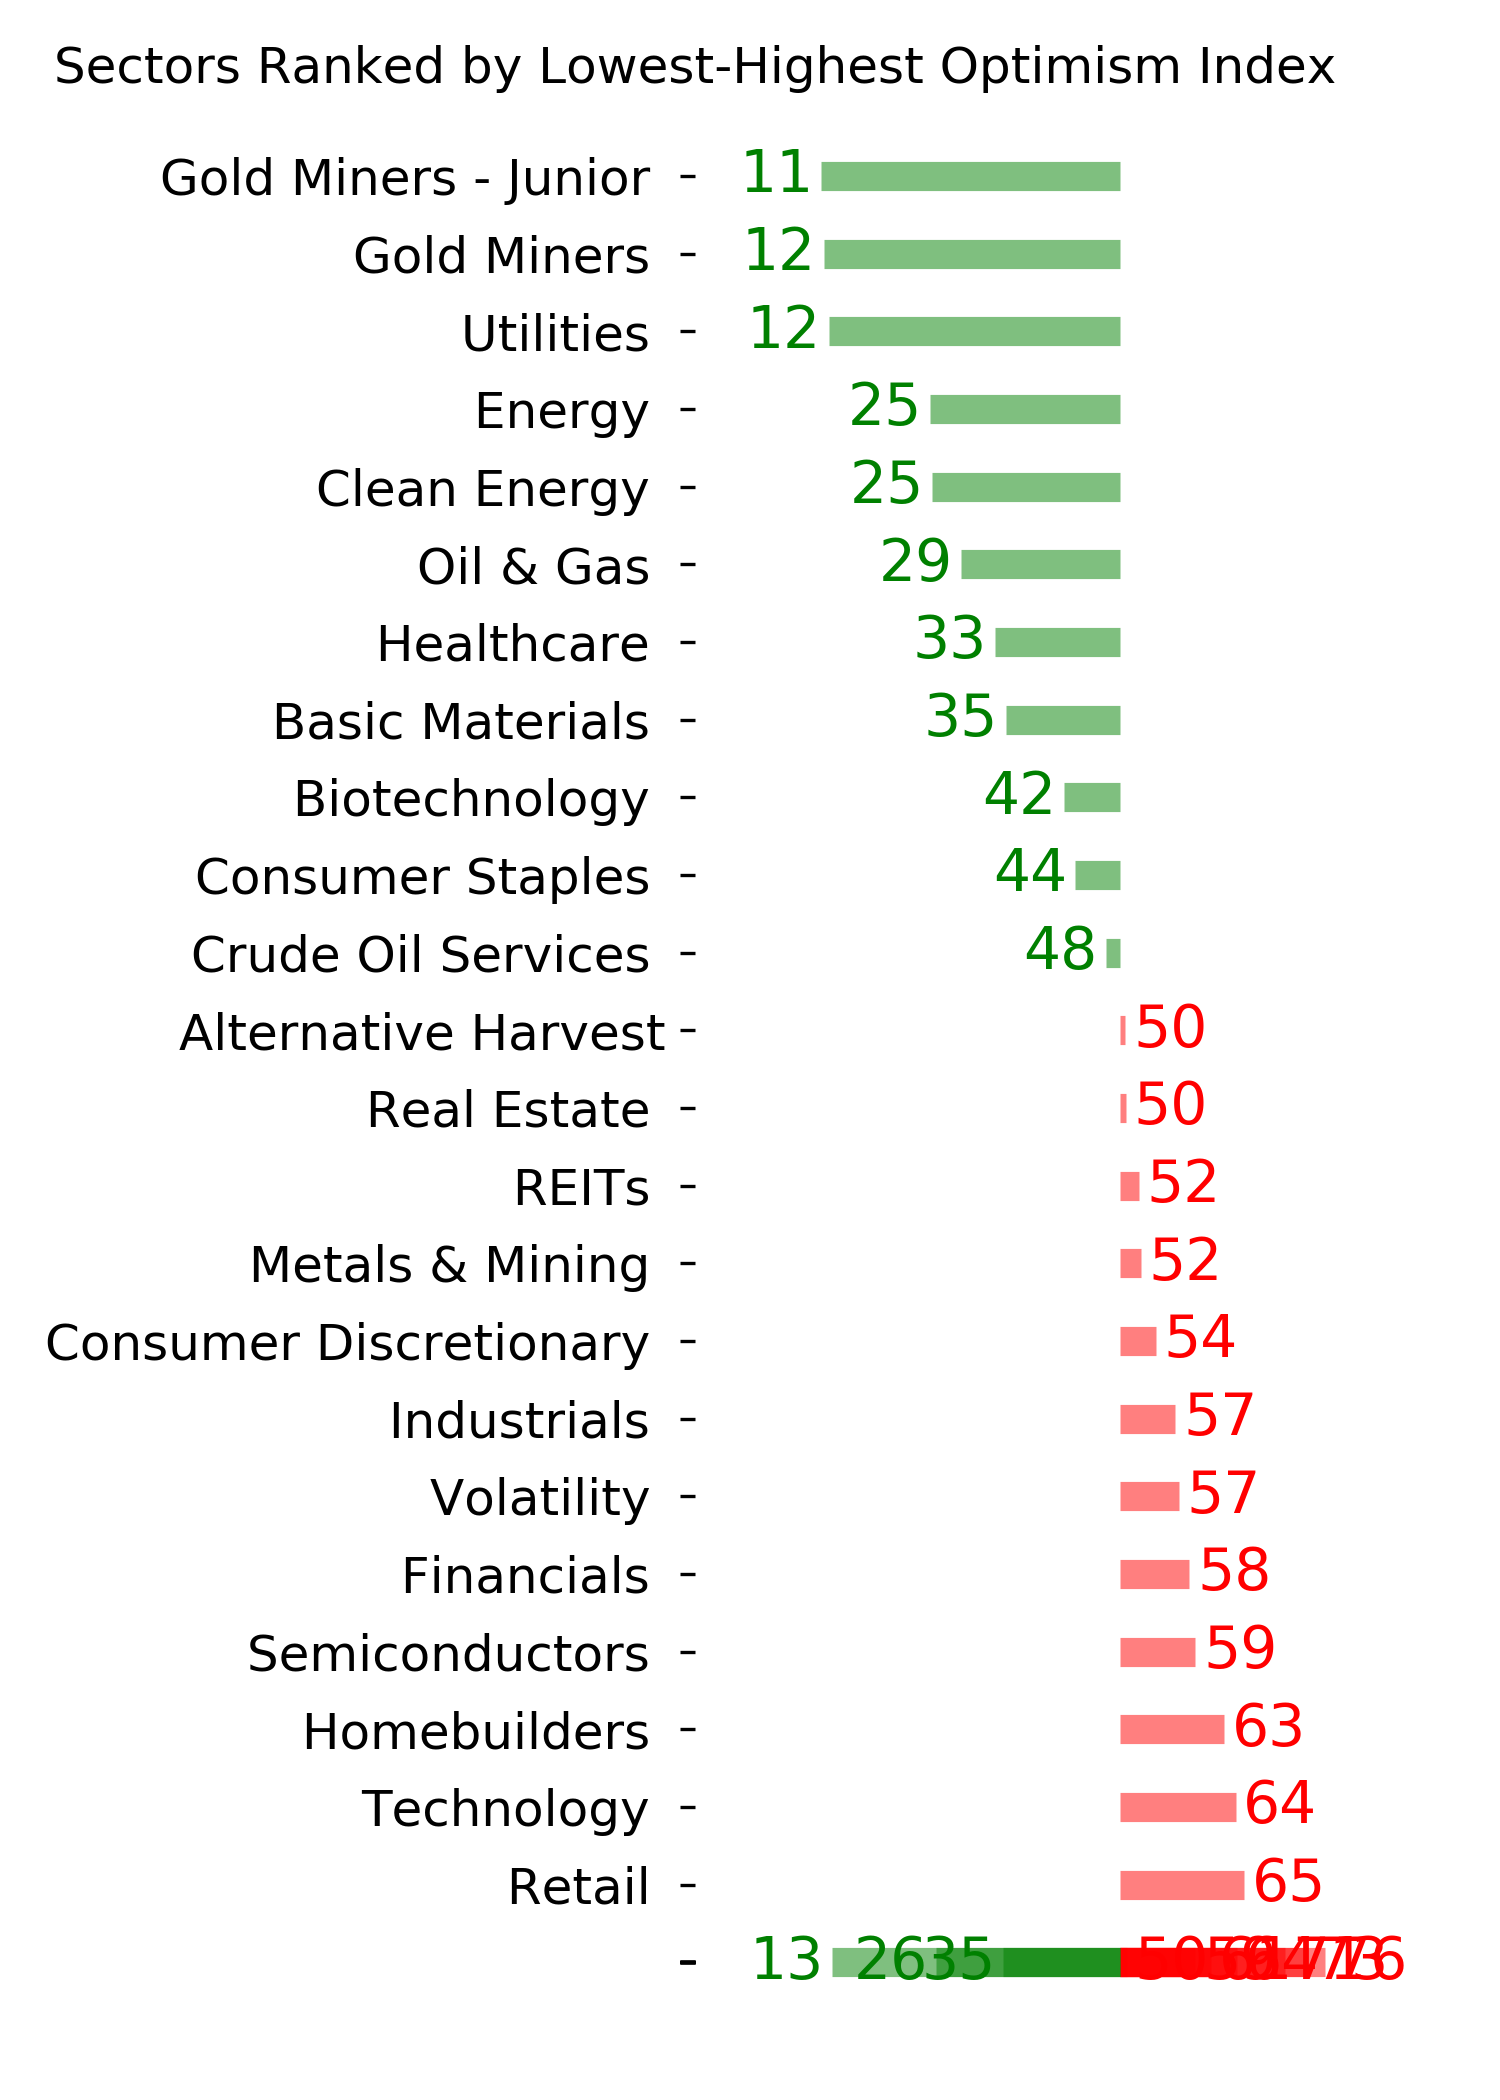
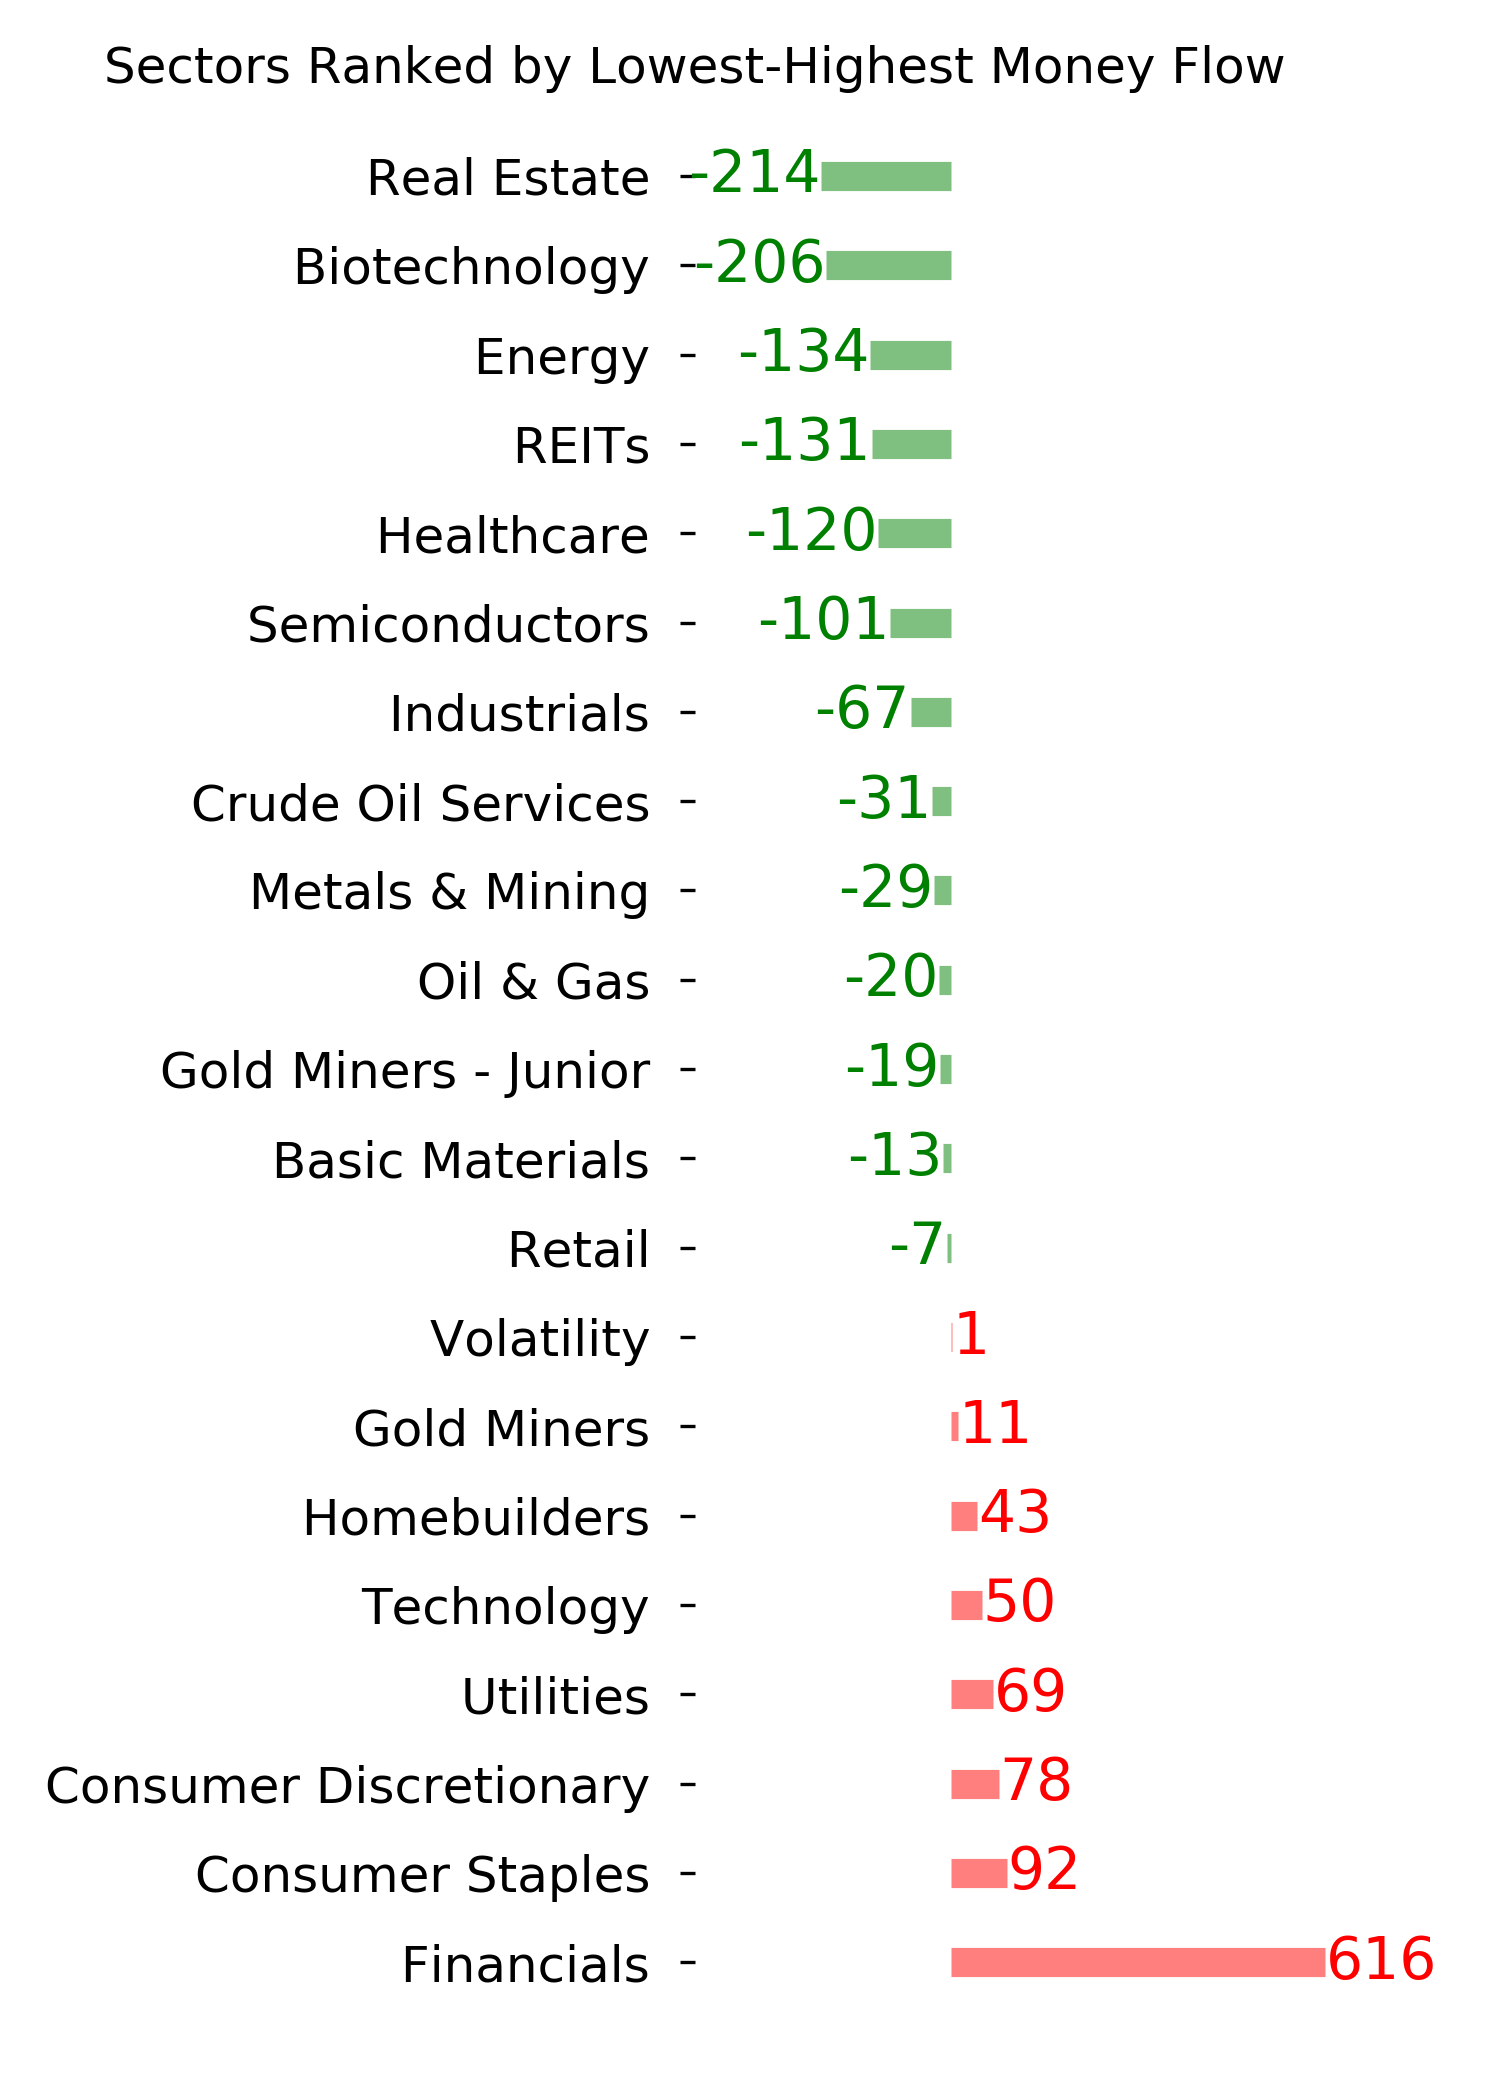
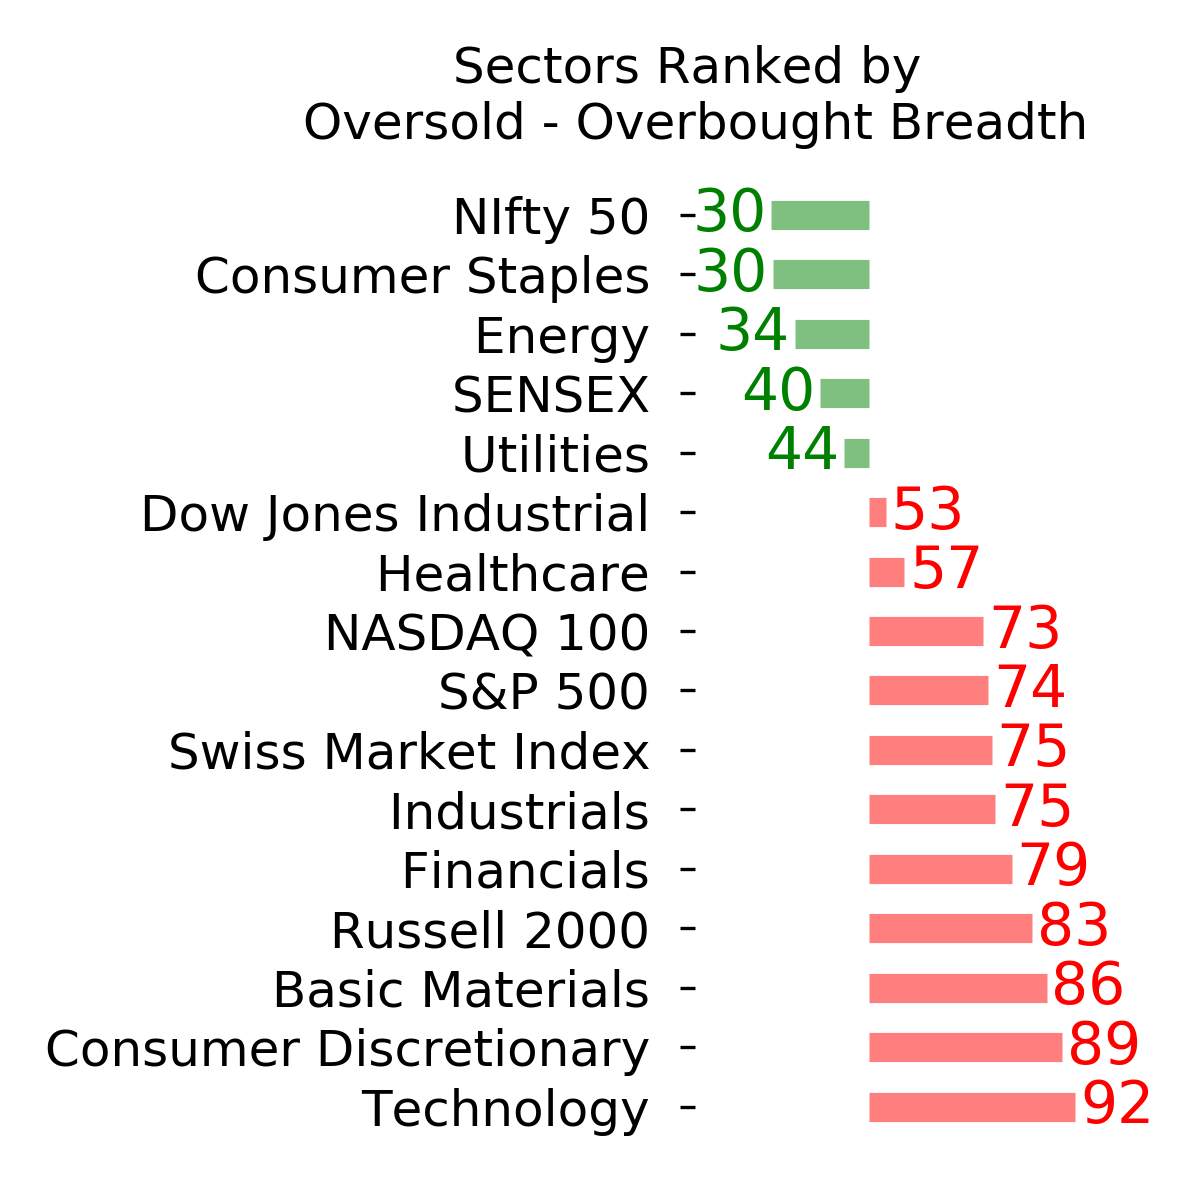
Ranks
|
|
|
|
|
|
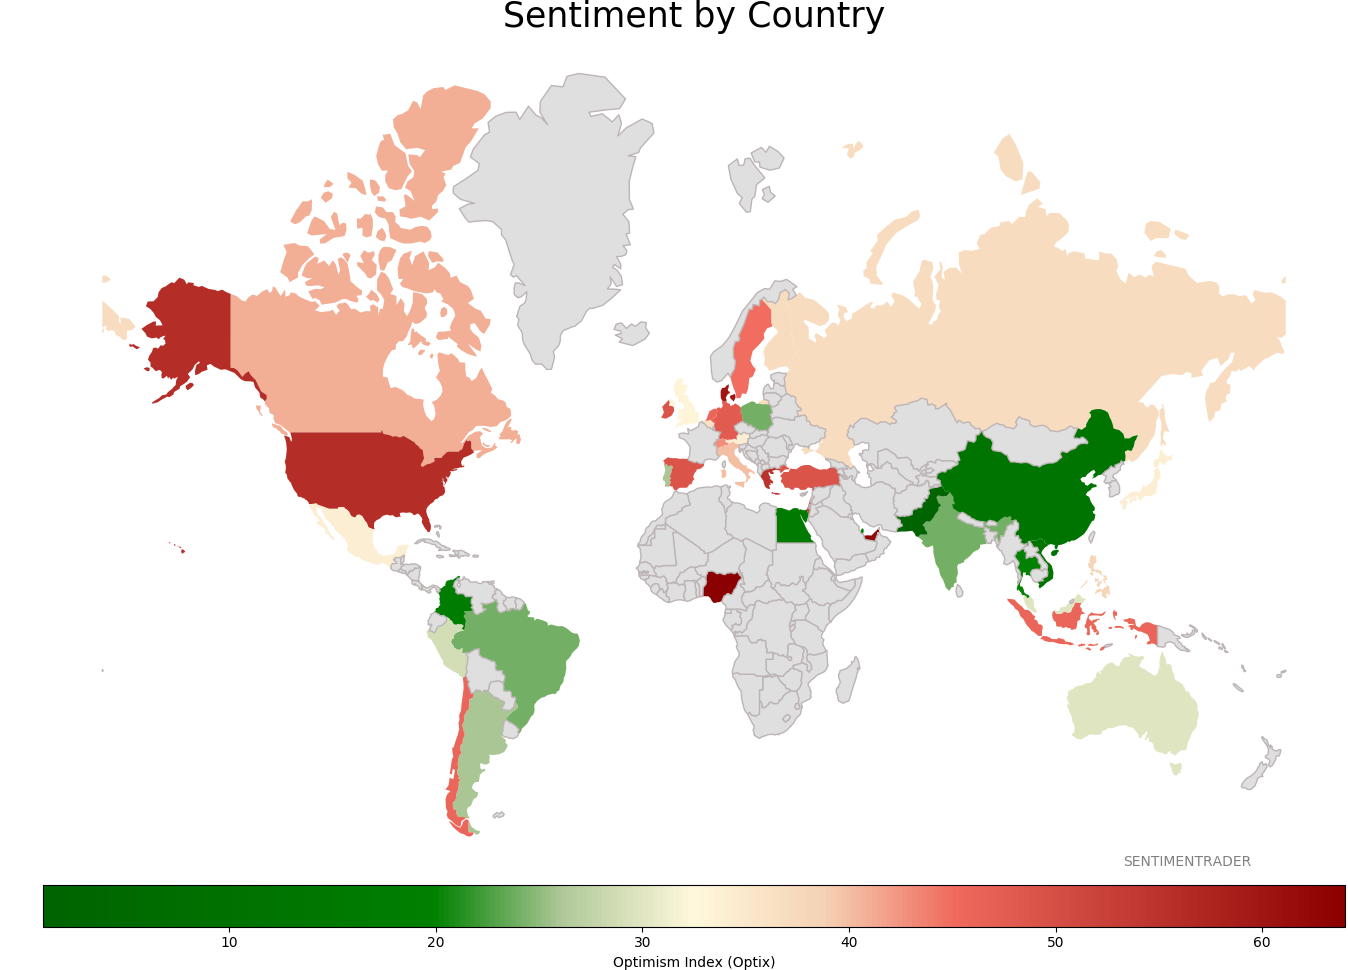
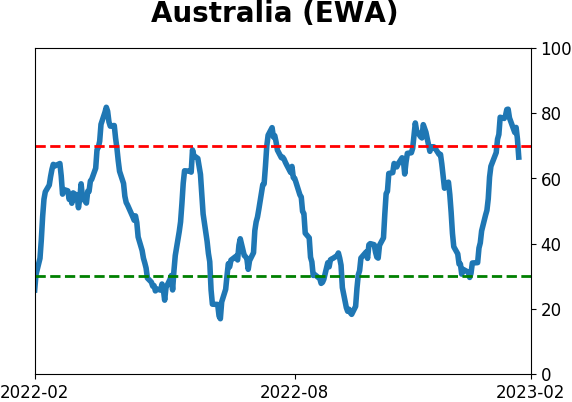
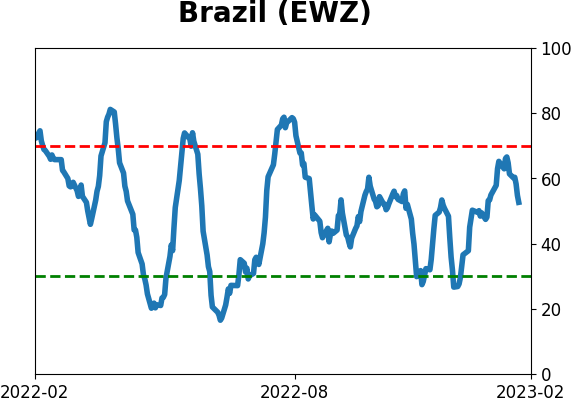
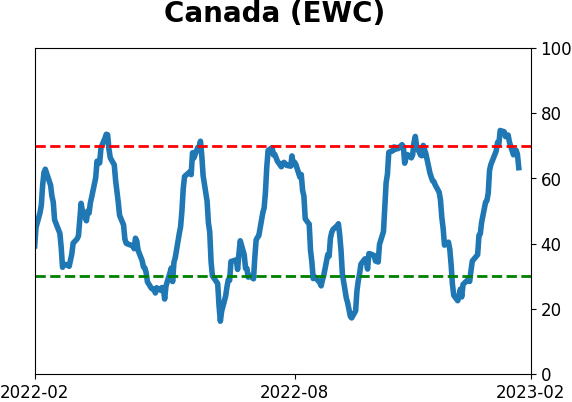
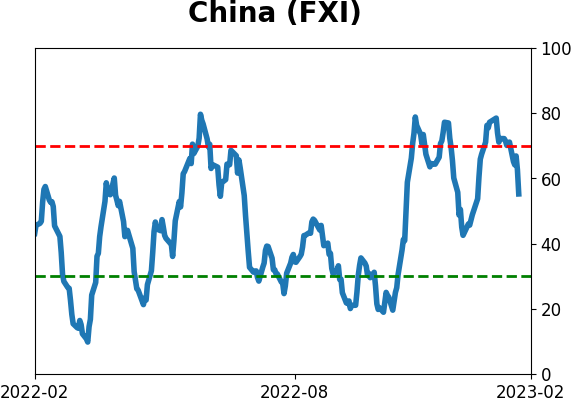
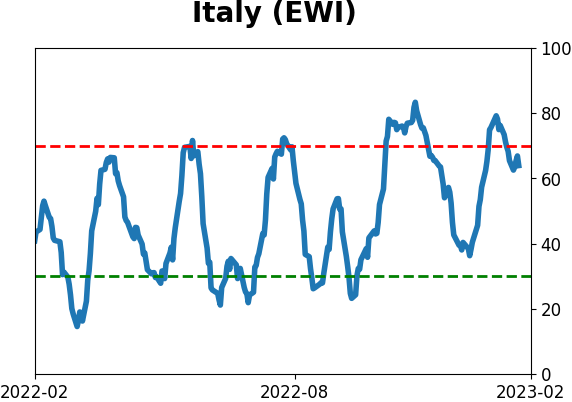
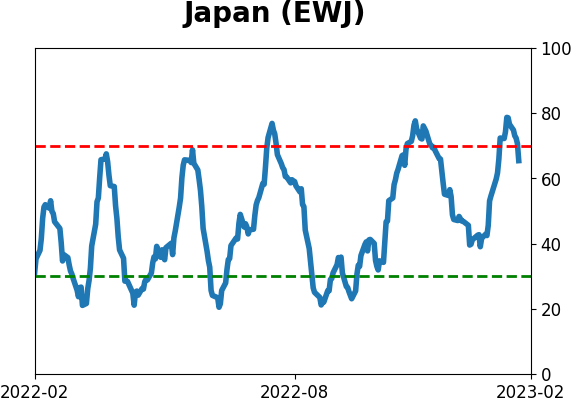
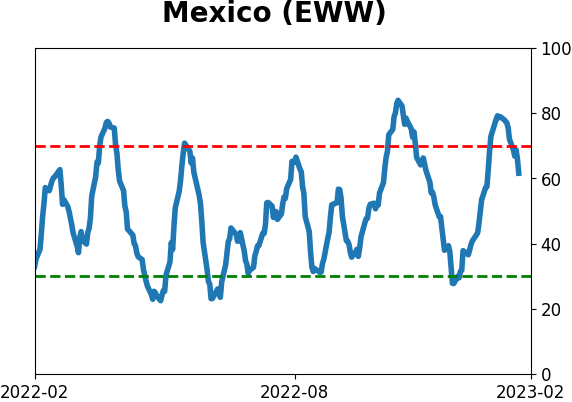
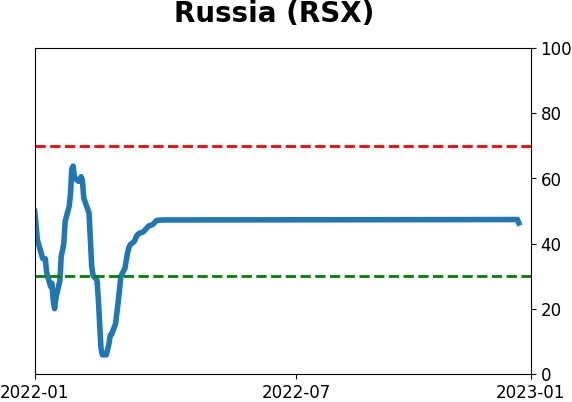
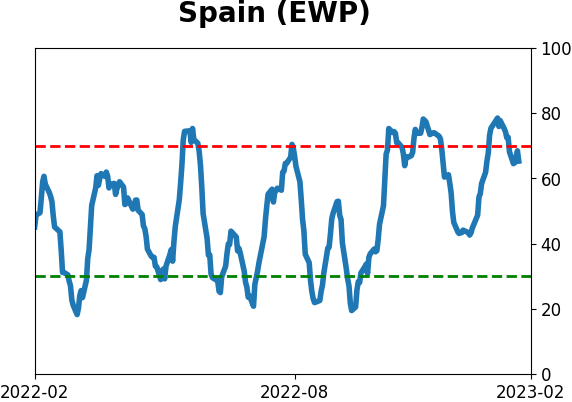
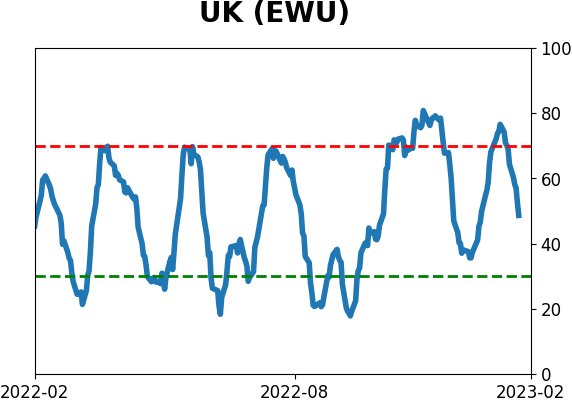
Sentiment Around The World
|
|
|
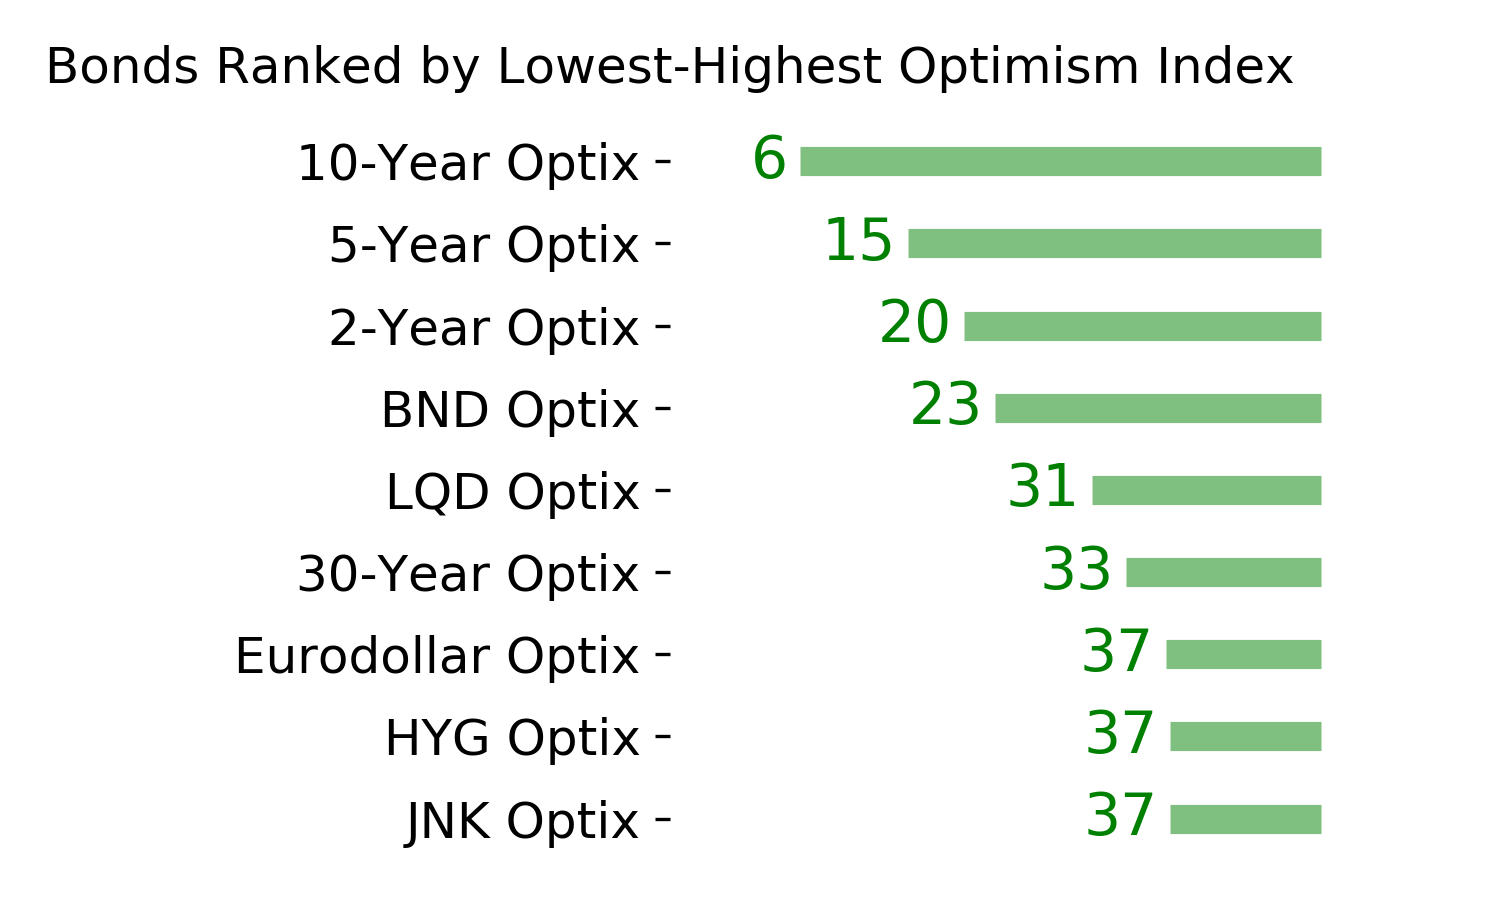
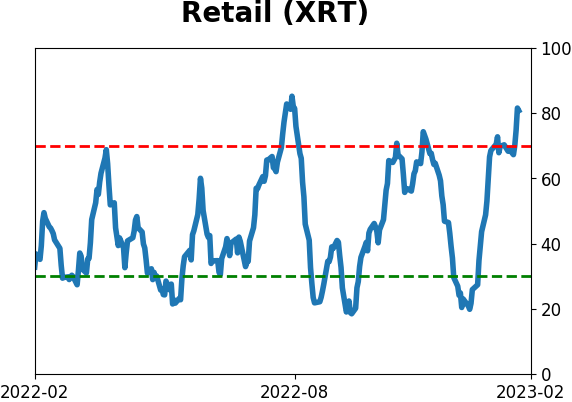
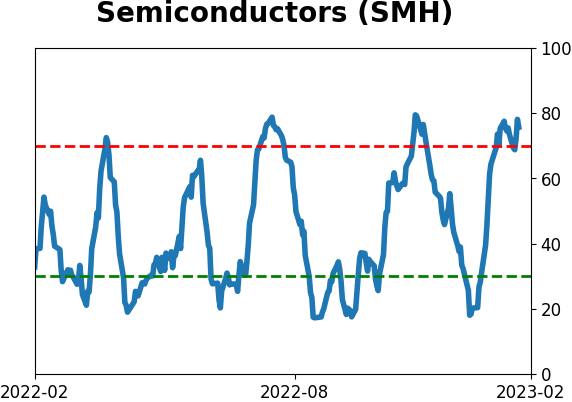
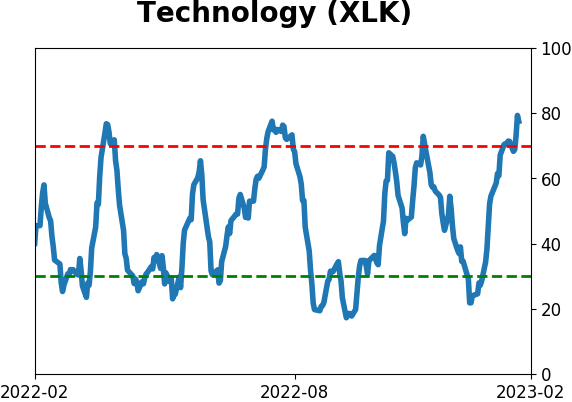
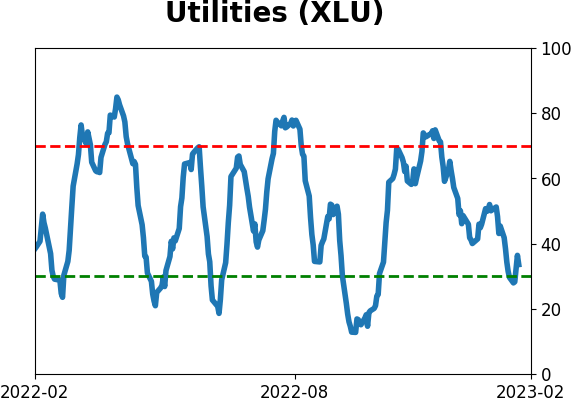
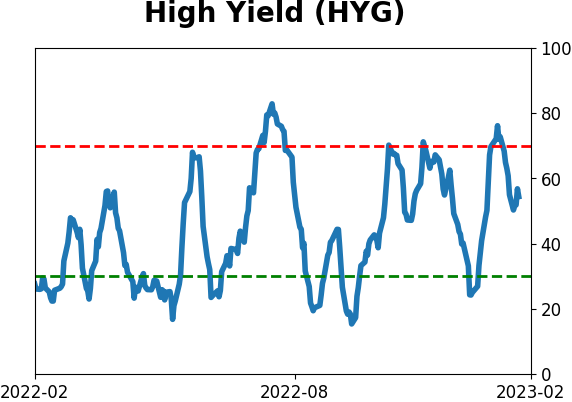
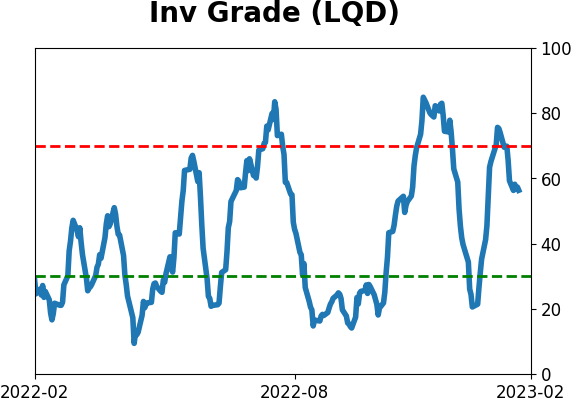
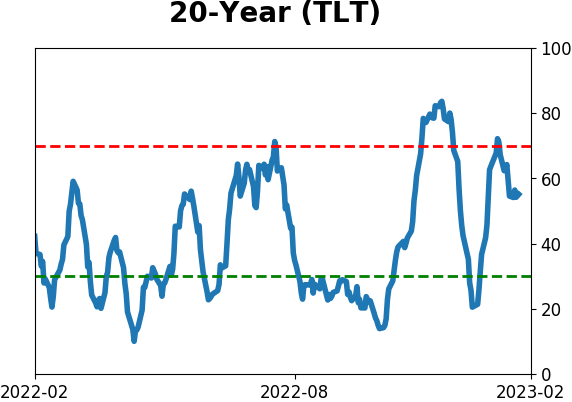
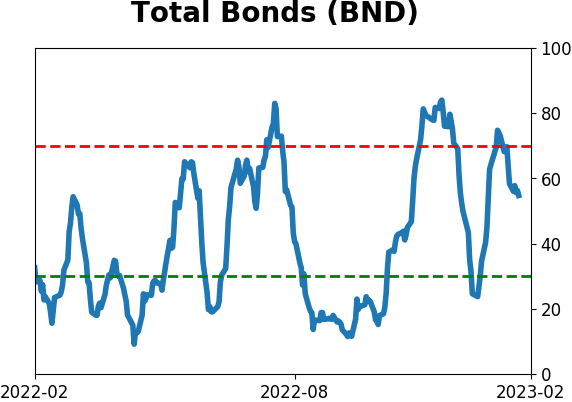
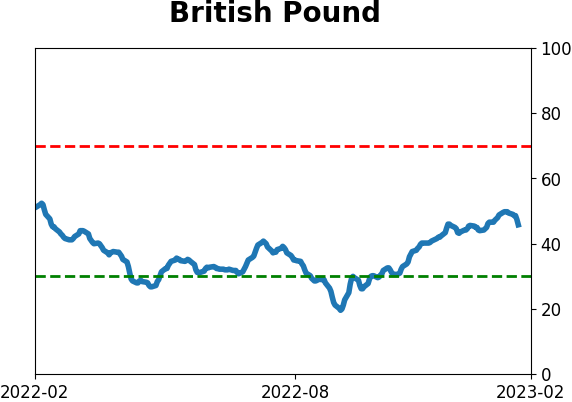
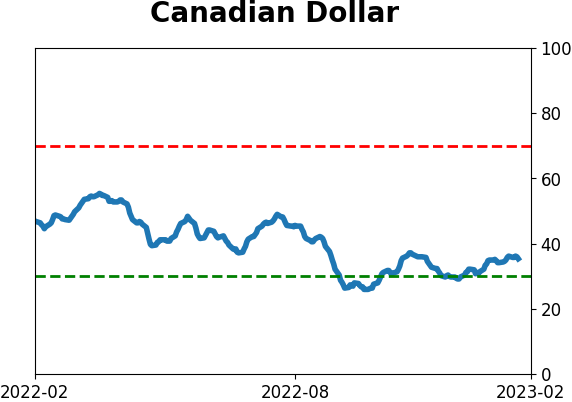
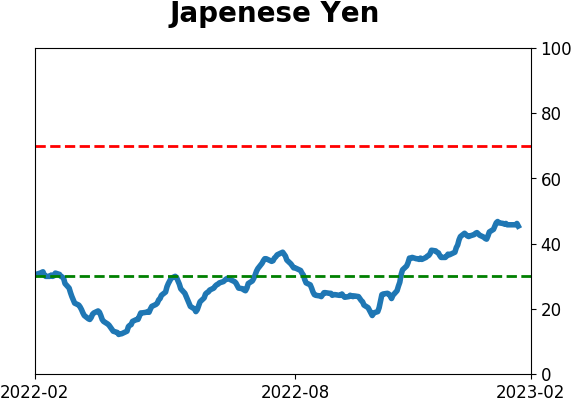
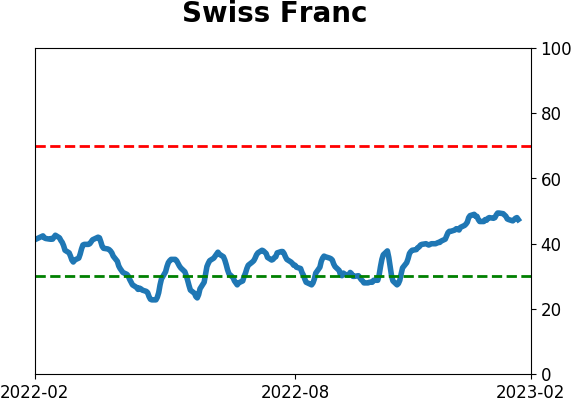
Optimism Index Thumbnails
|
|
|
|
|
|
|
|
|
|
|
|
|
|
|
|
|
|
|
|
|