Headlines
|
|
A bullish expansion in new highs for the healthcare sector:
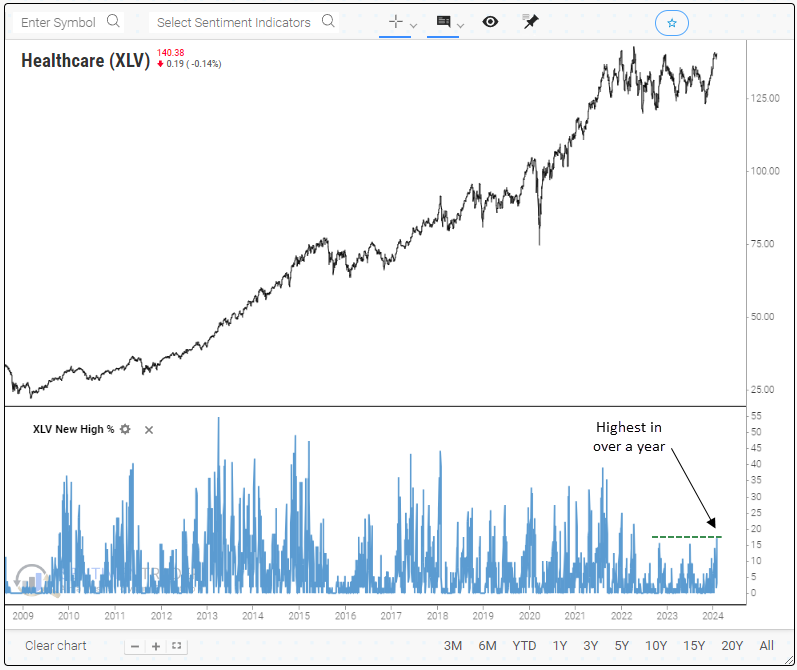
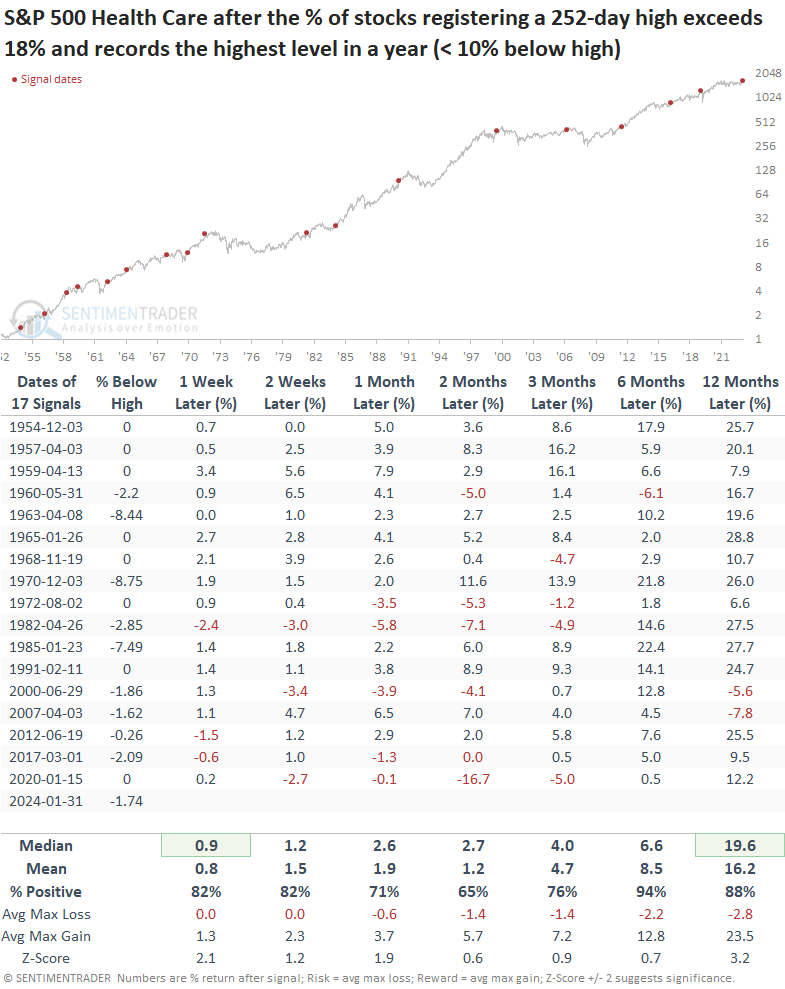
On Wednesday, annual highs for large-cap healthcare stocks soared to their highest level in over a year, surpassing all other sectors except financials. Following comparable breadth-based breakouts, the healthcare sector rallied 94% of the time over the subsequent six months.
|
Smart / Dumb Money Confidence
|
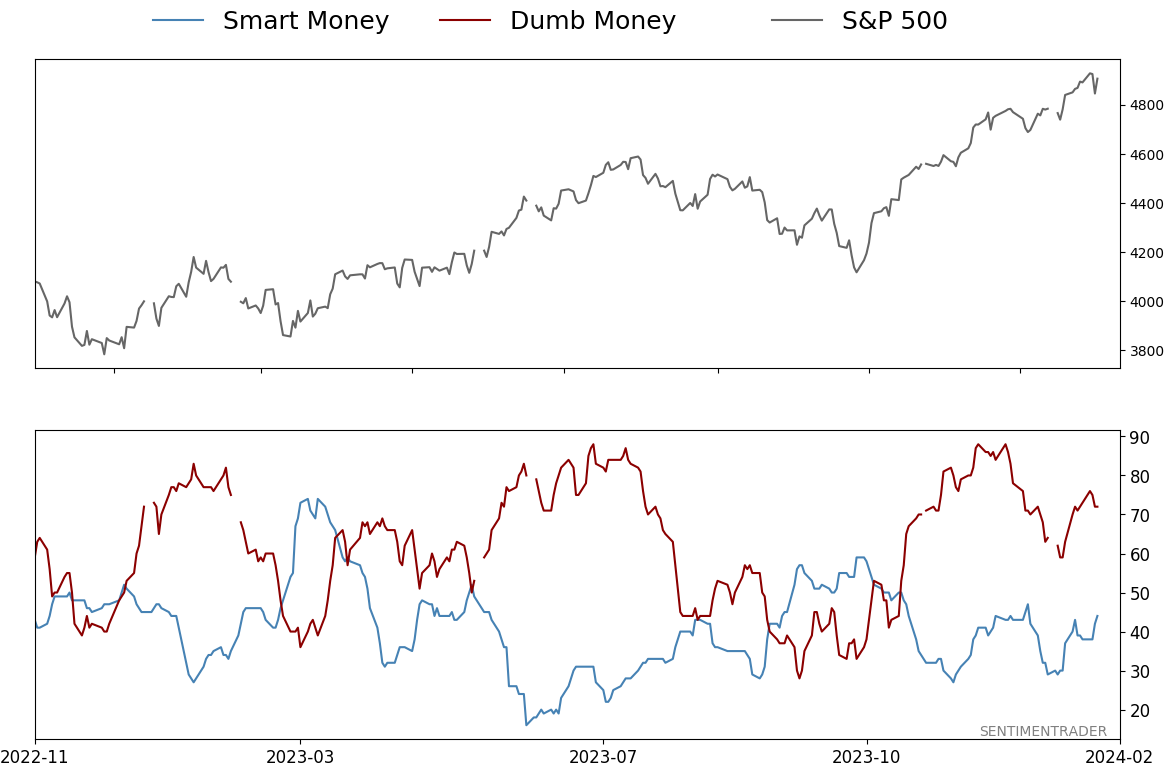
Smart Money Confidence: 44%
Dumb Money Confidence: 72%
|
|
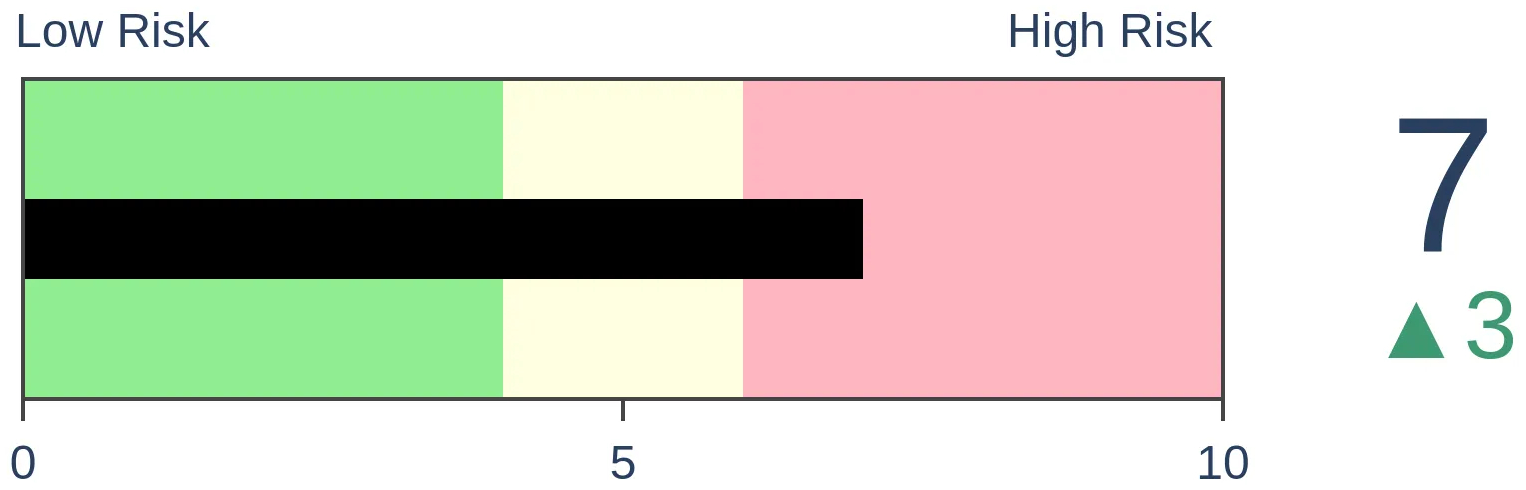
Risk Levels
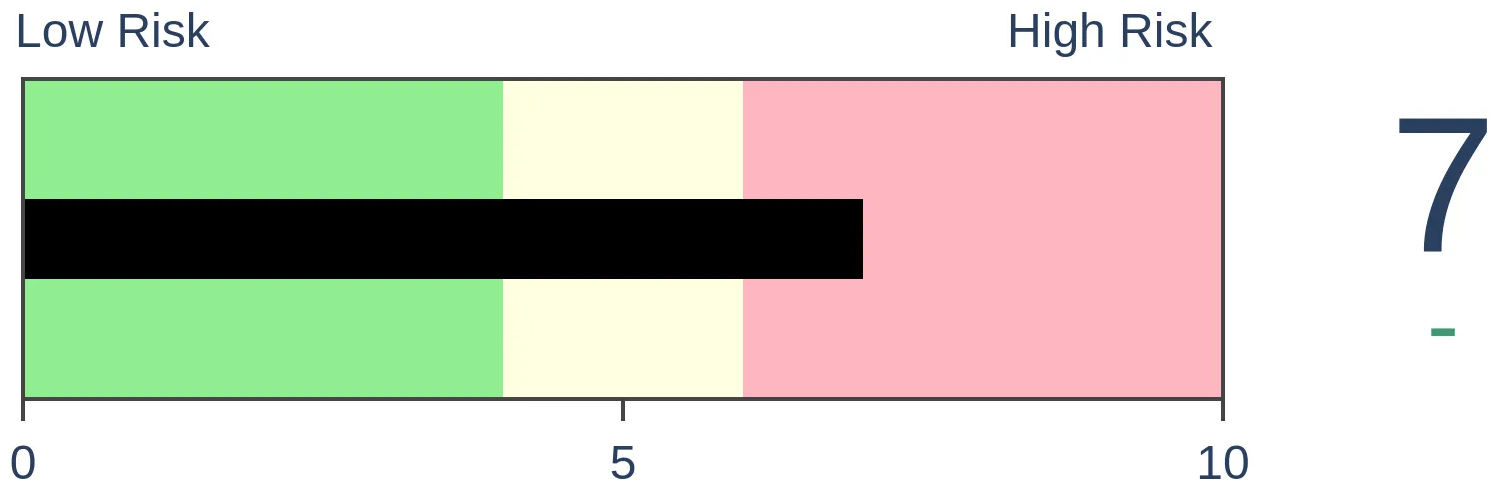
Stocks Short-Term
|
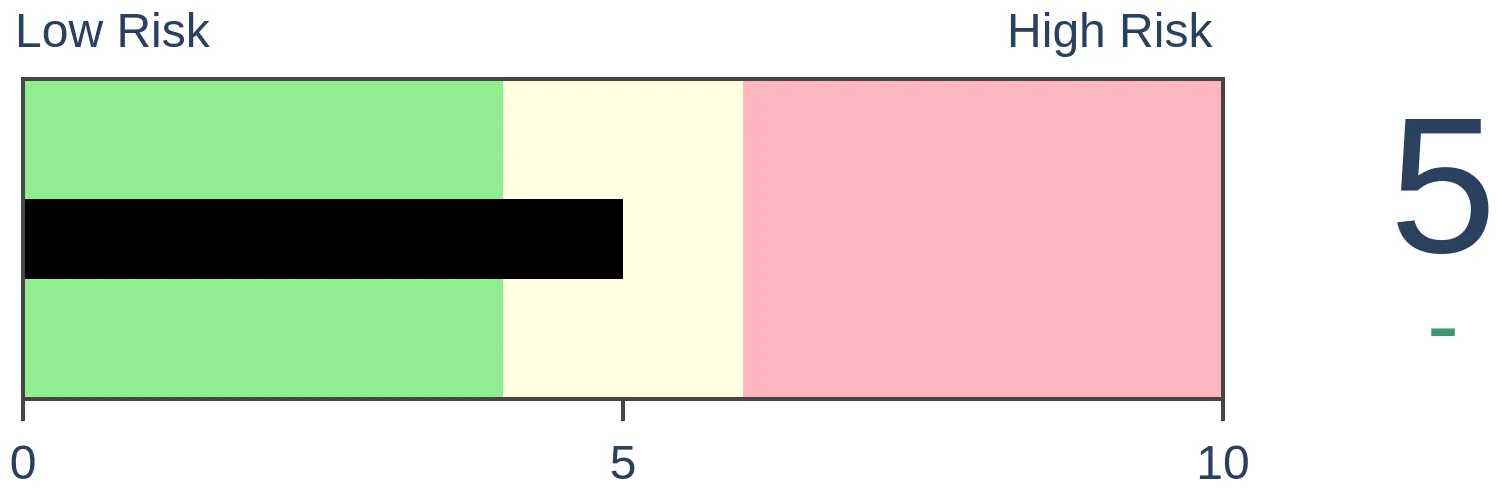
Stocks Medium-Term
|
|
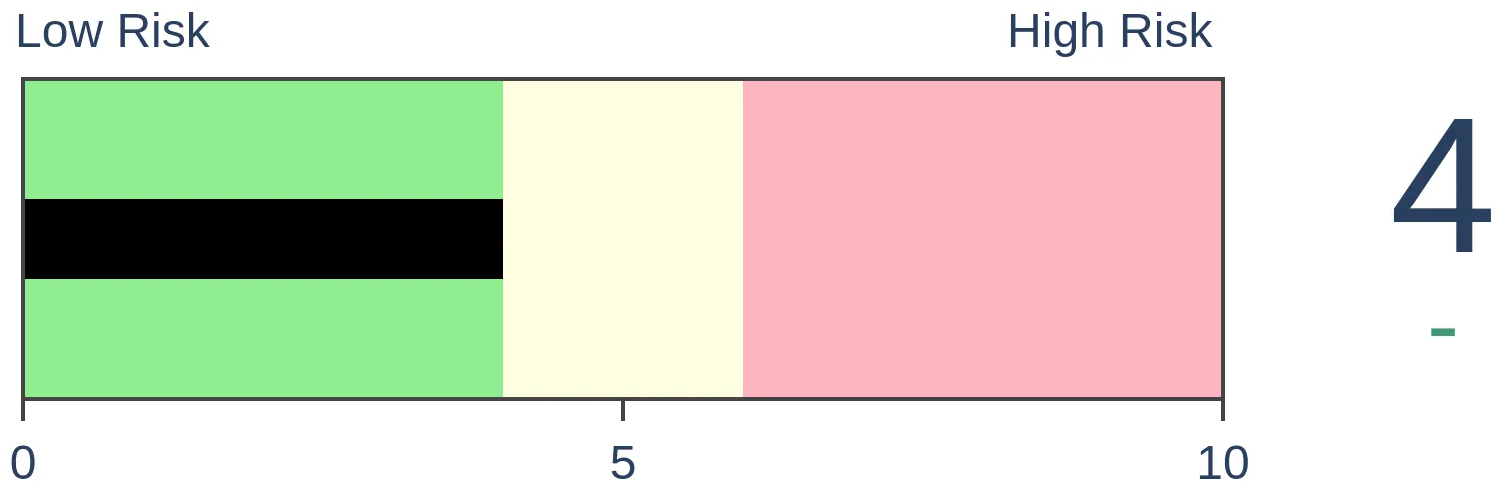
Bonds
|
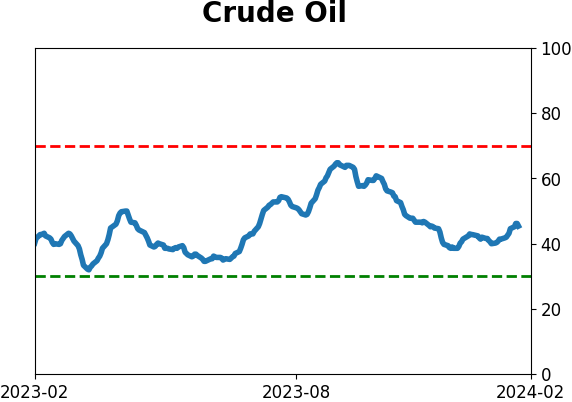
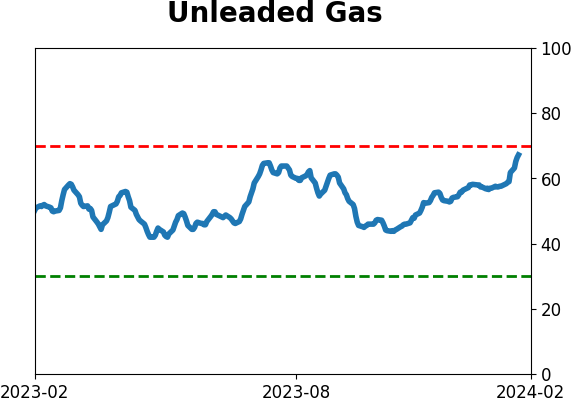
Crude Oil

|
|
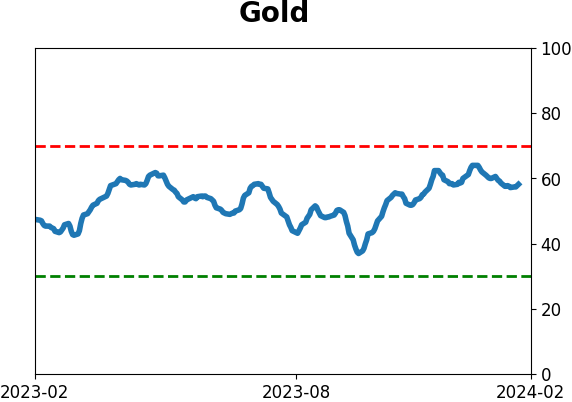
Gold
|
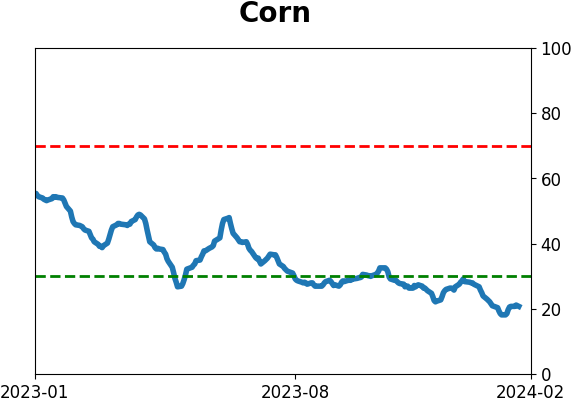
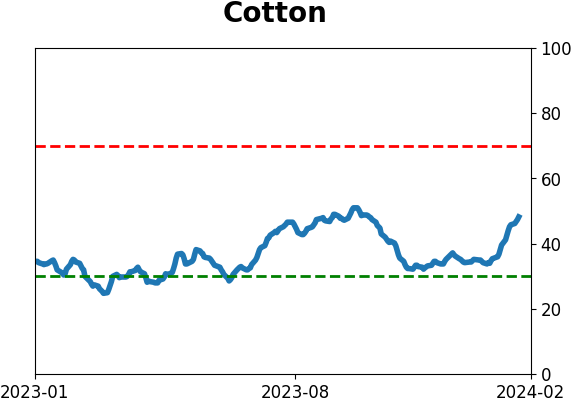
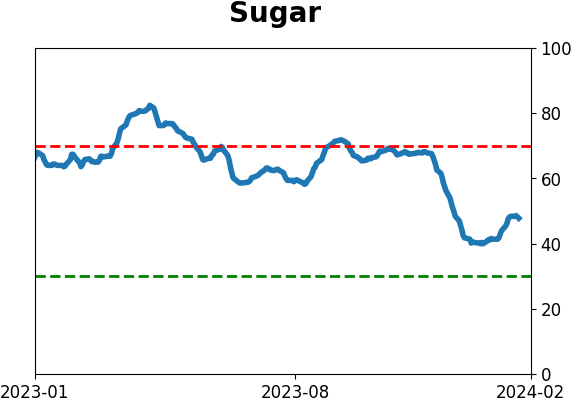
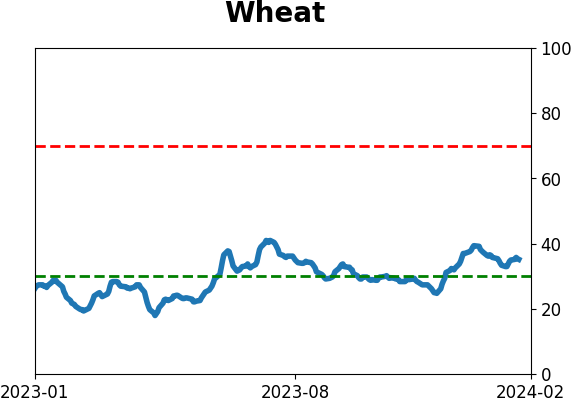
Agriculture

|
|
Research
By Dean Christians
BOTTOM LINE
On Wednesday, annual highs for large-cap healthcare stocks soared to their highest level in over a year, surpassing all other sectors except financials. Following comparable breadth-based breakouts, the healthcare sector rallied 94% of the time over the subsequent six months.
FORECAST / TIMEFRAME
None
|
Key points:
- S&P 500 healthcare stocks registering an annual high increased to the highest level in a year
- Similar expansions in new highs preceded a 94% win rate over the subsequent six months
- Healthcare Distributors and Biotech look the most favorable on an absolute and relative trend basis
A traditionally defensive sector shows an expansion in new highs
On Wednesday evening, as I reviewed market breadth indicators after the bloodbath following the FOMC meeting, the healthcare sector caught my attention.
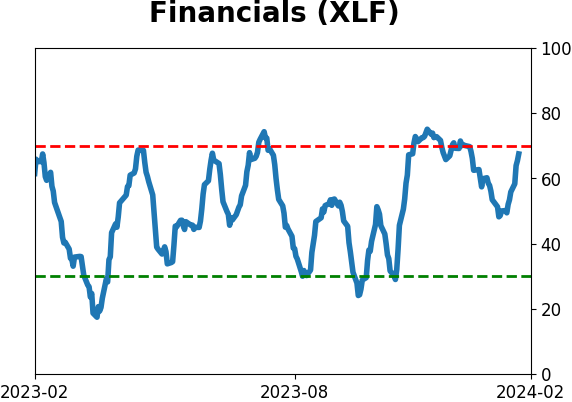
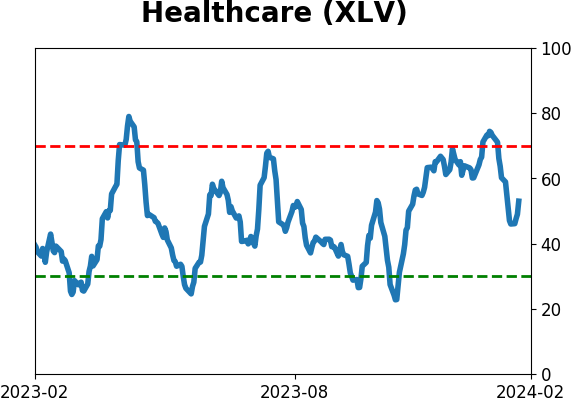
Annual highs for the traditionally defensive sector increased above 18%, reaching the highest since April 2022. The expansion in new highs was the second-best reading among all groups, trailing only Financials.
Let's assess the outlook for the healthcare sector when the percentage of S&P 500 healthcare stocks registering a 252-day high exceeds 18%, records the highest level in a year, and hovers less than 10% below a five-year high, conditions similar to now.
Similar expansions in annual highs preceded a bullish outlook
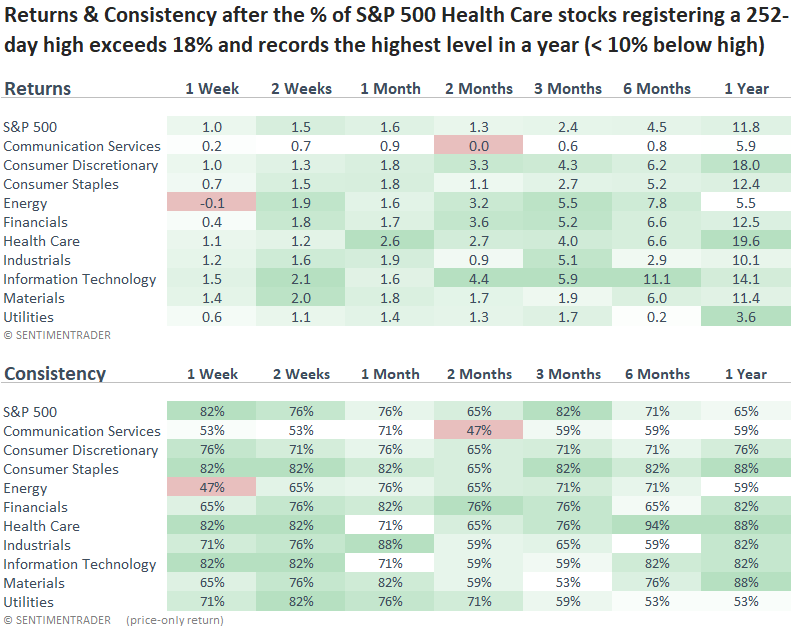
Under circumstances similar to now, when there is an expansion in annual highs within the healthcare sector, the group has demonstrated favorable returns and win rates, particularly over the ensuing six and twelve-month periods.
When examining historical trends related to defensive sectors like healthcare, it is imperative to consider the group's change in character. The transition from growth to defensive growth in the 1990s, similar to Consumer Staples, could result in less favorable returns than historical precedents, especially in bull markets.
Over the following year, healthcare outperformed all other sectors in a bullish market environment. As always, assessing current absolute and relative trends is critical to determine whether allocating to a group is appropriate.
Absolute and Relative Trend Scores
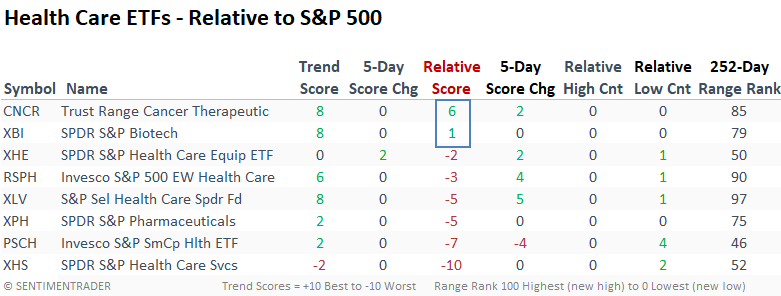
Among common healthcare ETFs, only Biotech-oriented groups stand out with positive relative trend scores versus the S&P 500. So, the group as a whole lacks a favorable tailwind.
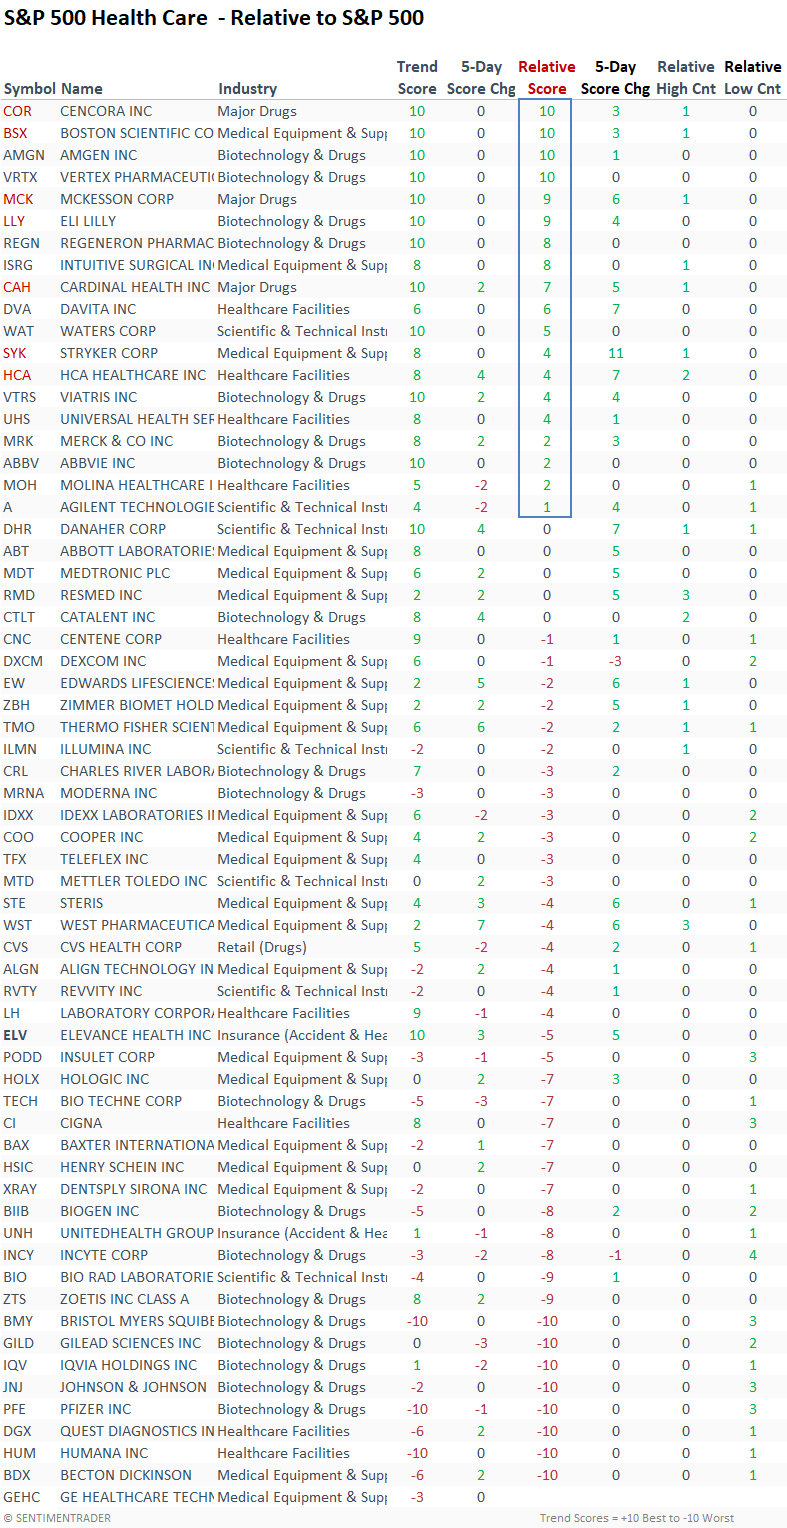
Within sub-industries, the Health Care Distributors group maintains the highest absolute and relative trend scores following a substantial week-over-week increase. Notably, distributors closed at a 1-year high on Wednesday, signaling resilience amidst broader market pressures.
The Biotech sub-industry group, which is market cap-weighted, looks more favorable than the Biotech ETF (XBI), which is equal-weighted.
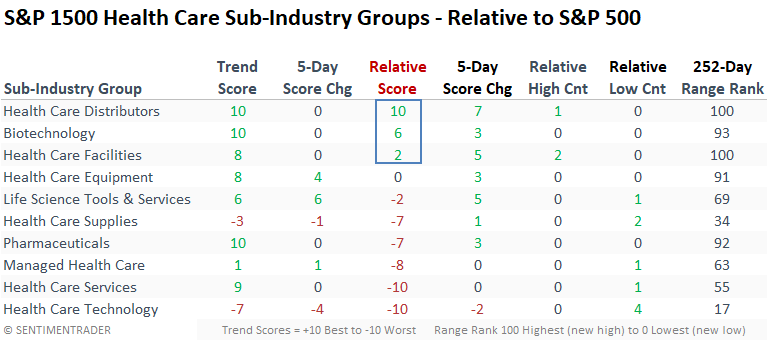
The healthcare distributor stocks include McKesson (MCK), Cardinal Health (CAH), and Cencora (COR), which used to be AmerisourceBergen. All three of these stocks show solid trend scores and closed at a new high on Wednesday, denoted by the red symbol in the table.
It's a market of stocks, not a stock market for the healthcare sector.
What the research tells us...
The S&P 500 healthcare sector experienced a notable surge in annual highs, reaching the highest level in over a year. Similar breadth-based breakouts led to a bullish outlook for the group and were indicative of a bullish broad market environment. While my absolute and relative trend score rankings do not suggest a broad-based industry tailwind, a handful of groups like distributors and biotech offer some compelling opportunities.
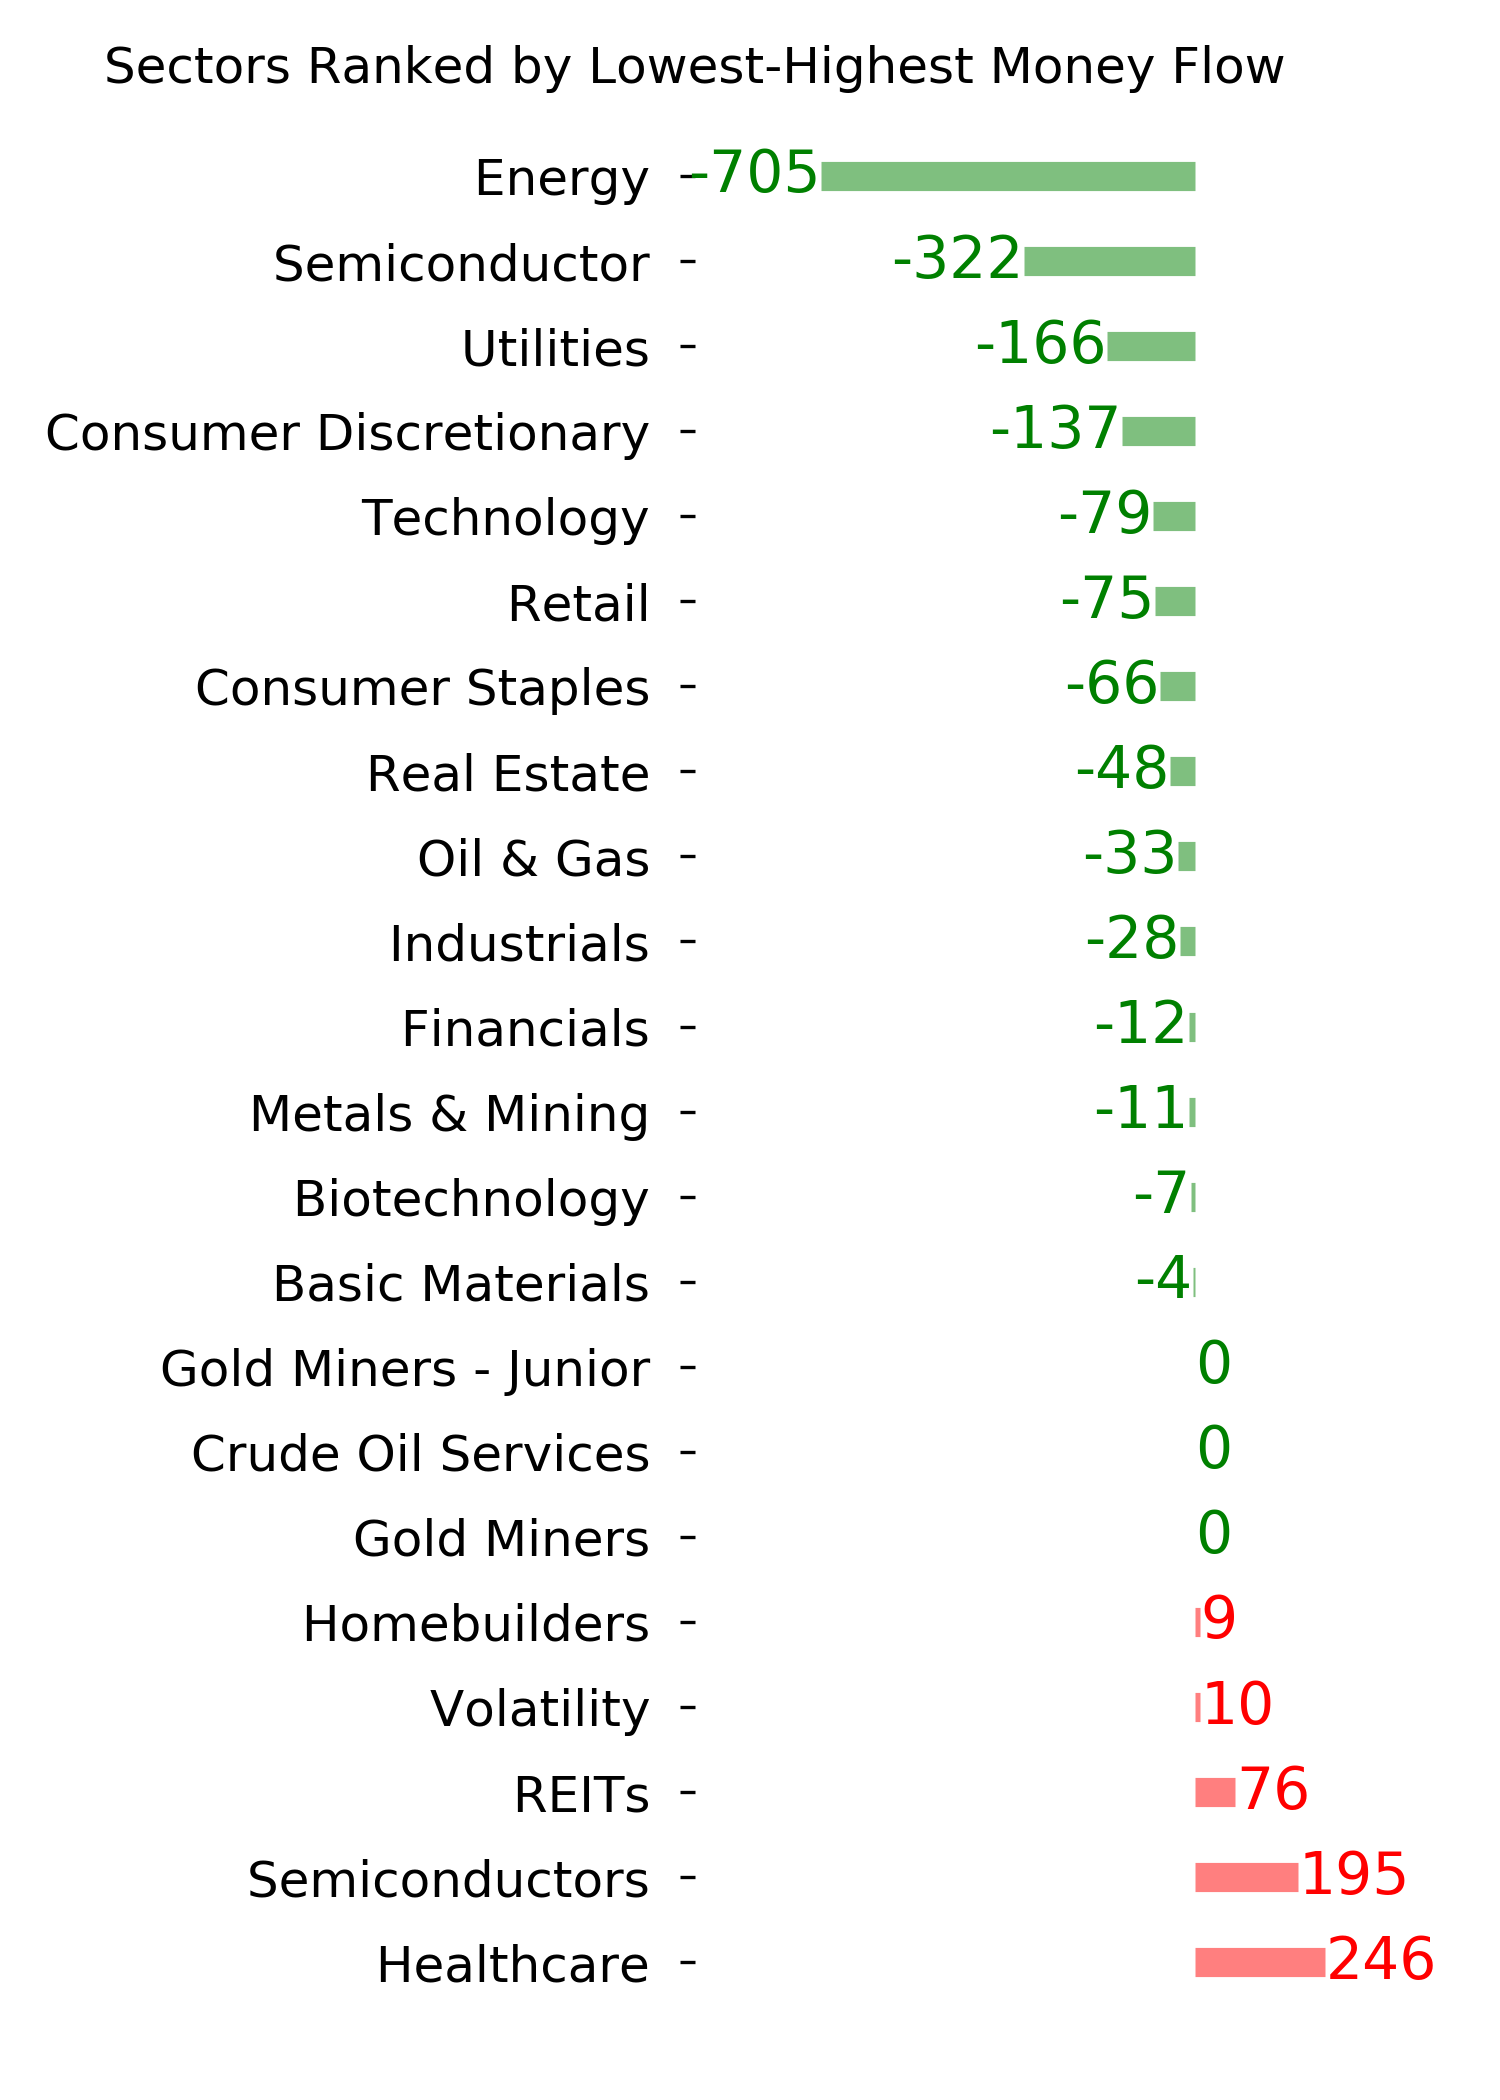
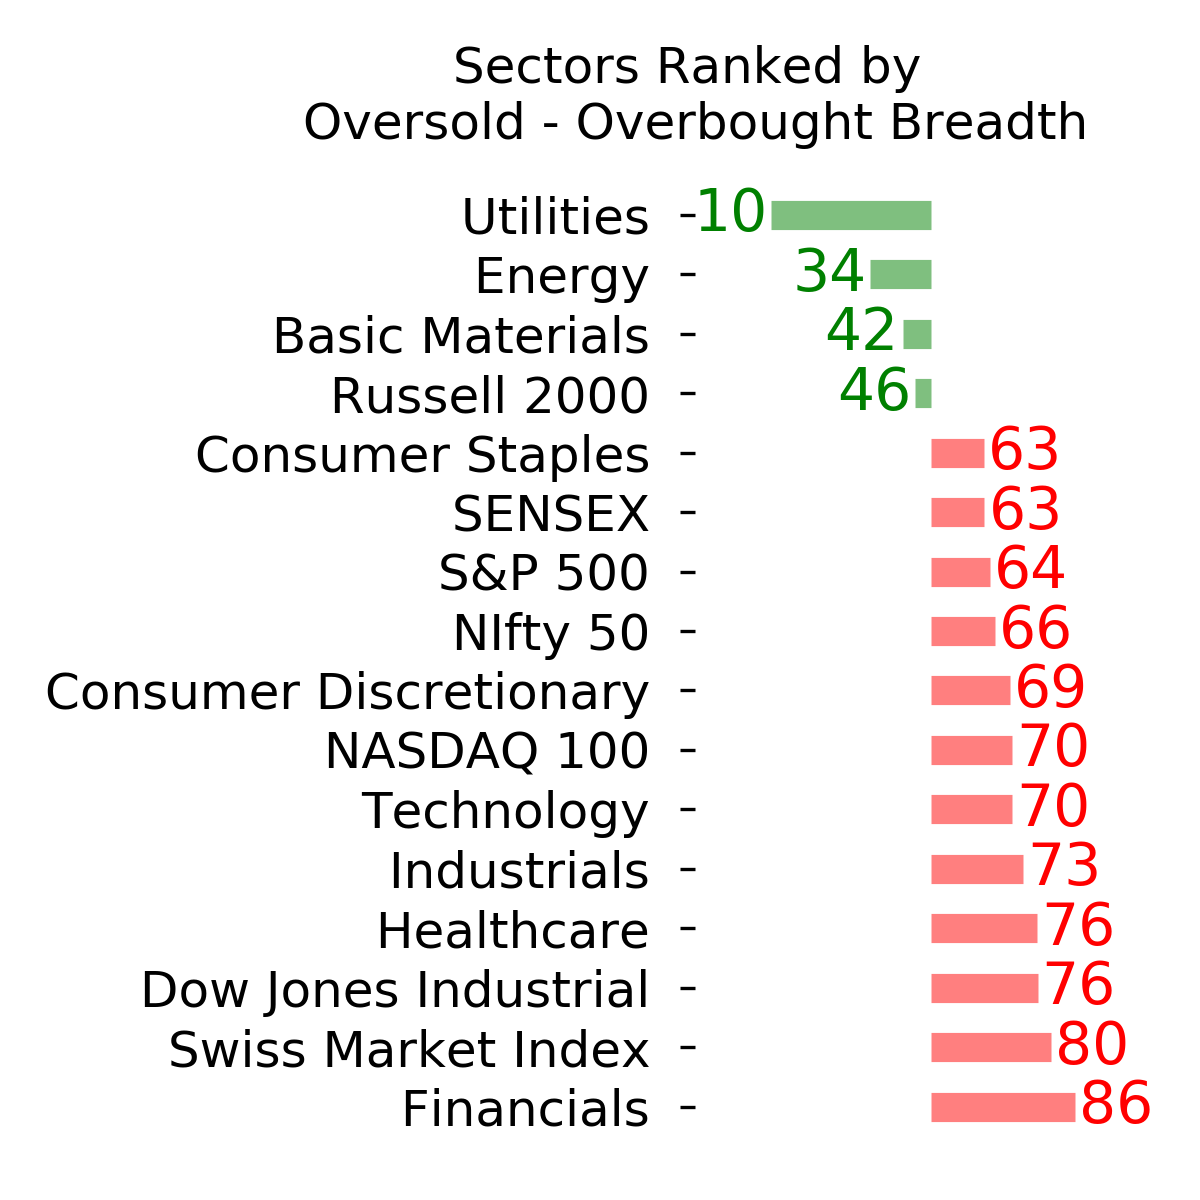
Indicators at Extremes
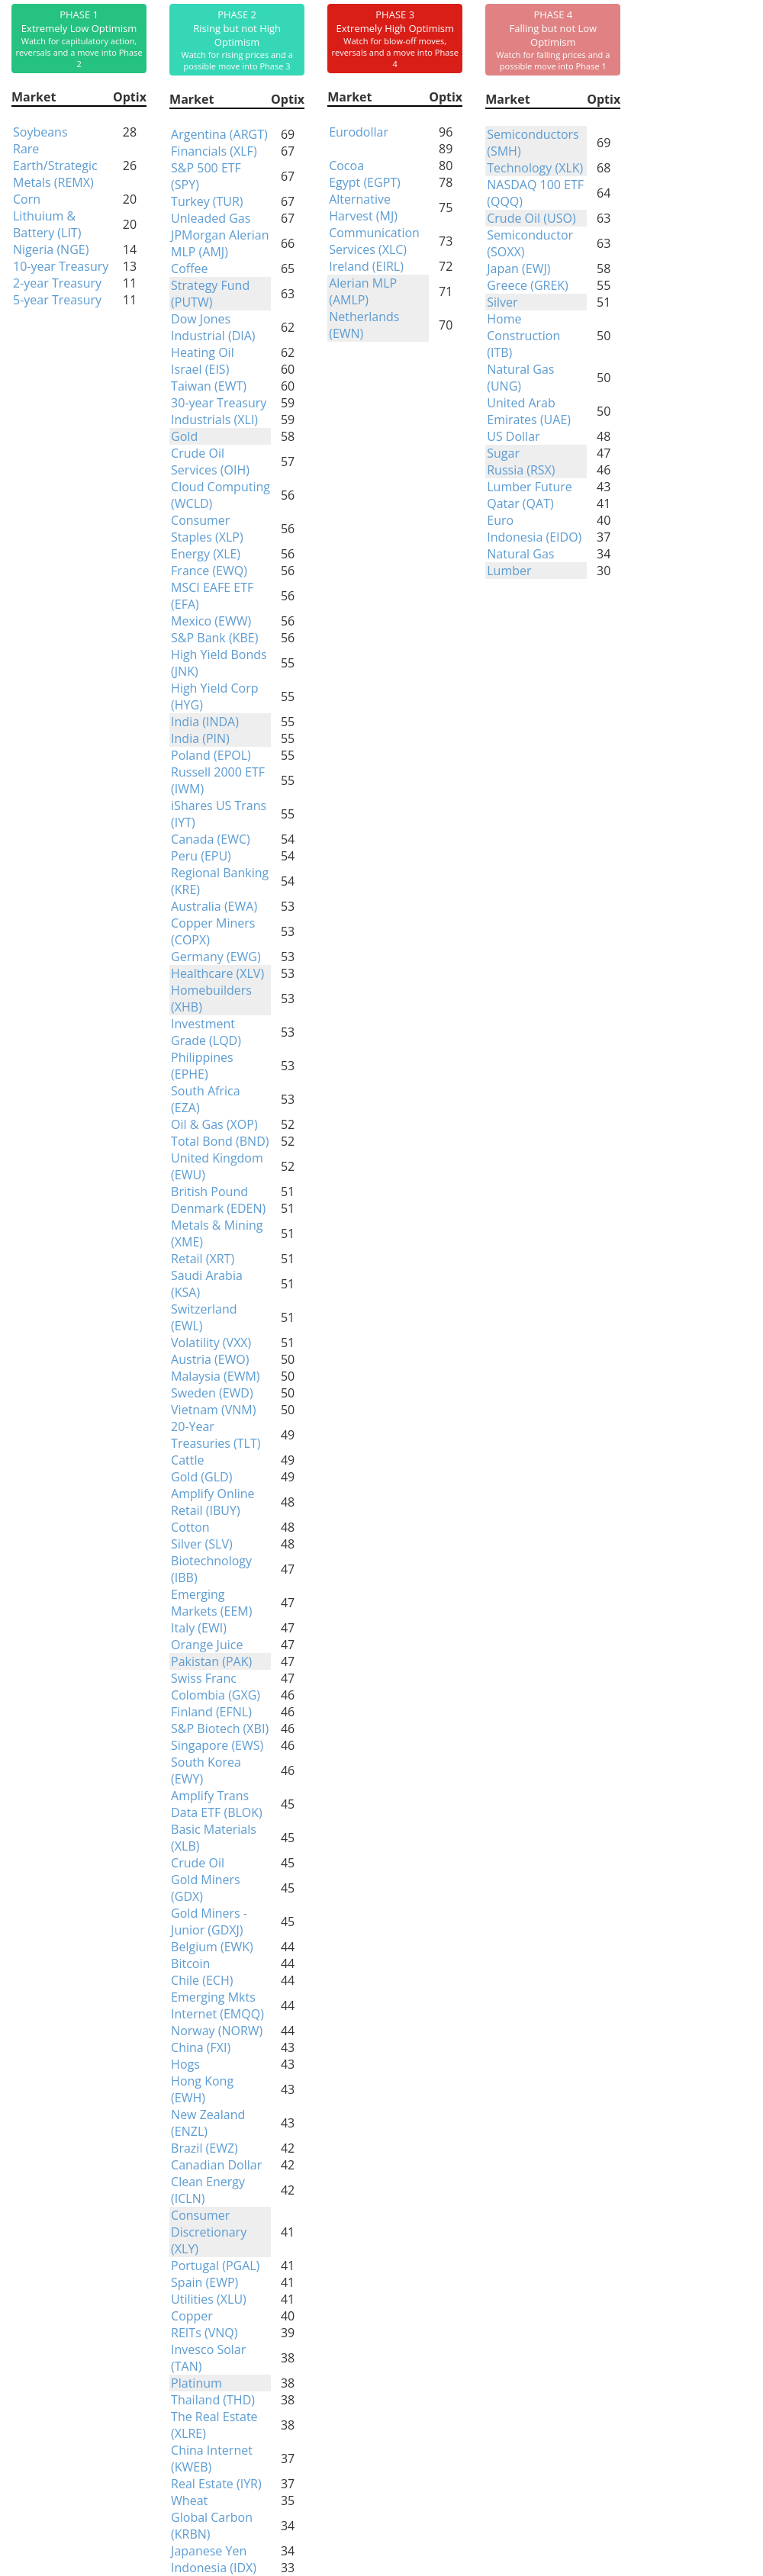
Phase Table
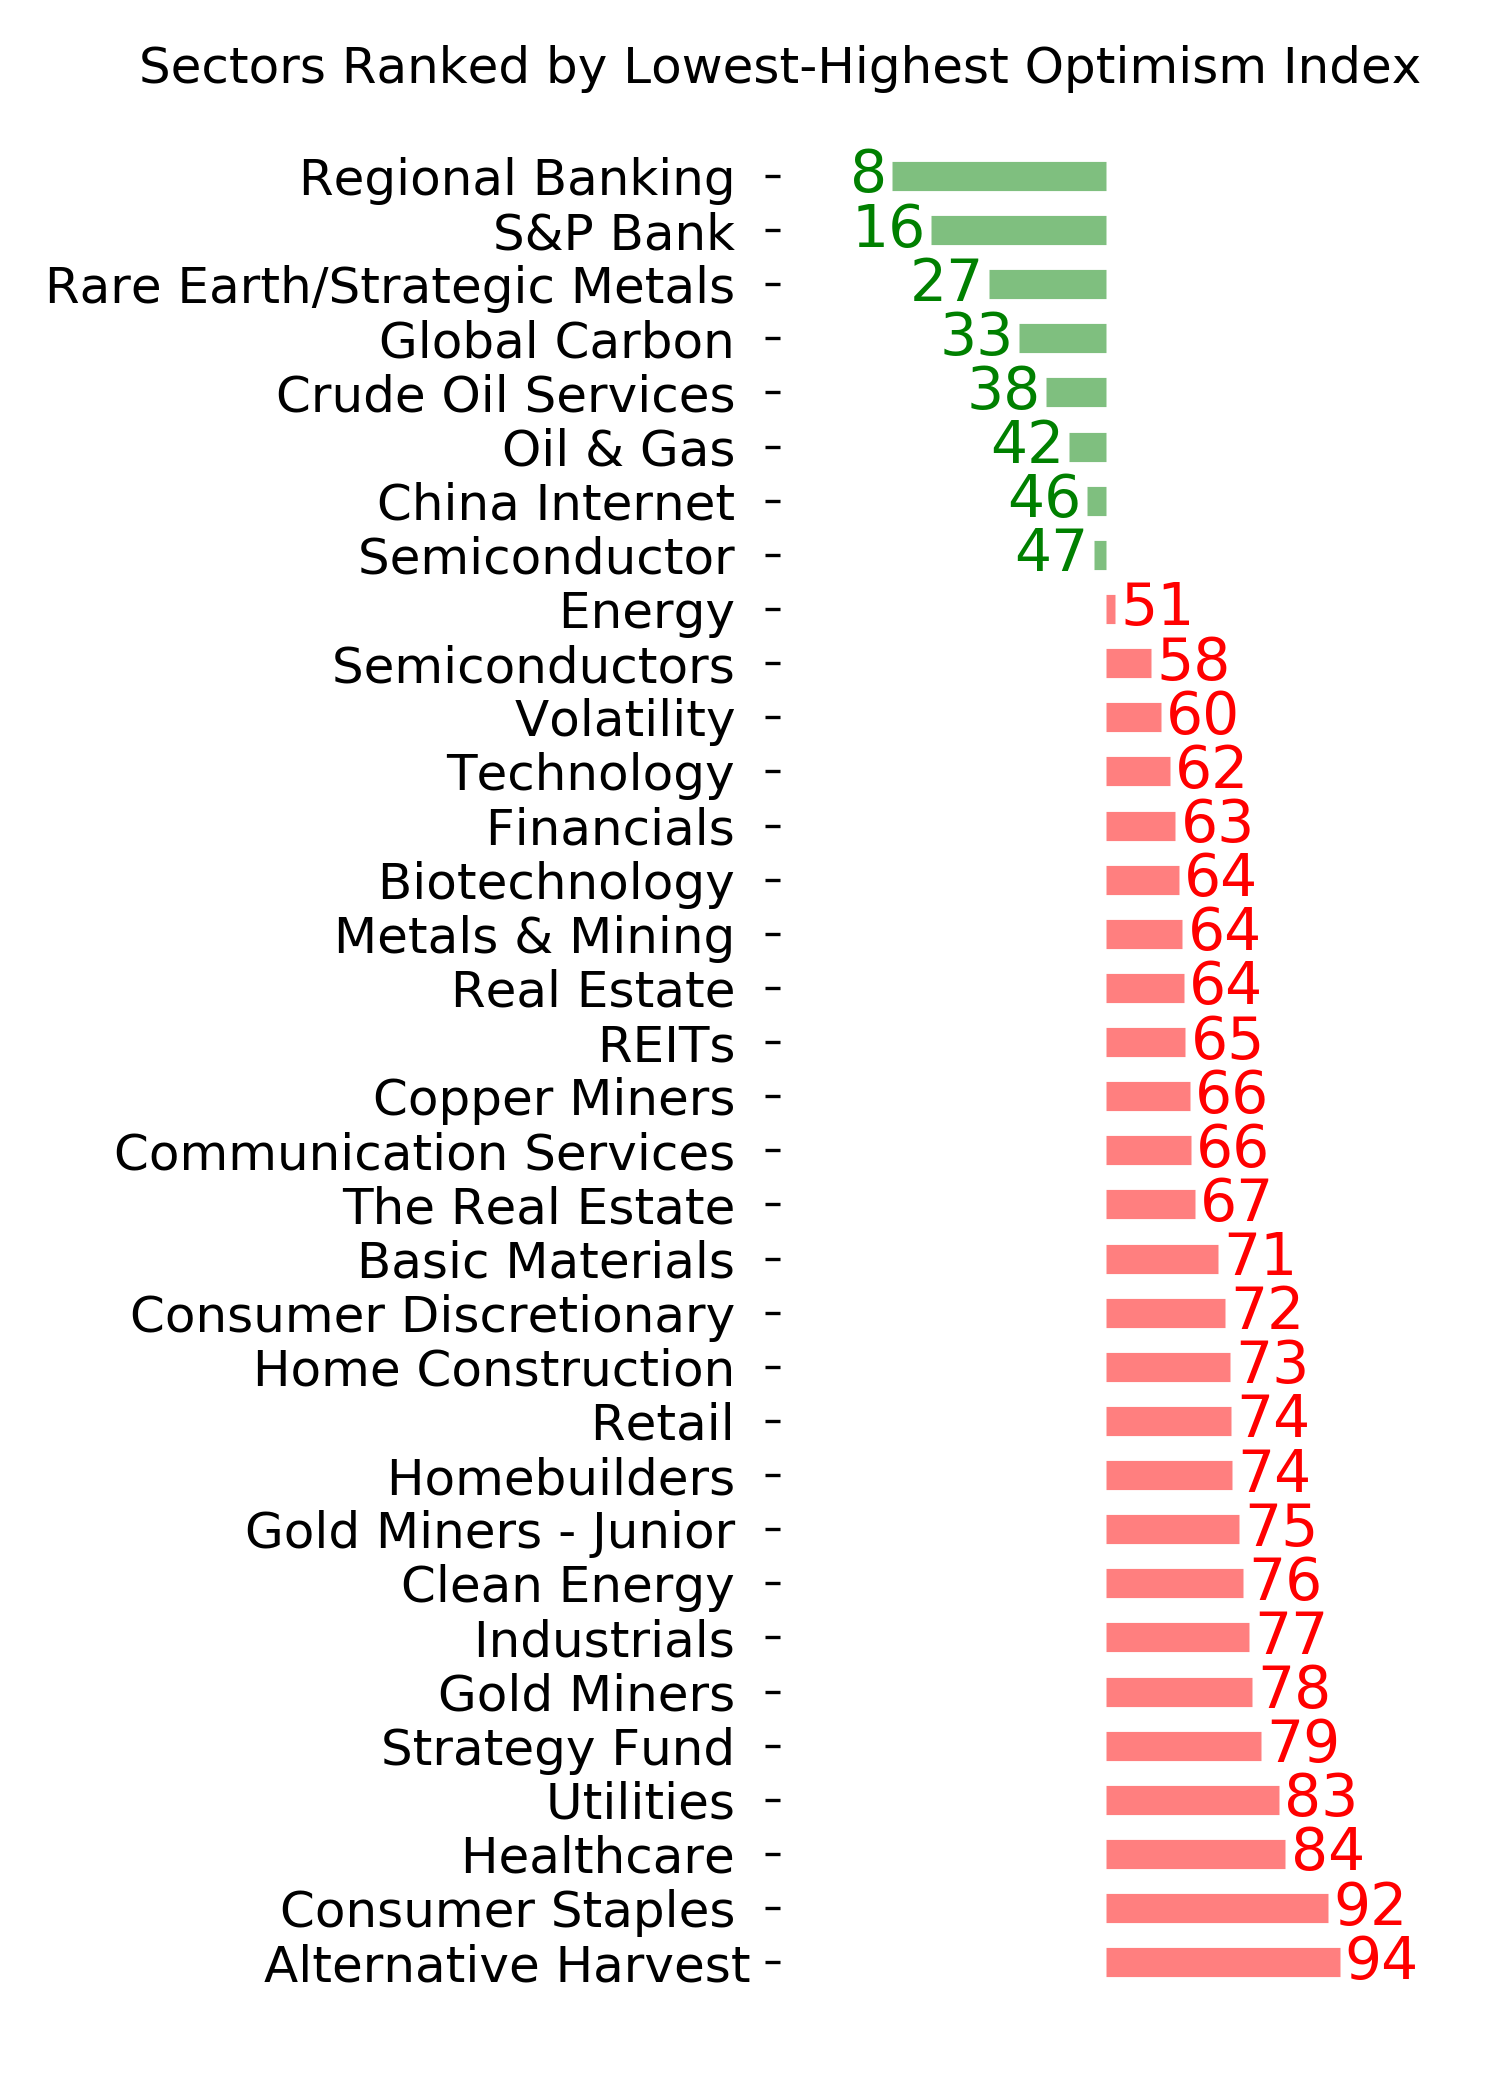
Ranks
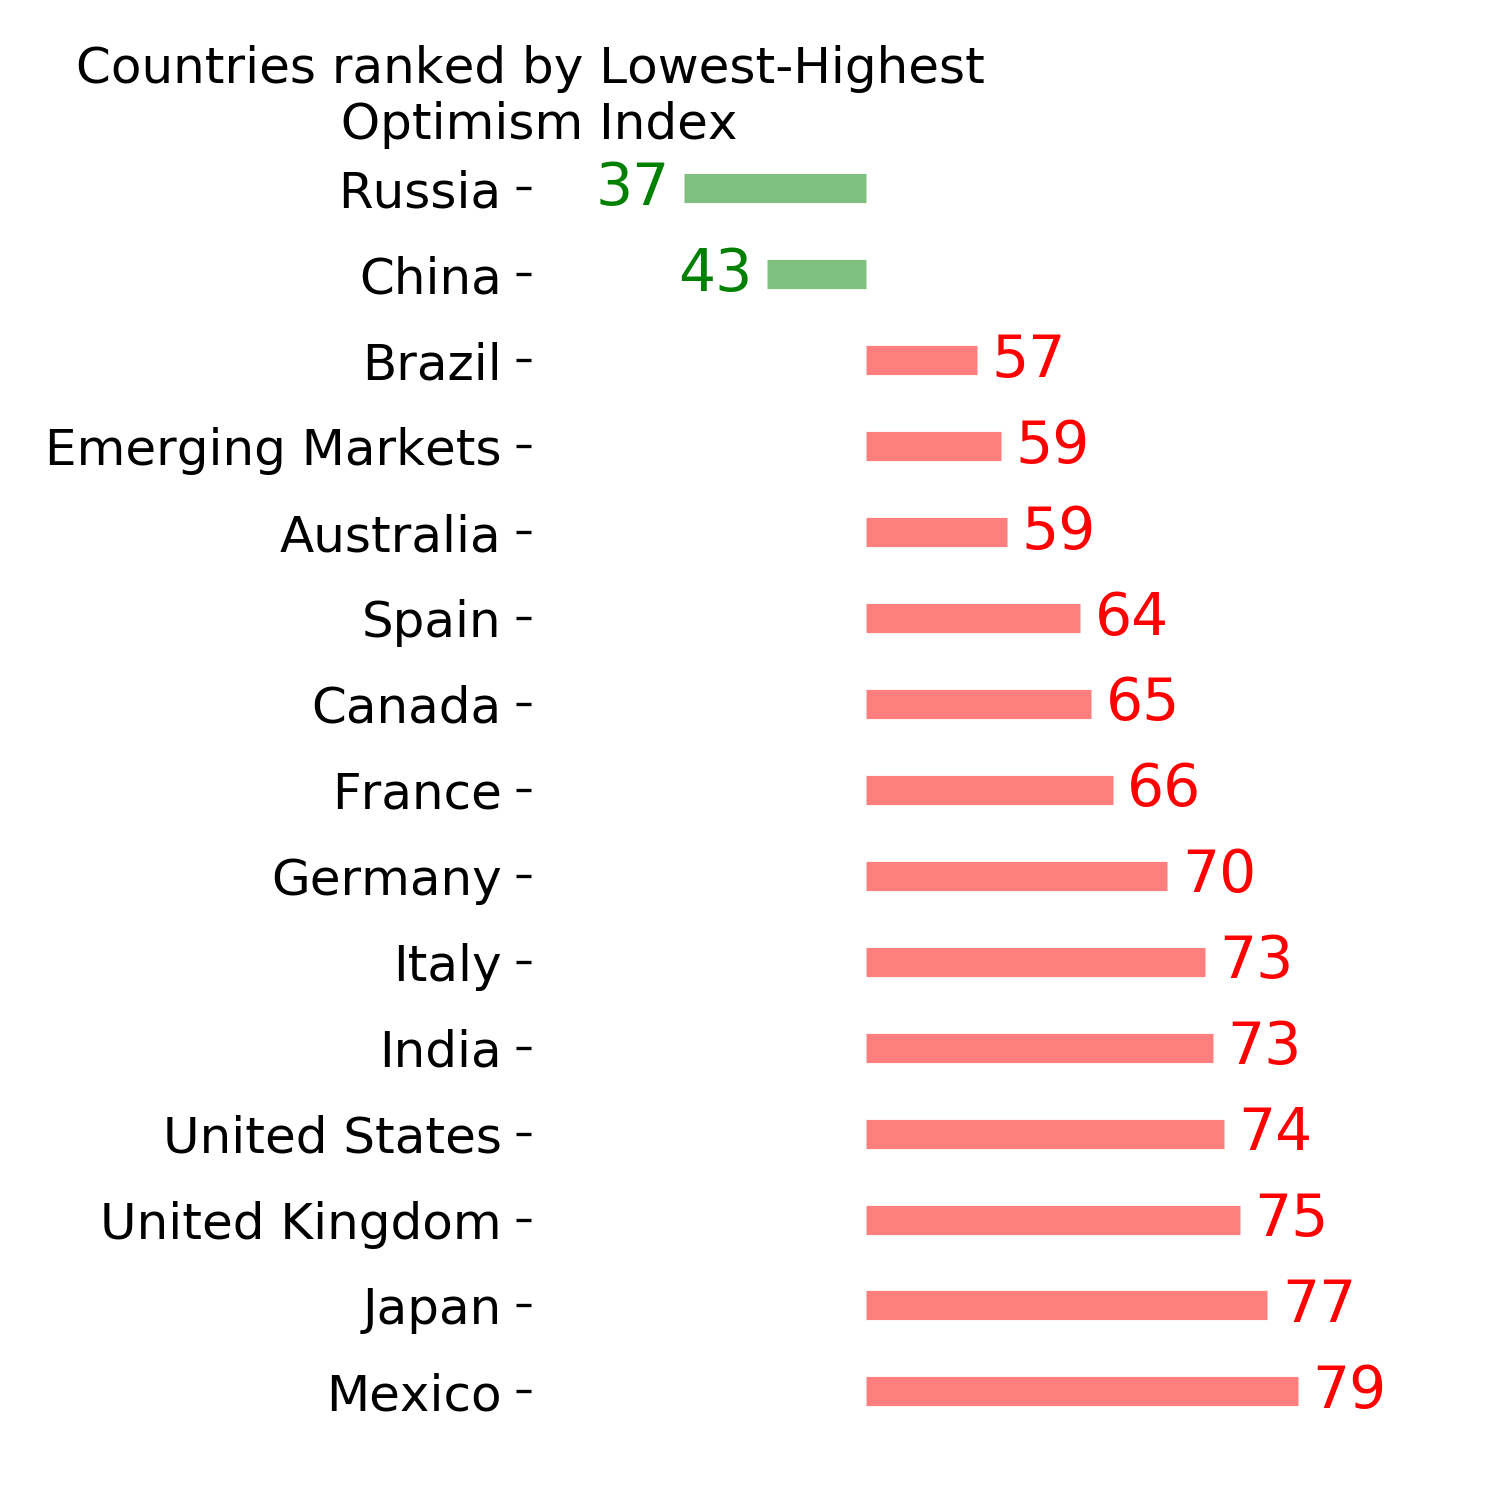
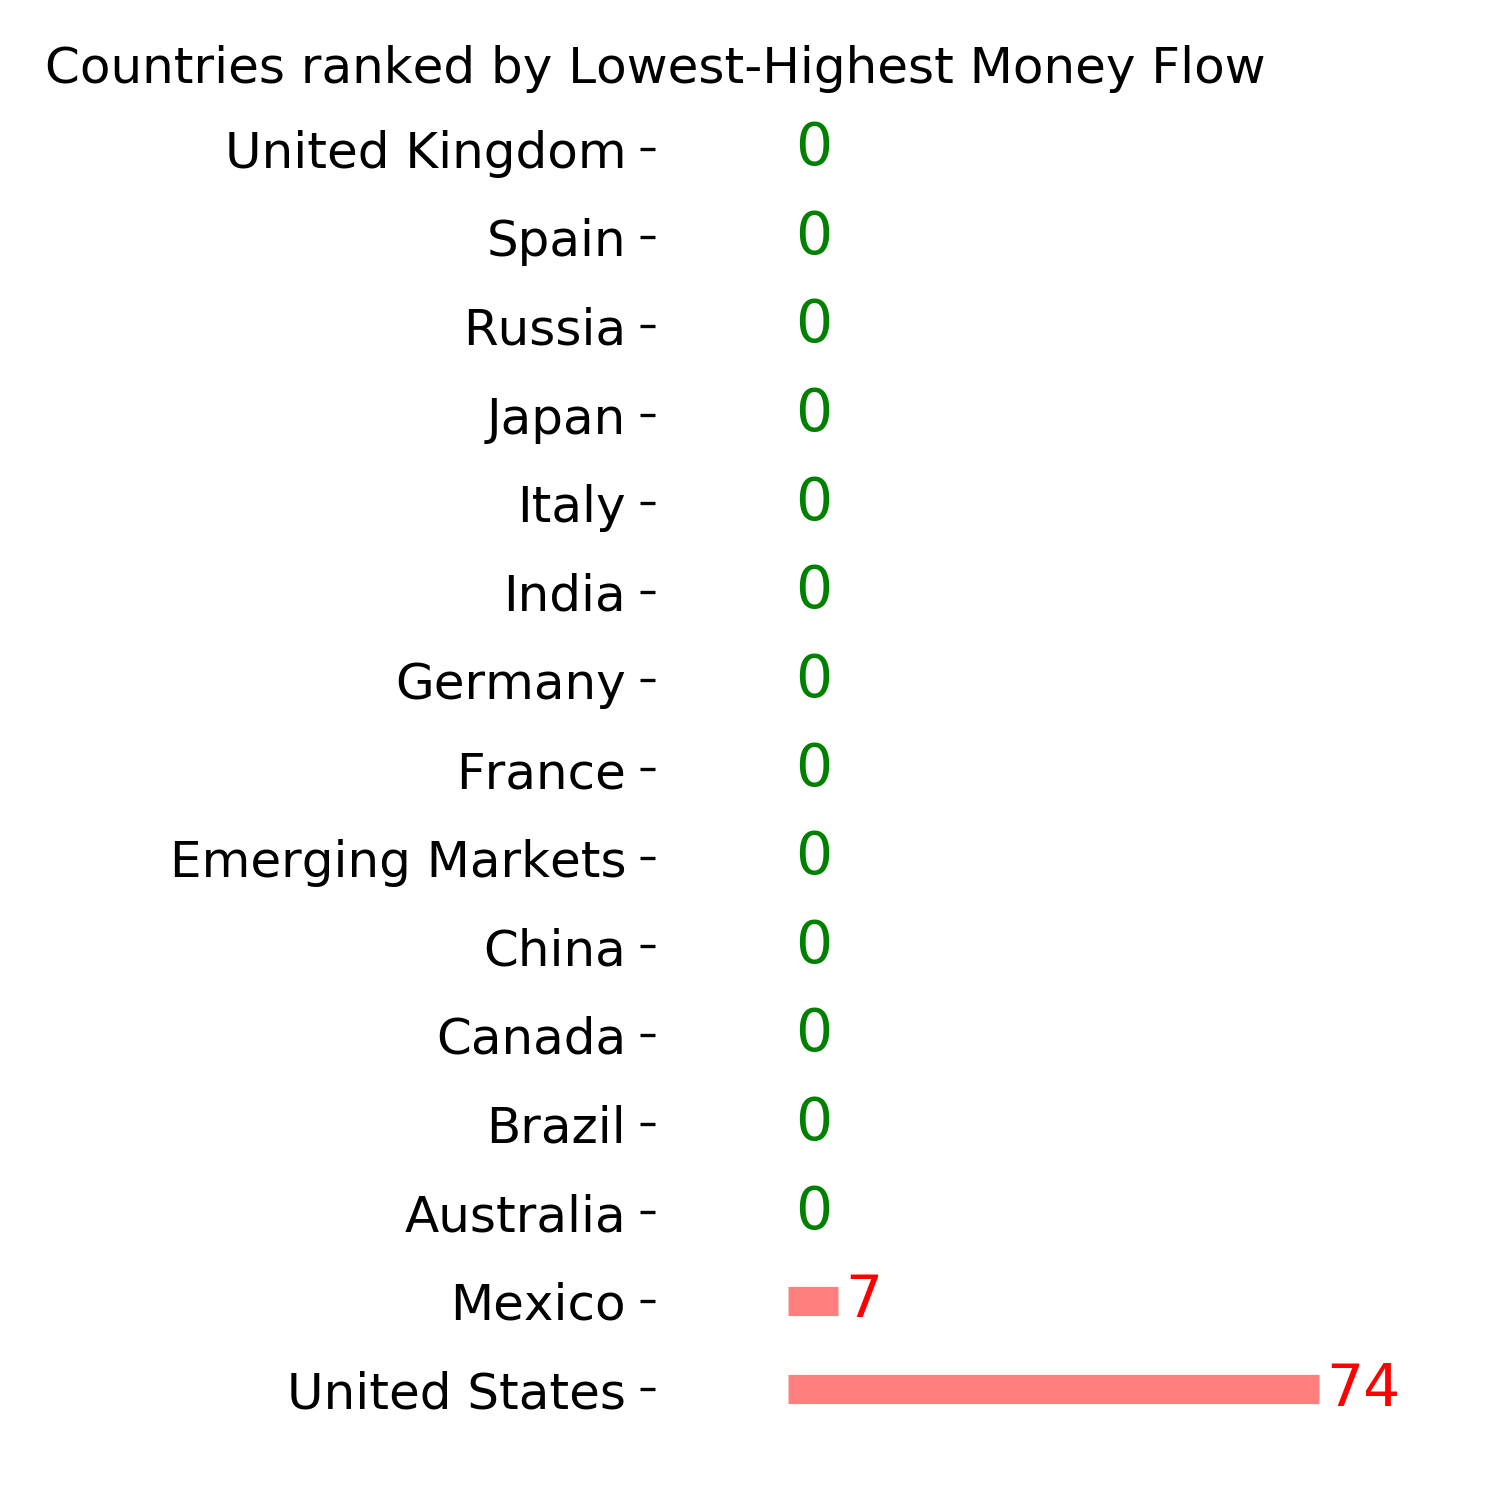
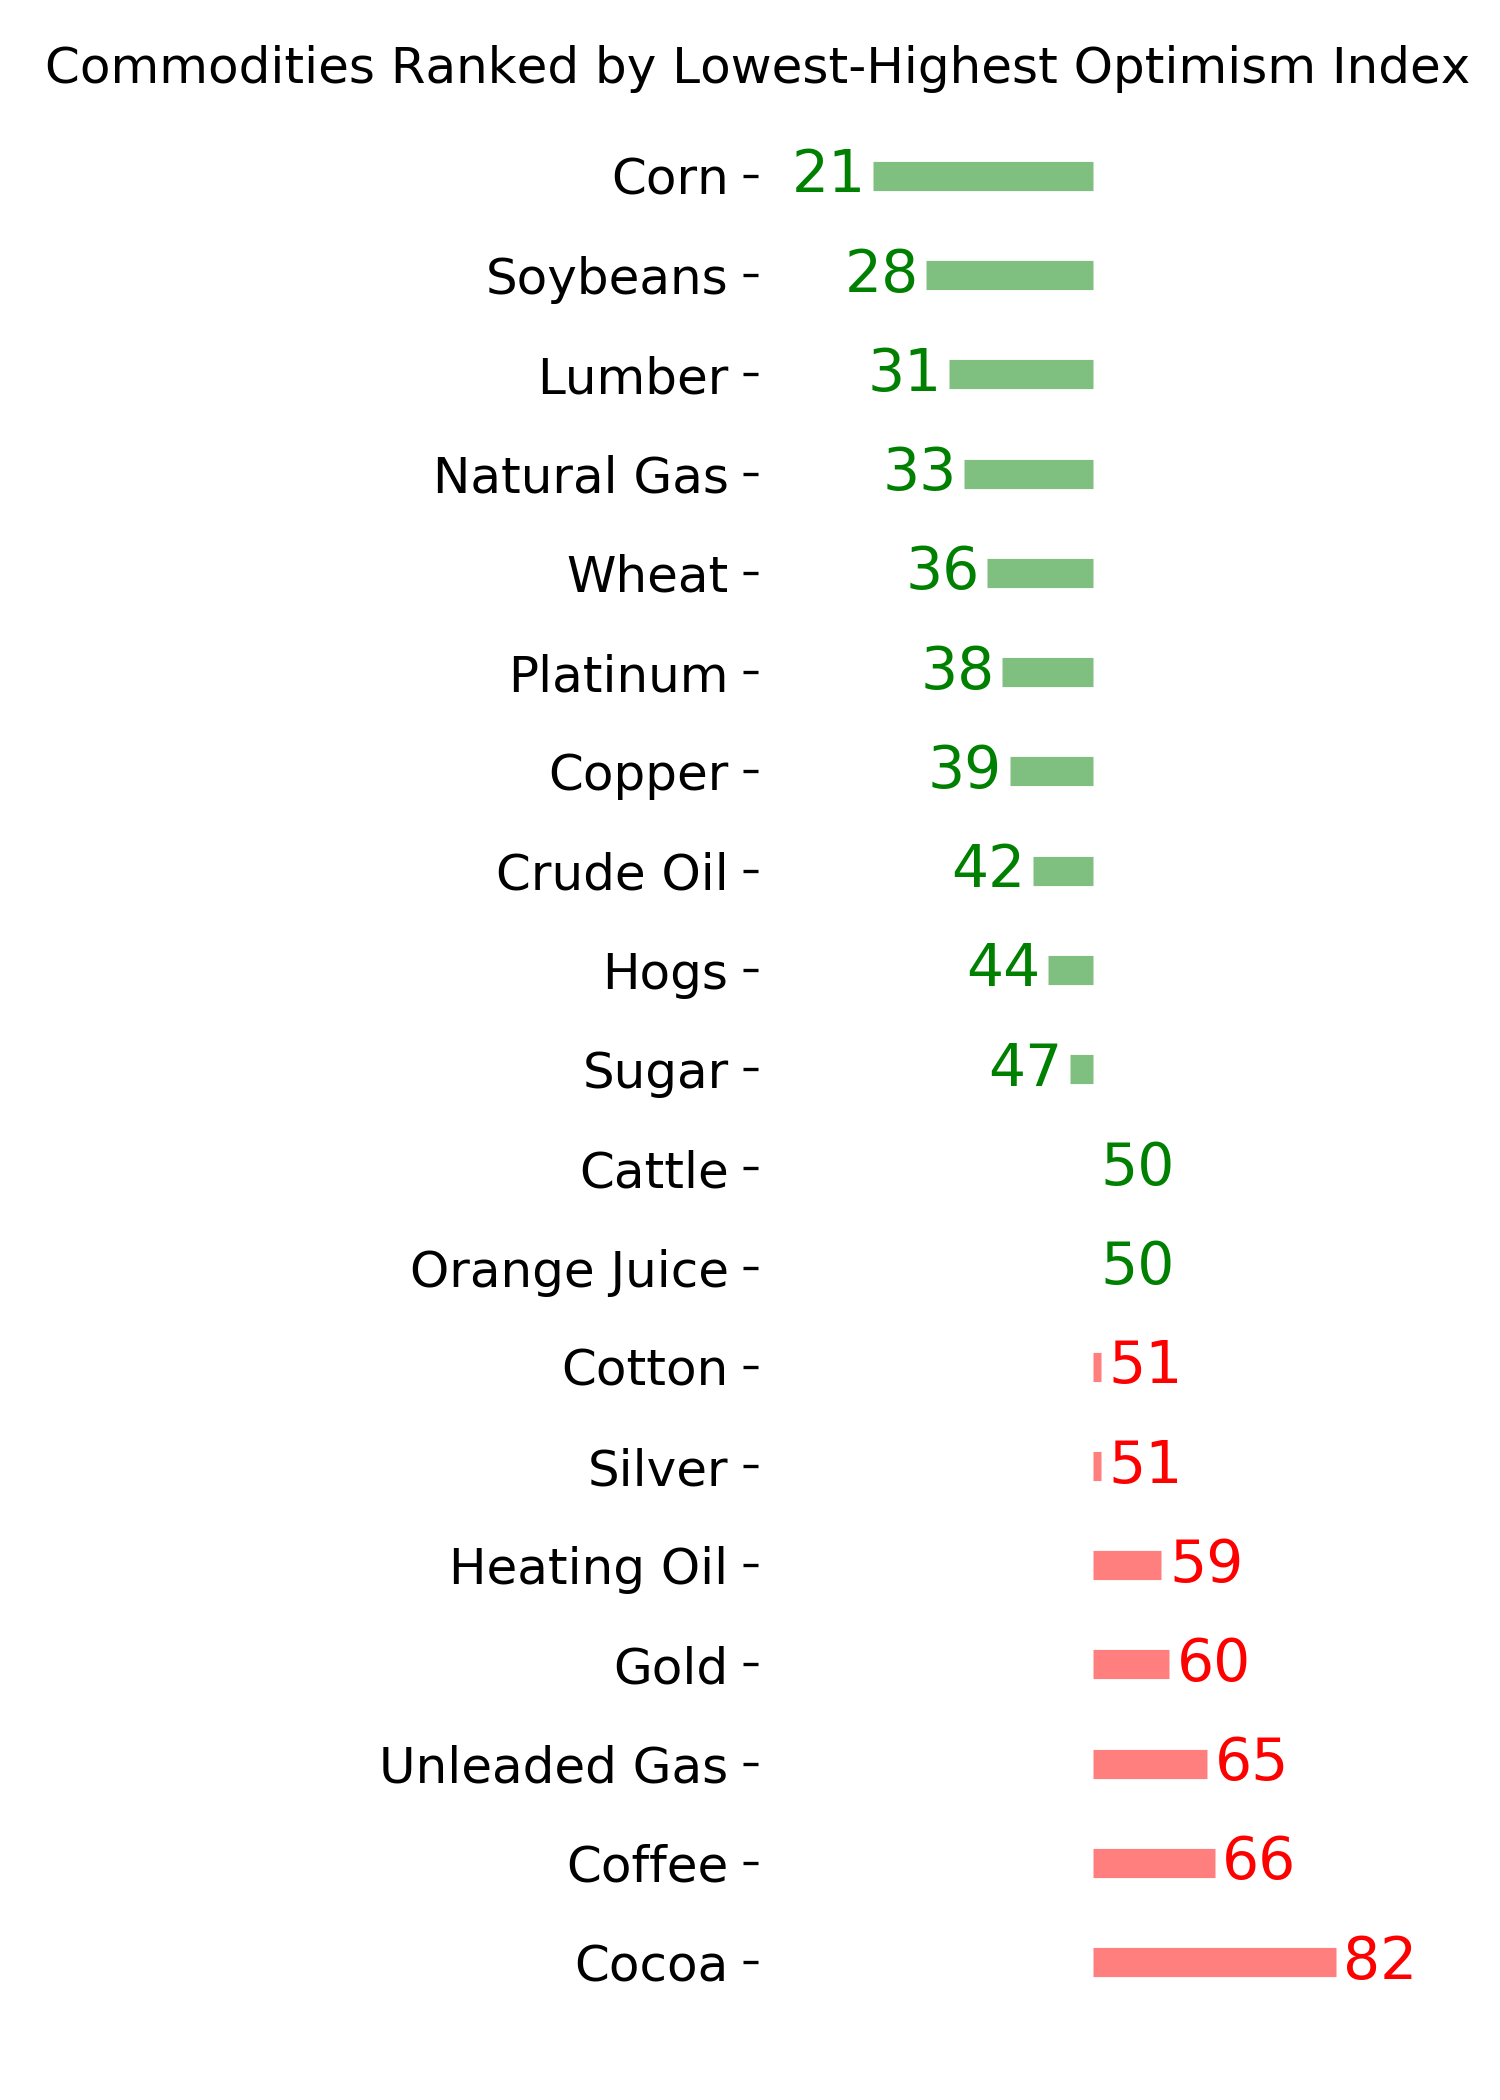
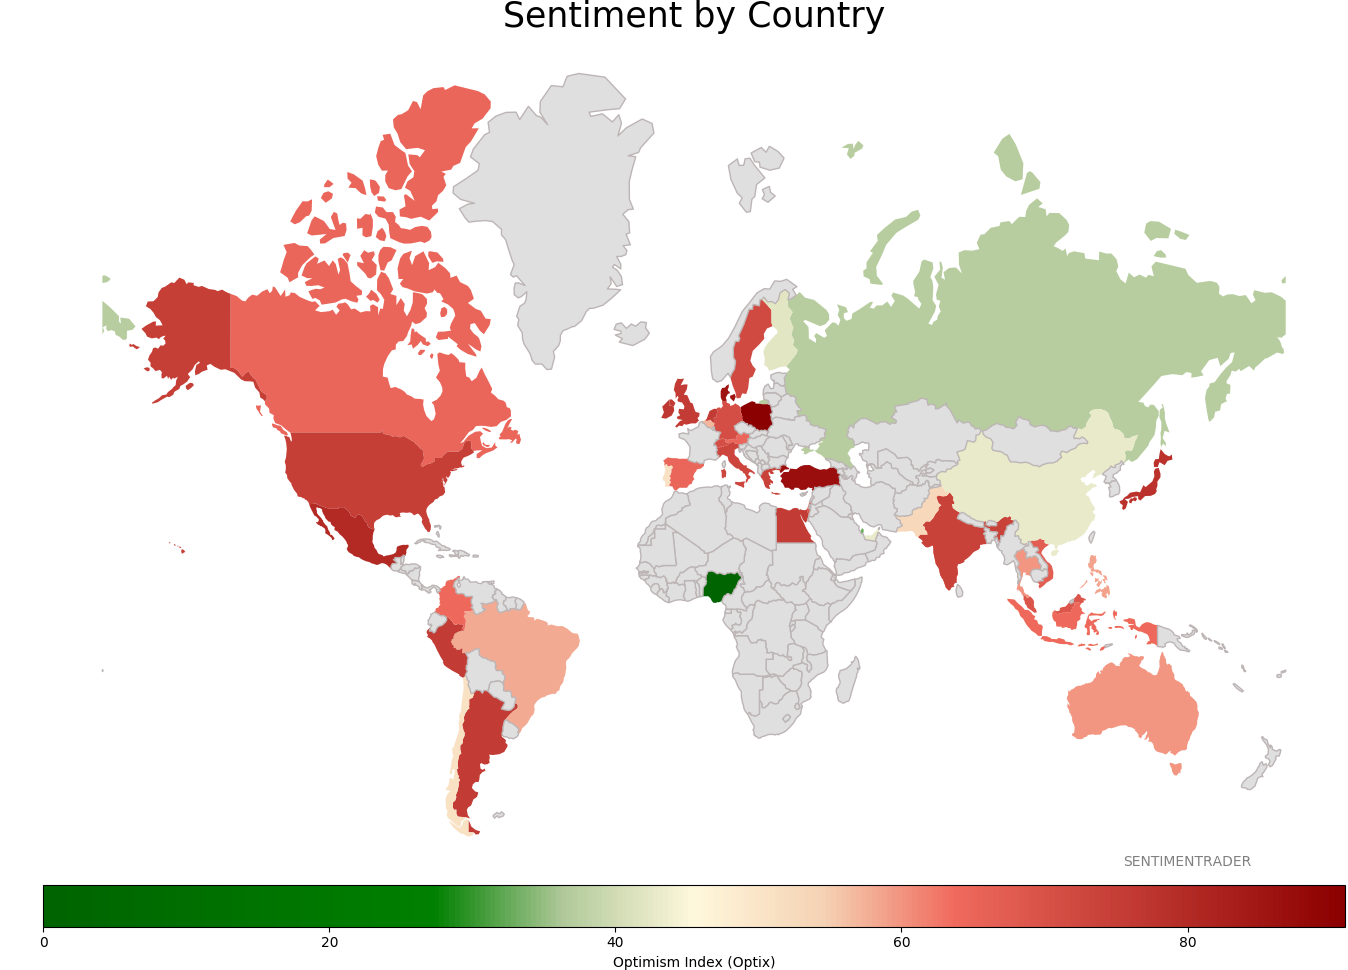
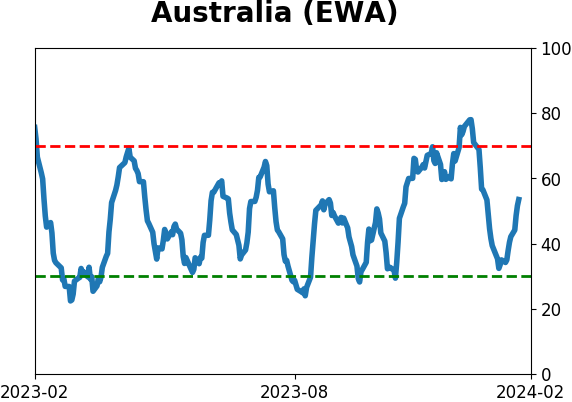
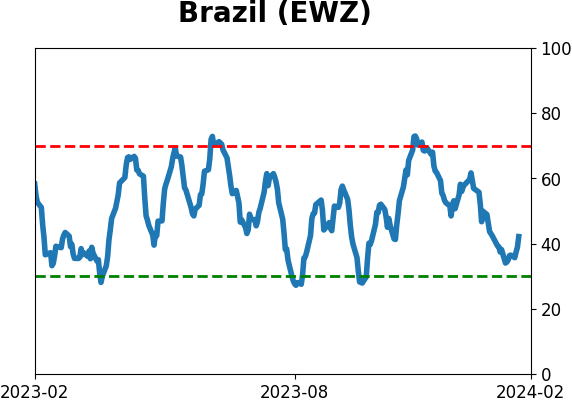
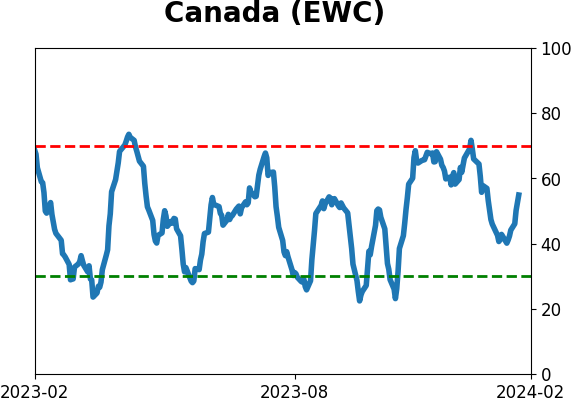
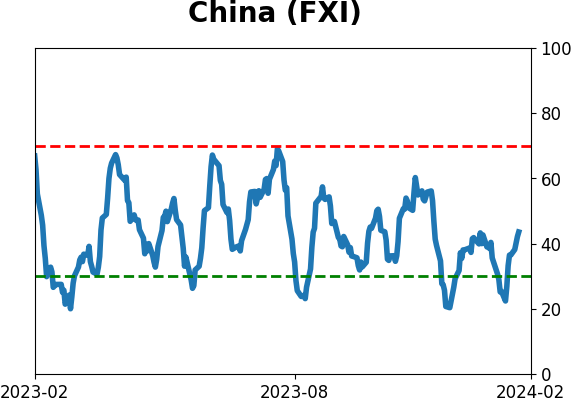
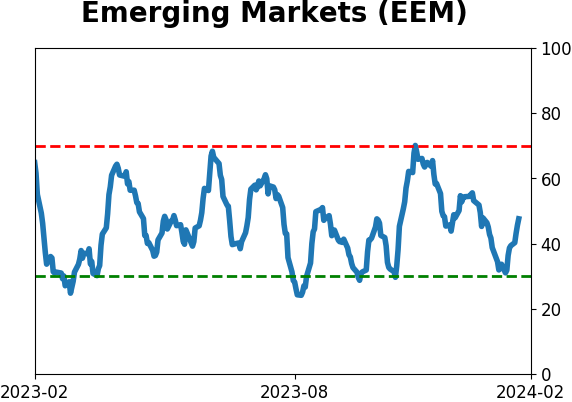
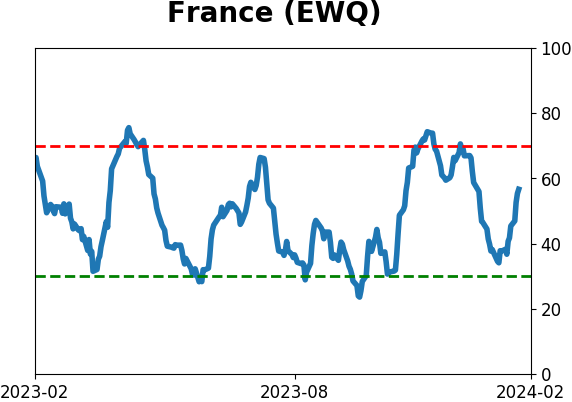
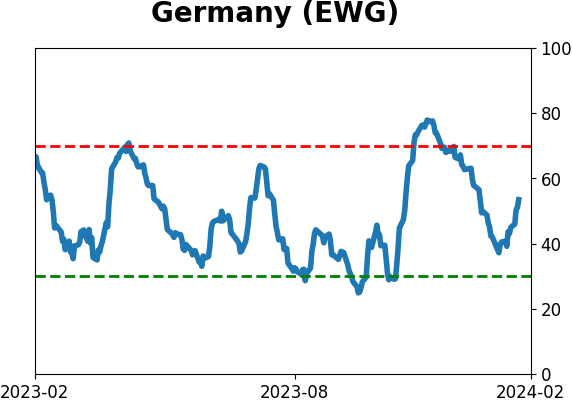
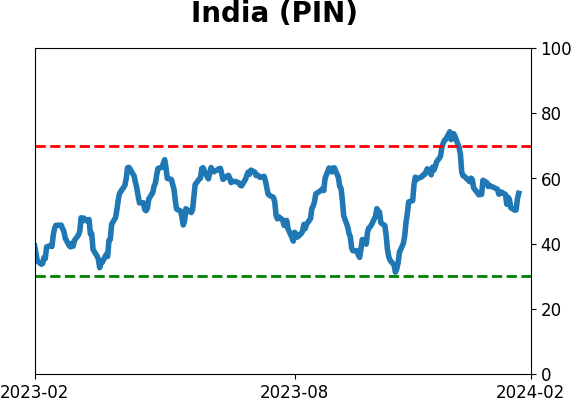
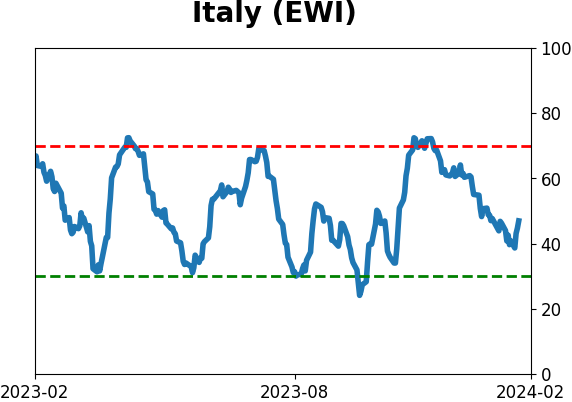
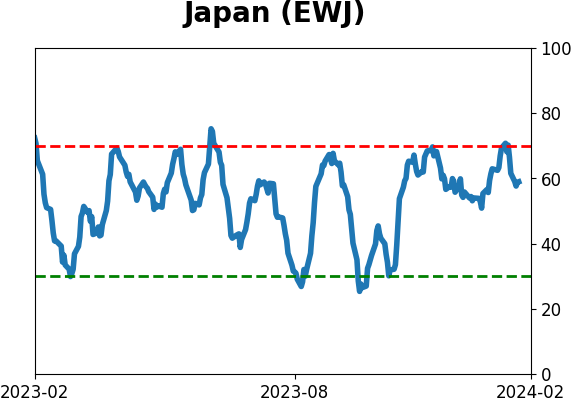
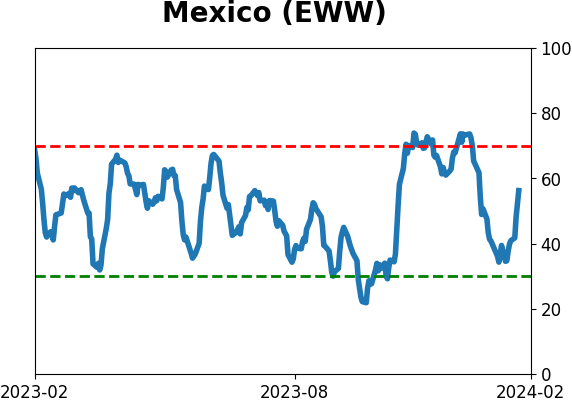
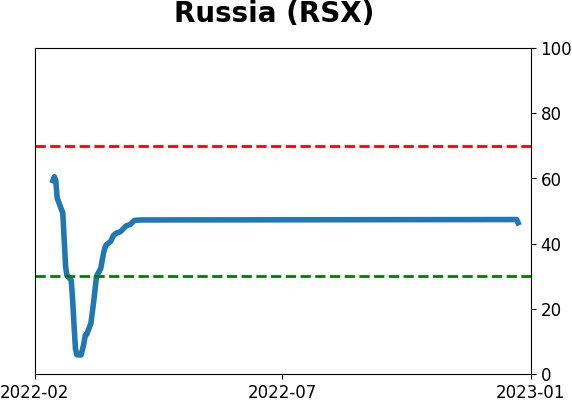
Sentiment Around The World
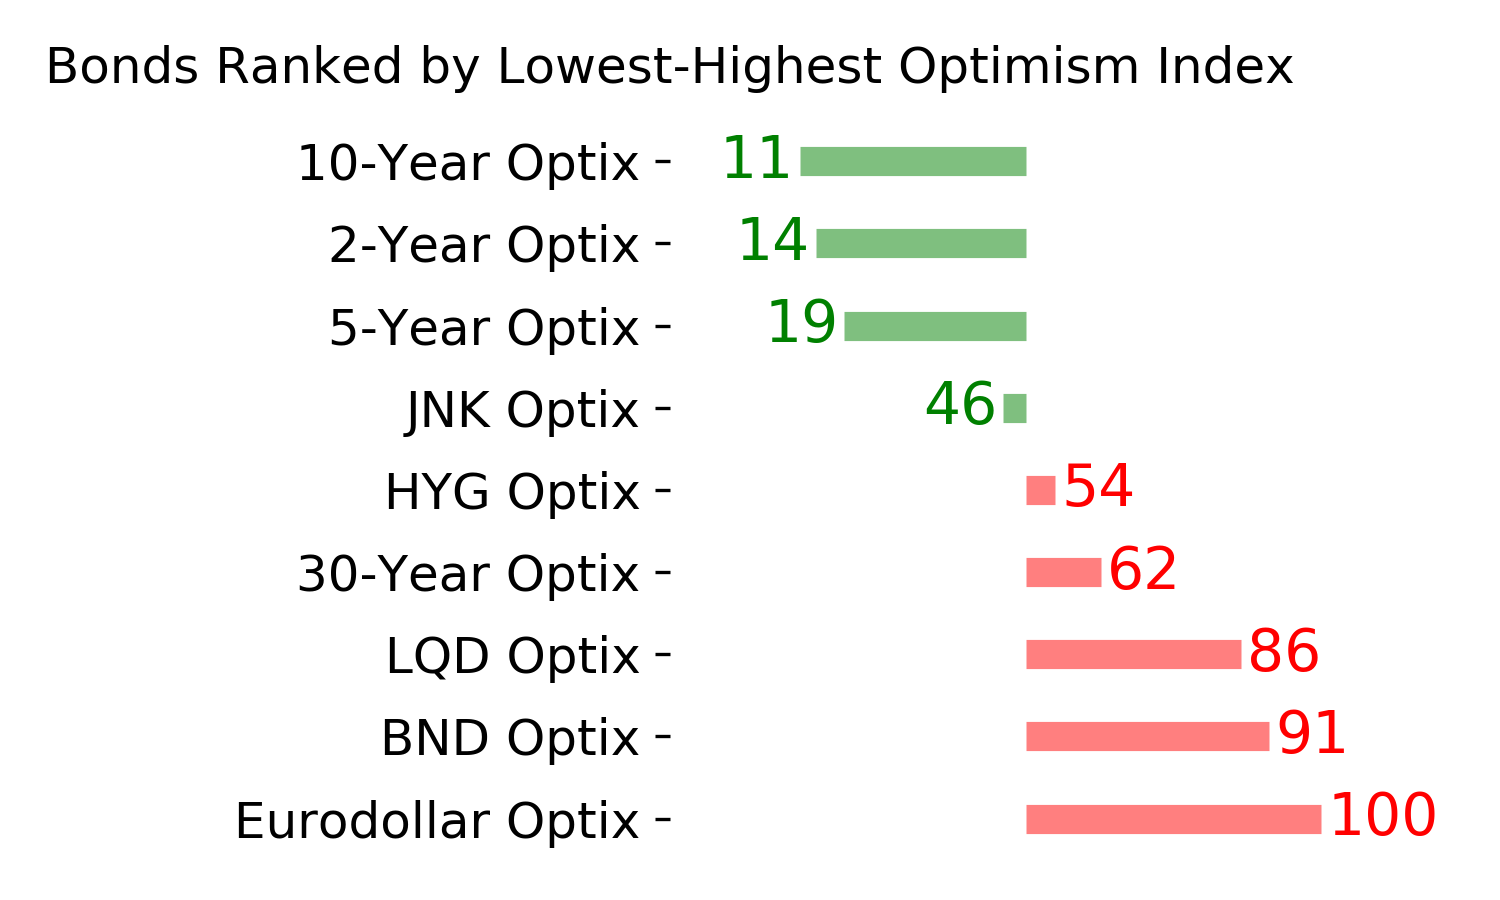
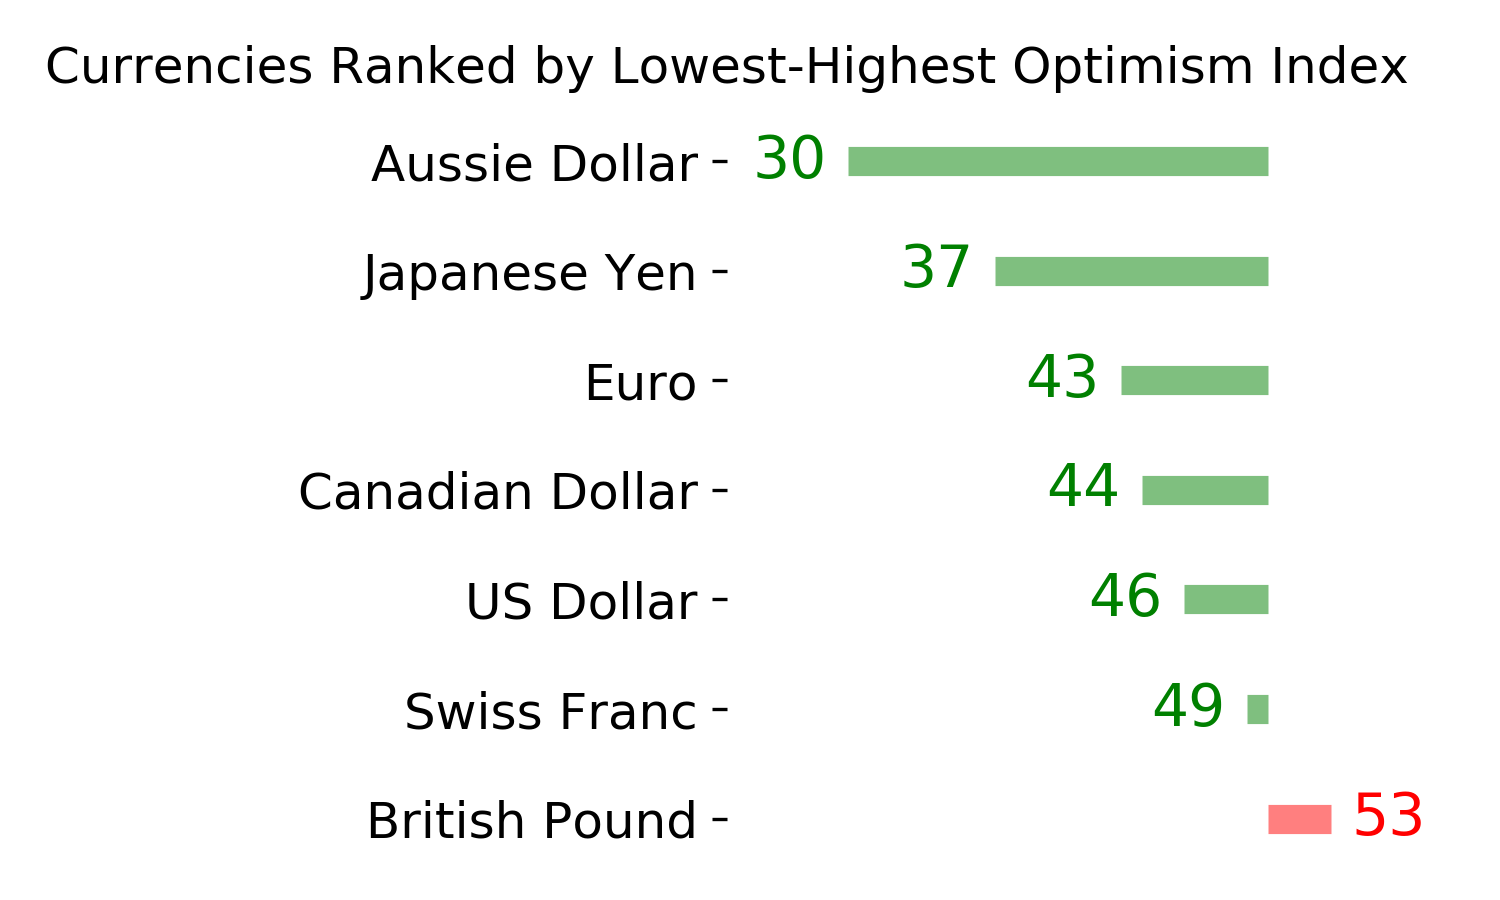
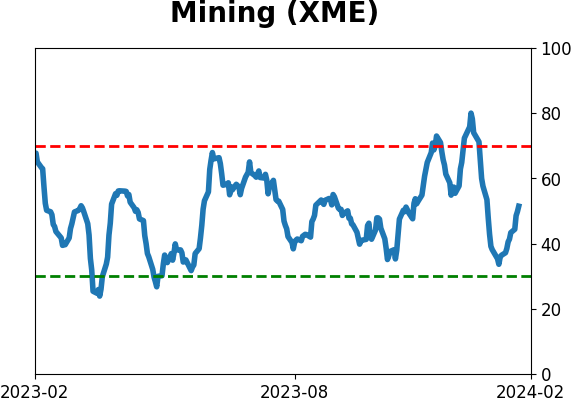
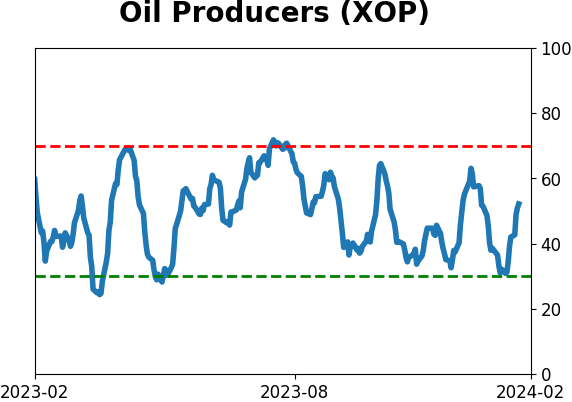
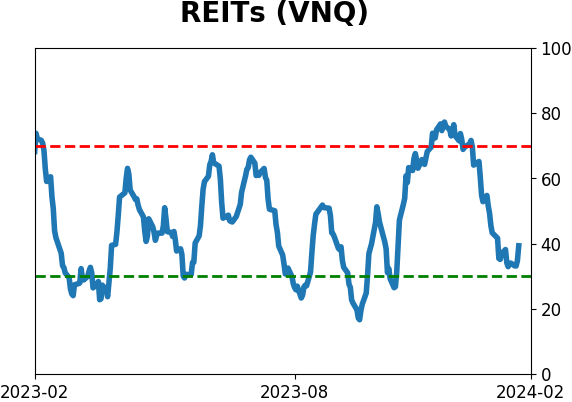
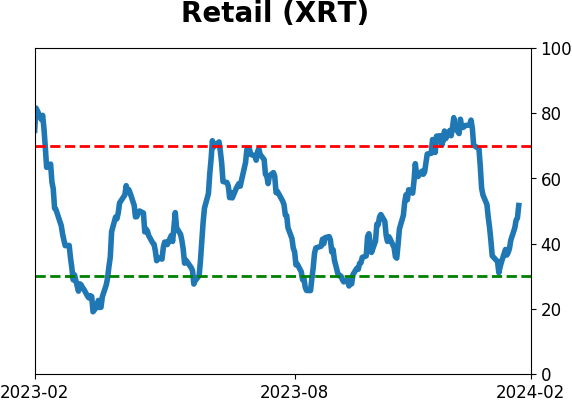
Optimism Index Thumbnails
|
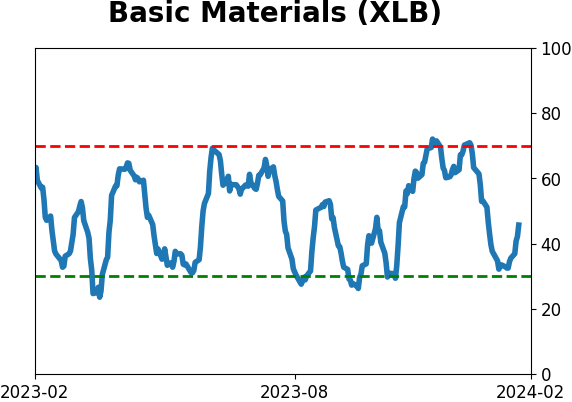
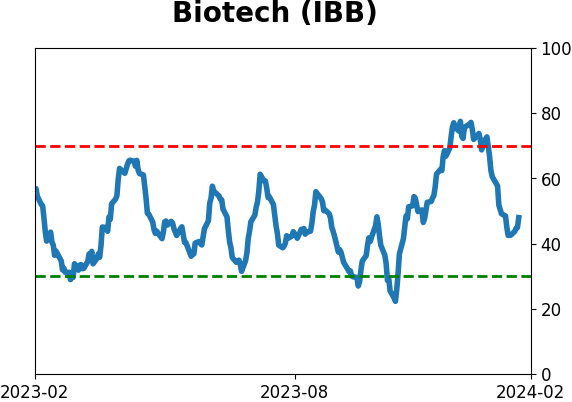
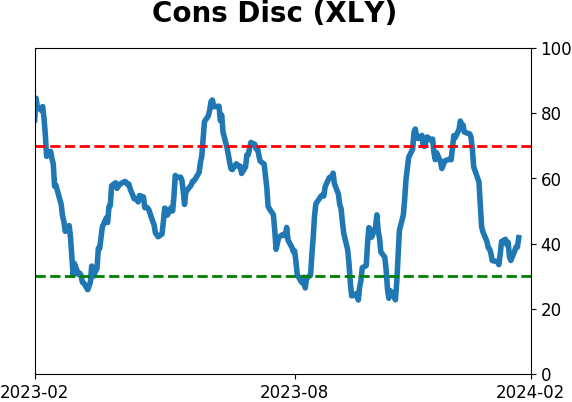
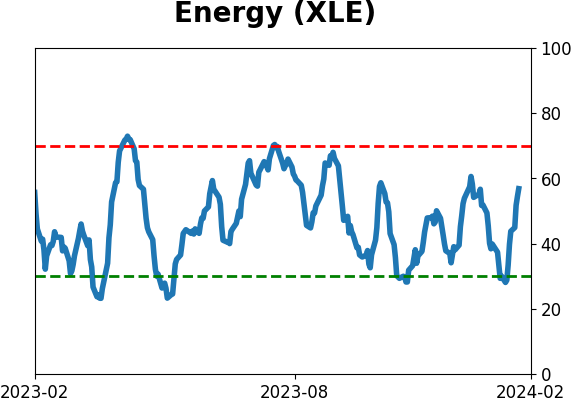
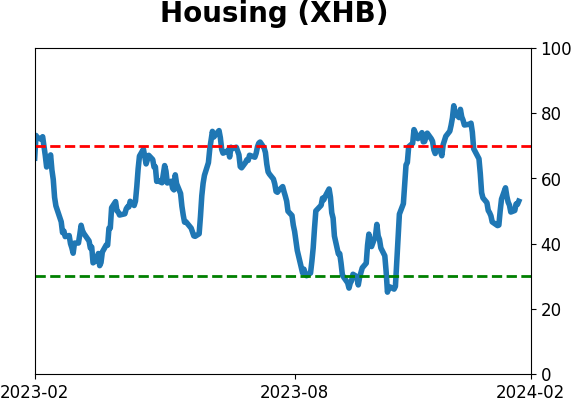
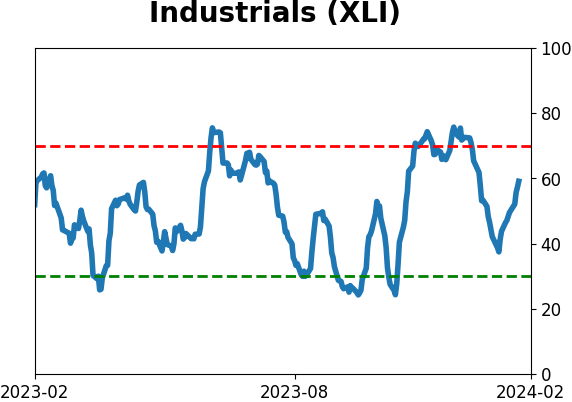
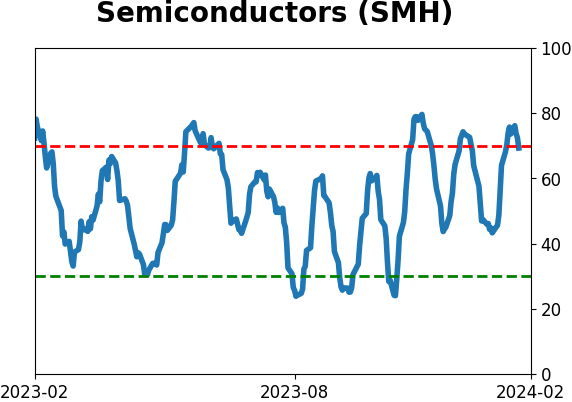
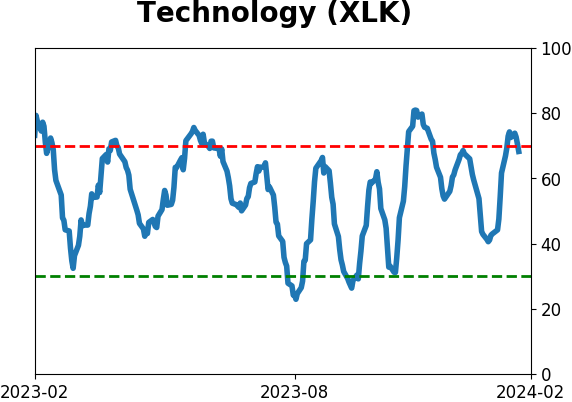
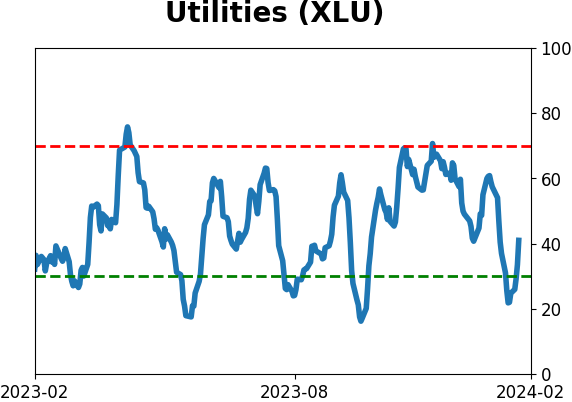
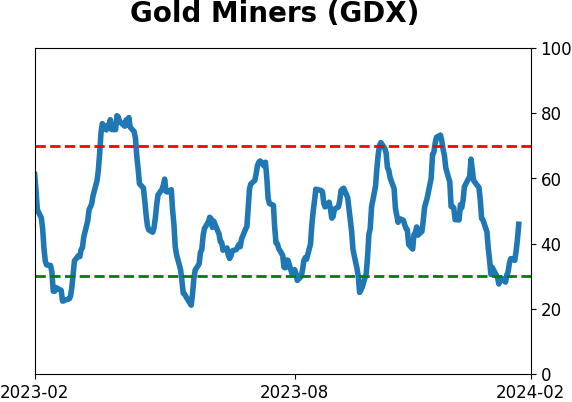
Sector ETF's - 10-Day Moving Average
|
|
|
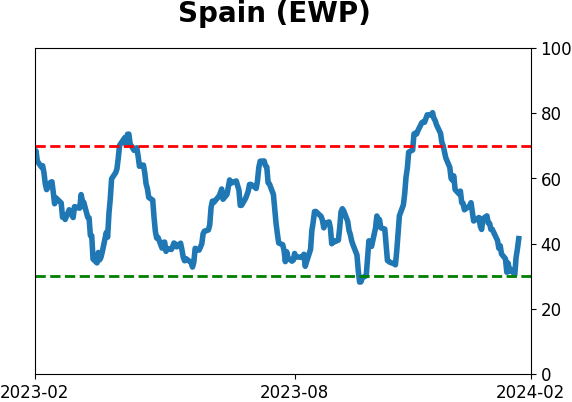
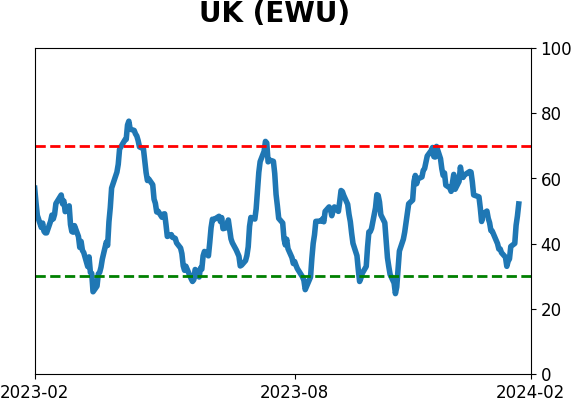
Country ETF's - 10-Day Moving Average
|
|
|
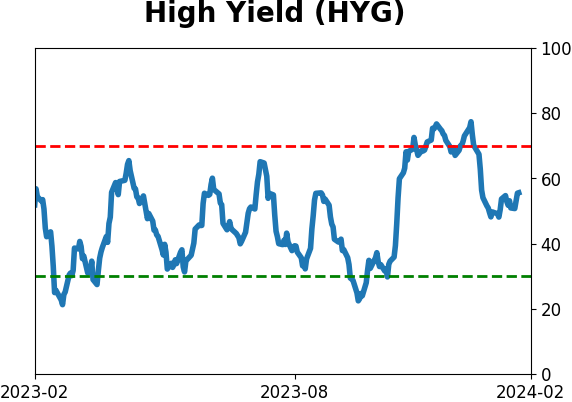
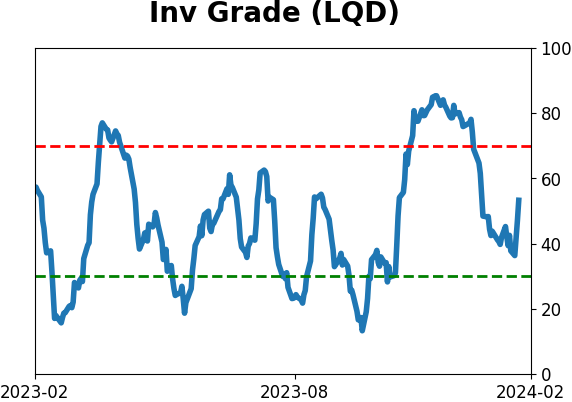
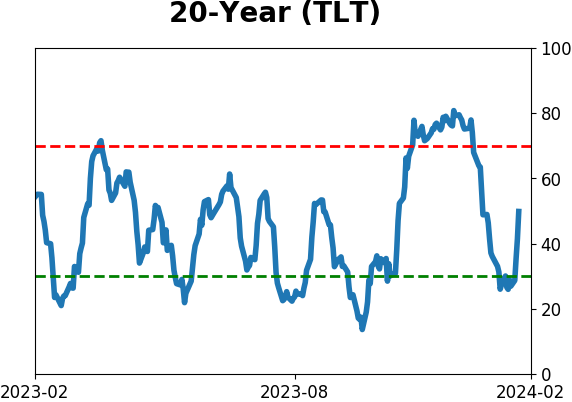
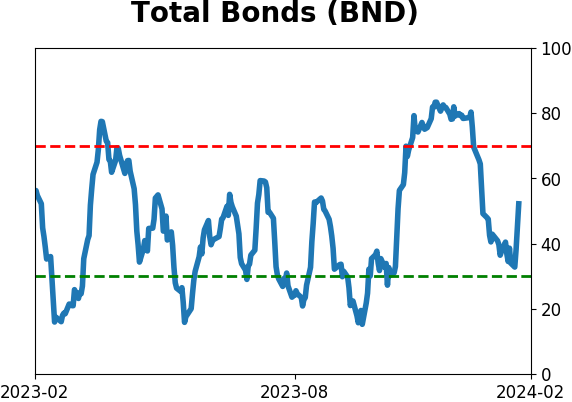
Bond ETF's - 10-Day Moving Average
|
|
|
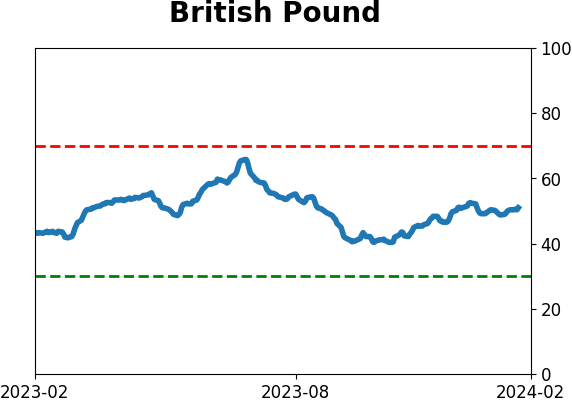
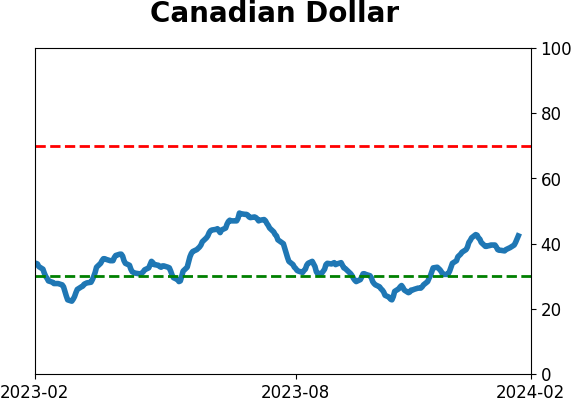
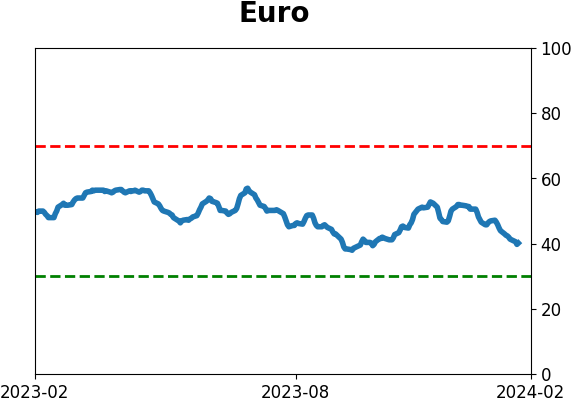
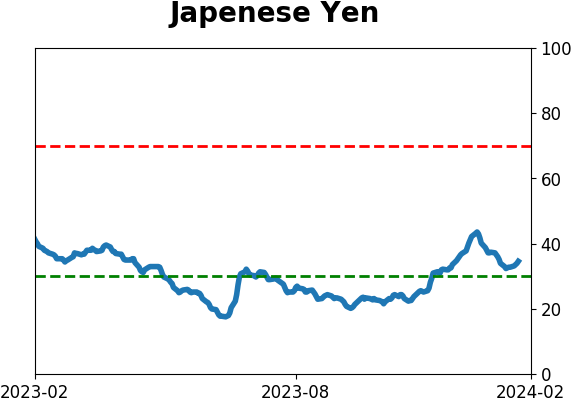
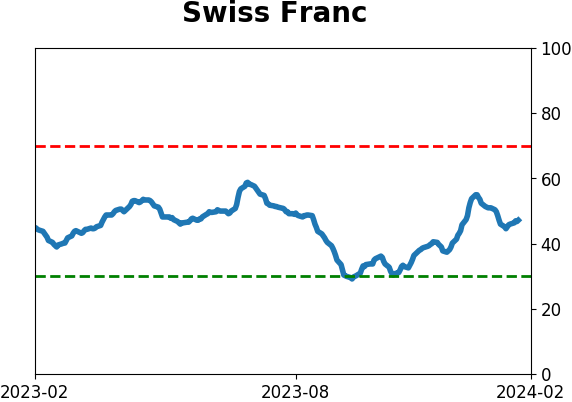
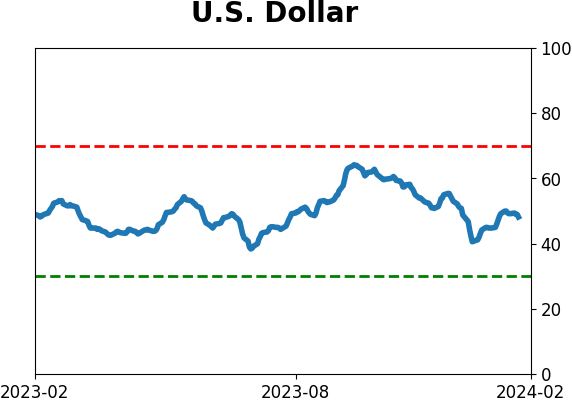
Currency ETF's - 5-Day Moving Average
|
|
|
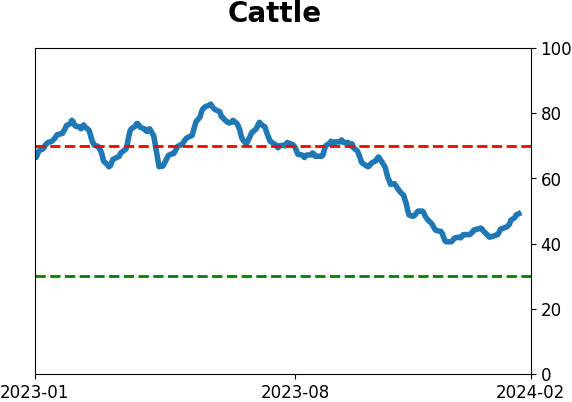
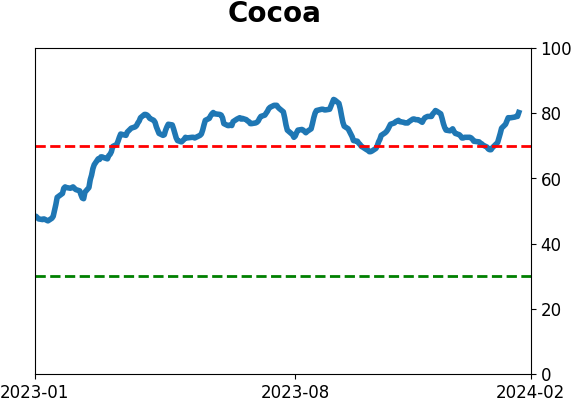
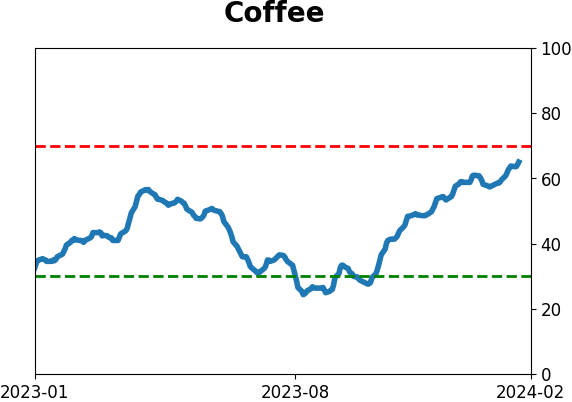
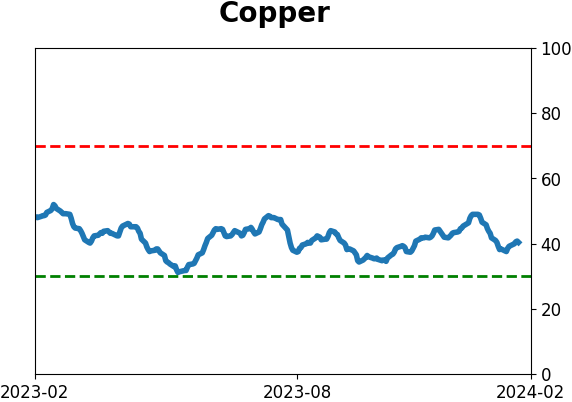
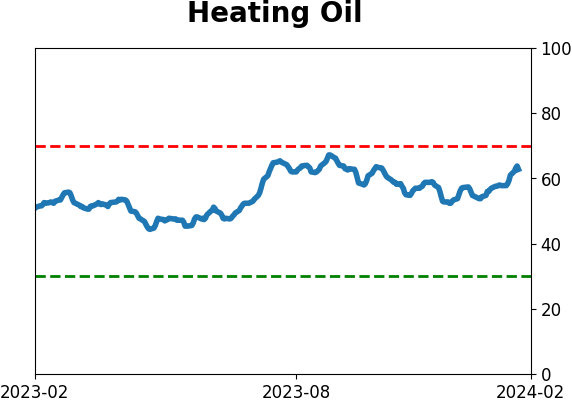
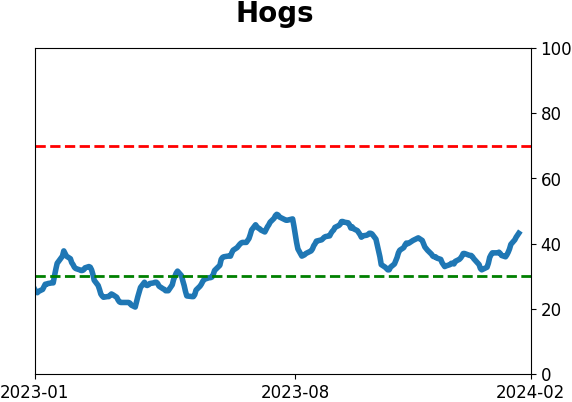
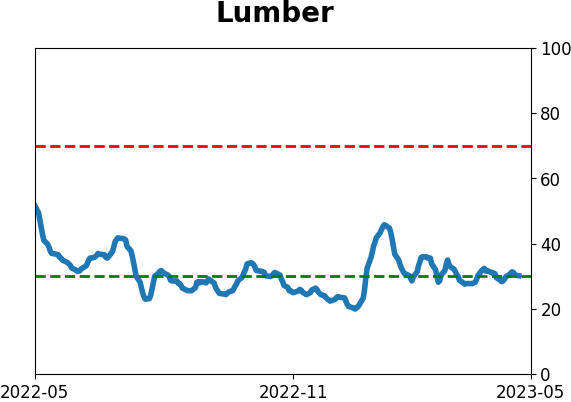
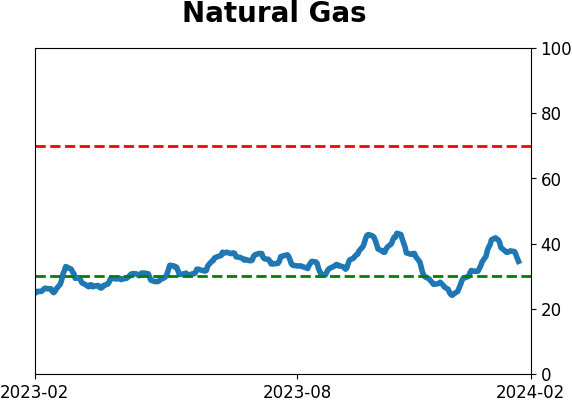
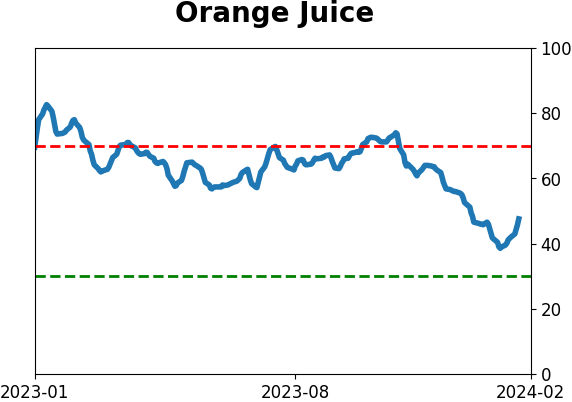
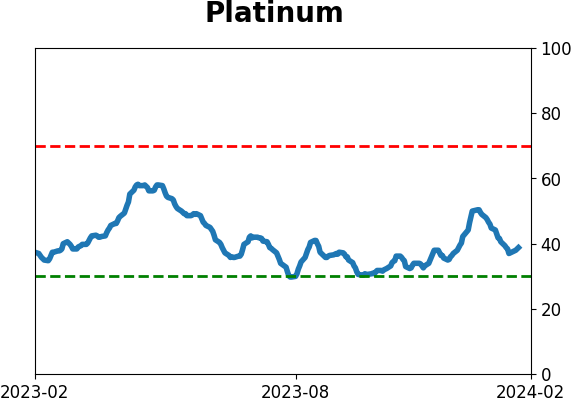
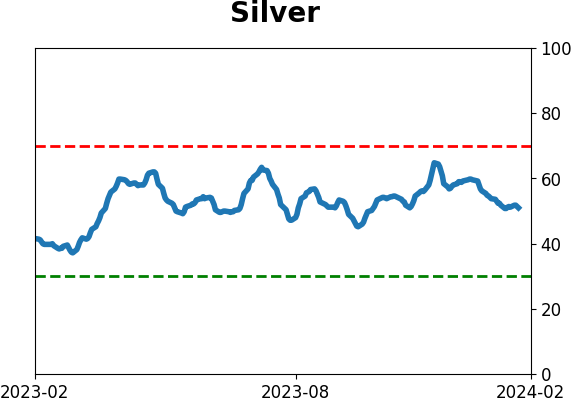
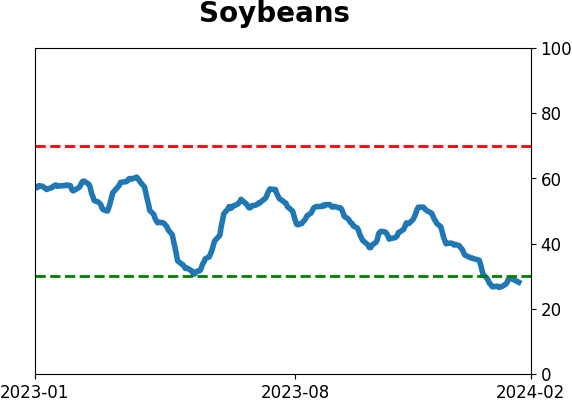
Commodity ETF's - 5-Day Moving Average
|
|