Headlines
|
|
Investors continue to pull back on leverage:
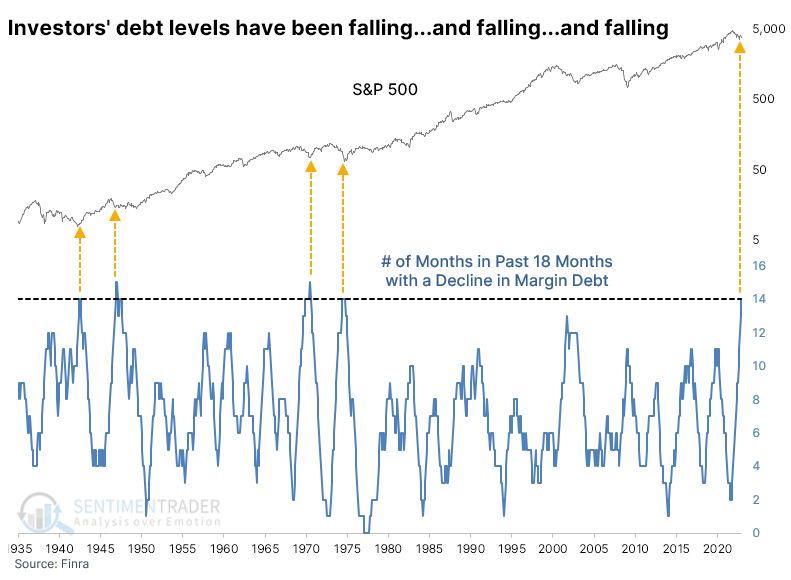
Even though stocks stabilized in October, investors keep pulling back on margin loans. Debt has declined for 14 out of 18 months, and the year-over-year plunge is dramatic. Behavior like this has tended to precede very good returns over the medium- to long-term in the S&P 500.
|
Smart / Dumb Money Confidence
|
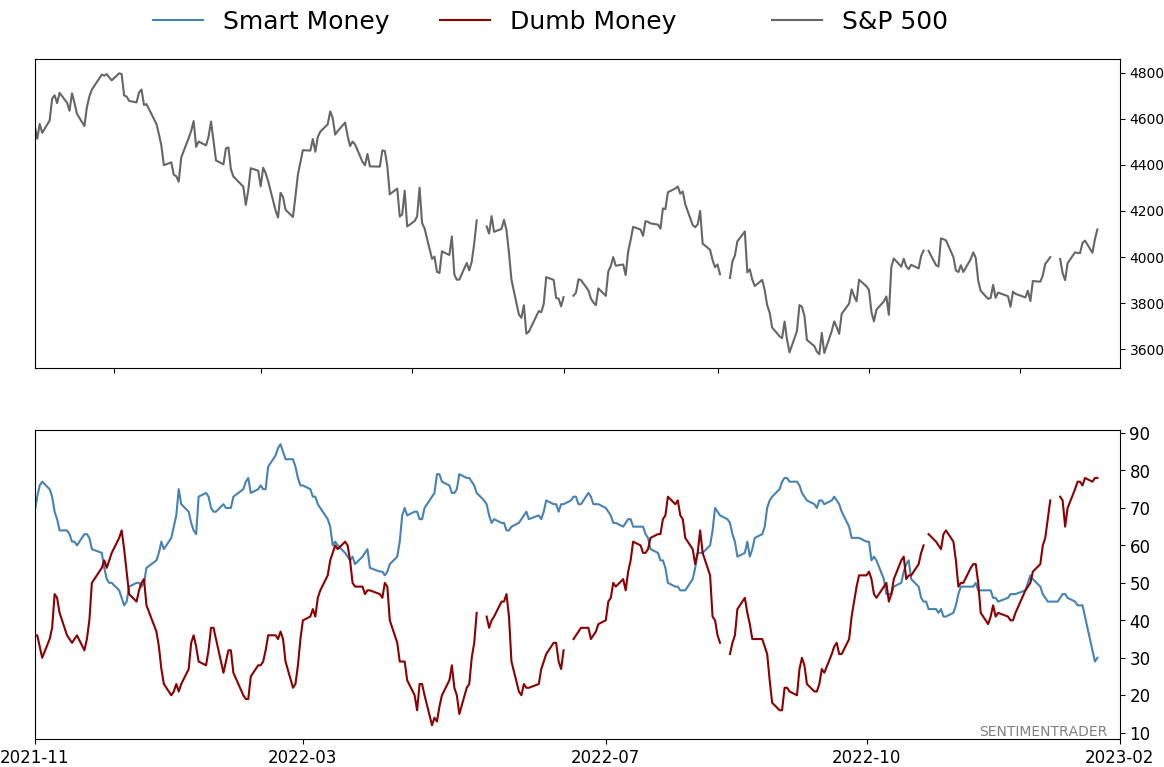
Smart Money Confidence: 30%
Dumb Money Confidence: 78%
|
|
Risk Levels
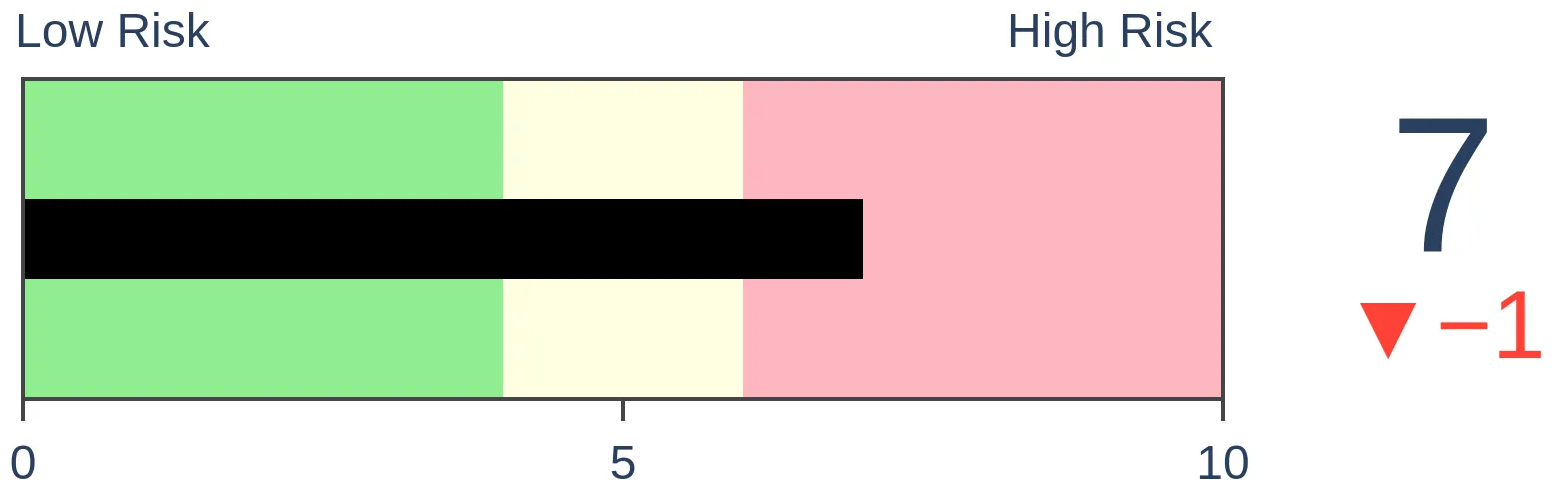
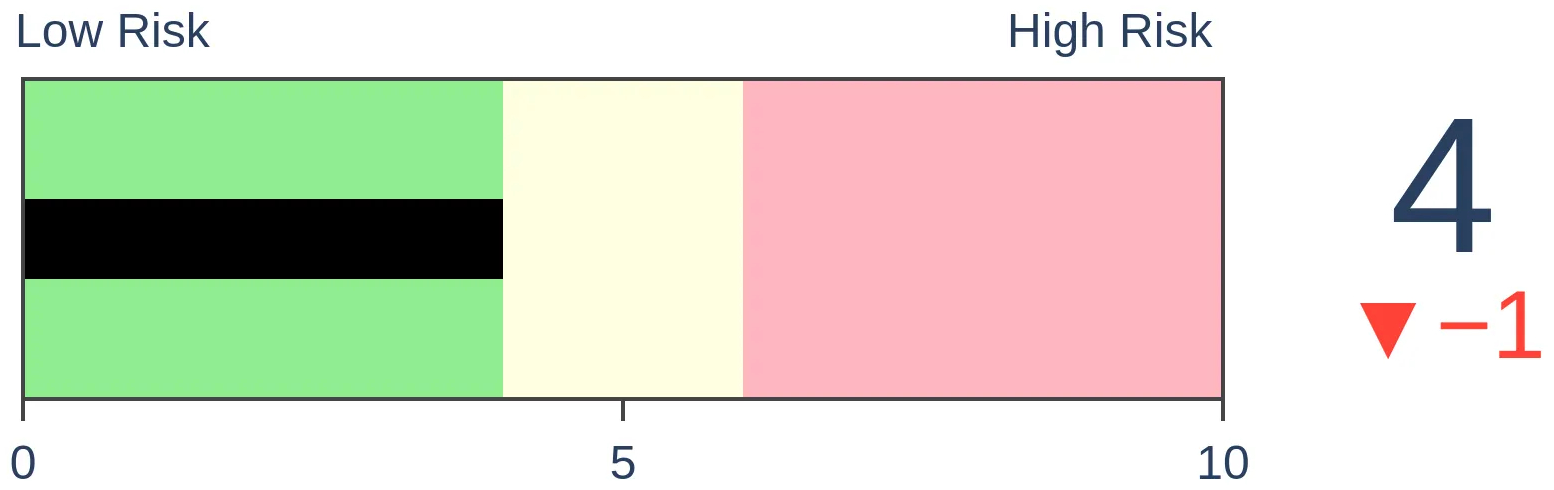
Stocks Short-Term
|
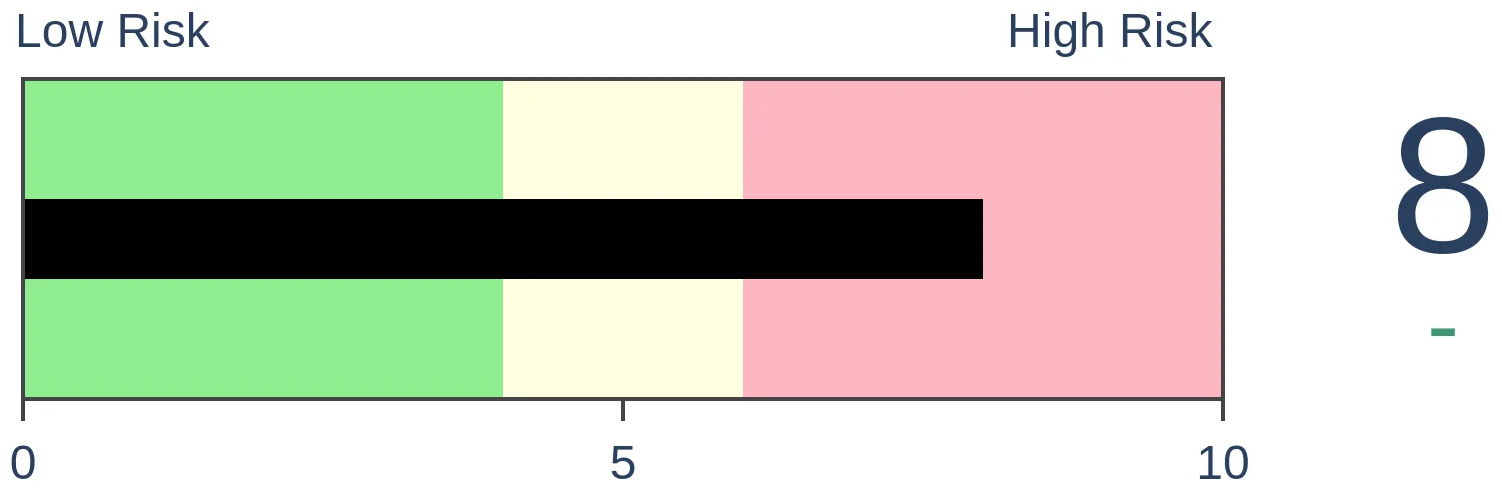
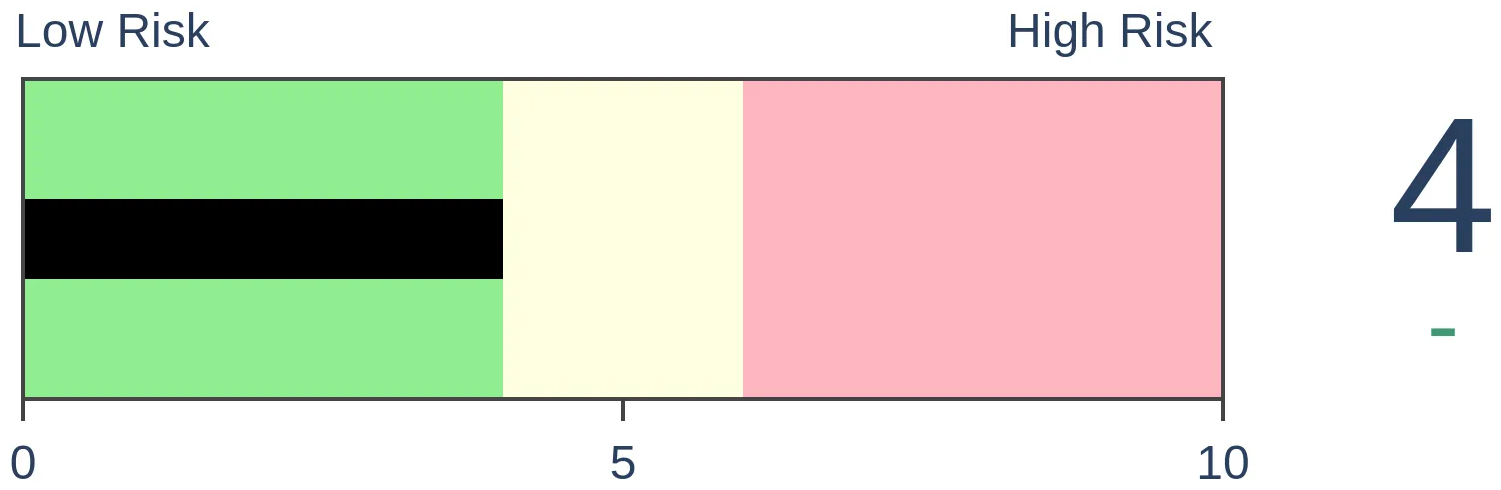
Stocks Medium-Term
|
|
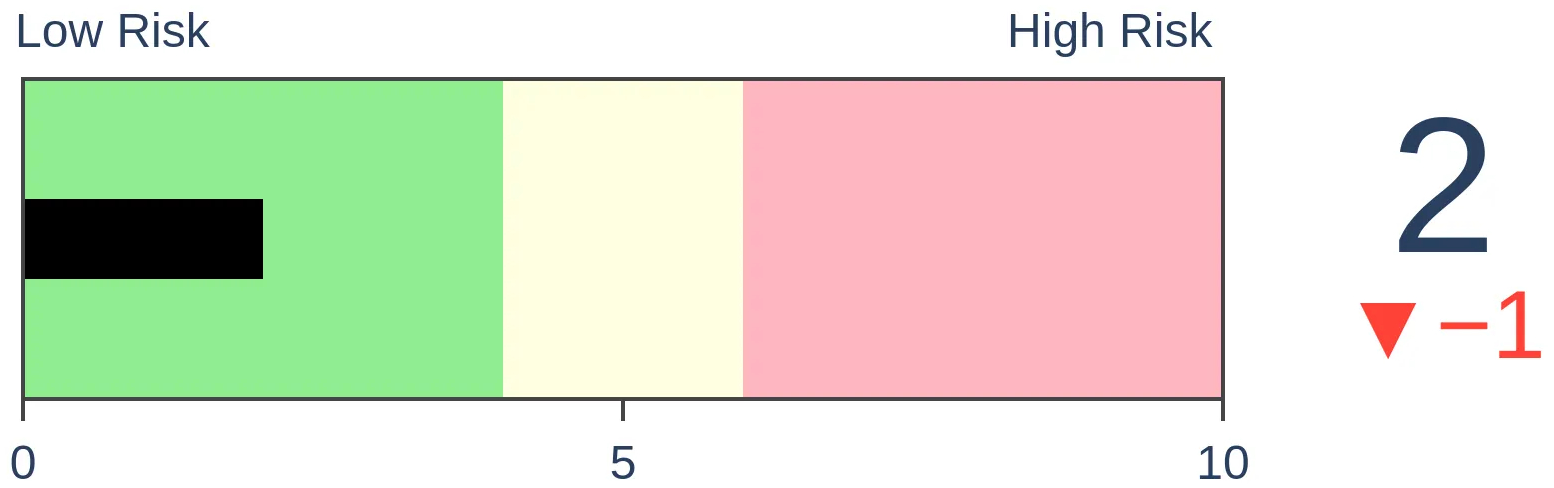
Bonds
|
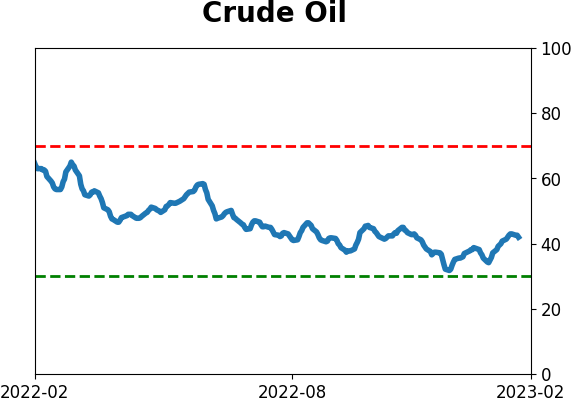
Crude Oil
|
|
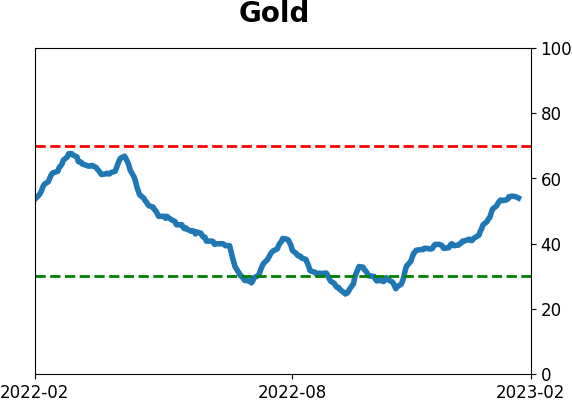
Gold

|
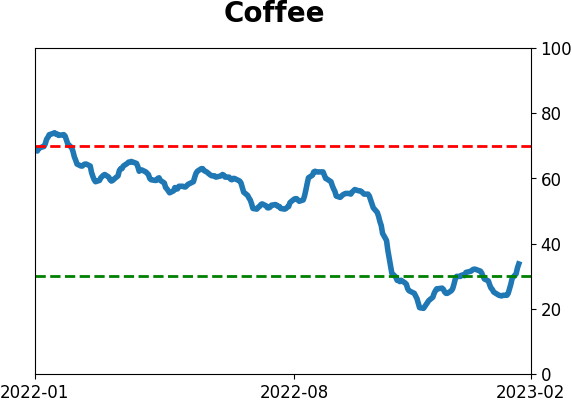
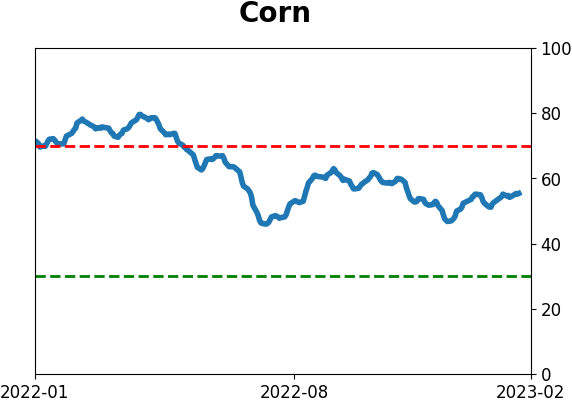
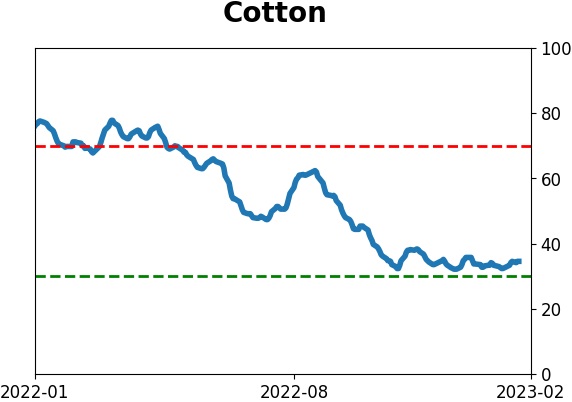
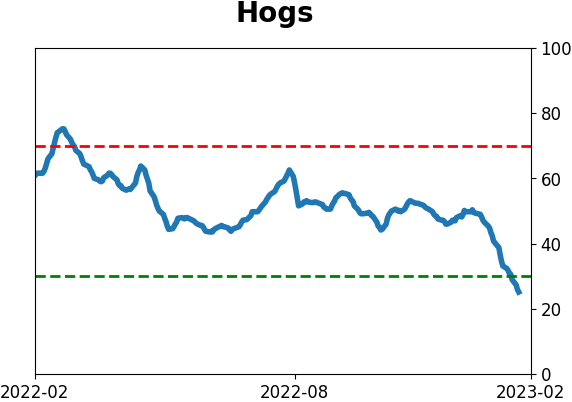
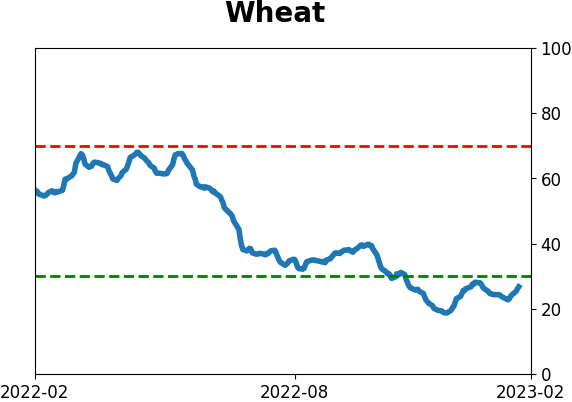
Agriculture
|
|
Research
By Jason Goepfert
BOTTOM LINE
Even though stocks stabilized in October, investors keep pulling back on margin loans. Debt has declined for 14 out of 18 months, and the year-over-year plunge is dramatic. Behavior like this has tended to precede very good returns over the medium- to long-term in the S&P 500.
FORECAST / TIMEFRAME
None
|
Key points:
- Margin debt - loans using equities as collateral - has been dropping despite a steadying stock market
- This is an unusual divergence, and debt has dropped at a historic pace and magnitude
- Behavior like this has tended to precede well-above-average returns in the S&P 500 over the longer-term
Stocks have been rising, but investors are pulling back on loans
Last fall, we saw that margin debt was declining despite a jump in stock prices. That has been a modest positive in the past, but investors aren't paying much attention; they're still pulling back on leverage as margin debt keeps dropping.
Stocks slid in December, so it makes sense that margin debt would decline again. But the S&P was still well above its monthly closing low from September, while margin debt was nearly 9% lower in December than it was in September.
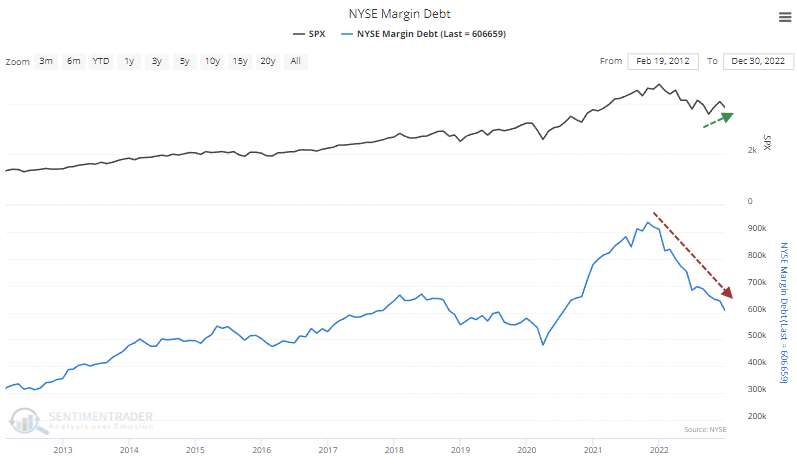
These claims on investors' stock positions have now plunged 33% over the past year, one of the most severe year-over-year declines in history. It failed to coincide with a bottom in stocks in 1974 and 2001, but other dramatic declines in debt tended to occur roughly around troughs in optimism.
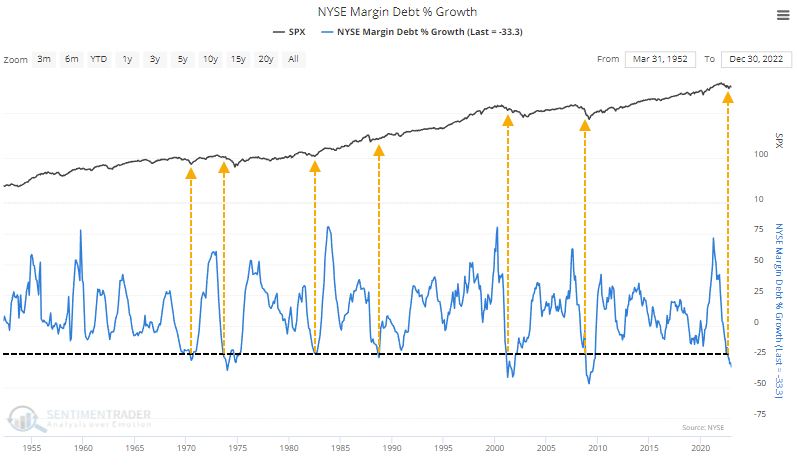
Remarkably, debt has dropped during 14 out of the past 18 months. That hasn't happened in nearly 40 years when it roughly coincided with the end of the terrible 70s decade.
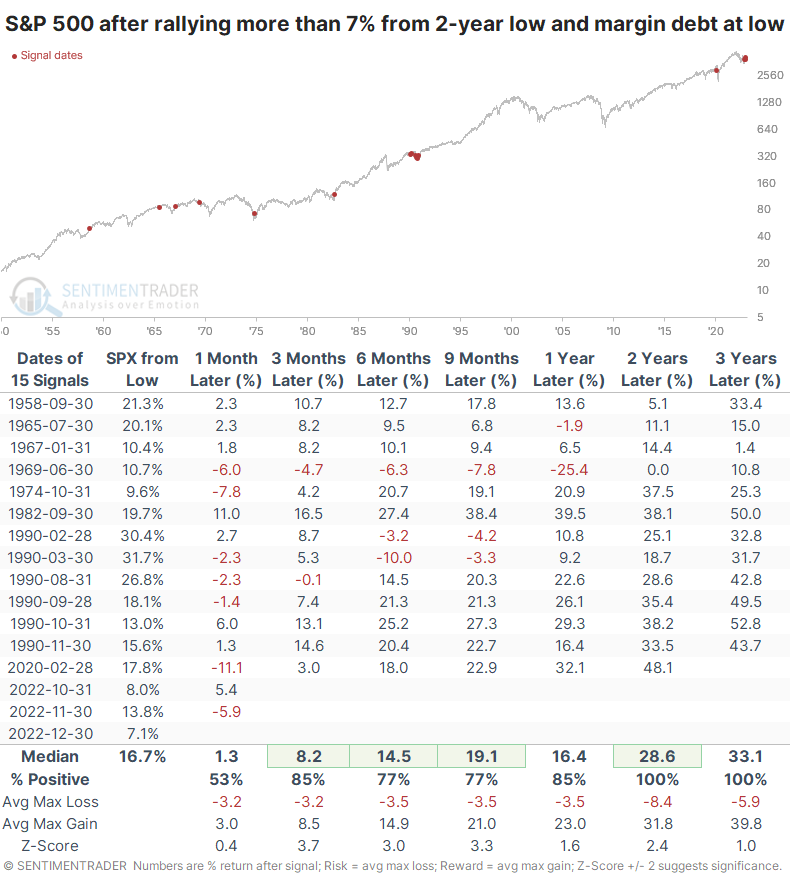
As we saw last fall, when stocks rally but investors continue to pull back on leverage, it tends to lead to above-average returns. Long-term returns when the S&P was more than 7% off it slow while margin debt was setting new lows were excellent.
This is the only period other than 1990 when there were multiple months with stocks rallying but investors stubbornly reducing their leverage.
What the research tells us...
Margin debt is mostly a coincident indicator. When stocks rise, margin debt does, too, and vice-versa. So, it's unusual to see it diverge so much and for multiple months, as we have lately. About the only precedent is 1990. Whenever leverage has declined as consistently as it has over the past 18 months, at such a pace, and in spite of a rising stock market, future returns in the S&P have been above average. We'd rate this as another modest positive for bulls' long-term prospects.
Indicators at Extremes
Phase Table
Ranks
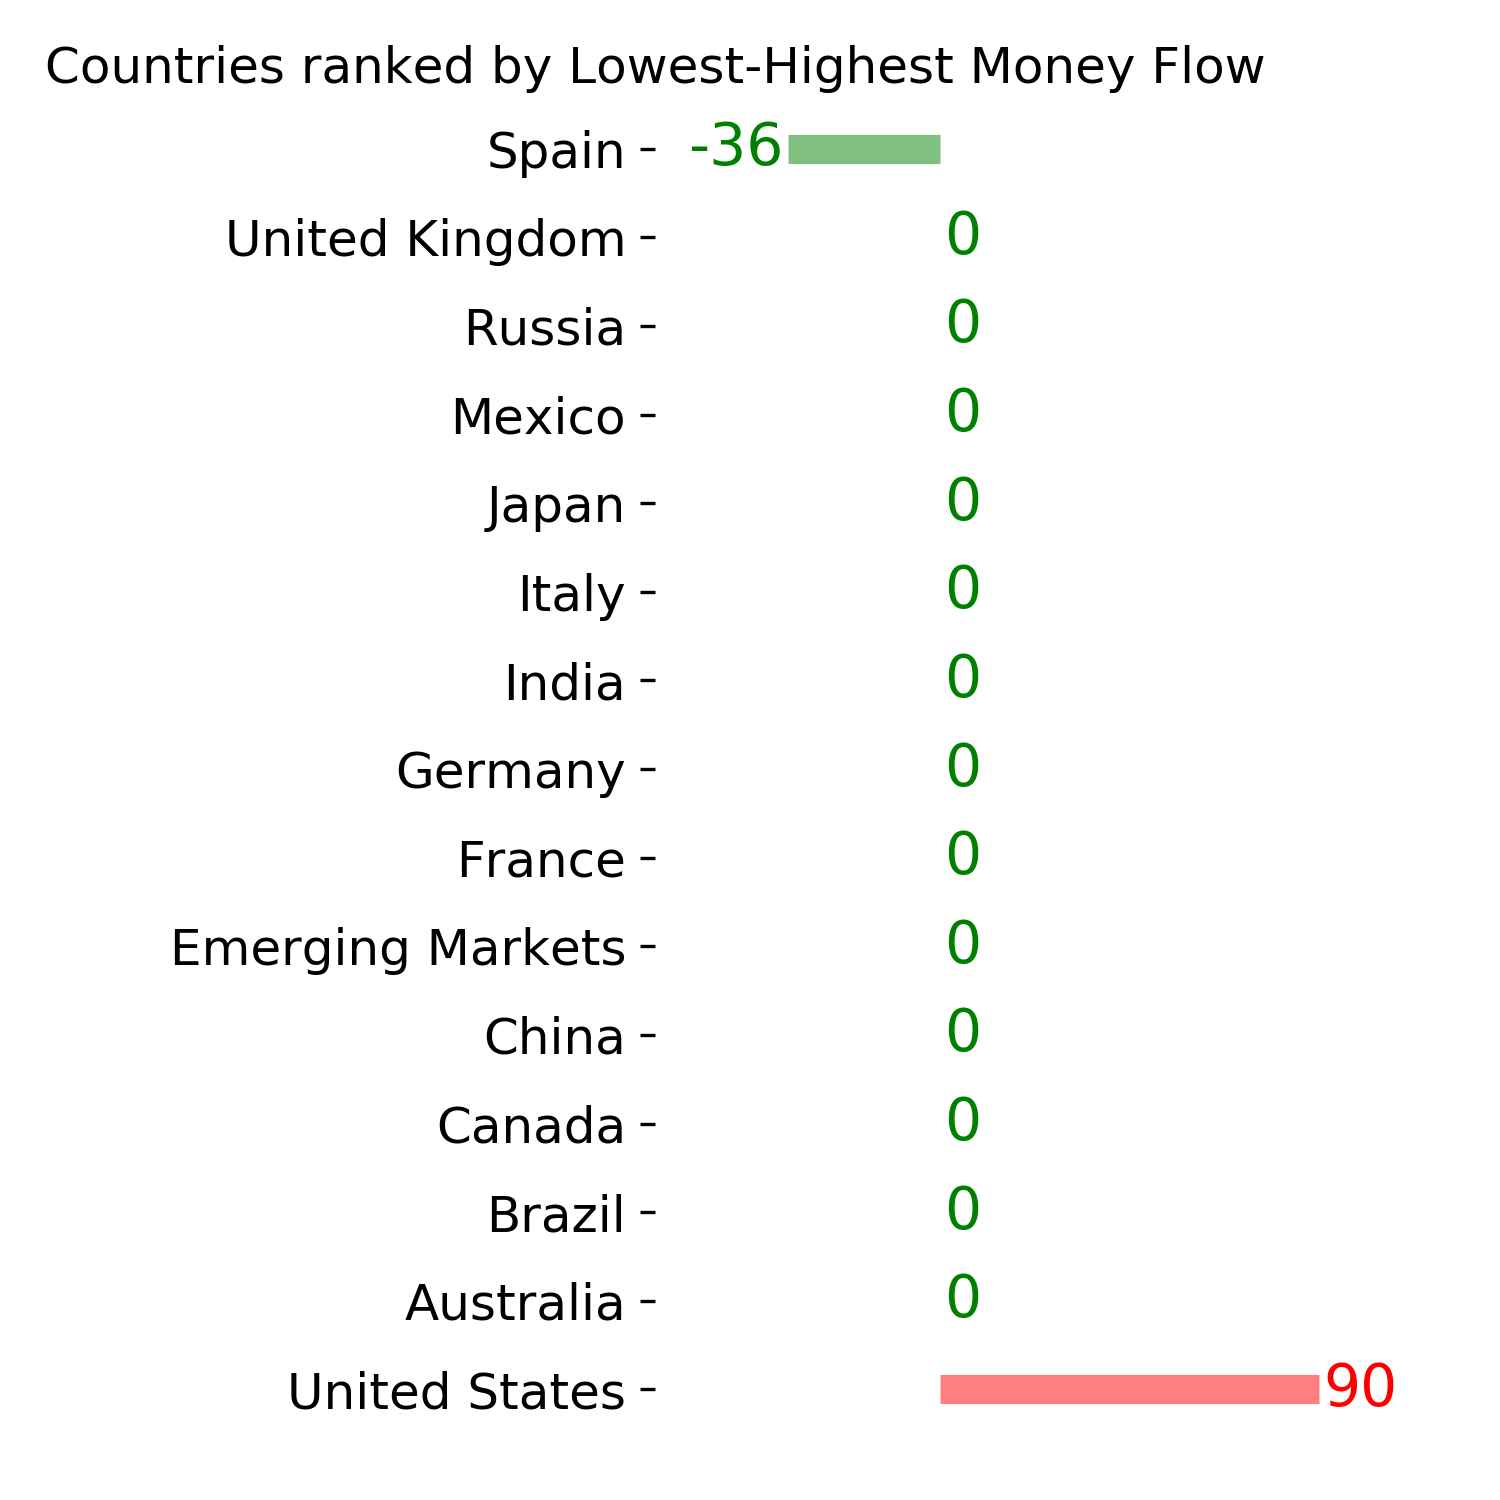
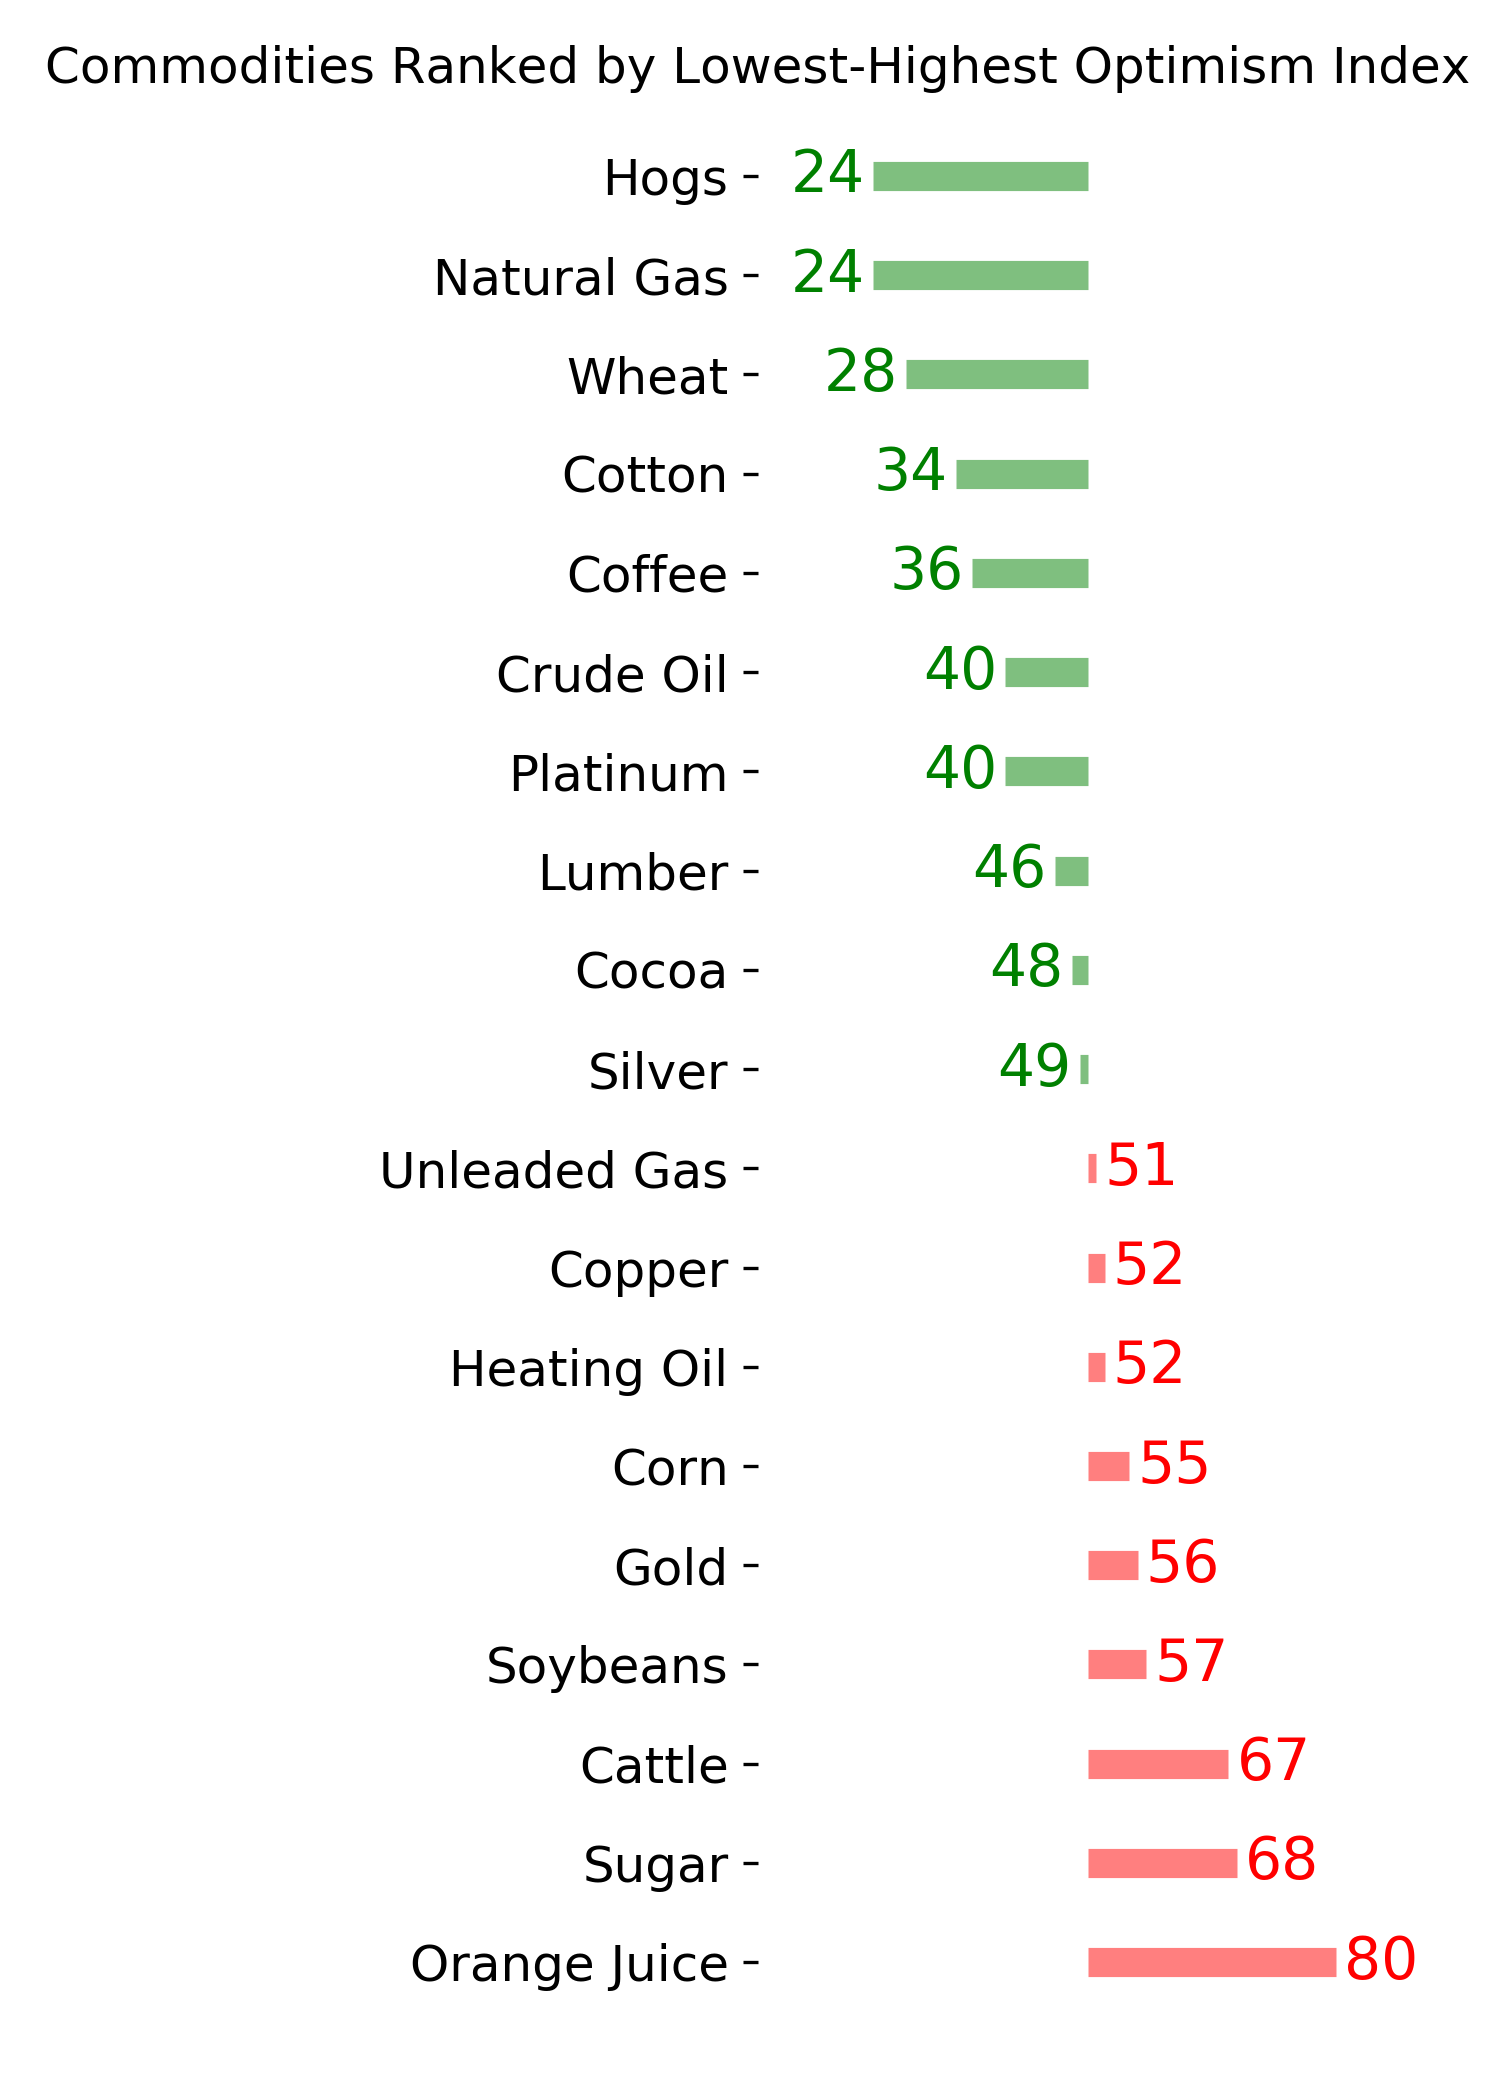
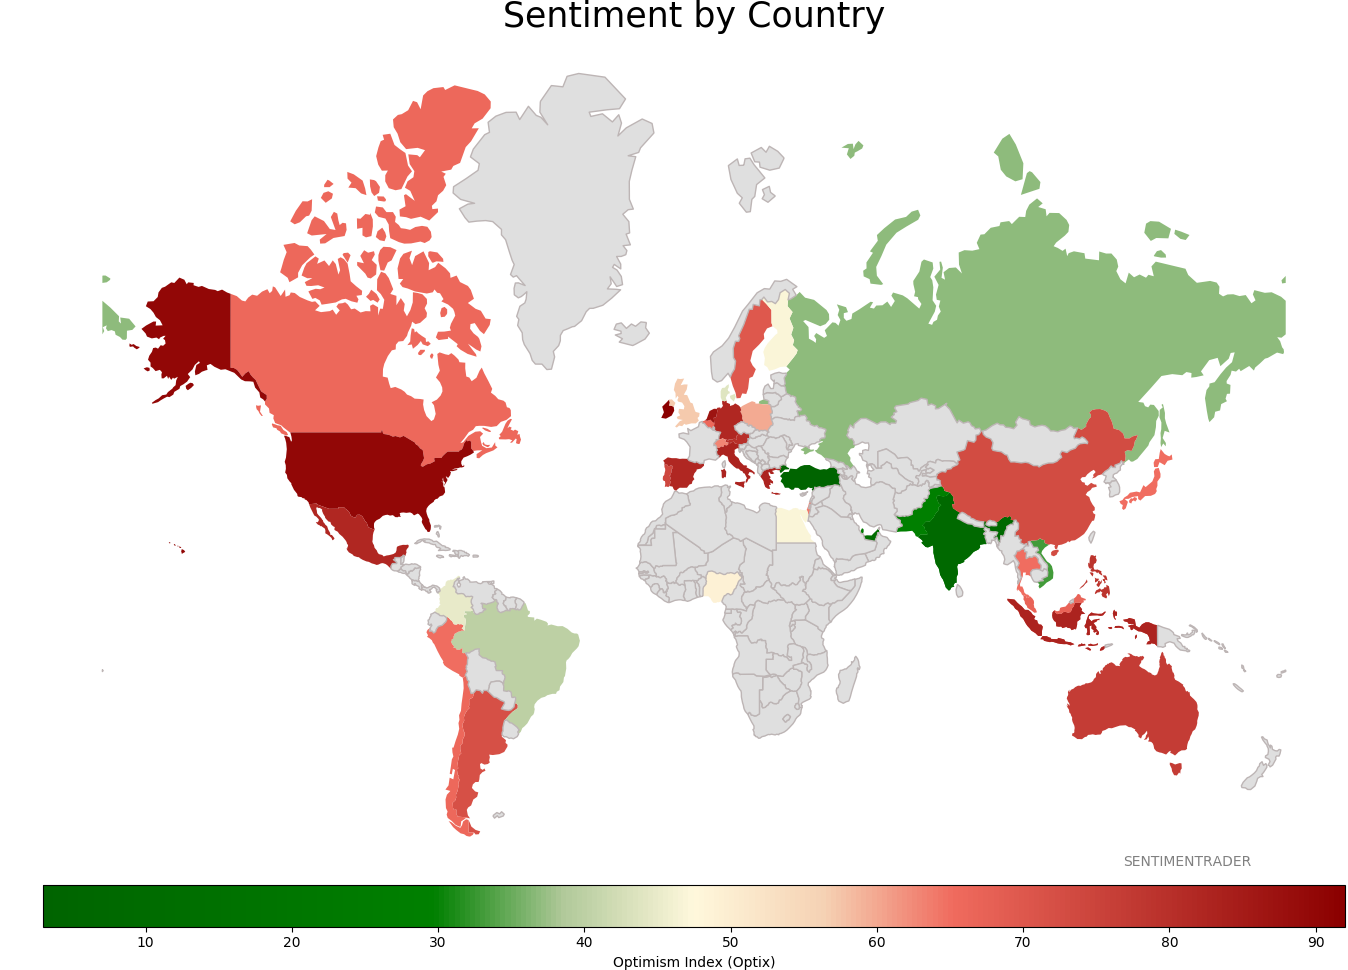
Sentiment Around The World
Optimism Index Thumbnails
|
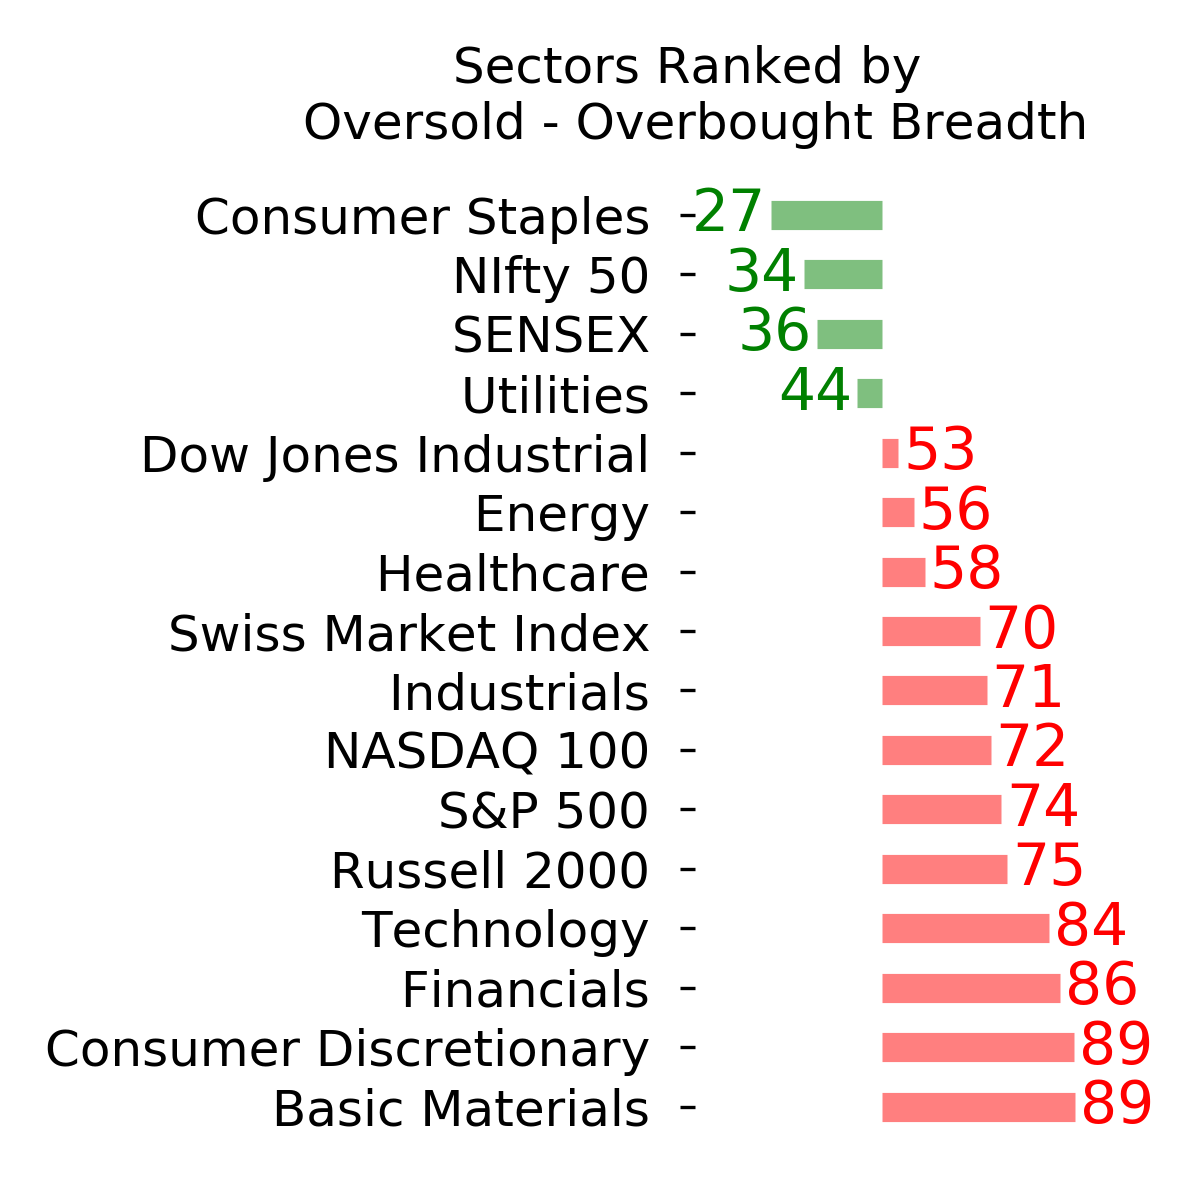
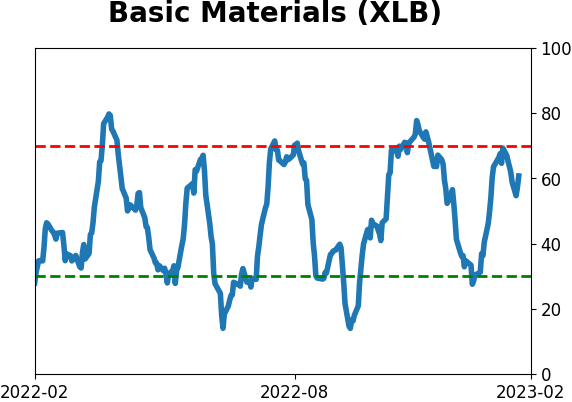
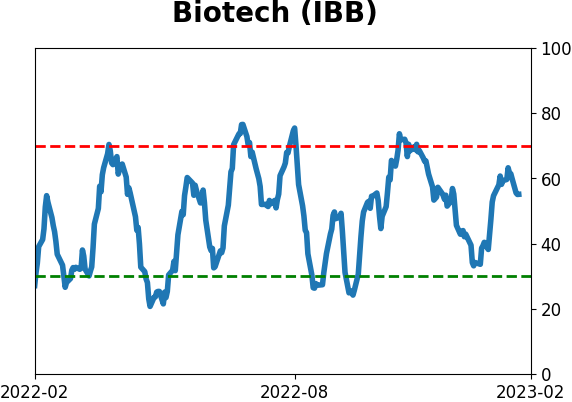
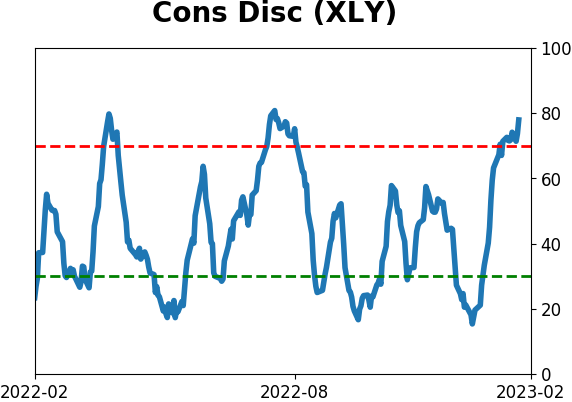
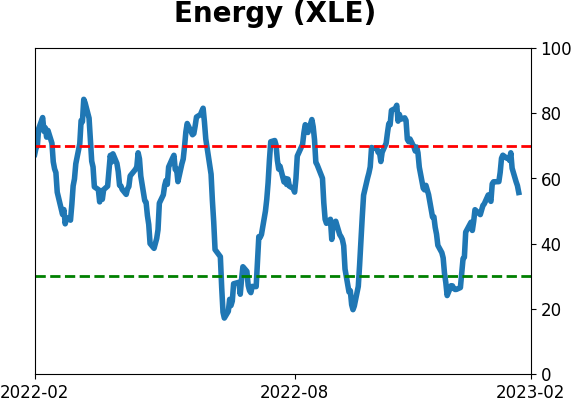
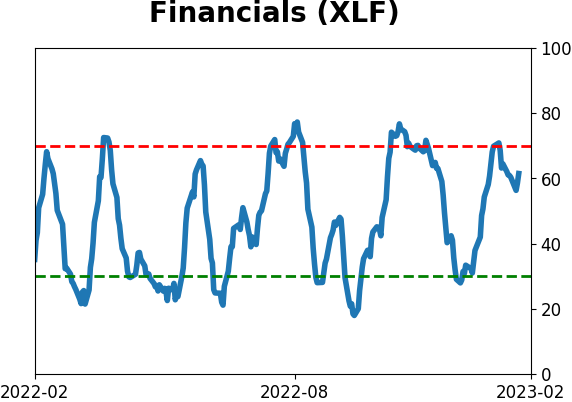
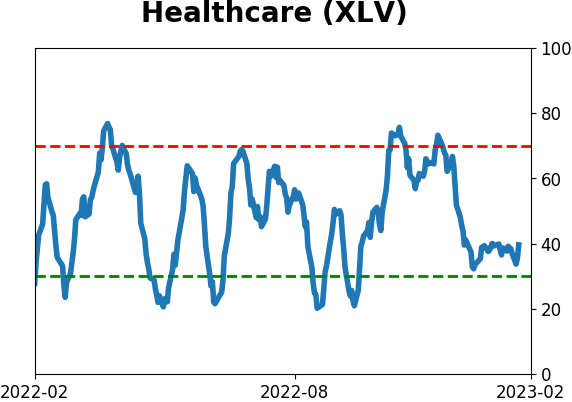
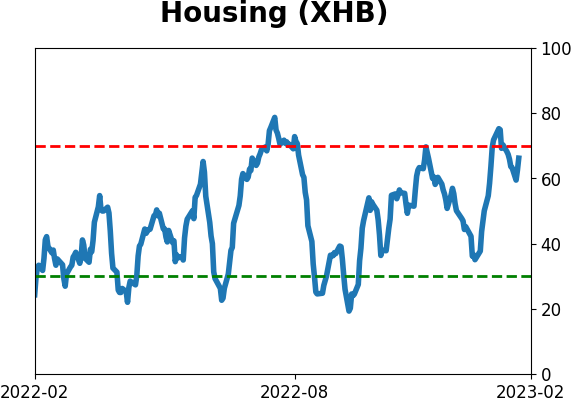
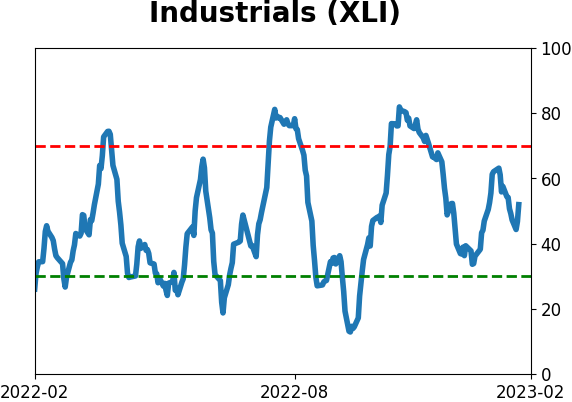
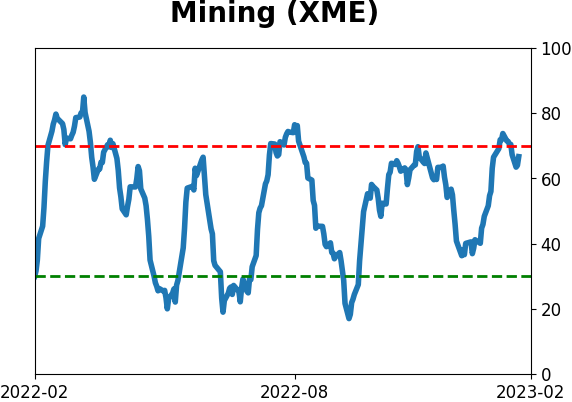
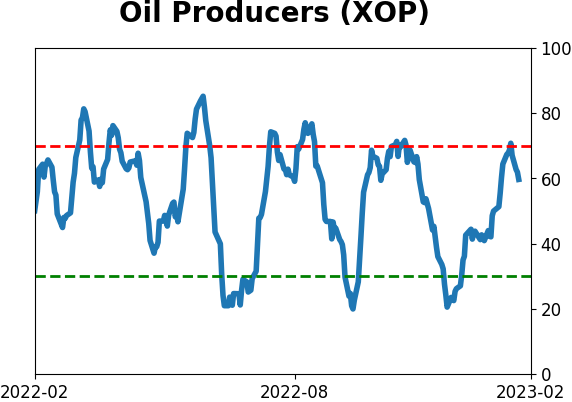
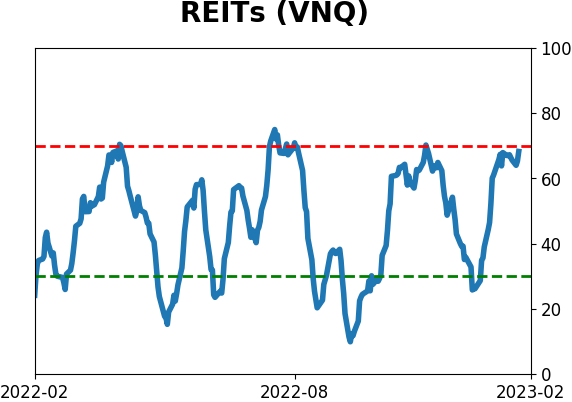
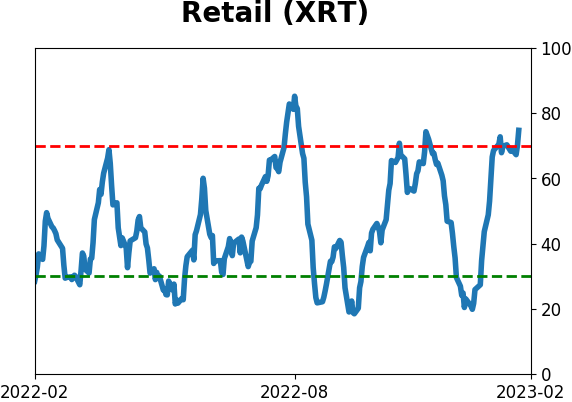
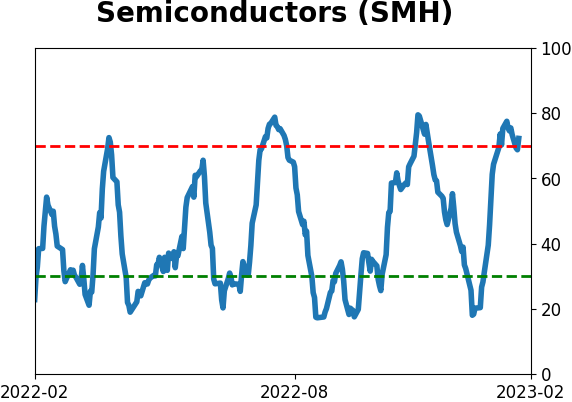
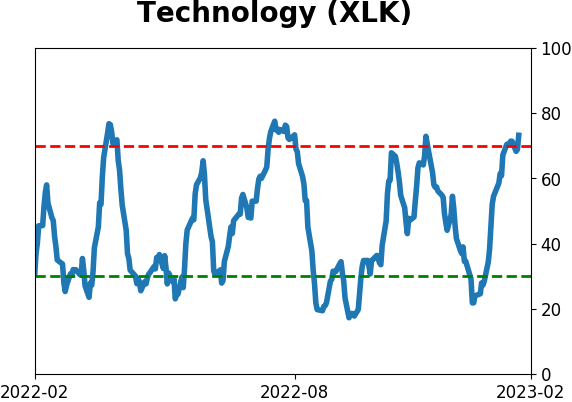
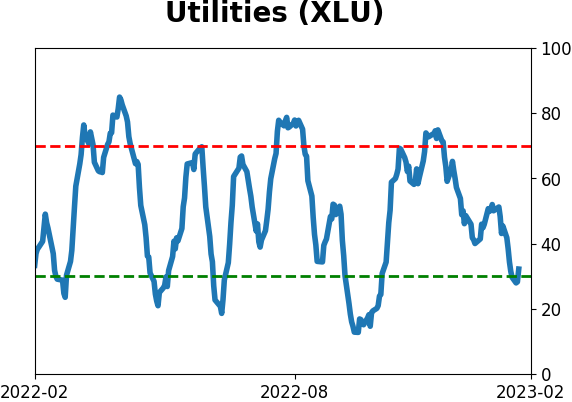
Sector ETF's - 10-Day Moving Average
|
|
|
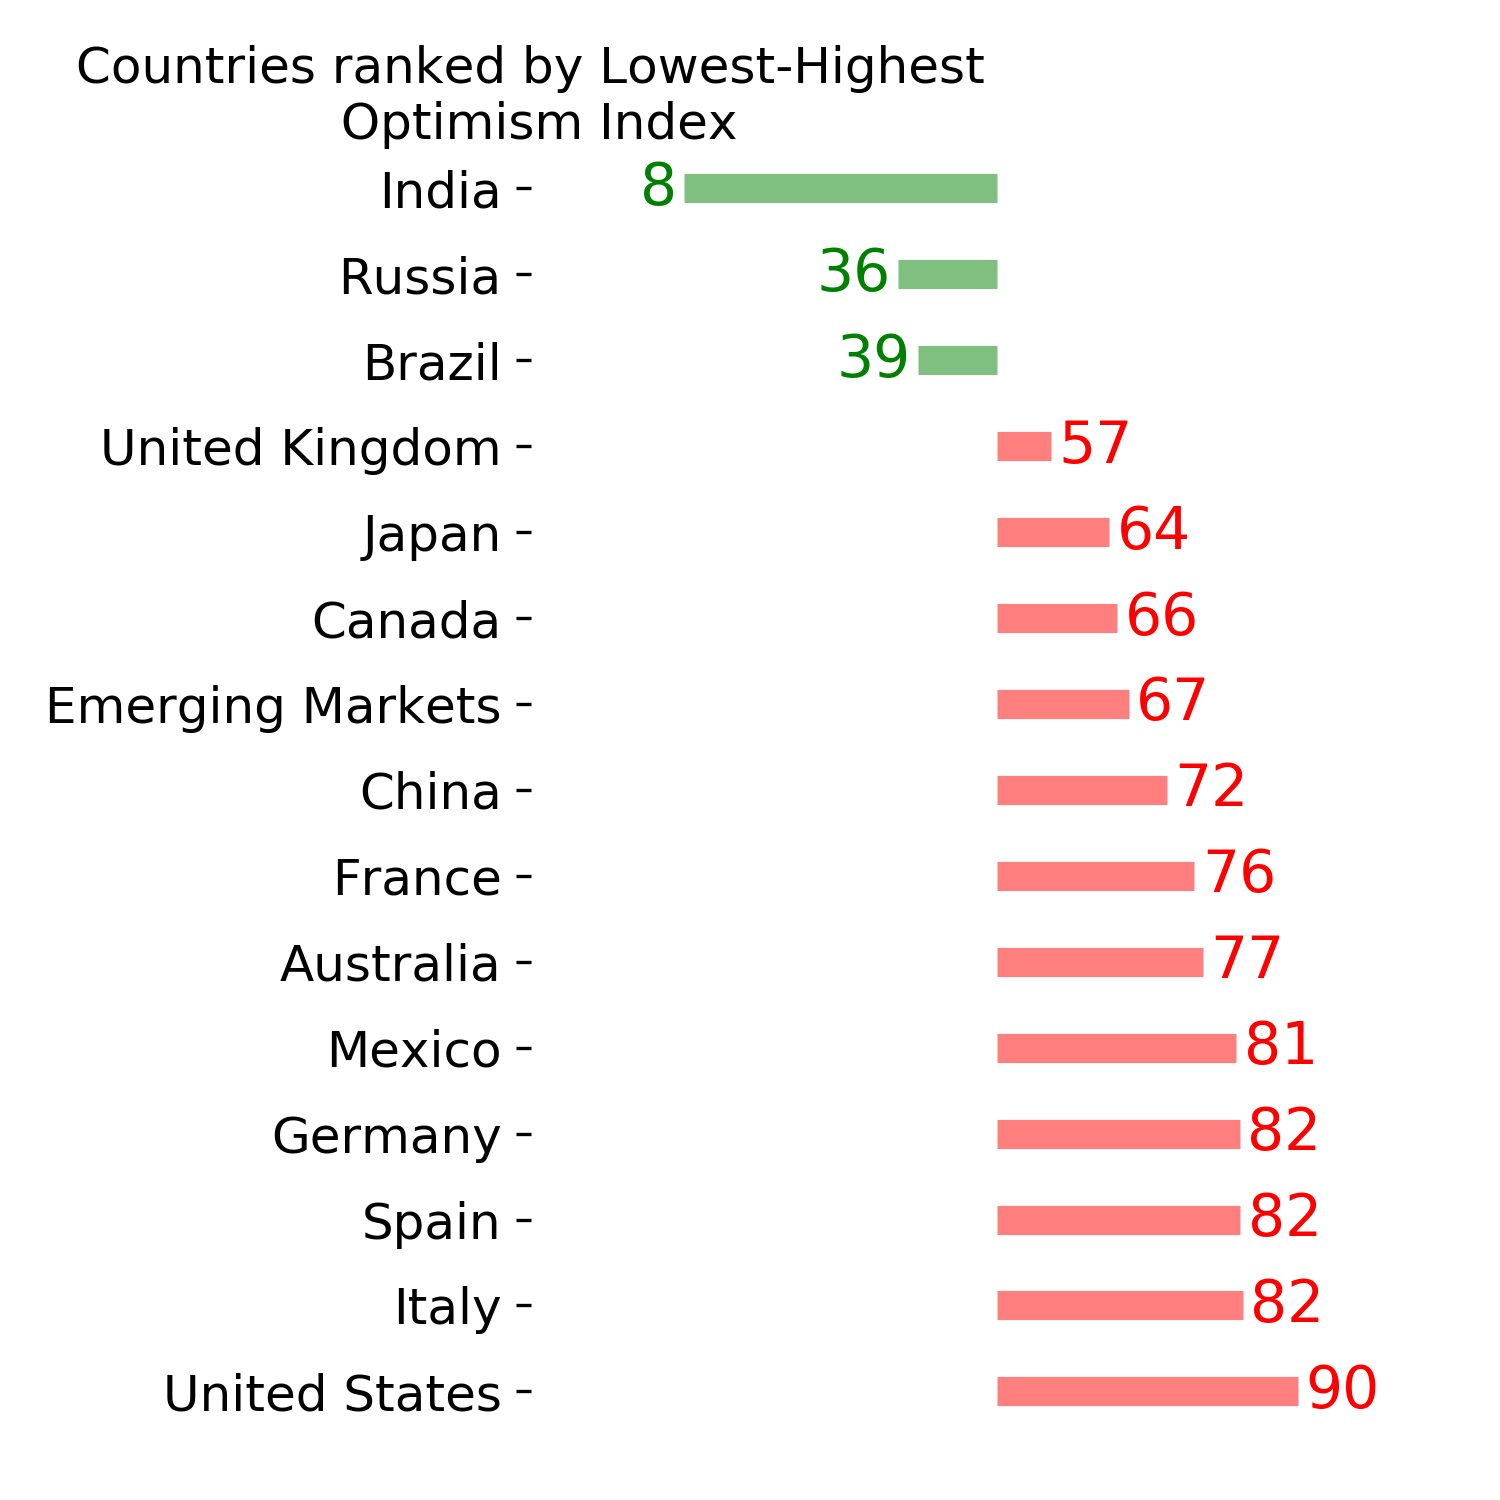
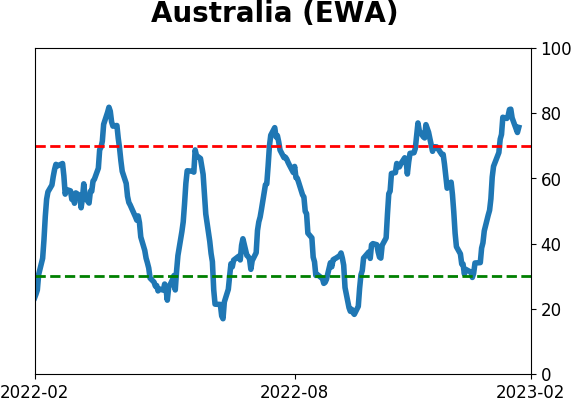
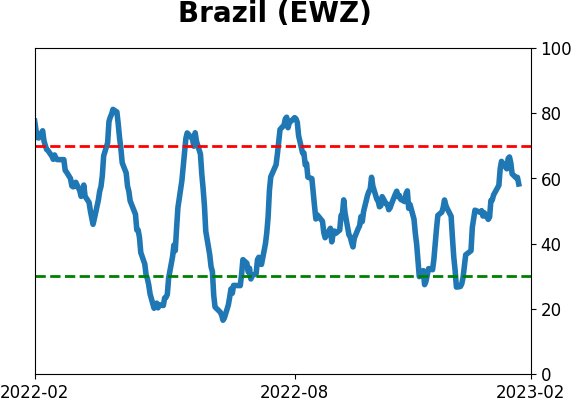
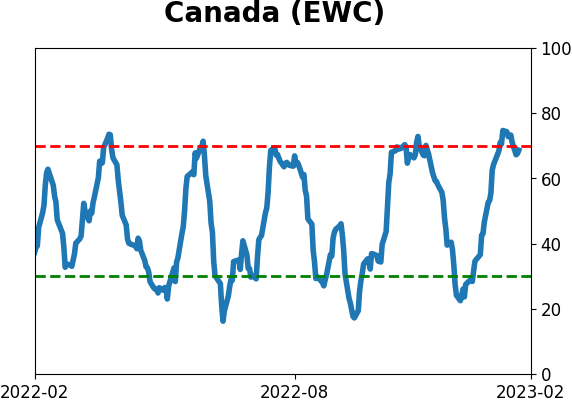
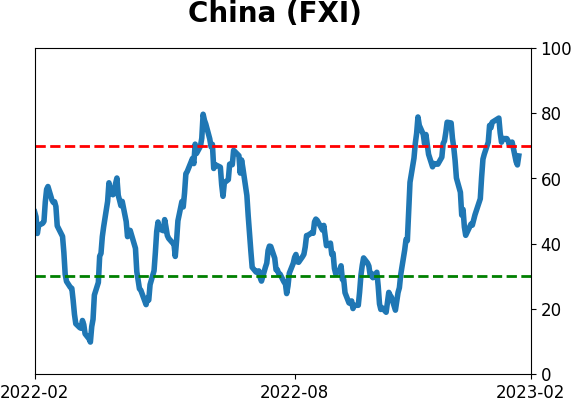
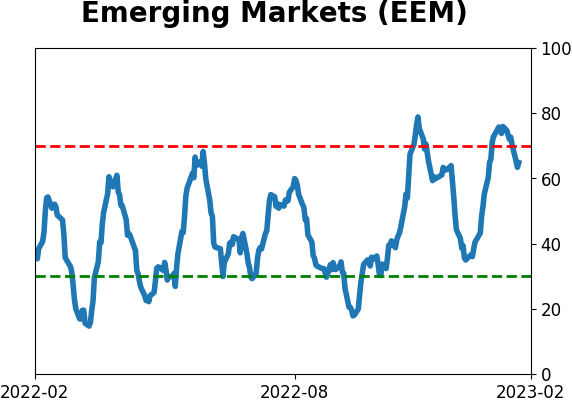
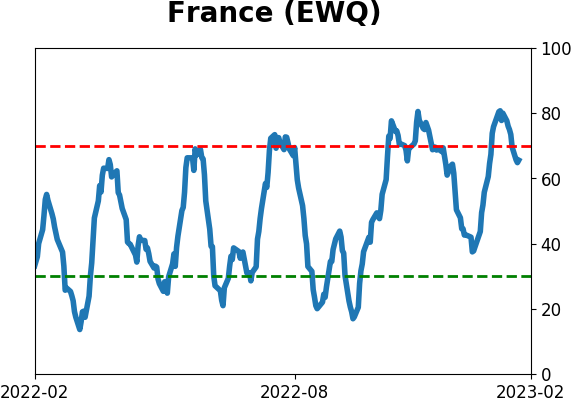
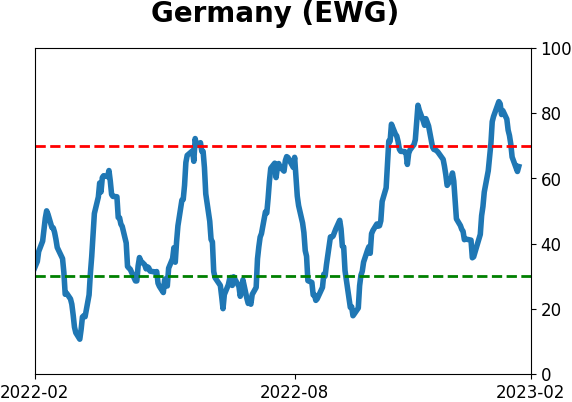
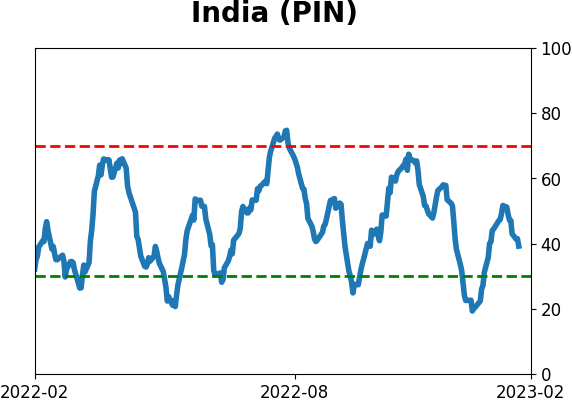
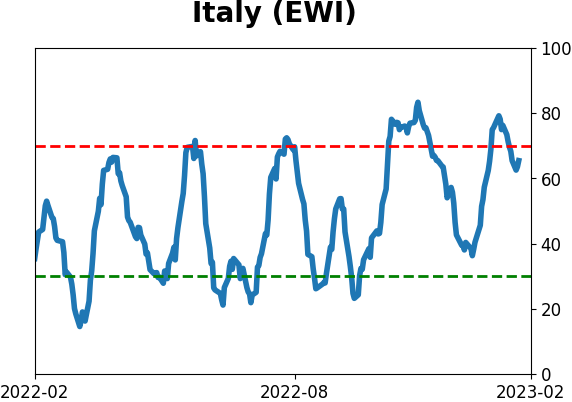
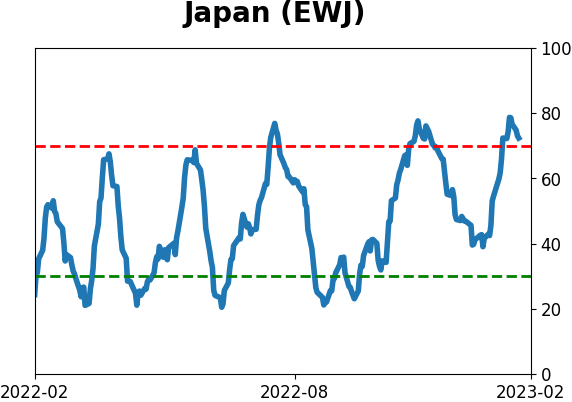
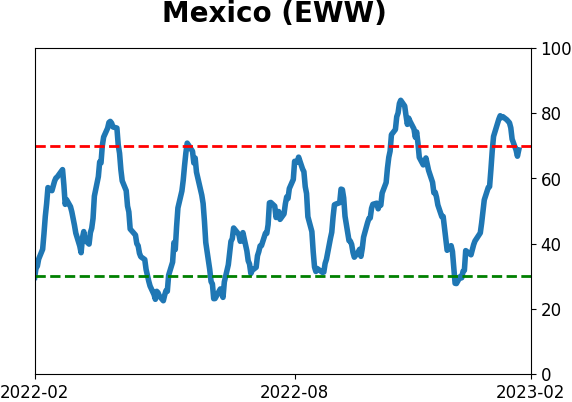
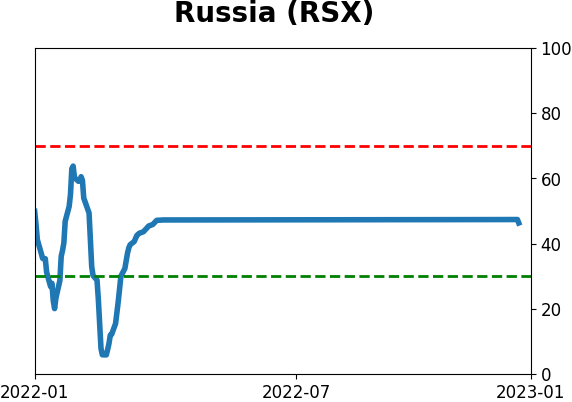
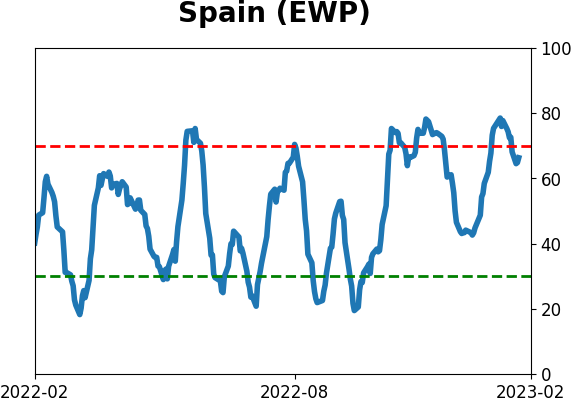
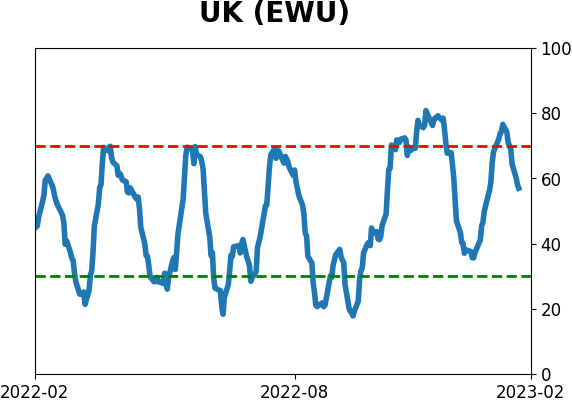
Country ETF's - 10-Day Moving Average
|
|
|
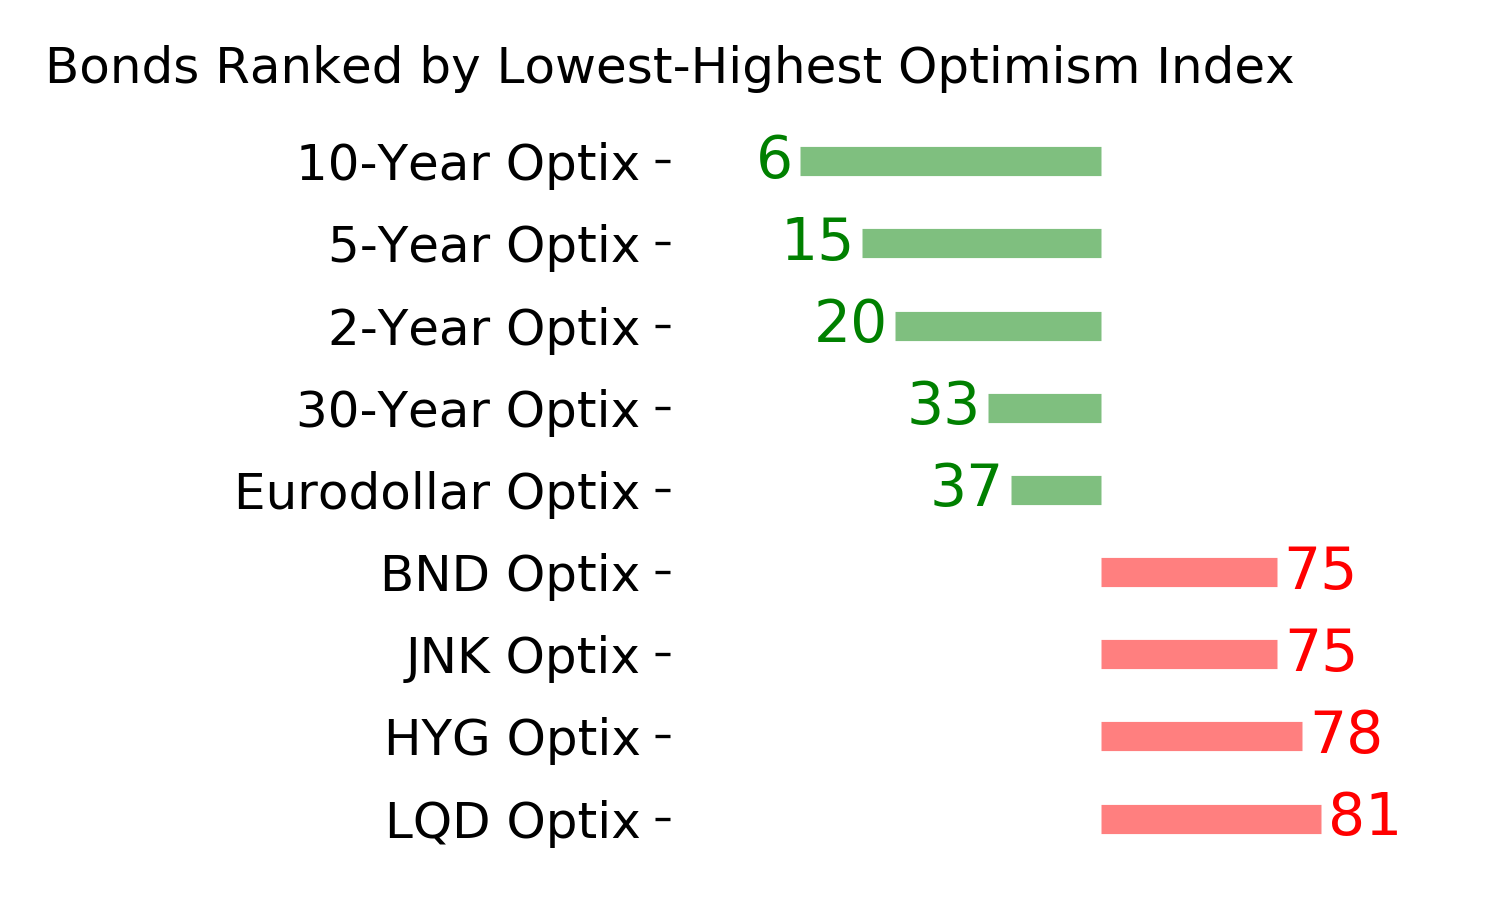
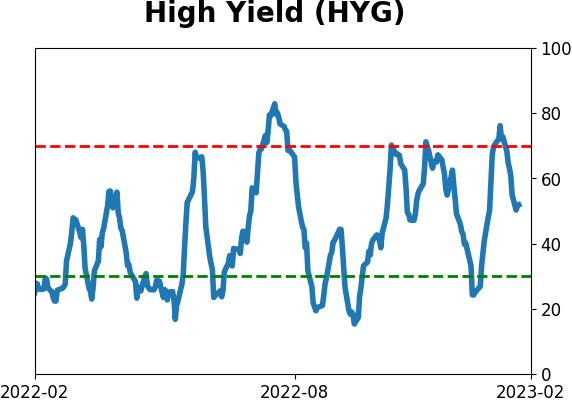
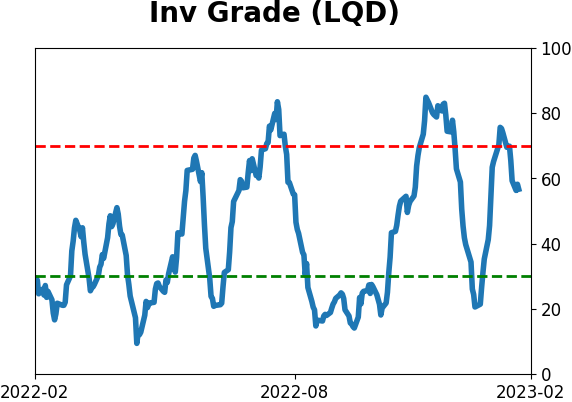
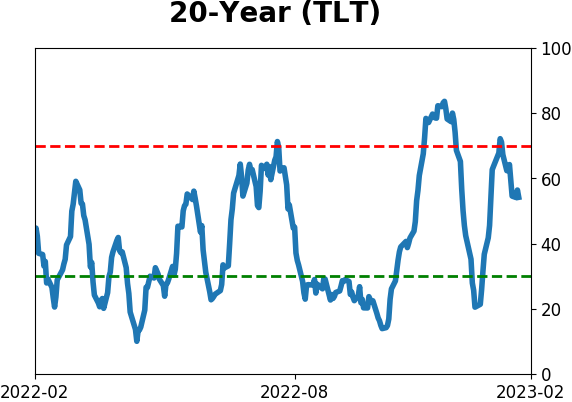
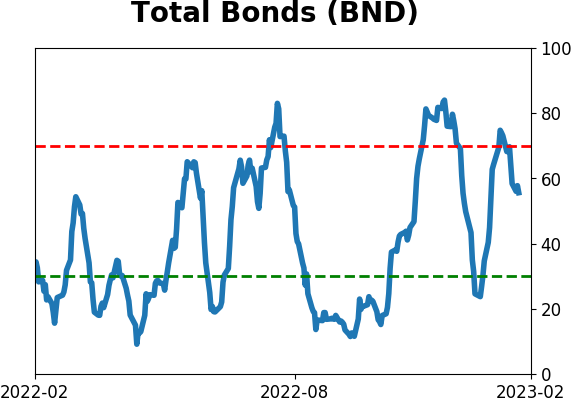
Bond ETF's - 10-Day Moving Average
|
|
|
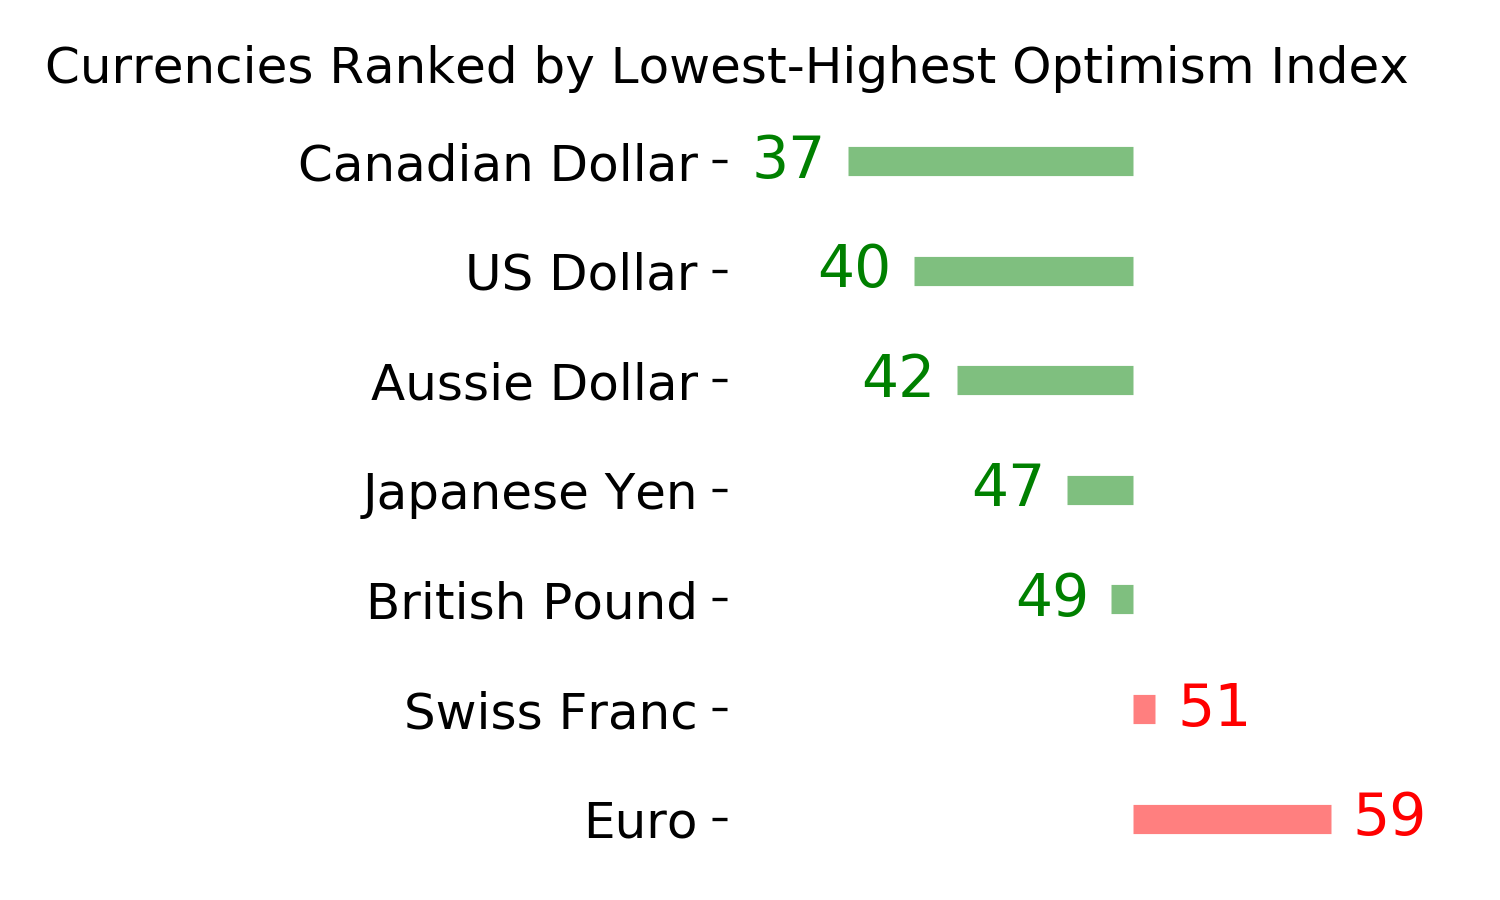
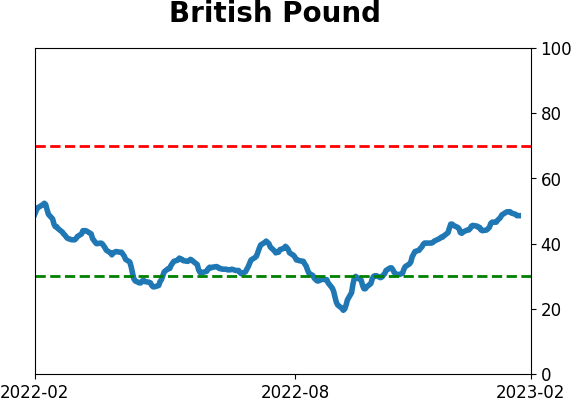
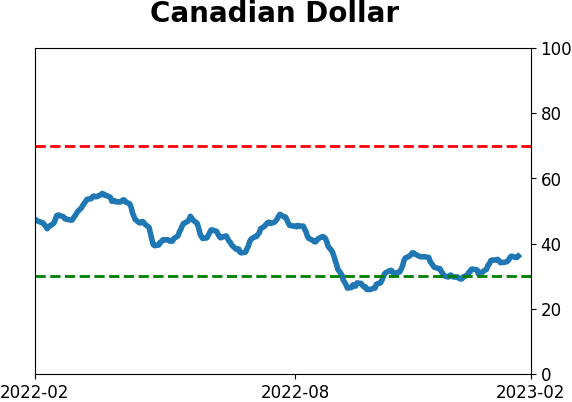
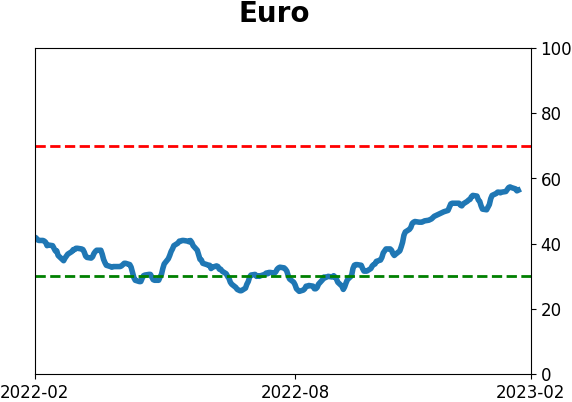
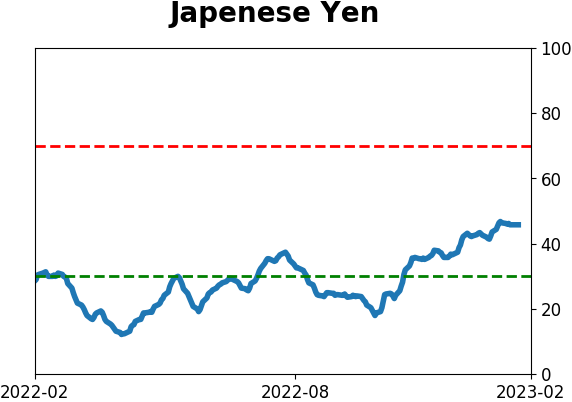
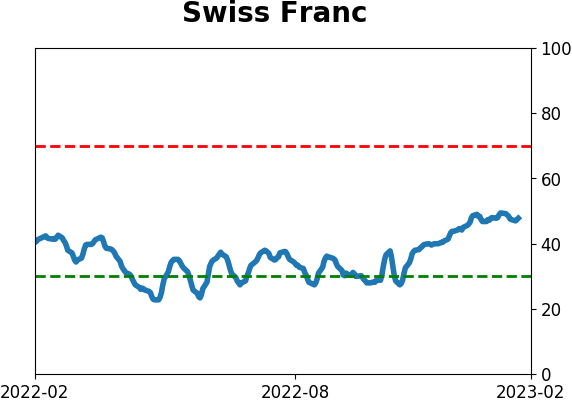
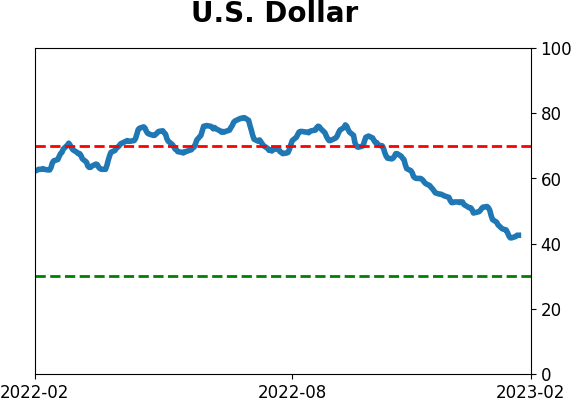
Currency ETF's - 5-Day Moving Average
|
|
|
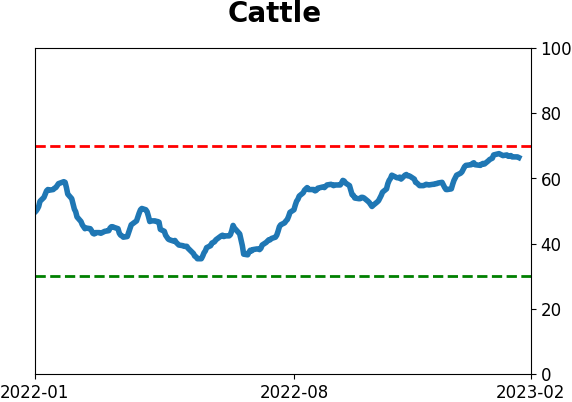
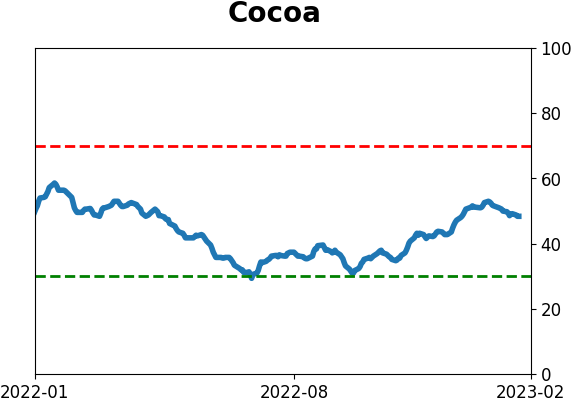
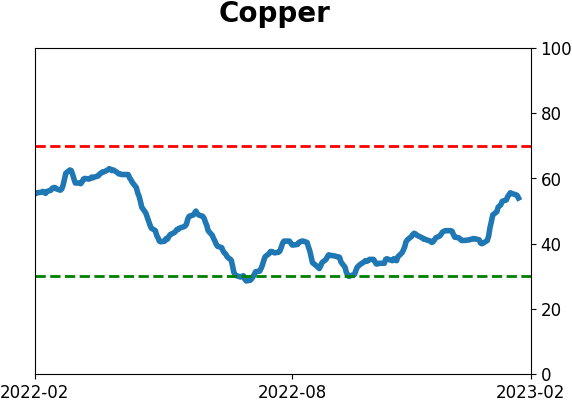
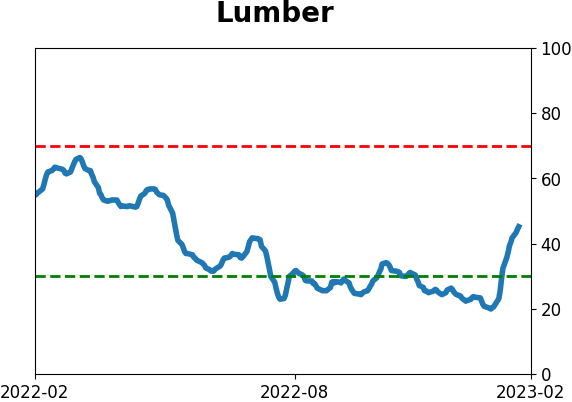
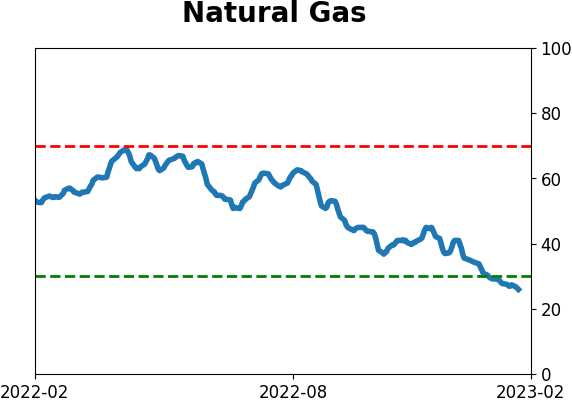
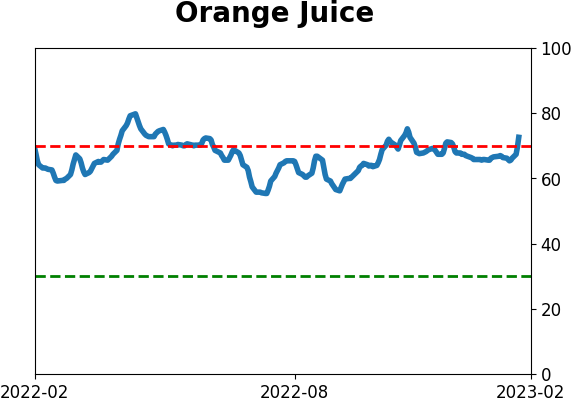
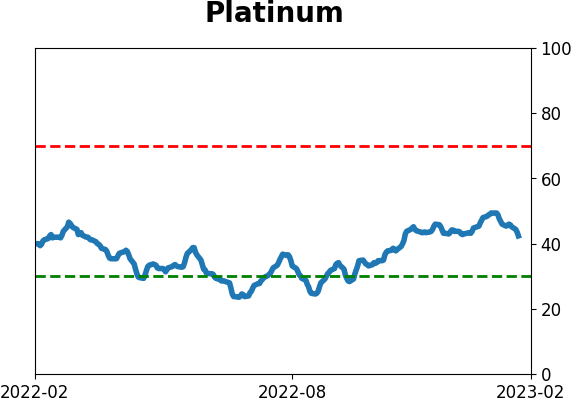
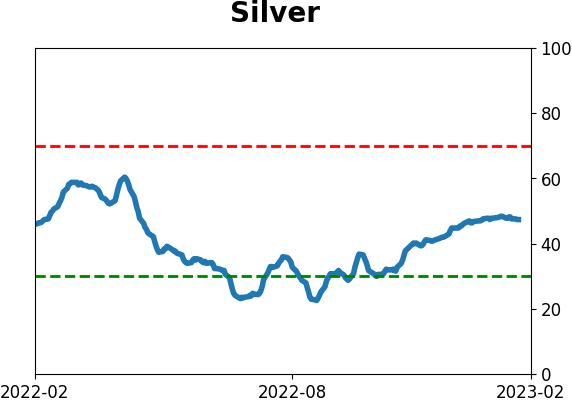
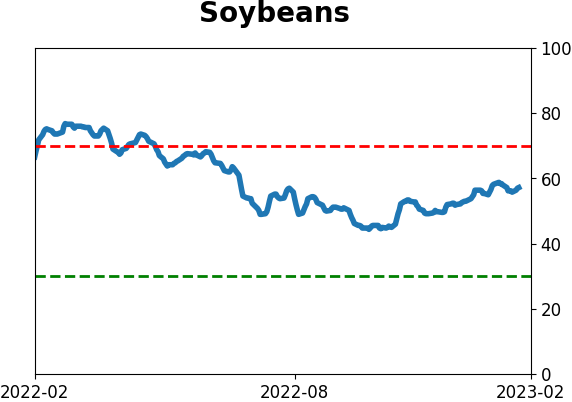
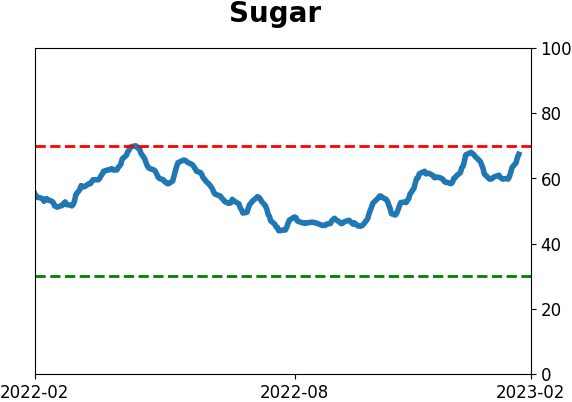
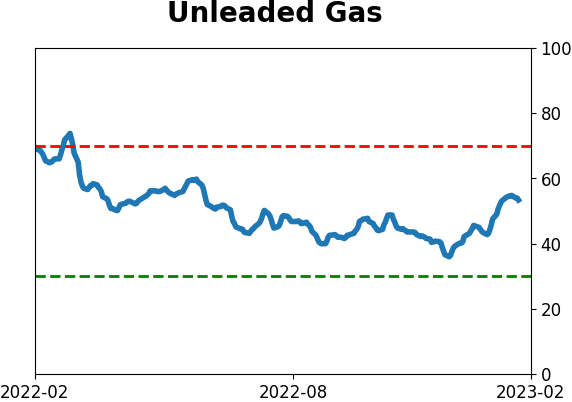
Commodity ETF's - 5-Day Moving Average
|
|