Headlines
|
|
Surveys show lowest relative optimism in 3 years:
The AAII survey last week showed a remarkable spike in bears, investors who expect stocks to fall in the coming months. That's not the only bearish survey, however, and the AIM Model is now below 5%. After other weeks in the bottom 1% of historical readings, the S&P 500's forward returns were well above average.
|
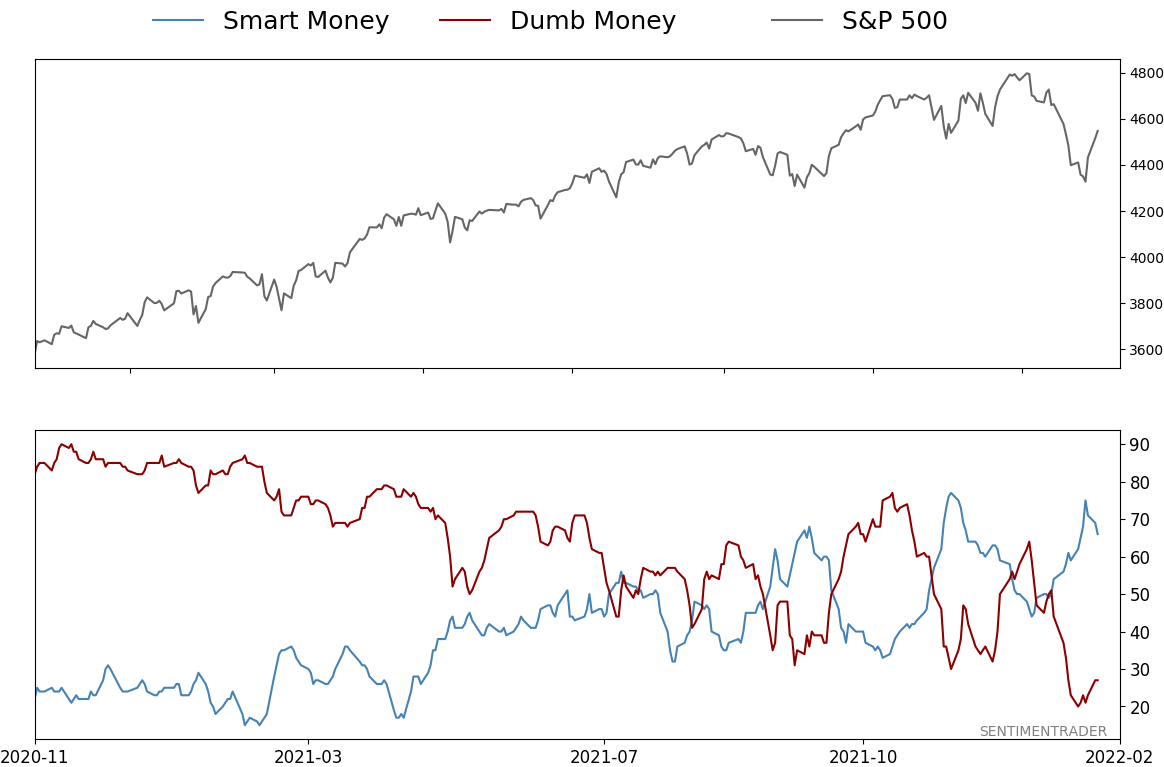
Smart / Dumb Money Confidence
|
Smart Money Confidence: 66%
Dumb Money Confidence: 27%
|
|
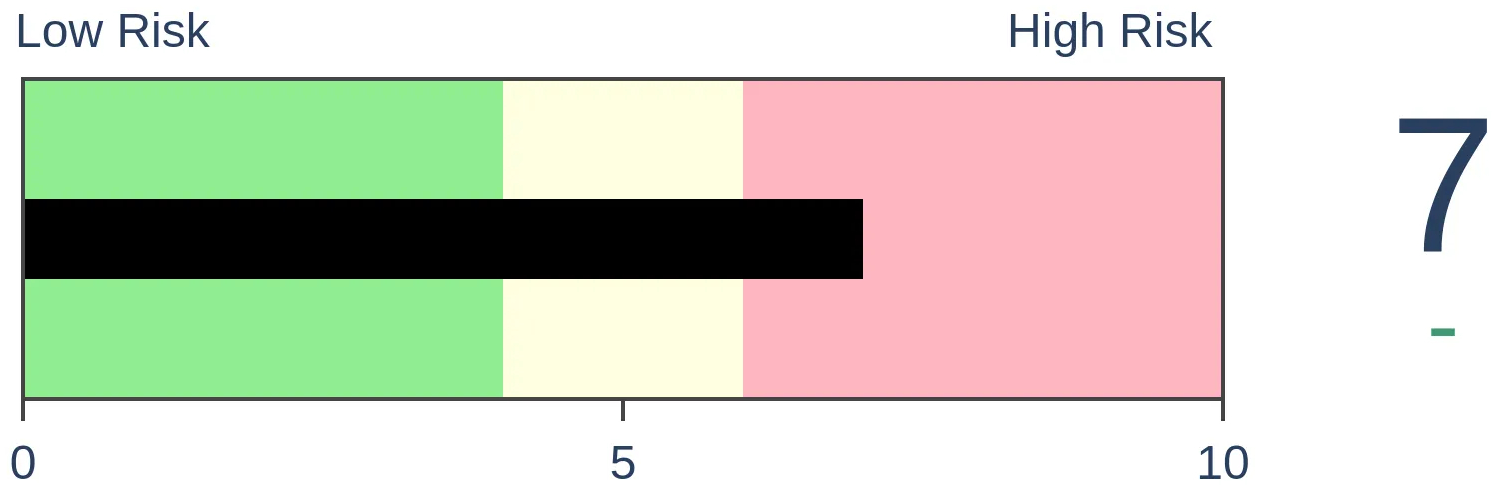
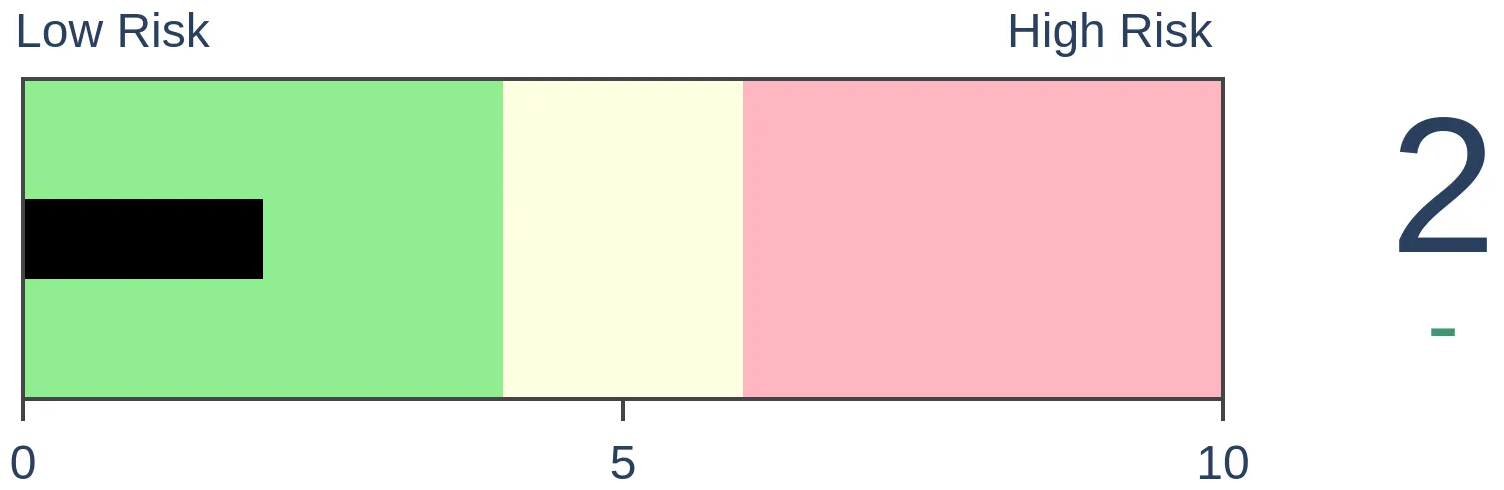
Risk Levels
Stocks Short-Term
|
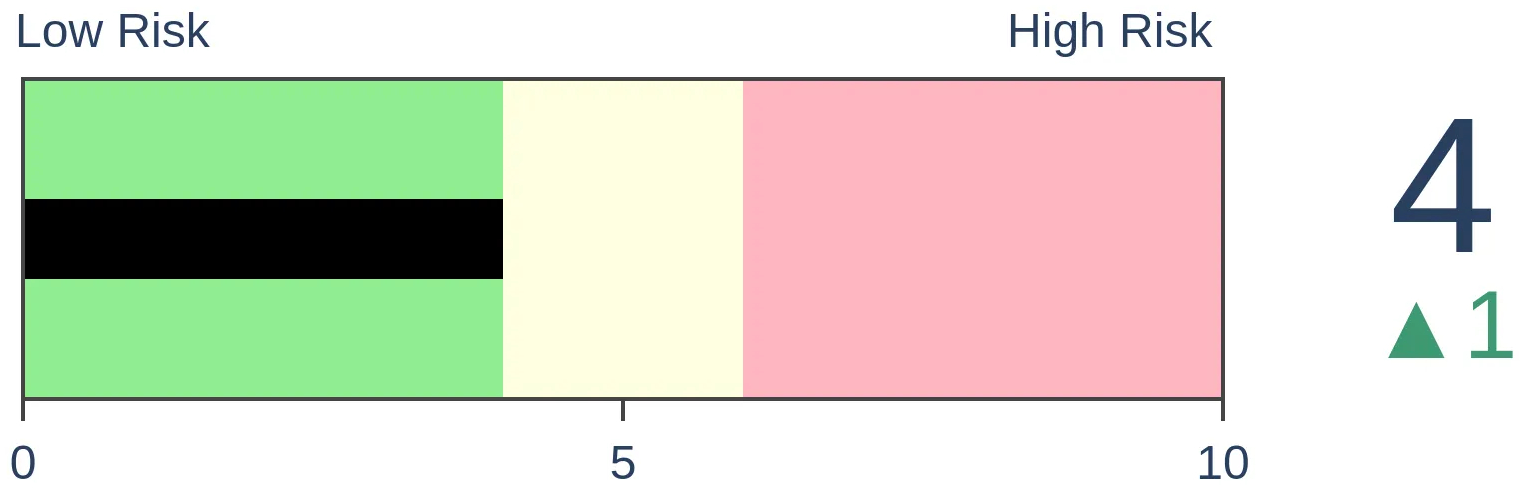
Stocks Medium-Term
|
|
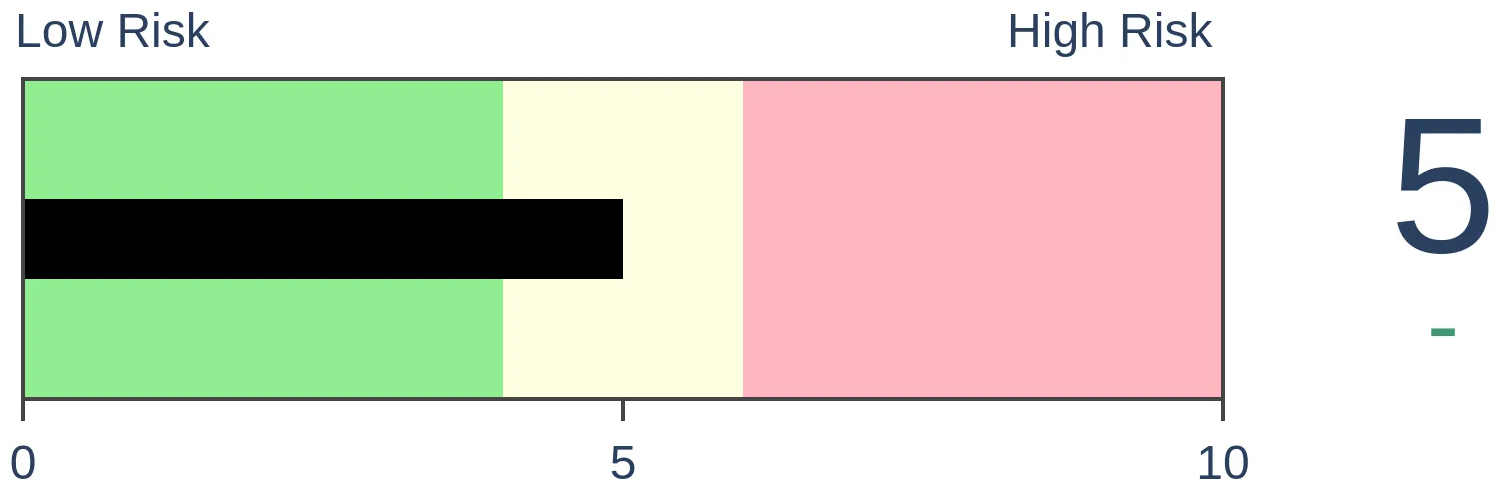
Bonds
|
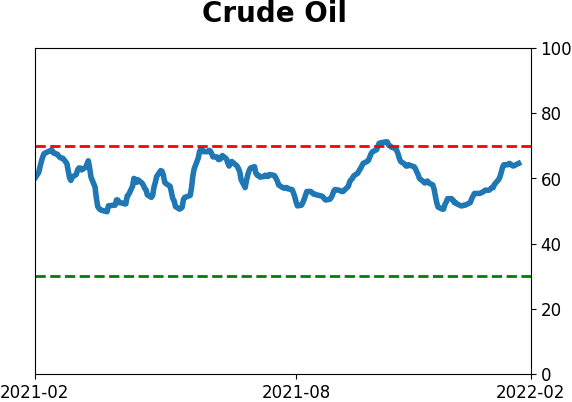
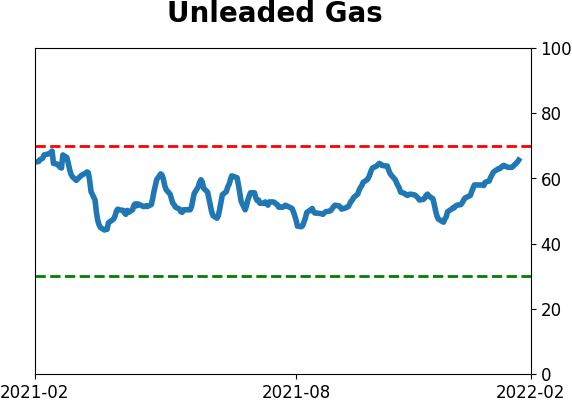
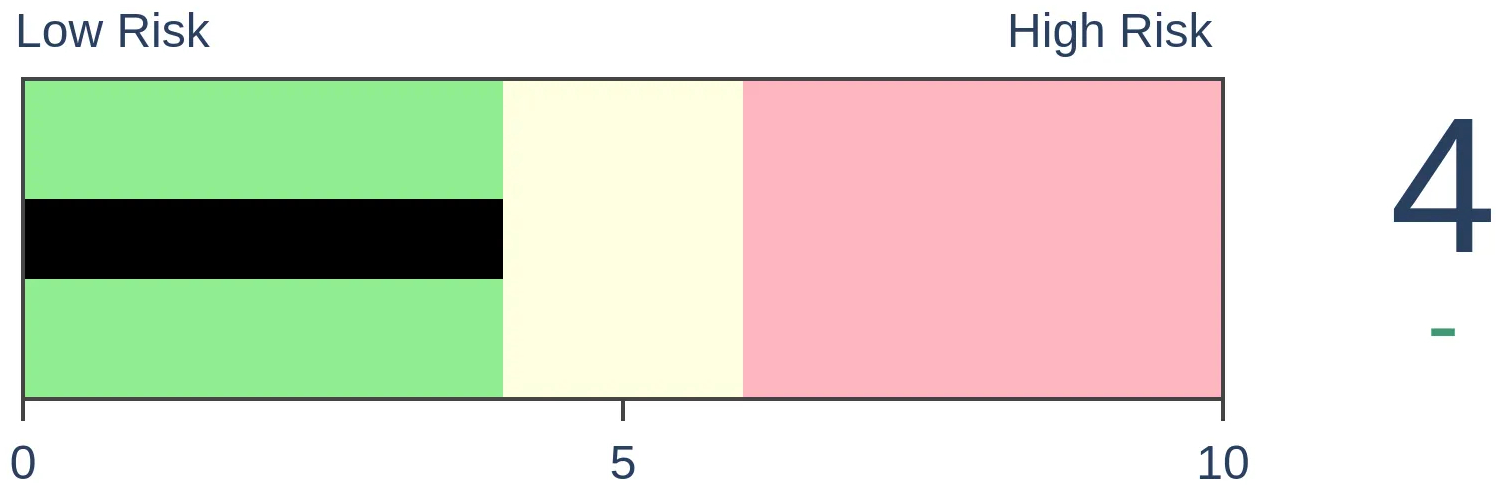
Crude Oil
|
|
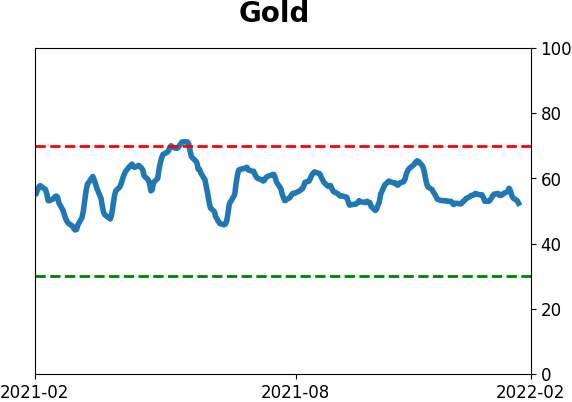
Gold

|
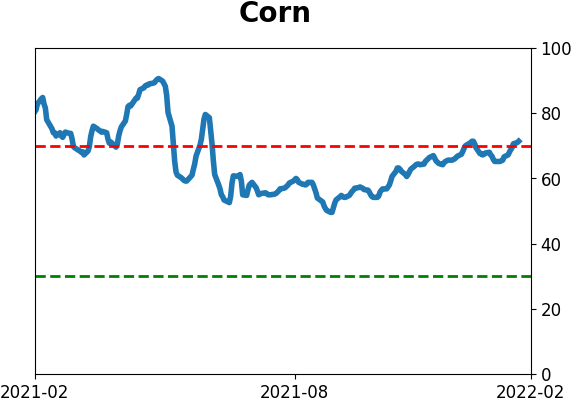
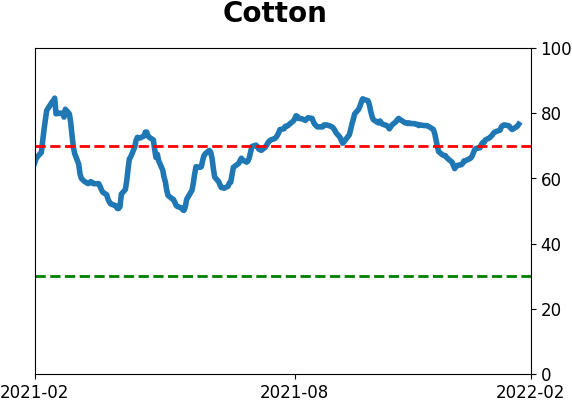
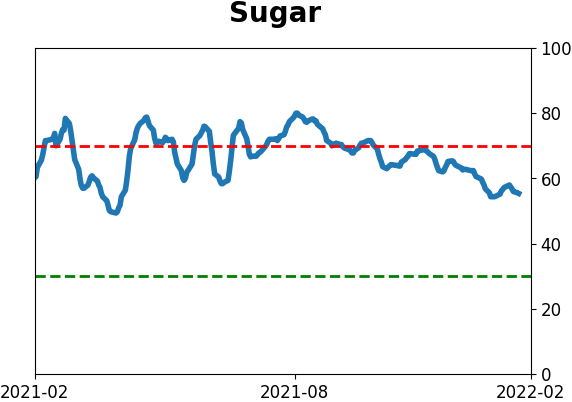
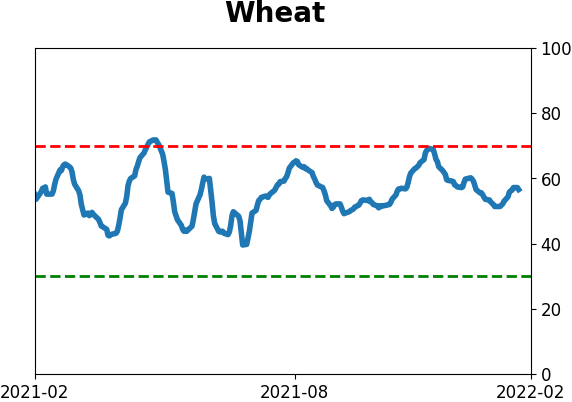
Agriculture
|
|
Research
By Jason Goepfert
BOTTOM LINE
The AAII survey last week showed a remarkable spike in bears, investors who expect stocks to fall in the coming months. That's not the only bearish survey, however, and the AIM Model is now below 5%. After other weeks in the bottom 1% of historical readings, the S&P 500's forward returns were well above average.
FORECAST / TIMEFRAME
SPY -- Up, Medium-Term
|
Key points:
- Sentiment surveys are showing extreme pessimism relative to recent history
- The AIM Model is now below 5%, one of the lowest readings in a decade
- S&P 500 returns after similarly low readings were almost universally positive
Surveys say excessive pessimism
We've seen how much sentiment has soured over the past couple of weeks from multiple perspectives. On Monday, more evidence came from small options traders, who spent a record amount on protective puts last week.
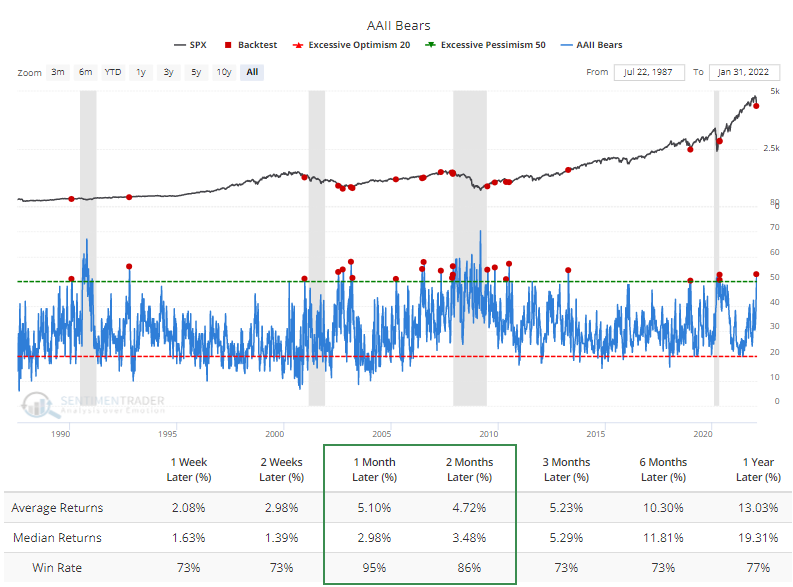
We prefer to focus on real-money gauges as opposed to surveys because people don't always do what they say they're going to do. Still, the survey of individual investors from AAII got quite a bit of attention last week. It showed that for one of the few times in the past decade, bears accounted for more than 50% of respondents.
The Backtest Engine shows that when more than 50% of investors said they were bearish and the U.S. economy was not in a recession at the time, the S&P 500 rallied during the next month after 21 out of 22 signals (and that sole loss was reversed during the subsequent month).
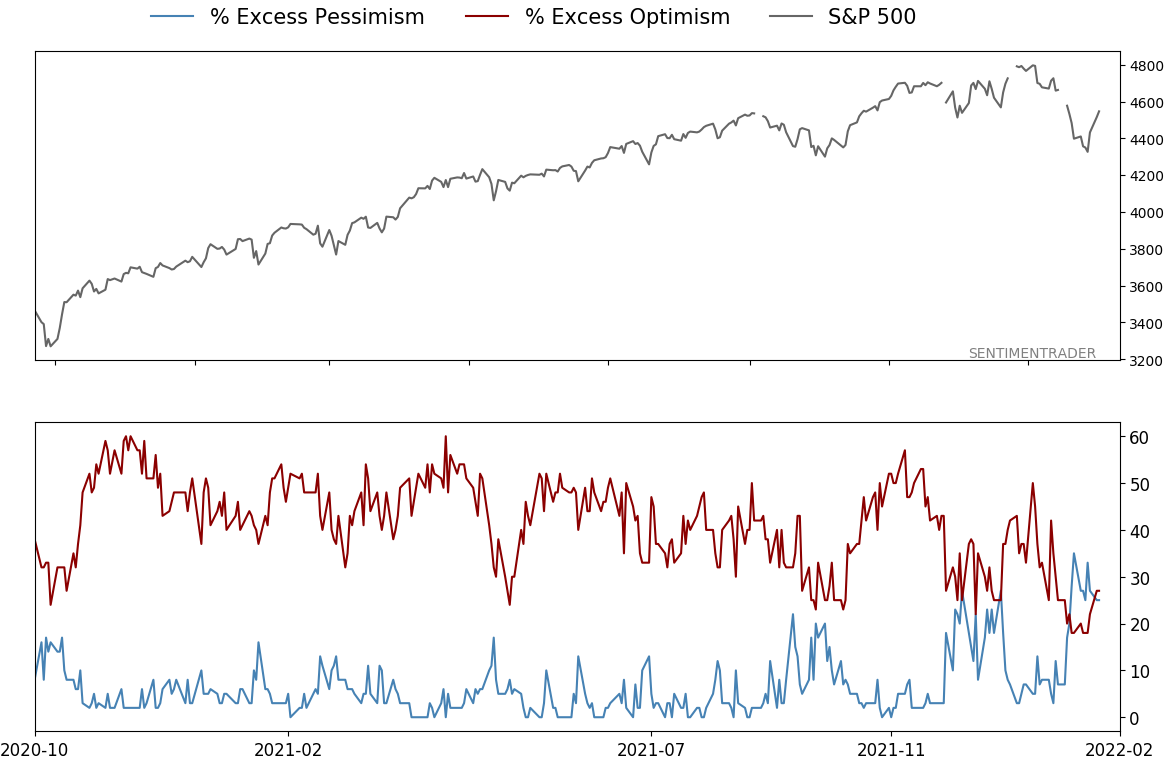
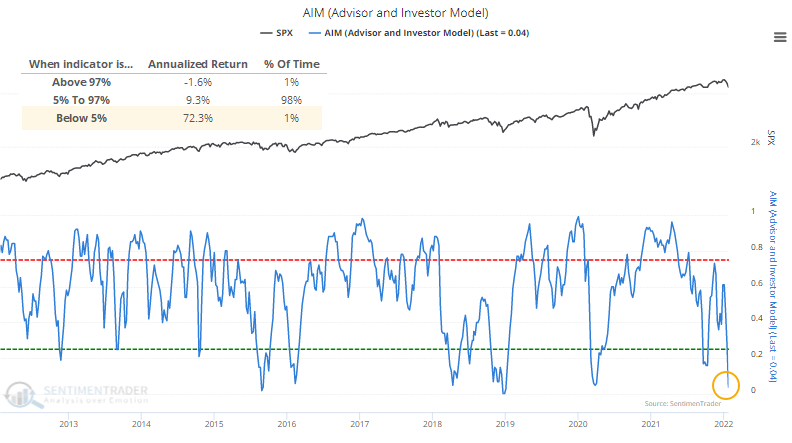
The AIM Model looks at a handful of popular sentiment surveys and calculates the relative amount of optimism in each one. As of the latest reading, there isn't much of it. The AAII survey isn't the only one showing a low degree of confidence among investors.
A reading below 5% in the model is rare, accounting for fewer than 1% of days since 1990. The S&P 500's annualized return following a reading that low was +72.3%, compared to -1.6% when the model was in the top 1% of readings.
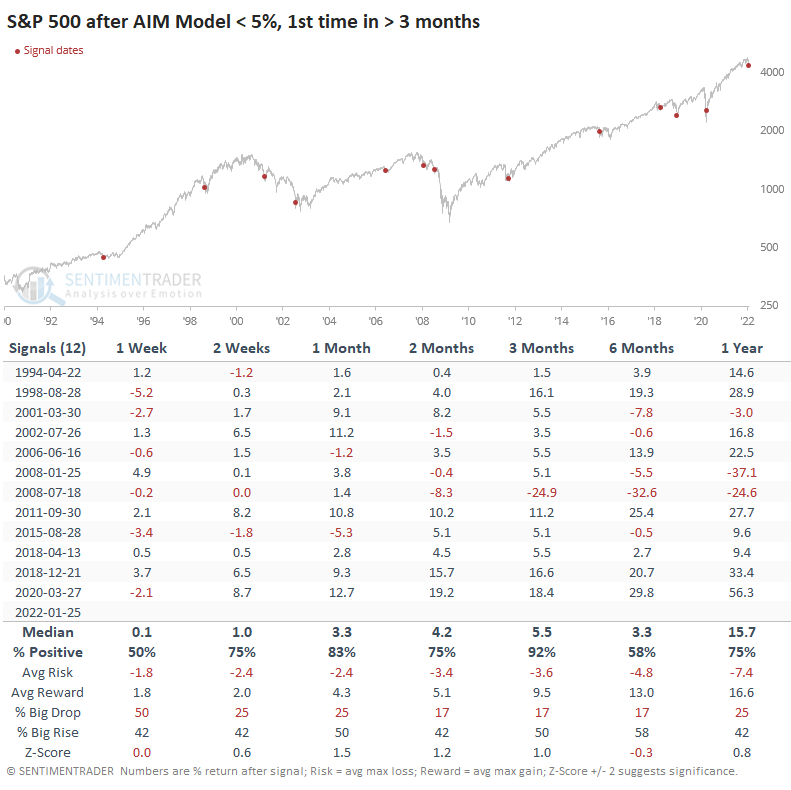
This was the first reading of true pessimism in at least 3 months. The table below shows that the S&P tended to perform well after these first bursts of pessimism. Over the next 3 months, it rose over 11 out of 12 signals, though that loser was dismal.
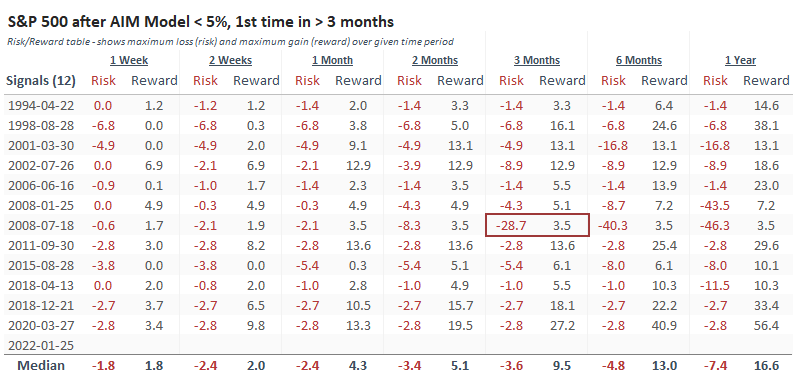
The Risk/Reward Table shows that the only signal that led to a maximum loss of more than -10% at any point within the next 3 months was that one in 2008. Losses after the others were mostly minimal, while double-digit gains were more common than not.
What the research tells us...
As we saw with small options traders, when sentiment gets as extreme as is indicated by the AIM Model, forward returns in stocks tend to be consistently positive, especially over the medium-term of 1-3 months. Since the market environment is unhealthy, we have to be careful about placing too much weight on readings like this, and for too long. For a multi-week or even multi-month rebound, it's fine. Longer than that, we need a marked improvement in the environment.
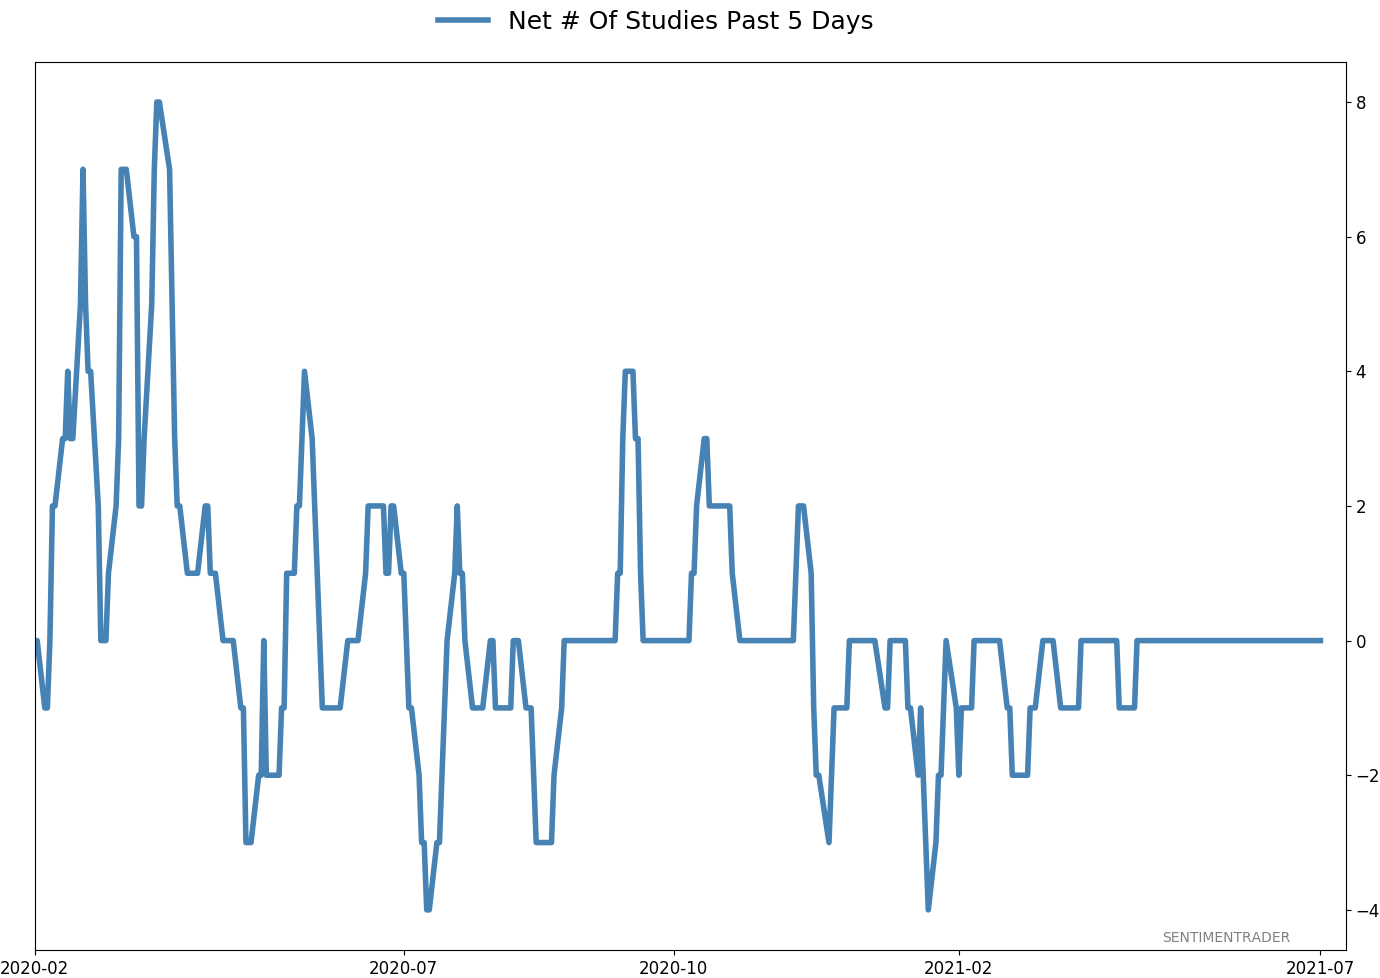
Active Studies
| Time Frame | Bullish | Bearish | | Short-Term | 3 | 0 | | Medium-Term | 15 | 2 | | Long-Term | 14 | 5 |
|
Indicators at Extremes
Portfolio
| Position | Description | Weight % | Added / Reduced | Date | | Stocks | RSP | 21.4 | Added 10.2% | 2022-01-28 | | Bonds | 32.7% BND, 7.1% SCHP | 40.1 | Added 8.3% | 2021-10-26 | | Commodities | GCC | 2.4 | Reduced 2.1%
| 2020-09-04 | | Precious Metals | GDX | 4.6 | Reduced 4.2% | 2021-05-19 | | Special Situations | 8.1% KWEB, 3.6% XLE, 1.7% PSCE | 13.4 | Reduced 3.9% | 2022-01-18 | | Cash | | 17.9 | | |
|
Updates (Changes made today are underlined)
With a typical time frame of several months in this account, I normally don't make changes so quickly. I've added back part of the stock exposure I took off earlier in January due to the washed-out conditions and extreme pessimism we're seeing across a wide array of metrics. The biggest issue is that the environment is unhealthy and we could be in the throes of a protracted bear market. Even so, the readings we've seen recently have a good record at preceding relief rallies, so we'll have to see how that pans out. Bond sentiment is trying to recover from a recent bout of pessimism, and gold stocks are doing their thing which is not much at all. They've been flat for six months. Chinese tech stocks were doing exactly what they're supposed to do, then did *not* by plunging to new lows. This is troubling on a shorter-term time frame, but this was never meant for a trade, rather a multi-year investment. Recent behavior is troubling and I will not be adding any exposure as long as that's the case. RETURN YTD: +0.3% 2021: +8.7%, 2020: +8.1%, 2019: +12.6%, 2018: +0.6%, 2017: +3.8%, 2016: +17.1%, 2015: +9.2%, 2014: +14.5%, 2013: +2.2%, 2012: +10.8%, 2011: +16.5%, 2010: +15.3%, 2009: +23.9%, 2008: +16.2%, 2007: +7.8%
|
|
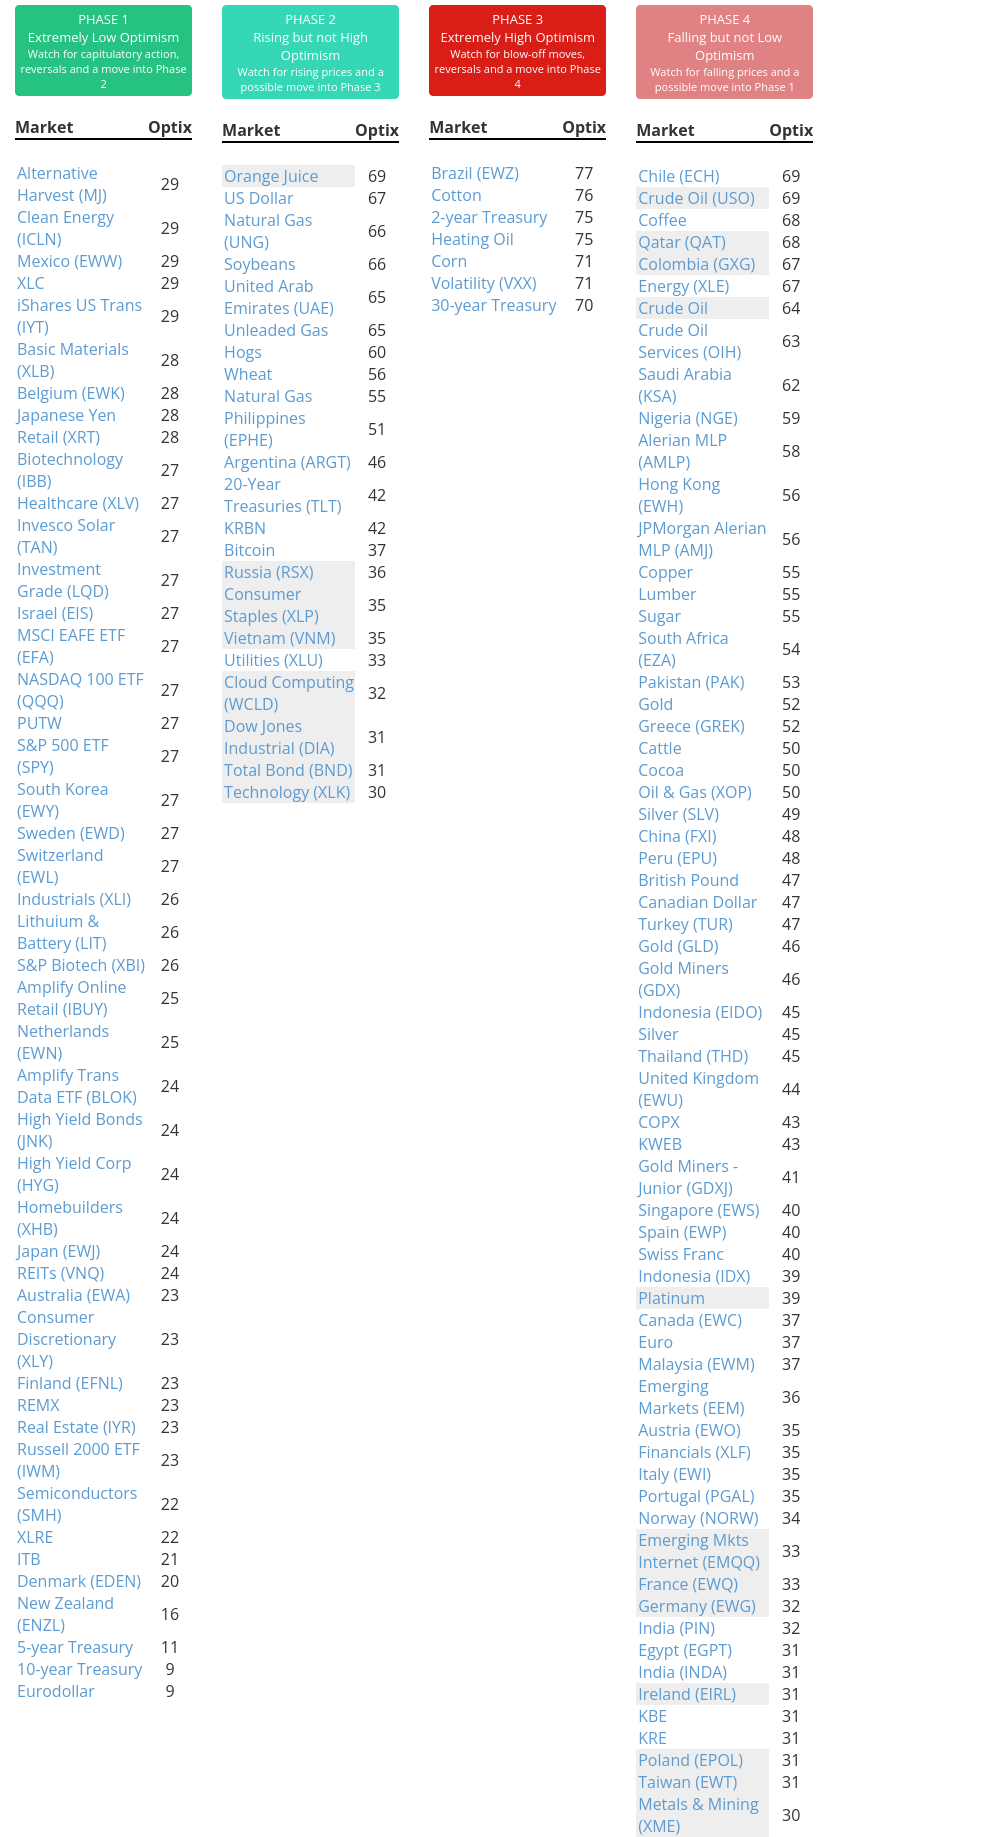
Phase Table
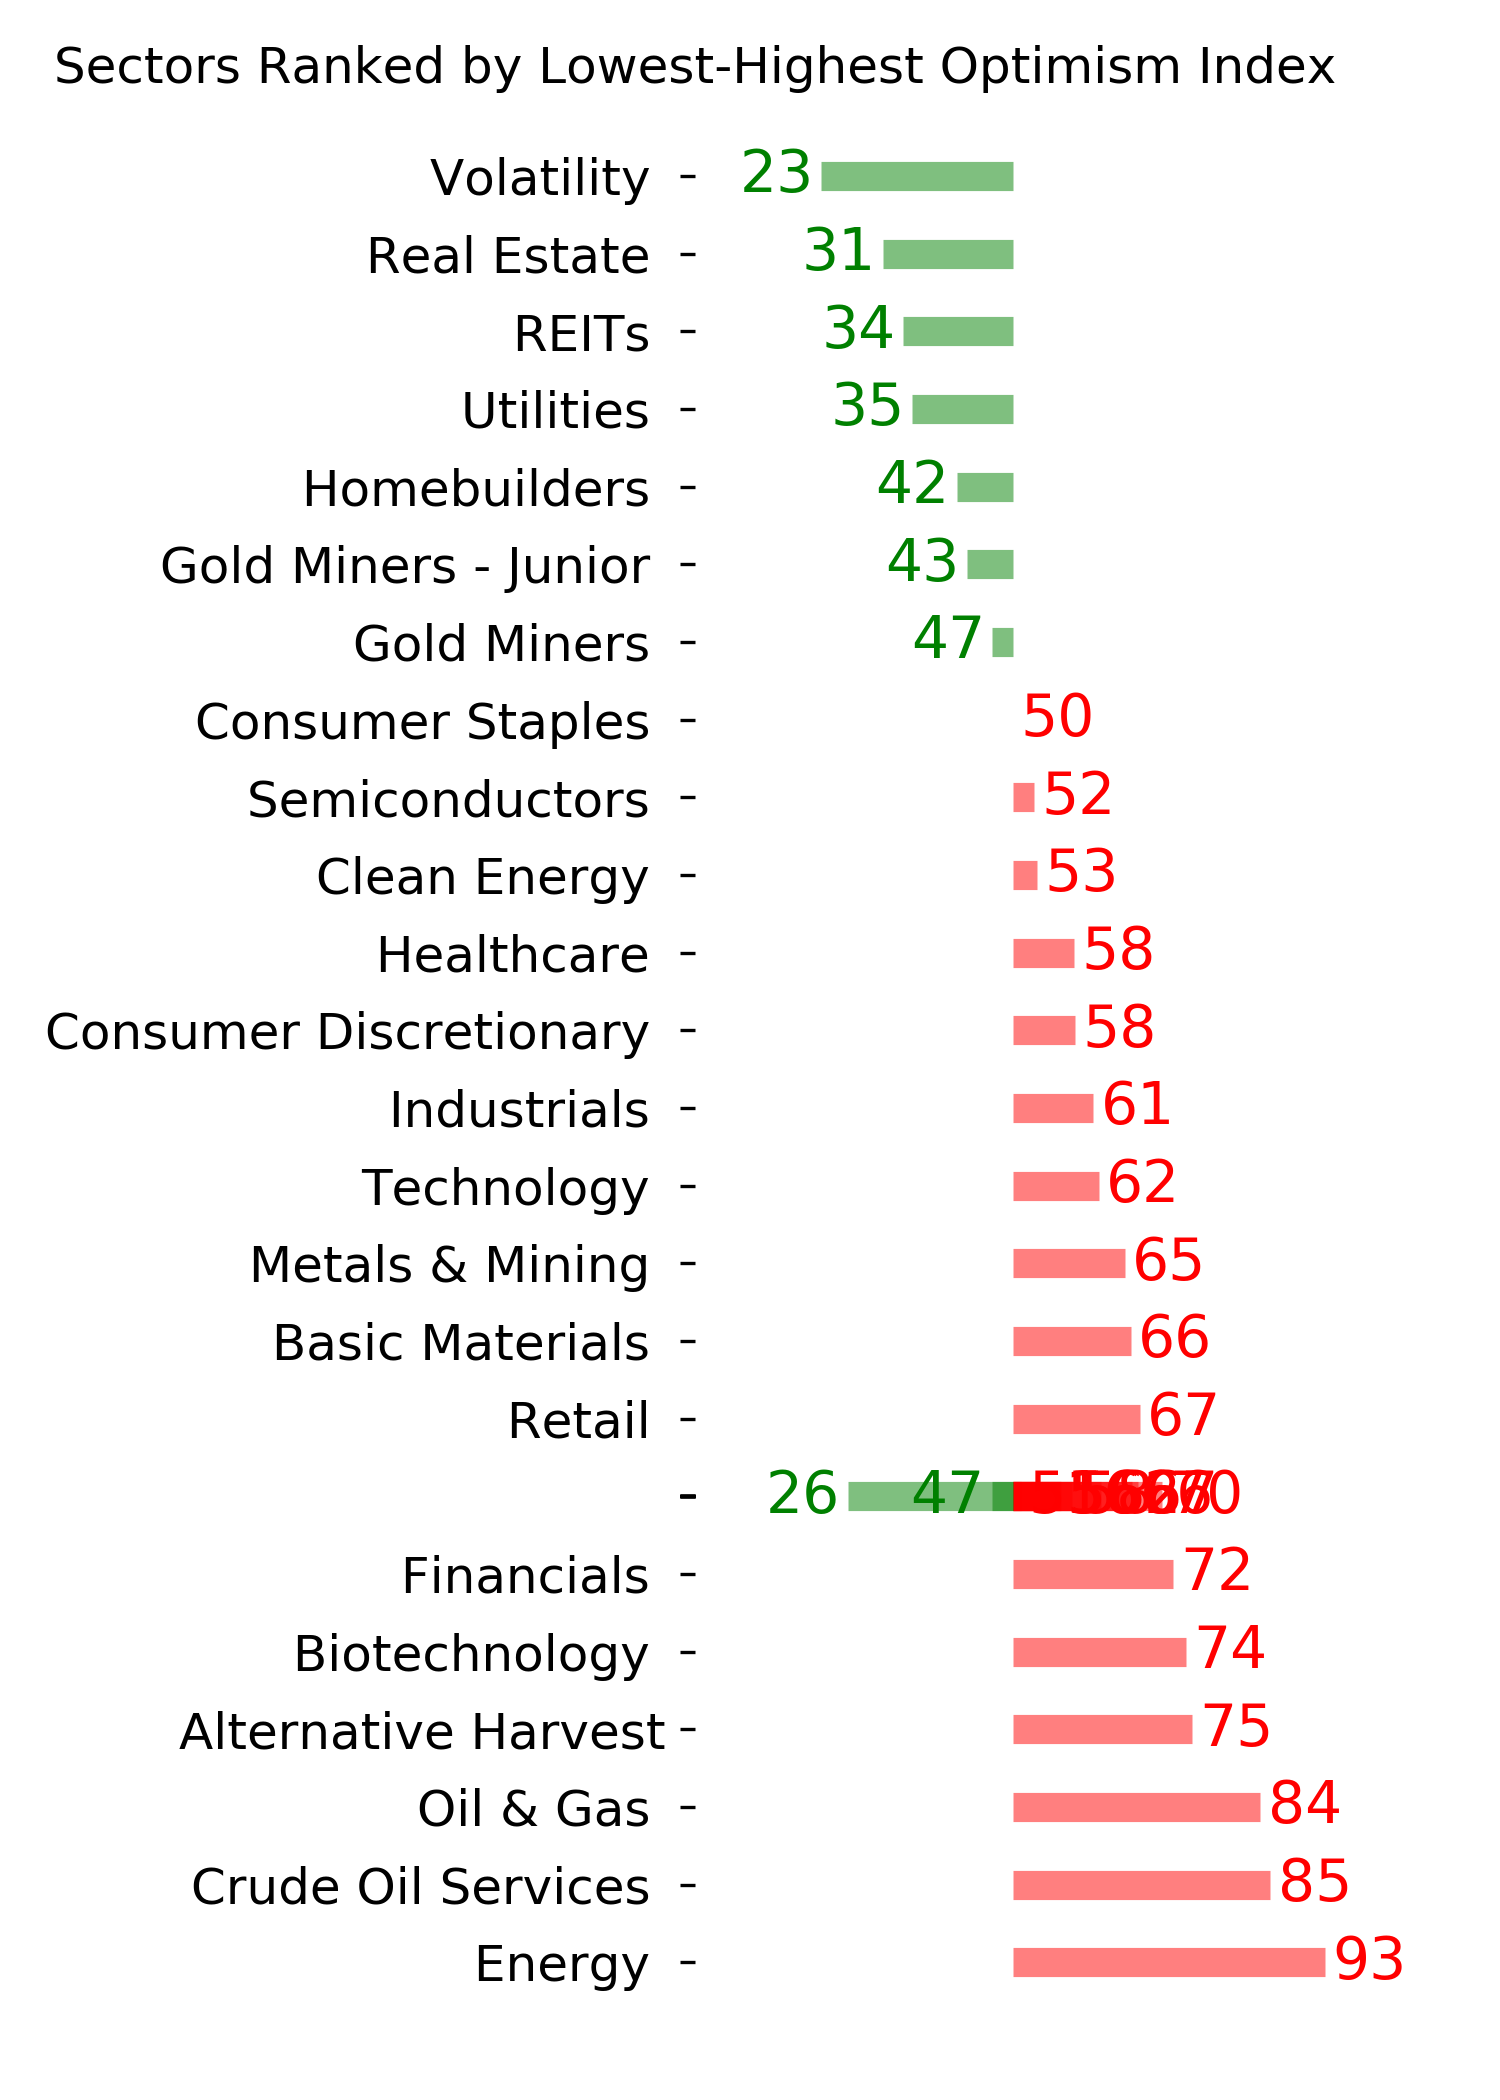
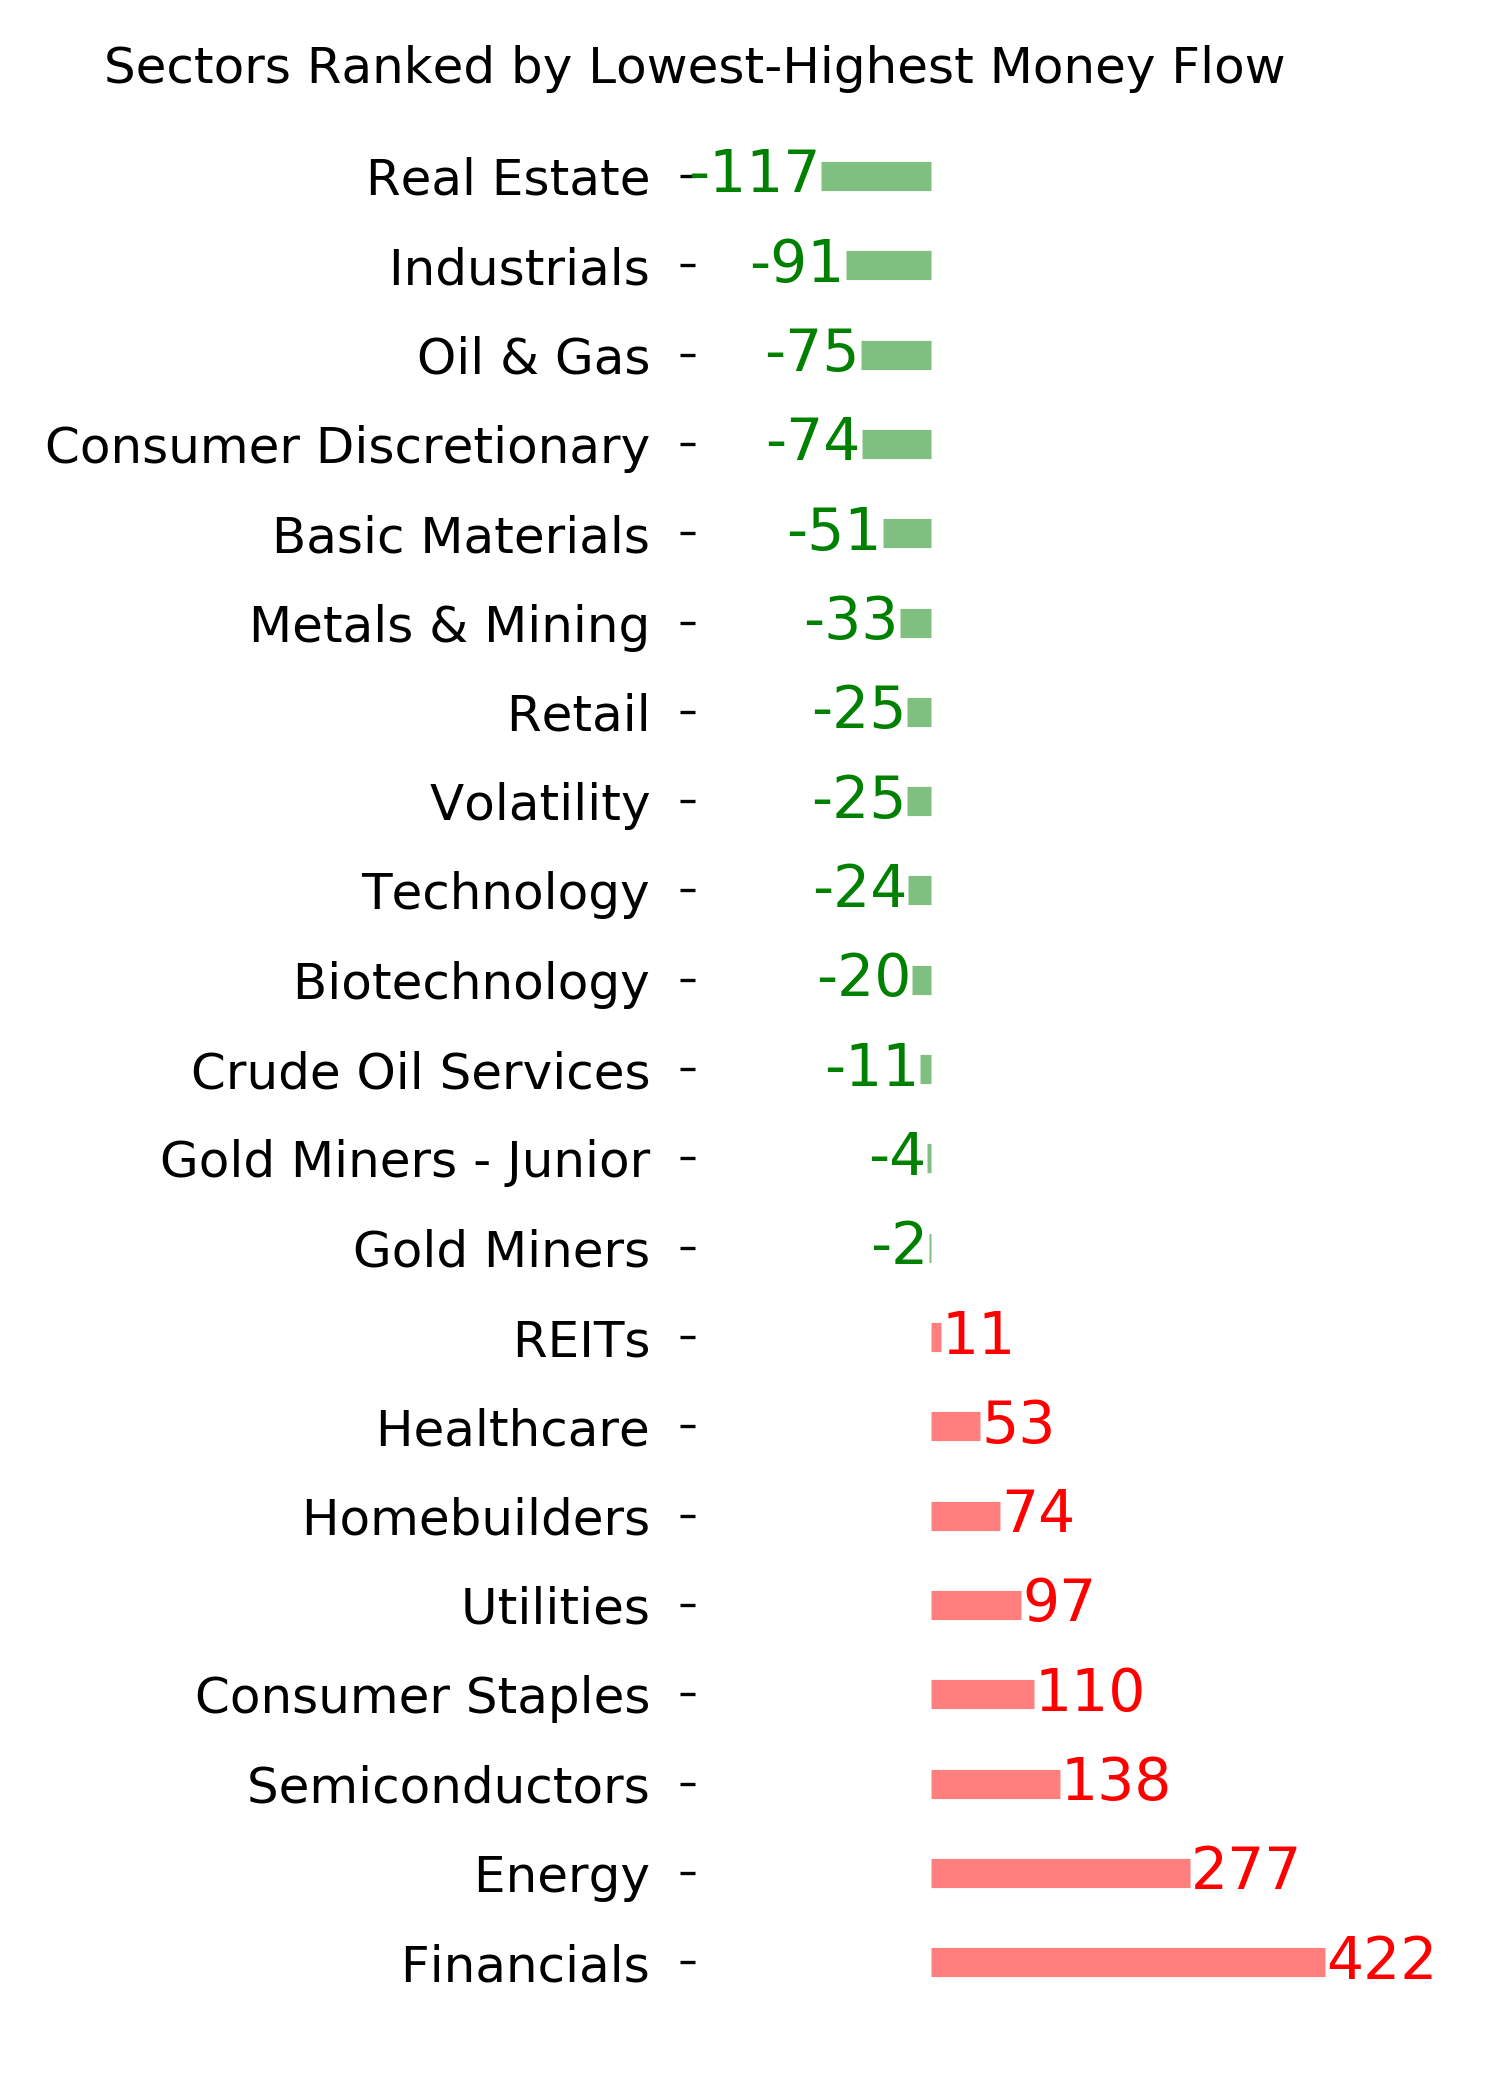
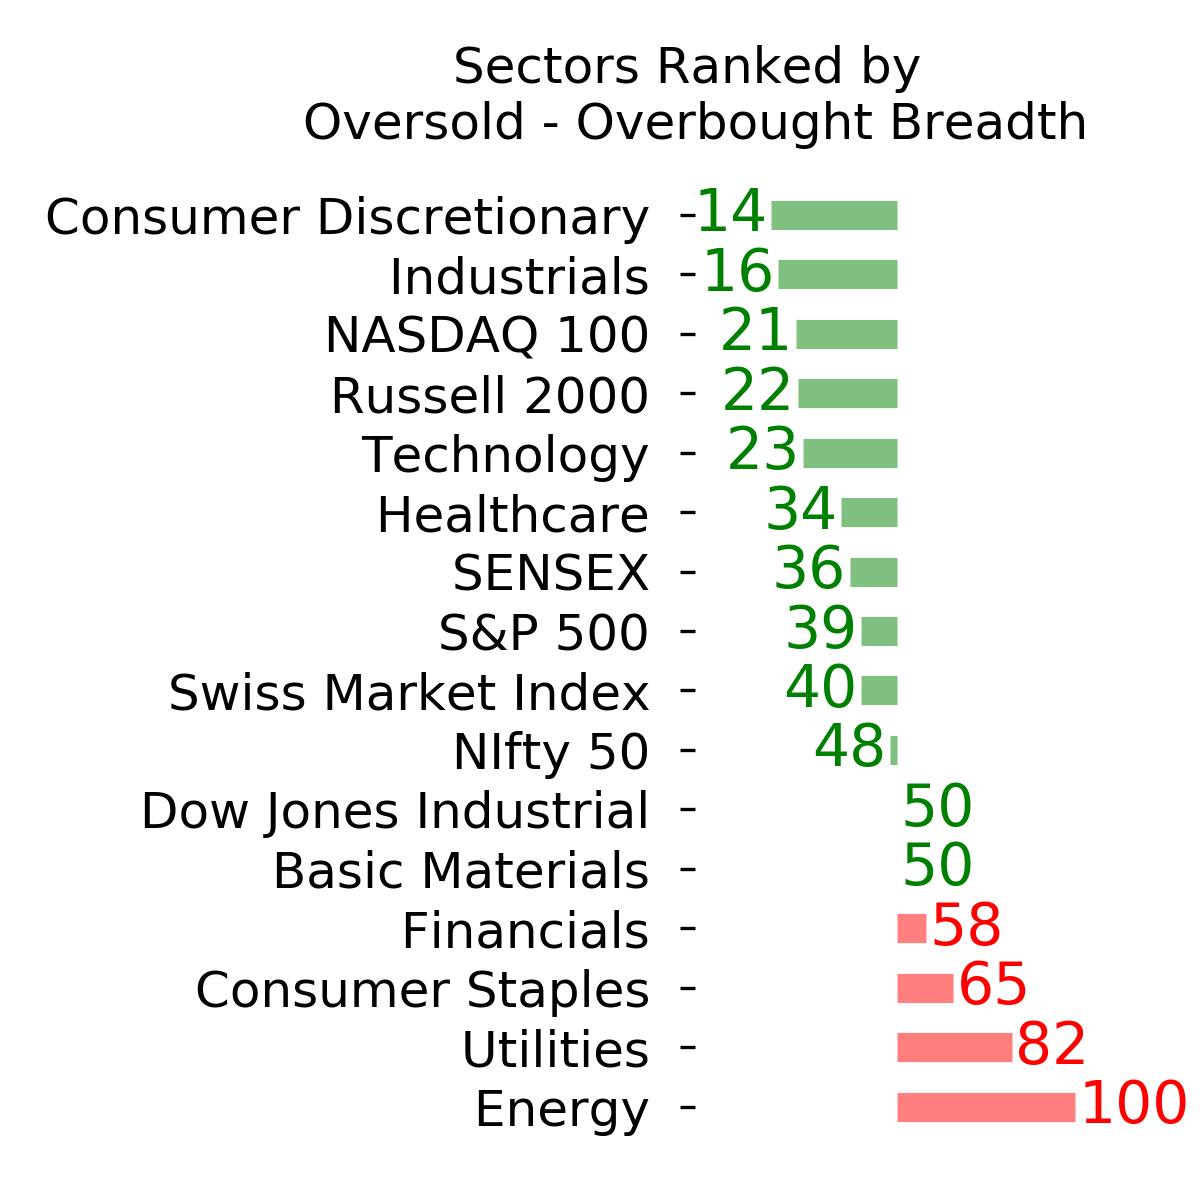
Ranks
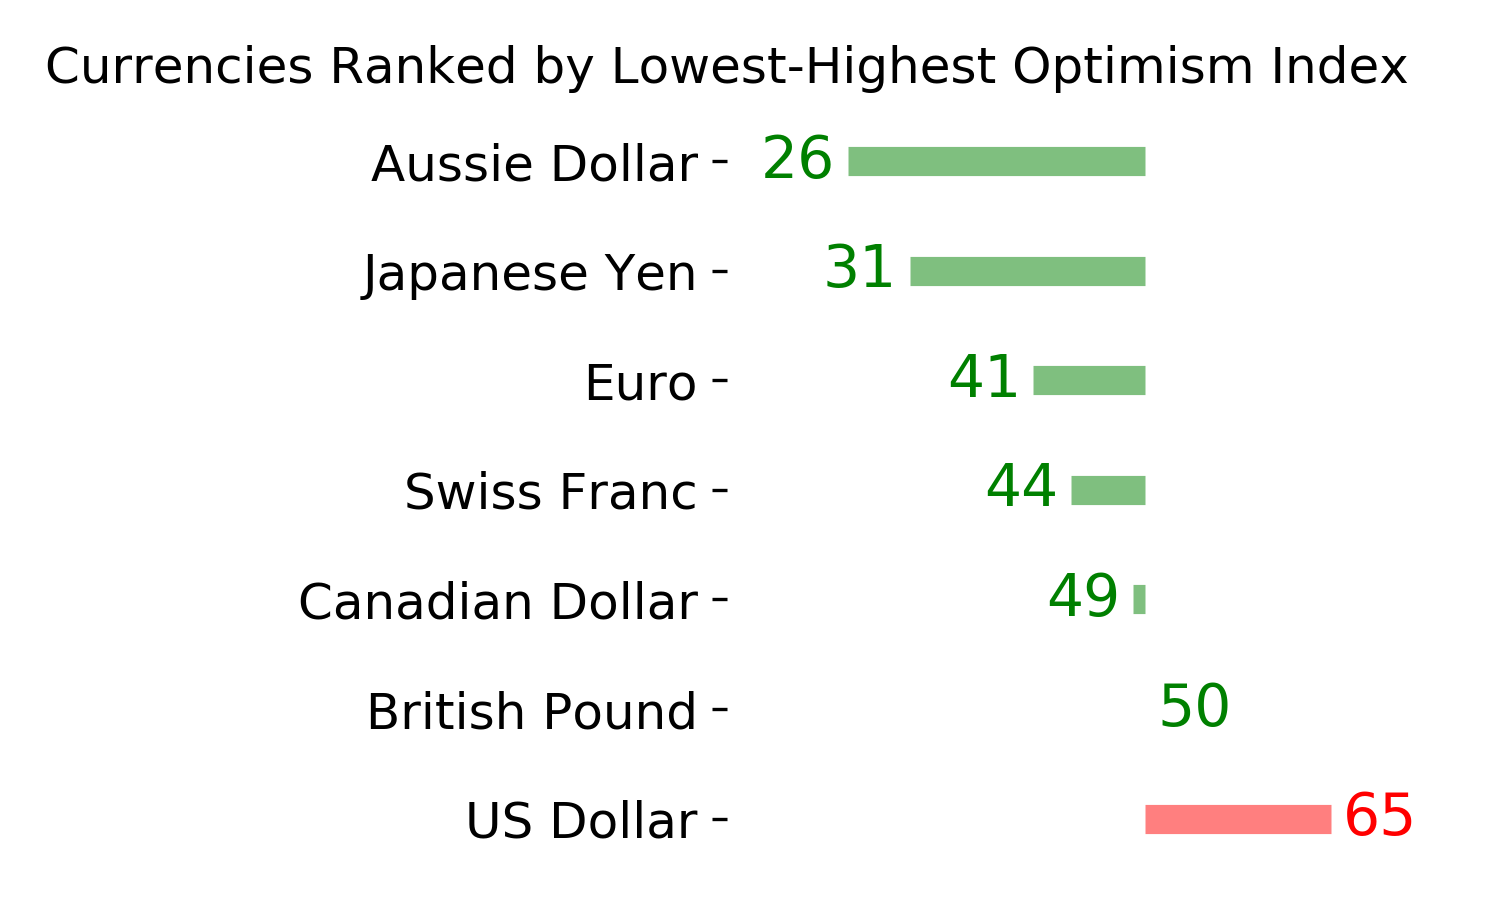
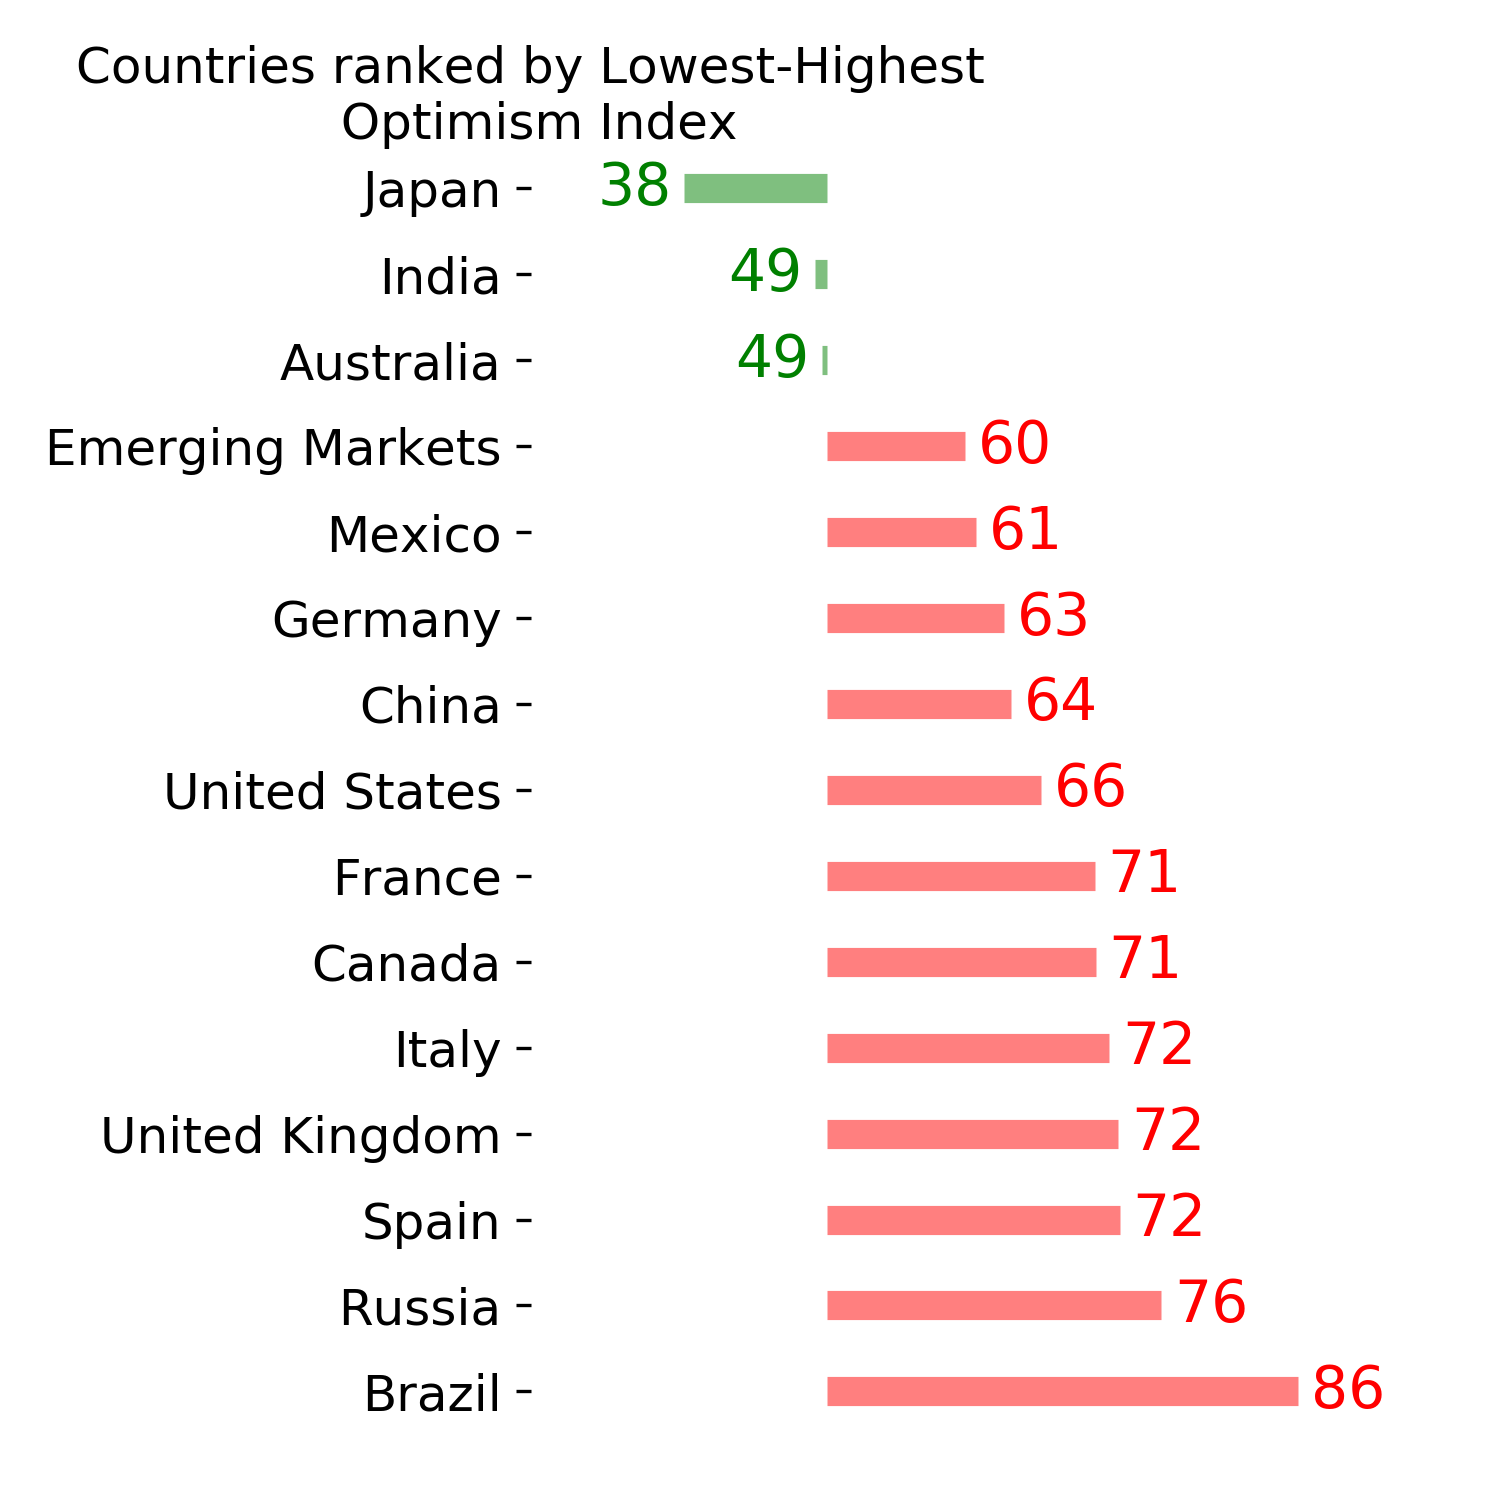
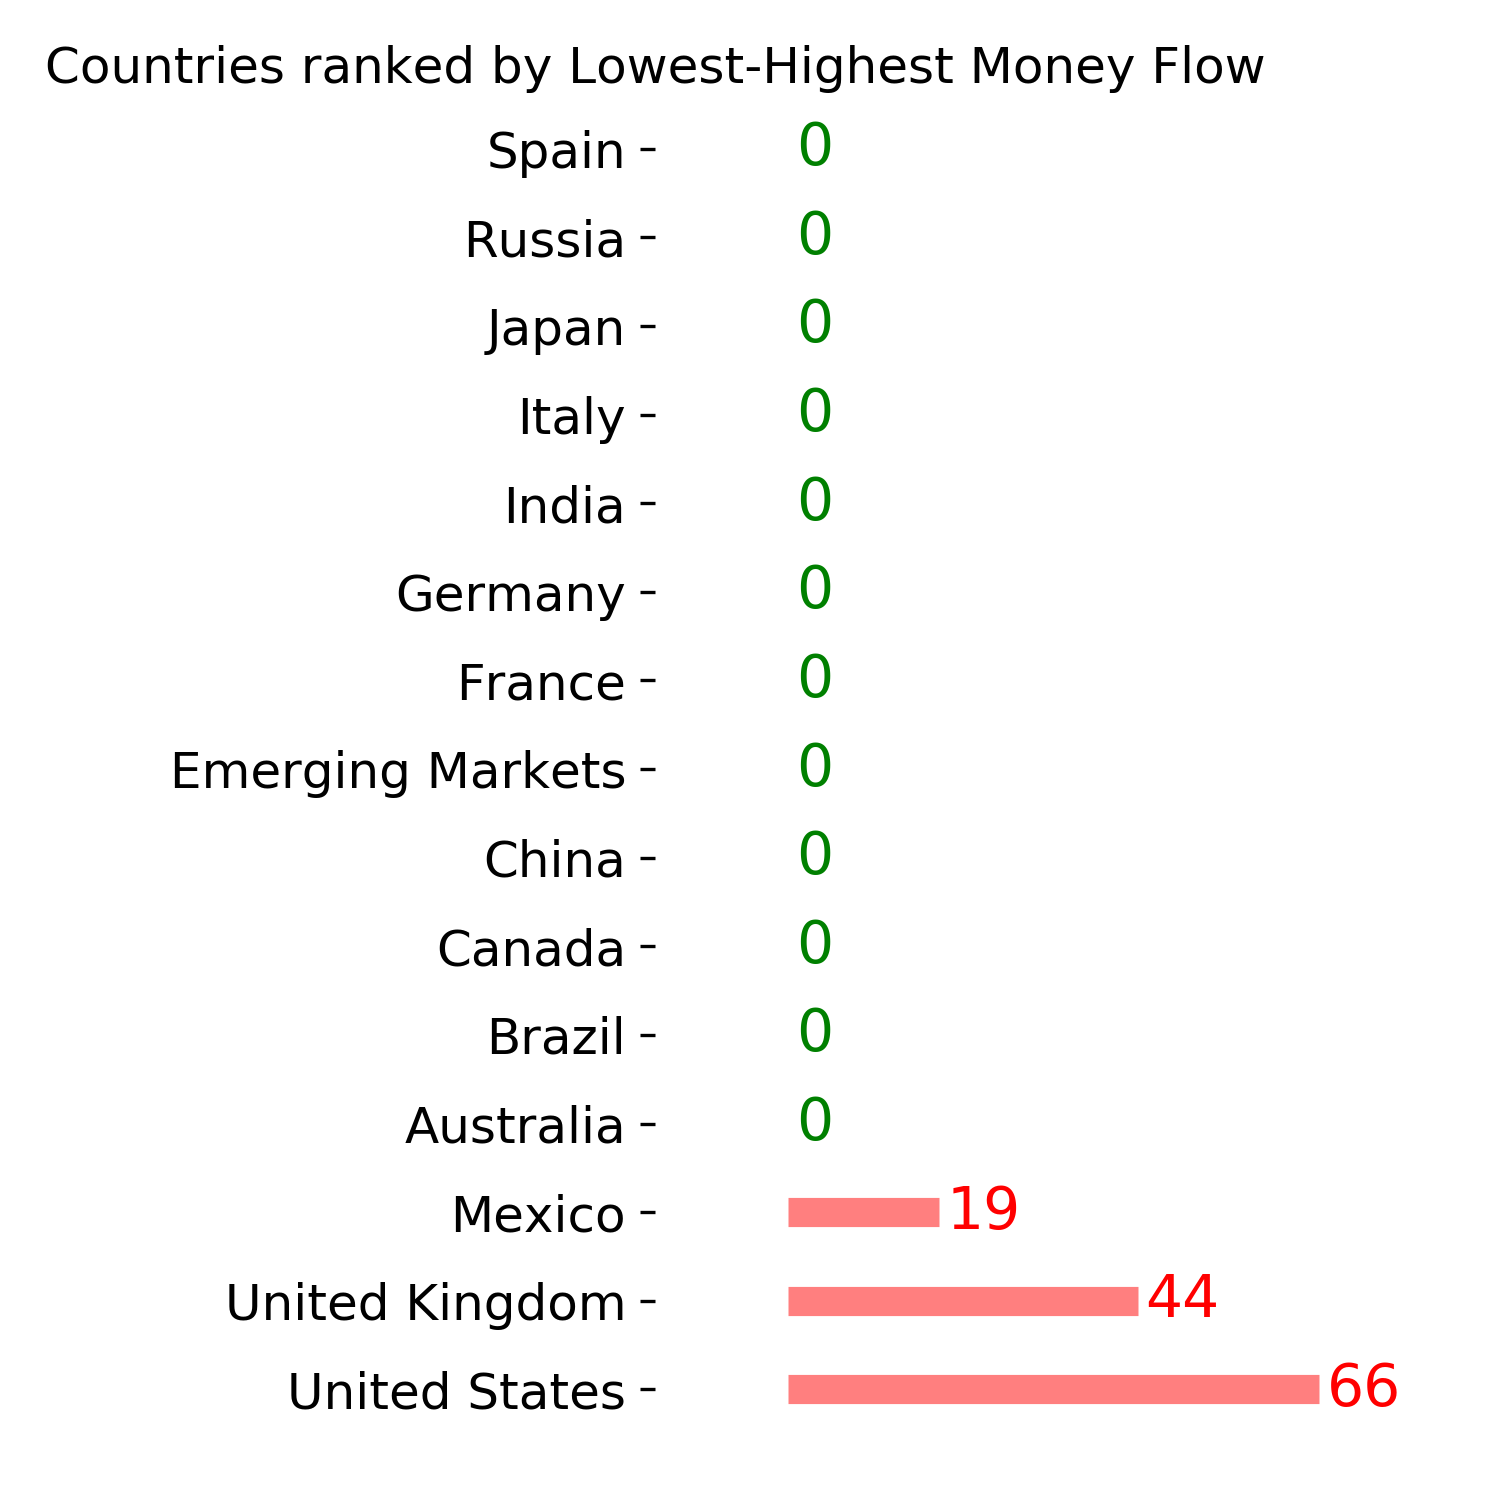
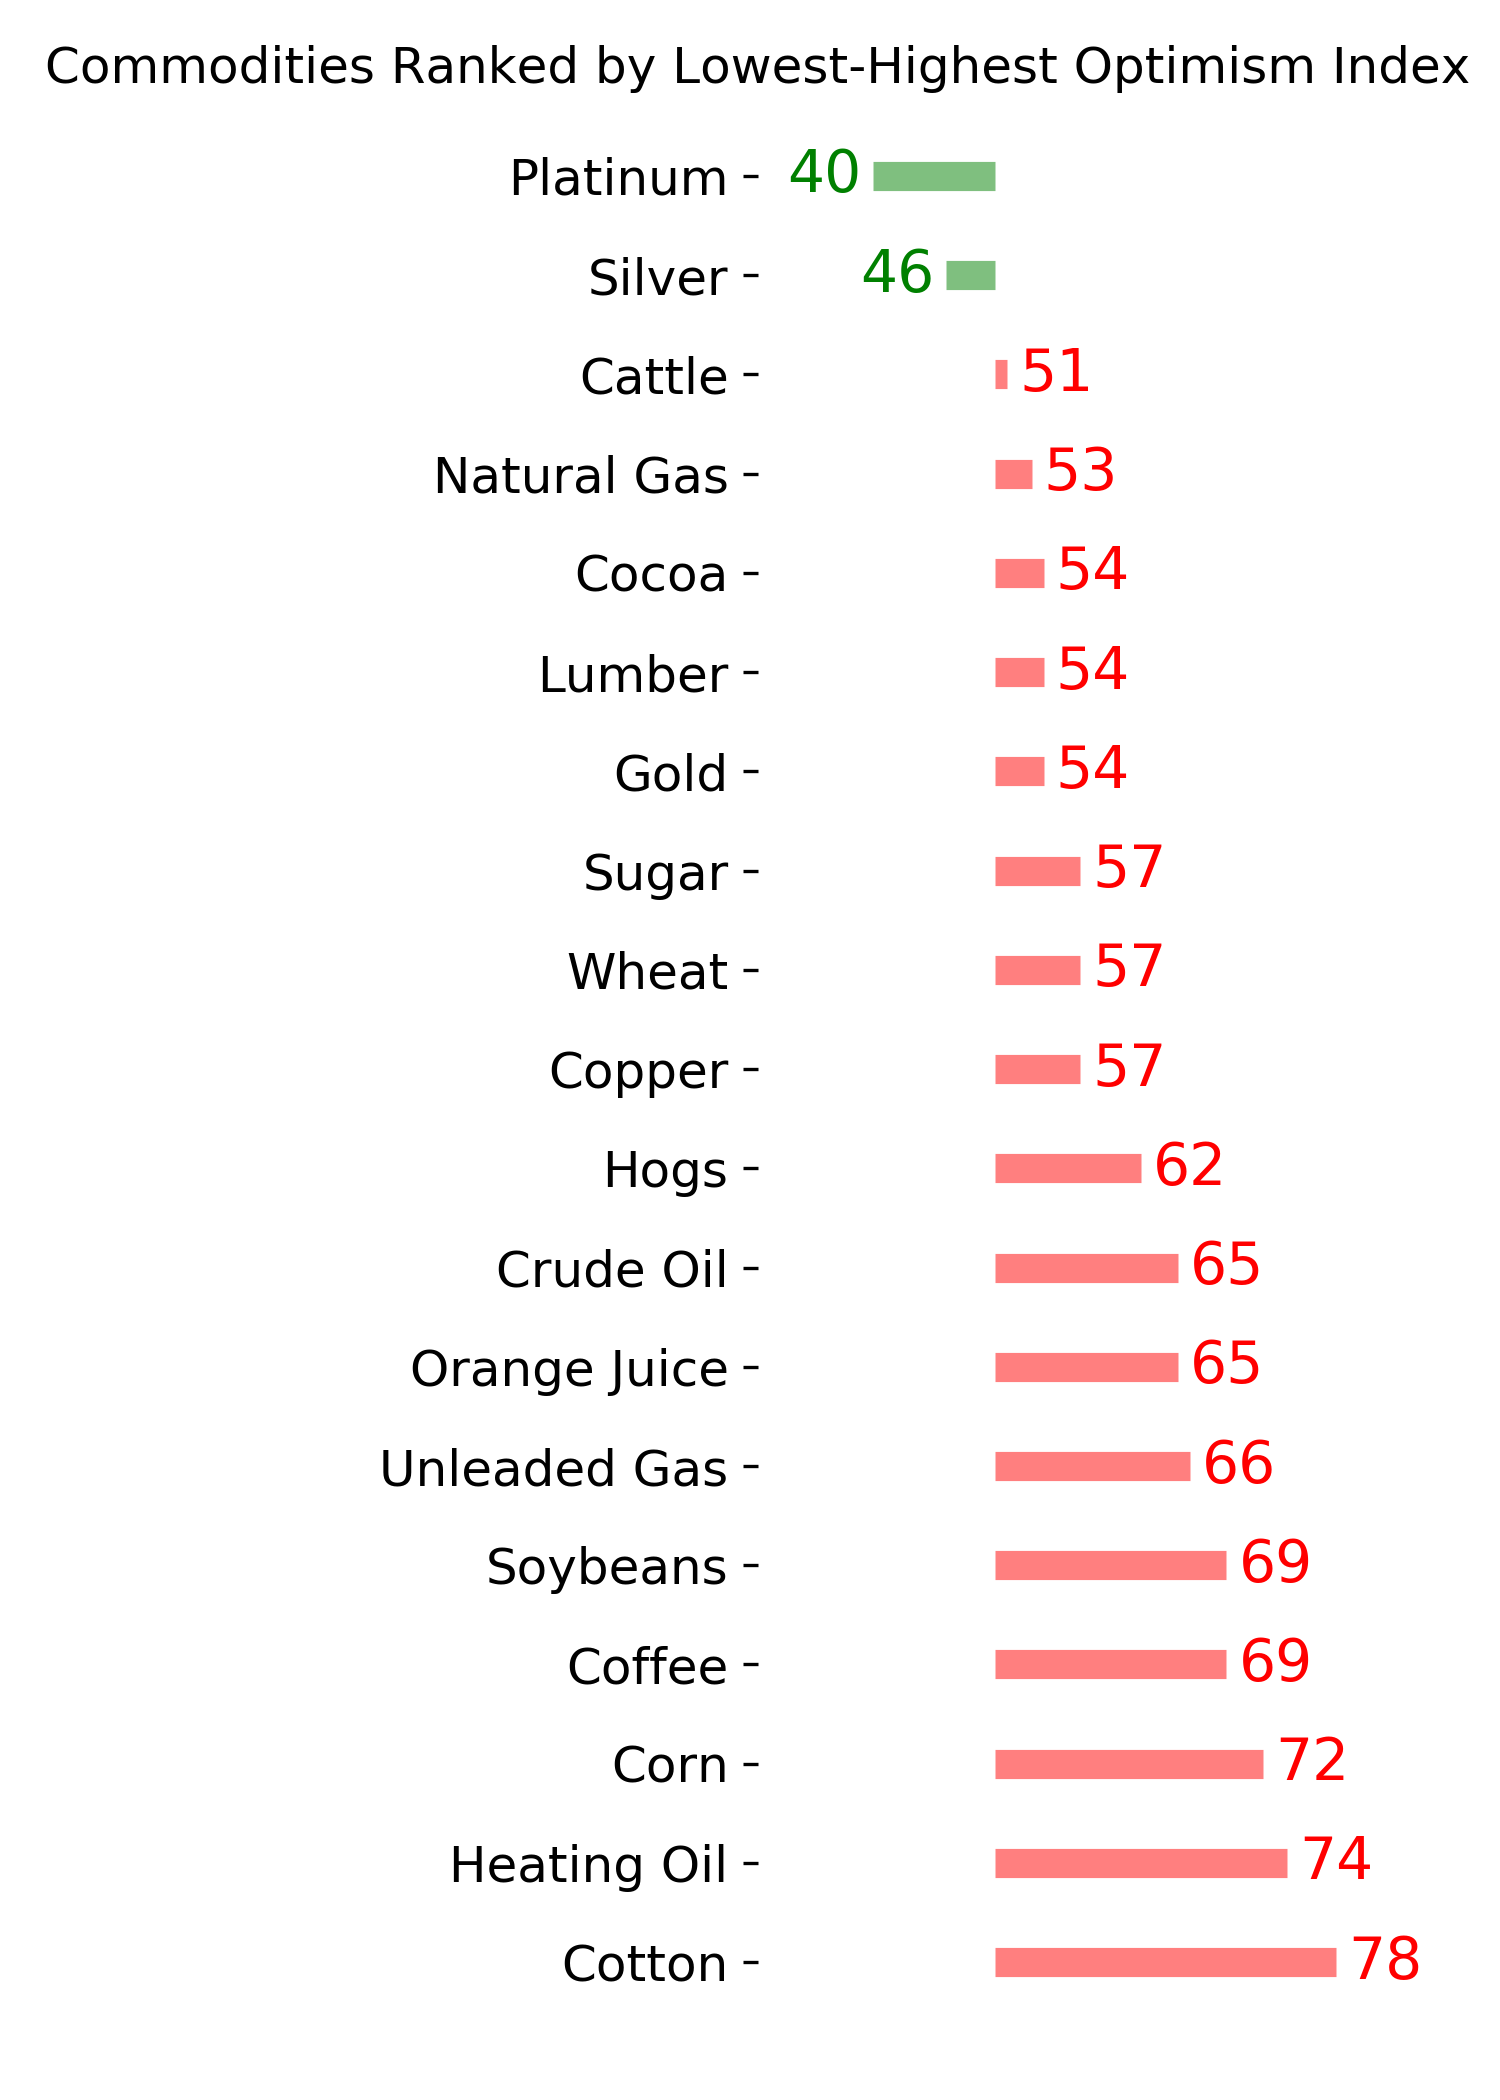
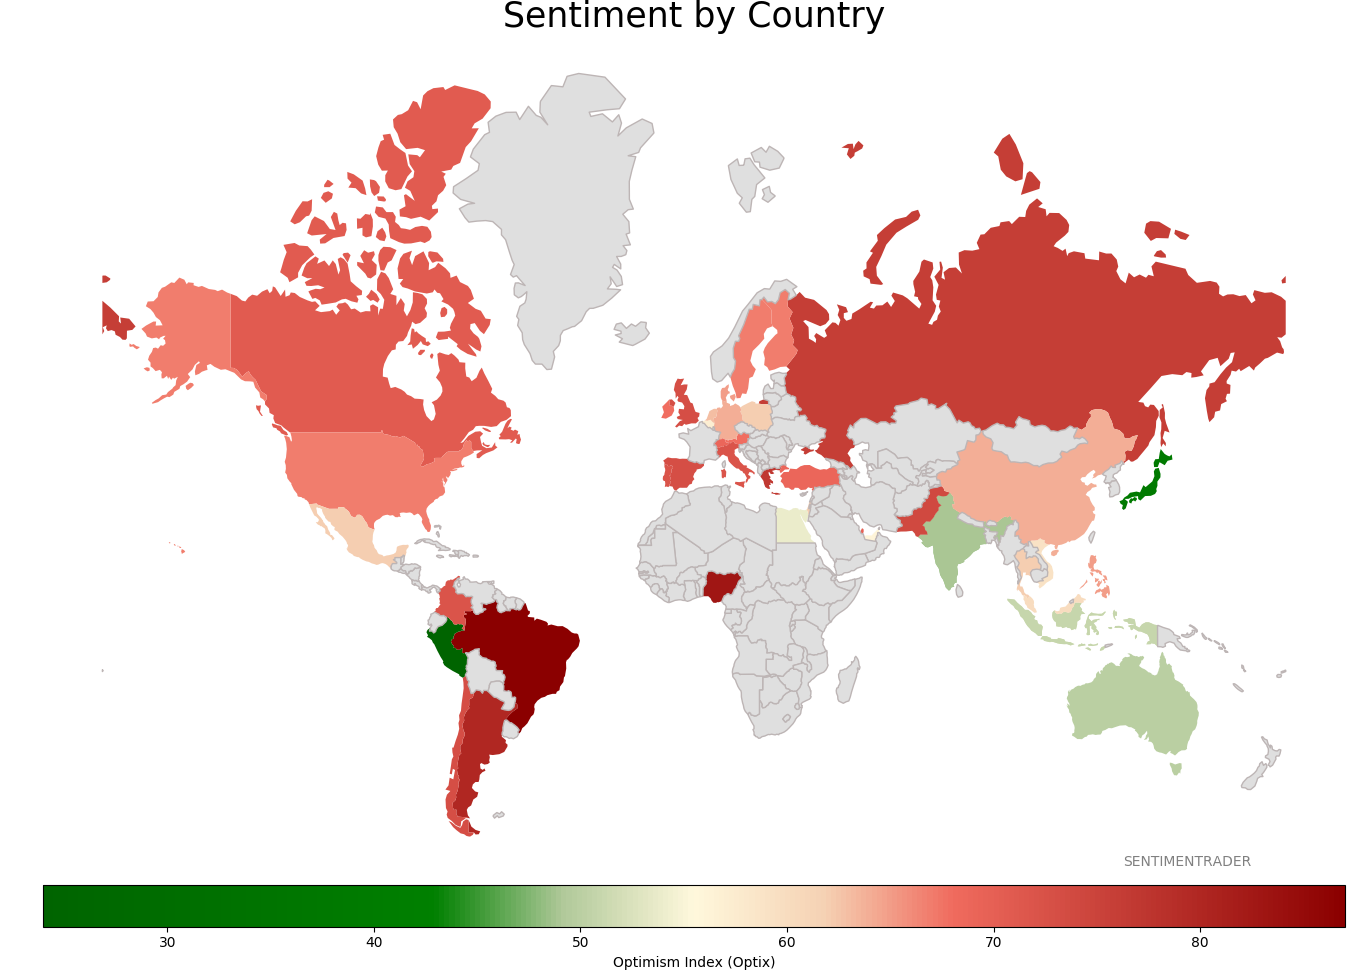
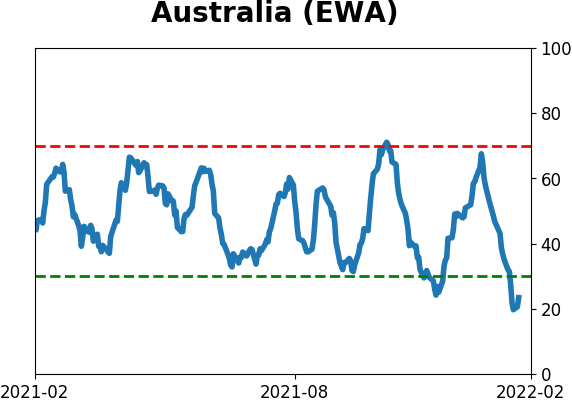
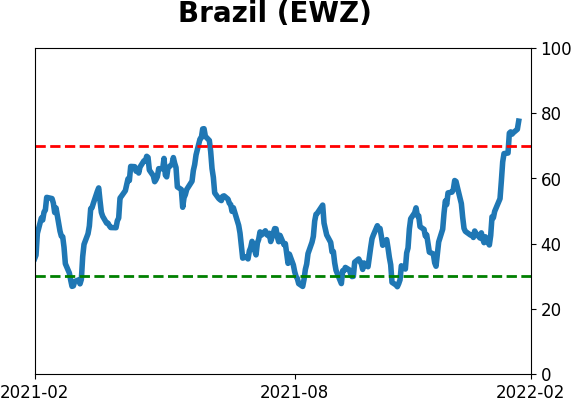
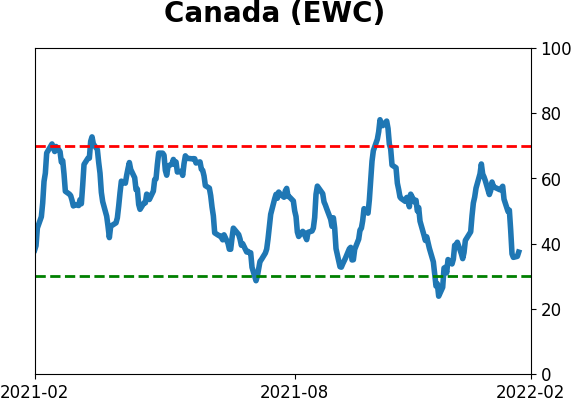
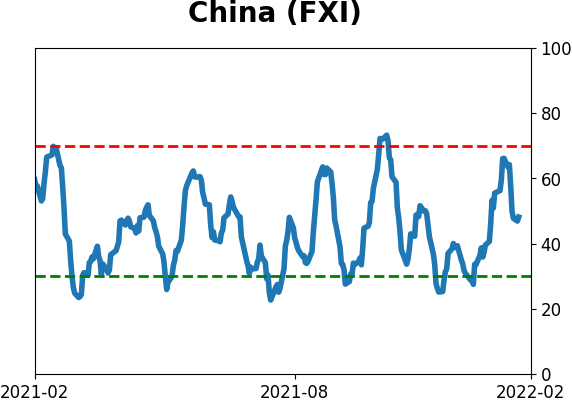
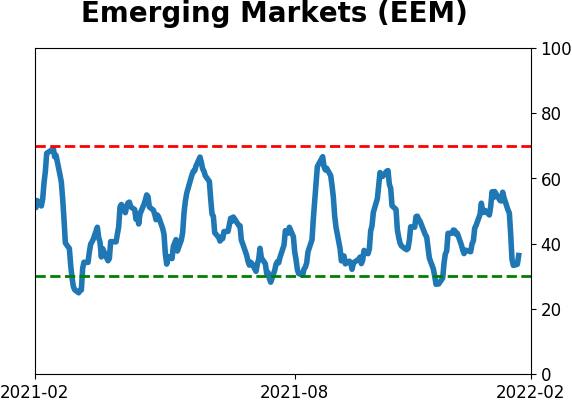
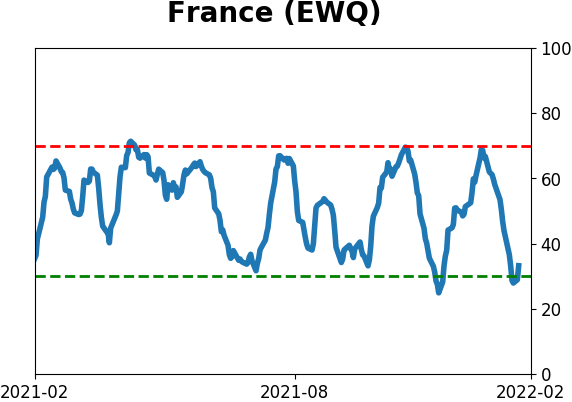
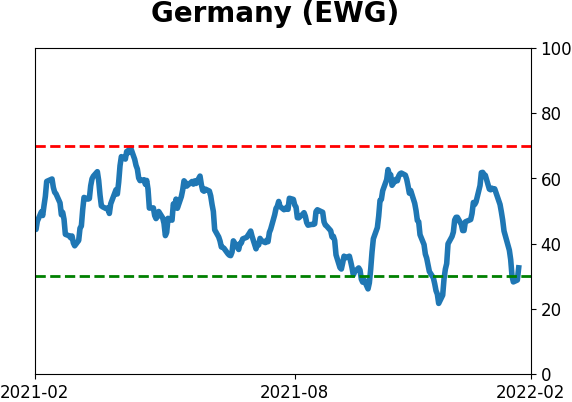
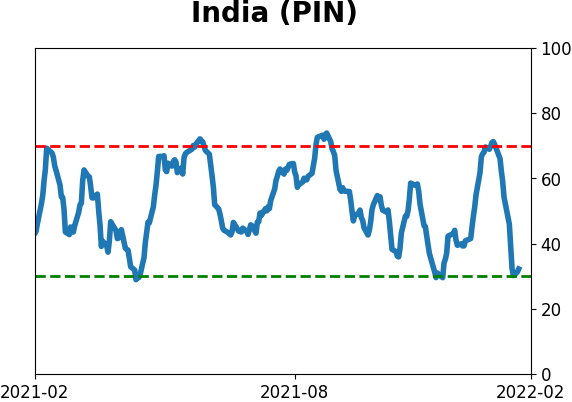
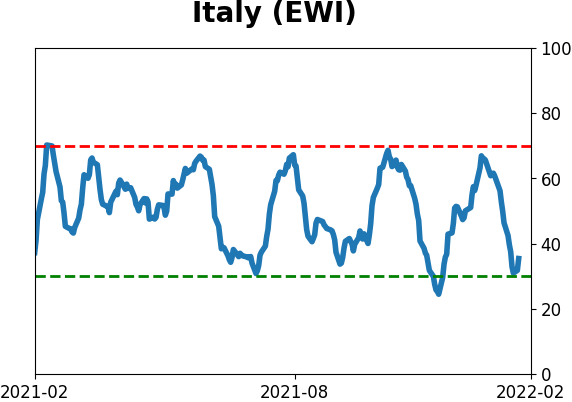
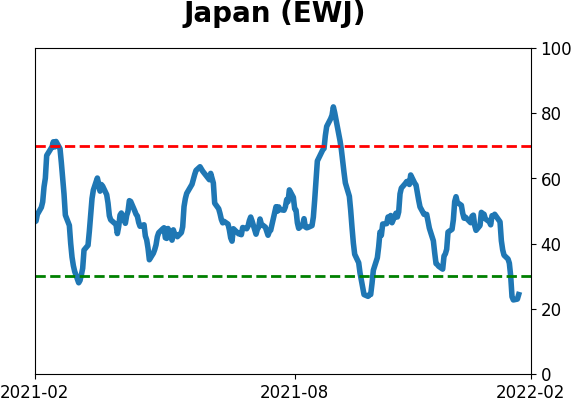
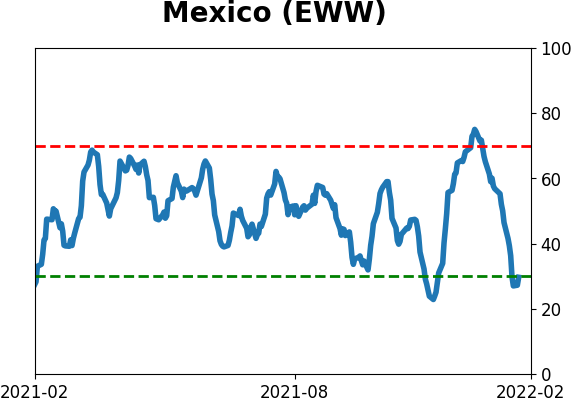
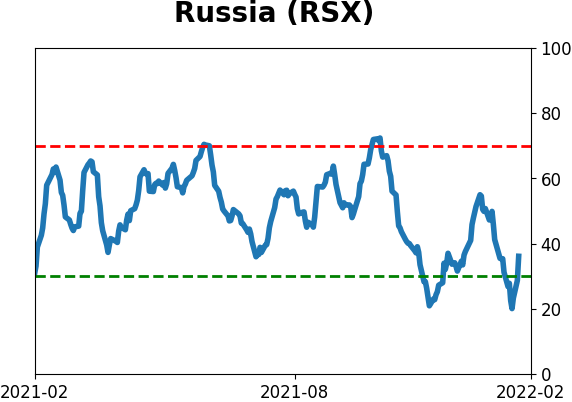
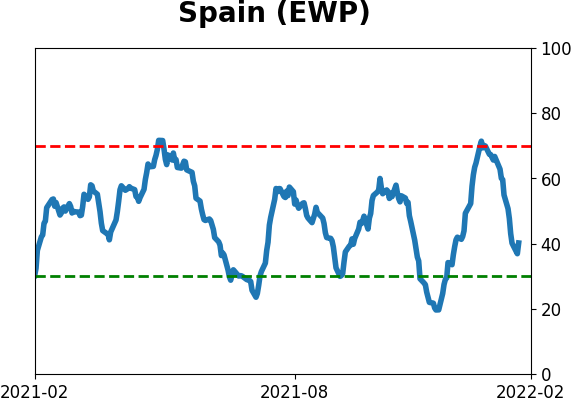
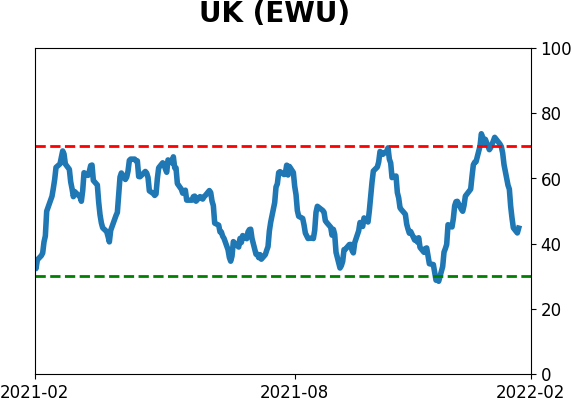
Sentiment Around The World
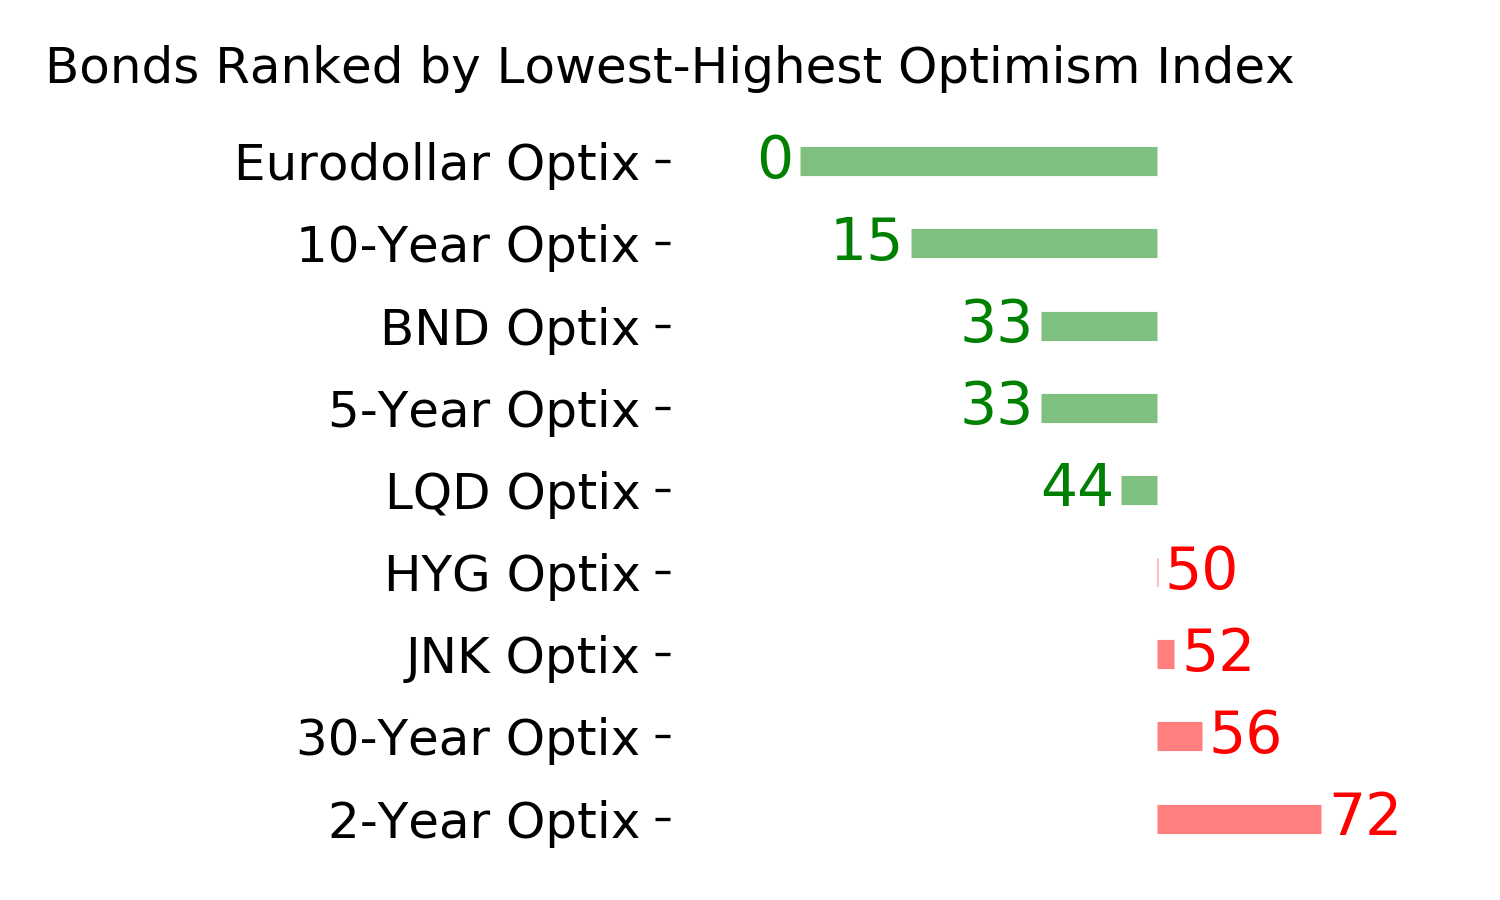
Optimism Index Thumbnails
|
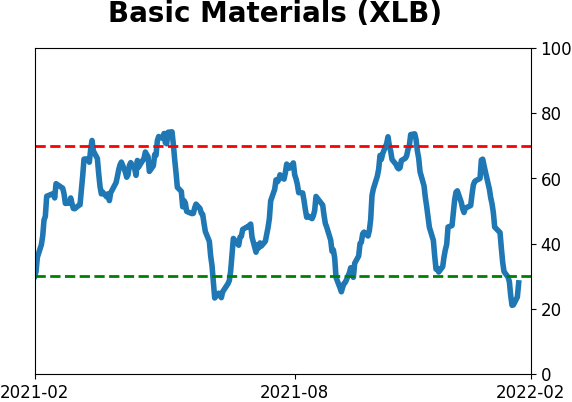
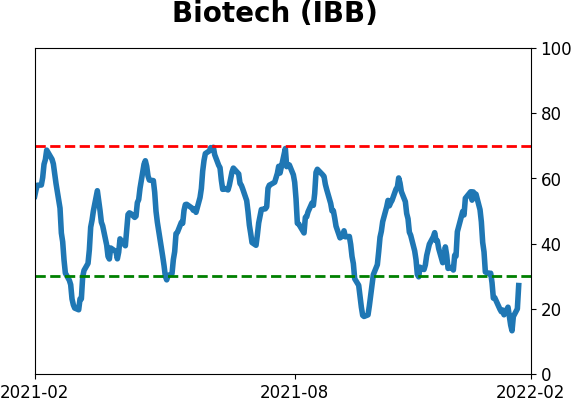
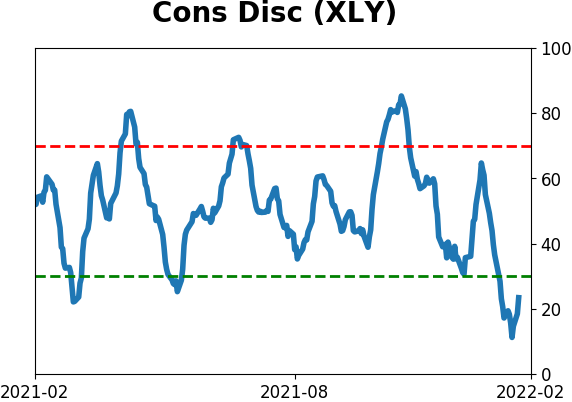
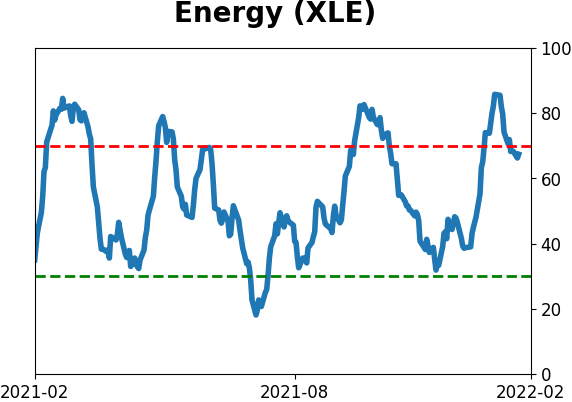
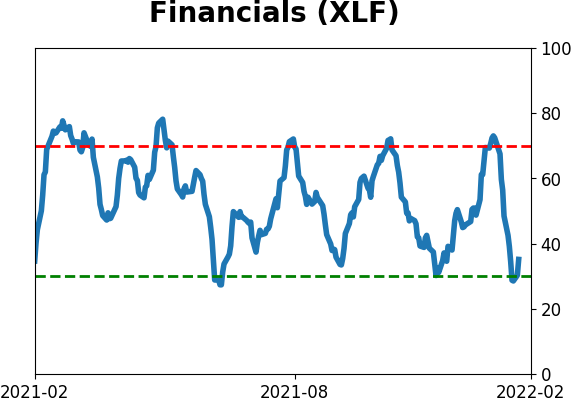
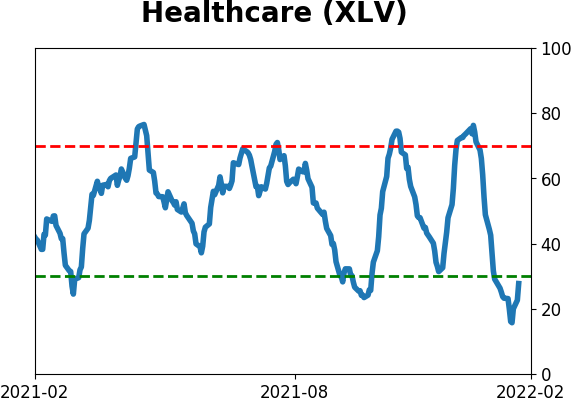
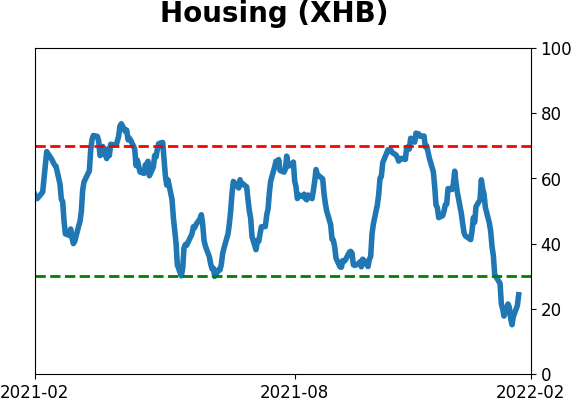
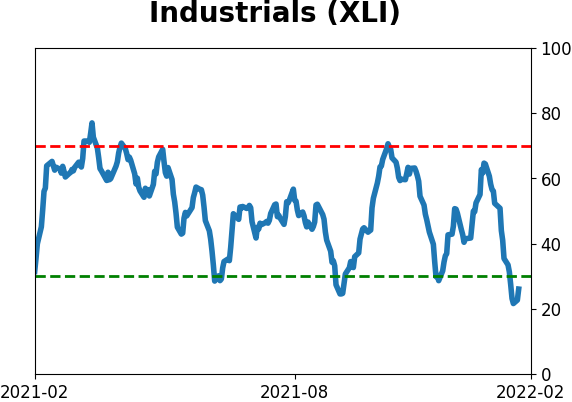
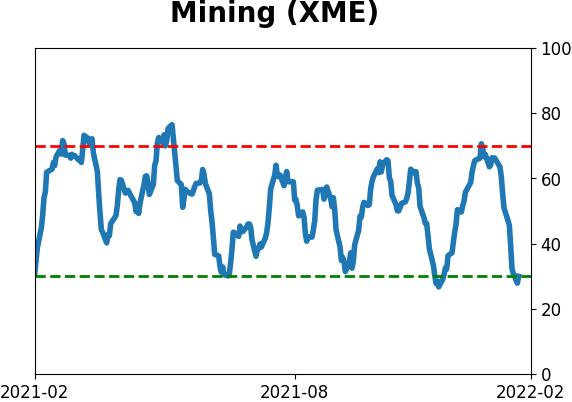
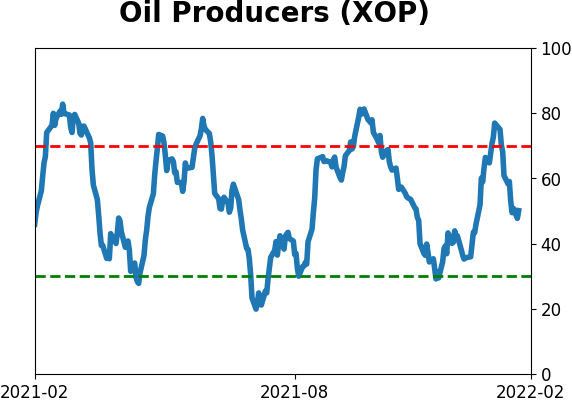
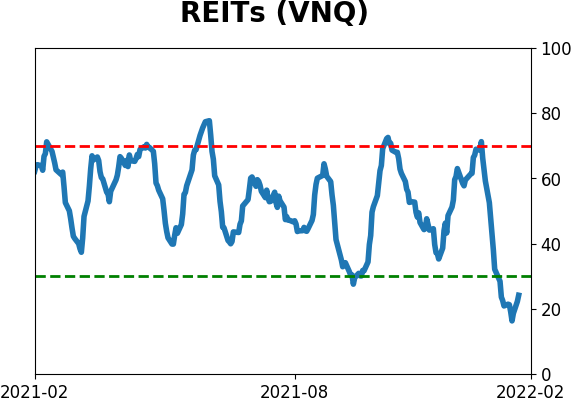
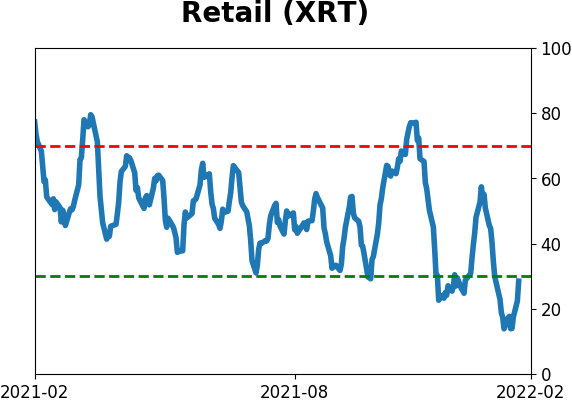
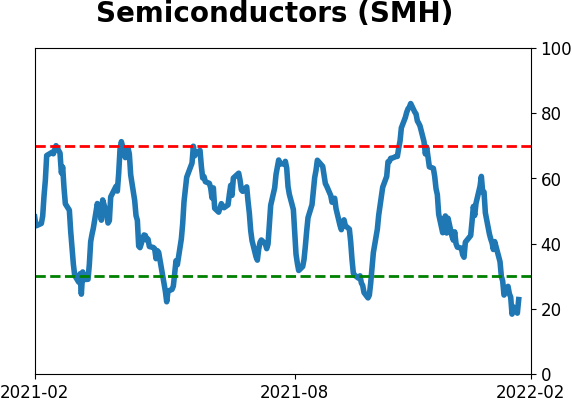
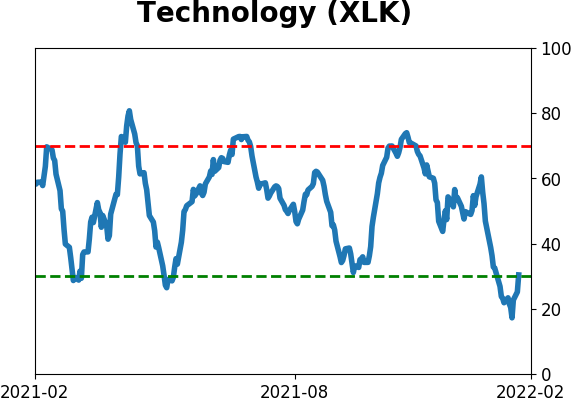
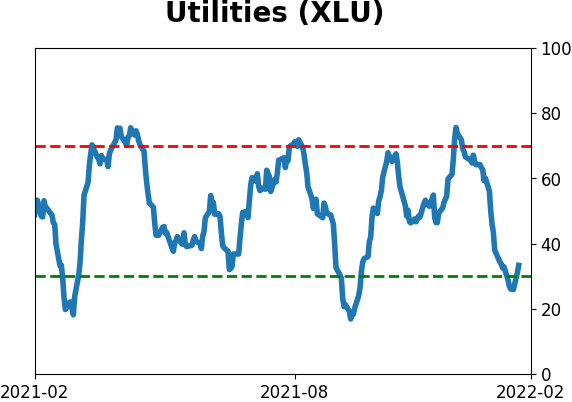
Sector ETF's - 10-Day Moving Average
|
|
|
Country ETF's - 10-Day Moving Average
|
|
|
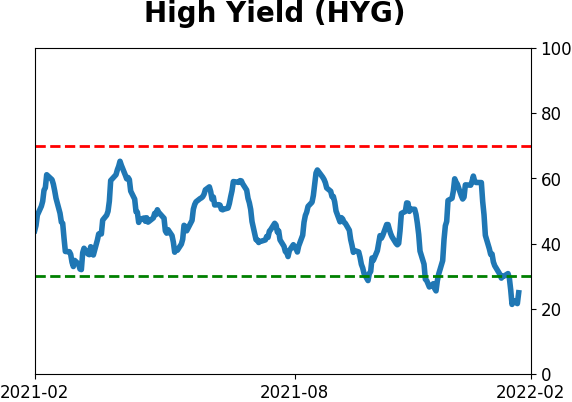
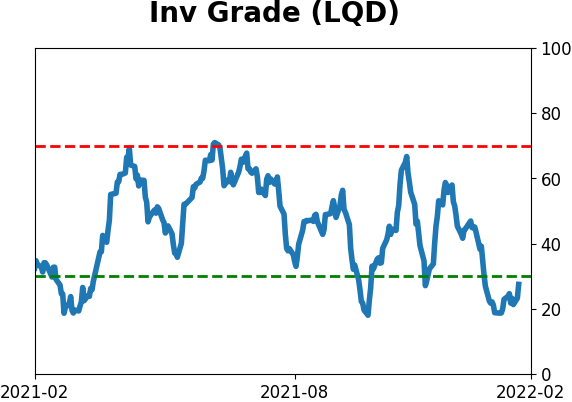
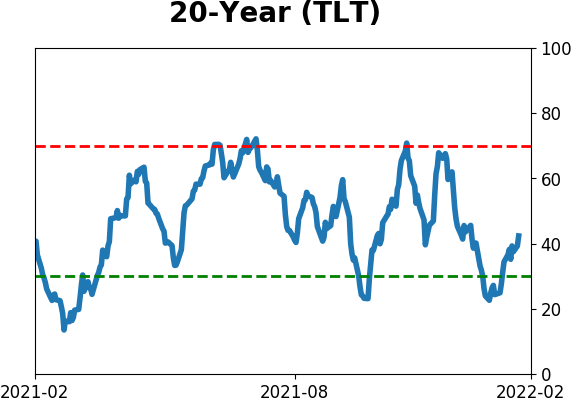
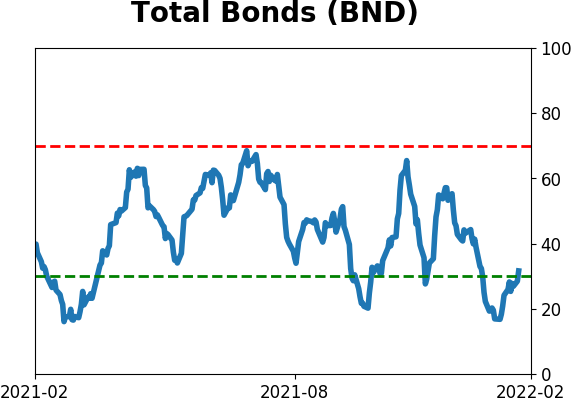
Bond ETF's - 10-Day Moving Average
|
|
|
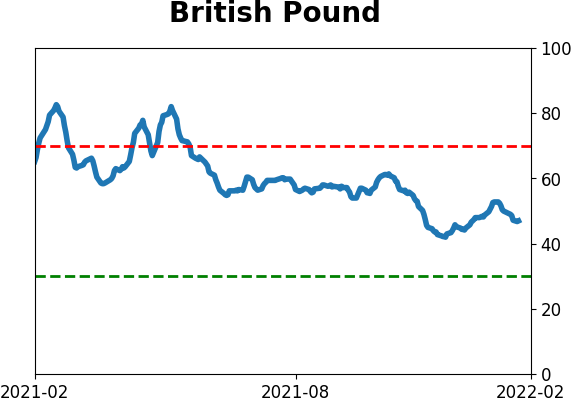
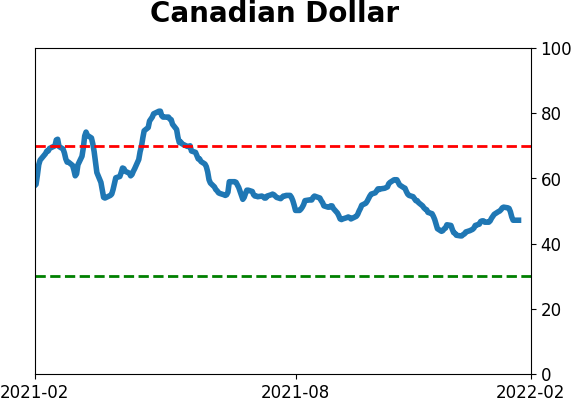
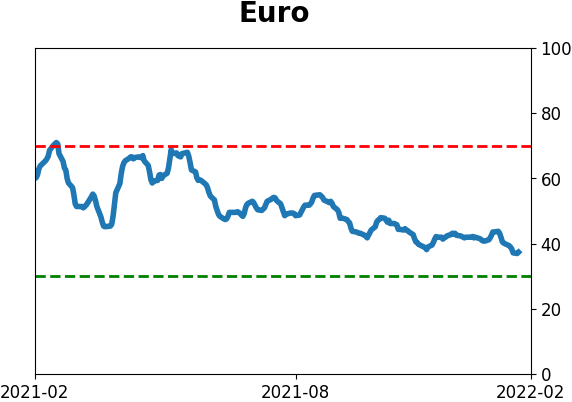
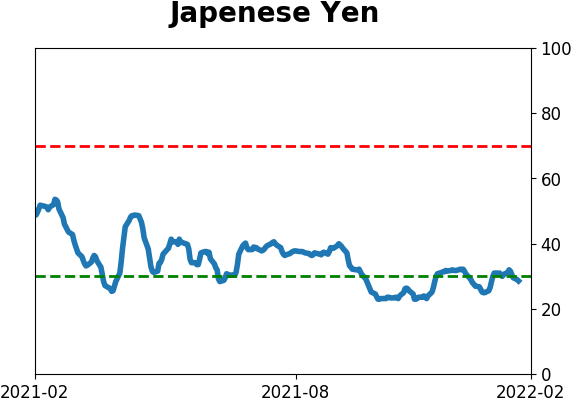
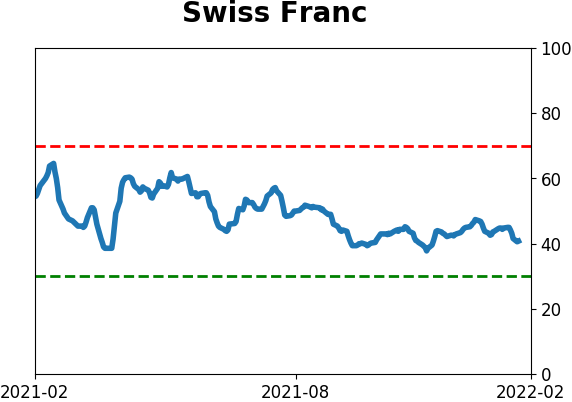
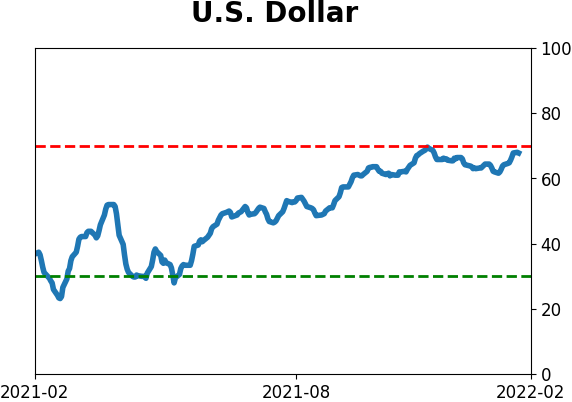
Currency ETF's - 5-Day Moving Average
|
|
|
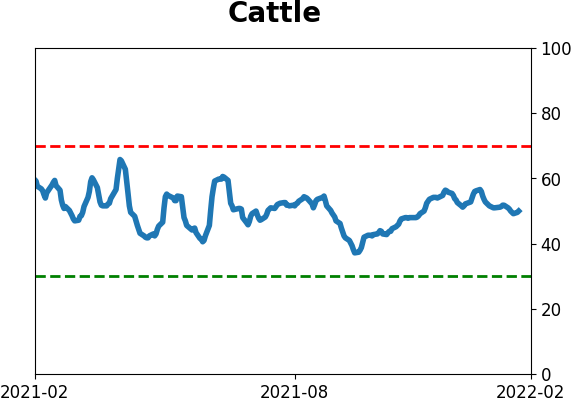
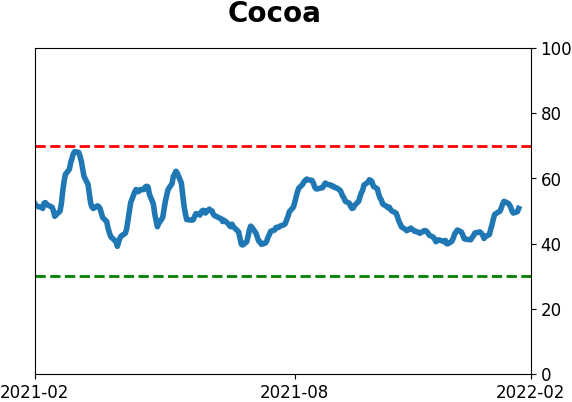
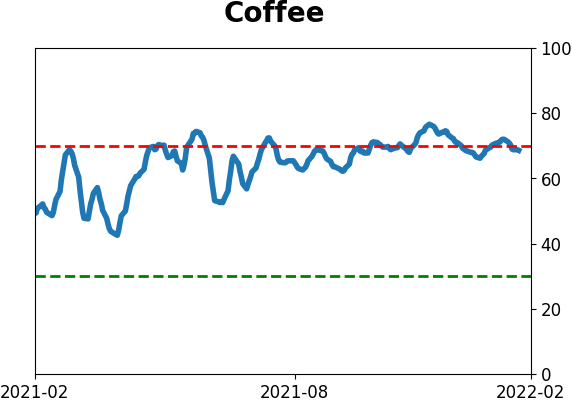
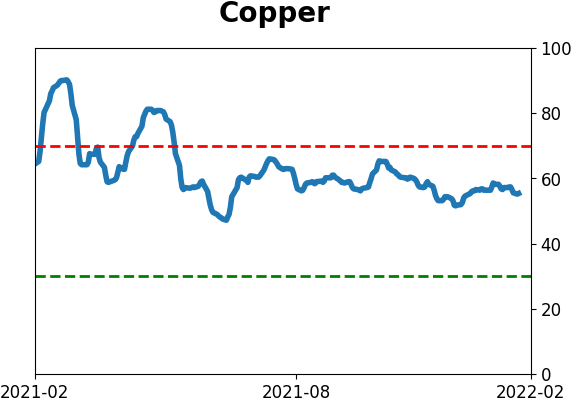
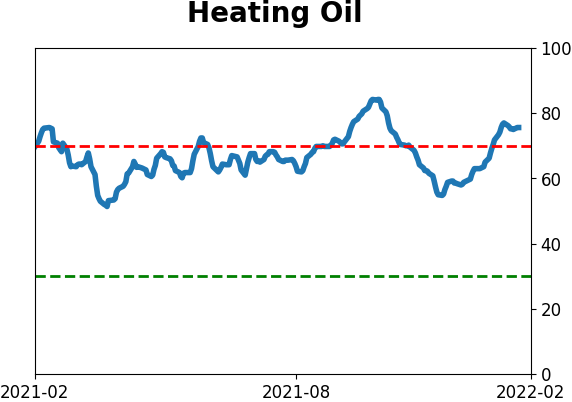
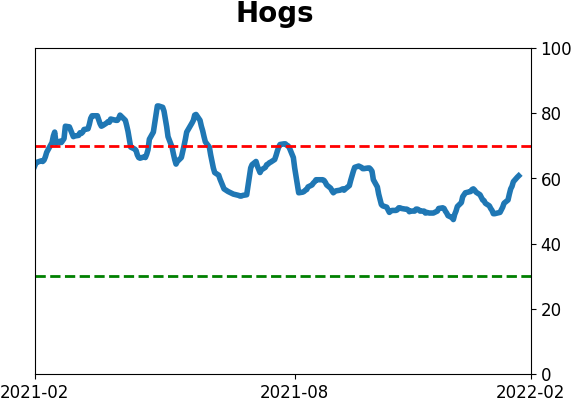
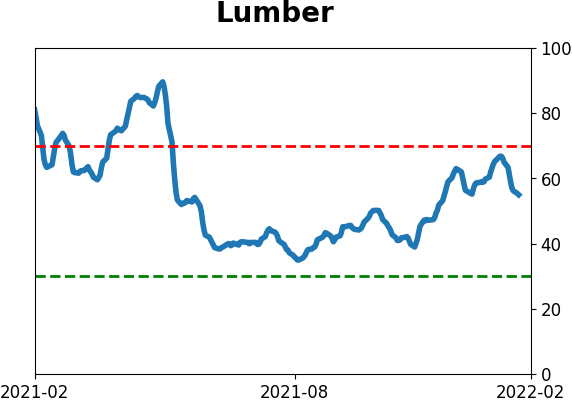
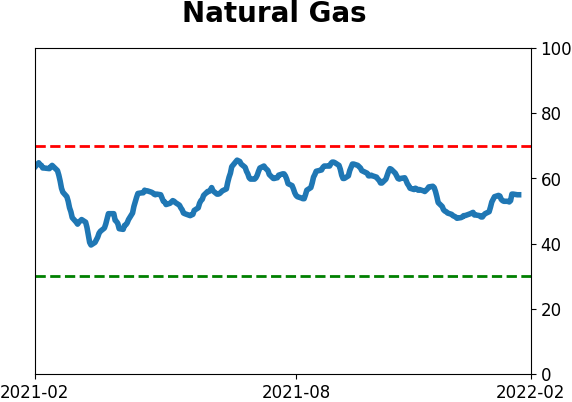
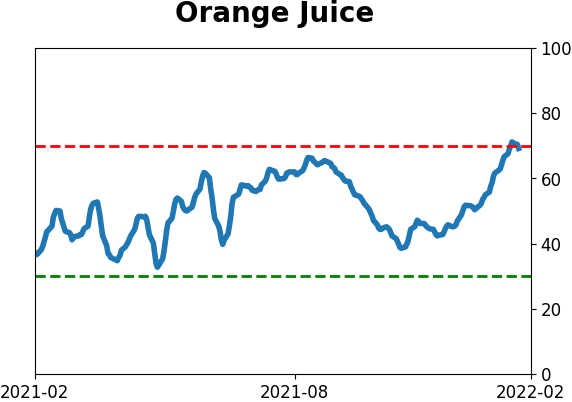
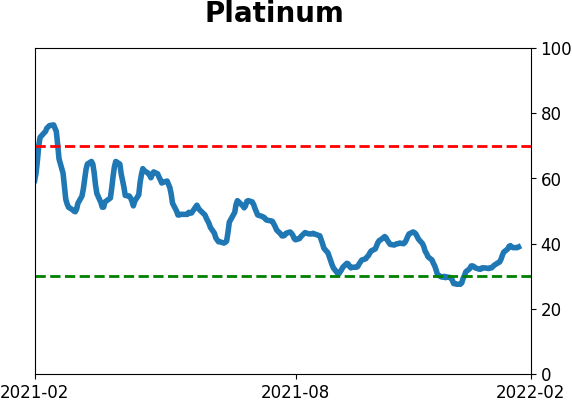
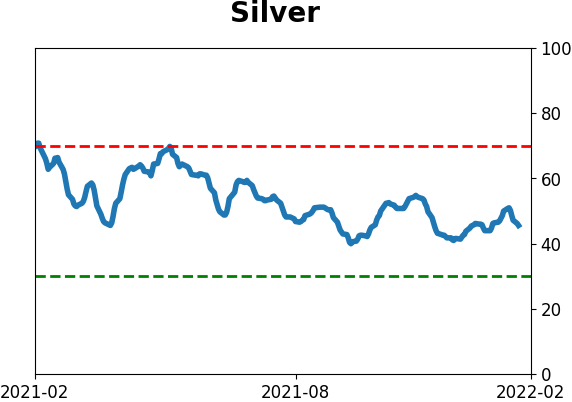
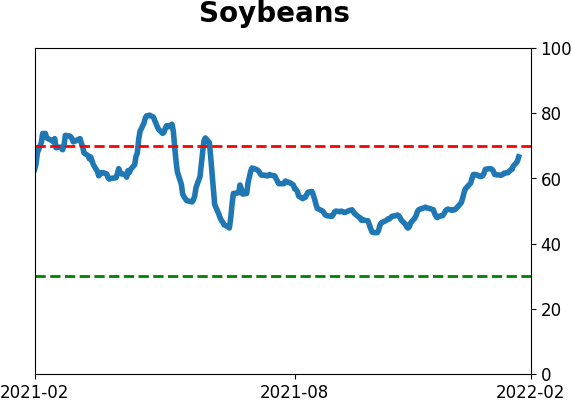
Commodity ETF's - 5-Day Moving Average
|
|