Headlines
|
|
Small options traders more panicked now than during the pandemic:
Small options traders bought a record number of put options and spent a record amount for the privilege of protecting their portfolios. As a percentage of all volume, hedging activity was high last week. Historically, that has preceded a bounce with good consistency.
|
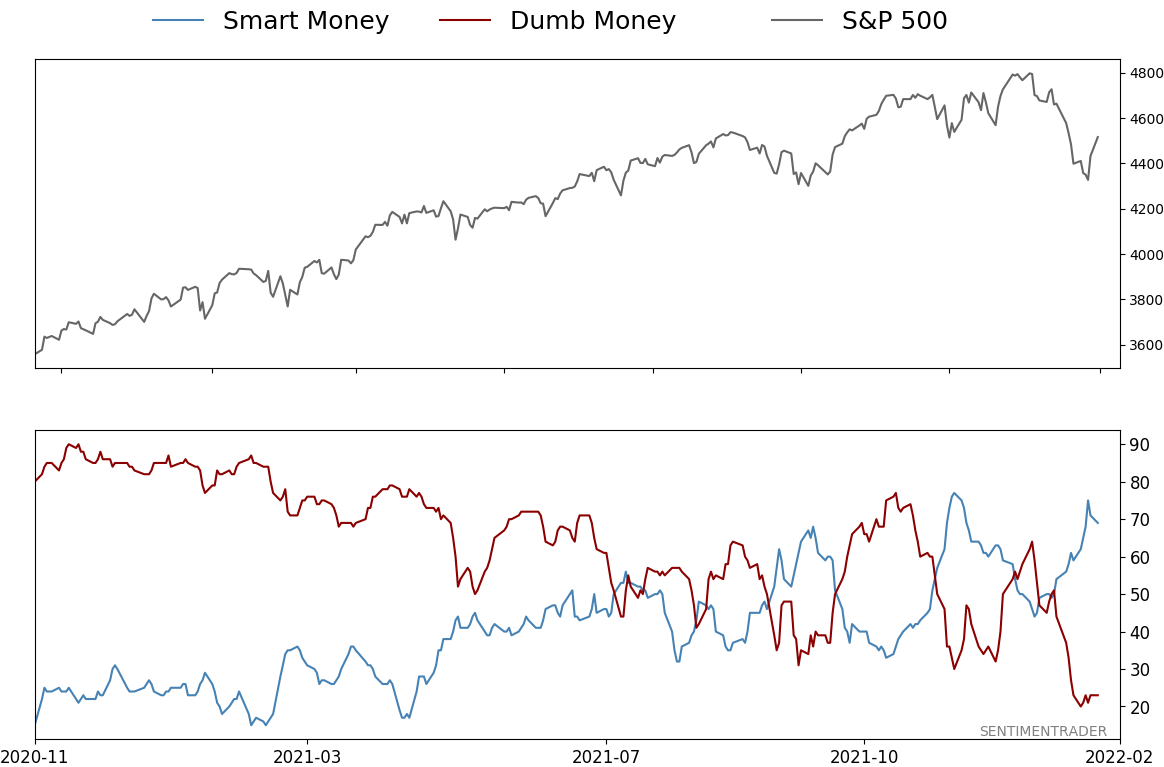
Smart / Dumb Money Confidence
|
Smart Money Confidence: 69%
Dumb Money Confidence: 23%
|
|
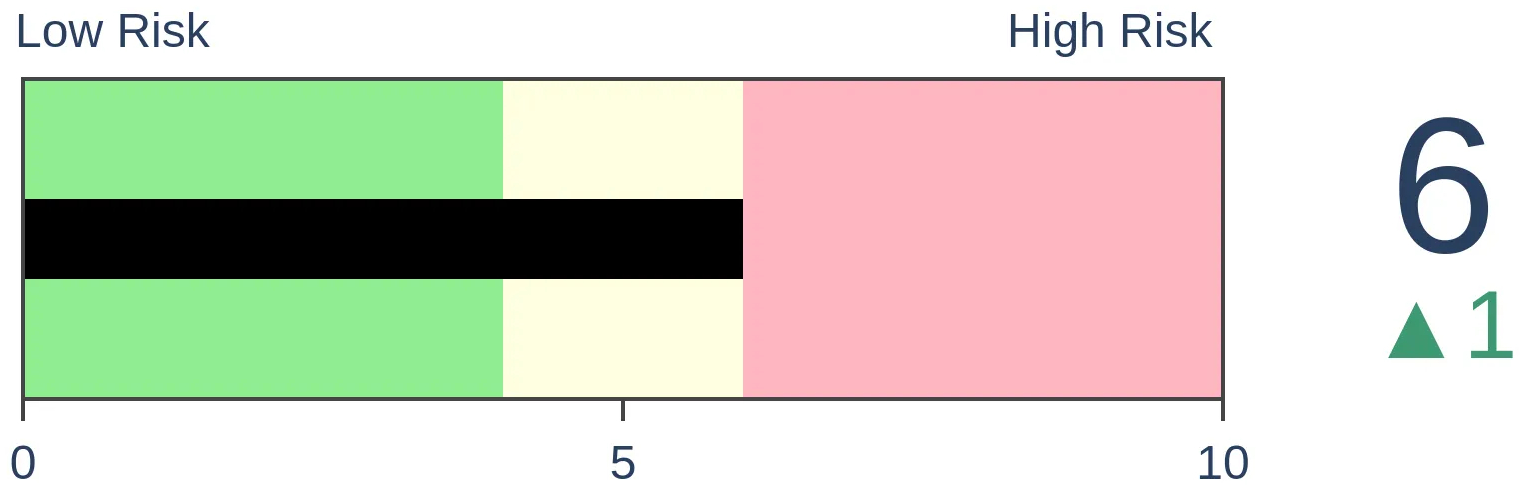
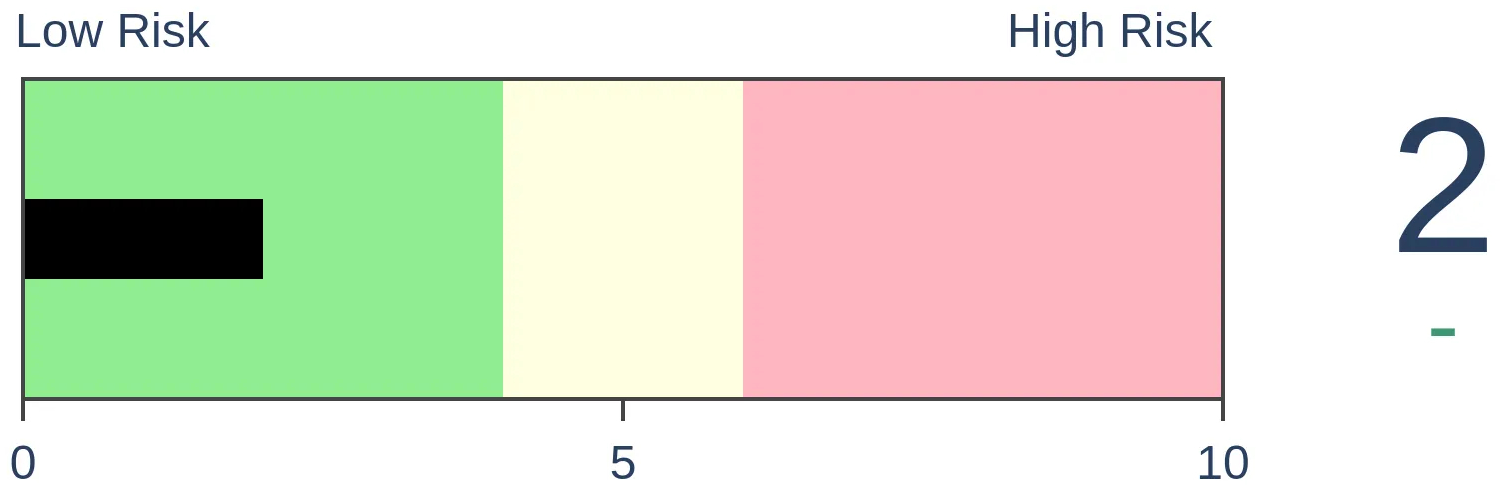
Risk Levels
Stocks Short-Term
|
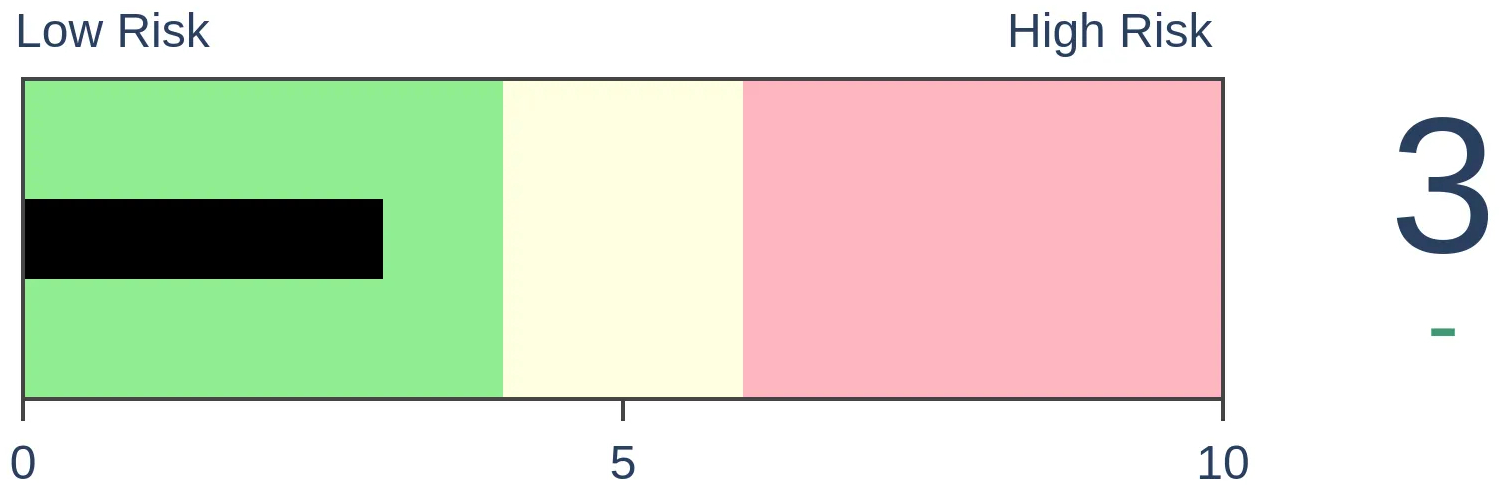
Stocks Medium-Term
|
|
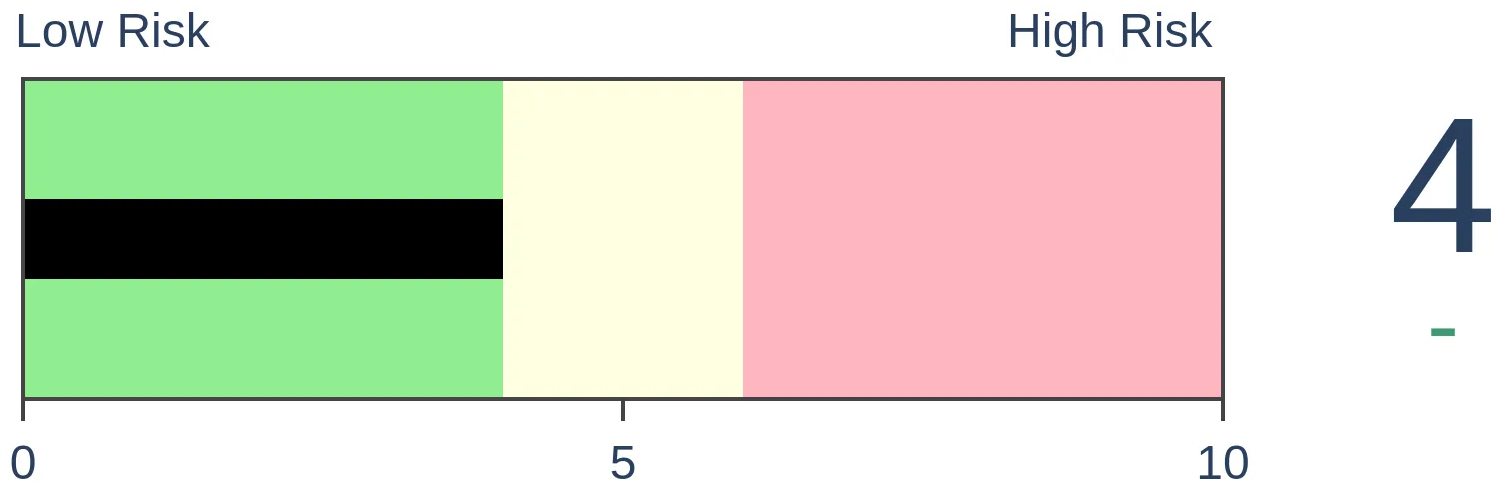
Bonds
|
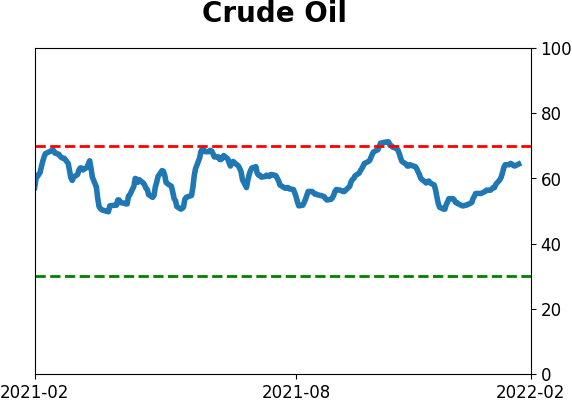
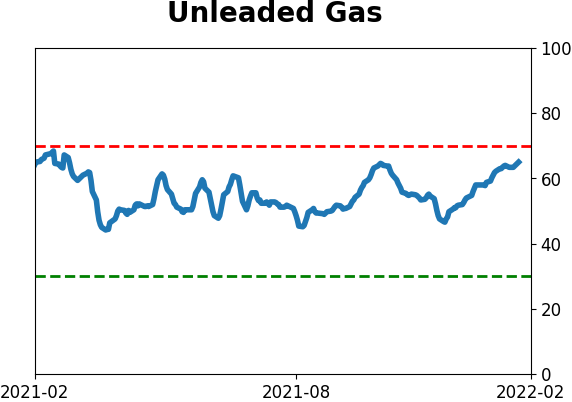
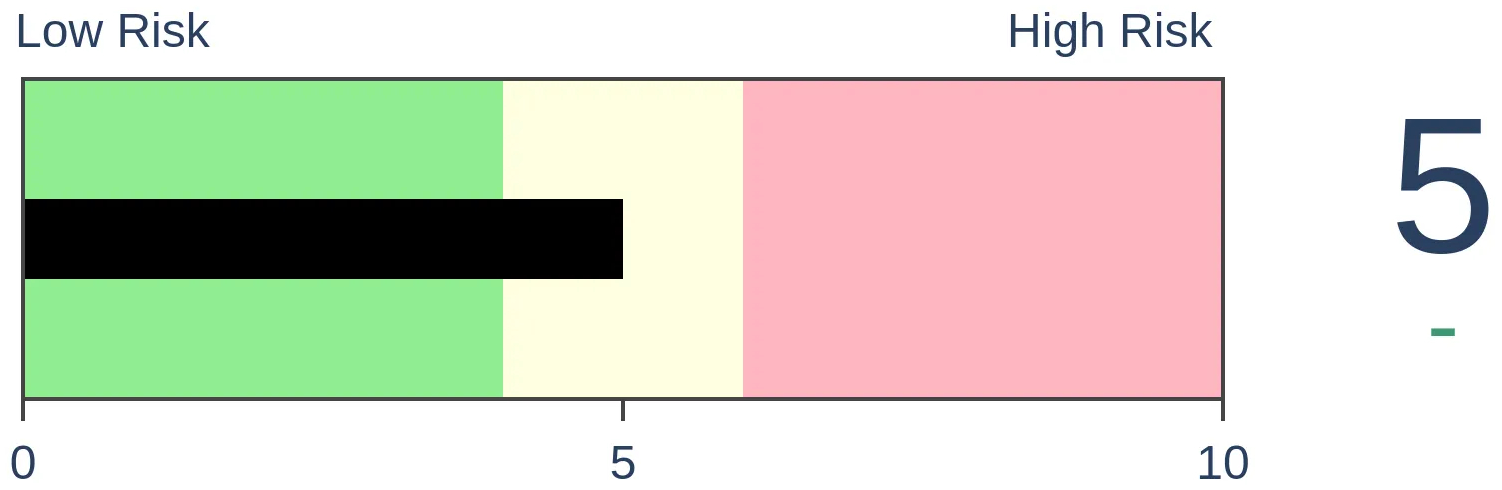
Crude Oil

|
|
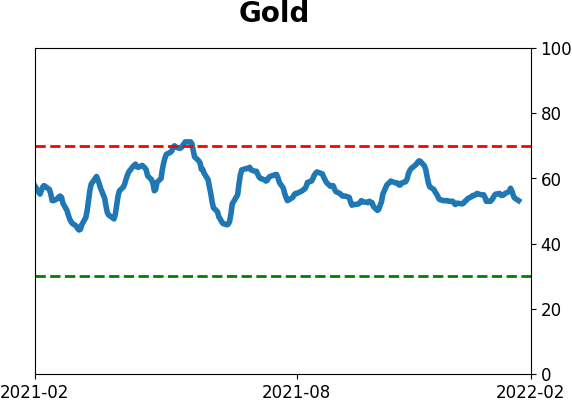
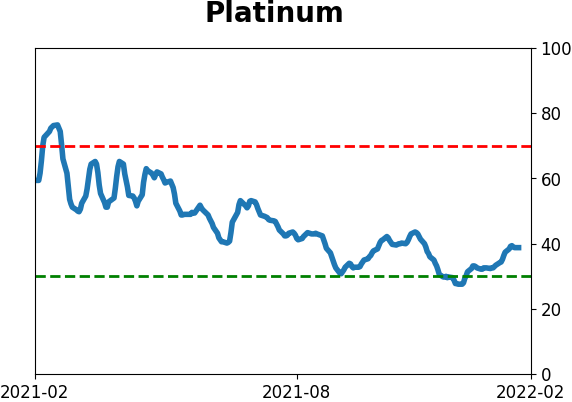
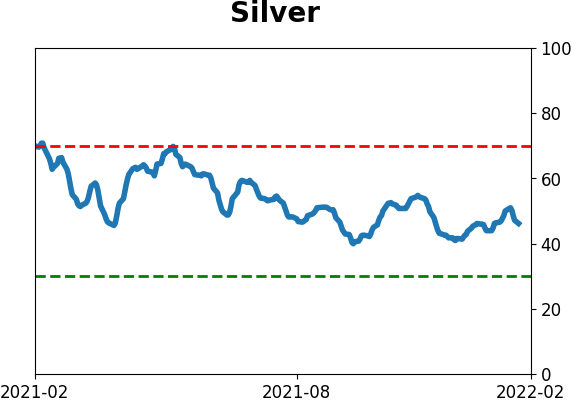
Gold
|
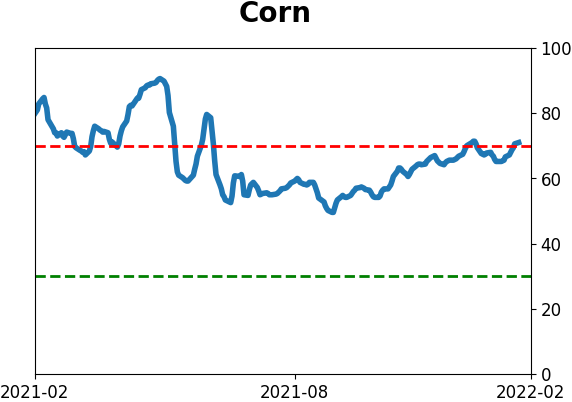
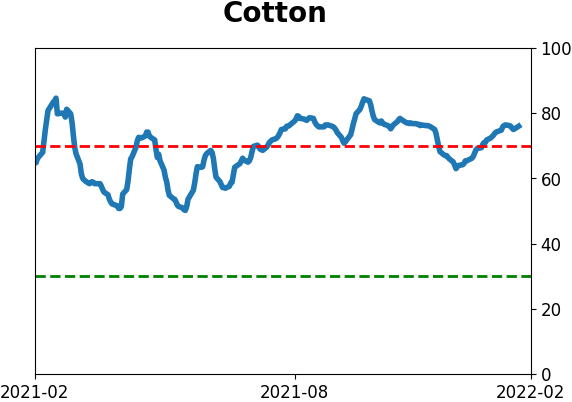
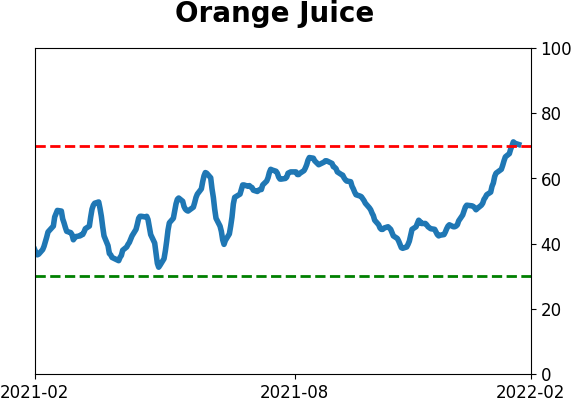
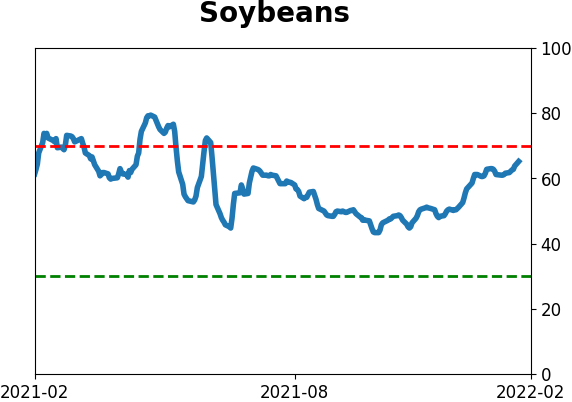
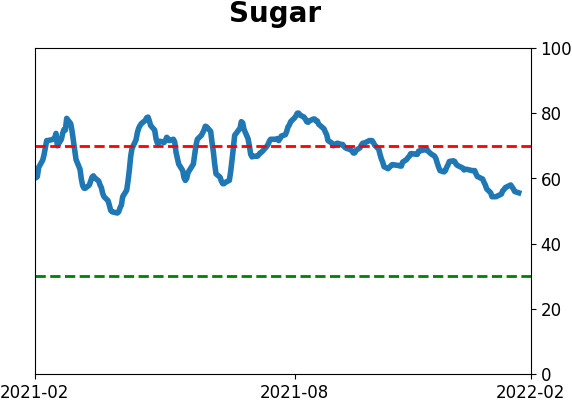
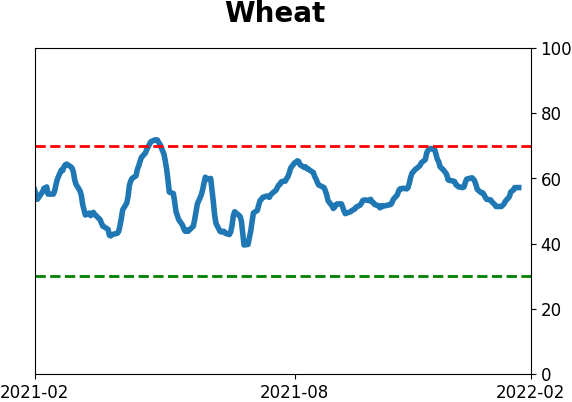
Agriculture
|
|
Research
By Jason Goepfert
BOTTOM LINE
Small options traders bought a record number of put options and spent a record amount for the privilege of protecting their portfolios. As a percentage of all volume, hedging activity was high last week. Historically, that has preceded a bounce with good consistency.
FORECAST / TIMEFRAME
SPY -- Up, Medium-Term
|
Key points:
- Small options traders spent a record amount on protective put options
- Relative to other option activity, their hedging bias was still extremely high
- Similar behavior typically preceded a bounce, but the market environment now is decidedly negative
A scary week triggers a rush into put options
Last week saw some of the most volatile price action in 2 years, a barrage of nasty headlines, and a cutting in half of a near-majority of stocks on the Nasdaq.
It was enough to trigger panic among the most leveraged traders in the market.
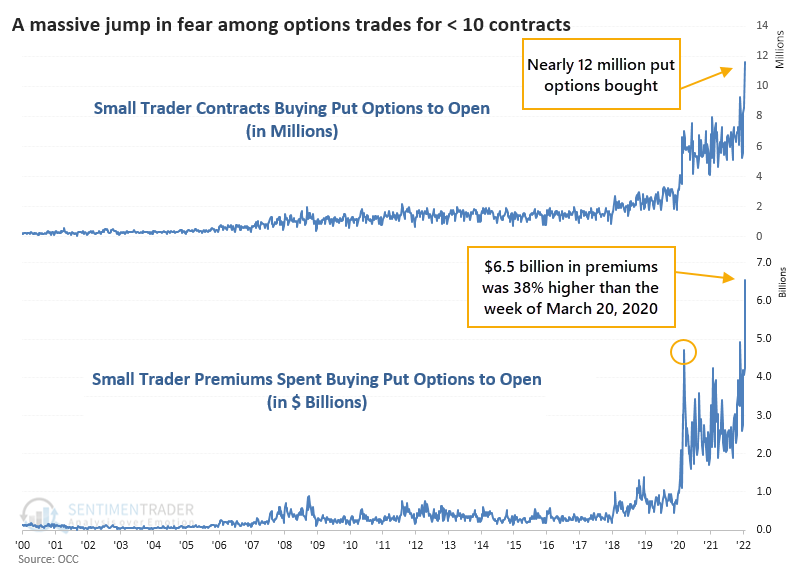
Small options traders bought to open nearly 12 million put options last week, spending $6.5 billion for the privilege of protecting their portfolios. That's a remarkable jump in trades meant to hedge against further losses. It's 40% higher than even the worst week during the March 2020 meltdown.
Of course, this only shows one side. If they also bought a tremendous number of speculative call options or sold a bunch of put options betting that declines would be limited, then it doesn't mean a whole lot.
As a percentage of all opening option trades, small traders spent 29% of their volume on buying put options. The Backtest Engine shows just how rare this is.
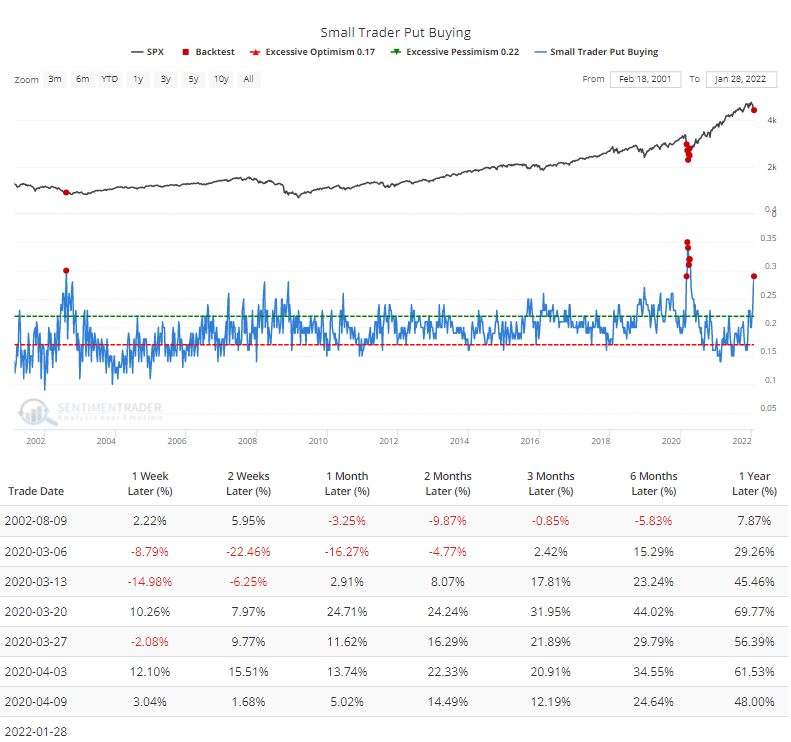
They were this scared during only a handful of weeks during the end of the internet bubble meltdown and the global pandemic lockdowns. The S&P 500 fell further both times, then formed long-term bottoms.
More expensive options trigger a spike in premiums spent
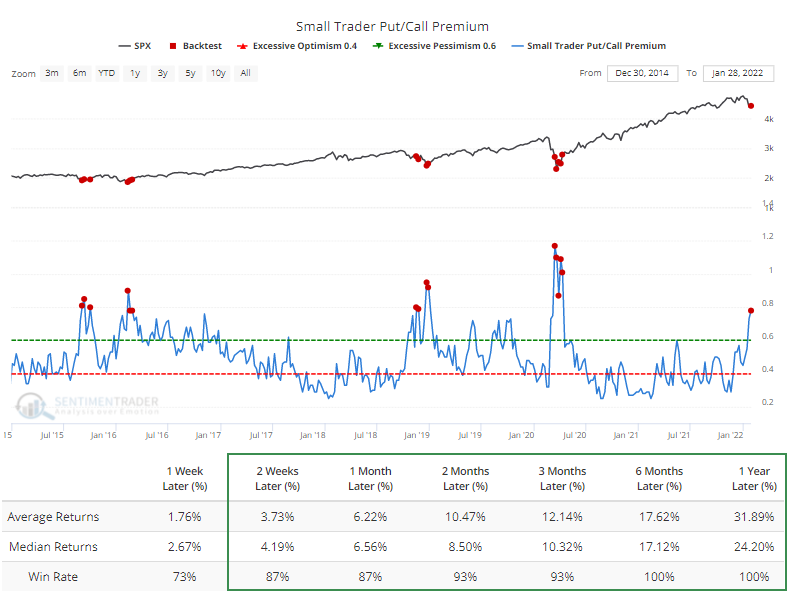
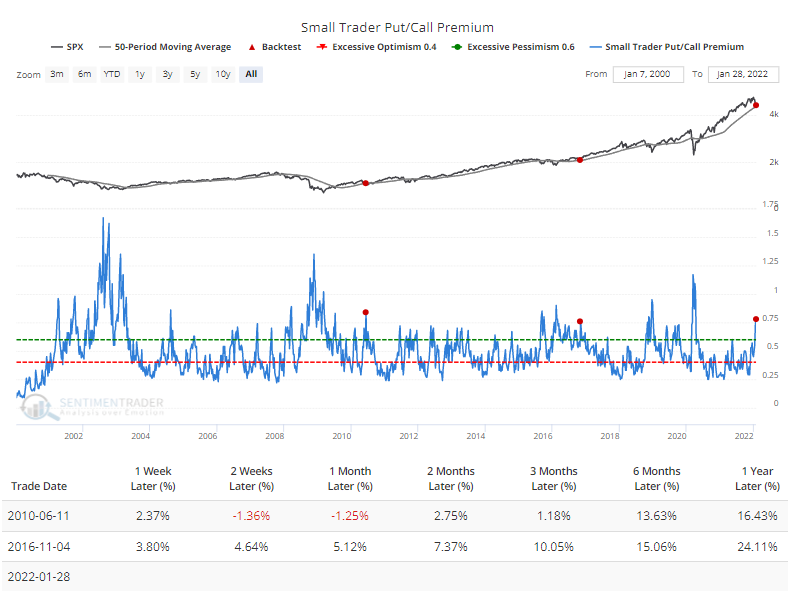
When we look at the amount of money small traders spent on put options relative to calls, it's now the highest since April 2020. Small traders spent $6.5 billion on buying put options, but they also spent $8.4 billion on call options.
Even so, it's been relatively rare to see them spend nearly 80% as much on puts as they did on calls. The Backtest Engine shows that such high levels of relative hedging activity preceded consistent gains over the past decade.
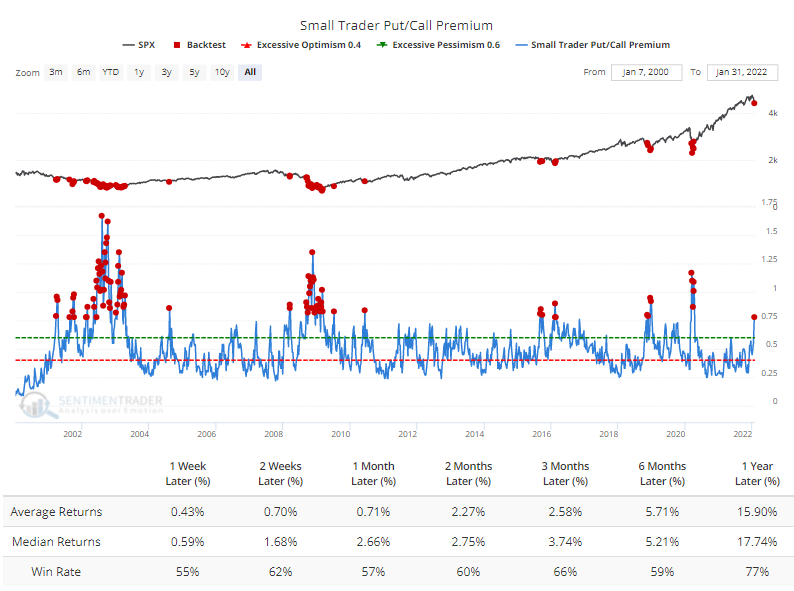
This is not a big surprise, of course, because bull markets dominated the past decade. Also, this heightened activity was first triggered before the worst of the selling was over in 2018 and 2020.
Returns were positive but not nearly as impressive when looking at all history.
This was only the 3rd time traders spent so much on puts relative to calls when the S&P 500 was trading above its 50-week moving average. Only 2 weeks in June 2010 and November 2016 triggered so much hedging activity among retail options traders during a generally uptrending market.
The Options Speculation Index (OSI) is the most comprehensive indicator we follow. It shows the percentage of volume that went into bullish options strategies among all traders on all exchanges.
Last week, it was still above 1.0, meaning that there was still more volume in bullish strategies than bearish ones. But it was among the lowest levels in 5 years. The Backtest Engine shows exemplary forward returns after weeks with similarly low levels of speculation.
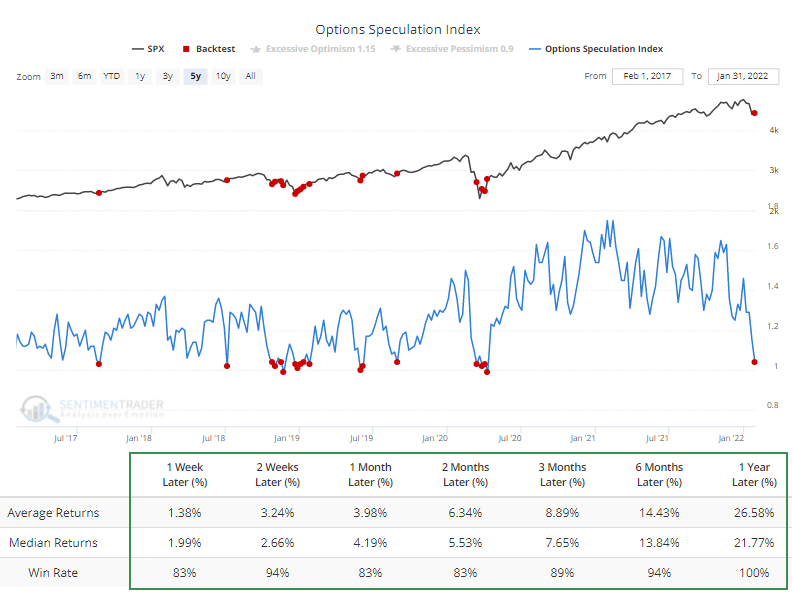
Unfortunately, it's low only relative to recent history. Going back to 2000, the OSI fell well below 1.0 during panics. We tend to place more weight on recent history, but the lack of genuine fear in this measure reduces the contrary urges somewhat.
What the research tells us...
Last week's options activity is further evidence of a high degree of pessimism that became evident during the week. Sentiment surveys have cratered, fear is prevalent, and Confidence is extremely low. All of those would be a good sign that risk is low relative to potential reward for equity buyers during a healthy market environment. Unfortunately, this is not that. The market environment is decidedly hostile, which significantly raises the risk for new buys. There is a very high probability that we're facing a bear market, and coupled with an unhealthy environment, modest pessimism isn't a great trigger. Maybe we have enough ammunition for a multi-week or even multi-month rally, but long-term investors should want to see either true widespread panic or a much healthier market environment.
A year ago, the mania in speculative options activity coincided with the peak of many of the most speculative stocks in the market. We're not quite seeing the exact opposite of that now, but it's getting pretty close. It doesn't suggest that the most speculative stocks are now a buy; rather, a better bet would be that quality stocks that got hit in recent weeks due to collateral damage are likely a safer bet, and more for buyers than sellers.
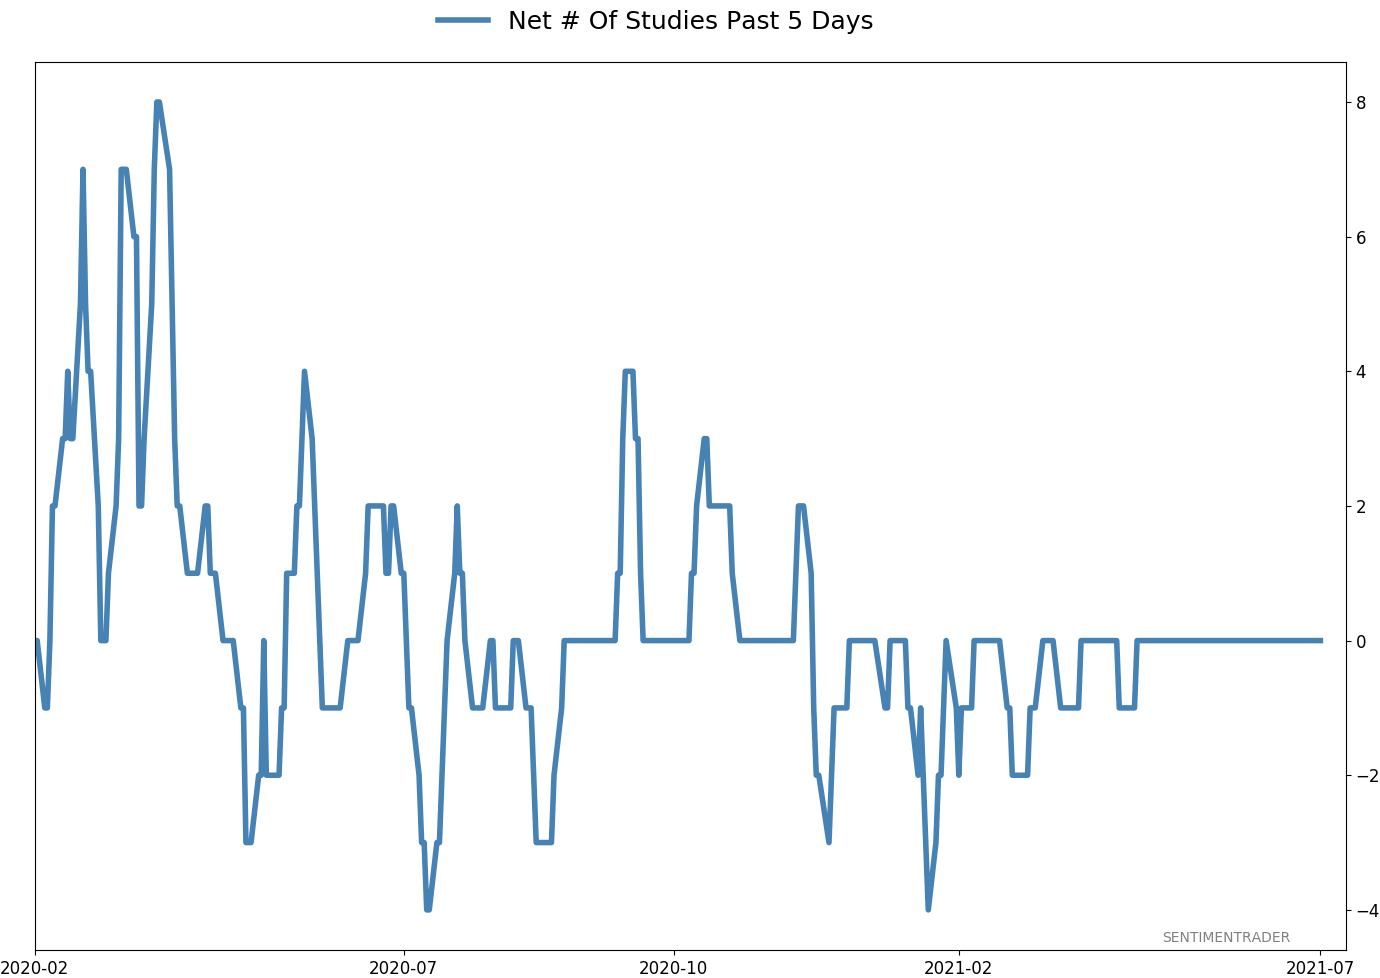
Active Studies
| Time Frame | Bullish | Bearish | | Short-Term | 3 | 0 | | Medium-Term | 14 | 2 | | Long-Term | 14 | 5 |
|
Indicators at Extremes
Portfolio
| Position | Description | Weight % | Added / Reduced | Date | | Stocks | RSP | 21.4 | Added 10.2% | 2022-01-28 | | Bonds | 32.7% BND, 7.1% SCHP | 40.1 | Added 8.3% | 2021-10-26 | | Commodities | GCC | 2.4 | Reduced 2.1%
| 2020-09-04 | | Precious Metals | GDX | 4.6 | Reduced 4.2% | 2021-05-19 | | Special Situations | 8.1% KWEB, 3.6% XLE, 1.7% PSCE | 13.4 | Reduced 3.9% | 2022-01-18 | | Cash | | 17.9 | | |
|
Updates (Changes made today are underlined)
With a typical time frame of several months in this account, I normally don't make changes so quickly. I've added back part of the stock exposure I took off earlier in January due to the washed-out conditions and extreme pessimism we're seeing across a wide array of metrics. The biggest issue is that the environment is unhealthy and we could be in the throes of a protracted bear market. Even so, the readings we've seen recently have a good record at preceding relief rallies, so we'll have to see how that pans out. Bond sentiment is trying to recover from a recent bout of pessimism, and gold stocks are doing their thing which is not much at all. They've been flat for six months. Chinese tech stocks were doing exactly what they're supposed to do, then did *not* by plunging to new lows. This is troubling on a shorter-term time frame, but this was never meant for a trade, rather a multi-year investment. Recent behavior is troubling and I will not be adding any exposure as long as that's the case. RETURN YTD: +0.1% 2021: +8.7%, 2020: +8.1%, 2019: +12.6%, 2018: +0.6%, 2017: +3.8%, 2016: +17.1%, 2015: +9.2%, 2014: +14.5%, 2013: +2.2%, 2012: +10.8%, 2011: +16.5%, 2010: +15.3%, 2009: +23.9%, 2008: +16.2%, 2007: +7.8%
|
|
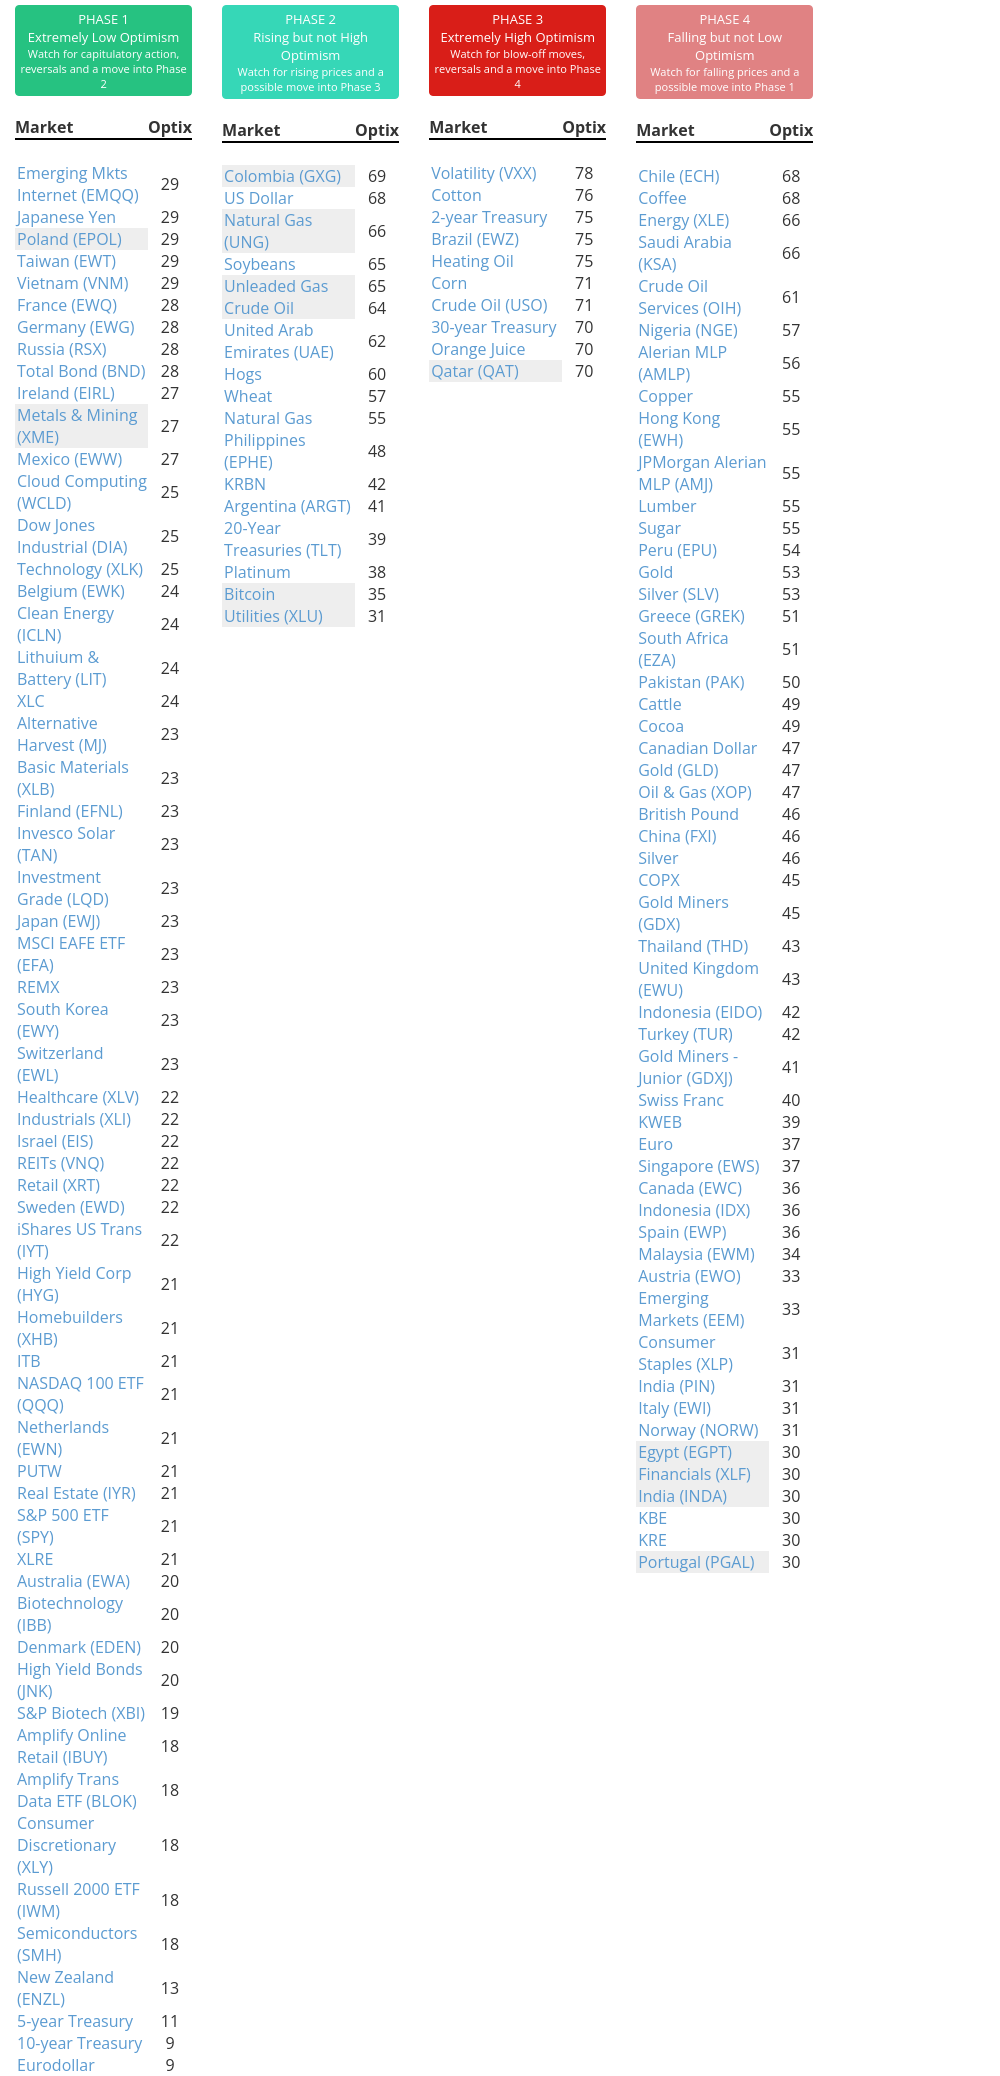
Phase Table
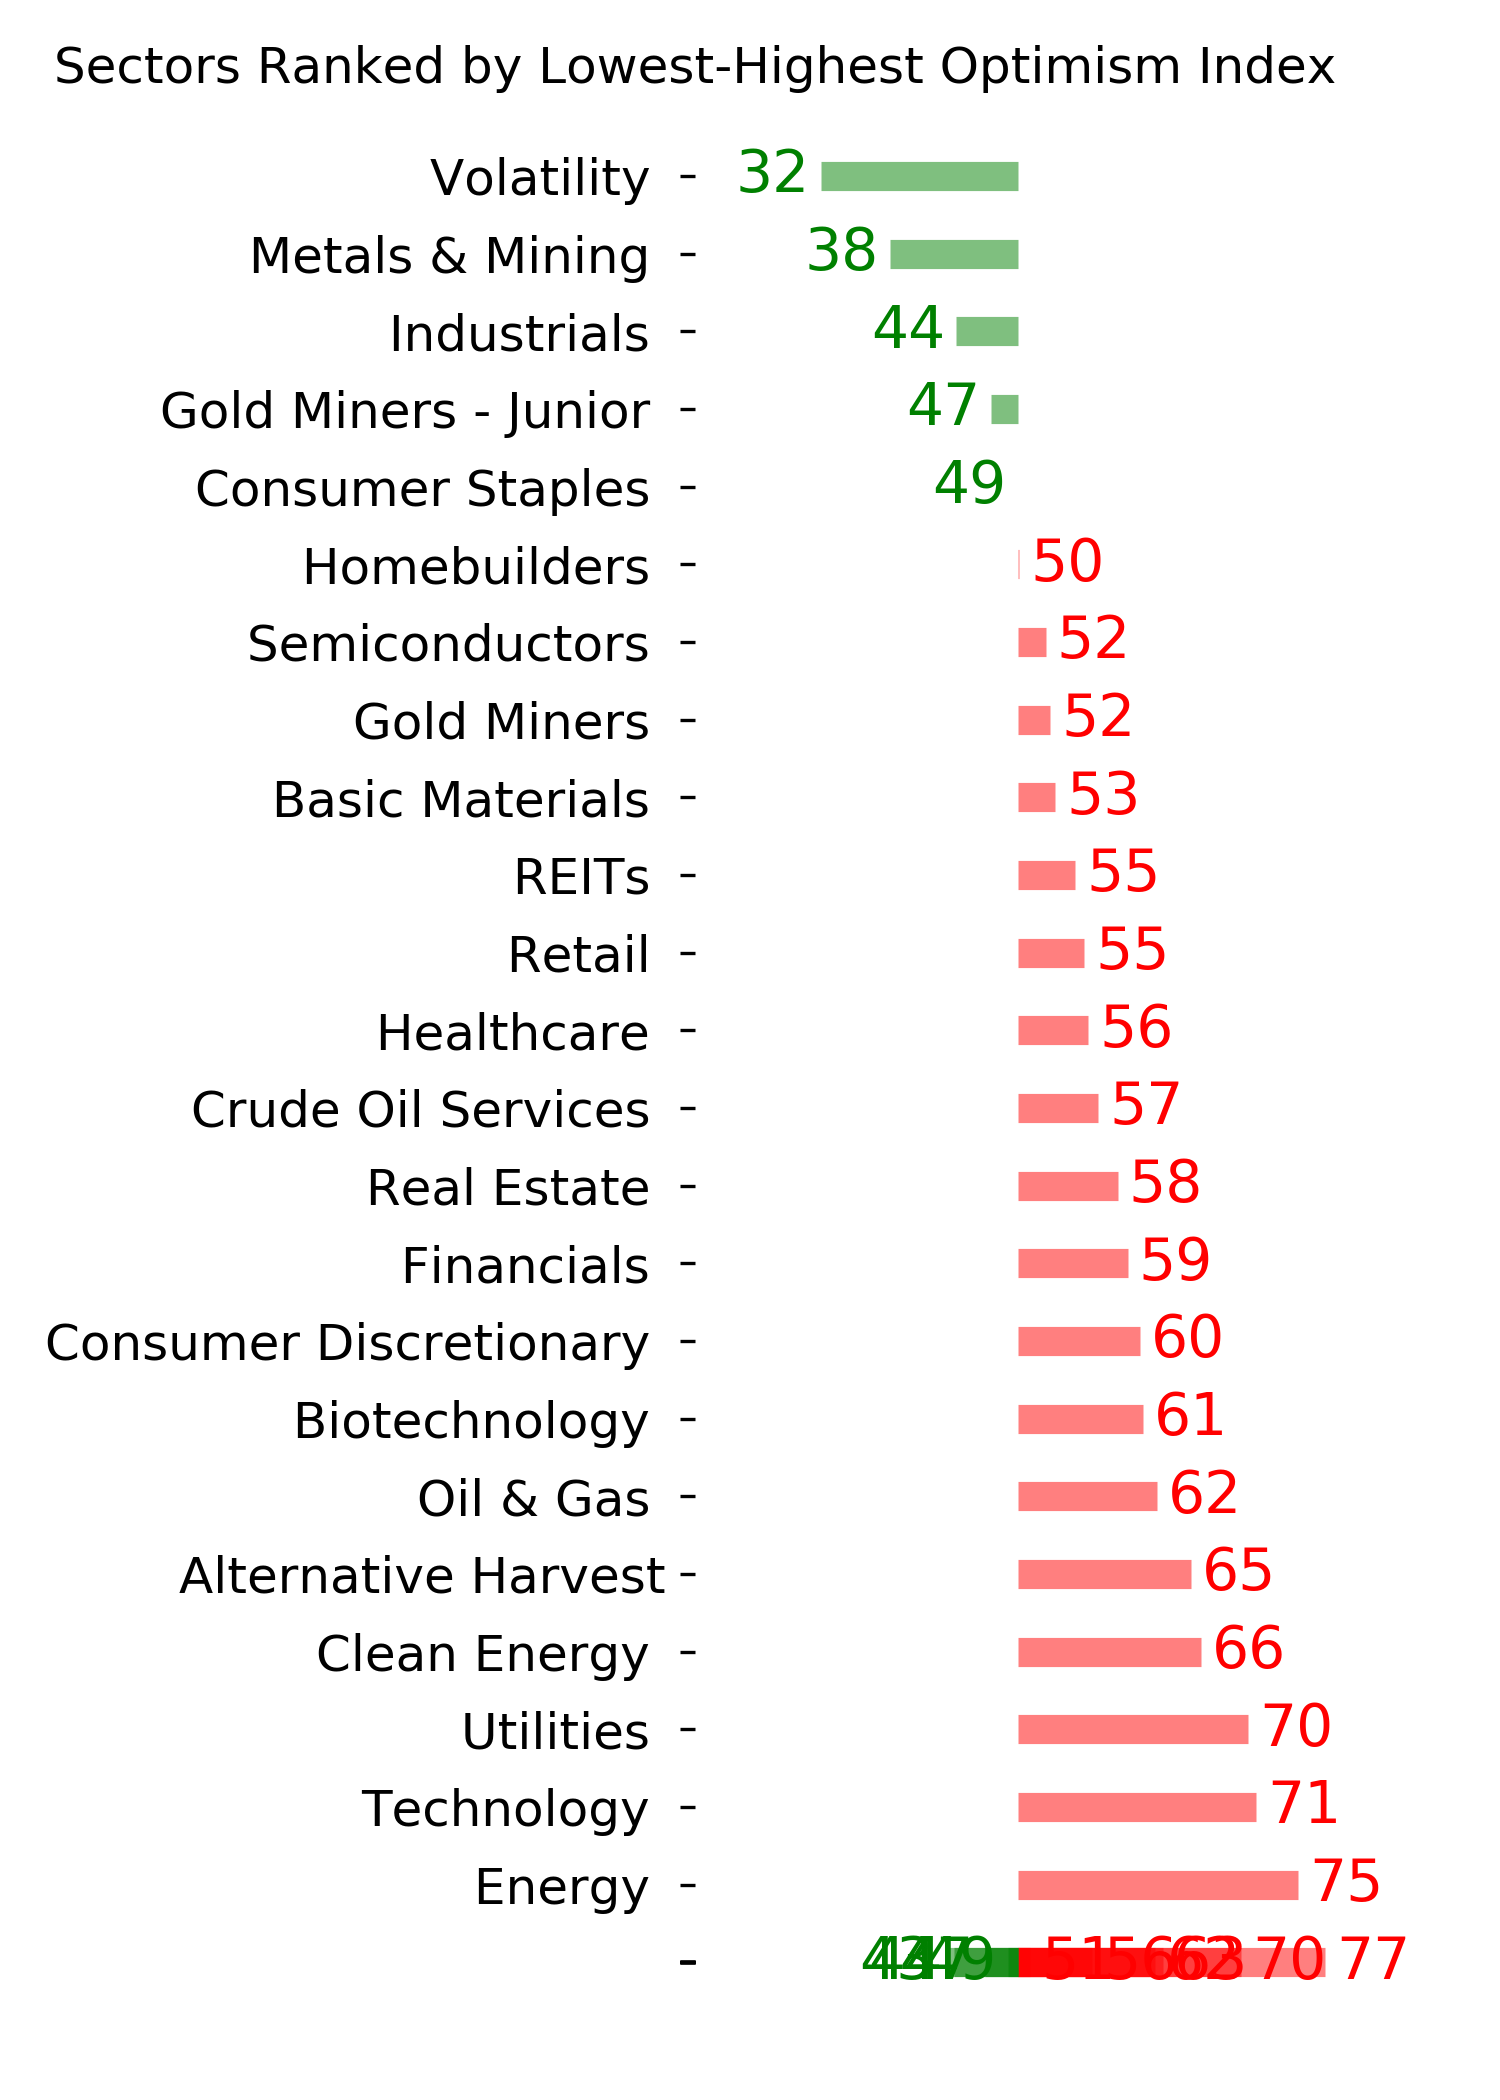
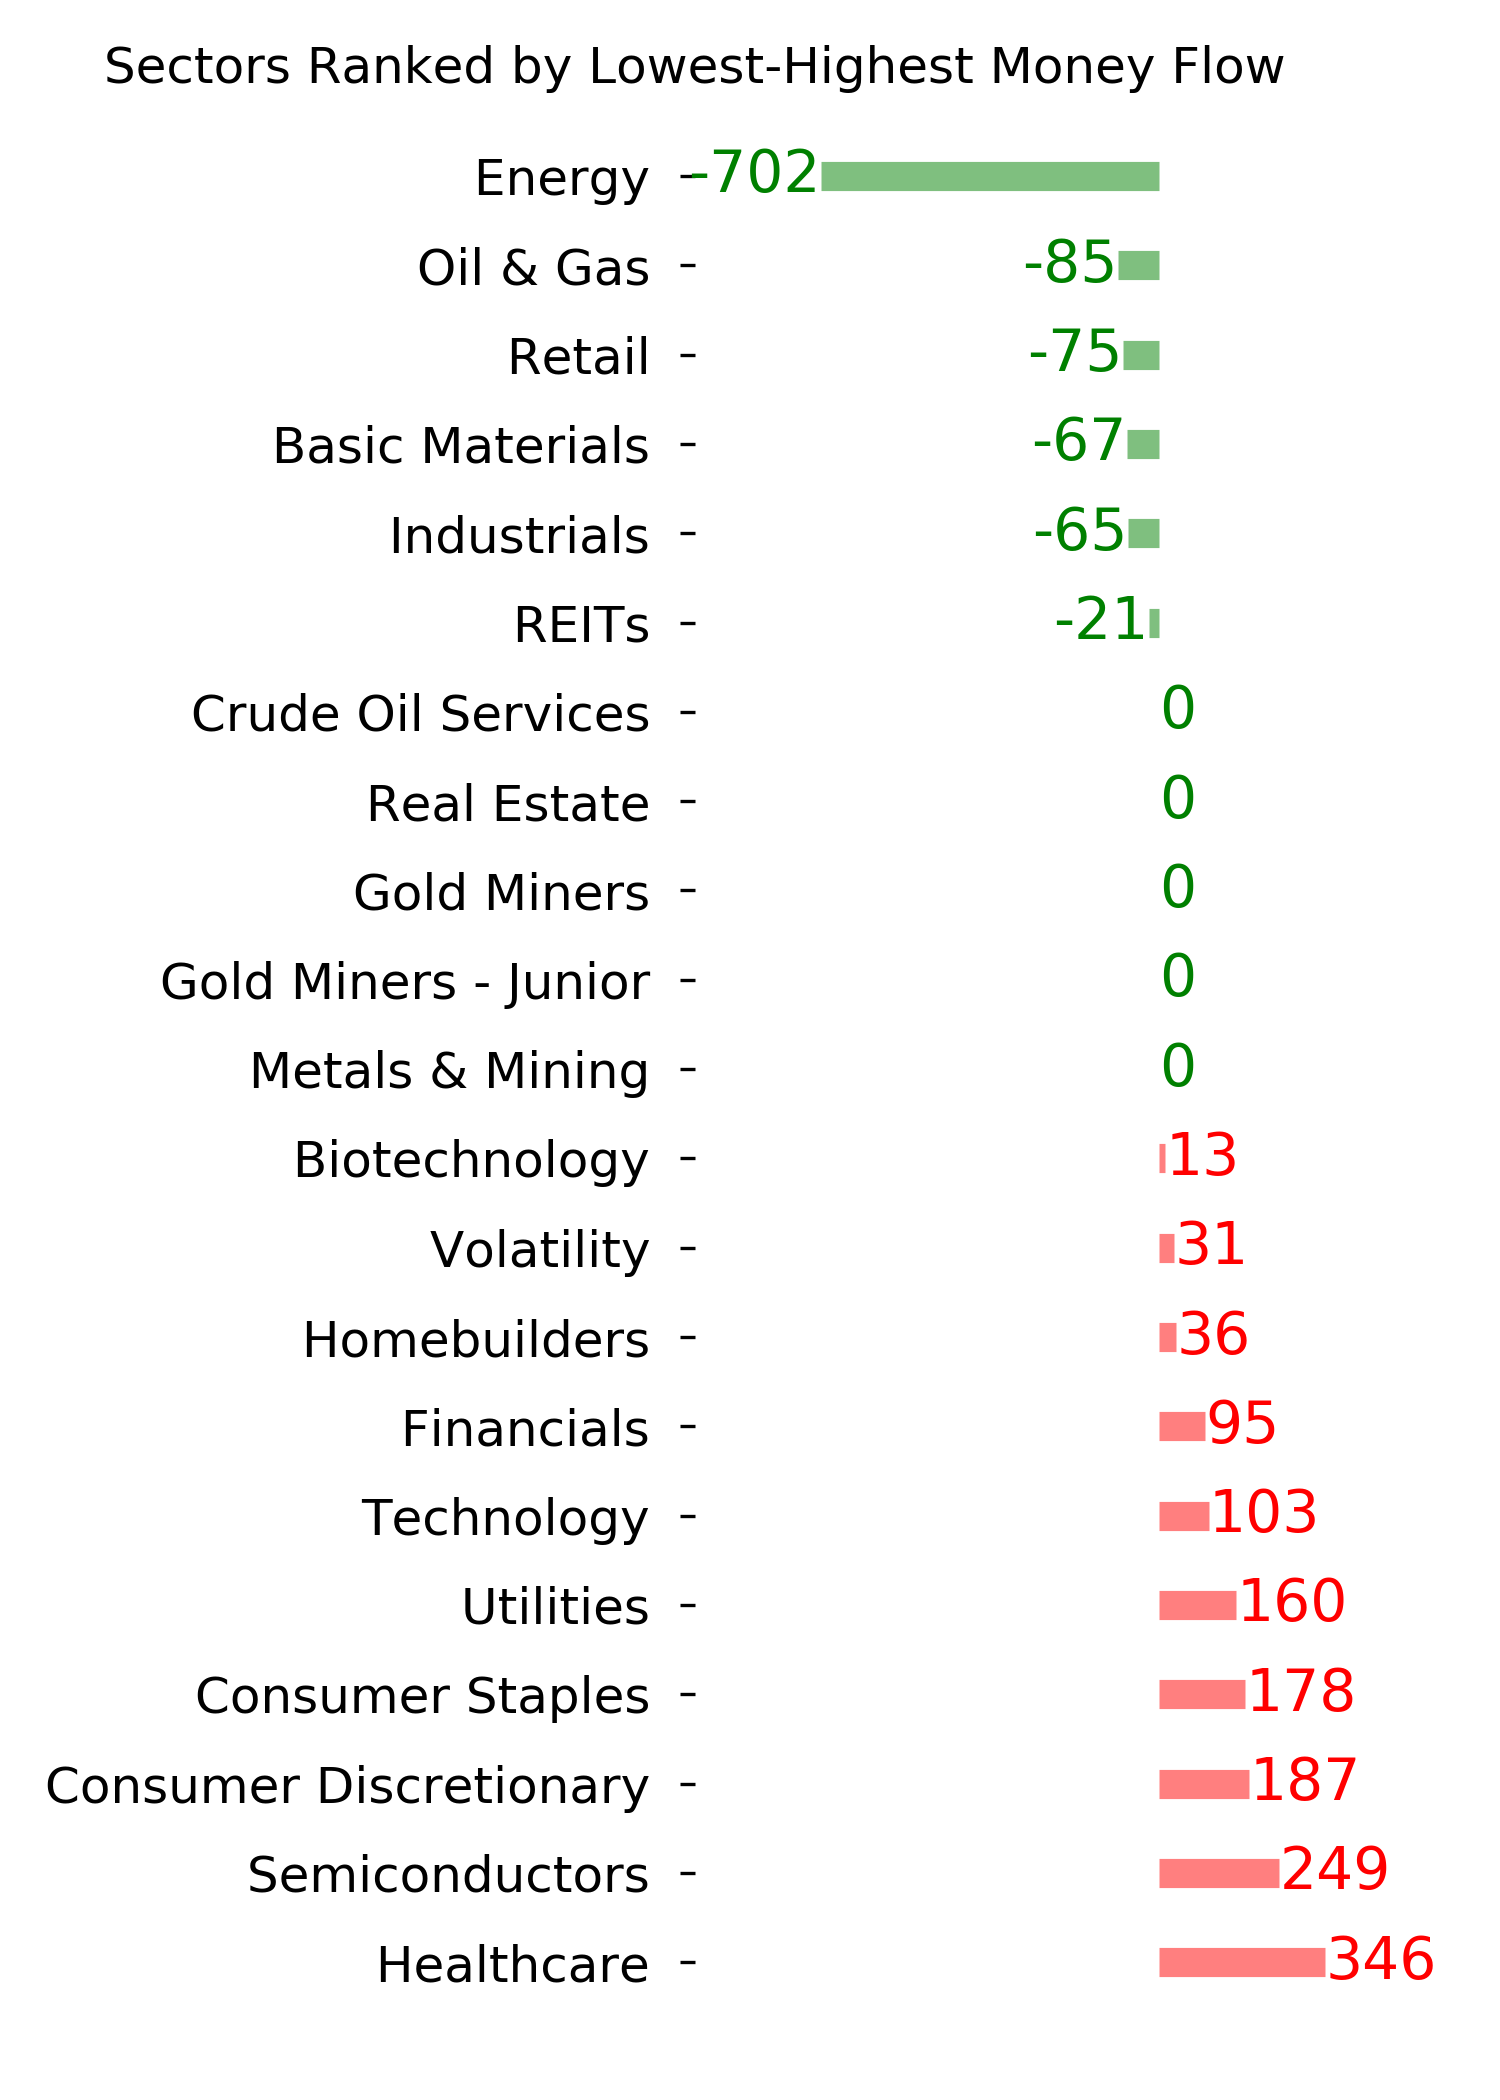
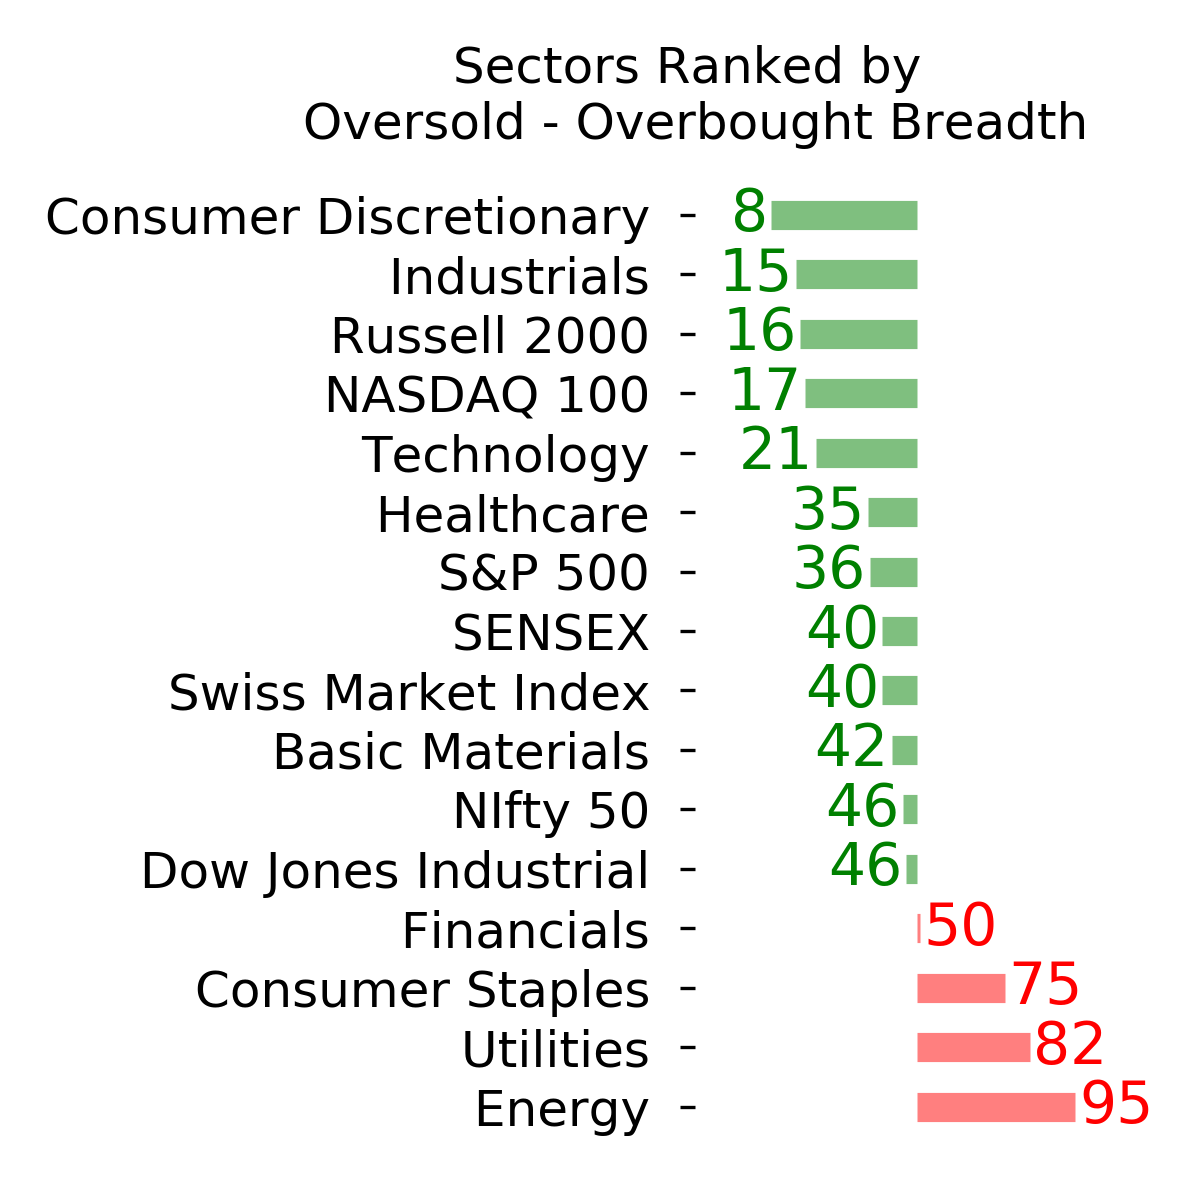
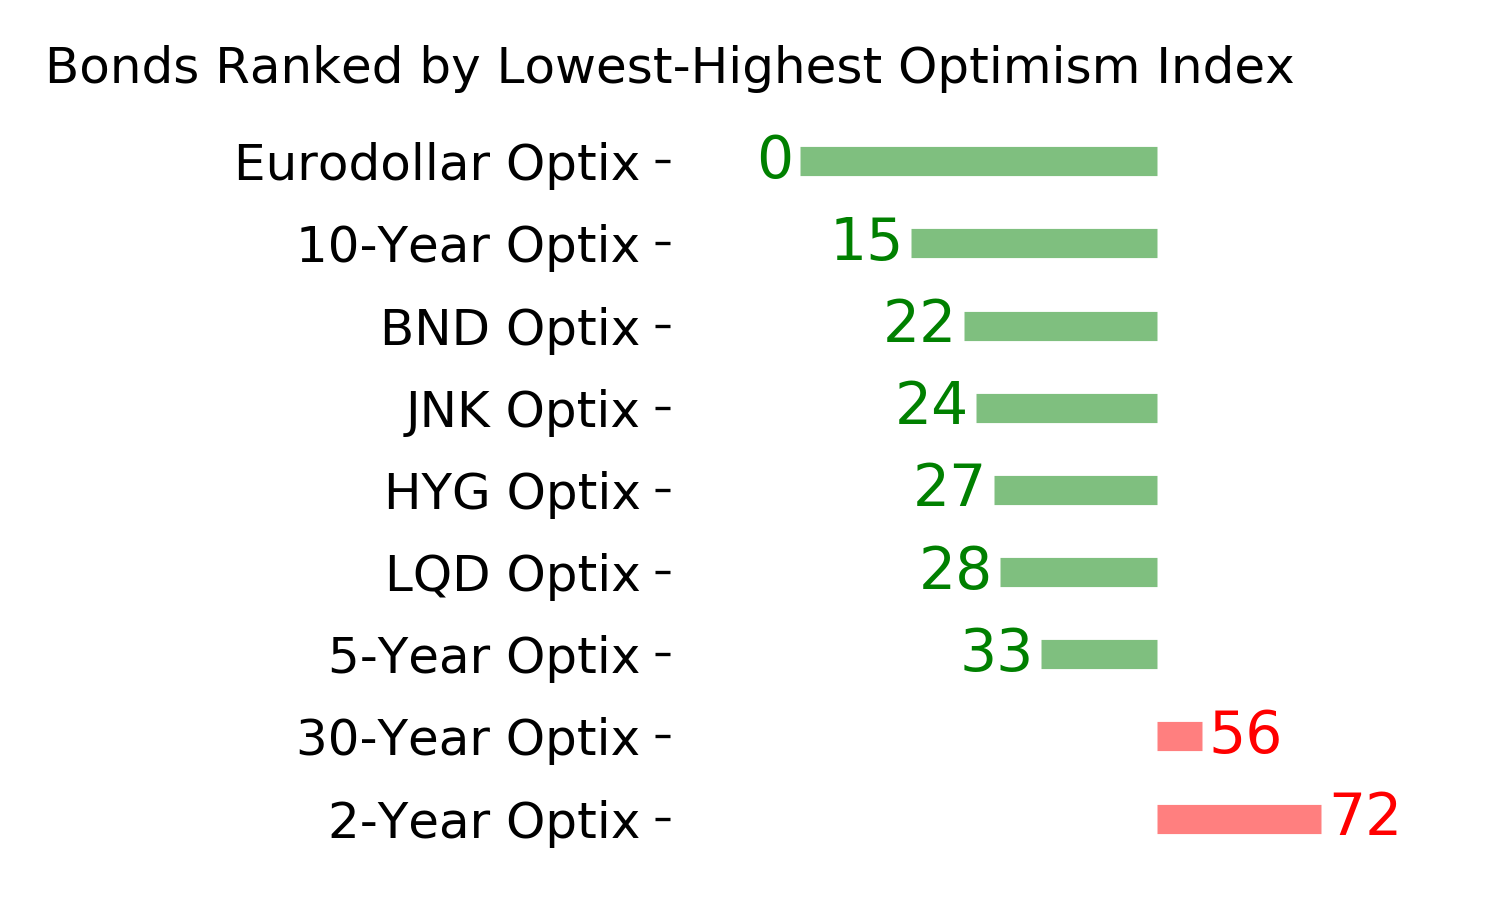
Ranks
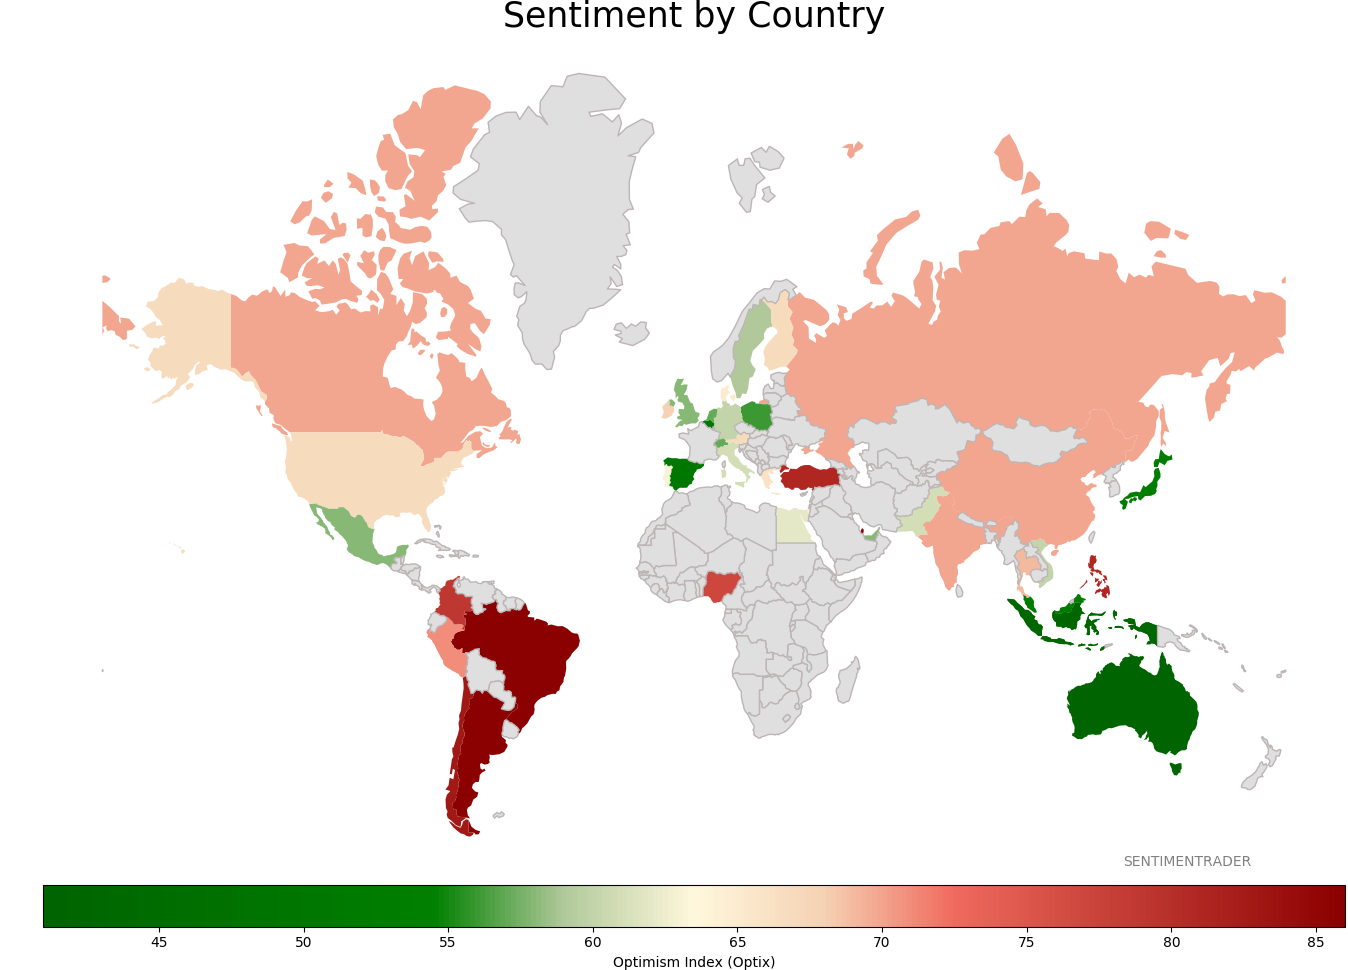
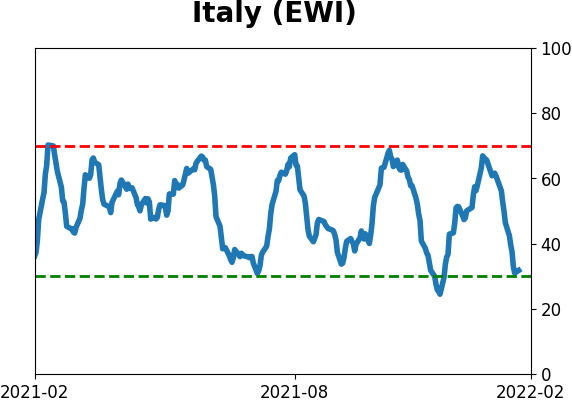
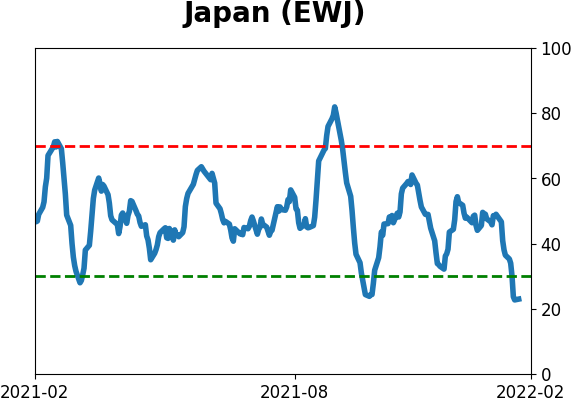
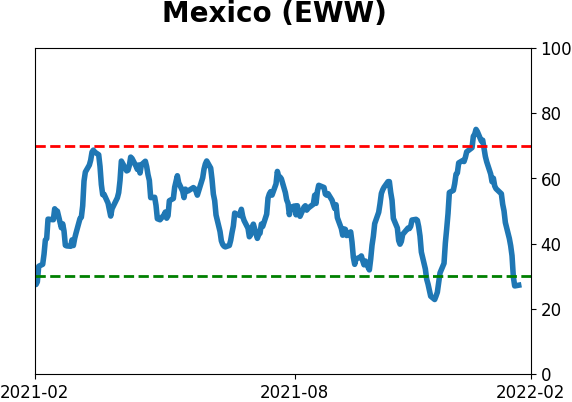
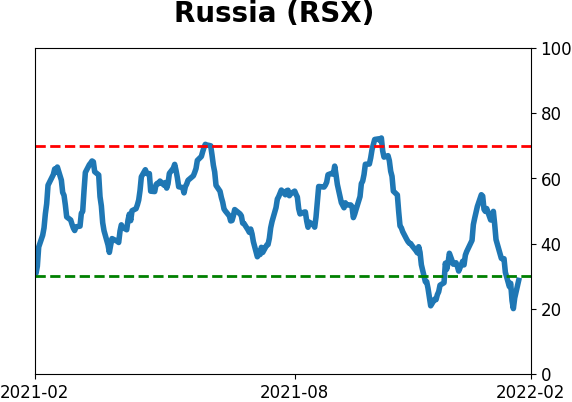
Sentiment Around The World
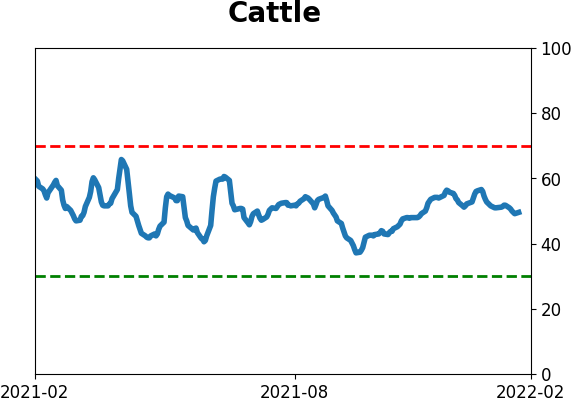
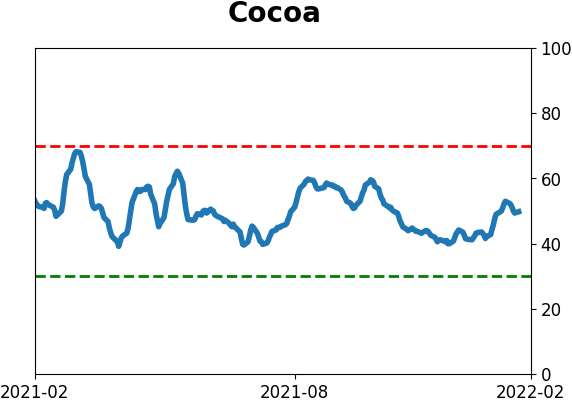
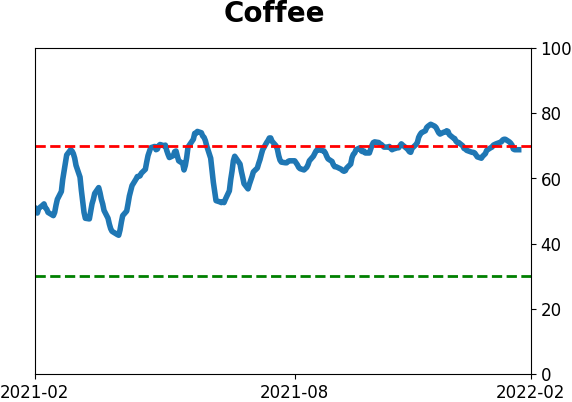
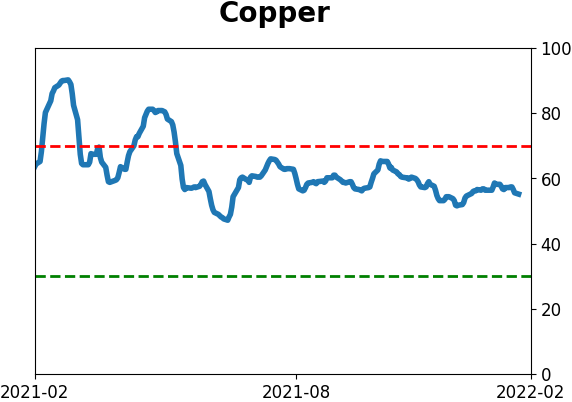
Optimism Index Thumbnails
|
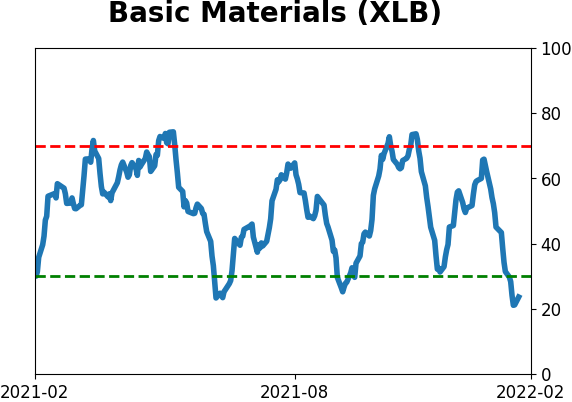
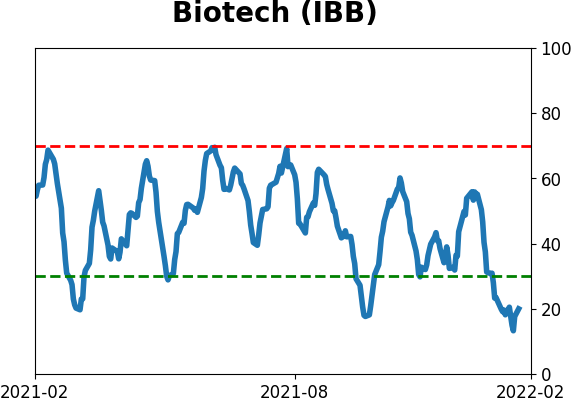
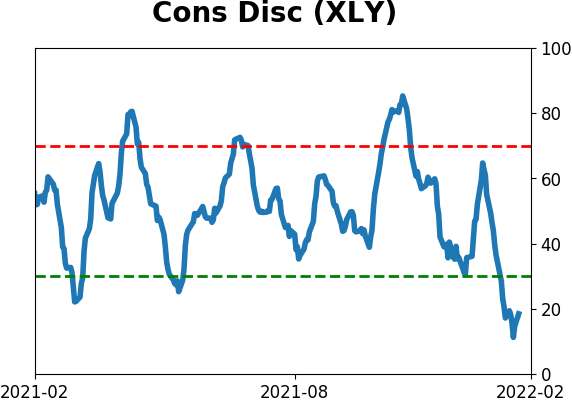
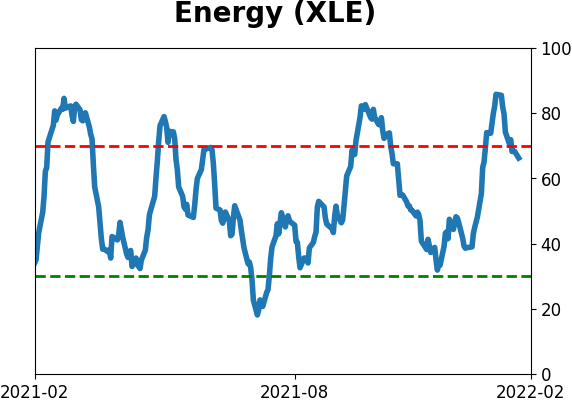
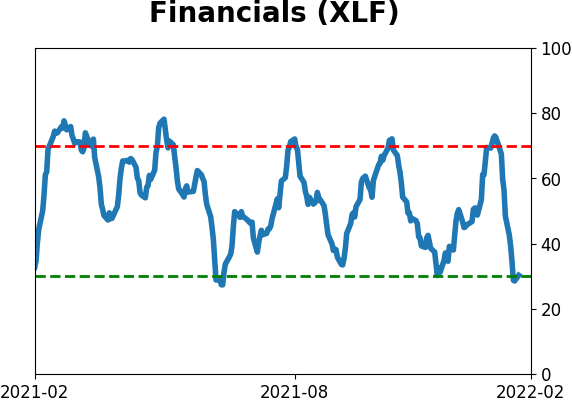
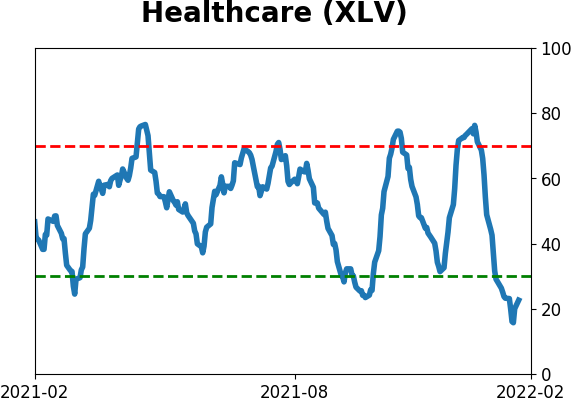
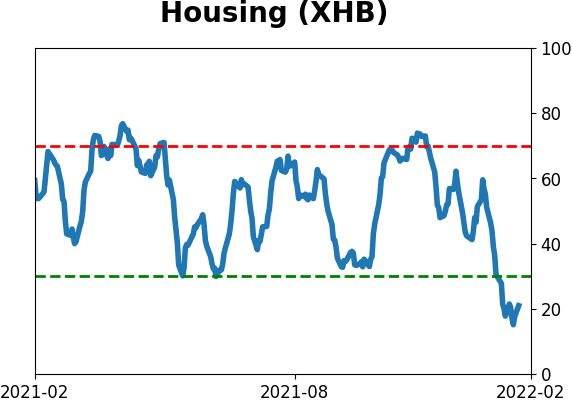
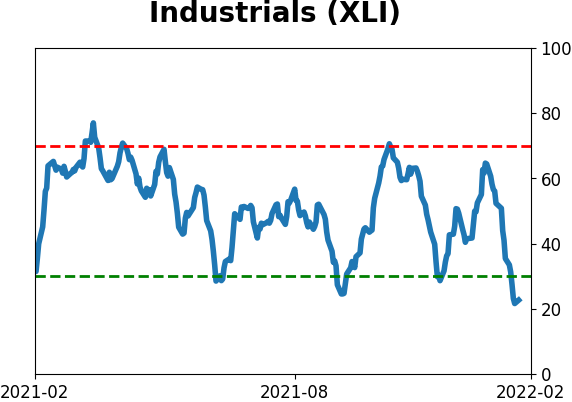
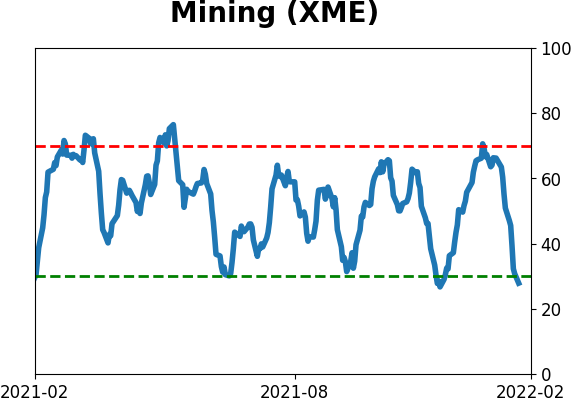
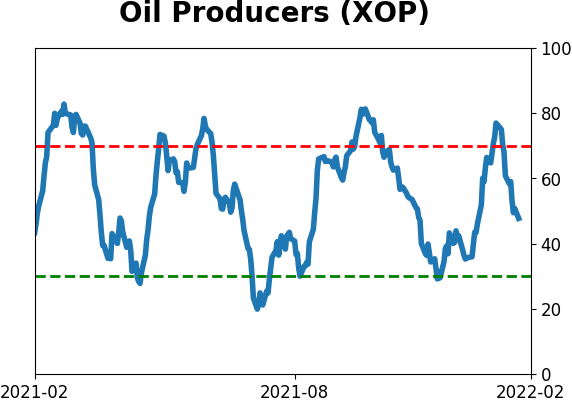
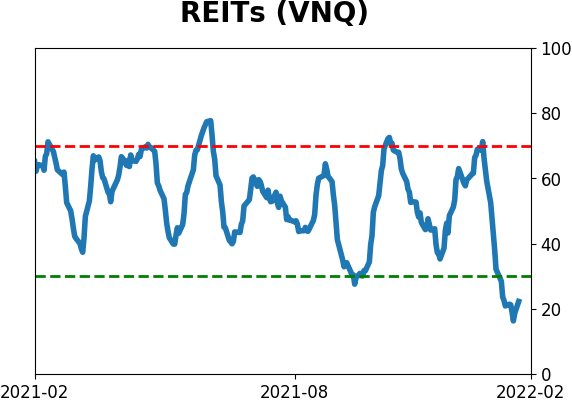
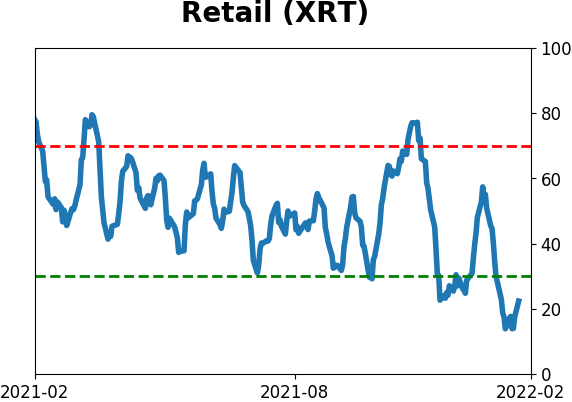
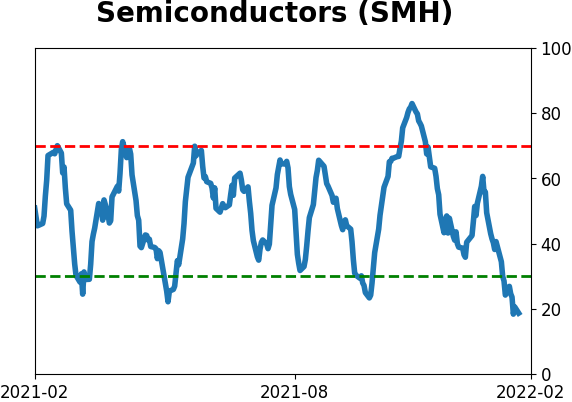
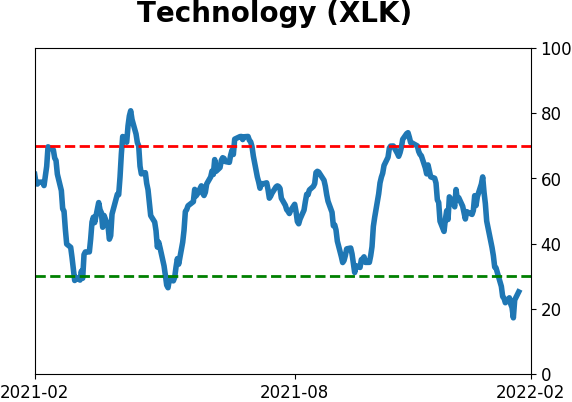
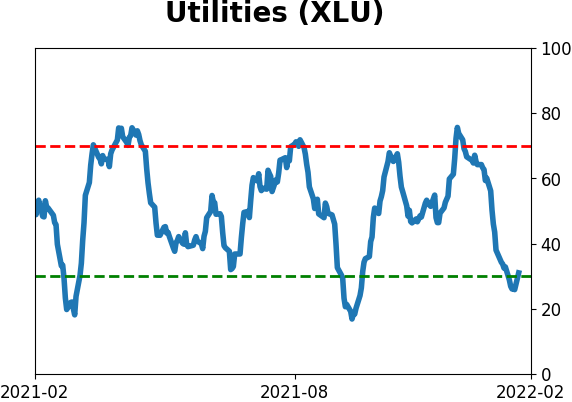
Sector ETF's - 10-Day Moving Average
|
|
|
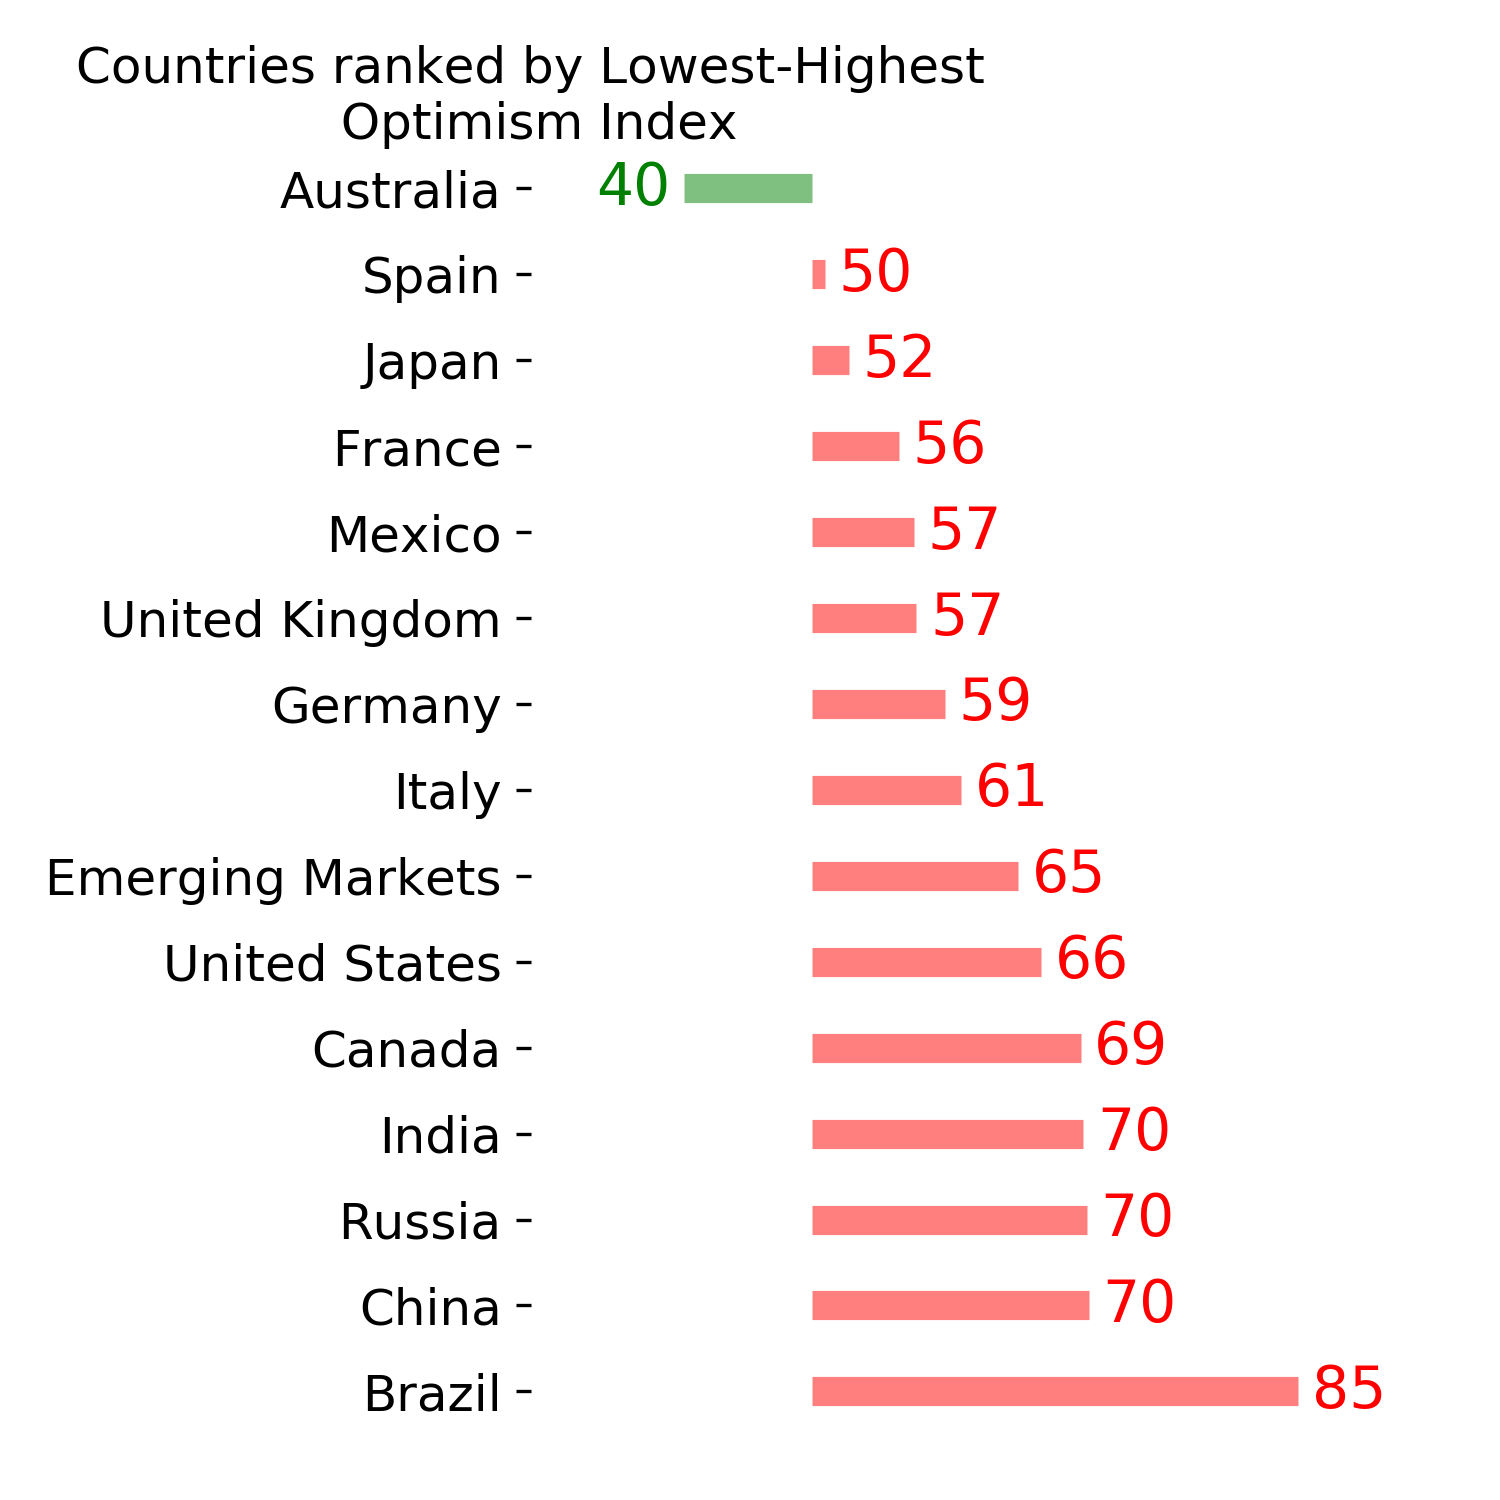
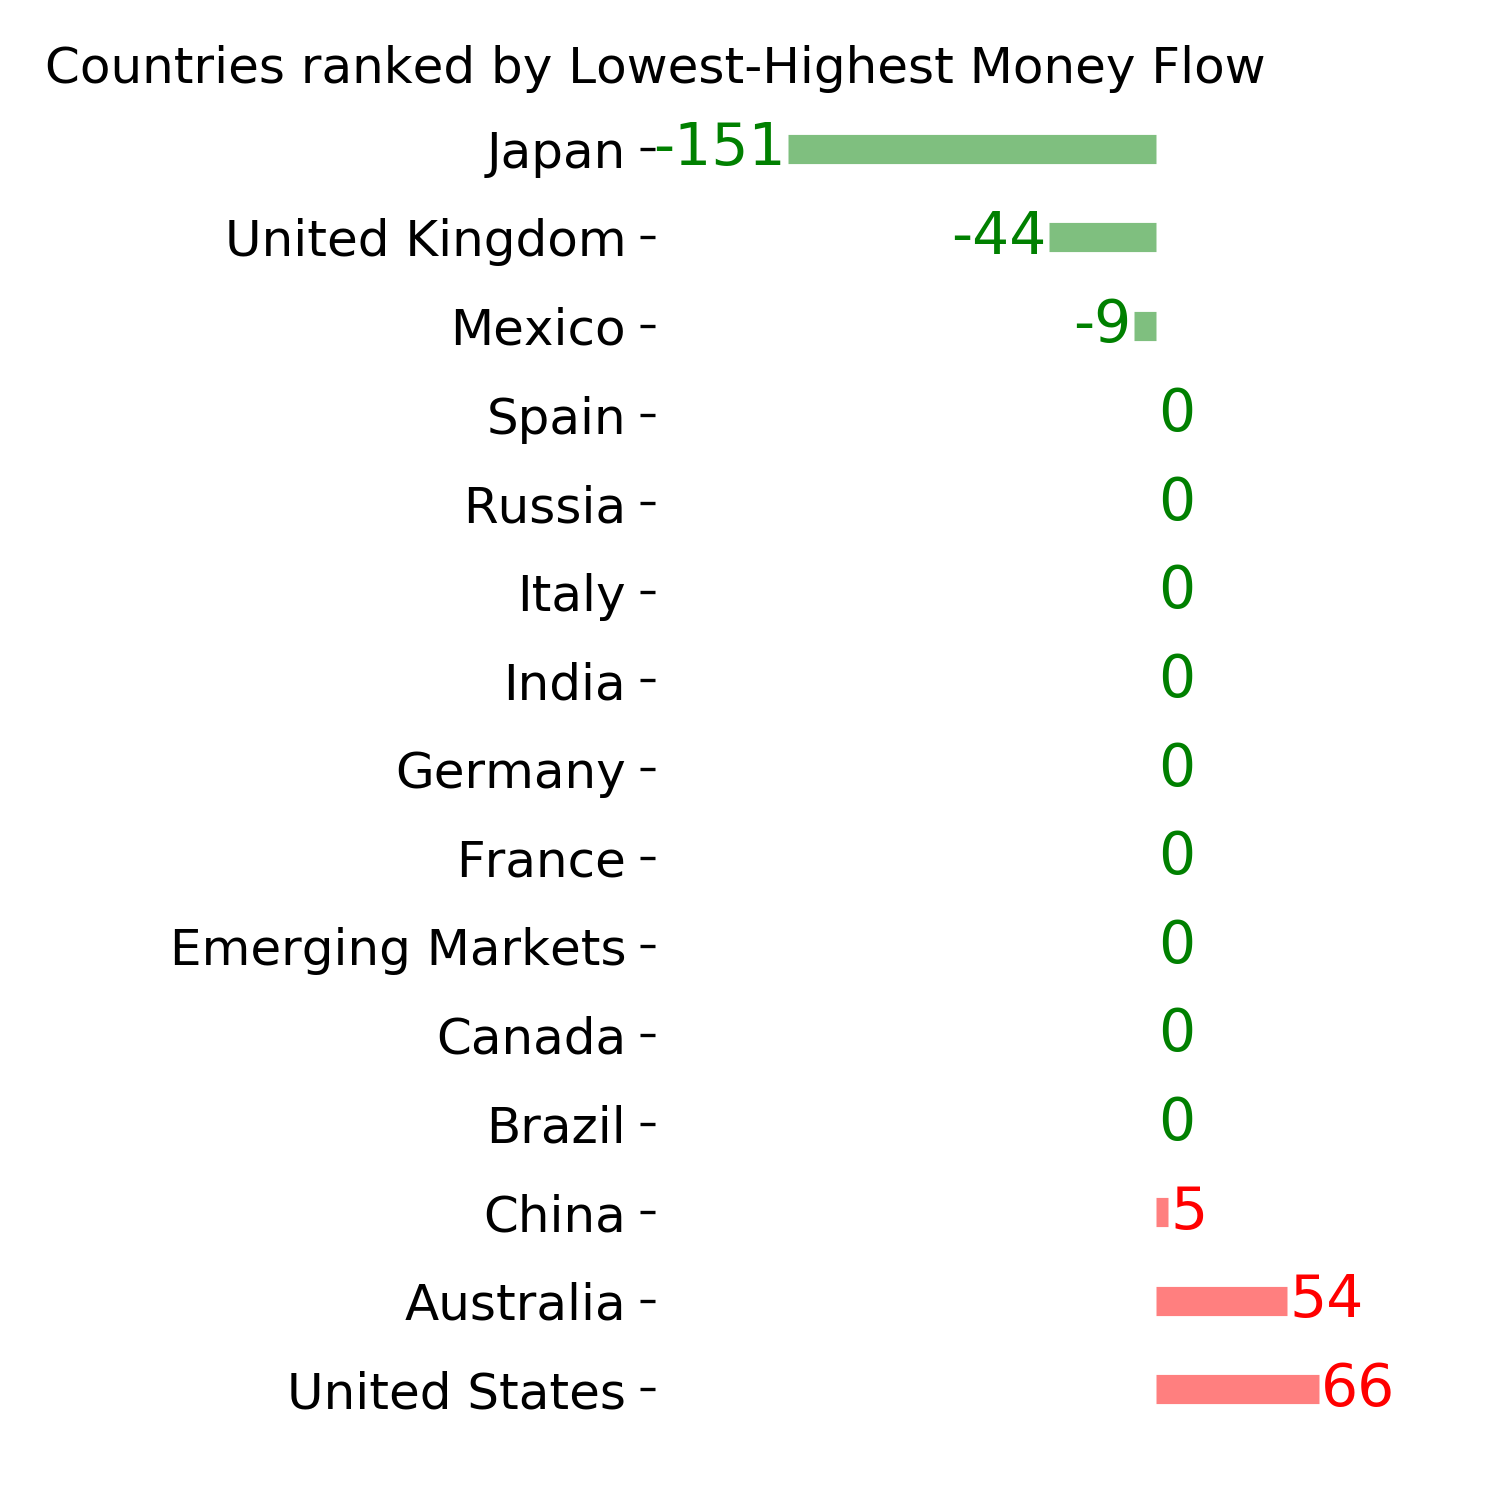
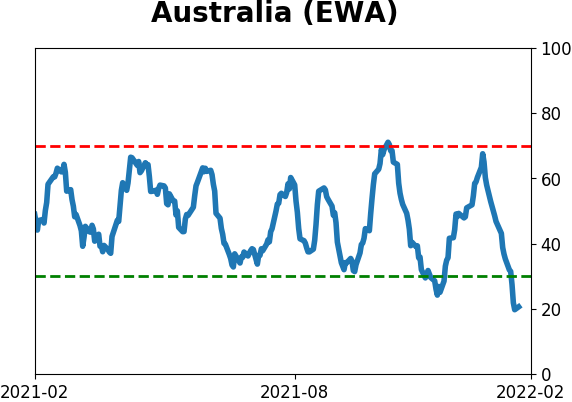
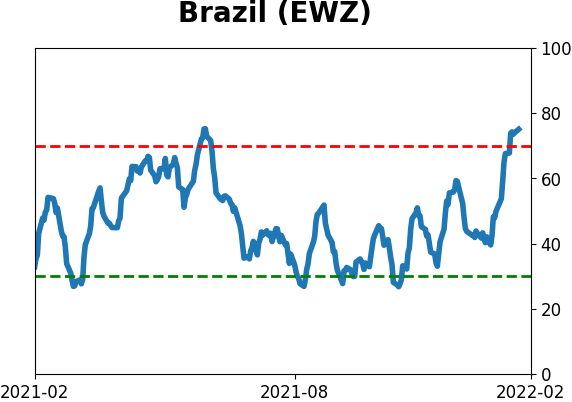
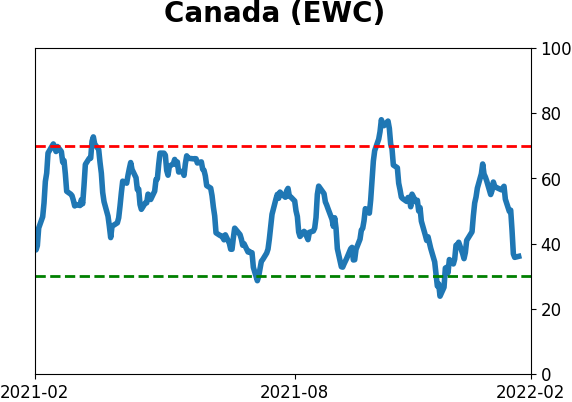
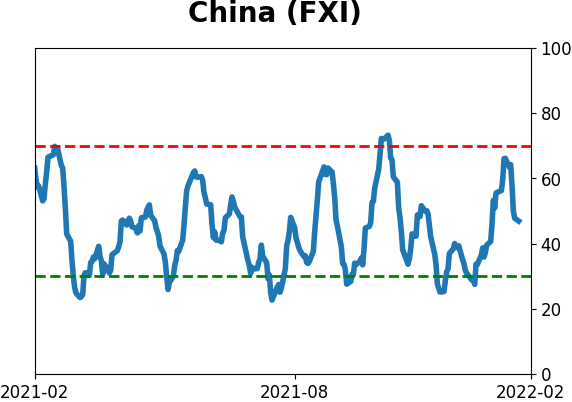
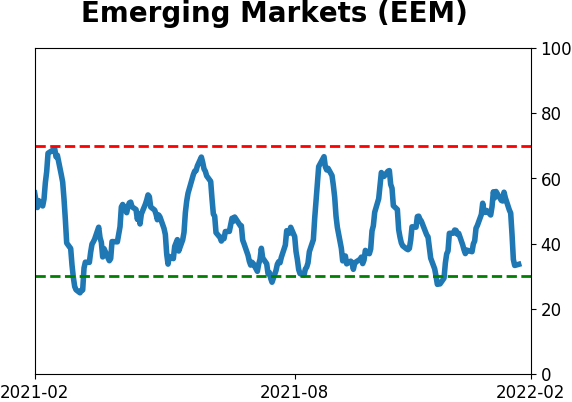
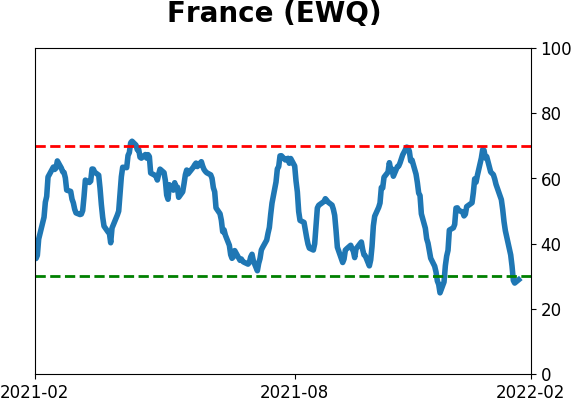
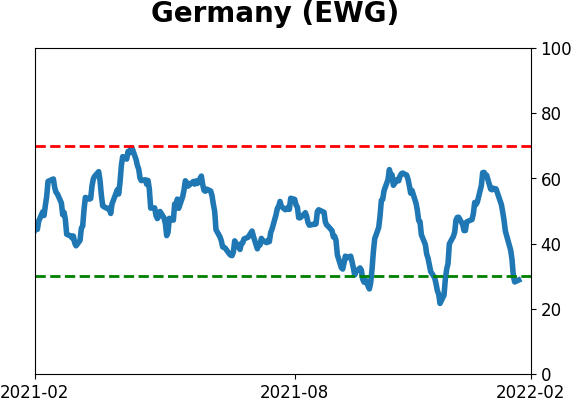
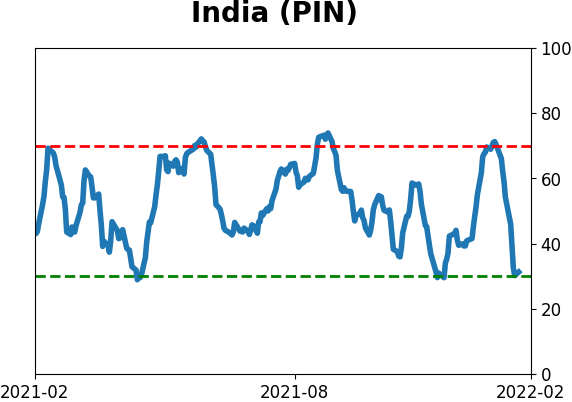
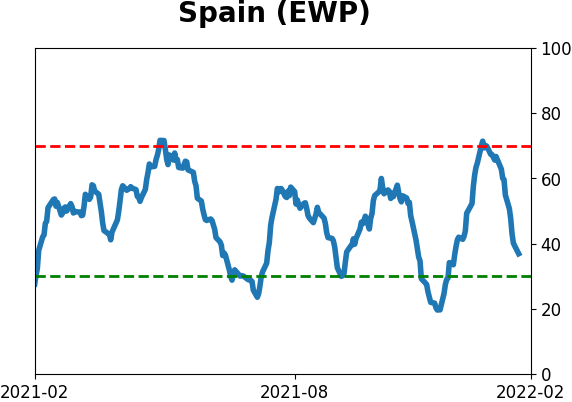
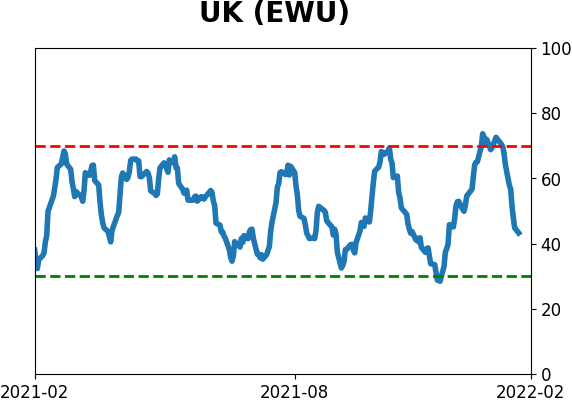
Country ETF's - 10-Day Moving Average
|
|
|
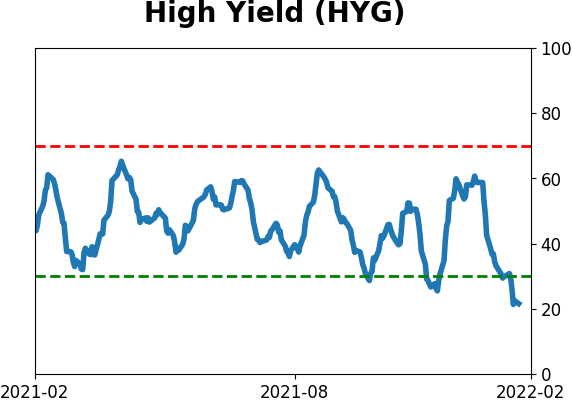
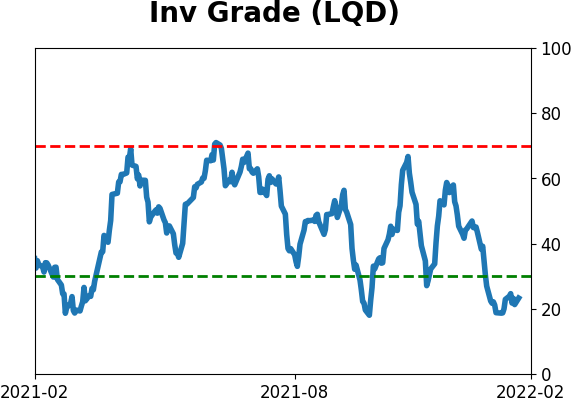
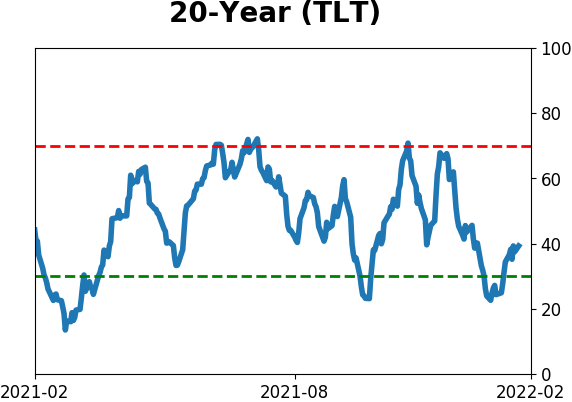
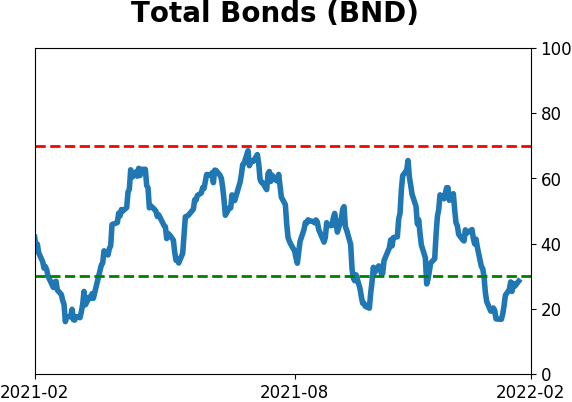
Bond ETF's - 10-Day Moving Average
|
|
|
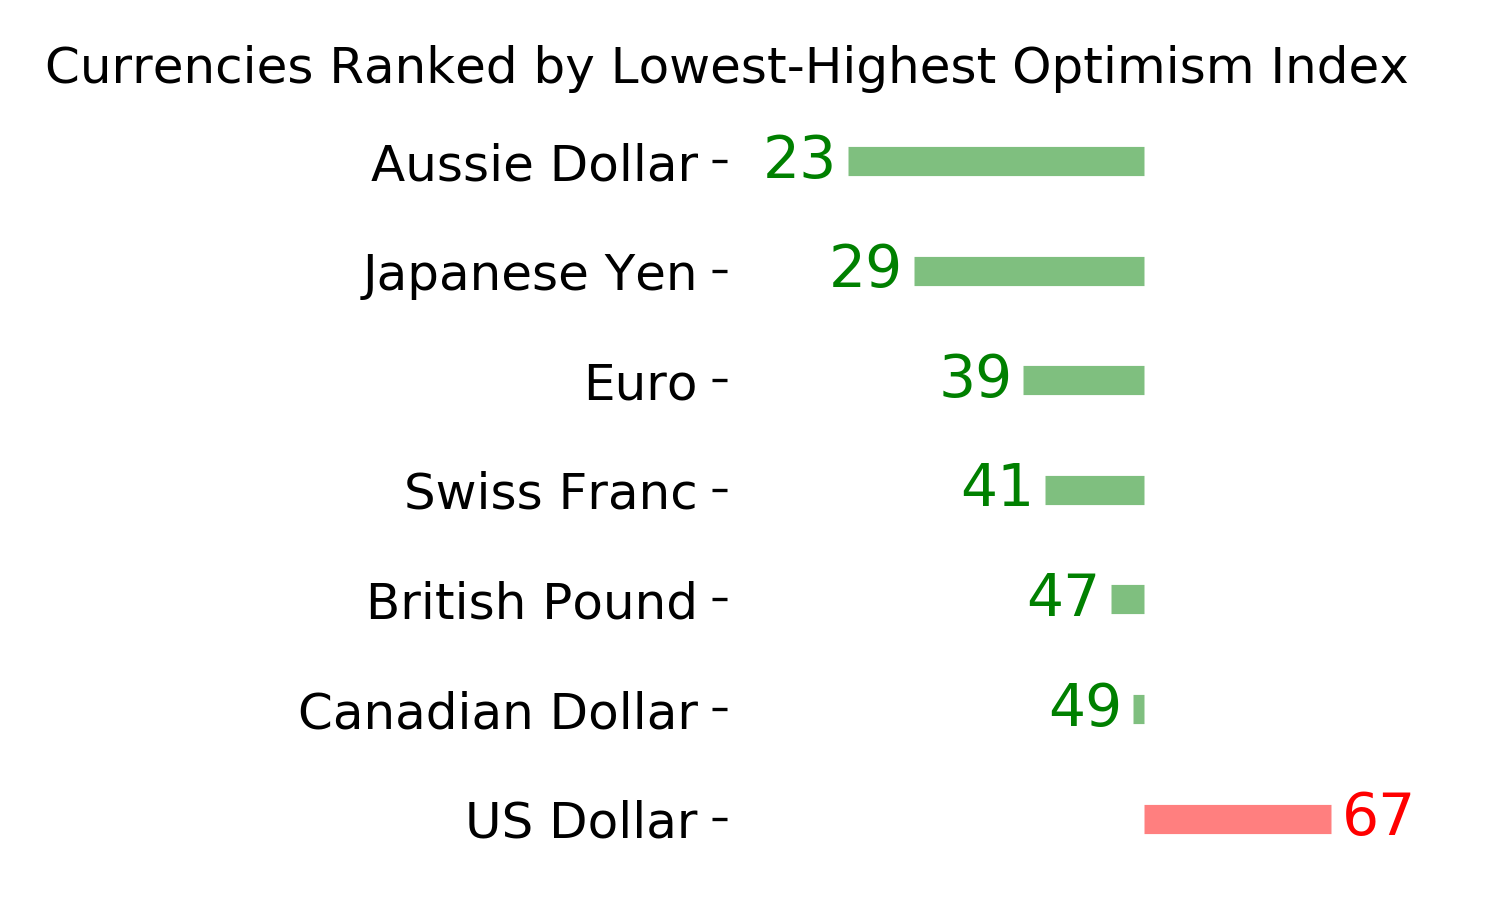
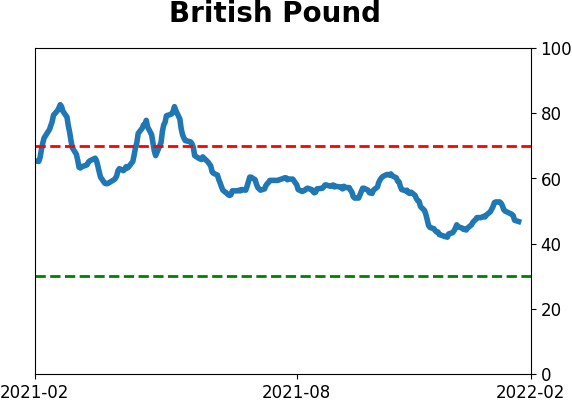
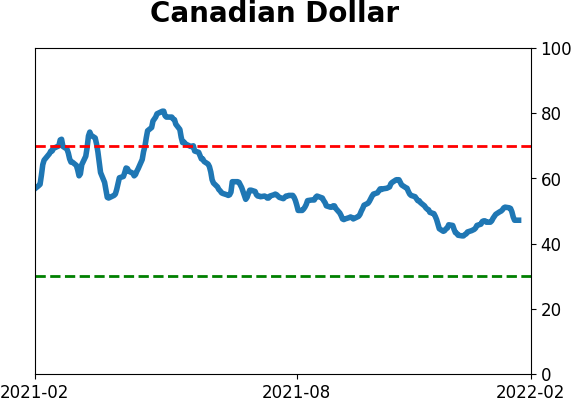
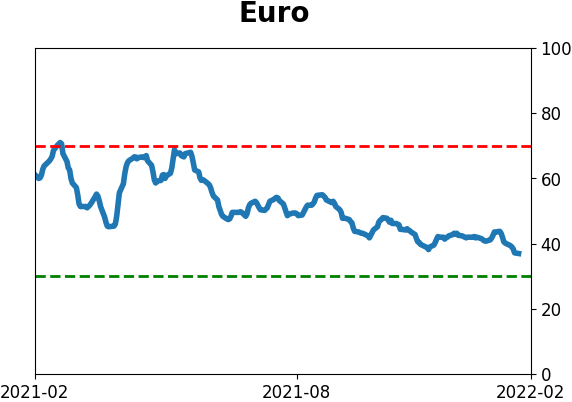
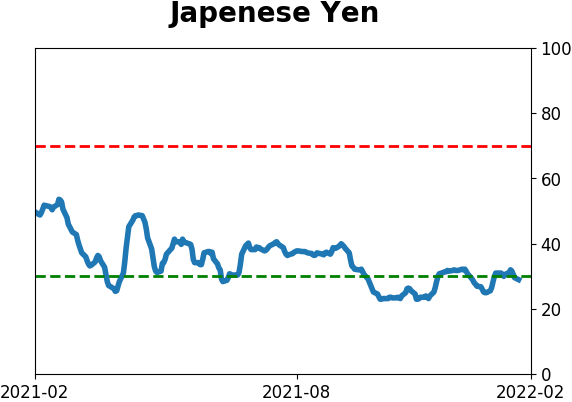
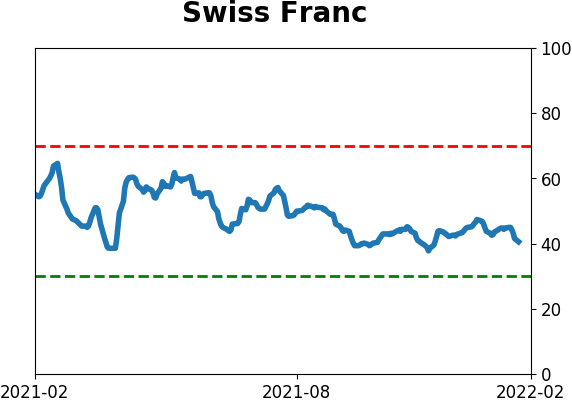
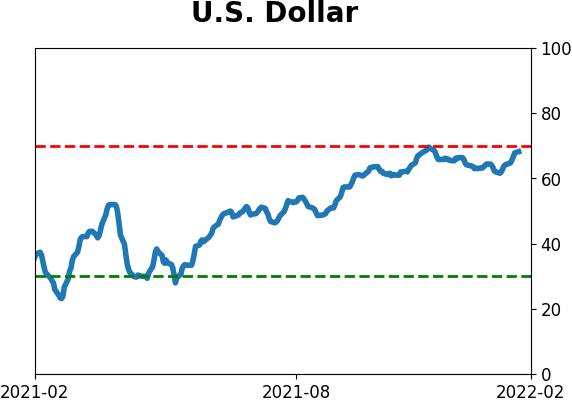
Currency ETF's - 5-Day Moving Average
|
|
|
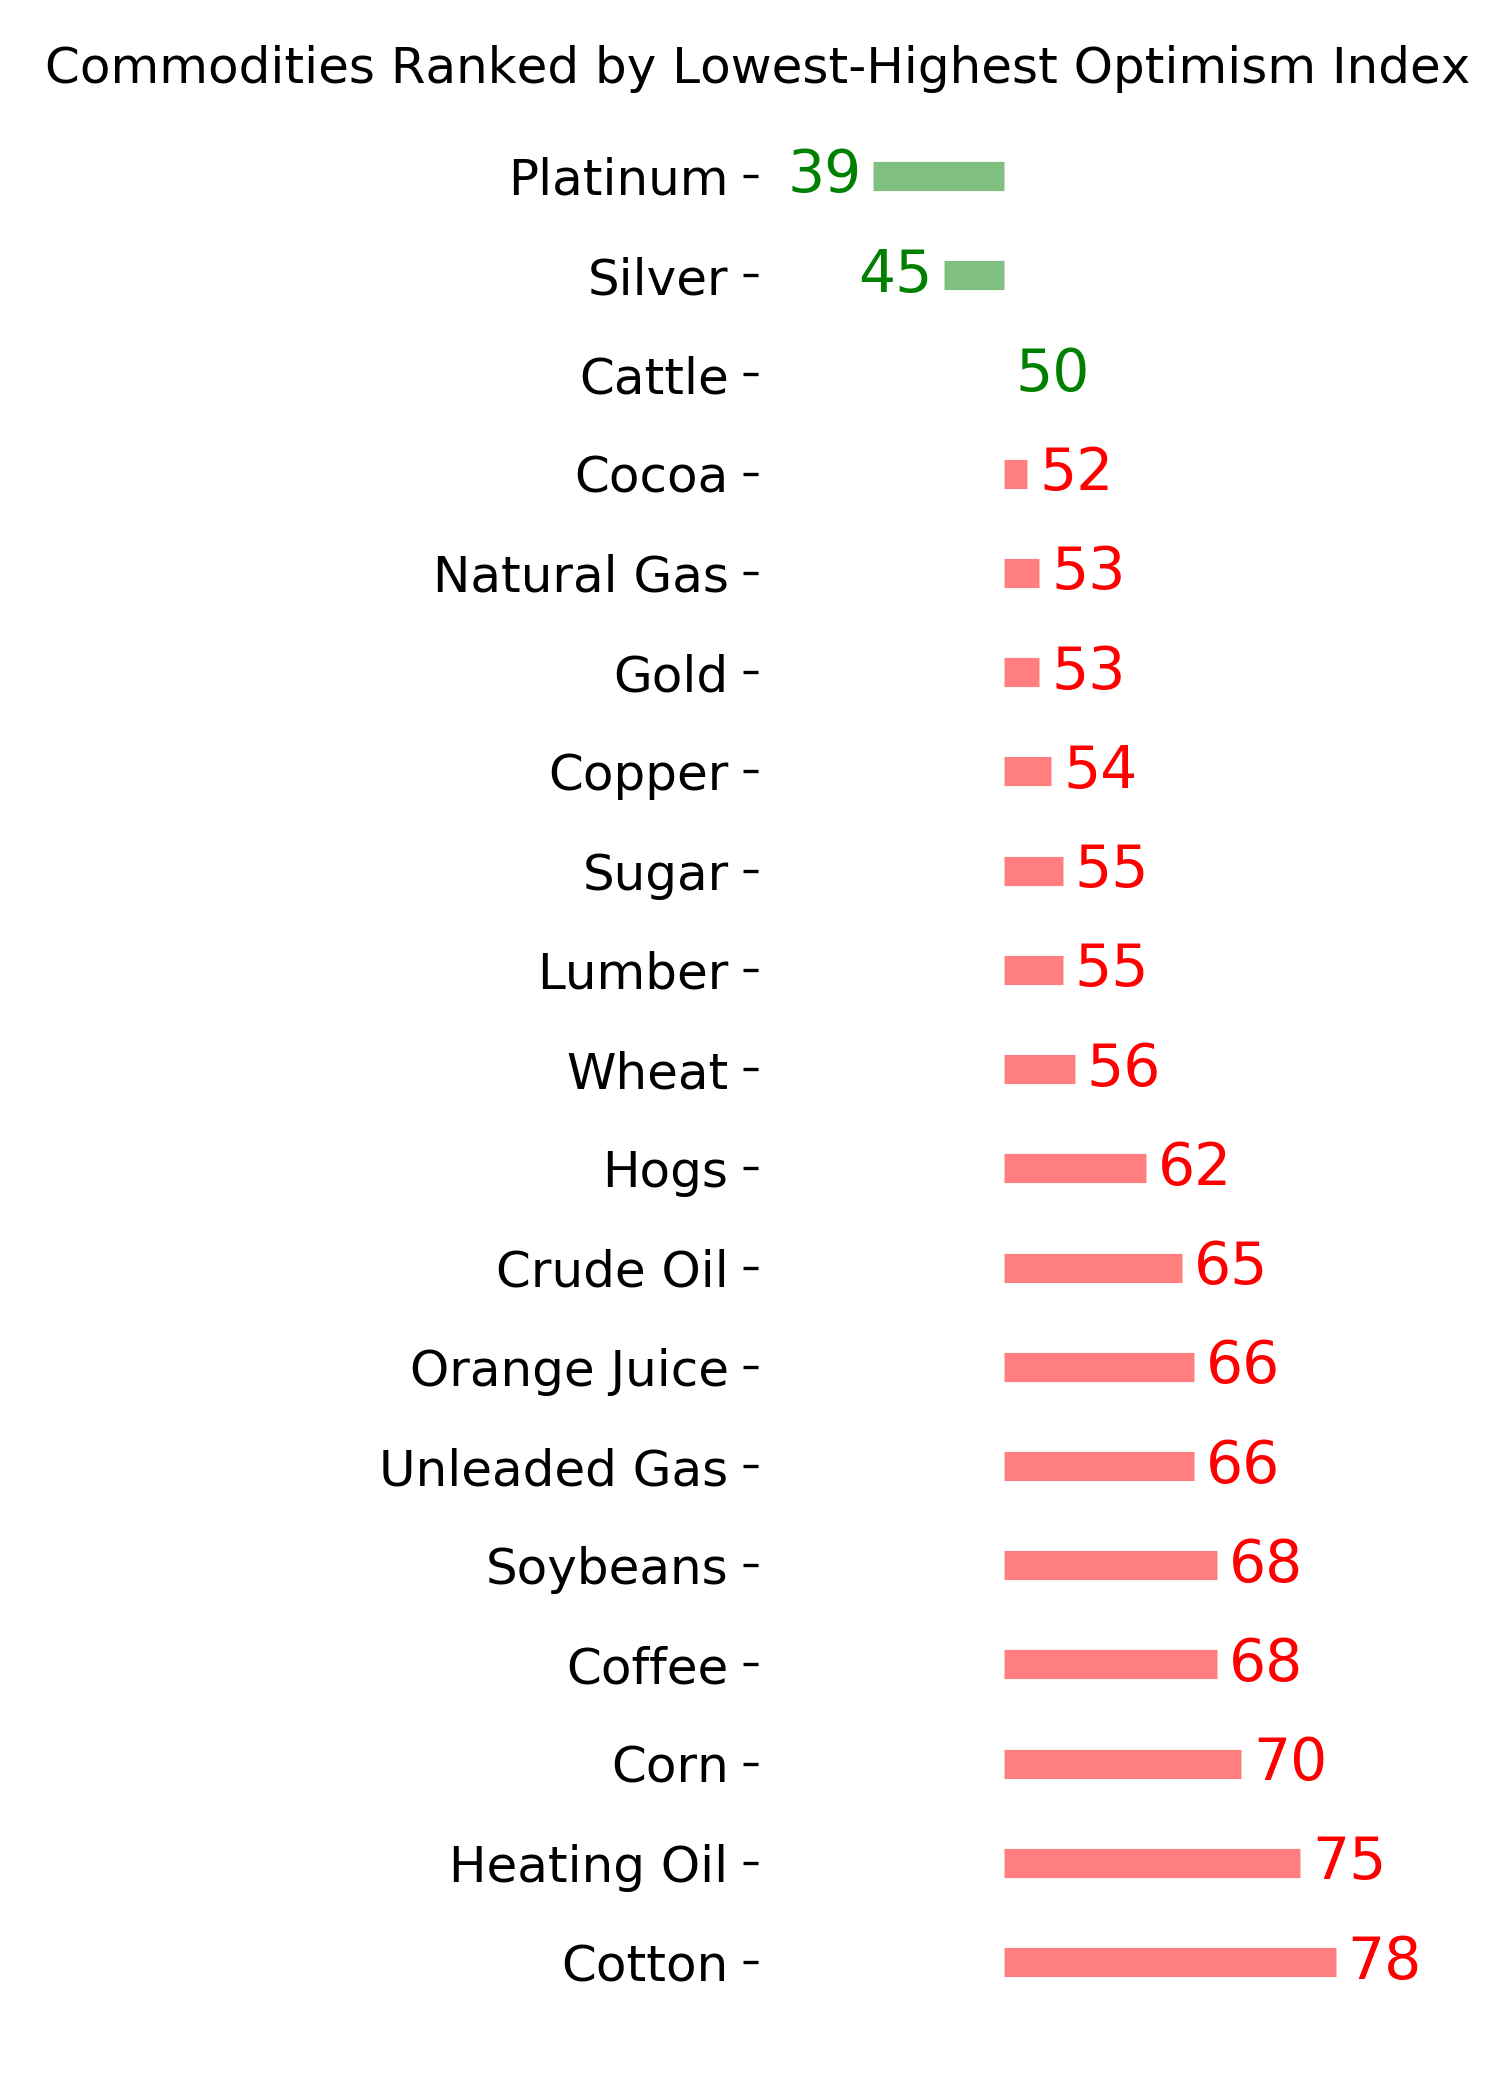
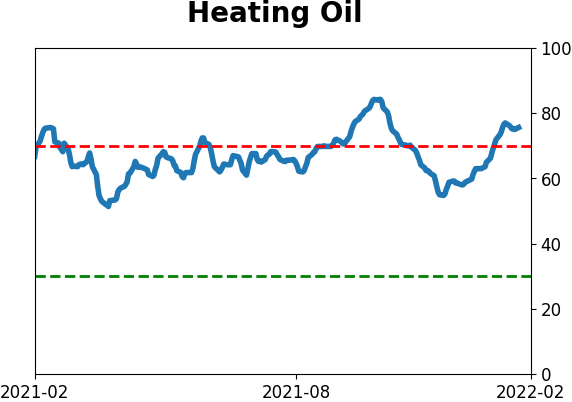
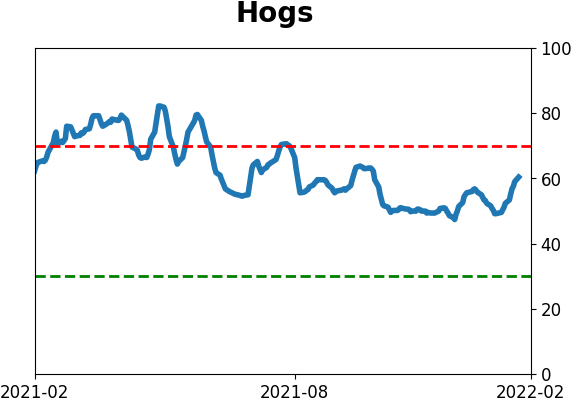
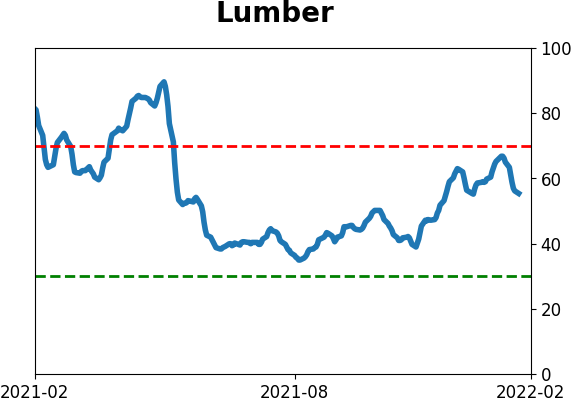
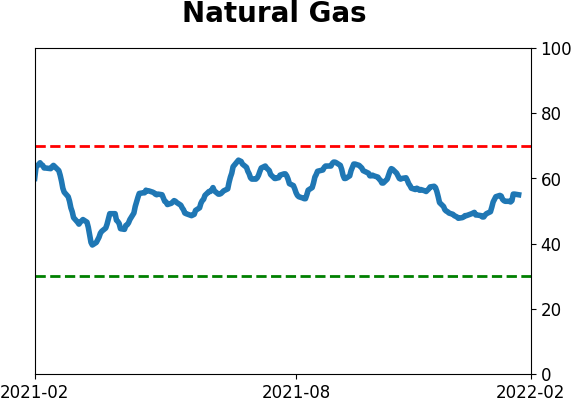
Commodity ETF's - 5-Day Moving Average
|
|