Headlines
|
|
What happens when Info Tech drives the market to record highs:
As the S&P 500 recorded its recent record highs, only the information technology sector was along for the ride and setting its own records. On average, the other major sectors were down several percent from their highs. Similar records in the S&P, when it was accompanied only by technology, showed a consistent tendency for more gains.
|
Smart / Dumb Money Confidence
|
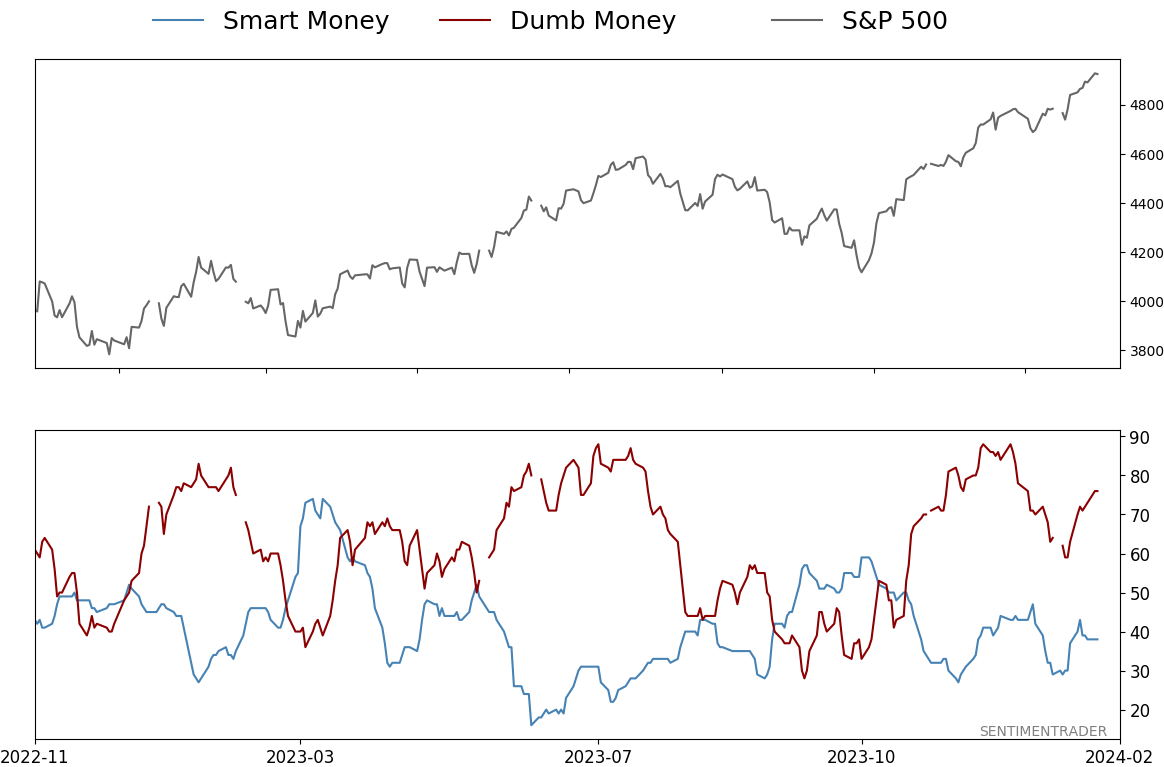
Smart Money Confidence: 38%
Dumb Money Confidence: 76%
|
|
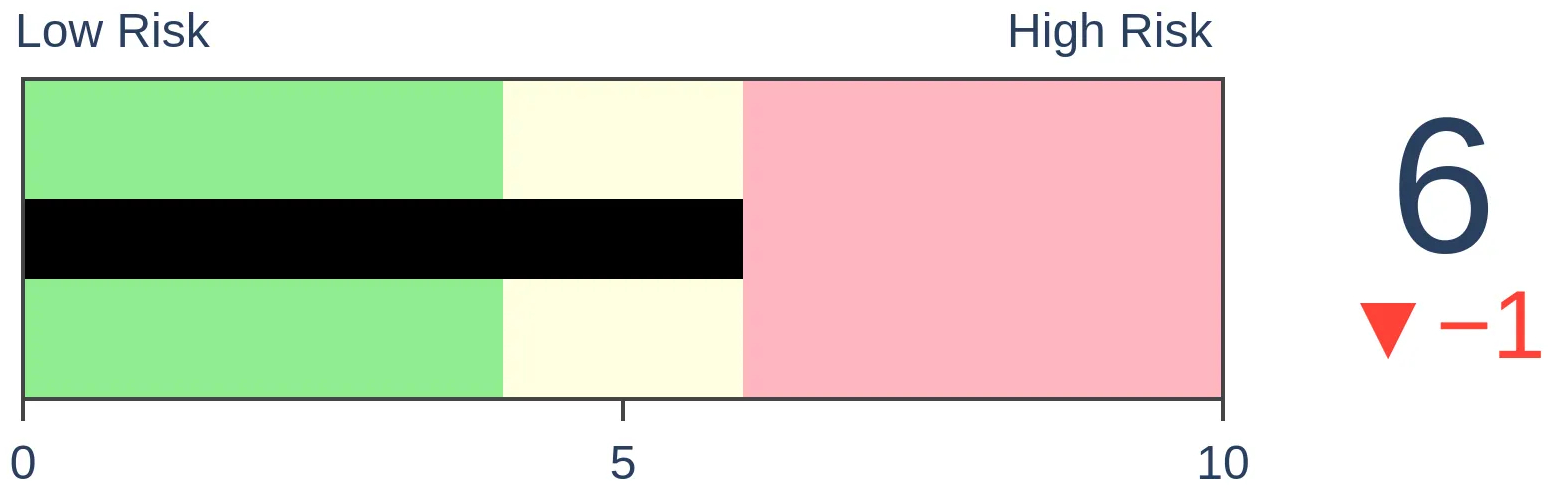
Risk Levels
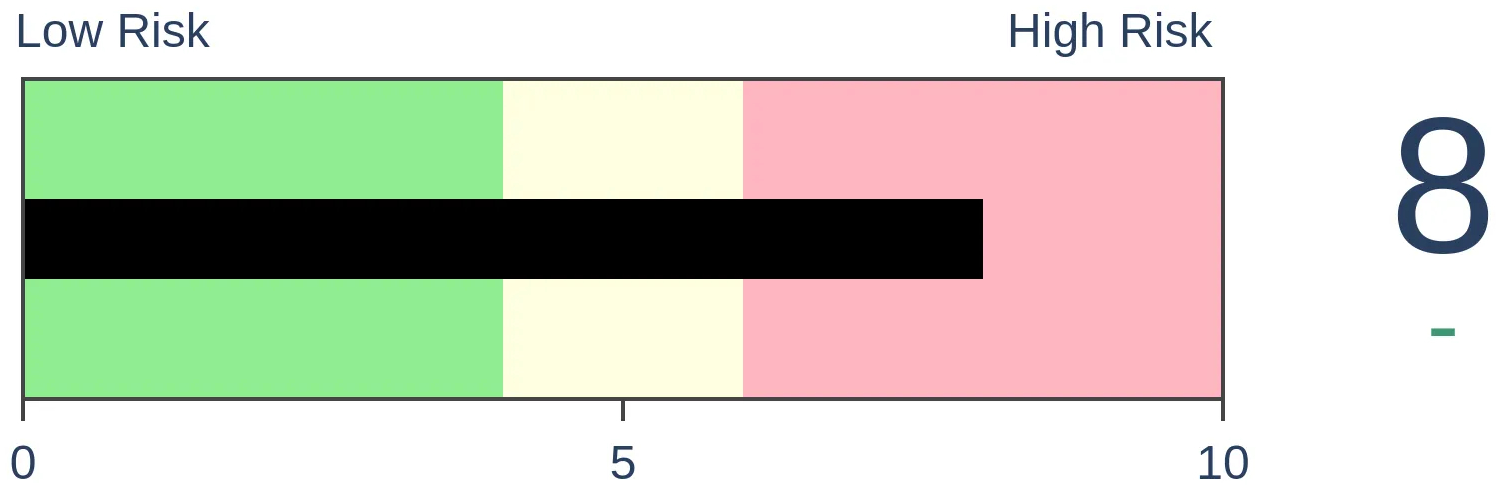
Stocks Short-Term
|
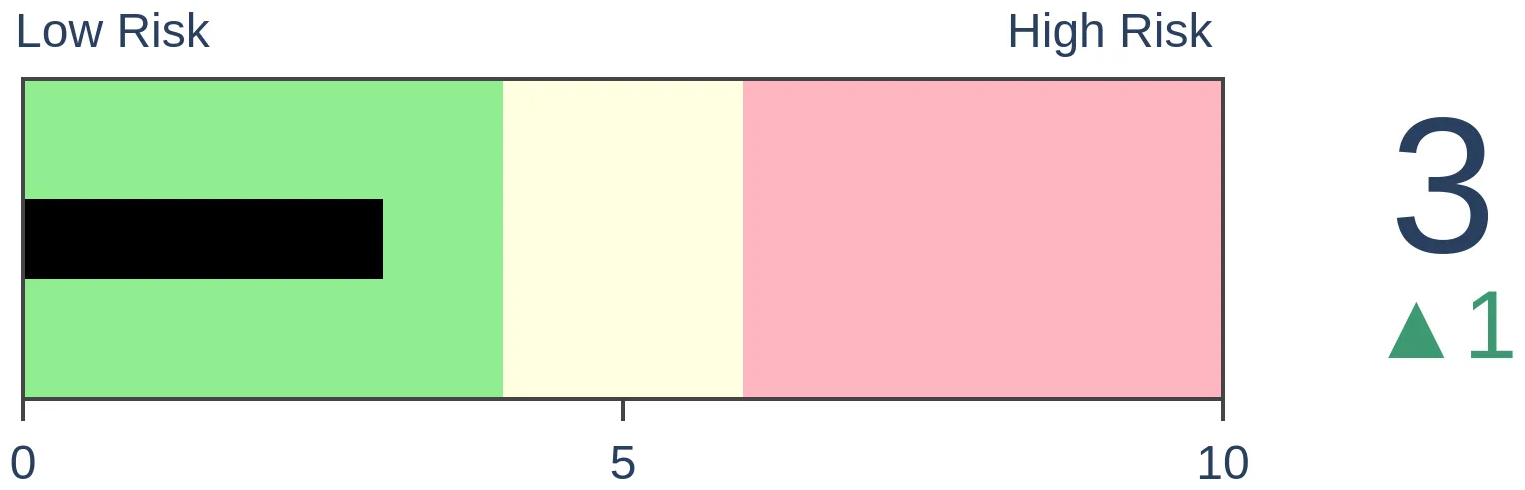
Stocks Medium-Term
|
|
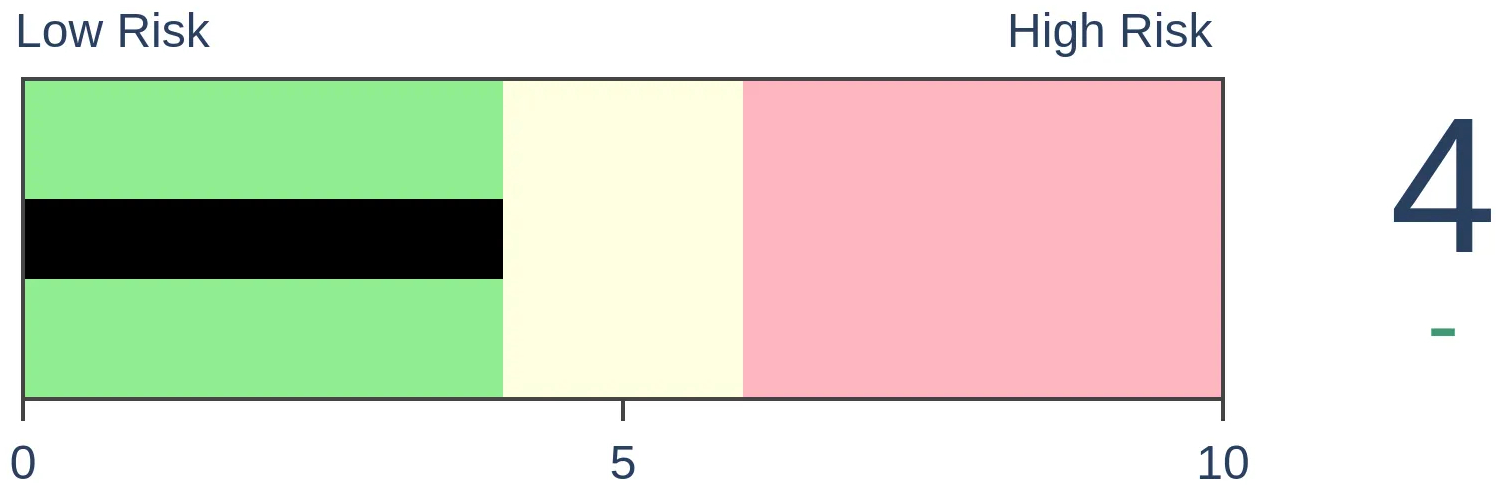
Bonds
|
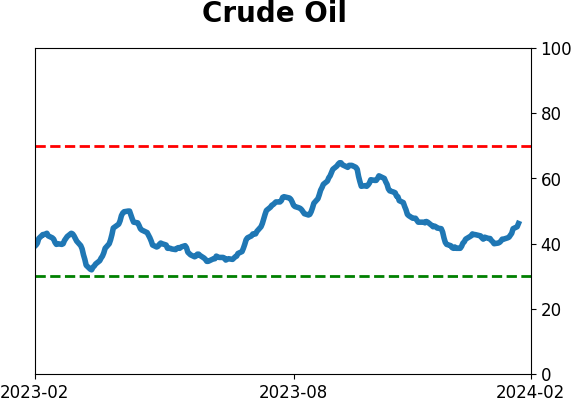
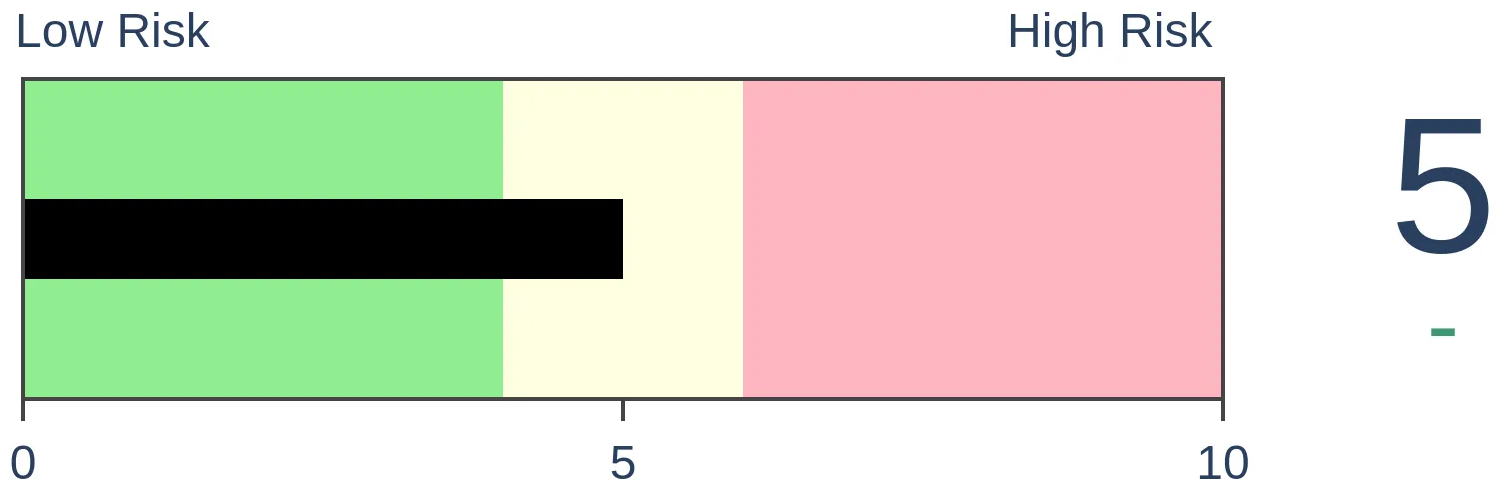
Crude Oil
|
|
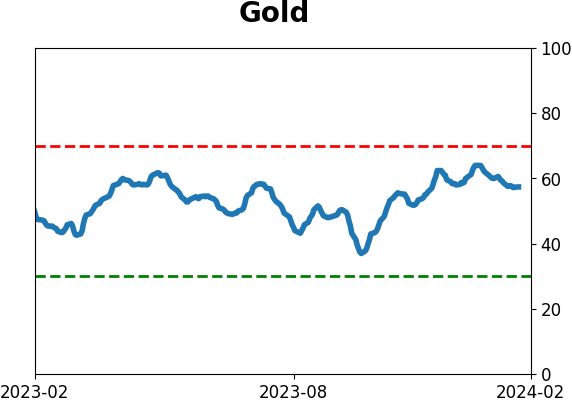
Gold

|
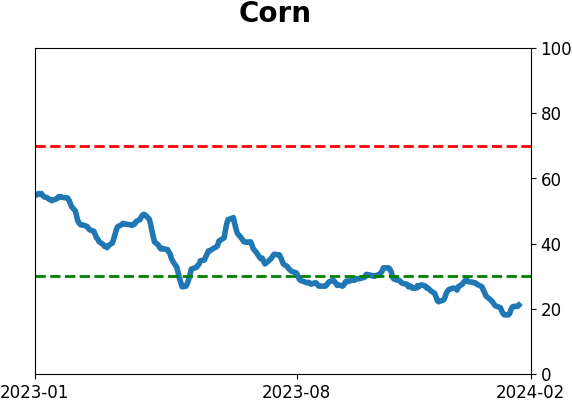
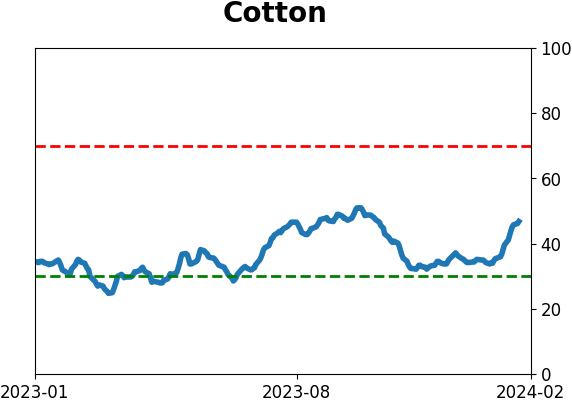
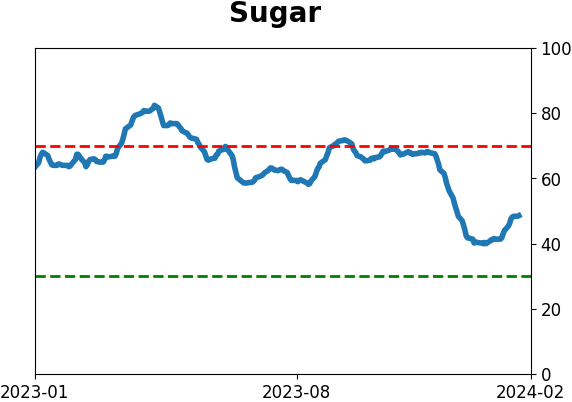
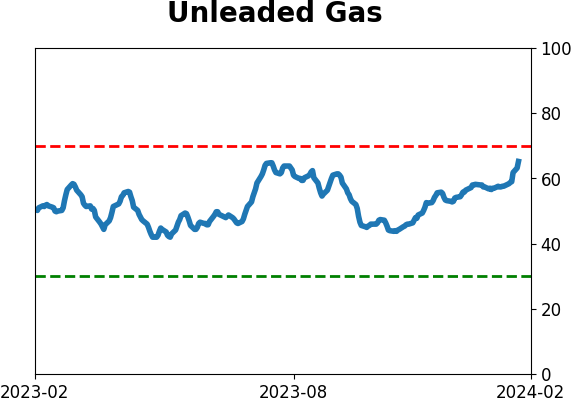
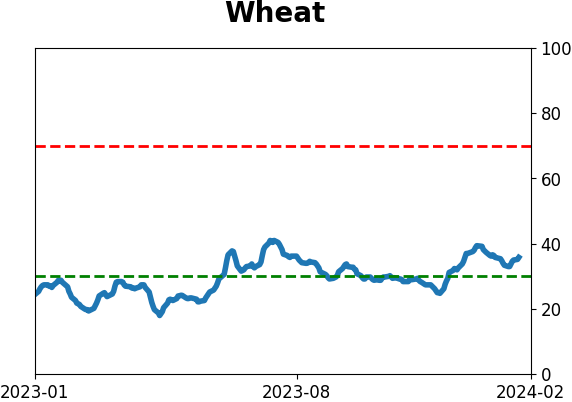
Agriculture
|
|
Research
By Jason Goepfert
BOTTOM LINE
As the S&P 500 recorded its recent record highs, only the information technology sector was along for the ride and setting its own records. On average, the other major sectors were down several percent from their highs. Similar records in the S&P, when it was accompanied only by technology, showed a consistent tendency for more gains.
FORECAST / TIMEFRAME
None
|
Key points:
- When the S&P 500 recently reached a record high, only information technology accompanied it
- On average, the other major sectors were more than -8% off their own highs
- Similar "narrow" drives to record highs didn't have any negative impact on future returns
When the S&P 500 pushed to a record high, technology was the only passenger
The most benchmarked index in the world has reached numerous record closes over the past week, and similar behavior in the past showed a strong tendency to keep going. This time, there are some oddities that we've touched on a few times. It's nothing too worrying, but it's still worth watching in the weeks ahead.
The main reason for the weirdness is that much of the gain in the S&P 500 since December, in particular, has come from a handful of stocks. As a result, the information technology sector is the only one that recorded a record high along with the S&P. As noted by The Wall Street Journal:
The S&P 500 is back at record levels for the first time in two years. Information technology is the only one of the index's 11 sectors that can say the same...A narrow rally is a potentially worrying sign to some investors and strategists. When just a handful of big stocks are responsible for most of the market's gains, it becomes more vulnerable to a downturn if a few of those heavyweights stumble, they say.
The Journal is correct regarding info tech being the only (well, the first) major sector to join the S&P 500 at a record high. Several of the others were close but not quite there.
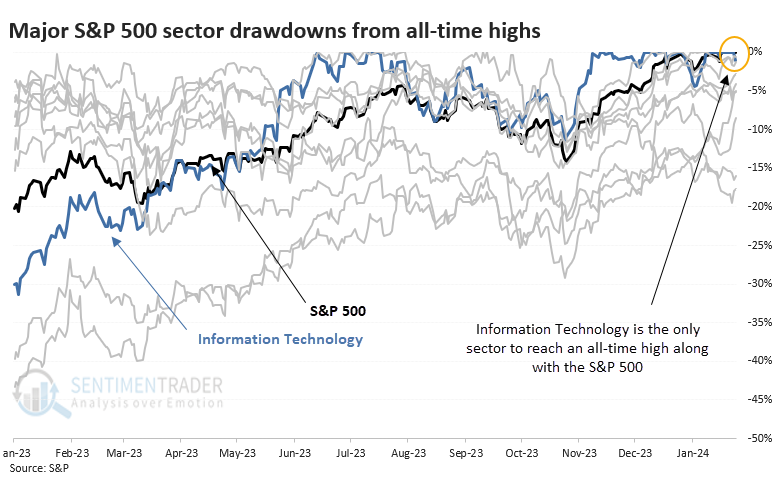
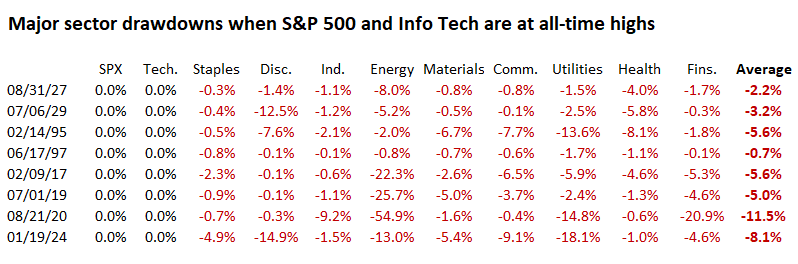
The other sectors that aren't yet at record highs are off an average of -8.1% from their highs. That's the second-largest divergence dating back to 1927.
Whether it matters or not is really the only thing we're concerned about. Unfortunately, there aren't many precedents to draw from, even with nearly 100 years of history.
Info tech driving gains has not been a warning sign
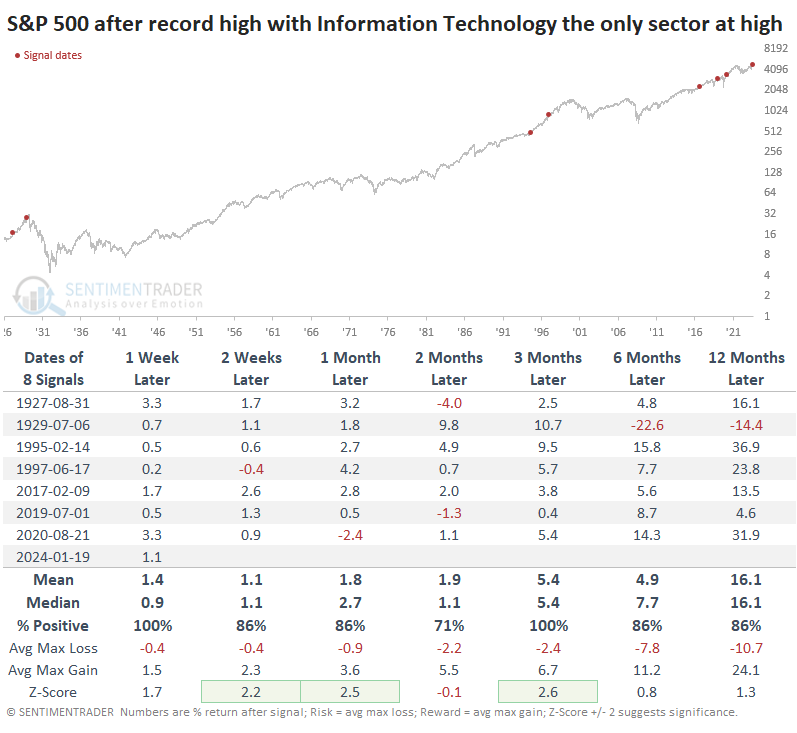
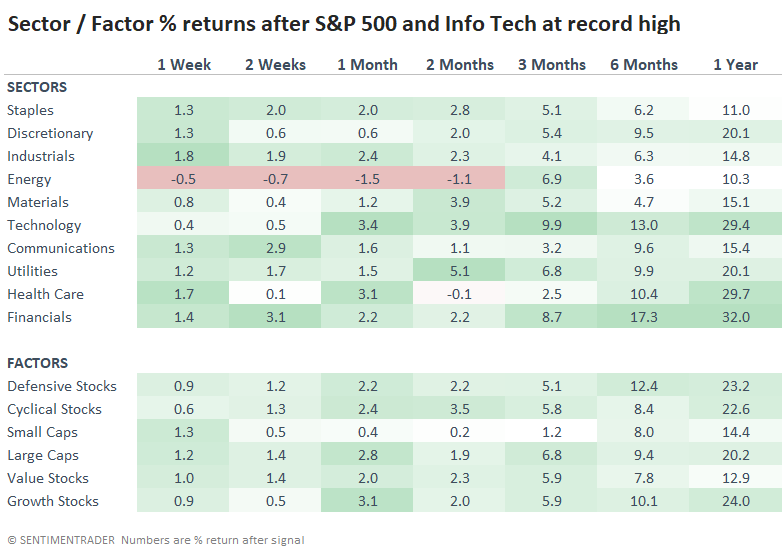
The table below shows every instance and the S&P 500's forward returns. The lack of participation at new highs from other sectors had no negative impact. Well, there was that pesky signal from 1929, but even then, the S&P gained double-digits before rolling over.
For the information technology sector, returns were generally very good. It did show an extra negative return across most time frames, but it was small.
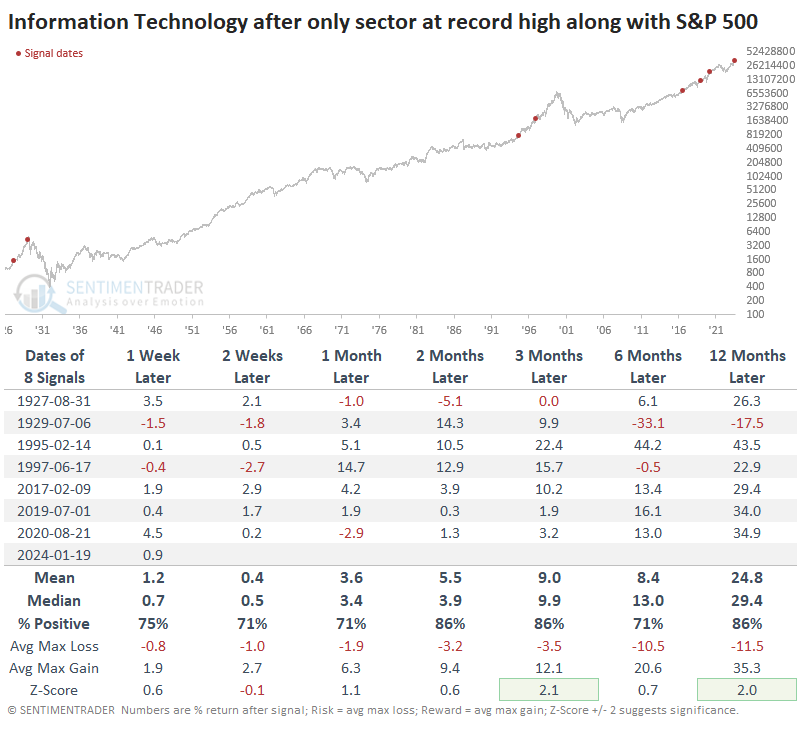
Across sectors and factors, technology showed among the strongest returns, with financials also doing well.
What the research tells us...
When a handful of large stocks do spectacularly well and drive indexes higher, investors always become concerned about a narrow tape. A lack of participation is a consistent warning sign ahead of major peaks, but we're not seeing too many signs of that just yet. Yes, some gigantic stocks are rolling along and carrying cap-weighted indexes higher, but most other stocks are doing pretty good, too.
There are a few nascent signs of odd underlying behavior, but it's not nearly to the degree that we often see ahead of significant peaks. We'd also include this study - even though info tech was the only sector joining the S&P 500 at a record high, it didn't mean anything nefarious in any of the previous instances, at least for the next several months.
Indicators at Extremes
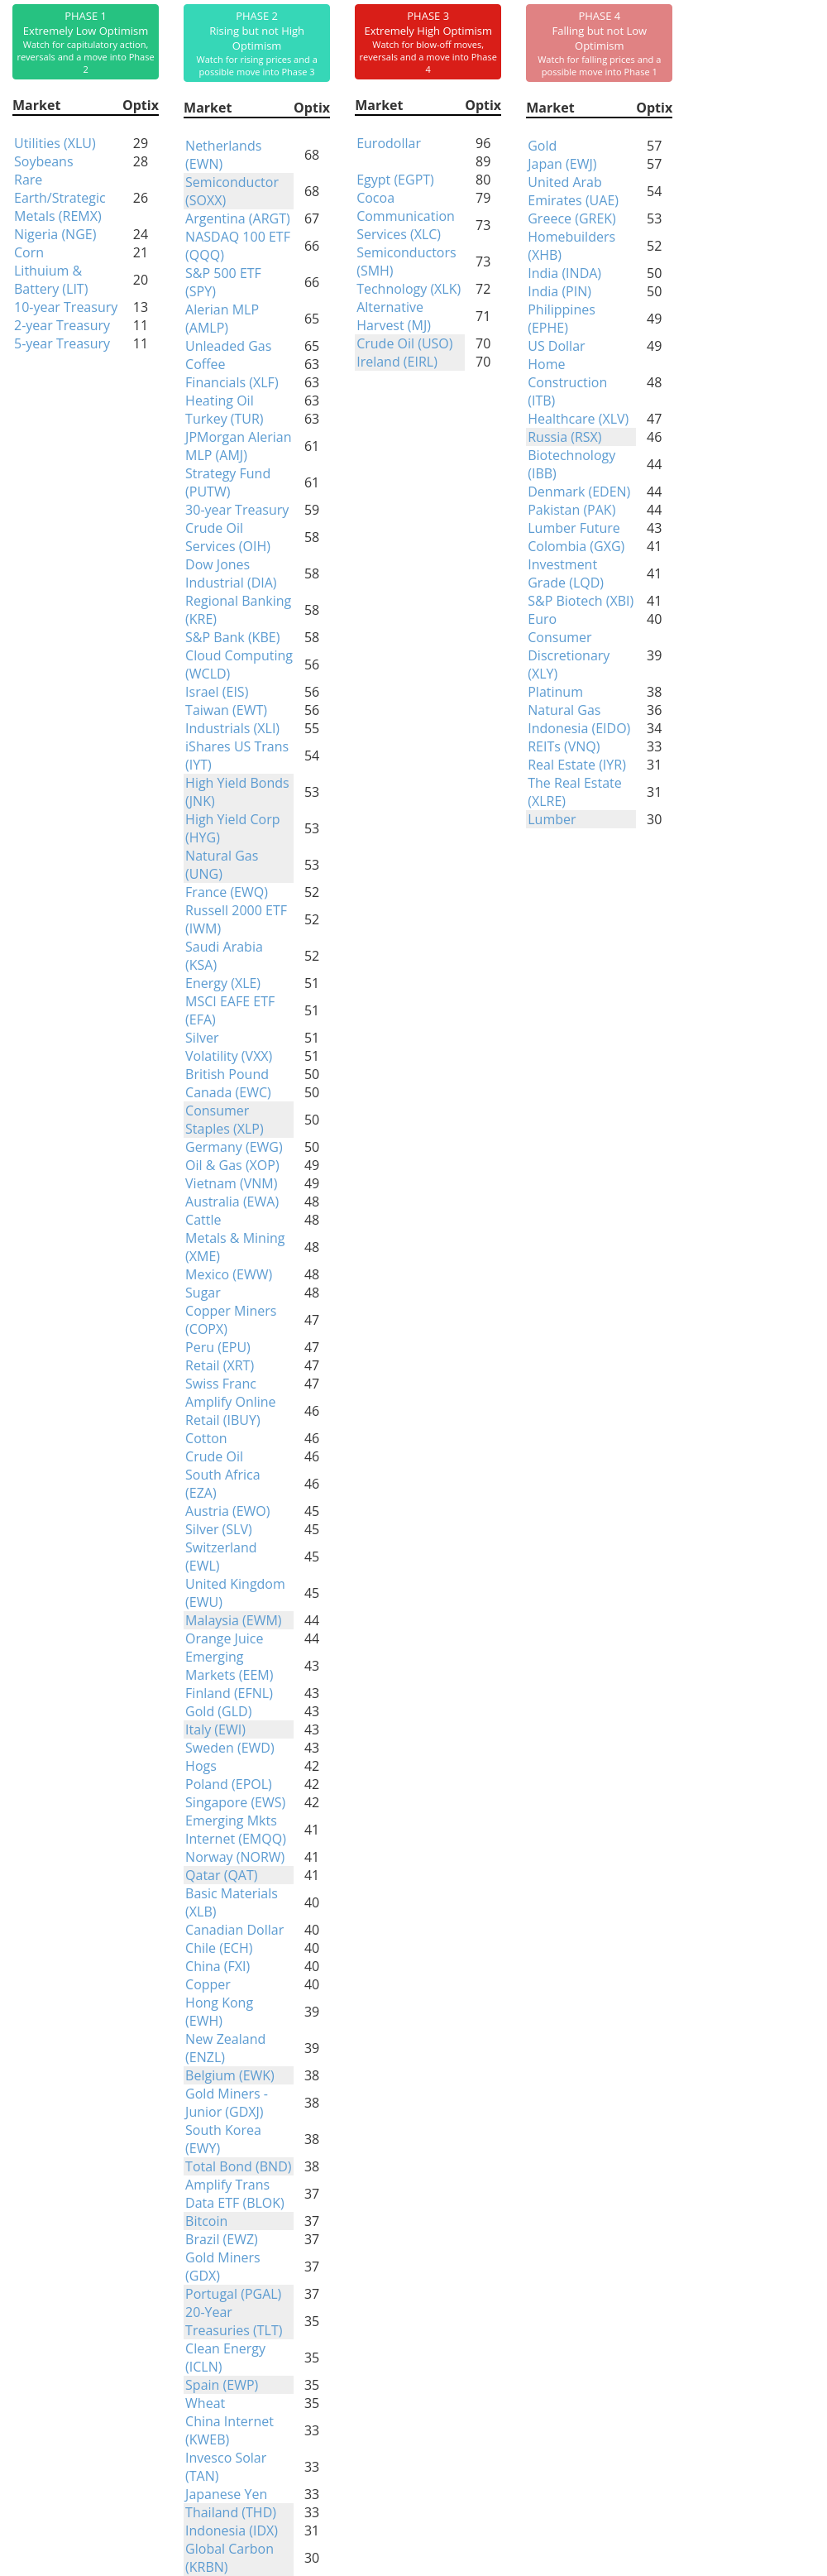
Phase Table
Ranks
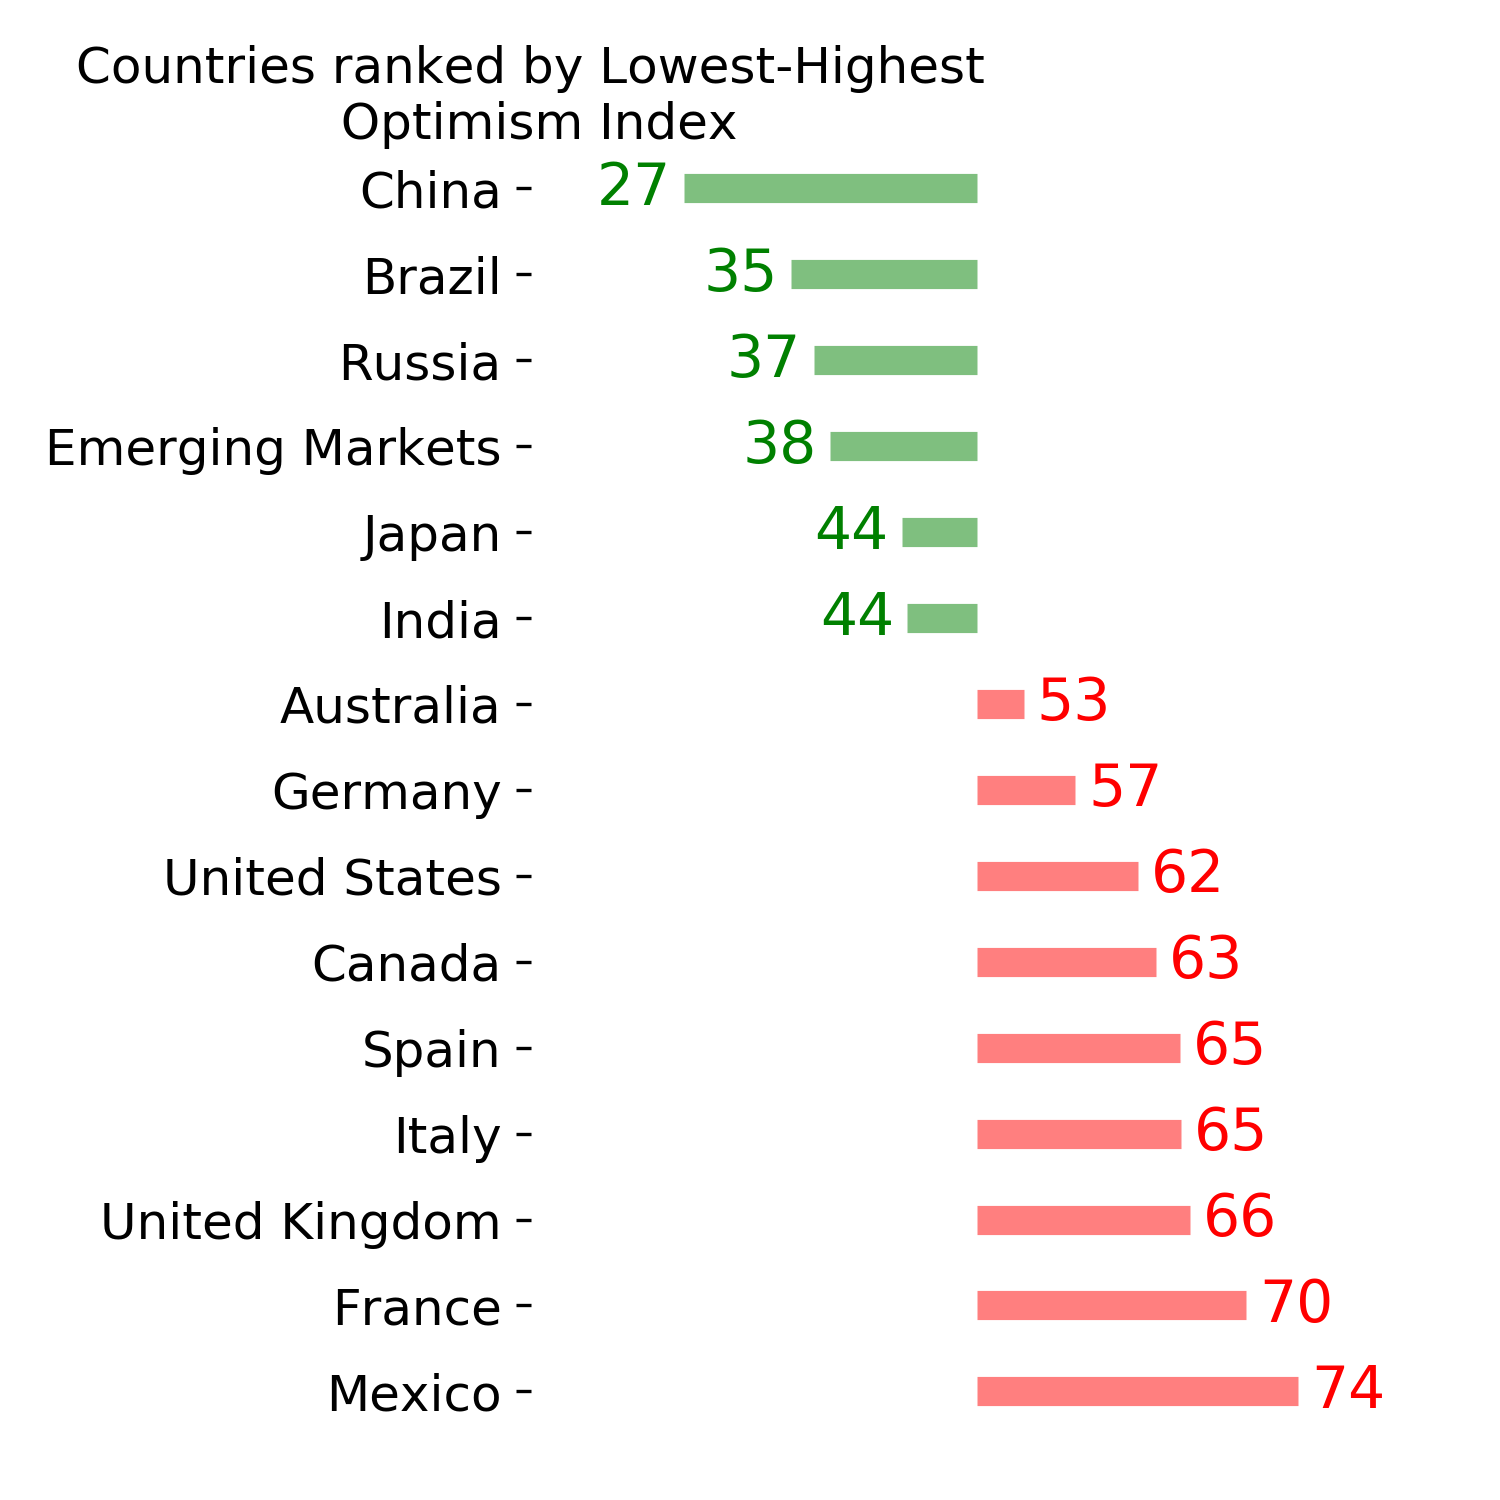
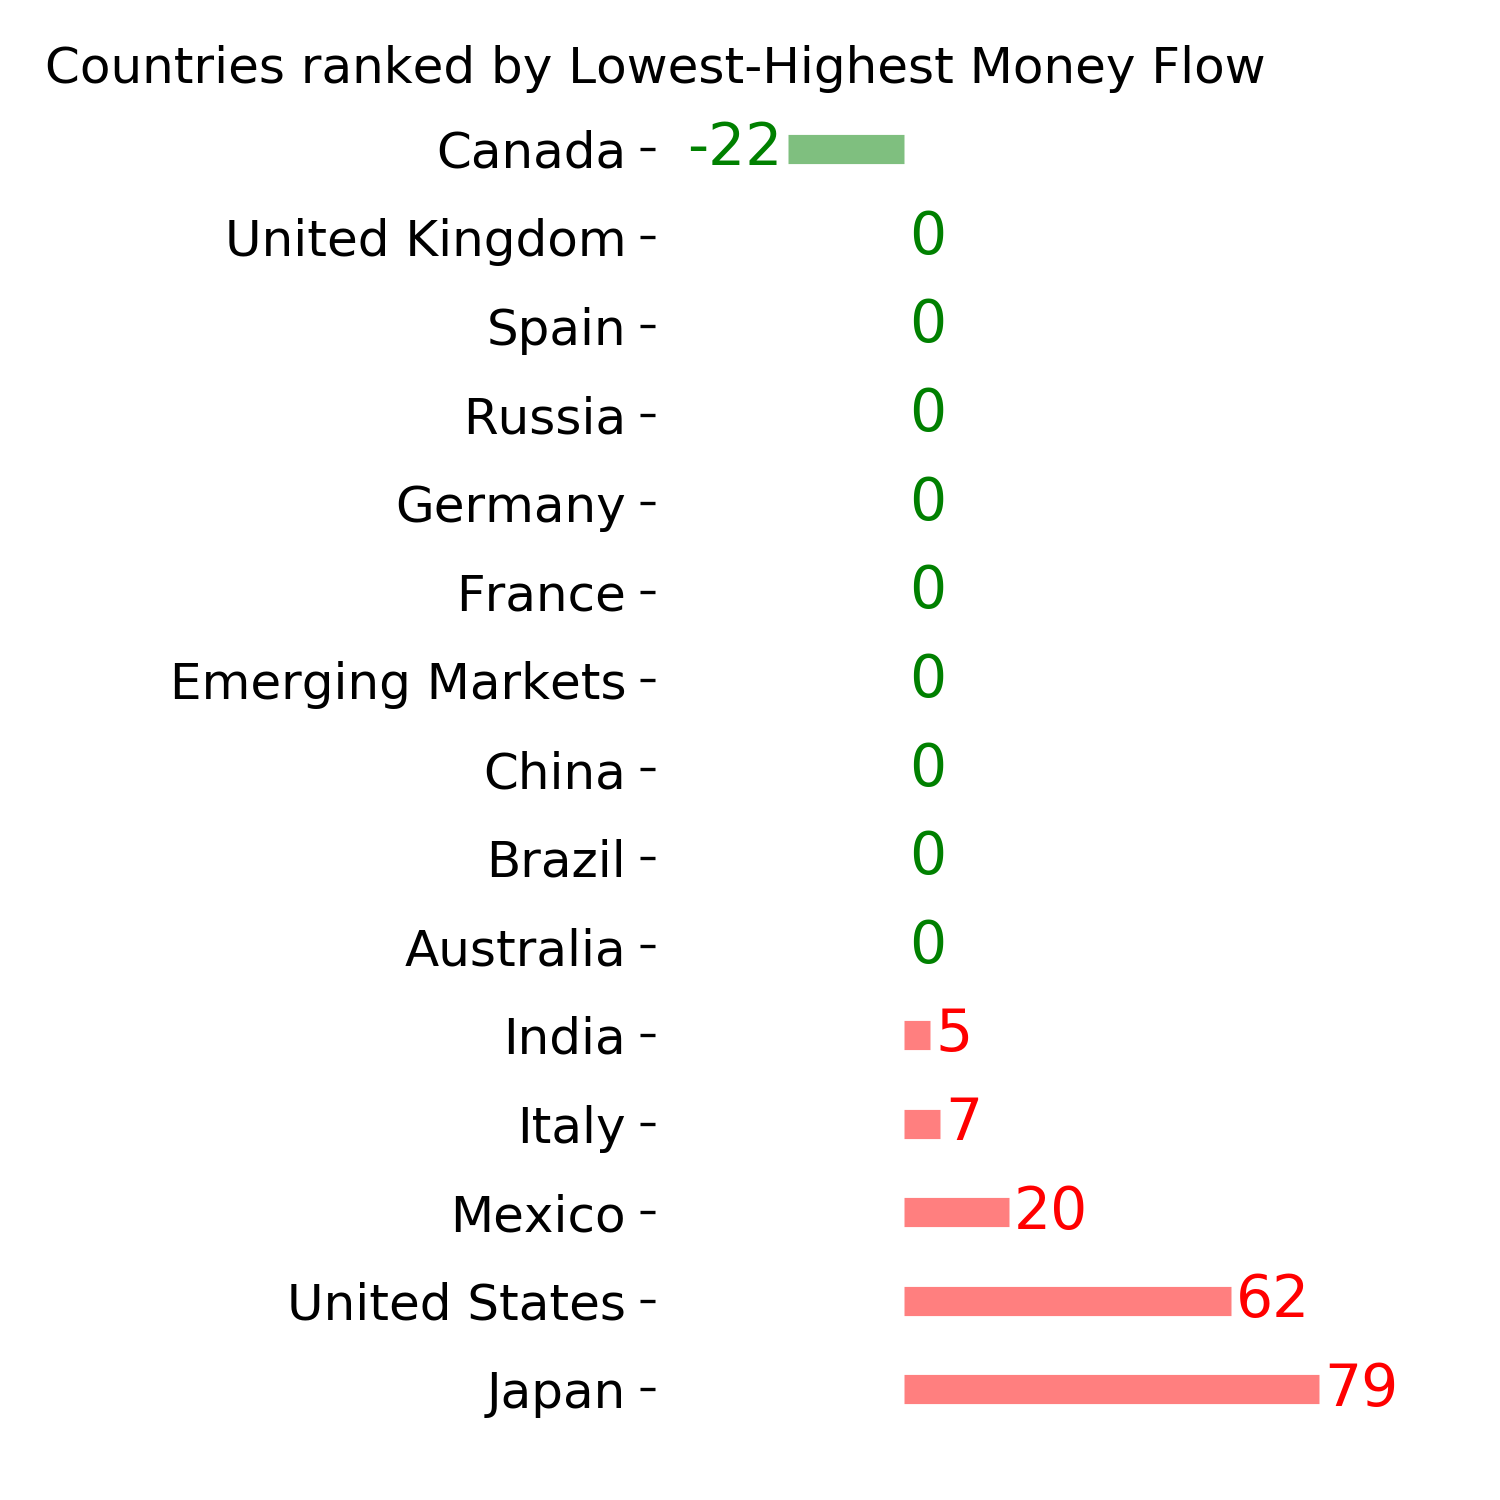
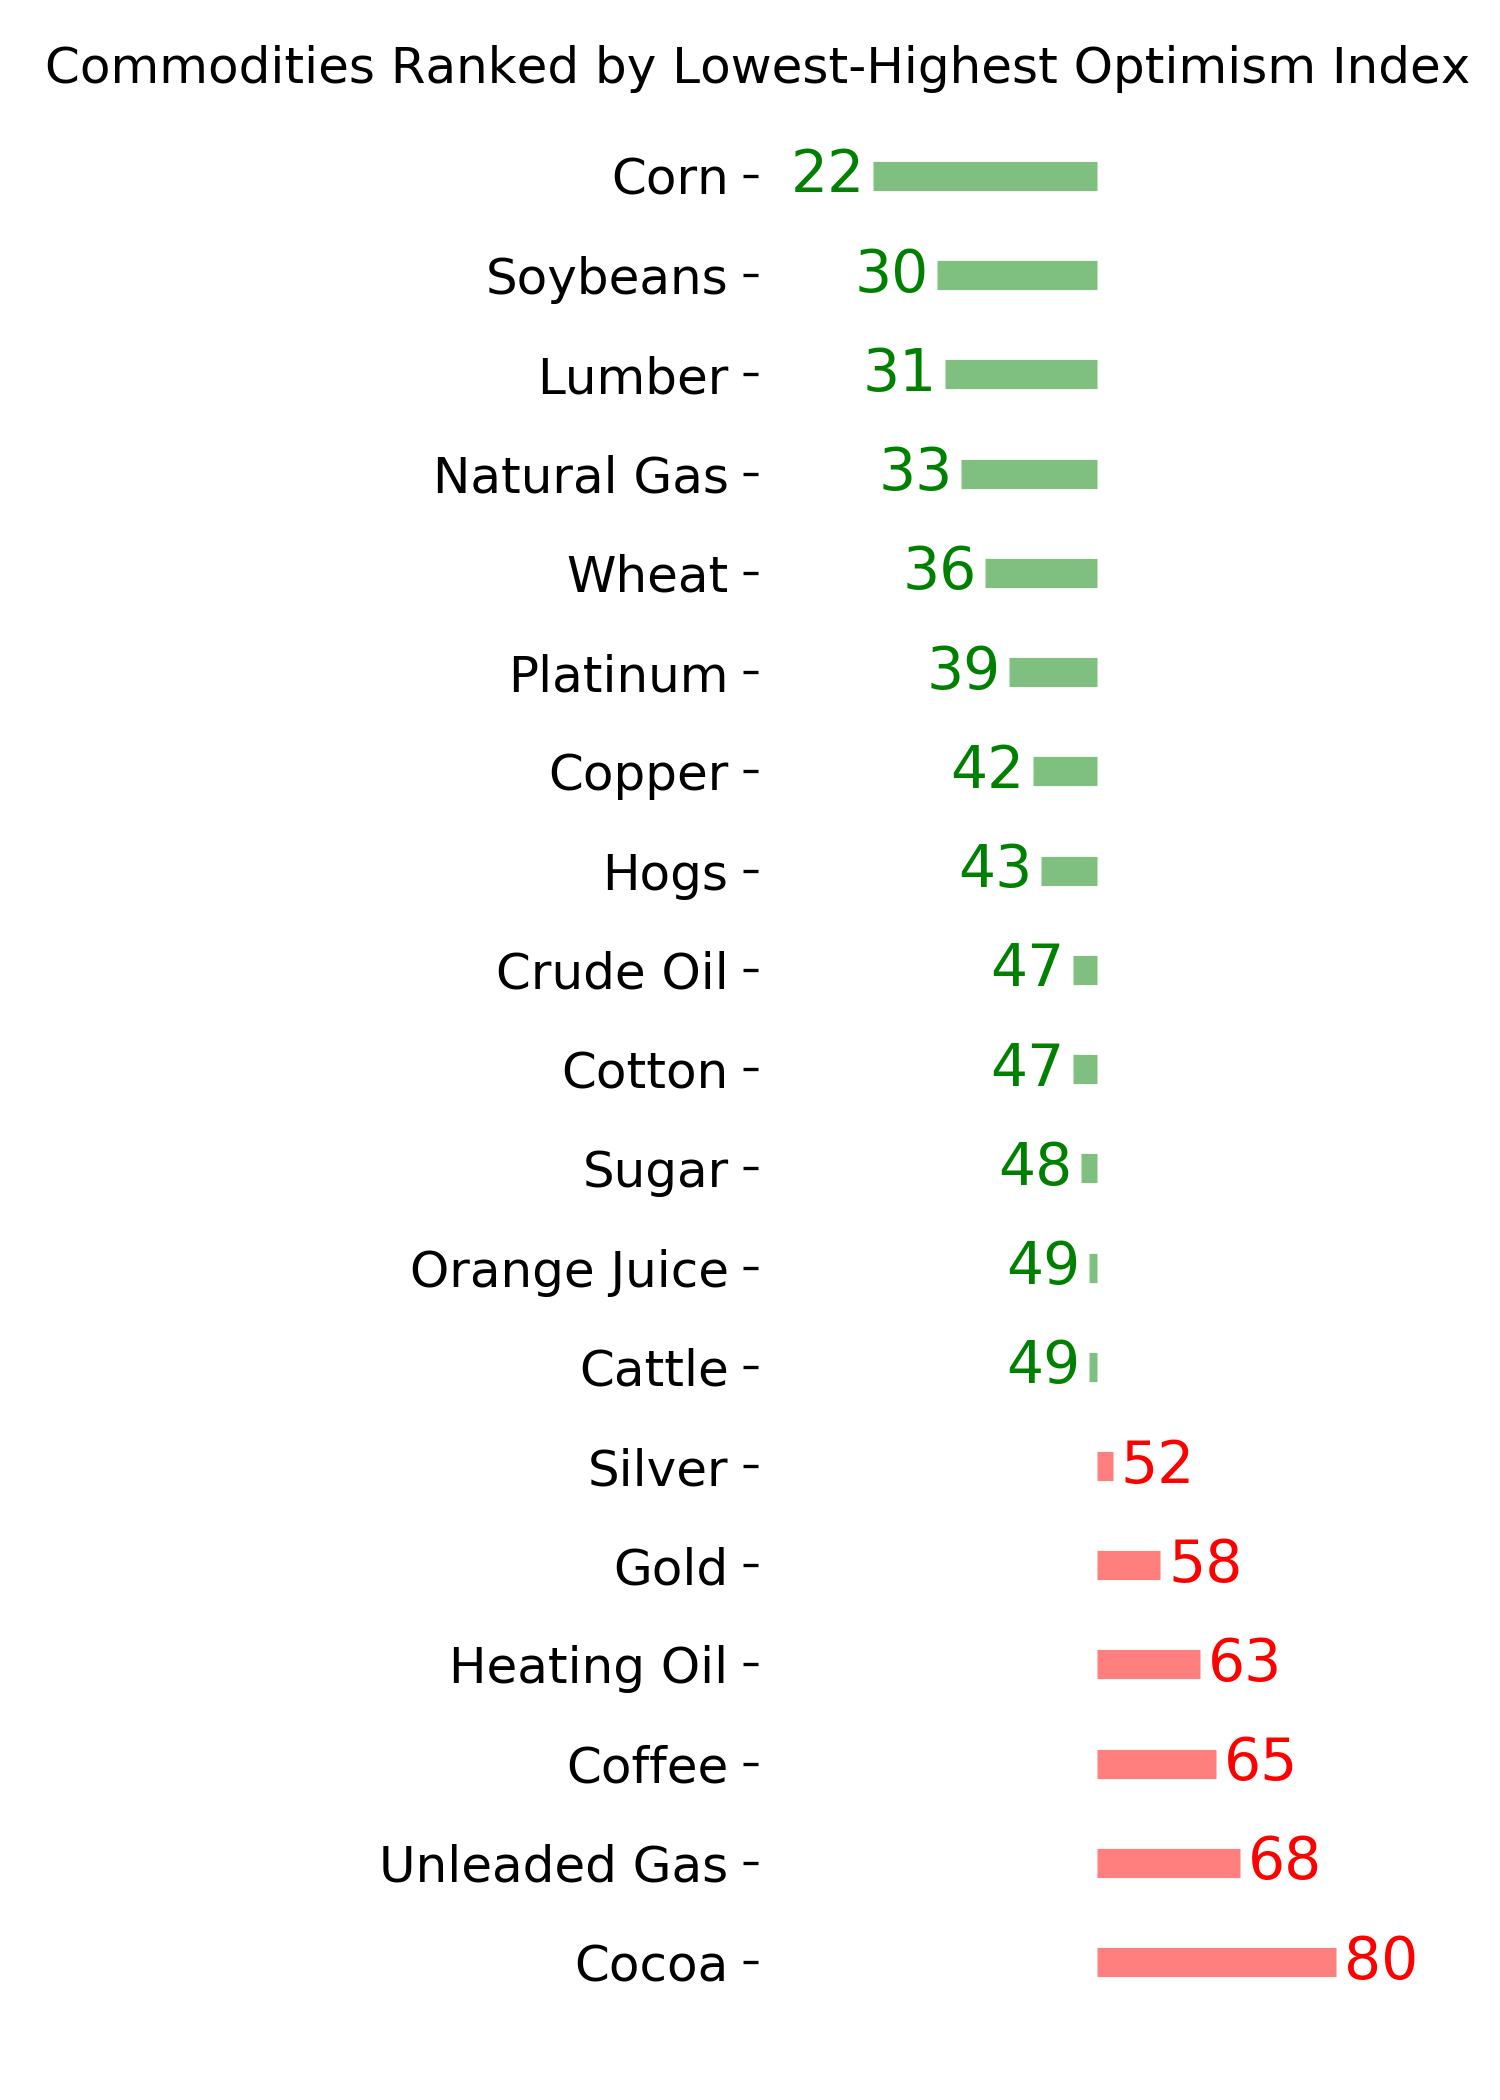
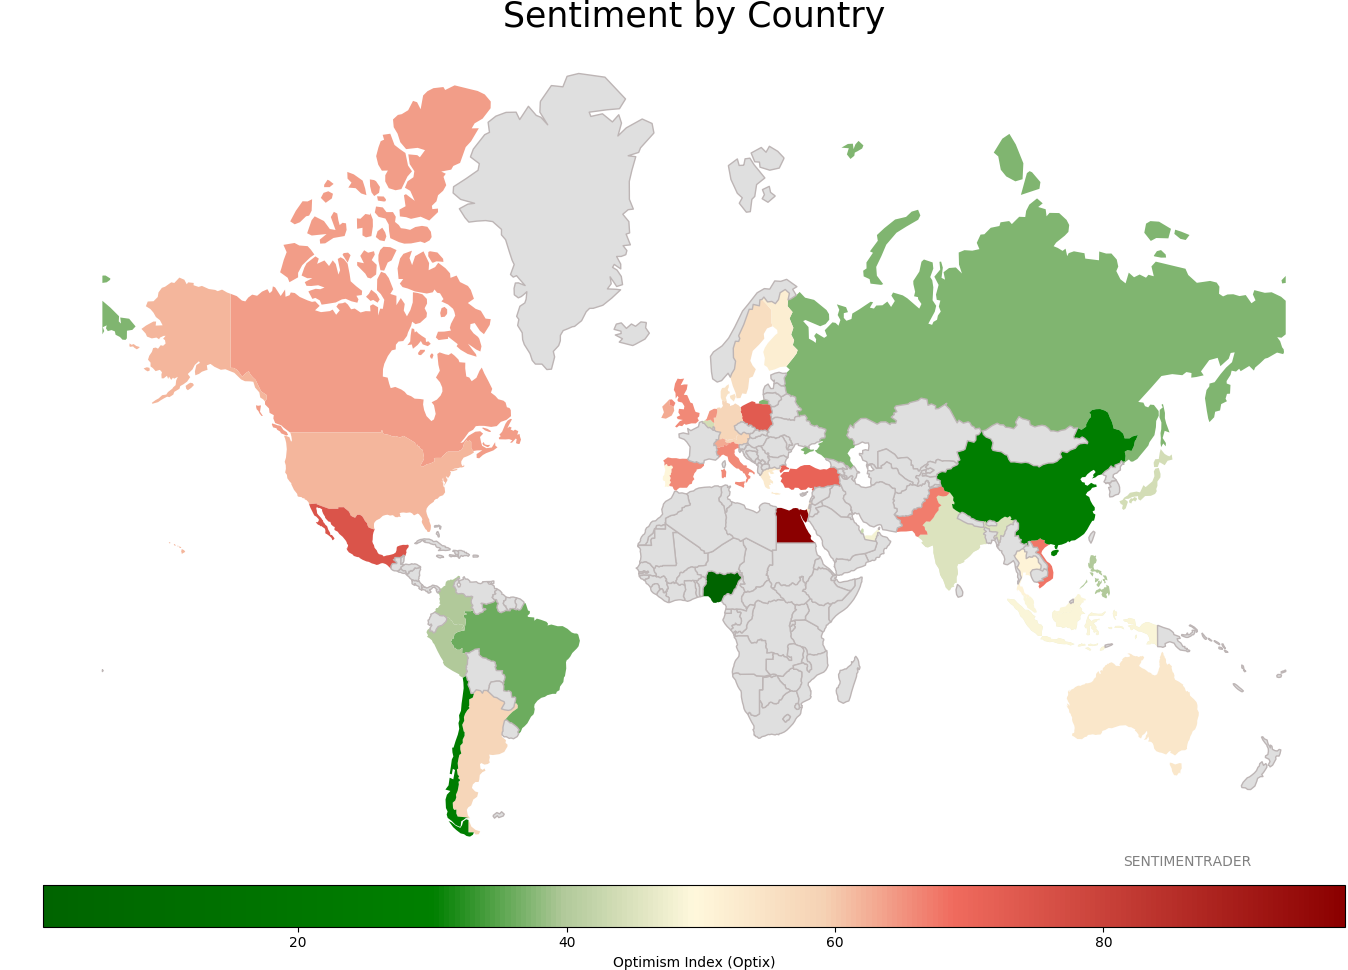
Sentiment Around The World
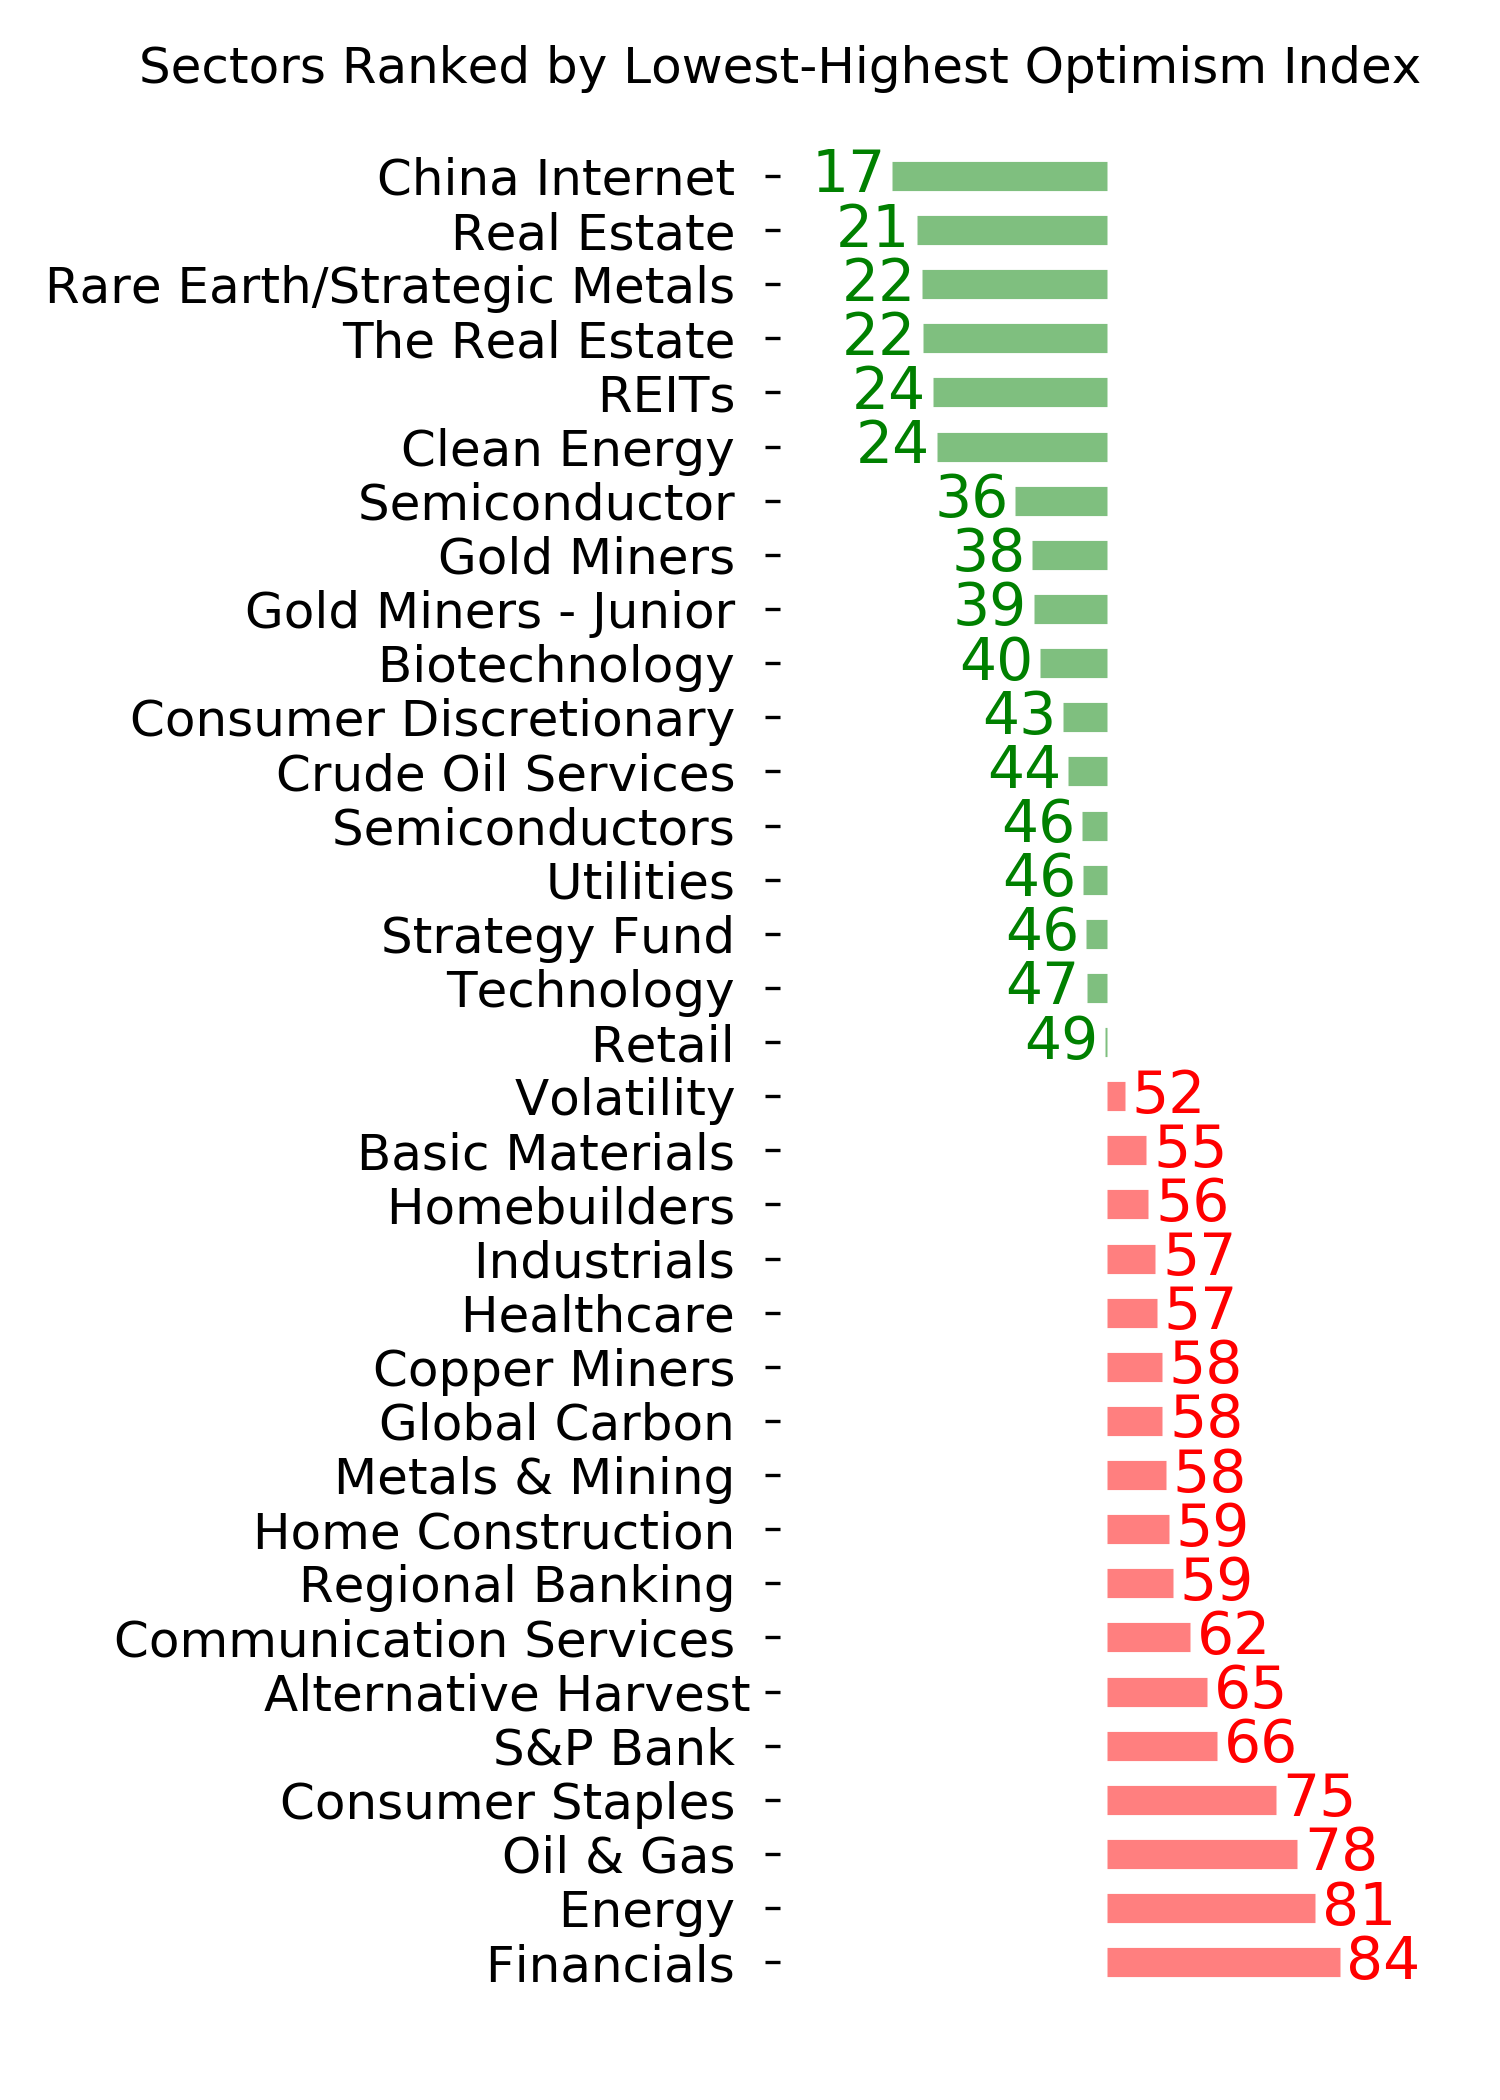
Optimism Index Thumbnails
|
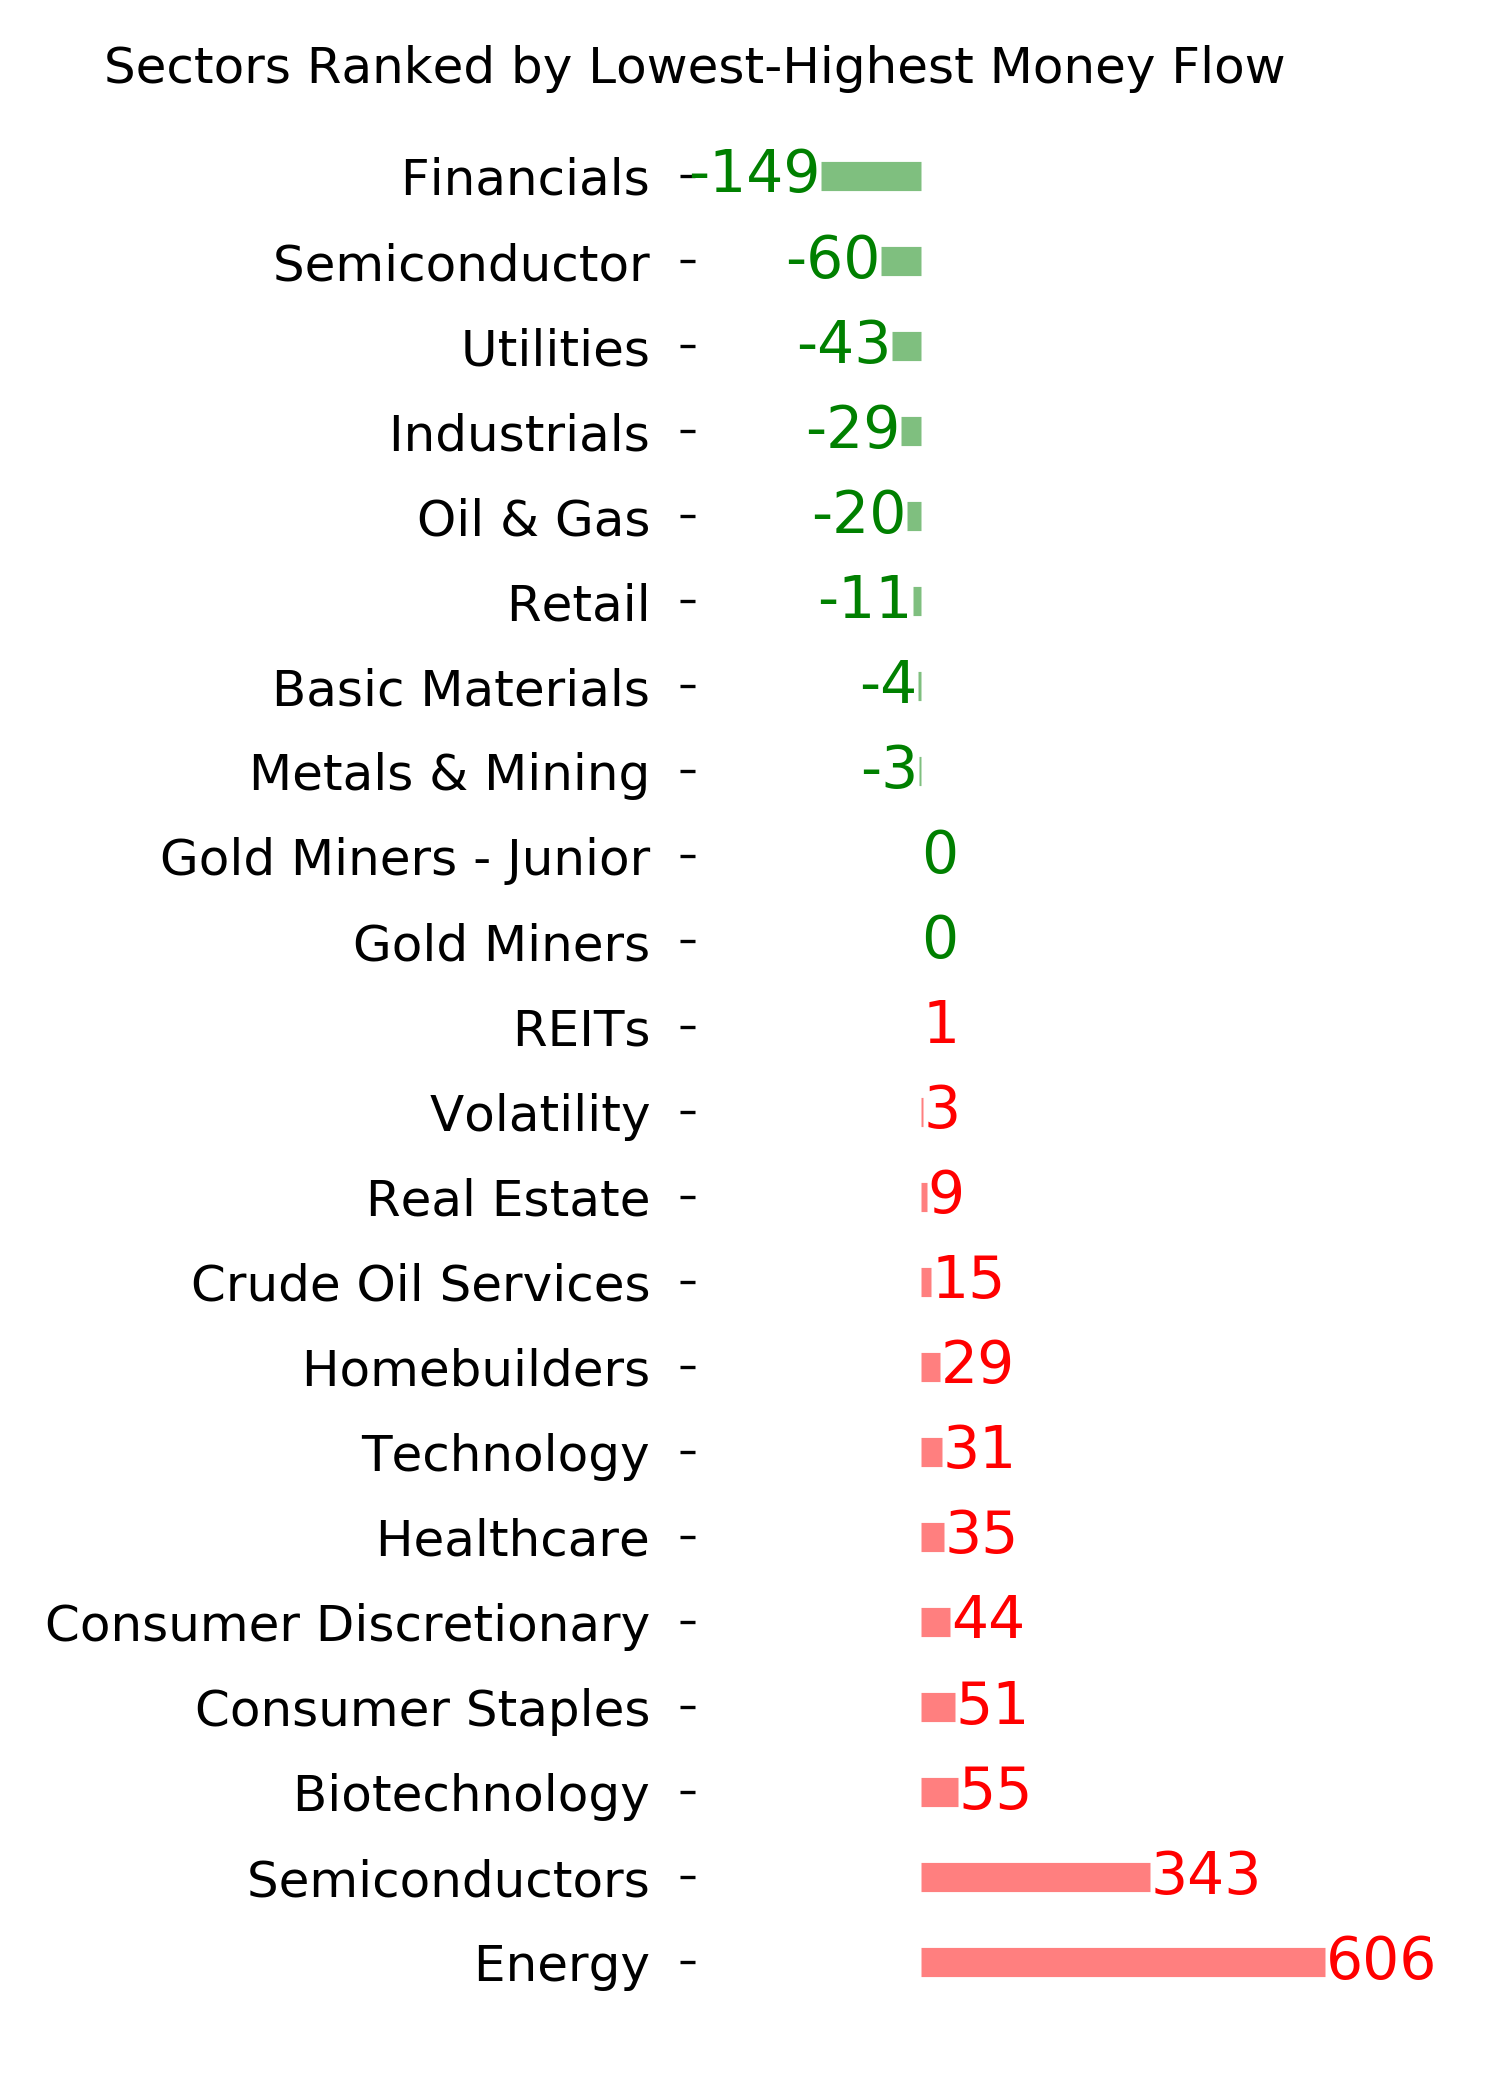
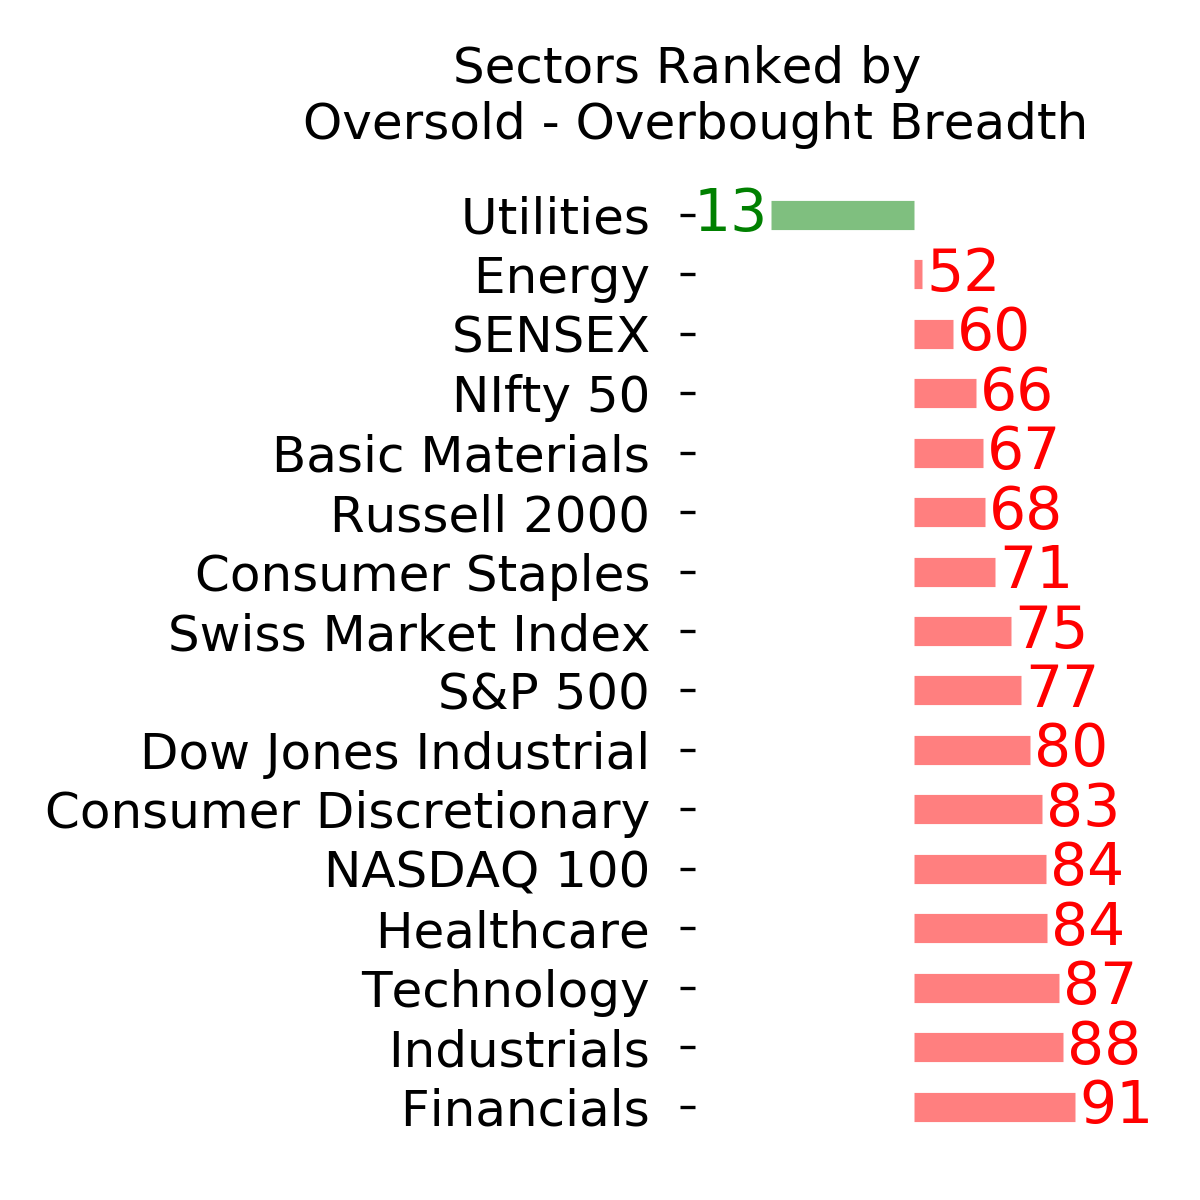
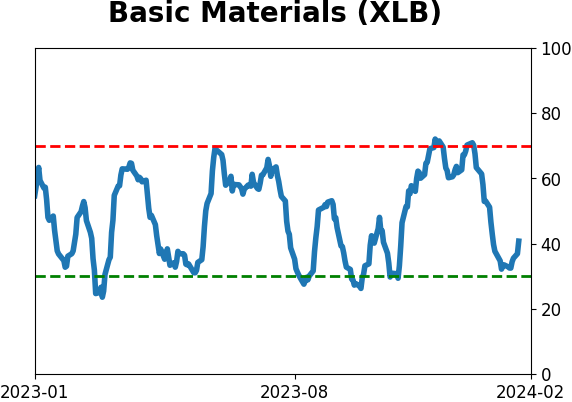
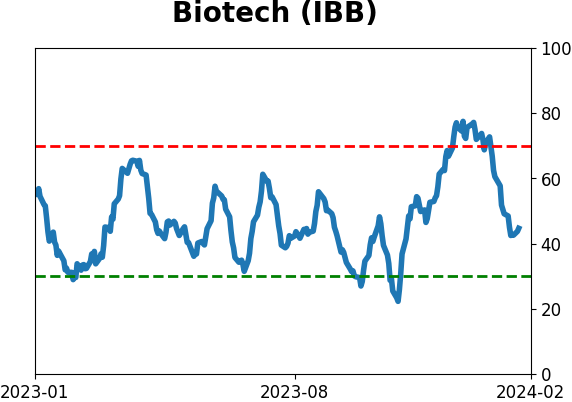
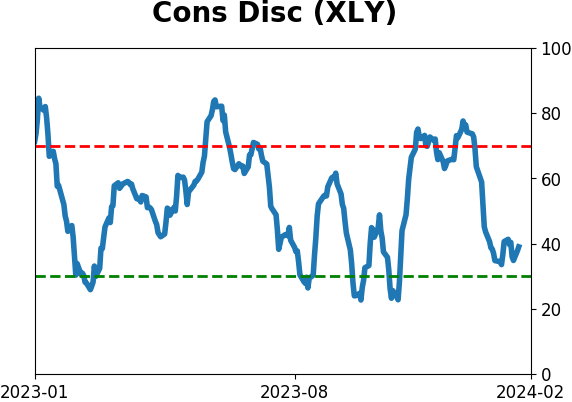
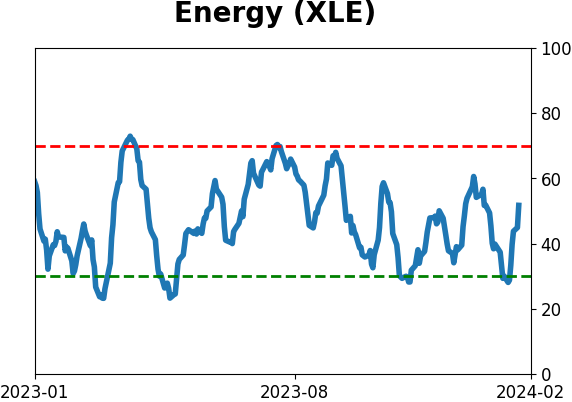
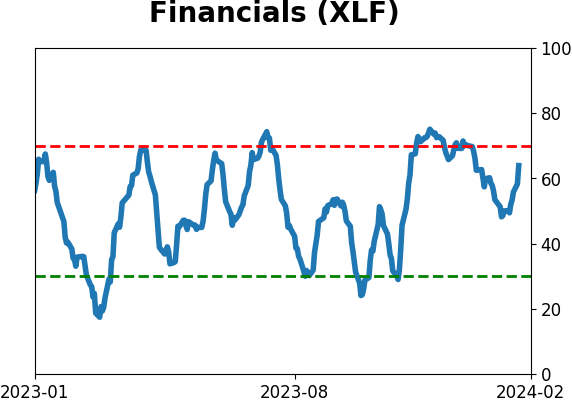
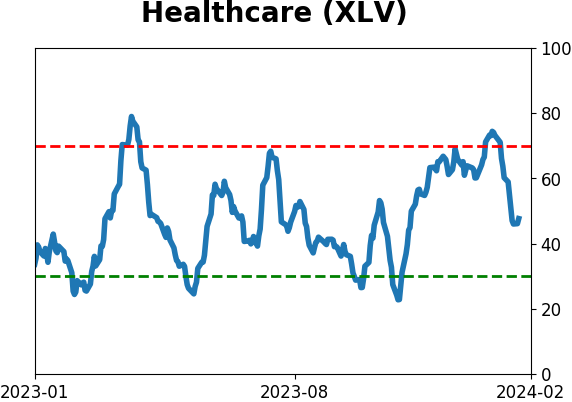
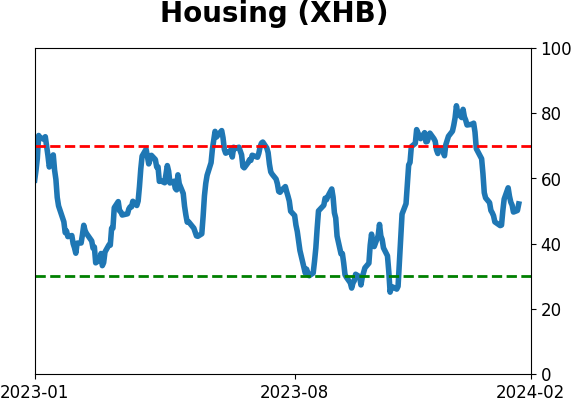
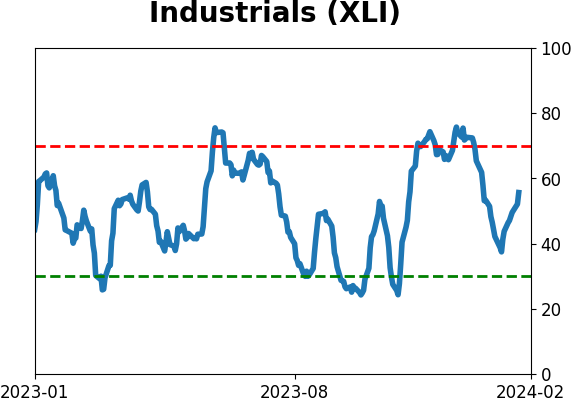
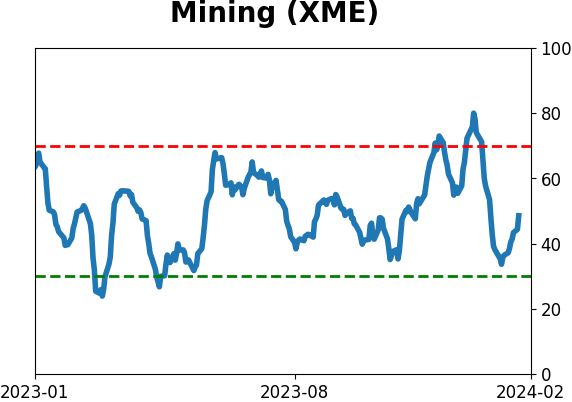
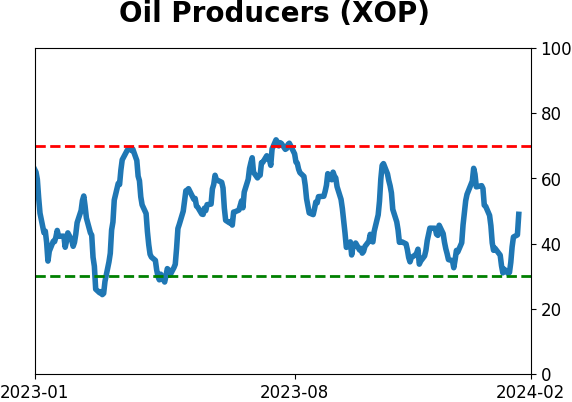
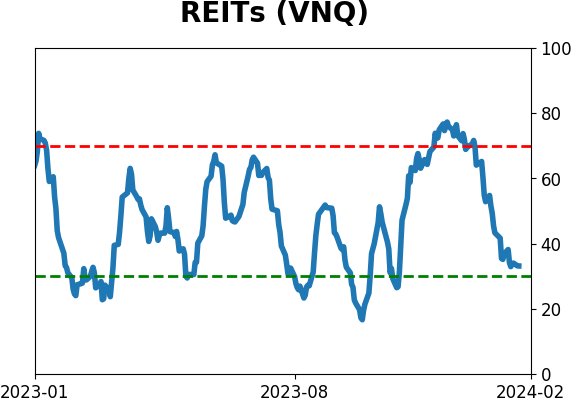
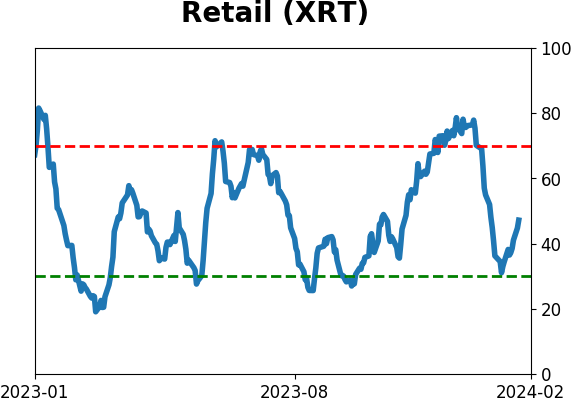
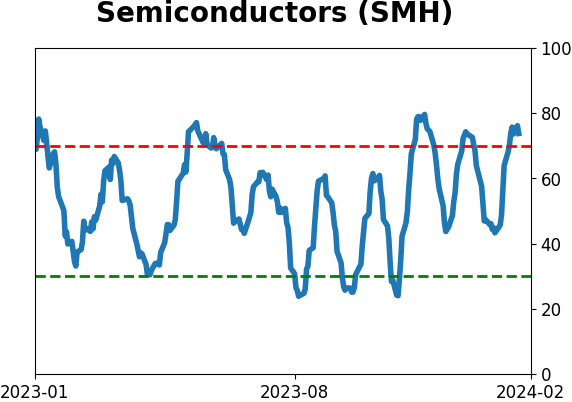
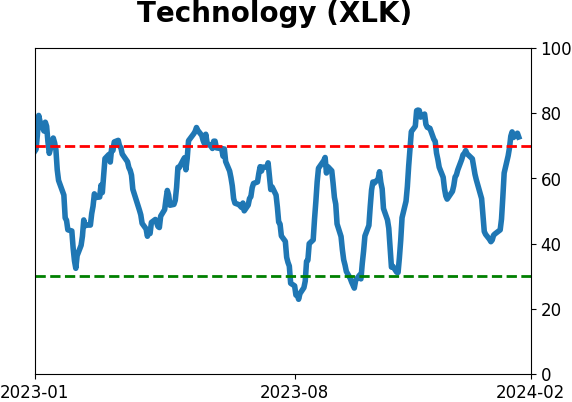
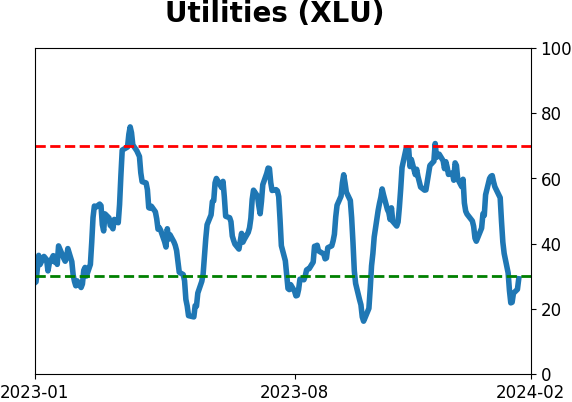
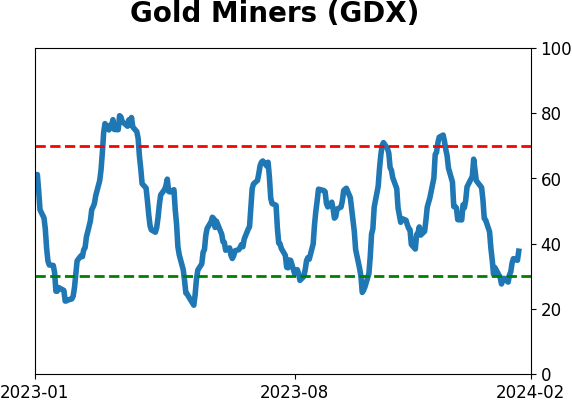
Sector ETF's - 10-Day Moving Average
|
|
|
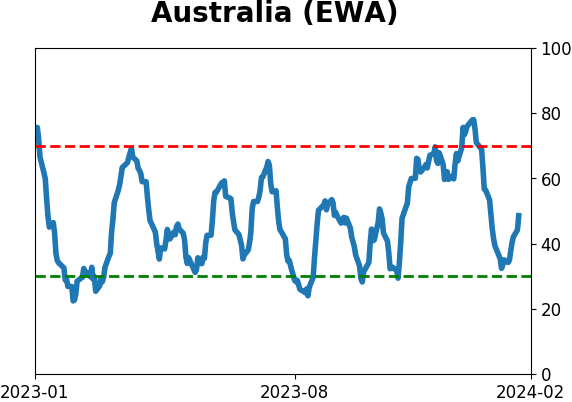
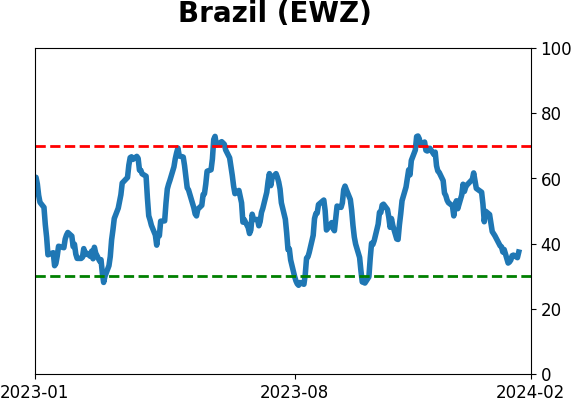
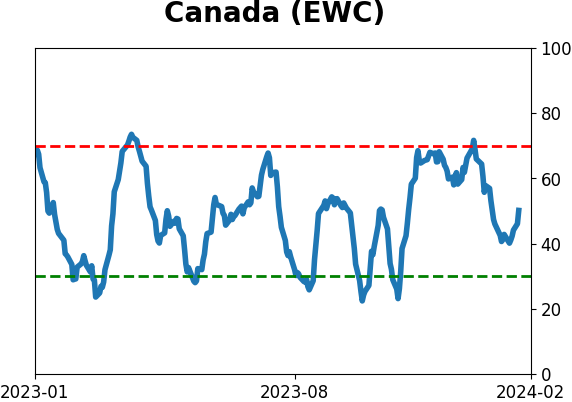
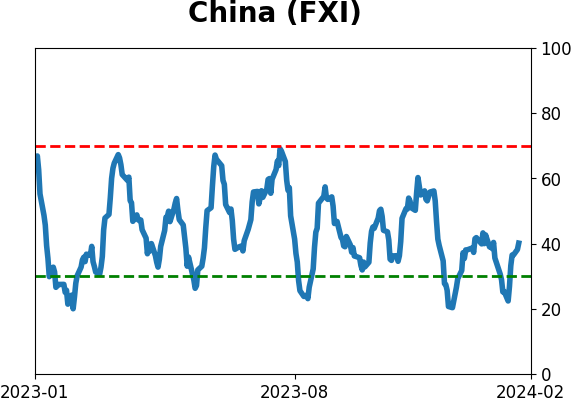
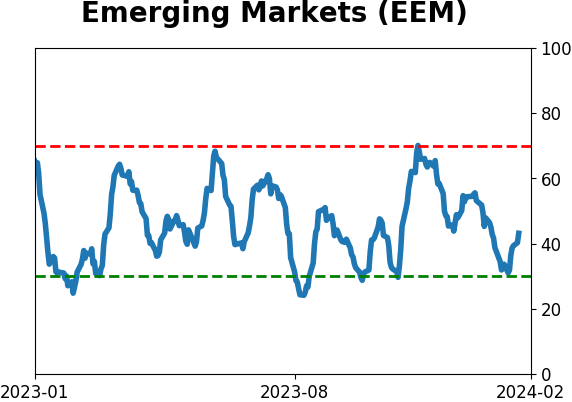
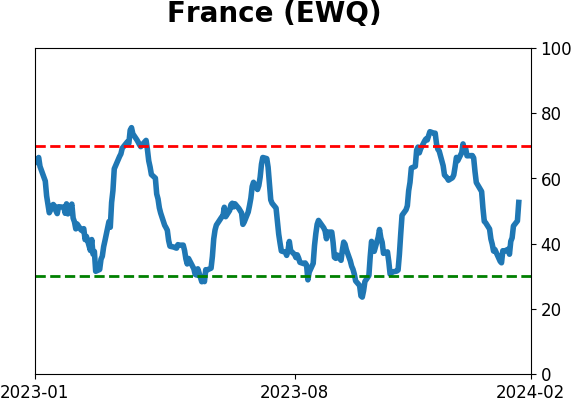
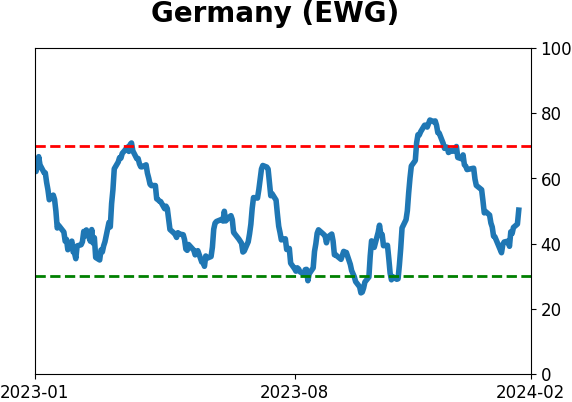
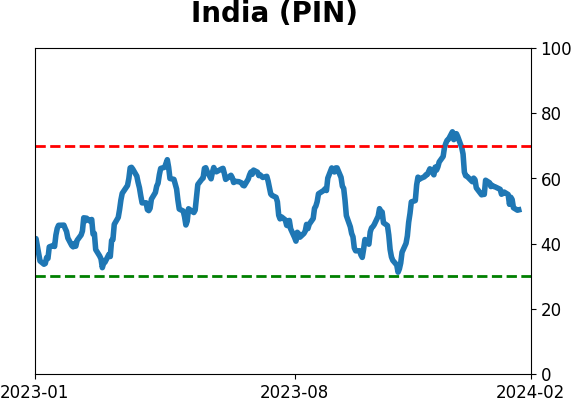
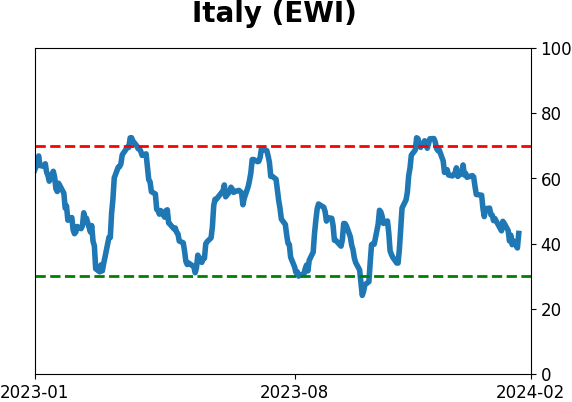
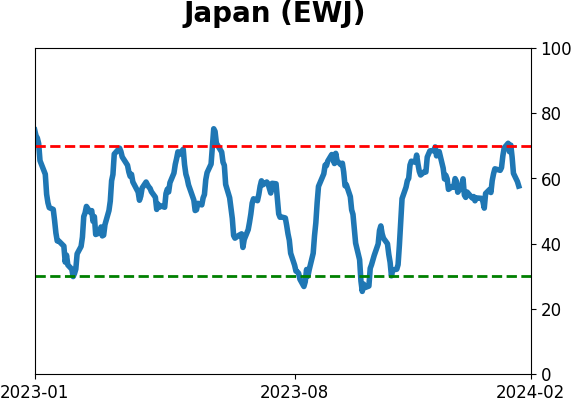
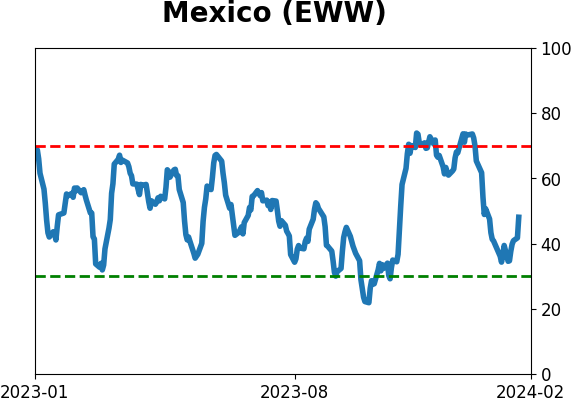
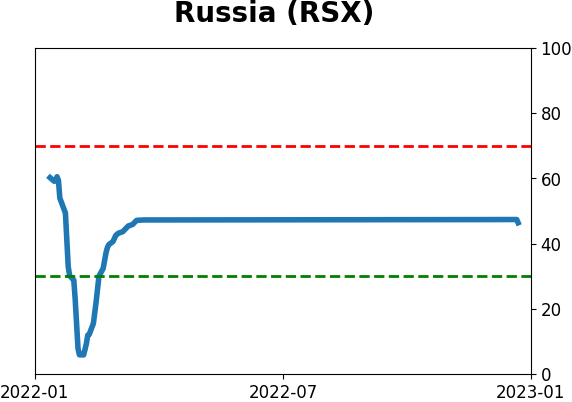
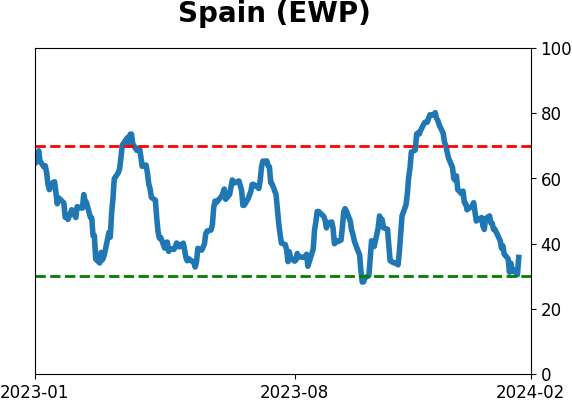
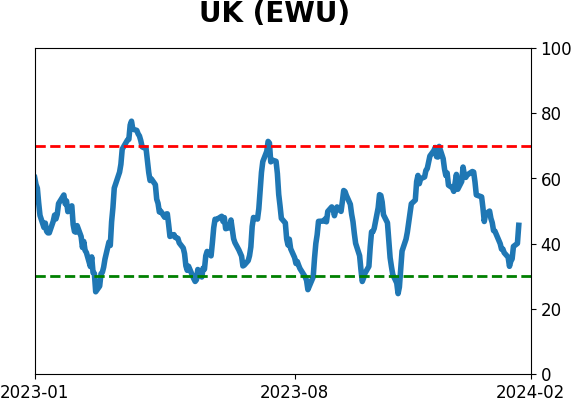
Country ETF's - 10-Day Moving Average
|
|
|
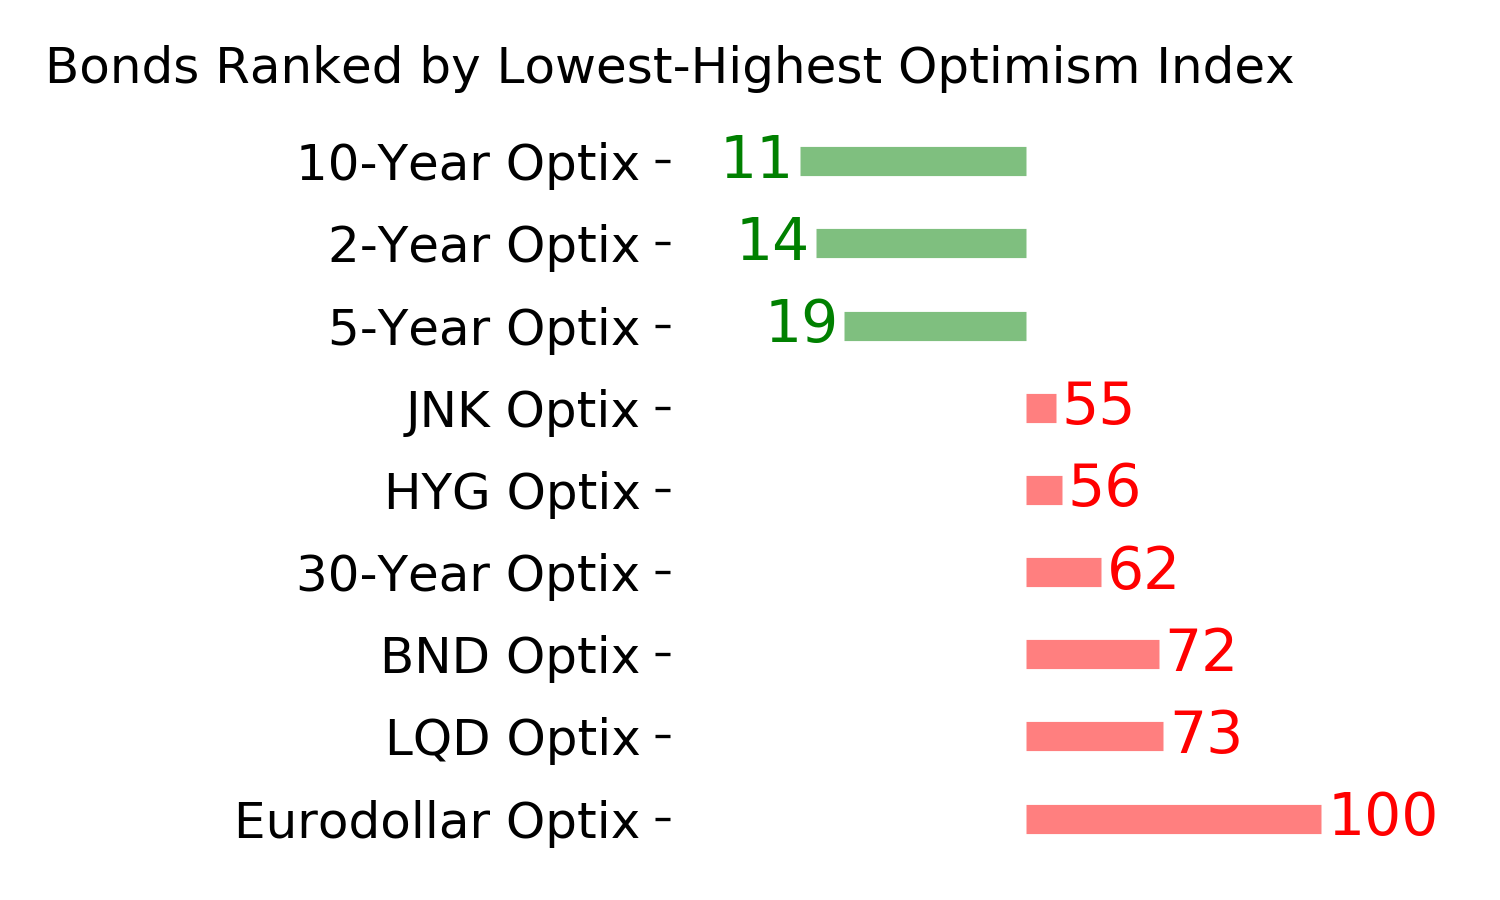
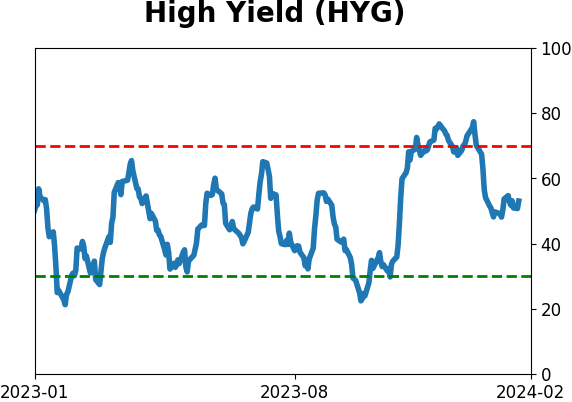
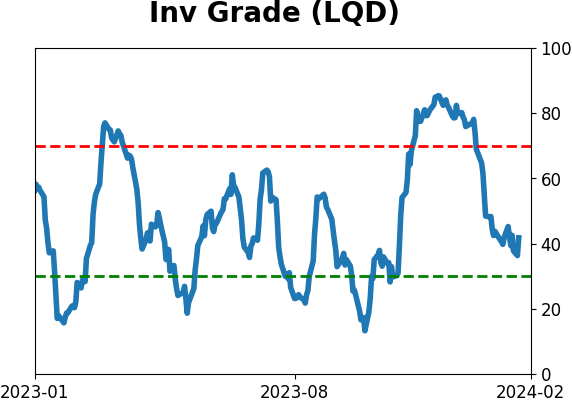
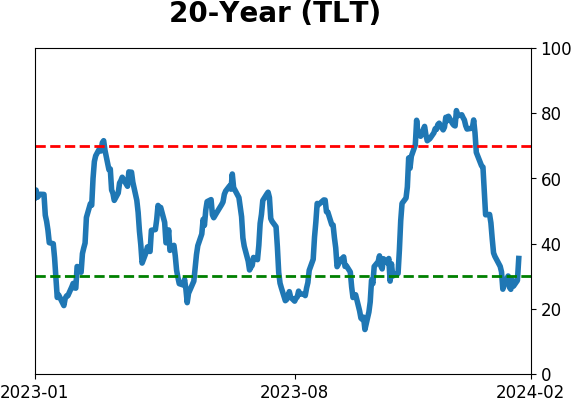
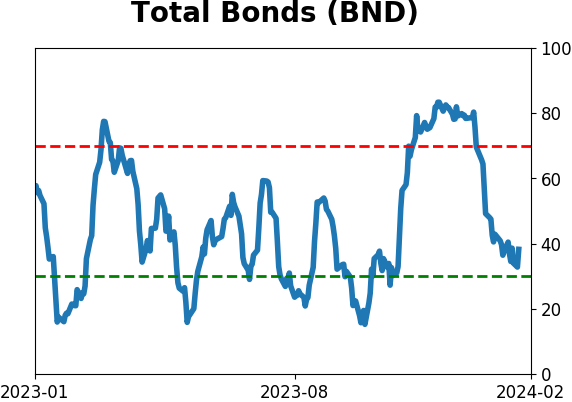
Bond ETF's - 10-Day Moving Average
|
|
|
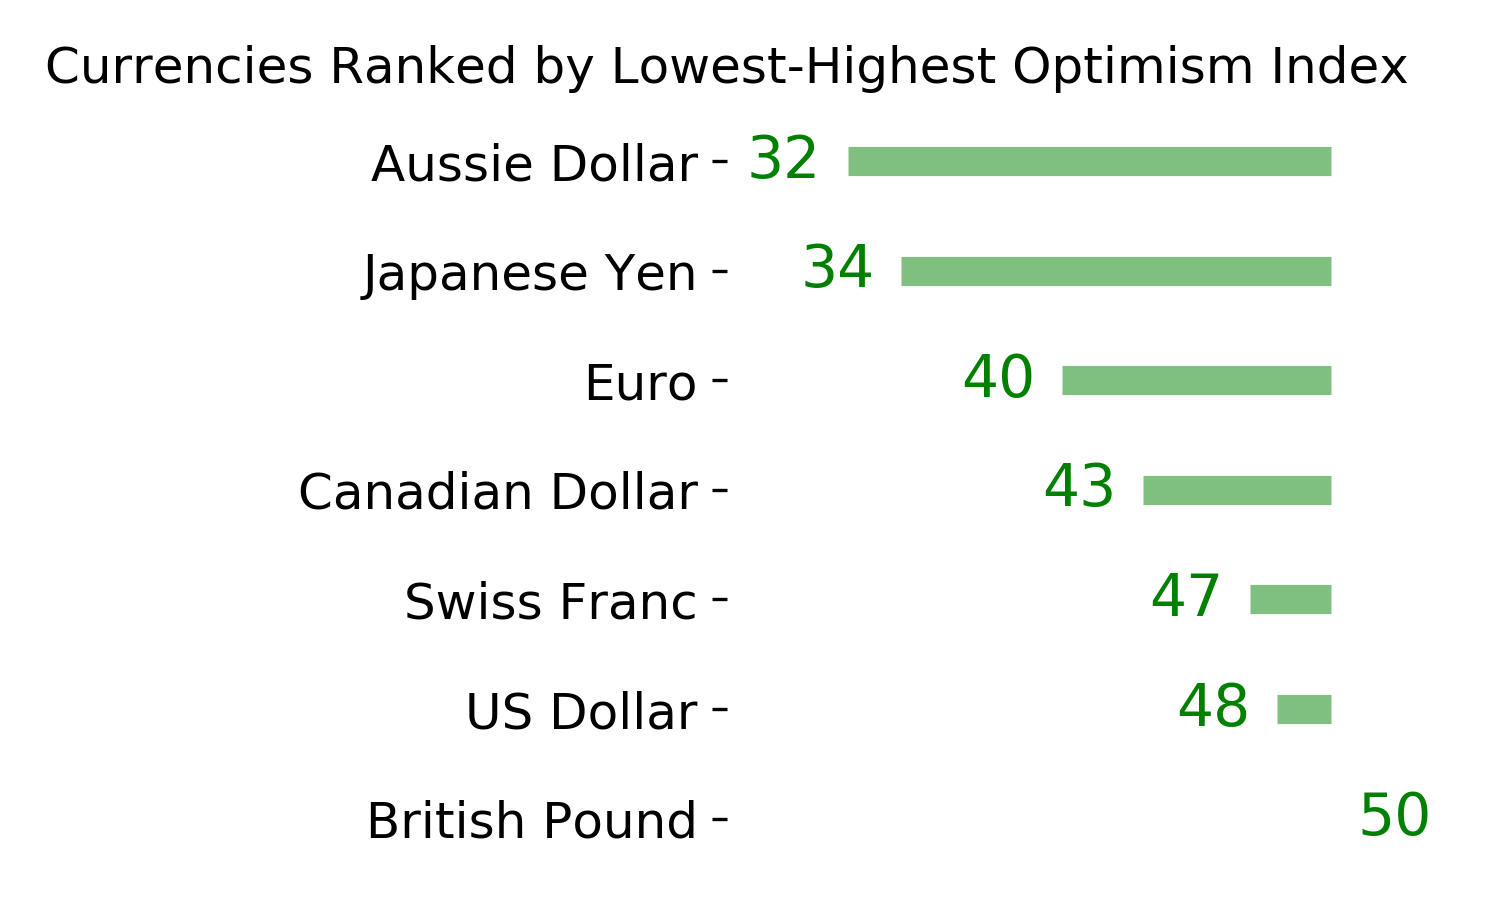
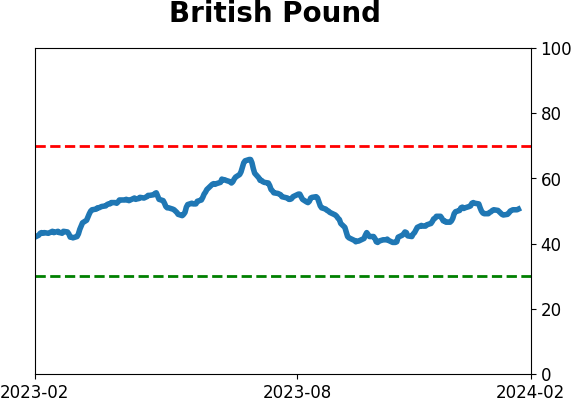
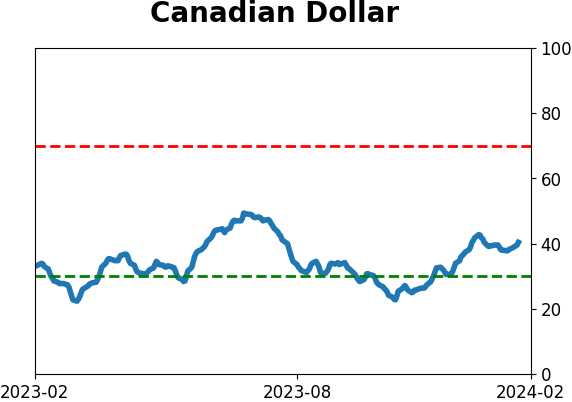
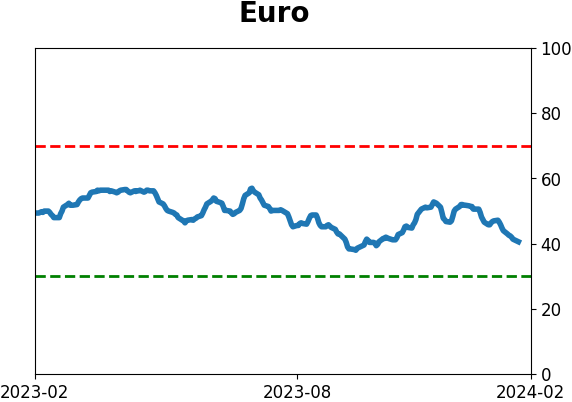
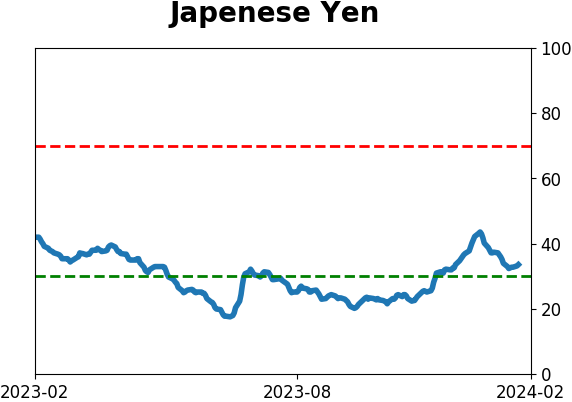
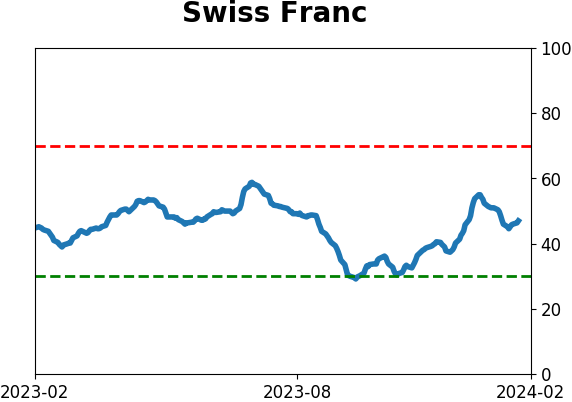
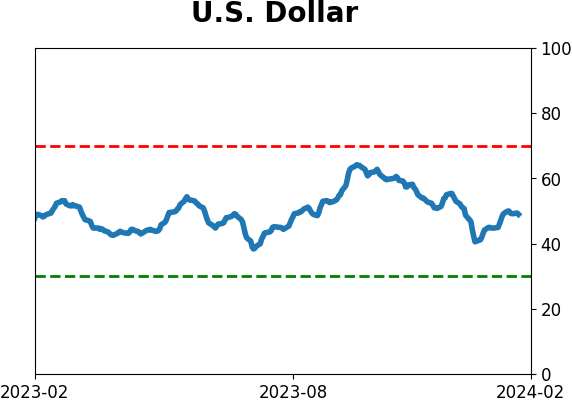
Currency ETF's - 5-Day Moving Average
|
|
|
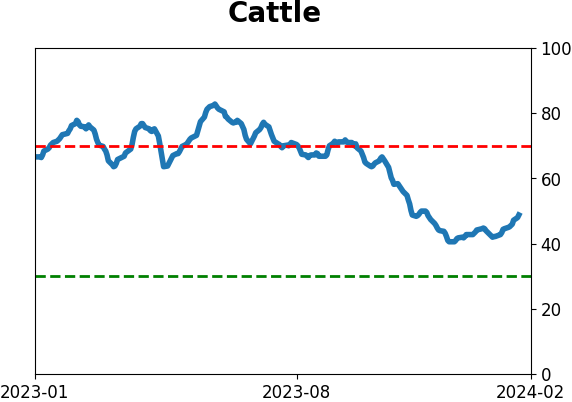
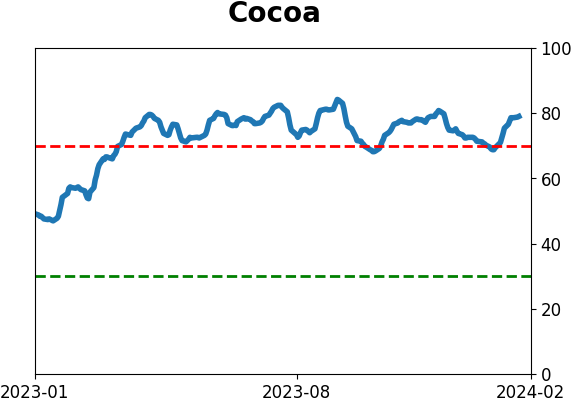
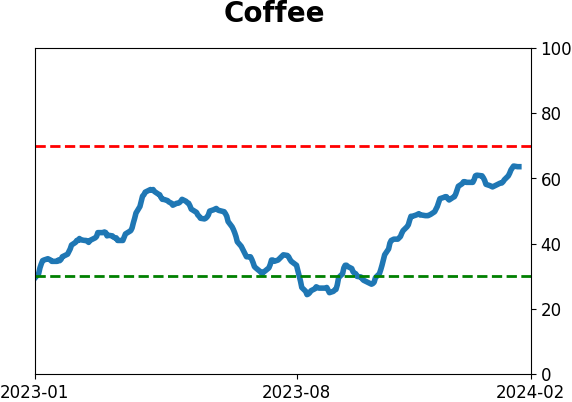
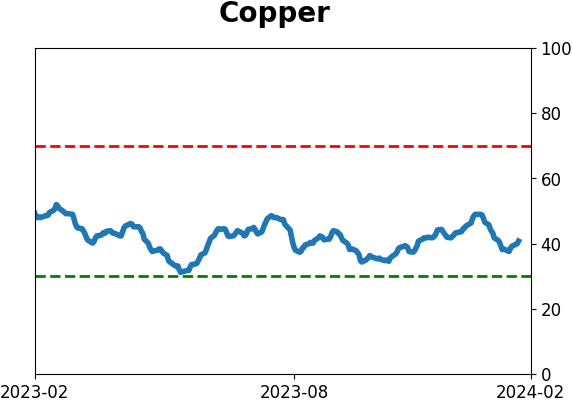
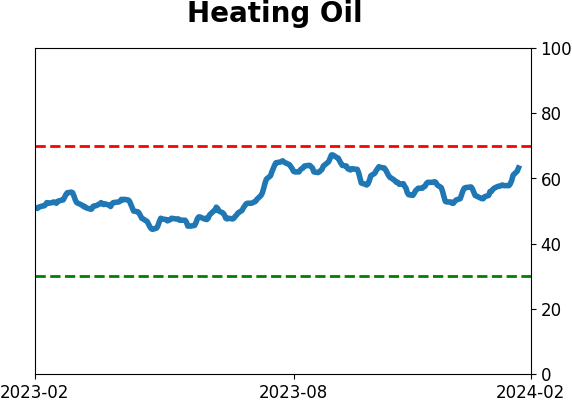
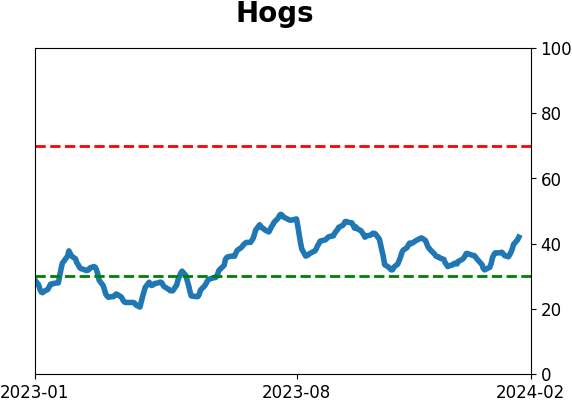
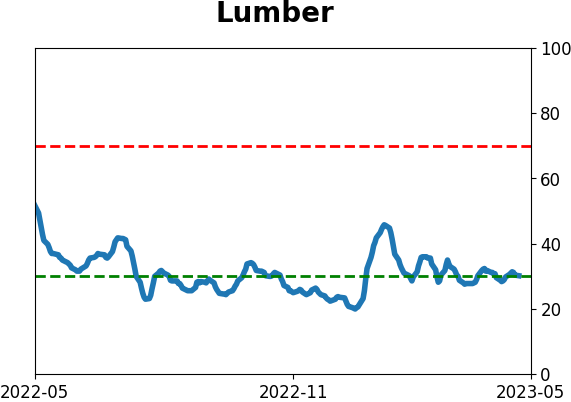
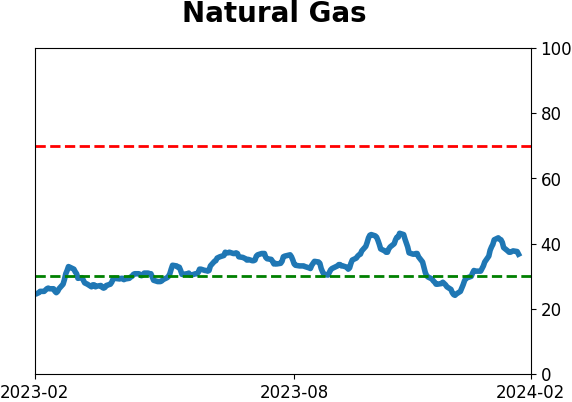
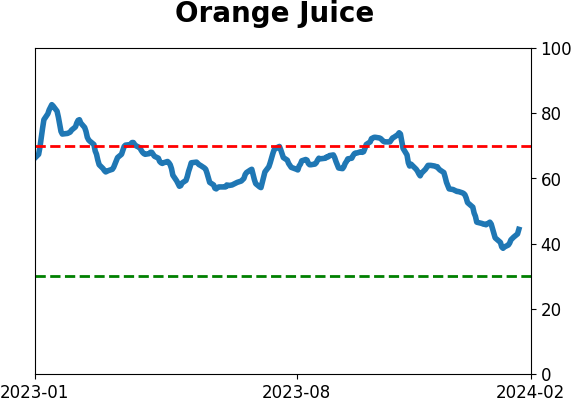
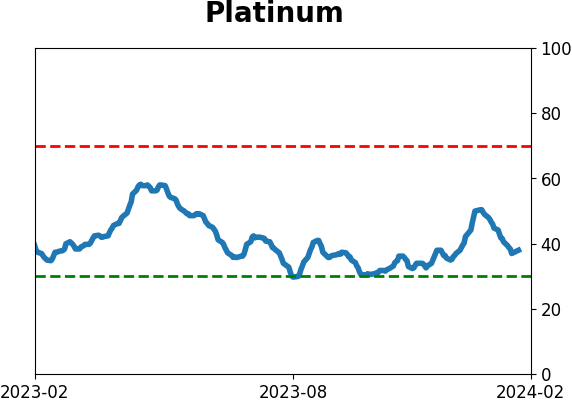
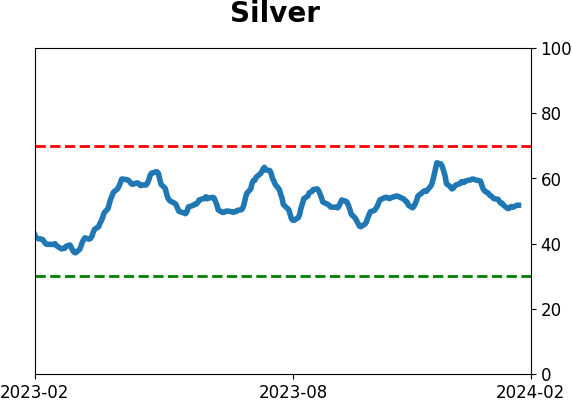
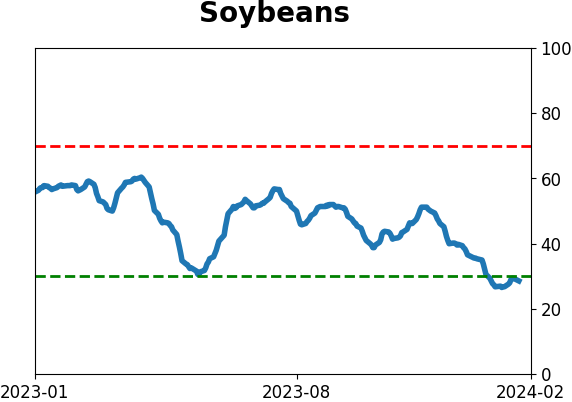
Commodity ETF's - 5-Day Moving Average
|
|